Analysis of the growth of strike-slip faults using effective medium theory 1 2 3 4 5 6 7 8 9
10
11
12
13
14
15
16
17
18
19
20
21
22
23
24
25
26
27 28 29
Atilla Aydin, Rock Fracture Project, Department of Geological and Environmental Sciences, Stanford University, Stanford, California, USA James G. Berryman, Lawrence Berkeley National Laboratory, Earth Science Division, One Cyclotron Rd., MS/90R1116, Berkeley, California, USA ABSTRACT
Increases in the dimensions of strike-slip faults including fault length and thickness of fault
rock and the surrounding damage zone collectively provide quantitative definition of fault
growth and are commonly measured in terms of slip. A vast amount of field data shows that
fault dimensions increase in some fashion as the slip across faults increases though these
relationships may not be simple. The field observations also indicate that a common
mechanism for fault growth in the brittle upper crust is fault lengthening by linkage and
coalescence of neighboring fault segments or strands. In addition, the mechanism of fault zone
widening is spreading of fault rock via cataclastic deformation into highly fractured inner
damage zone. The most important underlying mechanical reason in both cases is prior
weakening of the rocks surrounding a fault’s core and between neighboring fault segments by
fault-related fractures. Using field observations together with effective medium models, this
paper attempts to constrain the reduction in the effective elastic properties of rock in terms of
the orientation and density of the fault-related brittle fractures. Calculated and extrapolated
values of the Young’s and shear moduli for idealized fractured rock masses at fault steps and
inner damage zones provide insight into the degree of strength degradation as a function of the
angle between fracture sets and fracture density and how increasing fracture density may
eventually facilitate fault growth via cataclastic deformation of fractured rock masses.
1

30 31 32 33
34
35
36
37
38
39
40
41
42
43
44
45
46
47
48
49
50
51
52
53
54
INTRODUCTION
Strike-slip faults, similar to other types of faults, typically have complex architectures
with numerous segments or strands of various trace lengths separated by steps or relays
of various sizes (Fig. 1a). This discontinuous characteristic of strike-slip faults has been
reported for simple incipient faults (Segal and Pollard, 1980; 1983; Gamond, 1983;
Willemse et al., 1987; Peacock and Sanderson, 1995) as well as for mature crustal scale
faults (Aydin and Nur, 1982; Barka and Kadinsky-Cade, 1988; Wesnousky, 1988;
Stirling et al., 1996, Kim et al., 2004) and is thought to be pertinent to a number of
properties of strike-slip fault systems including their permeability structure (Sibson,
1985; Martel and Peterson, 1991; Aydin, 2000; Odling et al., 2004), the dynamics and
size of earthquake ruptures (Aki, 1989; Harris and Day, 1999; Harris et al., 1999;
Wesnousky, 2006; Shaw and Dieterich, 2007), the spatial and temporal evolution of
earthquakes (Dewey, 1976; Toksöz et al., 1979; Stein et al., 1997), and growth and
scaling of faults (de Joussineau and Aydin, 2009; Scholz, 2002).
One of the fault scaling relationships concerns fault length (L) to fault slip or
displacement (D). Various studies of mostly normal faults (Watterson, 1986; Walsh and
Watterson, 1987; Schlische et al., 1996; Cowie, 1998; Scholz, 2002) concluded that the
length-slip relationship has the form, L=Dn, where n was proposed to be between 1 and 2.
Neighboring segments of strike-slip faults are separated by steps (Fig. 1a). It turns
out that strike-slip steps have self similar geometry regardless of the sense of stepping
and sense of shearing (Aydin and Schultz, 1990; Aydin and Nur, 1982). However, the
failure modes and the distribution of the shearing-related structures may be different from
one sense of step to another depending on loading, stress perturbations, rhelogy, and the
2

55
56
57
58
59
60
61
62
63
64
65
66
67
68
69
70
71
72
73
74
75
76
77
geometry of initial pre-faulting discontinuities (Kim et al., 2004; Myers and Aydin 2004;
Peacock and Sanderson, 1991; 1995; Burgmann and Pollard, 1994; Gamond, 1983; 1987;
Rispoli, 1981).
Data set collected by Wesnousky (1988) from crustal-scale strike-slip faults
suggests that the number of steps per kilometer along strike-slip faults decreases as fault
slip increases. Although it is difficult to define uncertainty regarding the fault dimensions
measured from published geologic and seismologic maps, recent experimental (Otsuki
and Dilov, 2005) and site-specific field data from the same tectonic region and lithology
and similar resolution (de Joussineau and Aydin, 2009) appear to confirm this trend. It is
also interesting to note that larger size of steps is associated with faults having larger
maximum slip magnitudes (Aydin and Nur, 1982; de Joussineau and Aydin; 2009).
The fault length-slip and step count per unit length relationships, regardless of
their exact form, implies that faults, like other types of geological structures having
different senses of displacement discontinuity, start in small length and grow larger in
time and space. As faults grow longer, they are able to interact with the neighboring
faults at greater distances. Furthermore, it has been shown that faults extend their lengths
by linkage and coalescence of smaller segments through fault steps in order to
accommodate larger amount of slip (Segall and Pollard, 1983; Martel et al., 1988; Martel,
1990; Peacock, 1991; Peacock and Sanderson, 1995; Cartwright et al., 1995; Dawers and
Anders, 1995; Pachell and Evans, 2002; Scholz, 2002; Myers and Aydin, 2004; de
Joussineau and Aydin, 2009). It follows that the length-slip plots for faults which grew by
linkage and coalescence is not actually continuous but rather have sharp “jumps”
coinciding with large increases in lengths at the merger of neighboring segments and
3

78
79
80
81
82
83
84
85
86
87
88
89
90
91
92
93
94
95
96
97
98
99
100
“flats” corresponding to the time span between the consecutive merger instances, in
which fault lengths stay nearly constant while fault slips catch up the limiting length/slip
ratio (Cartwright et al., 1995, Cowie, 1998; Gupta and Scholz, 2000)
Another type of fault scaling relationship illuminates how fault zones become
wider as they grow (Fig. 1b). Field data (Hull, 1990; Robertson, 1982; Knott et al., 1996)
and theoretical considerations (Scholz, 2002) suggest that the width or thickness of faults
increases linearly with fault slip. Agosta and Aydin (2006) and de Joussineau and Aydin
(2007) proposed that fault rock zones grow or widen perpendicular to their trend at the
expense of highly fractured inner damage zone via cataclastic deformation. This
widening is also influenced by the width of the steps along faults (Kim et al., 2004;
Childs et al., 2008), which are precursors of fault cores.
An important consequence of lengthening of faults by linkage and coalescence is
that larger magnitude of slip takes place in merged or composite segments which tend to
straighten the overall through-going fault trace with respect to the earlier segmented or
discontinuous trace. This process, which appears to be a second order shear localization
phenomenon immediately after the fault zone attains the next composite configuration, is
referred to as through-going faulting, fault straightening, and fault zone simplification
(Cox and Scholz, 1988; Reches and Lockner, 1994; Le Pichon et al., 2001; Scholz, 2002;
Ben-Zion and Sammis, 2003).
As this short introductory account indicates, the discontinuous geometry of strike-
slip faults, their segmentation, the geometry and scaling of the segments and steps, and
their impact on earthquake rupture, fluid flow and mineralization have attracted
considerable interest in the literature. However, aside from a number of papers addressing
4
101
102
103
104
105
106
107
108
109
110
111
112
113
114
115
116
117
118
119
120
121
122
123
the stress state between neighboring faults and the type and orientation of the linkage
structure (Segall and Pollard, 1980; Pollard and Segall, 1987; Du and Aydin, 1993, 1995;
Crider and Pollard, 1998; and De Bremaecker and Ferris, 2004), very little attention has
been paid to quantification of the elastic parameters leading to the growth of the fault
dimensions. To this end, there is only a handful of studies of the criteria for the linkage
and coalescence of neighboring faults. The first group of these papers includes those
dealing with calculation of the critical damage parameters at fault steps in terms of strain
invariants (Lyakhovsky and Ben-Zion, 2009; Lyakhovsky et al., 1997). The second
category is rather empirical and is based on a field survey of normal faults and
subsequent analysis of displacement-segment separation ratio to define those fields with
unlinked and linked configurations (Salivo and Benedicto, 2004). There are also a large
number of publications dealing with calculating effective moduli of fractured materials
(Lockner and Madden, 1991; Sayers and Kachanov, 1991; Berryman and Grechka, 2006;
Grechka and Kachanov, 2006; Berryman 2008). However, these do not deal directly with
fault growth and the related problems.
In this paper, we present natural and idealized fracture patterns around faults and
within fault steps from the Valley of Fire State Park, Nevada, and use effective medium
models to investigate how rocks around and between fault segments weaken by faulting-
related fractures and, consequently, how these intensely fractured rock masses may
facilitate the growth of fault dimensions. A related paper (Berryman and Aydin, 2009)
dealing with the methodology for calculating effective moduli of fractured medium to be
submitted to another journal soon.
5

Geological background 124
125
126
127
128
129
130
131
132
133
134
135
136
137
138
139
140
141
142
143
144
145
146
For the last two decades, we have been studying the initiation, interaction and
growth of brittle, primarily strike-slip faults in the Jurassic Aeolian Aztec Sandstone with
excellent exposures in the Valley of Fire State Park, about 60 km northeast of Las Vegas,
Nevada (Fig. 2) (Cakir and Aydin, 1994; Taylor et al, 1999; Flodin et al., 2005; Myers
and Aydin, 2004; Flodin and Aydin, 2004; de Joussineau and Aydin, 2007, 2009; de
Joussineau et al., 2007). We have documented that these Cenozoic faults (Bohannon,
1983) with both left- and right-lateral offsets ranging from a few mm to a few km
initiated from a system of joint zones by shearing of the joints, formation of new splay
fractures and their subsequent shearing. By mapping of strike-slip faults with increasing
magnitude of slip, the mechanism of fault growth was established to be the linkage and
coalescence of initially sheared joint zones and of fault segments at progressively greater
scales. It was also concluded that the pattern and orientations of these faults within the
Valley of Fire and the surrounding area are reminiscence of the large size strike-slip
faults in the southeastern Basin and Range province (Cakir et al., 1998).
Aside from the citations above, there is a large body of publications on various
aspects of the sandstone deformation in the form of shear bands (Antonellini et al., 1994;
Cakir and Aydin, 1994; Flodin et al., 2003), compaction bands and their permeability
(Sternlof et al., 2005; Sternlof et al, 2006; Aydin and Ahmadov, 2009), strike-slip fault
zone permeability (Jourde et al., 2002; Flodin et al, 2001, 2004, and 2005; Eichhubl et al.
2004; Ahmadov et al., 2007), and petrophysical and failure properties of the major units
of the Aztec Sandstone (Taylor et al., 1997; Flodin et al., 2003) in the study area.
6

Conceptual models 147
148
149
150
151
152
153
154
155
156
157
158
159
160
161
162
163
164
165
166
167
168
169
Fig. 1a is an idealized diagram illustrating fundamental geometric attributes of
strike-slip faults. Along-strike view shows segments with various lengths (l1, l2, …ln ),
which include the slip vector direction by definition. Hence, identifying segments assures
a basis for determining mean and maximum segment lengths. This view also shows
discontinuities along the trace length in the form of steps (s1, s2, …sn-1) with overlaps (o1,
o2, …on-1) and widths (w1, w2, … wn-1) or separations (Fig. 1a inset). These parameters
provide the bases for calculating the number of steps per length, and the size of the steps
along a given strike-slip fault.
Down-dip view also includes segments with steps. We will not consider down-dip
segmentation and steps because these steps are perpendicular to the slip vector for strike-
slip faults and therefore the vertical fault growth in uniform lithologies is relatively easy.
In vertically anisotropic lithologies, the problem becomes more complex by the presence
of inelastic rocks such as shale, which is also out of the scope of this paper.
Fig.1b shows a detailed view of fault zone architecture with a fault core, made up
of fault rock and slip surfaces. Fault rock is the product of fragmentation and cataclasis
when a highly fractured rock is disaggregated, fracture-bounded blocks rotate and
translate and grains crush. Slip surfaces are through-going structures that accommodate
shear displacement along polished and striated surfaces which usually run through, or
occur adjacent to, the fault rock. Fault cores are flanked on both sides by a damage zone
which includes a complex fracture system of splay joints and sheared splay joints of
various generations. We note that, as depicted in the diagram, the distributions of fault
rock and damage zone are highly irregular. The diagram in Fig. 1b also illustrates the
7

170
171
172
173
174
175
176
177
178
179
180
181
182
183
184
185
186
187
188
189
190
191
192
notion that one of the major slip surfaces within the fault core may be continuous from
one end to the other, which is meant to represent a through-going fault surface (referred
to earlier), and accommodates a large portion of the total slip across the fault zone.
Here, we focus on dimensional attributes and growth processes of a network of
strike-slip faults exposed in the Aztec Sandstone cropping out in the Valley of Fire Sate
Park and its surroundings (Fig. 2). Although the geometric and mechanical properties of
the strike-slip faults at this location appear to be similar to those strike-slip faults from
different regions (de Joussineau and Aydin, 2009) as summarized in the introduction
section of this paper, we restrict our statistical and conceptual models to the cases that we
studied in some details at the Valley of Fire State Park for two reasons: One is that the
mechanisms of fault initiation and growth are well-known and the precision of
measurements is fairly uniform in a wide range of scales. The accuracy of other data,
commonly from various geological maps by different authors, is difficult if not
impossible to assess and may introduce some artifacts.
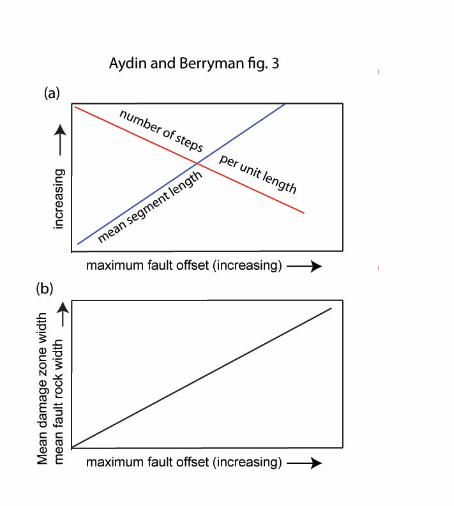
Fault segment length, step number and dimensions, and fault width: Data from
about 20 well exposed faults in the study area show that the mean segment length
increases with the maximum fault offset (de Joussineau and Aydin, 2009) as idealized in
Fig. 3a. We here use a simple idealized trend because the exact nature of the relationship
is not the focus. Data collected from the same faults also show that the number of steps
per unit length (km) decreases as a function of the maximum fault offsets. Stating this
result in a simpler way; when “n” number of segments is reduced to “n-1” segments by
linkage of the two neighboring segments, then, “n-1” number of steps will be reduced
down to “n-2” steps by destruction of one of the steps.
8

193
194
195
196
197
198
199
200
201
202
203
204
205
206
207
208
209
210
211
212
213
214
215
The damage zone and fault rock widths increase with increasing fault slip (Flodin
et al., 2001; 2005; Myers and Aydin, 2004; de Joussineau and Aydin 2007; 2009). These
relationships are not locally smooth, but regardless of the actual forms, can be idealized
as shown in Figure 3b. These trends are more meaningful for considering either mean or
maximum widths versus maximum slip values. For example, the damage zone widths are
controlled primarily by the location, angle and length of the splay fractures (de
Joussineau et al., 2007) whose distribution about the fault may be highly nonuniform.
The nature of fracturing at small fault steps can be characterized as first splay
fracturing in response to shearing of the echelon joints (Fig. 4a) and then shearing of the
1st generation of splay fractures and formation of a 2nd generation splay fractures that
connect the sheared 1st generation splay fractures (Fig. 4b). The intersection angle
between the initial echelon sheared joints and the 1st generation splay fractures varies
from about 150 to 850 with an average value of about 500 (de Joussineau et al., 2007).
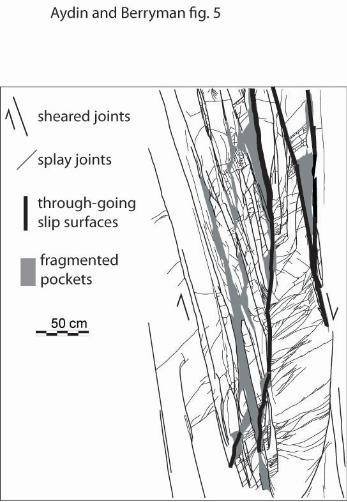
Figure 5 shows the terminal area of a fault zone with ~65 cm slip. In this regard, it
is analogous to an incipient stage of fault development. Similar to the cases shown in Fig.
4, shearing of the initial joint system resulted in splay fracturing and continued shearing
facilitated the formation of multiple sets of sequential splays localizing into
discontinuous pockets of high density fractures, and, in places, fragmentation zones. The
incipient short slip surfaces go through these pockets of weakened rock at fault steps.
Figures 6a and b show a fault of about 14 m left-lateral slip, which displays
several characteristic architectural elements common to all fairly well developed strike-
slip faults in the study area: Fault rock, slip surfaces, and damage zone. Fig. 6a shows
domains of different deformation zones and of fracture densities, which allow one to see
9
216
217
218
219
220
221
222
223
224
225
226
227
228
229
230
231
232
233
234
235
236
237
238
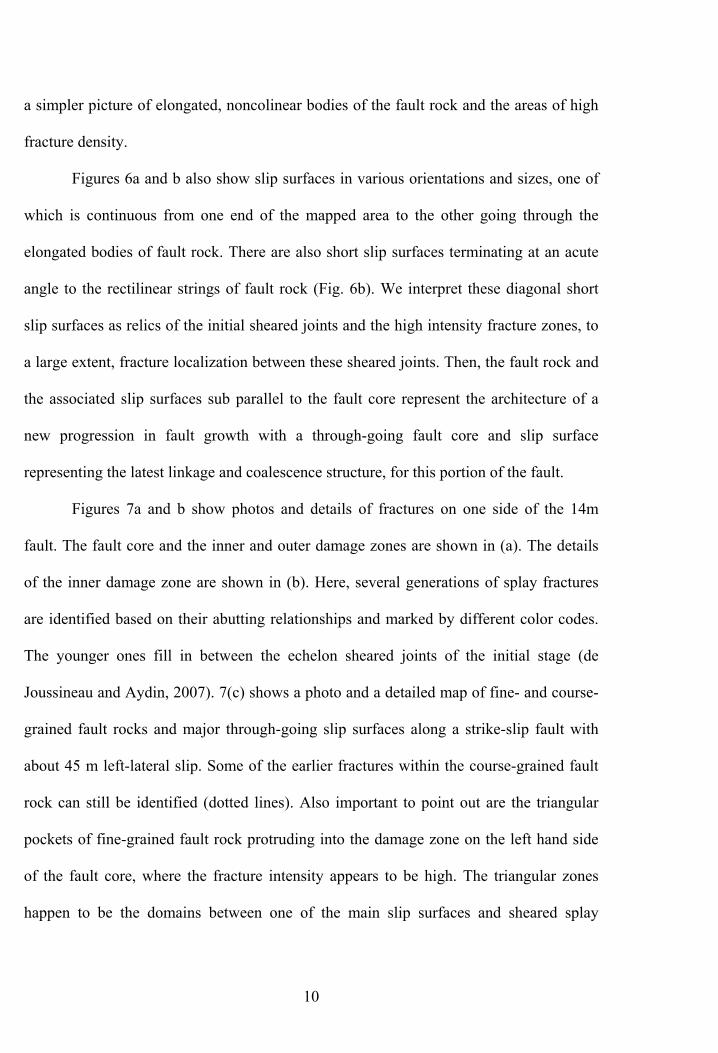
a simpler picture of elongated, noncolinear bodies of the fault rock and the areas of high
fracture density.
Figures 6a and b also show slip surfaces in various orientations and sizes, one of
which is continuous from one end of the mapped area to the other going through the
elongated bodies of fault rock. There are also short slip surfaces terminating at an acute
angle to the rectilinear strings of fault rock (Fig. 6b). We interpret these diagonal short
slip surfaces as relics of the initial sheared joints and the high intensity fracture zones, to
a large extent, fracture localization between these sheared joints. Then, the fault rock and
the associated slip surfaces sub parallel to the fault core represent the architecture of a
new progression in fault growth with a through-going fault core and slip surface
representing the latest linkage and coalescence structure, for this portion of the fault.
Figures 7a and b show photos and details of fractures on one side of the 14m
fault. The fault core and the inner and outer damage zones are shown in (a). The details
of the inner damage zone are shown in (b). Here, several generations of splay fractures
are identified based on their abutting relationships and marked by different color codes.
The younger ones fill in between the echelon sheared joints of the initial stage (de
Joussineau and Aydin, 2007). 7(c) shows a photo and a detailed map of fine- and course-
grained fault rocks and major through-going slip surfaces along a strike-slip fault with
about 45 m left-lateral slip. Some of the earlier fractures within the course-grained fault
rock can still be identified (dotted lines). Also important to point out are the triangular
pockets of fine-grained fault rock protruding into the damage zone on the left hand side
of the fault core, where the fracture intensity appears to be high. The triangular zones
happen to be the domains between one of the main slip surfaces and sheared splay
10

239
240
241
242
243
244
245
246
247
248
249
250
251
252
253
254
255
256
257
258
259
260
261
fractures, which are known to be the location of higher fracture concentrations based on
observations at other locations with similar geometry (Flodin and Aydin, 2004).
Figure 8 is a conceptual model displaying linkage and coalescence of fault
segments or strands which result in longer segment lengths, reduced number of fault
steps, and wider damage zones and fault core with increasing fault slip. In a simple way,
the model depicts how strike-slip faults grow via an interrelated series of processes
including splay fracturing, shearing of splay fractures, segment linkage, and formation of
through-going slip-surfaces in a hierarchical manner. Progressive lengthening of the
linked segments, in turn, drives splay fractures to farther distances from the main body of
the fault and thus increases the size of potential steps and eventually the widths of fault
cores and fault damage zones.
Analysis using effective medium models
The premise of this study is that a certain degree of high intensity fracturing at
fault steps and fault damage zones weakens the rock masses thereby facilitating fault
lengthening through linkage and coalescence of neighboring segments and fault zone
widening by incorporation of the fractured and fragmented material into the fault rock via
a cataclastic process.
Next, we will use effective medium models to investigate the degradation of the
strength and reduction of resistance to cataclastic deformation, which presumably pave
the way to the setting of through-going faults. Given the complexity of the fractures
around faults, the problem is obviously rather difficult and, at this stage, further
simplification is desirable for applications to an effective medium theory. We first
11
262
263
264
265
266
267
268
269
270
271
272
273
274
275
276
277
278
279
280
281
282
283
284
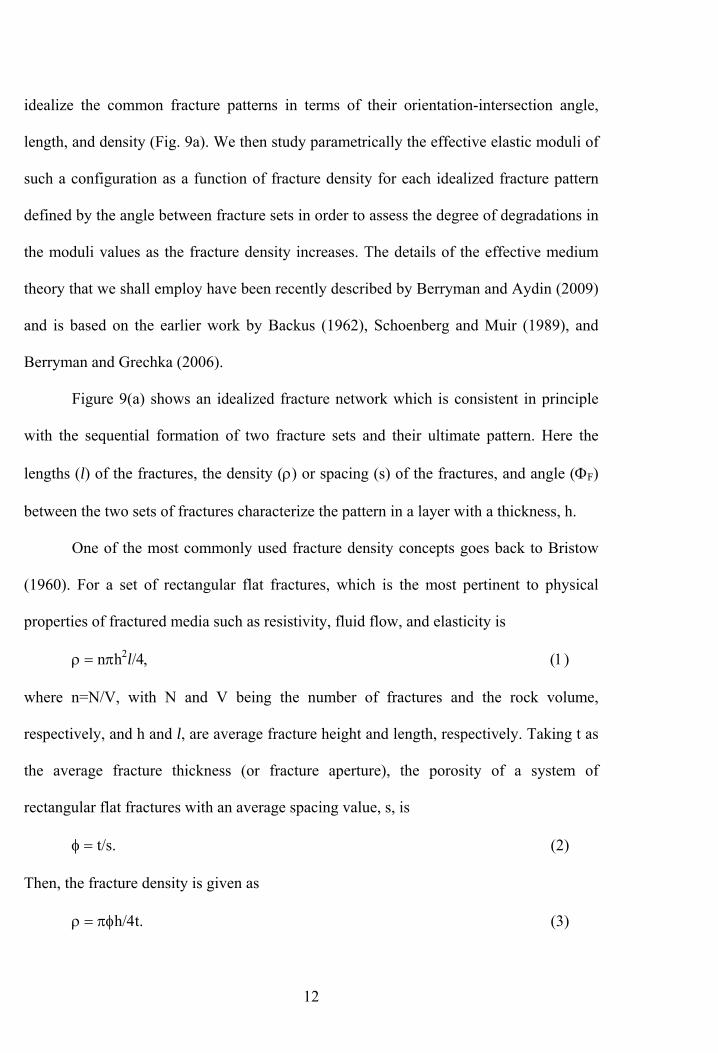
idealize the common fracture patterns in terms of their orientation-intersection angle,
length, and density (Fig. 9a). We then study parametrically the effective elastic moduli of
such a configuration as a function of fracture density for each idealized fracture pattern
defined by the angle between fracture sets in order to assess the degree of degradations in
the moduli values as the fracture density increases. The details of the effective medium
theory that we shall employ have been recently described by Berryman and Aydin (2009)
and is based on the earlier work by Backus (1962), Schoenberg and Muir (1989), and
Berryman and Grechka (2006).
Figure 9(a) shows an idealized fracture network which is consistent in principle
with the sequential formation of two fracture sets and their ultimate pattern. Here the
lengths (l) of the fractures, the density (ρ) or spacing (s) of the fractures, and angle (ΦF)
between the two sets of fractures characterize the pattern in a layer with a thickness, h.
One of the most commonly used fracture density concepts goes back to Bristow
(1960). For a set of rectangular flat fractures, which is the most pertinent to physical
properties of fractured media such as resistivity, fluid flow, and elasticity is
ρ = nπh2l/4, (1)
where n=N/V, with N and V being the number of fractures and the rock volume,
respectively, and h and l, are average fracture height and length, respectively. Taking t as
the average fracture thickness (or fracture aperture), the porosity of a system of
rectangular flat fractures with an average spacing value, s, is
φ = t/s. (2)
Then, the fracture density is given as
ρ = πφh/4t. (3)
12
285
286
287
288
289
290
291
292
293
294
295
Using (2) and (3), we find that the fracture density is proportional to h/s. Therefore, the
fracture density of, for example, 0.78 (or using the approximation in Eq. (3), a rounded
number, ~1.0), corresponds to a commonly observed spacing for one set of opening mode
fractures distribution in a layer, for which spacing of a single fracture set scales with the
layer thickness. For two sets of overlapping fractures systems of equal density (but could
be of different distributions) in a single layer, for example, this value approaches to 0.39
or to 0.5 for the approximate case.
Compliance matrix and the corresponding Young’s and shear moduli components
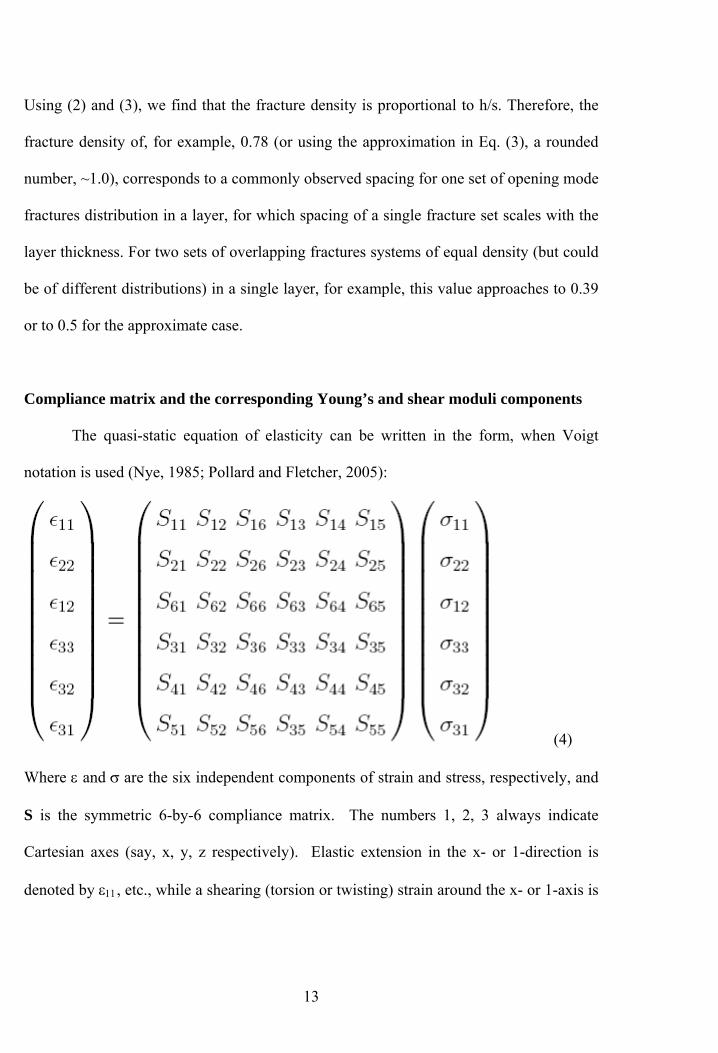
The quasi-static equation of elasticity can be written in the form, when Voigt
notation is used (Nye, 1985; Pollard and Fletcher, 2005):
(4) 296
297
298
299
300
Where ε and σ are the six independent components of strain and stress, respectively, and
S is the symmetric 6-by-6 compliance matrix. The numbers 1, 2, 3 always indicate
Cartesian axes (say, x, y, z respectively). Elastic extension in the x- or 1-direction is
denoted by ε11, etc., while a shearing (torsion or twisting) strain around the x- or 1-axis is
13
301
302
303
304
305
306
307
308
309
310
311
312
313
314
315
316
317
318
319
320
321
322
323
represented by ε23, etc. Similarly, the normal stress or tension in the x-direction is σ11,
and the shear stress around the x-axis is symbolized by σ23, etc.
For any system, the compliance matrix, or its inverse, the stiffness matrix, has six
eigenvalues. For an isotropic system, five of these eigenvalues are for shearing modes
and one is for pure compression/tension mode. Of the five shearing modes, three are the
independent torsional or twisting motions and/or the corresponding stresses; for example,
in an isotropic system, ε23, couples simply to σ23, while all the off-diagonal compliances
and/or stiffnesses involving subscripts 4, 5, 6 vanish identically. Two other types of
shear modes are eigenmodes for an isotropic system; for example, when σ22 = − σ11, we
have a ``push-pull'' or ``pure shear’’ mode resulting in the eigen-response ε22 = − ε11 for
the strain. For the isotropic case, there are three distinct versions of these pure shear
behaviors that give analogous results, but for nonisotropic systems usually only one of
these will actually be an eigenmode - the most common example of this behavior being
for transversely isotropic systems.
In the presence of a set of fully aligned fractures in an otherwise isotropic elastic
medium, the elastic matrix becomes transversely isotropic. The plane of the aligned
fractures is the plane of symmetry, and the direction perpendicular to this plane is the axis
of symmetry. Elastic behavior strictly within the plane of symmetry (i.e., two-
dimensional behavior in this plane) remains isotropic, which is the origin of the term
``transverse isotropy'' - this type of isotropic behavior thus occurring transversely to the
axis of symmetry.
When analyzing such systems in three-dimensional space, it is common to choose
the axis of symmetry to coincide with one of the spatial axes, x, y, and z, or 1, 2, and 3,
14

324
325
326
327
328
respectively. This choice makes no difference to the final results but makes some
difference to the level of difficulty in obtaining those results. In particular, making a
good choice of axes can simplify the matrix of elastic coefficients somewhat, so that, for
fully aligned fractures, we have a compliance matrix in the Voigt [Nye (1985)] 6x6-
matrix-form of the elastic tensor notation:
. (5) 329
330
331
332
333
334
335
336
337
338
339
340
Thus, for orthorhombic symmetry, the diagonal components of the matrix; the Young’s
moduli E11, E22, and E33 and the shear moduli G44, G55, and G66 are inversely related to
these diagonal components.
In calculating these components of the effective elastic moduli for a medium with
Poisson’s ratio of 0.4375 appropriate for sandstone, which has two fracture sets (Fig. 9a),
we follow an approach based primarily on layer averaging methods of Backus (1962) and
Schoenberg and Muir (1989). The details of the mathematical analysis of the effective
properties of such a composite system are given in detail by Berryman and Aydin (2009).
Basically, two different layers each containing one set of fractures with the same density
(ρ) but possibly differing distributions, are considered for the effective moduli
calculations (Fig. 9b). After constructing one layer with one of the fracture sets, this layer
15

341
342
343
344
345
346
347
348
349
350
351
352
353
354
355
356
357
358
359
360
361
362
363
is rotated in such a way that the combined fracture system will have the desired angle
between the two fracture sets. This is done by rotating each layer plus/minus one half of
the angle between the two fracture sets. In this paper, we investigate cases where the
angles between the two fracture sets (ΦF) are, 150, 300, 450 and 600; the most common
range of angles for natural fractures considered in this study. The two layers are either
stacked up, which we call “sandwich” configuration (Fig. 9b) or are placed side by side,
which we call “contiguous” configuration (Fig. 9c). The former is used for averaging in
the z- or 3-axis whereas the later is used for averaging along the x- or 1-axis. Another
side by side contiguous configuration similar to that in Figure 9c is used for averaging
along the y- or 2-direction. Both the contiguous and sandwich configurations represent
interacting but not intersecting fracture arrays.
Figure 10 shows the plots of the calculated effective moduli; (a) for the Young’s
moduli, (b) for the shear moduli, and (c) for the quasi-shear moduli for “pure shear” for
each of the four different fracture configurations defined by the angle ΦF=150, 300, 450,
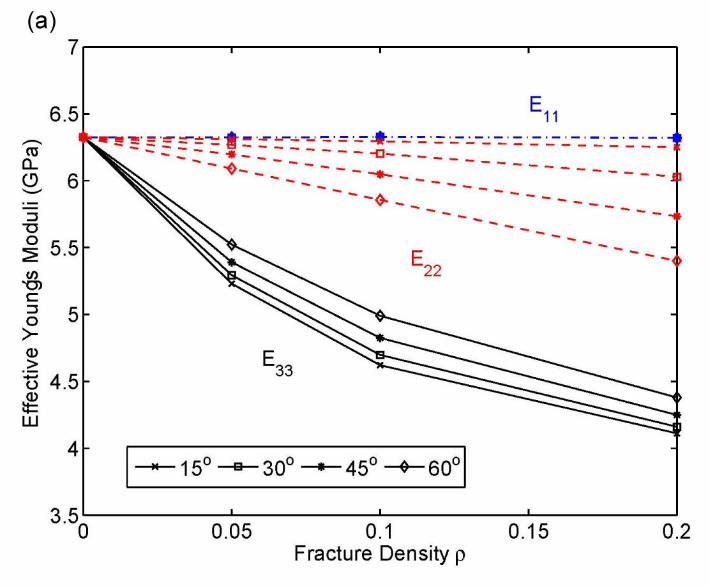
600 and for a range of fracture densities from 0 to 0.2. The results show that the E11
components of the Young’s moduli for all four fracture configurations do not change at
all (all four lines overlap along the top blue line in Fig. 10a) with increasing fracture
density up to 0.2. This is because E11 corresponds to uniaxial loading in the x- or 1-
direction and the changes of the angles and densities of fractures, as seen from this
direction edge-on, make no difference on the effective moduli. The E22 and E33
components show systematic decrease for all configurations as the fracture densities
increase. We note that the E22 for the configuration ΦF=600 and 450 experiences greater
decreases for the range of densities, whereas E33 shows greater decreases for
16
configurations with smaller intersection angles ΦF=150 and 300. For example, the
effective Young’s modulus, E33, corresponding to ΦF=150 at a fracture density of 0.2
shows about 30% reduction with respect to the value for no fracture (ρ=0). We note that
the plots for E22 and E33 have segments with different slopes indicating the nonlinear
nature of the moduli variations as the density increases. Since the change of slope occurs
at the fracture densities for which the calculations were performed, the change would
have been smoother if more runs with intermediate fracture density values were
performed.
364
365
366
367
368
369
370
371
372
373
374
375
376
377
378
379
380
381
382
383
384
385
386
The plots for the shear moduli components for the four fracture configurations are
shown in Fig. 10b. They all are nearly linear except one (G44-shearing about the 1- or x-
axis). G66 and G55 (shearing about the vertical 3- or z-axis and the 2- or y-axis,
respectively) get monotonically weaker for the density range used. However, these
moduli show the largest decreases for the fracture configurations 600 and 150,
respectively. The greatest decrease of the shear moduli occur in the G44 and G55
components (shearing about the 1- or x-axis and 2- or y-axis, respectively) corresponding
to the fracture configurations with the lowest angle, ΦF=150. However, this decrease
amounts to about 20% of the modulus for the no-fracture state. The curves for G44
components have a crossover at a fracture density ρ, between 0.1 and 0.15. This
crossover is curious and remains to be investigated further.
Fig. 10c shows the variation in the effective quasi-shear modulus for pure shear
(qGp) as being one of the special cases. This parameter shows a smaller variation of about
5% with respect to the modulus for the no-fracture state for ΦF=600 at the highest fracture
density (0.2) used in the calculations.
17

Extrapolations: One way of obtaining estimates beyond the range of our more
certain knowledge is to use an extrapolation technique. One such method is to extrapolate
simply by using the same expansion in powers of ρ that we have been using. However,
this approach is likely to give misleading results since higher order fracture influence
coefficients for higher powers of ρ would come into play.
387
388
389
390
391
392
393
394
395
396
397
398
399
400
401
402
403
404
405
406
407
408
409
One such method is to extrapolate simply by using the same expansion in powers
of ρ that we have been using. However, this approach is likely to give misleading results
since higher order fracture influence coefficients for higher powers of ρwould come into
play. The ways in which the shear and quasi-shear moduli vary with increasing fracture
density for each configuration in our models are nearly linear. This may warrant some
extrapolation using the last segment of the curves (for ρ between 0.1 and 0.2) to estimate
the critical fracture densities corresponding to the vanishing values of shear moduli
components with the greatest decrease in magnitude. Hence, G55 and G44 plots for the
intersection angle of 150 provide 0.9 for the critical density which is the upper bound for
cataclastic failure. The qGp for pure shear gives the highest critical fracture density on
the order of about 4.1, which implies that the failure will occur earlier due to weakening
of the other elastic parameters. Although the Young’s moduli curves showing greater
decreases (E33) appear to be highly nonlinear, again the last linear segments are used to
approximate the densities corresponding to the vanishing value of this component. For
these cases the critical values of densities are close to each other for each angular
configuration being between 0.88 and 1.01. Just to provide a spacing value to which the
JSG reader can relate to: These roughly correspond to a single set fracture spacing range
of about 4-5 cm for a 5 cm thick bed. However it is possible that cataclastic failure may
18

410
411
412
413
414
415
416
417
418
419
420
421
422
423
424
425
426
427
428
429
430
431
432
occur at spacings lower than that for thinner layers and having the bedding interfaces fail
as part of the fragmentation process which has not been considered in our analyses.
Discussion
The conceptual models depicting increasing mean segment lengths, decreasing
number of steps per unit length, and increasing step size as faults grow are straight
forward. It is also generally agreed upon that, as faults grow, the damage zone and the
fault rock also widen. However, the widening aspect of the fault growth is somewhat
contentious. There are various models for the distribution of fault damage zone. These
are recently discussed by Childs et al. (2008), de Joussineau and Aydin (2007), Kim et al.
(2004), and Shipton and Cowie (2003). The field data on the fault zone width-slip
relationship has been questioned in the literature (Evans, 1990). Furthermore,
observations of large amount of slip across surprisingly narrow bands (Chester and
Chester, 1998) within wide fault zones along some major faults have been used to cast
doubts about the existence of a universal fault rock width-slip relationship. However,
detailed studies tracking down progressive evolution of brittle faults in well-exposed
outcrops including the present study show that bigger faults generally have wider zones
of fault rock and related damage (Martel, 1990; Knott et al., 1996, Willemse et al., 1997;
Flodin et al., 2001; 2005; Shipton and Cowie, 2003; Myers and Aydin, 2004, Kim et al.,
2004; de Joussineau and Aydin, 2007; 2009; de Joussineau et al., 2007). Albeit, the
thickness variations are highly heterogeneous along a given fault (Childs, et al., 2008; de
Joussineau and Aydin, 2007; Kim et al., 2004) and their distribution may not be as simple
and locally smooth as alluded to by the earlier investigators.
19

433
434
435
436
437
438
439
440
441
442
443
444
445
446
447
448
449
450
451
452
453
454
455
The premise behind this study is that the patterns of fractures at strike-slip steps
and inner damage zones adjacent to fault rocks is complicated but can be simplified to
represent the local damage fairly well. Due to high density of fractures, the mechanical
properties of the rock mass at these locations are so altered that a new paradigm is
required to analyze the conditions leading to the growth of faults by linkage of
neighboring segments and by enlargement of fault rock into the adjacent inner damage
zone. Thus, this premise separates the present study from those using single linkage
structure whether in opening, closing, or shearing modes in pristine rock within the
context of the LEFM (see for example, Segall and Pollard, 1980; Du and Aydin, 1993,
1995; Crider and Pollard, 1998; and De Bremaecker and Ferris, 2004). In this regard, the
underlying reasoning in our approach is similar to that of the damage concept of
Lyakhovsky and Ben Zion (2008) if the fracture density is a proxy for the damage
parameter in their model. On the other hand, the linkage criteria for the normal fault
relays in map view investigated by Salivo and Benedicto (2004) is not quite analogous
for the strike-slip configurations considered in our study for the simple reason that the
map view of normal faults does not contain the slip vector. However, the displacement-
segment separation ratio, which is a measure of the shear strain across fault steps, used by
these authors to characterize various stages of fault linkage may be related to the fracture
density used in our study for strike-slip steps. It is likely that the fracture density is
related to the shear strain across the zone, however, the nature of such a possible
relationship between these parameters is not known.
It appears that the underlying mechanical principle for fault growth processes and
many of the related scaling relationships is controlled by the stress concentration at fault
20

456
457
458
459
460
461
462
463
464
465
466
467
468
469
470
471
472
473
474
475
476
477
478
tips and its length dependence. First, for a simple mode-II fracture, the stress components
at a point in the regions away from the fracture tips decay as (a/r)2 for 2D (Pollard and
Segall, 1987) and (a/r)3 for 3D (Ben-Zion and Sammis, 2003), where “a” is half fault
length and “r” is the radial distance to the center of the fault. Second, fault interaction is
an important factor in the final fault geometry of discontinuous strike-slip faults (Aydin
and Schultz, 1990). It turns out that the relative locations of the neighboring fracture tips
do have a strong impact on echelon mode-II fracture geometry but this influence is more-
or-less independent of the sense of echelon steps. The data on the step size and
distribution are also consistent with the earlier results in that larger steps are associated
with longer fault segments and, presumably, higher slip magnitudes.
Steps or relay ramps between echelon strike-slip faults include various structures
(joints, pressure solutions, other faults, and folds) and eventually are cut through by a
through-going fault connecting the echelon fault segments. In our study area, the failure
structures at steps and around the fault core are generally mode-I fractures formed either
under tensile local stresses (Segall and Pollard, 1980) or compressive local stresses (Horii
and Nemat-Nasser, 1985). However, shear bands (Aydin et al., 2006; Shipton and Cowie,
2003) are occasionally observed at narrow contractional steps (Davatzes et al., 2003),
which are neglected in this study.
Earlier experimental and theoretical studies have proposed buckling (Peng and
Johnson, 1972) and bending (Renshaw and Schulson, 2001) of thin and slender rock slabs
between a set of fractures as a mechanism for through-going shear fracture formation. It
is difficult to identify these mechanisms in the field. As the field data show, most
fracture- bounded blocks have diamond shapes due to dihedral intersection angle between
21

479
480
481
482
483
484
485
486
487
488
489
490
491
492
493
494
495
496
497
498
499
500
501
the fracture sets and may not be favorable either for buckling or bending. Rather, the
triangular areas at the intersection of these fractures appear to be most prone to further
fracturing and fragmentation. The rotation and drifting of some fracture-bounded rock
blocks with respect to the neighboring blocks can be identified in advanced stages of
deformation, particularly within slivers preserved within fault cores. However, the
relative timing of these rotations and relative motions with respect to the shear zone
evolution cannot be determined.
Presence of multiple sets of fractures formed by splaying within fault steps and
inner damage zones with intersection angles less than 900, requires that all but the
youngest set of fractures are sheared. We assume that even the sheared fractures have
collinear open fractures along their lengths and, therefore, they can be represented as
rectangular flat fractures for the purpose of the effective properties calculations. The
mean value of the splay angle turns out to be 500 (de Joussineau et al., 2007) which falls
into the range of angles investigated.
The critical fracture densities of about 0.9 to 1.0 correspond to the lowest
vanishing values of shear moduli components (G55 and G44) for the intersection angle of
150 and one of the Young’s moduli component (E33) for all four intersection angles. This,
of course, is the upper bound for cataclastic failure. It is possible that cataclastic failure
for most cases may occur at fracture densities lower than that for thinner layers and
having the bedding interfaces fail as part of the fragmentation process which has not been
considered in our analyses. The quasi shear modulus for pure shear gives the highest
critical fracture density on the order of about 4, which implies that the failure will occur
earlier due to weakening of the other elastic parameters.
22

502
503
504
505
506
507
508
509
510
511
512
513
514
515
516
517
518
519
520
521
522
523
524
Conclusions
In this paper, we conceptualized fault growth in terms of increasing dimensions of
faults with fault slip and provided examples from the same structural and lithological
setting. We idealized complex fracture geometries at strike-slip fault steps and inner
damage zones in order to use the effective medium models for gaining an insight in the
influence of the fractures on the mechanical properties of rocks along and around the
faults. Our results indicate that a significant reduction in most components of the
Young’s, shear, and quasi-shear (for pure shear) moduli of the fractured rock masses
should occur as the fracture density increases modestly. The extrapolated values of the
Young’s and shear moduli for the fracture configuration which resulted in the greatest
moduli reduction would suggest an upper bound value for a critical density of ~0.9 to 1.0
for each set of fractures corresponding to a rough estimate of critical single set fracture
spacing value on the order of 4-5 cm for a bed thickness of 5 cm. This, in turn, sheds
some light on possible fracture densities for two sets of fractures leading to linkage and
coalescence of neighboring segments and to spread of cataclastic deformation along fault
zones into their inner damage zones. Increasing number of fracture sets and slip across, or
opening of, bed interfaces may facilitate failure at smaller bed normal fracture densities.
Acknowledgement: The works at the Valley of Fire State Park by many former graduate
students and postdocs who studied with AA at Stanford University formed the foundation
for establishing the conceptual models in this paper. A partial list of these includes R.
Myers, E. Flodin, N. Davatzes, P. Eichhubl, and G. de Joussineau. AA is supported by
23

525
526
527
528
529
530 531 532 533 534
535
536
537
538
539
540
541
542
543
544
545
546
547
548
the U. S. DOE Basic Energy Science, Division of Chemical Sciences, Geosciences and
Bio-Sciences, Grant # DE-FG03-94ER14462. Work of JGB performed under auspices of
the U. S. DOE by the University of California Lawrence Berkeley National Laboratory
under contract no DE-ACO2-05CH11231. AA thanks the Valley of Fire State Park
personnel for their support of the field campaigns through many years.
References Agosta, F., and Aydin, A., 2006. Architecture and deformation mechanism of a basin
bounding normal fault in mesozoic platform carbonates, central Italy. Journal of
Structural Geology 28, 2445-2467.
Ahmadov, R., Aydin, A., Karimi-Fard, M., Durlofsky, L., 2007. Permeability upscaling
of fault zones in the Aztec Sandstone, Valley of Fire State Park, Nevada with a focus on
slip surfaces and slip bands. Hydrogeology Journal, DOI 10.1007/s1004-007-0180-2.
Aki, K., 1989. Geometric features of a fault zone related to the nucleation and
termination of an earthquake rupture. In: Proceedings of Conference XLV Fault
Segmentation and Controls of Rupture Initiation and Termination. U.S. Geological
Survey Open File Report 89-315, 1-9.
Antonellini, M., Aydin, A., Pollard, D. D., and D'Onfro, P., 1994. Petrophysical study of faults in
sandstones using petrographic Image Analysis and X-ray Computerized Tomography. Pure and
Applied Geophysics 143, 181-201.
Aydin, A., 2000. Fractures, faults, and hydrocarbon entrapment, migration and flow.
Marine and Petroleum Geology 17, 797-814.
24

549
550
551
552
553
554
555
556
557
558
559
560
561
562
563
564
565
566
567
568
569
570
571
Aydin, A., and Ahmadov, R., 2009. Bed-parallel compaction bands: Their identification,
characterization and implications. Tectonophysics (to be submitted).
Aydin, A., Borja, R. I., and Eichhubl, P., 2006, Geological and Mathematical Framework for
failure modes in granular rock. Journal of Structural Geology 28, 83-98.
Aydin, A., and Nur, A., 1982. Evolution of pull-apart basins and their scale
independence. Tectonics 1, 91-105.
Aydin, A., and Schultz, R.A., 1990. Effect of mechanical interaction on the development of
strike-slip faults with echelon patterns, Journal of Structural Geology 12, 123-129.
Backus. G. E., 1962. Long-wave elastic anisotropy produced by horizontal layering.
Journal of Geophysical Research 67, 4427-4440.
Barka, A., and Kadinsky-Cade, K., 1988. Strike-slip fault geometry in Turkey and its
influence on earthquake activity. Tectonics 7, 663-684.
Ben-Zion, Y., and Sammis, C.G., 2003. Characterization of fault zones. Pure and Applied
Geophysics 160, 677-715, 0033 – 4553/03/040677–39.
Berryman, J. G., 2008. Elastic and transport properties in polycrystals of cracked grains:
Cross-property relations and microstructure. International Journal of Engineering Science
46, 500-512.
Berryman, J. G., and Aydin, A., 2009. Quasi-static analysis of elastic behaviour for some
higher density crack systems. International Journal of Numerical and Analytical Methods
in Geomechanics (to be submitted).
Berryman, J. G., and Grechka, V., 2006. Random polycrystals of grains containing
cracks: Model of quasistatic elastic behavior for fractured systems. Journal of Applied
Physics 100, 113527.
25

572
573
574
575
576
577
578
579
580
581
582
583
584
585
586
587
588
589
590
591
592
Bohannon, R.G.,1983. Mesozoic and Cenozoic tectonic development of the Muddy,
North Muddy, and northern Black Mountains, Clark County, Nevada. In: Miller, D. M,
Todd, V. R., and Howard, K. A., (Editors), Tectonic and stratigraphic studies in the
eastern Great Basin, Geological Society of America Memoir 157, 125-148.
Bristow, J., 1960. Microcracks and the static and dynamic elastic constants of annealed
and heavily cold-worked metals. British Journal of Applied Physics 11, 81-85.
Burgmann, R., and Pollard, D. D., 1994. Strain accommodation about strike-slip fault
discontinuities in granitic rock under brittle-to-ductile conditions. Journal of Structural
Geology 16, 1655-1674.
Cakir, M., and Aydin, A., 1994. Tectonics and fracture characteristics of the Northern
Lake Mead, SE Nevada, Proceedings of the Stanford Rock Fracture Project Workshop,
Field guide book.
Cakir, M., Aydin, A., and Campagna, D. J., 1998. Deformation pattern around conjoining
strike-slip faults systems in the Basin and Range, southeast Nevada: The role of strike-slip
faulting in basin formation and inversion. Tectonics 17, 344-359.
Cartwright, J. A., Trudgill, B. D., and Mansfield, C. S., 1995. Fault growth by segment
linkage: an explanation for scatter in maximum displacement and trace length
data from the Canyonlands Grabens of SE Utah. Journal of Structural Geology 17, 1319-
1326.
Chester, F. M., and Chester, J. S., 1998. Ultracataclasite structure and friction processes
of the San Andreas Fault. Tectonophysics 295, 199-221.
26

593
594
595
596
597
598
599
600
601
602
603
604
605
606
607
608
609
610
611
612
613
614
Childs, C., Manzocchi, T., Walsh, J. J., Bonson, C. G., Nicol, A., and Schopfer, M. P. J.,
2008. A geometric model of fault zone and fault rock thickness variations. Journal of
Structural Geology, doi:10.1016/j.jsg.2008.08.009.
Cowie, P. A., 1998. Normal fault growth in three dimensions in continental and oceanic
crust, in Faulting and Magmatism in Mid-Ocean Ridges. Geophysical Monograph Series
106, 325-349.
Cowie, P.A., and Scholz, C.H., 1992. Displacement-length scaling relationship for faults:
data synthesis and discussion. Journal of Structural Geology 14, 1149-1156.
Cox, S. J. D., and Scholz, C. H., 1988. Rupture initiation in shear fracture of rocks: An
experimental study. Journal of Geophysical Research 93, 3307-3320.
Crider, J.G., and Pollard, D.D., 1998. Fault linkage: three-dimensional mechanical
interaction between echelon normal faults. Journal of Geophysical Research 103, 24373–
24391.
Davatzes, N.C., Aydin, A., and Eichhubl, P., 2003. Overprinting Faulting Mechanisms
During the Development of Multiple Fault Sets in Sandstone, Chimney Rock, Utah.
Tectonophysics 363, 1-18.
Dawers, N. H., and Anders, M. H., 1995. Displacement-length scaling and fault linkage.
Journal of Structural Geology 17, 607-614.
Dawers, N. H., Anders, M. H., and Scholz, C. H., 1993. Growth of normal faults:
Displacement-length scaling. Geology 21, 1107-1110.
De Bremaecker, J.-Cl. ; Ferris, M. C., 2004. Numerical models of shear fracture
propagation. Engineering Fracture Mechanics 71, 2161-2178.
27
615
616
617
618
619
620
621
622
623
624
625
626
627
628
629
630
631
632
633
634
635
de Joussineau, G., and Aydin, A., 2009. Segmentation along strike-slip faults and their
self-similar architecture. Pure and Applied Geophysics (submitted).
de Joussineau, G., and Aydin, A., 2007. The evolution of the damage zone with fault
growth and its multiscale characterization. Journal of Geophysical Research 112,
B12401, doi:10.1029/2006JB004711.
de Joussineau, G., Mutlu, O., Aydin, A., and Pollard, D.D., 2007. Characterization of
strike-slip fault-splay relationships in sandstone. Journal of Structural Geology 29, 1831-
1842.
Dewey, J. W., 1976. Seismicity of Northern Anatolia. Bulletin Seismological Society of America
66, 843-868.
Du, Y., and Aydin, A., 1995. Shear fracture patterns and connectivity at geometric
complexities along strike-slip faults. Journal of Geophysical Research 100, 18093-18102.
Du, Y., and Aydin, A., 1993. The maximum distortional strain energy density criterion
for shear fracture propagation with applications to the growth paths of en echelon faults.
Geophysical Research Letters 20, 1091-1094.
Eichhubl, P., Taylor, W. L., Pollard, D.D., and Aydin, A., 2004. Paleo-fluid flow and
deformation in the Aztec Sandstone at the Valley of Fire, Nevada-Evidence for the
coupling of hydrogeologic, diagenetic and tectonic processes. Geological Society of
America Bulletin 116, 1120-1136.
Evans, J. P., 1990. Thickness-displacement relationships for fault zones. Journal of
Structural Geology 12, 1061-1065.
28

636
637
638
639
640
641
642
643
644
645
646
647
648
649
650
651
652
653
654
655
656
657
Flodin, E. A. and Aydin, A., 2004. Evolution of a strike-slip fault network, Valley of
Fire, southern Nevada. Geological Society of America Bulletin 116, 42-59, DOI
10.1130/B25282.1.
Flodin, E. A., Durlofsky, L. J. and Aydin, A., 2004. Upscaled models of flow and
transport in faulted sandstone: Boundary condition effects and explicit fracture modeling.
Petroleum Geoscience 10, 173-181.
Flodin, E., Aydin, A., Durlofsky, L. J., and Yeten, B., 2001. Representation of Fault Zone
Permeability in Reservoir Flow Models. Society of Petroleum Engineers paper # 71617,
1-10.
Flodin, E. A., Gerdes, M., Aydin, A., and Wiggins, W. D., 2005. Petrophysical properties
of cataclastic fault rock in sandstone. In: Sorkhabi, R., and Tsuji, Y., (editors), Faults,
fluid flow, and petroleum traps. American Association of Petroleum Geologists Memoir
85, 197-227.
Flodin, E; Prasad, M; Aydin, A., 2003. Petrophysical constraints on deformation styles in
Aztec sandstone, Southern Nevada, USA. Pure and Applied Geophysics 160, 1589-1610.
Gamond, J. F., 1983. Displacement features associated with fault zones: a comparison
between observed examples and experimental models. Journal of Structural Geology 5,
33-45.
Gamond, J. F., 1987. Bridging structures as sense of displacement criteria in brittle fault
zones. Journal of Structural Geology 9, 609-620.
Grechka, V., and Kachanov, M., 2006. Seismic characterization of multiple fracture sets:
Does orthotropy suffice? Geophysics 71, D93-D105.
29

658
659
660
661
662
663
664
665
666
667
668
669
670
671
672
673
674
675
676
677
678
679
680
Gupta, A., and Scholz, C.H., 2000. A model for fault interaction based on observations
and theory. Journal of Structural Geology 22, 865-879.
Harris, R. A., and Day, S. M., 1999. Dynamic 3D simulation of earthquakes on en
echelon faults. Geophysical Research Letters 26, 2089-2092.
Harris, R. A., Archuleta, R. J., and Day, S. M., 1999. Fault steps and the dynamic rupture
process: 2-d simulation of a spontaneously propagating shear fractures. Geophysical
Research Letters 18, 893-896.
Horii, H., and Nemat-Nasser, S., 1985. Compression-induced microcrack growth in
brittle solids: axial splitting and shear fracture. Journal of Geophysical Research 90,
3105-3125.
Hull, J., 1989. Thickness-displacement relationships for deformation zones. Journal of
Structural Geology 10, 431-435.
Jourde, H., Flodin, E.A., Aydin, A., and Durlofsky, L.J., 2002. Computing permeability
of fault zones in eolian sandstone from outcrops measurements. American Association of
Petroleum Geologists Bulletin 86, 1187-1200.
Kim, Y., Peacock, D. C. P., and Sanderson, D. J., 2004. Fault damage zones. Journal of
Structural Geology 26, 503-517.
Knott, S. D., Beach, A., Brockbank, P. J., Brown, J. L., McCallum, J. E., and Welbon, A.
I., 1996. Spatial and mechanical controls on normal fault population. Journal of Structural
G eology 18, 359-372.
Le Pichon, X., Şengör, A. M. C., Demirbağ, E., Rangin, C., İmren, C., Armijo, R., Görür,
N., Çağatay, N., Mercier de Lepinay, B., Meyer, B., Saatçilar, R., and Tok, B., 2001. The
active Main Marmara Fault. Earth and Planetary Sciences Letters 192, 595-616.
30

681
682
683
684
685
686
687
688
689
690
691
692
693
694
695
696
697
698
699
700
701
702
Lockner, D. A., and Madden, T. R., 1991. A multiple-crack model of brittle fracture 1.
Non-time-dependent simulations. Journal of Geophysical Research 96, 19,623-19,642.
Lyakhovsky, V., Ben-Zion, Y., 2009. Evolving fault zone structures in a damage
rheology model. Earth and Planetary Sci. Letters (submitted).
Lyakhovsky, V., Ben-Zion, Y., Agnon, A., 1997. Distributed damage, faulting, and
friction. Journal of Geophysical Research102, 27,635-27,649.
Martel, S. J., 1990. Formation of compound strike-slip fault zones, Mount Abbot
quadrangle, California. Journal of Structural Geology. 12:869-882.
Martel, S. J., and J. E. Peterson, Jr. 1991. Interdisciplinary characterization of fracture
systems at the US/BK site, Grimsel Laboratory, Switzerland. International Journal of
Rock Mechanics and Mining Science and Geomechanical Abstracts 28, 259-323.
Martel, S. J., Pollard, D. D., and Segall, P., 1988. Development of simple strike-slip fault
zones in granitic rock, Mount Abbot quadrangle, Sierra Nevada, California. Geological
Society of America Bulletin. 99, 1451-1465.
Myers, R. (1999), Structure and hydraulics of brittle faults in sandstone, Ph.D. thesis,
Stanford University.
Myers, R., and Aydin, A., 2004. The evolution of faults formed by shearing across joint
zones in sandstone. Journal of Structural Geology 26, 947-966.
Nye, J. F.1985. Physical properties of crystals: Their representation by tensors and
matrices. Oxford Science Publications.
Odling, N. E, Harris, S. D., and Knipe, R. J., 2004. Permeability scaling properties of
fault damage zones in siliclastic rocks. Journal of Structural Geology 26, 1727-1747.
31

703
704
705
706
707
708
709
710
711
712
713
714
715
716
717
718
719
720
721
722
723
724
725
Otsuki, K., and Dilov, T.,2005. Evolution of self-similar geometry of experimental fault
zones; implications for seismic nucleation and earthquake size. Journal of Geophysical
Research 110, B03303, doi:10.1029/2004JB003359.
Pachell, M.A., and Evans, J.P., 2002. Growth, linkage, and termination processes of a 10-
km-long strike-slip fault in jointed granite: the Gemini fault zone, Sierra Nevada,
California. Journal of Structural Geology 24, 1903-1924.
Peacock, D. C. P., and Sanderson, D. J., 1995, Strike-slip relay ramps. Journal of
Structural Geology 17, 1351-1360.
Peacock, D. C. P., and Sanderson, D. J., 1991. Displacement, segment linkage and relay
ramps in normal fault zones. Journal of Structural Geology 13, 721-733.
Peng, S., and Johnson, A. M., 1972. Crack growth and faulting in cylindrical specimens
of Chelmsford Granite. International Journal of Rock Mechanics, Mineral Sciences and
Geomechanics Abstracts 9, 37-86.
Pollard, D. D., and Fletcher, R. C., 2005. Fundamentals of Structural Geology,
Cambridge University Press, Cambridge, UK, 500 p.
Pollard, D. D., and Segall, P., 1987. Theoretical displacements and stresses near fractures
in rock: with applications to faults, joints, veins, dikes, and solution surfaces. In:
Atkinson, B., K. (ed), Fracture mechanics of rock, Academic Press, London, UK, 277-
349.
Reches, Z., and Lockner, D.A., 1994. Nucleation and growth of faults in brittle rocks.
Journal of Geophysical Research 99, 18159-18173.
Renshaw, C. E., and Schulson, E. M., 2001. Universal behaviour in compressive failure
of brittle materials. Nature 412, 897-899.
32

726
727
728
729
730
731
732
733
734
735
736
737
738
739
740
741
742
743
744
745
746
747
748
Rispoli, R., 1981. Stress fields about strike-slip faults inferred from stylolites and tension
gashes. Tectonophysics 75, 729-736.
Robertson, E. C., 1963. Relationship of fault displacement to gouge and breccia
thickness. Mineral Engineering Transactions, American Institute of Mining Engineering
35, 1426-1432.
Salivo, R., and Benedicto, A., 2004. A linkage criterion for segmented normal faults.
Journal of Structural Geology 26, 2251-2267.
Sayers, C. M., and Kachanov, M., 1991. A simple technique for finding effective elastic
constants of cracked solids for arbitrary crack orientation statistics. International Journal
of Solids and Structures 27, 671-680.
Schlische, R.W., Young, S. S., Ackermann, R. V. and Gupta, A., 1996. Geometry and
scaling relations of a population of very small rift-related normal faults. Geology 24, 683-
686.
Schoenberg, M., and Muir, F. A., 1989. A calculus for finely layered anisotropic media.
Geophysics 54, 581-489.
Scholz, C. H., 2002. The mechanics of earthquakes and faulting. Cambridge University
Press (2nd edition), Cambridge, UK, 471p.
Segall, P., and Pollard, D. D., 1980. Mechanics of discontinuous faults. Journal of
Geophysical Research 85, 4337-4350.
Segall, P., Pollard, D. D., 1983. Nucleation and growth of strike slip faults in granite.
Journal of Geophysical Research 88, 555-568.
Shaw, B. E., and Dieterich, J. H., 2007. Probabilities for jumping fault segment
stepovers. Geophysical Research Letters 34, L01307, doi:10.1029/2006GL027980.
33
749
750
751
752
753
754
755
756
757
758
759
760
761
762
763
764
765
766
767
768
769
770
771
Shipton, Z. K., and Cowie, P. A., 2003. A conceptual model for the origin of fault
damage zone structures in high-porosity sandstone. Journal of Structural Geology, 25,
333-344.
Sibson, R. H., 1986. Structural permeability of fluid-driven fault-fracture meshes. Journal
of Structural Geology 18, 1031-1042.
Sibson, R. H., 1985. Stopping of earthquake ruptures at dilational fault jogs. Nature 316,
248-251.
Stein, R. S., Barka, A. A. and Dieterich, J. H., 1997. Progressive failure on the North Anatolian
fault since 1939 by earthquake stress triggering. Geophysical Journal Interternational 128, 594-
604.
Sternlof, K. R., Karimi-Fard, M., Pollard, D. D., and Durlofsky, L. J., 2006. Flow and
transport effects of compaction bands in sandstone at scales relevant to aquifer and
reservoir management. Water Resources Research 42, W07425,
doi:10.1029/2005WR004664.
Sternlof, K. R., Rudnicki, J. W., and Pollard, D. D., 2005. Anticrack inclusion model for
compaction bands in sandstone. Journal of Geophysical Research. 110, 1-16, B11403,
doi:10.1029/2005JB003764
Stirling, M. W., Wesnousky, S. G., and Shimazaki, K., 1996. Fault trace complexity,
cumulative slip, and the shape of the magnitude-frequency distribution for strike-slip
faults: a global survey. Geophysical Journal International 124, 833-868.
Taylor, W. L., Myers, R., and Aydin, A., 1997. Geology of the Valley of Fire Sate Park,
Southeastern Nevada, Proceedings of the Stanford Rock Fracture Project Field
Workshop.
34

772
773
774
775
776
777
778
779
780
781
782
783
784
785
786
787
788
789 790 791 792 793 794 795 796 797 798 799 800
Taylor, W. L., Pollard, D. D., and Aydin, A., 1999. Fluid flow in discrete joint sets: Field
observations and numerical simulations. Journal of Geophysical Research 104, 28983-
29006.
Toksöz, N., Shakal, A. F., and Michael, A. J., 1979. Space-time migration of earthquakes along
the North Anatolian fault zone and seismic gap. Pure and Applied Geophysics 117, 1258-1270.
Walsh, J. J., Watterson, J., 1987. Distribution of cumulative displacement and seismic
slip on a single normal fault surface. Journal of Structural Geology 9, 1039–1046.
Watterson, J., 1986. Fault dimensions, displacement and growth. Pure and Applied Geophysics
124, 365-373.
Wesnousky, S. G., 1988. Seismological and structural evolution of strike-slip faults.
Nature 335, 340-342.
Wesnousky, S. G., 2006. Predicting the endpoints of earthquake ruptures. Nature 444,
358-360.
Willemse, E. J. M., Peacock, D. C. P., Aydin, A., 1997. Nucleation and growth of strike-
slip faults in limestones from Somerset, U. K. Journal of Structural Geology 19, 1461–
1477.
35

Figure captions: 801 802 803
804
805
806
807
808
809
810
811
812
813
814
815
816
817
818
819
820
821
822
823
Fig. 1 Idealized diagrams showing: (a) segmentation along strike-slip faults and their
segment lengths, heights and step numbers. Overlaps (or step lengths) and step widths (or
fault separations) are also shown in inset. (b) Internal architecture of a strike slip fault
showing fault core, which includes fault rock and slip surfaces, and the surrounding
damage zone.
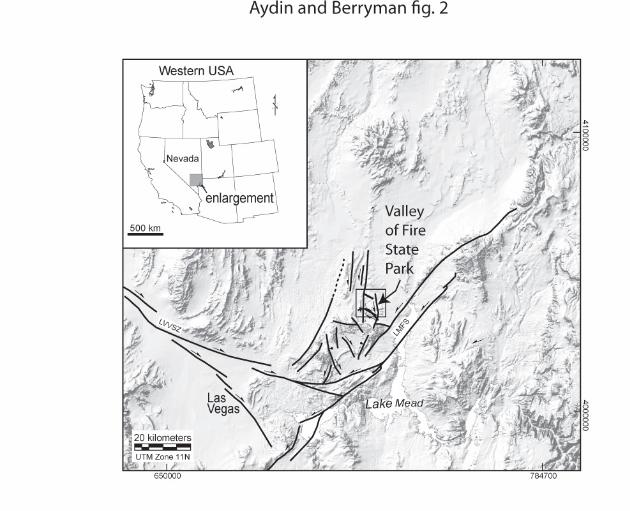
Fig. 2. Location and generalized map of Cenozoic strike-slip faults in the Valley of Fire
region of southern Nevada. Heavy lines are faults. Arrows indicate predominant sense of
slip. LMFS = Lake Mead Fault System, LVVSZ = Las Vegas Valley Shear Zone.
Rectangle marks the location of the Valley of Fire State Park.
Fig. 3. Idealized diagrams summarizing general trends of (a) mean segment length and
number of steps per km, and (b) mean fault rock and mean damage zones widths as the
maximum fault slip increases.
Fig. 4. (a) Incipient right-lateral shearing (~2 cm) of a series of echelon joints with right
steps. Splay fractures at high angle to the sheared joints are localized near the tips of the
segments at the steps. (b) Two sets of splay fractures at and around a right step along a
strike-slip fault with about 80cm right-lateral slip. The two sets have a range of
intersection angles from 300 to 600.
36

824
825
826
827
828
829
830
831
832
833
834
835
836
837
838
839
840
841
842
843
844
845
846
Fig. 5. Detailed map of the end of a small shear zone of about 65 cm right-lateral slip
showing a set of slightly sheared and highly overlapped echelon joints with many splay
joints at high angle to the sheared joints. Gray shading marks narrow pockets of
fragmentation and thick lines show incipient through-going slip surfaces orientated at a
small angle to the sheared initial echelon joints. Interpreted by AA from a map by N.
Davatzes (unpublished).
Fig. 6. (a and b). Detailed maps of a strike-slip fault with about 14 m left-lateral slip. (b)
shows the orientations, lengths, and intersections of damage zone fractures (splay joints
and sheared splay joints) around the fault core (Myers and Aydin, 2004) whereas (a)
shows a new reinterpreted version of the same fault architecture in which noncolinear
pockets of fault rocks and highly fractured domains of occasionally fragmented damage
zone are delineated in the field. One through-going slip surface (thick solid line) and
several short slip surfaces (dotted lines) diagonal to the through-going slip surface are
highlighted. The geometry and distribution of many of short diagonal slip surfaces
resemble the initial echelon sheared joints observed along faults with smaller slip in the
area. Mapped by N. Davatzes (unpublished) and revised by AA.
Fig. 7. Damage zone characteristics around the strike-slip fault with ~14 m left-lateral
slip. (a) Two fractured domains were distinguished: The inner damage zone of high
fracture density right next to the fault core; and the outer damage zone of significantly
lower fracture density. (b) A detailed map of the inner damage zone shows that several
generations of splay fractures (marked by different color codes) fill in between the
37

847
848
849
850
851
852
853
854
855
856
857
858
859
860
861
862
863
864
865
866
867
868
869
echelon sheared joints of the initial stage. (a and b from de Joussineau and Aydin, 2007).
(c) Detail map showing fine- and course-grained fault rock and major through-going slip
surfaces along a left-lateral fault with about 45 m left-lateral slip. Some of the earlier
fractures within the course-grained fault rock can still be identified (dotted lines). Also
important to point out triangular pockets of fine-grained fault rock protruding into the
damage zone in some locations on the left hand side of the fault core, where the fracture
intensity is the highest.
Fig. 8. Conceptual model showing linkage and coalescence of fault segments or strands
which result in longer segment lengths, reduced number of fault steps, larger step sizes,
and wider damage zones and fault rock zones with increasing fault slip. (From de
Joussineau and Aydin, 2007).
Fig. 9. (a). A simplified and idealized fracture pattern at fault steps and within inner
damage zones. The pattern is defined by the angle (ΦF) between the two fracture sets and
lengths (l) and density (ρ) of the fracture systems. Fracture density is proportional to the
ratio of layer thickness (h) to average spacing (s). (b and c) Block diagrams showing the
procedure to represent layers with each fracture set and the configurations of the layers
for averaging the effective properties in z- and x-directions or 3-and 1-directions,
respectively. The block diagrams represent stacking up layers vertically in z-direction (b-
sandwich configuration) and arranging the layers side by side in x-direction (c-
contiguous configuration).
38

39
870
871
872
873
874
875
876
877
878
879
Fig. 10. Plots showing the variation in elastic moduli of rocks with prescribed fracture
patterns (defined by the angle, ΦF, between two fracture sets as 150, 300, 450and 600) and
a range of fracture densities (ρ from 0.05 to 0.2). (a) The three components of the
Young’s moduli (E11, E22, and E33) with increasing fracture density. The nearly horizontal
solid blue line near the top represents all four E11 plots for all four angles between the
fracture sets (the lines just overlap). (b) The three components of the shear moduli (G44,
G55, and G66) for the four angles with increasing fracture density (ρ). (c) The quasi-shear
moduli for pure shear for the same four angular configurations. This moduli show the
least decrease in magnitude with respect to that for no-fracture state.