Structural Properties and Deformation Patterns of Evolving Strike-slip Faults: Numerical Simulations Incorporating Damage Rheology YARON FINZI, 1 ELIZABETH H. HEARN, 1 YEHUDA BEN-ZION, 2 and VLADIMIR LYAKHOVSKY 3 Abstract—We present results on evolving geometrical and material properties of large strike-slip fault zones and associated deformation fields, using 3-D numerical simulations in a rheologically-layered model with a seismogenic upper crust governed by a continuum brittle damage framework over a viscoelastic substrate. The damage healing parameters we employ are constrained using results of test models and geophysical observations of healing along active faults. The model simulations exhibit several results that are likely to have general applicability. The fault zones form initially as complex segmented structures and evolve overall with continuing deformation toward contiguous, simpler structures. Along relatively-straight mature segments, the models produce flower structures with depth consisting of a broad damage zone in the top few kilometers of the crust and highly localized damage at depth. The flower structures form during an early evolutionary stage of the fault system (before a total offset of about 0.05 to 0.1 km has accumulated), and persist as continued deformation localizes further along narrow slip zones. The tectonic strain at seismogenic depths is concentrated along the highly damaged cores of the main fault zones, although at shallow depths a small portion of the strain is accommodated over a broader region. This broader domain corresponds to shallow damage (or compliant) zones which have been identified in several seismic and geodetic studies of active faults. The models produce releasing stepovers between fault zone segments that are locations of ongoing interseismic deformation. Material within the fault stepovers remains damaged during the entire earthquake cycle (with significantly reduced rigidity and shear- wave velocity) to depths of 10 to 15 km. These persistent damage zones should be detectable by geophysical imaging studies and could have important implications for earthquake dynamics and seismic hazard. Key words: Damage rheology, fault zone structure, strike-slip fault evolution, compliant zones, fault stepovers. 1. Introduction Understanding the geometrical and mechanical properties of fault zones is important for many geoscience fields, including earthquake mechanics, crustal hydrology and mineral exploration. Since crustal faults generally grow and evolve through repeated earthquake ruptures, there are fundamental feedback mechanisms between the earth- 1 Department of Earth and Ocean Sciences, University of British Columbia, Vancouver B.C. V6T 1Z4, Canada. E-mail: yfi[email protected]; [email protected] 2 Department of Earth Sciences, University of Southern California Los Angeles, CA 90089-0740, U.S.A. E-mail: [email protected] 3 Geological Survey of Israel, Jerusalem 95501, Israel. E-mail: [email protected] Pure appl. geophys. 166 (2009) 1537–1573 Ó Birkha ¨user Verlag, Basel, 2009 0033–4553/09/101537–37 DOI 10.1007/s00024-009-0522-1 Pure and Applied Geophysics

Welcome message from author
This document is posted to help you gain knowledge. Please leave a comment to let me know what you think about it! Share it to your friends and learn new things together.
Transcript
Structural Properties and Deformation Patterns of Evolving Strike-slip
Faults: Numerical Simulations Incorporating Damage Rheology
YARON FINZI,1 ELIZABETH H. HEARN,1 YEHUDA BEN-ZION,2 and VLADIMIR LYAKHOVSKY3
Abstract—We present results on evolving geometrical and material properties of large strike-slip fault zones
and associated deformation fields, using 3-D numerical simulations in a rheologically-layered model with a
seismogenic upper crust governed by a continuum brittle damage framework over a viscoelastic substrate. The
damage healing parameters we employ are constrained using results of test models and geophysical observations
of healing along active faults. The model simulations exhibit several results that are likely to have general
applicability. The fault zones form initially as complex segmented structures and evolve overall with continuing
deformation toward contiguous, simpler structures. Along relatively-straight mature segments, the models
produce flower structures with depth consisting of a broad damage zone in the top few kilometers of the crust and
highly localized damage at depth. The flower structures form during an early evolutionary stage of the fault
system (before a total offset of about 0.05 to 0.1 km has accumulated), and persist as continued deformation
localizes further along narrow slip zones. The tectonic strain at seismogenic depths is concentrated along the
highly damaged cores of the main fault zones, although at shallow depths a small portion of the strain is
accommodated over a broader region. This broader domain corresponds to shallow damage (or compliant) zones
which have been identified in several seismic and geodetic studies of active faults. The models produce releasing
stepovers between fault zone segments that are locations of ongoing interseismic deformation. Material within the
fault stepovers remains damaged during the entire earthquake cycle (with significantly reduced rigidity and shear-
wave velocity) to depths of 10 to 15 km. These persistent damage zones should be detectable by geophysical
imaging studies and could have important implications for earthquake dynamics and seismic hazard.
Key words: Damage rheology, fault zone structure, strike-slip fault evolution, compliant zones, fault
stepovers.
1. Introduction
Understanding the geometrical and mechanical properties of fault zones is important
for many geoscience fields, including earthquake mechanics, crustal hydrology and
mineral exploration. Since crustal faults generally grow and evolve through repeated
earthquake ruptures, there are fundamental feedback mechanisms between the earth-
1 Department of Earth and Ocean Sciences, University of British Columbia, Vancouver B.C. V6T 1Z4,
Canada. E-mail: [email protected]; [email protected] Department of Earth Sciences, University of Southern California Los Angeles, CA 90089-0740, U.S.A.
E-mail: [email protected] Geological Survey of Israel, Jerusalem 95501, Israel. E-mail: [email protected]
Pure appl. geophys. 166 (2009) 1537–1573 � Birkhauser Verlag, Basel, 2009
0033–4553/09/101537–37
DOI 10.1007/s00024-009-0522-1Pure and Applied Geophysics

quakes sustained by a fault and its structural evolution. Observational and theoretical
studies indicate that the temporal and frequency-size statistics of earthquakes change as
faults evolve with cumulative slip, from disordered structures to more regular mature
fault zones (e.g., WESNOUSKY, 1994; BEN-ZION, 1996; STIRLING et al., 1996; LYAKHOVSKY
et al., 2001). The evolution of the permeability structures around large faults affects the
fluid flow properties of the crust and deposition of minerals (e.g., MICKLETHWAITE and
COX, 2004). The evolving fluid flow regime influences in turn the mechanics of
earthquakes and faults (e.g., HICKMAN et al., 1995 and references therein). Fault stepovers
and other geometrical heterogeneities affect the initiation, propagation and termination of
earthquakes (e.g., SIBSON, 1985; KING, 1986; HARRIS and DAY, 1999; OGLESBY et al., 2003;
WESNOUSKY, 2006). Contrasts of elastic and permeability properties across faults affect
the mode and properties of dynamic ruptures, seismic radiation and aseismic slip (e.g.,
BEN-ZION and ANDREWS, 1998; RUDNICKI and RICE, 2006; YAMASHITA, 2007; AMPUERO and
BEN-ZION, 2008; DUNHAM and RICE, 2008).
Detailed mapping of several exhumed fault zones (e.g., CHESTER et al., 1993; EVANS
et al., 2000; SIBSON, 2003) and additional observations summarized by BEN-ZION and
SAMMIS (2003) indicate that the internal structure of fault zones evolves from an early
stage associated with distributed deformation and band-limited fractal structures at
several hierarchies, through localization to principal slip zones, to a mature stage
characterized by large-scale faults with tabular damage zones and narrow cores of ultra-
cataclasites. However, the ranges of conditions over which such evolution takes place,
and the coupling between the evolving structures and distributions of crustal stress and
strain, are not well understood. Various studies attempted to model changes of fault
properties with ongoing deformation. For example, OLSON and POLLARD (1989) modeled
the evolution of joints based on linear elastic fracture mechanics. COWIE et al. (1993)
simulated evolving geometrical properties of fault networks using a scalar elastic field on
a lattice model with spring-like elements. ANDREWS (2005), BEN-ZION and SHI (2005) and
TEMPLETON and RICE (2008) simulated the generation of off-fault plastic strain during
propagation of dynamic ruptures on frictional faults surrounded by a solid governed by
Coulomb plastic yielding. While these studies provide important insights for various
topics, they do not account for the evolution of elastic properties that accompanies the
generation of cracking and inelastic strain, and they are also typically done within 2-D
‘‘plane strain’’ frameworks.
In the present work we attempt to understand some general aspects of the evolution of
large strike-slip fault zone structures. The study is based on three-dimensional numerical
simulations with a regional lithospheric model consisting of a seismogenic crust
governed by damage rheology over a viscoelastic substrate (BEN-ZION and LYAKHOVSKY,
2006). Using this framework with parameters constrained by laboratory and geophysical
observations, we examine the evolving geometrical and elastic properties of fault zones
and the associated deformation patterns.
In the next section we summarize observational results on fault zone structures that
are relevant to our study. In Section 3 we review the damage rheology framework and
1538 Y. Finzi et al. Pure appl. geophys.,

key aspects of the numerical model employed in this work. In Section 4 we use
geophysical observations of strength degradation and recovery within active fault zones
to narrow the range of admissible damage rheology parameters. Section 5 contains the
results of our parameter-space study on structural evolution of large strike-slip fault
zones. Our simulations produce for ranges of realistic conditions flower structures with
depth and secondary faulting within stepovers comparable to those documented in
geological and seismic studies. The results support the view that fault zones display
highly localized slip embedded within a wider shallow damage zone. The implications of
the results to plate boundary dynamics and suggestions for continuing studies are
discussed in Section 6.
2. Geological and Geophysical Observations of Fault Zone Structure
The geometrical properties of fault structures and earthquake slip zones have been
documented in many geological and geophysical studies. In general, strike-slip fault
zones display a nested hierarchy of damage zones and slip surfaces that form ‘‘flower
structures’’ with depth (e.g., WILCOX et al., 1973; SYLVESTER and SMITH, 1976; SYLVESTER,
1988). In a typical fault structure, the principal slip zone is surrounded by gouge and
embedded within a tabular or wedge-shaped damage zone (BEN-ZION and SAMMIS, 2003,
and references therein). The extent of the damage zone may be defined as the region in
which the density of deformation features exceeds the average regional level of
deformation in the surrounding host rock (CHESTER, 1995).
Studies of earthquake slip in exhumed faults and paleoseismic trenches indicate that
within the top few kilometers of the crust the majority of coseismic slip is accommodated
along very narrow slip zones (e.g., SIBSON, 2003; ROCKWELL and BEN-ZION, 2007). The
highly localized slip zone and surrounding ultracataclasite layer are referred to as the
‘‘core’’ of the fault zone. This fault core is typically parallel to the macroscopic slip
vector and is surrounded by a cataclasite layer which is a few meters thick (e.g., CHESTER
and CHESTER, 1998; SCHULZ and EVANS, 2000). The damage zone (DZ) around the fault
core typically consists of a zone of intense damage, and possibly pulverized rocks, with
a width of a few hundred meters (DOR et al., 2006, 2008), which is surrounded by a
broader, several kilometers wide zone, of distributed damage. The latter is probably a
relic structure of the progressive coalescence and localization of the active fault zone
over time (AMBRASEYS, 1970; KIM et al., 2004; SIBSON, 2003).
The near-surface observations of distributed DZ are supported and complemented by a
variety of geophysical studies that associate the DZ with a negative gravity anomaly and
low seismic velocities (e.g., STIERMAN, 1984; MOONEY and GINZBURG, 1986), along with
anisotropic seismic waves (e.g., COCHRAN et al., 2003; LIU et al. 2004; PENG and BEN-ZION,
2004, 2005) and elevated seismic scattering (e.g., REVENAUGH, 2000). Within the fault
zone, seismic waves may be trapped in a narrow zone of intense coherent damage that is
significantly distinct from the wider distributed damage zone (e.g., BEN-ZION and AKI,
Vol. 166, 2009 Damage Rheology Models of Strike-slip Fault Zone Evolution 1539
1990; LI et al., 1990). Such fault zone trapped waves have been observed along large faults
of the North Anatolian Fault System (NAFS), the Eastern California Shear Zone (ECSZ)
and the San Andreas Fault System (e.g., LI et al., 1994; BEN-ZION et al., 2003). Systematic
inversions of trapped waves indicate *100 m wide tabular zones that extend typically to
*3–4 km depth and are characterized by strong attenuation and *30–50% shear-wave
velocity (Vs) reduction relative to their surroundings (PENG et al., 2003; KORNEEV et al.,
2003; LEWIS et al., 2005).
Damage zones also show up in geodetic measurements that detect amplification of
deformation signals along fault zones. BEN-ZION et al. (1990) observed amplified strain
and water-level signals at several locations along the Mojave segment of the San Andreas
fault. FIALKO et al. (2002) and HAMIEL and FIALKO (2007) interpreted measurements of
Interferometeric Synthetic Aperture Radar (InSAR) along several large strike-slip faults
in terms of compliant zones that are 1–2 kilometers wide, 3 km to over 10 km deep, and
which have rigidity (l) reduction of 50%–70% relative to the host rock. The
discrepancies in dimensions (particularly, width) of the geodetically determined
‘‘compliant zones’’ and seismically determined ‘‘trapping structures’’ probably reflect
differences between the broader long-term, quasi-passive, damage structure and the
narrower active zone associated with recent earthquake ruptures. Other effects may feed
into these discrepancies. For example, distributed microfractures affect the geodetically
observed static strength more than they affect the seismically observed dynamic strength
of rock (e.g., IDE, 1936; EISSA and KAZI, 1988). Other seismic observations such as
seismic anisotropy (e.g., COCHRAN et al., 2003; LIU et al. 2004; PENG and BEN-ZION, 2004,
2005) and elevated scattering (e.g., REVENAUGH, 2000) near large faults conform with the
geodetically determined wide damage zones (1–2 km wide at the top few kilometers),
indicating perhaps that the ‘‘trapping structures’’ are much smaller than the entire damage
zone.
To date, the best evidence of high localization of seismic slip at depths larger than
3–5 km is associated with the general tendency of seismicity to localize along relatively-
straight fault segments to zones with width that is comparable to the smallest dimension
that is resolvable by the data analysis. In places with good network coverage and
relocated seismicity, the width of such zones is only a few tens of meters (e.g., POUPINET
et al., 1984; NADEAU et al., 1994; SCHAFF et al., 2002; MCGUIRE and BEN-ZION, 2005;
THURBER et al., 2006).
A significant deviation from the relatively simple DZ structure described above
occurs at fault stepover zones. Fault zones generally display higher geometrical
complexity and broader damage zones within stepovers than along relatively straight
segments. While the major fault segments reflect a positive feedback of strain weakening
and strain localization along the fault cores, persisting geometrical features such as fault
offsets, kinks, and bends, can produce strain hardening that leads to local complexity and
secondary fractures at different scales (BEN-ZION and SAMMIS, 2003). Many studies have
characterized macroscopic structural features within enlarged damage zones at geomet-
rical irregularities (e.g., SEGALL and POLLARD, 1980; KIM et al., 2004). Our study attempts
1540 Y. Finzi et al. Pure appl. geophys.,
to clarify the evolution of structural properties of fault zones along relatively straight
segments as well as near large persisting stepovers.
3. Damage Rheology Framework
3.1. Theoretical Background
In the past decade continuum damage mechanics models have been successfully
applied (e.g., BERCOVICI and RICARD, 2003; TURCOTTE and GLASSCOE, 2004) in various
studies of long-term tectonic deformation. LYAKHOVSKY et al. (1997a,b), HAMIEL et al.
(2004) and references therein developed a thermodynamically-based continuum damage
model for evolving elastic properties of rocks sustaining irreversible brittle deformation.
The employed damage rheology is applicable to volumes with a sufficiently large number
of cracks that allow quantitative description through properties of the crack distribution
rather than those of the individual cracks (LYAKHOVSKY and MYASNIKOV, 1984, 1985). The
model generalizes the strain energy function of a solid to account for first-order
macroscopic effects of distributed cracks (i.e., damage), and makes the elastic moduli
functions of an evolving damage state variable a representing the local crack density. An
undamaged material with a = 0 is the ideal solid governed by 3-D linear elasticity, while
a material with a = 1 is completely destroyed. Using the balance equations of energy and
entropy, the damage model quantifies the effective elastic behavior of a cracked solid for
all intermediate values of the damage variable (0 < a < 1). Detailed reviews and recent
developments of the model can be found in BEN-ZION and LYAKHOVSKY (2006) and
LYAKHOVSKY and BEN-ZION (2008). Here we only summarize the main ingredients of the
model that are relevant for our work.
The effects of distributed cracks (i.e., existing damage) on the elastic properties of a
solid are accounted for in the damage model by generalizing the strain energy function to
the form:
U ¼ 1
qk2
I21 þ lI2 � cI1
ffiffiffiffi
I2
p� �
ð1Þ
where I1 = ekk and I2 = eijeij are the first and second invariants of the elastic strain tensor
eij, q is the mass density, k and l are the Lame parameters, and c is a third modulus of a
damaged solid. The first two terms of equation (1) give the classical strain potential of
linear elasticity (e.g., MALVERN, 1969). The third term may be derived using the effective
medium theory of BUDIANSKY and O’CONNELL (1976) for non-interacting cracks that dilate
and contract in response to tension and compression (LYAKHOVSKY et al., 1997b), or by
expanding the strain energy potential as a general second-order function of I1 and I2 and
eliminating non-physical terms (BEN-ZION and LYAKHOVSKY, 2006).
The kinetic aspects of the damage rheology involve making the elastic moduli
functions of the damage state variable, and deriving an equation for the evolution of
Vol. 166, 2009 Damage Rheology Models of Strike-slip Fault Zone Evolution 1541

damage. LYAKHOVSKY et al. (1997a) showed that the leading term of the damage evolution
equation, satisfying energy conservation and nonnegative entropy production, can be
written as
dadt¼
CdI2 n� n0ð Þ; for n� n0
C1 � exp aC2
� �
I2 n� n0ð Þ; for n\n0
(
ð2Þ
where n ¼ I1
�
ffiffiffiffi
I2
pis referred to as the strain-invariants ratio, and Cd, C1, C2 are damage
rate parameters further described in Sections 3.2 and 4.1. The parameter n0 is a yielding
threshold separating states of deformation involving material degradation (da/dt > 0)
when n > n0, and material healing (da/dt < 0) when n < n0. AGNON and LYAKHOVSKY
(1995) and LYAKHOVSKY et al. (1997a) related this parameter to the angle of internal
friction by considering the critical shear stress for Mohr-Coulomb sliding. They obtained
n0 = -0.8 for rock with internal friction coefficient of f = 0.6 and Poisson’s ratio
m = 0.25, and noted that this value varies only slightly (-0.7 to -0.9) for rocks with
Poisson’s ratio between 0.2 and 0.3.
Equation (2) was derived assuming for simplicity
k ¼k0 ¼ constant;
l ¼l0 þ a cmn0;
c ¼a cm;
ð3Þ
where cm is the maximum value of the third elastic modulus defined by normalization of
the damage variable. The dependencies of elastic moduli on the damage variable produce
the following changes during loading: As the damage variable a increases, the shear
modulus l decreases, Poisson’s ratio m increases, and the modulus c increases from 0
(damage free) to cm. Following the onset of positive damage evolution above the elastic
limit at n = n0 and before the final macroscopic failure, the model incorporates a gradual
accumulation of inelastic strain, eijv , described in Appendix 1. When the damage variable
reaches a critical value acr, there is brittle instability leading to rapid conversion of
deviatoric elastic strain to permanent plastic strain. The reduced deviatoric stress at the
end of the brittle failure episode typically leads to a state n < n0 that is associated
(equation (2)) with healing. The exponential dependency of the damage recovery
(healing) is motivated by the logarithmic healing with time that is observed for rocks and
other materials (e.g., DIETERICH, 1978; 1979). LYAKHOVSKY et al. (2005) showed that the
above damage model reproduces the main observed features of rate- and state-dependent
friction, and constrained the healing parameters C1, C2 by comparing model calculations
with lab Frictional data.
The main components of the numerical procedure, utilizing the Fast Lagrangian
Analysis of Continua (FLAC) algorithm (e.g., CUNDALL and BOARD, 1988; POLIAKOV et al.,
1993), is presented in Appendix 1. To simulate long-term deformation processes with
appropriate boundary conditions at the edges of our model domain, we use boundary
conditions with variable forces (LYAKHOVSKY and BEN-ZION, 2008). These boundary
1542 Y. Finzi et al. Pure appl. geophys.,

conditions account for the stress buildup and abrupt drop during each seismic cycle, and
for the evolution of elastic properties and cumulative plastic strain within the model
domain. Appendix 2 presents an overview of the variable-force boundary conditions, and
Appendix 3 applies the conditions in a test study verifying the viscoelastic component of
our code. Additional details on the employed damage model and comparisons of results
with laboratory fracture and friction data are given by LYAKHOVSKY et al. (1997a,b, 2005),
HAMIEL et al. (2004, 2006), BEN-ZION and LYAKHOVSKY (2006) and LYAKHOVSKY and
BEN-ZION (2008).
3.2. Damage Model Parameters
A fundamental set of results of previous damage-based models is that rheological
damage parameters have significant impact on the evolving geometrical properties of
fault zones, seismicity patterns and spatial distribution of deformation. LYAKHOVSKY et al.
(2001) and BEN-ZION and LYAKHOVSKY (2006) suggested that damage zone structure is
primarily controlled by (1) the ratio between loading rate and healing rate, (2) the overall
degree of ‘‘brittleness’’ of crustal deformation which may be parameterized by the
seismic coupling coefficient v, and (3) the susceptibility to propagation of rupture
associated with dynamic weakening and related dynamic time scale sr. Below we review
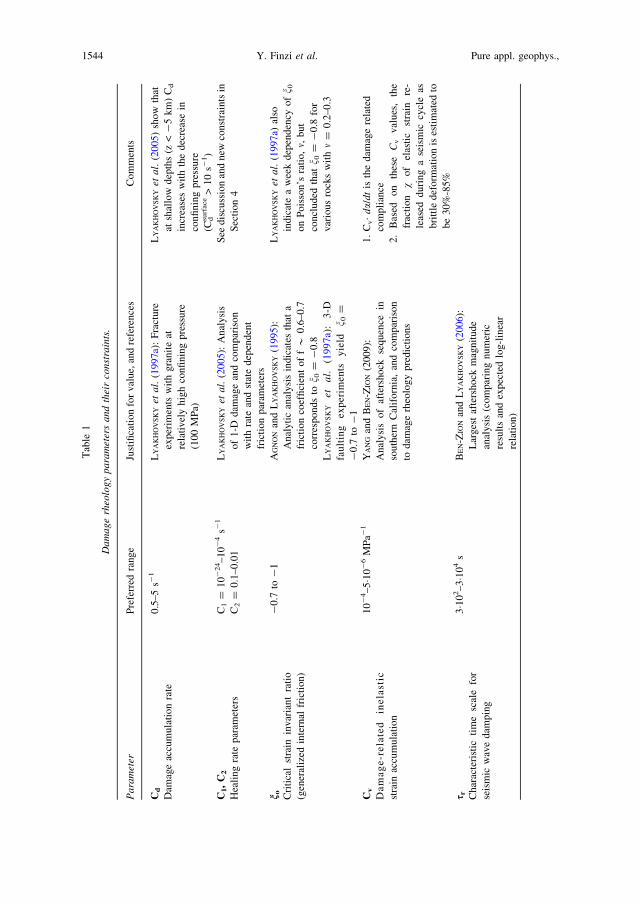
the main material parameters and outline their effect on fault zone evolution. Table 1
presents a synthesis of the plausible range of values for each parameter, and justifications
for these values.
As discussed in the context of equation (2), the employed damage rheology includes
three material parameters that affect the rate of damage evolution with time: C1 and C2
are both healing rate parameters, and Cd is the damage accumulation rate parameter. In
our simulations, the loading rate is closely linked to the specified tectonic strain rate and
the value of Cd is fixed. Therefore the ratio of loading rate to healing rate is governed by
the healing rate parameters C1 and C2. Simulations with high healing rates compared
to the loading rate result in rapid near-complete healing of fault damage. In such settings,
ruptured fault zones quickly regain their strength, enabling larger interseismic stress
accumulation and coseismic stress drops, and the evolving fault zones have more
complex geometries than cases with low healing rates.
The degree to which crustal deformation is brittle is controlled by the material
parameter Cv, the coefficient of damage-related inelastic deformation (Appendix 1). This
material parameter determines the ratio of aseismic to seismic components of
deformation, or the seismic coupling coefficient, given (BEN-ZION and LYAKHOVSKY,
2006) by v = 1/(1 ? R) through the nondimensional R value with R = l0Cv and l0
being the initial rigidity of the material. LYAKHOVSKY and BEN-ZION (2008) demonstrated
that higher crustal Cv values induce larger components of aseismic deformation in the
seismogenic zone, and therefore lower coseismic stress-drops. The susceptibility to
rupture propagation determines the degree of dynamic weakening and dynamic time scale
sr during the occurrence of brittle instability. LYAKHOVSKY et al. (2001) found that higher
Vol. 166, 2009 Damage Rheology Models of Strike-slip Fault Zone Evolution 1543
Tab
le1
Da
ma
ge
rheo
log
yp
ara
met
ers
an
dth
eir
con
stra
ints
.
Pa
ram
eter
Pre
ferr
edra
ng
eJu
stifi
cati
on
for
val
ue,
and
refe
ren
ces
Co
mm
ents
Cd
Dam
age
accu
mu
lati
on
rate
0.5
–5
s-1
LY
AK
HO
VS
KY
eta
l.(1
99
7a)
:F
ract
ure
exper
imen
tsw
ith
gra
nit
eat
rela
tivel
yhig
hco
nfi
nin
gpre
ssure
(10
0M
Pa)
LY
AK
HO
VS
KY
eta
l.(2
00
5)
sho
wth
at
atsh
allo
wd
epth
s(z
<-
5k
m)
Cd
incr
ease
sw
ith
the
dec
reas
ein
con
fin
ing
pre
ssu
re
(Cdsu
rface
>1
0s-
1)
C1,
C2
Hea
ling
rate
par
amet
ers
C1
=1
0-
24–
10
-4
s-1
C2
=0
.1–
0.0
1
LY
AK
HO
VS
KY
eta
l.(2
00
5):
An
alysi
s
of
1-D
dam
age
and
com
par
iso
n
wit
hra
tean
dst
ate
dep
end
ent
fric
tio
np
aram
eter
s
See
dis
cuss
ion
and
new
con
stra
ints
in
Sec
tio
n4
no
Cri
tica
lst
rain
invar
ian
tra
tio
(gen
eral
ized
inte
rnal
fric
tio
n)
-0
.7to
-1
AG
NO
Nan
dL
YA
KH
OV
SK
Y(1
99
5):
An
aly
tic
anal
ysi
sin
dic
ates
that
a
fric
tio
nco
effi
cien
to
ff*
0.6
–0
.7
corr
esponds
ton 0
=-
0.8
LY
AK
HO
VS
KY
eta
l.(1
99
7a)
:3
-D
fau
ltin
gex
peri
men
tsy
ield
n 0=
-0
.7to
-1
LY
AK
HO
VS
KY
eta
l.(1
99
7a)
also
ind
icat
ea
wee
kd
epen
den
cyo
fn 0
on
Po
isso
n’s
rati
o,m,
bu
t
con
clu
ded
that
n 0=
-0
.8fo
r
var
ious
rock
sw
ith
m=
0.2
–0
.3
Cv
Da
ma
ge
-re
late
din
ela
stic
stra
inac
cum
ula
tion
10
-4–
5�1
0-
6M
Pa-
1Y
AN
Gan
dB
EN
-ZIO
N(2
00
9):
Anal
ysi
sof
afte
rshock
sequen
cein
south
ern
Cal
iforn
ia,
and
com
par
ison
tod
amag
erh
eolo
gy
pre
dic
tion
s
1.
Cv�d
a/d
tis
the
dam
age
rela
ted
com
pli
ance
2.
Bas
edo
nth
ese
Cv
val
ues
,th
e
frac
tion
vo
fel
asti
cst
rain
re-
leas
edd
uri
ng
ase
ism
iccy
cle
as
bri
ttle
def
orm
atio
nis
esti
mat
edto
be
30
%-8
5%
s r Ch
arac
teri
stic
tim
esc
ale
for
seis
mic
wav
ed
amp
ing
3�1
02–
3�1
04
sB
EN
-ZIO
Nan
dL
YA
KH
OV
SK
Y(2
00
6):
Lar
ges
taf
ters
ho
ckm
agn
itu
de
anal
ysi
s(c
om
par
ing
nu
mer
ic
resu
lts
and
exp
ecte
dlo
g-l
inea
r
rela
tion)
1544 Y. Finzi et al. Pure appl. geophys.,
sr values induce larger ruptures and lead to relatively simple failure histories consisting of
system-sized events occurring in a single fault zone.
The above material parameters are currently constrained mainly by analytical
considerations and by fracture and friction experiments (Table 1). In the next section, we
use geophysical data to narrow the admissible range of healing rate parameters, and to
better relate these parameters to natural deformation processes observed along active
fault systems.
4. Geophysical Constraints on Healing Rate Parameters
4.1. Parameters C1 and C2, and Healing as a Function of Time
As follows from equation (2), the healing rate depends on the strain magnitude (I2),
strain invariant ratio (n), level of material damage (a), and material properties including
critical strain invariant ratio (n0) and two healing rate parameters C1 and C2. The critical
strain invariant ratio is well constrained and fairly constant (n0&-0.8). The strain
invariants ratio (n) varies from �ffiffiffi
3p
to þffiffiffi
3p
. The post failure shear strain (I2) is mostly
controlled by the lithostatic pressure and may vary with depth by two orders of magnitude
or less. Therefore, the rate and the overall effectiveness of the healing process are primarily
determined by the rate parameters C1 and C2. While C2 determines the rate dependence on
the damage state a and varies within one order of magnitude, C1 may vary by many orders
of magnitude (LYAKHOVSKY et al., 2005). Depending on the combination of these
parameters the healing process may be fast or slow, and may yield insignificant or near-
complete healing of the damaged material over long timescales. Equation (2) indicates that
very large C1 corresponds essentially to zero memory, in which case damaged material
heals rapidly and almost completely. If damage accumulation is also rapid (Cd is very large)
the model will display ideal elastoplastic behavior. Very small C1 yields insignificant
healing except for the special case of C2&0 in which healing is near instantaneous and
complete. Extremely large C2 values lead to a healing rate proportional to C1 (i.e., da/
dt = C1I2(n - n0)). In such cases, for C1 < 1�10-10 s-1 the healing is slow and insignificant
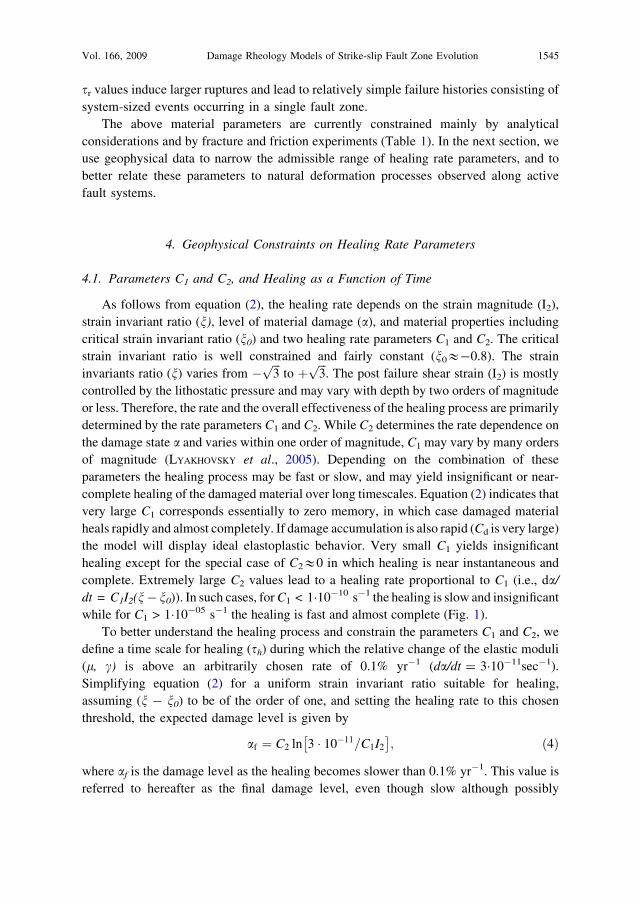
while for C1 > 1�10-05 s-1 the healing is fast and almost complete (Fig. 1).
To better understand the healing process and constrain the parameters C1 and C2, we
define a time scale for healing (sh) during which the relative change of the elastic moduli
(l, c) is above an arbitrarily chosen rate of 0.1% yr-1 (da/dt = 3�10-11sec-1).
Simplifying equation (2) for a uniform strain invariant ratio suitable for healing,
assuming (n - n0) to be of the order of one, and setting the healing rate to this chosen
threshold, the expected damage level is given by
af ¼ C2 ln 3 � 10�11=C1I2
� �
; ð4Þ
where af is the damage level as the healing becomes slower than 0.1% yr-1. This value is
referred to hereafter as the final damage level, even though slow although possibly
Vol. 166, 2009 Damage Rheology Models of Strike-slip Fault Zone Evolution 1545
significant healing continues after af is reached (at geological time scales). Substituting af
in equation (8) of LYAKHOVSKY et al. (2005) for the damage level as a function of time, the
time scale for healing (i.e., the duration required to reduce the damage level from a = 1
to af) can be estimated by
sh ¼exp
1�af
C2
� �
� 1
I2C1
C2exp 1
C2
� � : ð5Þ
Within the healing parameter space that represents materials that undergo significant
healing (i.e., damaged materials with af < 0.8), the time scale for healing (sh) falls in the
range 10–110 yr (Fig. 1a). The time scale for healing indicates how fast a damaged
material heals to a near constant damage level, however it does not reveal the final
damage level. Therefore, materials with similar sh may exhibit a wide range of final
damage levels (Fig. 1). Figure 1b displays six healing processes determined by six sets of
0 50 100 150 200 2500.4
0.5
0.6
0.7
0.8
0.9
1
1a1b
3b 3a
2b 2a
2b
1b
3b
2a1a
3a
(b)
time (yr)
dam
age
(α)
(a)Damage level (α)
Figure 1
(a) Damage levels of typical crustal material at 10 km depth after 50 years of healing, for the damage model
parameter space suggested by LYAKHOVSKY et al. (2005). Black and red lines show contours of equal damage and
final damage (af), respectively. White lines are contours of equal healing time scale (sh). Black diamonds
indicate sets of healing parameters referred to in Figure 1b. (b) Damage as a function of time after failure for six
sets of C1 and C2 parameters (indicated in Fig. 1a). The healing time scale (sh) and final damage level (af) of
each healing process are indicated by diamonds (red – 1a,b; black- 2a,b; blue – 3a,b). Note that some healing
occurs after af is attained (see Section 4.1).
1546 Y. Finzi et al. Pure appl. geophys.,
C1 and C2 parameters (marked and labeled in Fig. 1a). Healing processes with short time
scales (e.g., 1a and 1b in Fig. 1b) display higher initial healing rate and faster decay of
the healing rate compared to processes with longer time scales (e.g., 3a and 3b in
Fig. 1b). As evident from Figure 1b, in order to fully determine the healing parameters of
a material one would either need to establish the damage level at two distinct times after
failure or to determine the current damage level, the duration since failure and the healing
time scale relevant to the specific healing process.
LYAKHOVSKY et al. (2005) suggested that the parameter C2 is closely related to the
parameter b of rate and state friction (b * 10-1; C2 * 10-2-10-1), and obtained the
following relation between parameters C1 and C2:
C1 � BC2 exp � a0
C2
� �
e2cmp; ð6Þ
where B (*1–2 s-1) is a laboratory-determined time scale for the evolution of static
friction with hold time (DIETERICH, 1972, 1978) and ecmp is the compaction strain
estimated by the ratio between lithostatic stress and the bulk modulus (K). LYAKHOVSKY
et al. (2005) estimated ecmp * 10-2 for crustal rocks at seismogenic depths, but noted
that this strain level may vary significantly for various lithologies and depths. Since the
lithospheric stress within the seismogenic zone (depth 1–20 km) ranges between 20 MPa
and 400 MPa, and the bulk modulus of typical crustal rocks varies by an order of
magnitude (CHRISTENSEN and MOONEY, 1995), it is safe to assume that the compaction
strain could vary by 2–3 orders of magnitude. Given that the parameter B may differ from
the well-constrained lab-based values and that compaction strain may vary significantly,
we consider (Fig. 2) a wide range of C1 values per C2 value (six orders of magnitude).
4.2. In Situ Geophysical Constraints for Healing Parameters C1 and C2
We use data from seismic surveys along large fault zones with significant fault-
related damage to better constrain the healing parameters C1 and C2. Simplifying
equation (3) for uniform shear deformation l = l0(1-a), and using the relation between
rigidity, density and shear wave velocity (l = qVs2), we convert reported seismic velocity
and rigidity reductions (Section 2) into damage level estimates. The seismic and geodetic
studies indicate that major strike-slip fault zones rapidly heal in the top few km to
a & 0.75 during the early postseismic stage (BEN-ZION et al., 2003; PENG et al., 2003;
LEWIS et al., 2005), and thereafter display damage levels of a > 0.5 (HAMIEL and FIALKO,
2007; FIALKO et al., 2002; FIALKO, 2004). While the healing at greater depth is expected to
be higher, these observations may indicate that damage zones of large active faults do not
completely heal over time scales of typical earthquake cycles. This argument is supported
by the abundance of ancient fault zones that remain weaker than the surrounding rock
(TCHALENKO, 1970; SENGOR et al., 2005; ARMIJO et al., 1996; POWELL and WELDON, 1992;
EVANS et al., 2000). Additional support comes from previous numerical models
(LYAKHOVSKY et al., 2001; FINZI et al., 2006) and experimental work (TENTHOREY et al.,
Vol. 166, 2009 Damage Rheology Models of Strike-slip Fault Zone Evolution 1547

2003) showing that damage zones do not heal completely during the earthquake cycle.
The above is expected to be valid for low-porosity crystalline rocks. In contrast,
deformation bands in sandstones and other high porosity rocks are frequently denser and
stronger than their host rock (AYDIN and JOHNSON, 1983; SHIPTON and COWIE, 2003). The
limited healing argument implies that long-term interseismic healing in low porosity
rocks is typically minor and that damage generation and healing in such rocks occurs
predominantly in the seismogenic crust during the co- and early postseismic interval (e.g.,
over weeks to months). This is supported by various postseismic healing rate studies (e.g.,
LI et al., 2006; KARABULUT and BOUCHON, 2007; PENG and BEN-ZION, 2006; SCHAFF and
0 5 10 15 20 250.3
0.4
0.5
0.6
0.7
0.8
0.9
1.0
Depth (km)
αmin= 0.4αmax= 0.75
Damage level (α)
(a)
(b)
dam
age
(α)
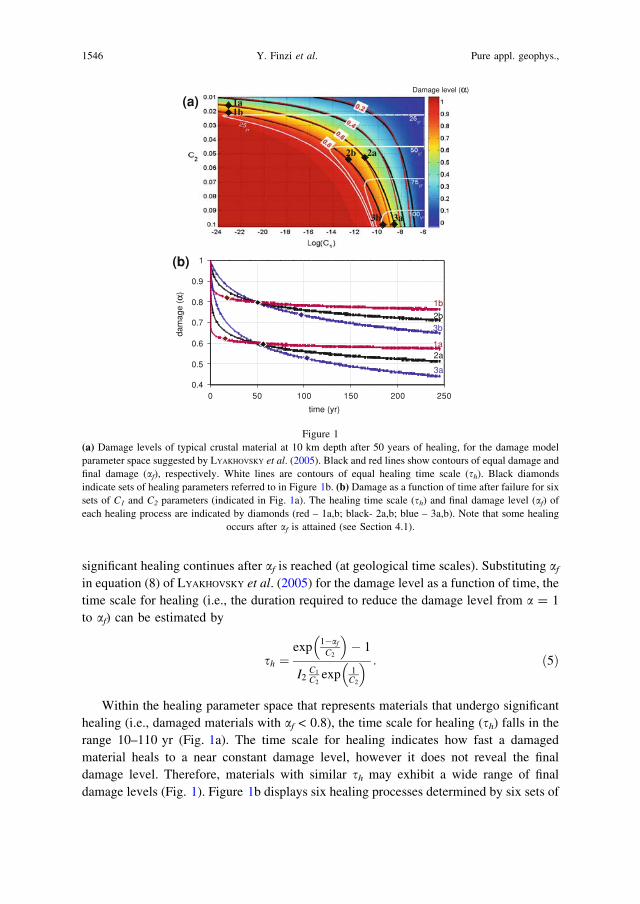
Figure 2
(a) Geophysical, analytical and laboratory-based constraints on healing parameters. Damage levels at a depth of
1 km after 50 years of healing are shown for C1 values within three orders of magnitude of their expected values
(Eq. (6)). The hatched region bracketed by the maximum healing time scale (sh = 40 yr) and the minimum and
maximum admissible damage levels (0.75 > af > 0.4) represents the healing parameters relevant to models of
natural damage zones (see text). Diamond symbols indicate two healing parameter sets plotted in Figure 2b for
illustration. (b) Estimated damage versus depth after 0.1 yr (gray lines), 10 yr (dark gray lines) and 100 years of
healing (thick black lines) under lithospheric stress conditions, for healing parameters representative of natural
fault zones (solid lines: C1 = 1�10-18 s-1, C2 = 0.02; dashed lines: C1 = 1�10-12 s-1, C2 = 0.03).
1548 Y. Finzi et al. Pure appl. geophys.,
BEROZA, 2004; RUBENSTEIN and BEROZA, 2004; BAISCH and BOKELMANN, 2001; WU et al.,
2009).
We note that the similar interseismic damage levels for the different fault zones
mentioned above may reflect resolution limitations of the seismic and geodetic methods
(i.e., perhaps materials with a < 0.5 are not reliably detected by these techniques). If this
is the case, the argument that long-term healing is minor may not be valid. Furthermore,
the healing parameters may be pressure- and/or temperature-dependent (as the damage
accumulation rate parameter Cd). Further work should be done to better constrain the
healing parameters at seismogenic depths. Finally, the healing computations in our
parameter space study do not take into account ongoing deformation (and damage
accumulation) due to continuous tectonic loading or nearby earthquakes, and therefore
they may underestimate damage levels in natural systems.
Based on the above considerations we suggest two general constraints for the healing
parameters suitable for models of natural processes: (a) the minimum damage level
expected in shallow crustal fault zones during the interseismic stage should be above
a & 0.4, and (b) the healing time scale representative of natural damage zones should be
shorter than sh & 40 yrs (yielding healing rates of 5–10% yr-1 after 4–5 months of
healing, and a very low rate of approximately 0.1% yr-1 after 40 years of healing). The
resulting healing parameter space is outlined in Figure 2 by a hatched pattern. The
admissible values of C1 and C2 in that subspace are 10-24 s-1 to 10-10 s-1 and 0.015 to
0.035, respectively.
A final analytical constraint for healing parameters can be derived from the convexity
condition for macroscopic failure used in our damage rheology framework (LYAKHOVSKY
et al., 1997a). This stability condition indicates that near the surface, where normal stress
is low compared to shear stress and the strain invariants ratio is approximately zero, the
maximum sustainable (stable) damage level is approximately a = 0.75. Therefore,
healing parameters that yield lasting damage levels greater than a = 0.75 at shallow
depths (z < 3 km) are assumed to be nonrealistic (Fig. 2).
5. Damage and Strain Distribution across Active Strike-slip Faults
To investigate the structure of damage zones associated with evolving strike-slip fault
systems, we use several realizations of a three-dimensional model of transform plate
boundary incorporating damage rheology in the upper crust.
5.1. Model Setup
A typical model setup (Fig. 3) consists of a layered seismogenic crust governed by
damage rheology, underlain by viscoelastic lower crust and upper mantle layers. The
modeled region is 100–250 km in the along-strike direction, 100 km wide and 50 km
deep. A detailed description of such a model setup is given by BEN-ZION and LYAKHOVSKY
Vol. 166, 2009 Damage Rheology Models of Strike-slip Fault Zone Evolution 1549
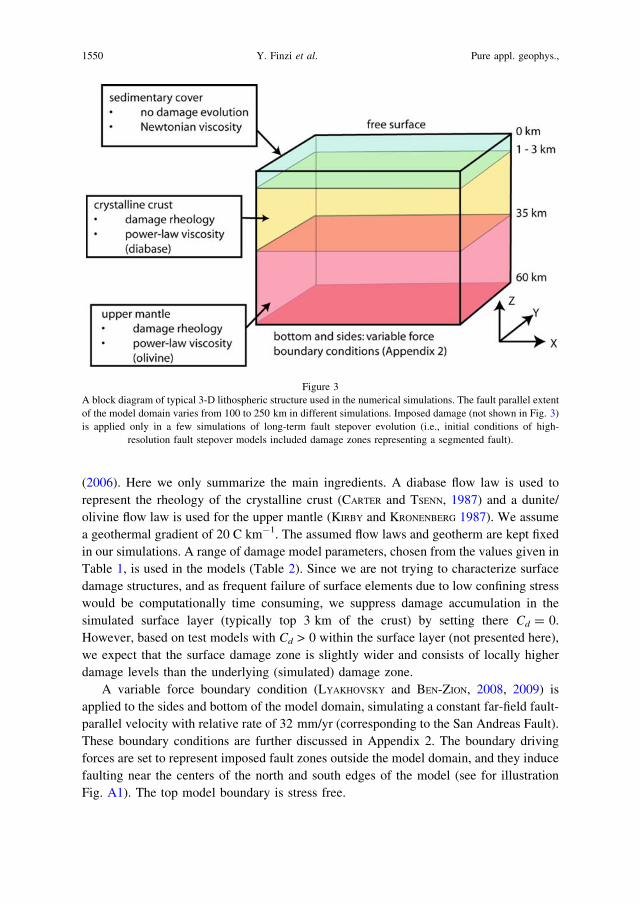
(2006). Here we only summarize the main ingredients. A diabase flow law is used to
represent the rheology of the crystalline crust (CARTER and TSENN, 1987) and a dunite/
olivine flow law is used for the upper mantle (KIRBY and KRONENBERG 1987). We assume
a geothermal gradient of 20 C km-1. The assumed flow laws and geotherm are kept fixed
in our simulations. A range of damage model parameters, chosen from the values given in
Table 1, is used in the models (Table 2). Since we are not trying to characterize surface
damage structures, and as frequent failure of surface elements due to low confining stress
would be computationally time consuming, we suppress damage accumulation in the
simulated surface layer (typically top 3 km of the crust) by setting there Cd = 0.
However, based on test models with Cd > 0 within the surface layer (not presented here),
we expect that the surface damage zone is slightly wider and consists of locally higher
damage levels than the underlying (simulated) damage zone.
A variable force boundary condition (LYAKHOVSKY and BEN-ZION, 2008, 2009) is
applied to the sides and bottom of the model domain, simulating a constant far-field fault-
parallel velocity with relative rate of 32 mm/yr (corresponding to the San Andreas Fault).
These boundary conditions are further discussed in Appendix 2. The boundary driving
forces are set to represent imposed fault zones outside the model domain, and they induce
faulting near the centers of the north and south edges of the model (see for illustration
Fig. A1). The top model boundary is stress free.
Figure 3
A block diagram of typical 3-D lithospheric structure used in the numerical simulations. The fault parallel extent
of the model domain varies from 100 to 250 km in different simulations. Imposed damage (not shown in Fig. 3)
is applied only in a few simulations of long-term fault stepover evolution (i.e., initial conditions of high-
resolution fault stepover models included damage zones representing a segmented fault).
1550 Y. Finzi et al. Pure appl. geophys.,

5.2. Model Output: Examples and Interpretation
The model outputs include the level of damage a and strain e. We calculate surface
velocities, rigidity l and other related quantities from these variables. Since a, e and l are
computed throughout the model domain, both plan views (including depth slices) and
cross-sectional views of these parameters may be plotted at any time step. Figures 4 and
5 show examples of model outputs, and illustrate features which correspond to observed
geological structures such as fault segments, stepovers, and flower structures.
Contiguous sets of elements that fail repeatedly, resulting in a higher level of a (and a
lower l) than their surroundings, are interpreted as fault segments (Figs. 4, 5). Because of
their relative weakness, these fault segments are also the centers of high velocity gradients
Table 2
Model parameters used in our fault evolution study (omitting models repeated with near-identical parameters)
Model name Grid
spacing (km)
Healing
C1 (s-1)
Healing
C2
Dynamic
weakening sr
Seismic
ratio vInitial damage
heterogeneity
Initial sr
heterogeneity
NB_0 3.2 6.0E-11 0.07 1.0E ? 4 80% 0% 30%
NB_2 3.2 1.0E-13 0.02 1.0E ? 4 80% 0% 30%
NB_6 2.2 1.0E-13 0.02 5.0E ? 3 61% 0% 30%
NB_7 2.2 1.0E-13 0.02 5.0E ? 3 99% 0% 30%
Nb_1_lap 3.2 1.0E-13 0.02 1.0E ? 4 80% 0% 30%
Nb_3_lap 3 1.0E-13 0.02 1.0E ? 4 80% 0% 30%
Nb_5_lap 2.2 1.0E-13 0.02 1.0E ? 4 80% 0% 30%
Nb_7_lap 2.2 1.0E-13 0.02 3.0E ? 3 67% 0% 30%
Nb_8_lap 2.2 1.0E-13 0.02 3.0E ? 3 97% 0% 30%
Nb_9_lap 2.2 1.0E-13 0.02 5.0E ? 3 57% 0% 30%
Nb_11_lap 2.2 5.0E-11 0.05 4.0E ? 3 61% 0% 30%
Nb_geos_4 1.6 1.0E-13 0.02 1.0E ? 4 80% 30% 30%
Nb_geos_6 1.6 1.0E-13 0.02 2.0E ? 3 67% 30% 30%
Prop_2 3.2 1.0E-13 0.03 8.0E ? 3 80% 25% 30%
Prop_7 3.2 2.0E-09 0.15 1.0E ? 4 80% 15% 30%
Prop_9 3.2 6.0E-11 0.07 1.0E ? 4 80% 25% 30%
Prop_lap_2 3.2 1.0E-13 0.03 9.0E ? 3 80% 25% 30%
Prop_lap_6 3.2 1.0E-13 0.03 1.0E ? 4 80% 10% 30%
Prop_run_a9 2.2 1.0E-12 0.03 5.0E ? 3 61% 10% 30%
Prop_geos_5 2.2 1.0E-12 0.03 7.0E ? 3 72% 10% 30%
Prop_lin_4.5 4.5 1.0E-13 0.03 1.0E ? 4 80% 0% 30%
Stepover_8 0.25 1.0E-10 0.03 3.0E ? 1 40% 100% 30%
Stepover_9 0.25 1.0E-10 0.03 1.0E ? 2 40% 100% 30%
Stepover_10 0.25 1.0E-10 0.025 4.0E ? 2 40% 50% 30%
Stepover_11 0.25 1.0E-10 0.025 6.0E ? 2 40% 100% 30%
long-term_1 0.6 1.0E-12 0.03 6.0E ? 4 80% 25% 30%
long-term_5 0.6 1.0E-20 0.02 6.0E ? 4 80% 25% 30%
Other material parameters were set to represent crustal materials and were not varied in our models (these
parameters include: n0 = -0.8. Cd = 5 s-1; Sedimentary layer: density q = 2.4�10-3 Kg m-3, Newtonian
viscosity g = 1019 Pa S; Crustal rheology: Young’s modulus E = 80 GPa, Poisson’s ratio m = 0.3, q = 2.8�10-3
Kg m-3, viscosity flow law coefficients: A = 6.3�10-20 Pa-n S-1, n = 3.05, Q = 276 Kj mol-1; Mantle
rheology: E = 150 GPa, m = 0.3, q = 3.3�10-3 Kg m-3, A = 7.0�10-14 Pa-n S-1, n = 3.0, Q = 520 Kj mol-1)
Vol. 166, 2009 Damage Rheology Models of Strike-slip Fault Zone Evolution 1551

and high strain rate (Figs. 4, 5). Cross-sectional profiles through modeled fault segments
(Fig. 5) display ‘‘flower structures’’ with depth, which comprise localized damage along
the active fault core with a superimposed, broader zone of distributed damage in the top
3–10 kilometers of the crust (Figs. 4, 5). Based on these observations, we define two
damage subzones that are distinct in their evolution patterns, damage level, and spatial
fault-segments
stepover-zone
Z = 3 km Z = 5-10 km Z = 10-15 km
Z = 10-15 km Z = 5-10 kmZ = 3 km
0 100 0 100
X (km)
Damage, Rigidity (GPa)
0.7 10
0.5 16
0.3 22
Strain (Sd)
0.018
0.012
0.006
200
100
0
200
100
0
Y (
km)
Figure 4
Plan views of a segmented strike slip fault at several depths, showing damage level (a), rigidity (l) and the
second invariant of the deviatoric strain, Sd (Sd = sqrt(eij �eij) where eij = eij-dij ekk /3 and dij is the Kronecker
delta). Shallow (z = 3 km) damage (top left panel) is distributed within the stepover and around the fault
segments. At depth (z = 5–10 km) damage is highly localized along the fault segments and is distributed within
the fault stepover. At the lower part of the seismogenic crust, damage within stepover may persist long after the
localized damage along fault segments heals.
1552 Y. Finzi et al. Pure appl. geophys.,

distribution: (1) Localized Active-Fault (LAF) damage which represents the highly
localized damage along the active fault cores (Figs. 4, 5). The LAF damage is
coseismically very high along the primary slip zone, but it rapidly heals at depth. (2)
Distributed Off-Fault (DOF) damage which is sustained cumulative damage resulting
from many earthquakes. The DOF damage develops during the early stages of
Figure 5
Cross-sectional views of a typical ‘‘flower type’’ damage zone along a strike-slip fault, displaying damage levels
and rigidity (A and B), and fault-parallel velocity (C). Annotations in (A) show the dimensions of the Localized
Active Fault (LAF) damage (black lines) and Distributed Off Fault (DOF) damage (white lines) as they were
measured in this study. Dashed black and white lines show the location of the LAF and DOF damage zones
(respectively) in the smoothed contour plots (B, C).
Vol. 166, 2009 Damage Rheology Models of Strike-slip Fault Zone Evolution 1553

fault-system evolution, and thereafter its spatial extent is stable and the degree of damage
within it evolves locally (Figs. 4, 5, 6). Descriptive analyses of damage structures along
simulated strike-slip fault segments are given in Section 5.3.
Plan views of the model domain show several examples of stepover zones where
segments are offset from one another (Fig. 4). Our models produce just extensional
stepovers; that is, during propagation, new offset faults form in areas where end-effects
from existing faults contribute a tensional mean normal stress. Stepovers are characteri-
zed by a wide DOF damage zone, and by high levels of damage, high strains, and low
rigidity within the stepover. Descriptive analyses of damage structures within simulated
stepover-zones are given in Section 5.4.
Before we discuss the results of our models, we need to (1) introduce observable
quantities which may be systematically measured and then used to compare between
model results, (2) define a threshold criterion for the maturity of our modeled faults to
ensure that we base our analysis only on models that were run long enough to form
mature damage zones, and (3) confirm that the model results presented here are fairly
insensitive to numerical element dimensions. This is necessary because the models shown
on Table 2 were run for different durations, and for a range of element dimensions.
To systematically describe the spatial extent of damage zones around faults we have
chosen a threshold damage level of a = 0.35 (presumably above any expected
background damage level). The four quantities used to define the extent of damage are
the widths and depths of both the LAF and DOF damage zones. Measurements of these
quantities are performed on plan-view and cross-section plots of the simulated fault zones
(without smoothing). The width of the DOF damage represents the maximal spatial extent
of the damage zone, and its depth is the average depth extent of the shallow distributed
0.00 0.05 0.10 0.15 0.20 0.25 0.30-16
-12
-8
-4
0
4
8
12
16
DZ width
DZ depth
Cumulative strike-slip offset (km)
Dam
age
zone
dim
ensi
ons
(km
)
Figure 6
DOF damage zone width and depth plotted against cumulative strike-slip offset. After an initial stage with
relatively fast damage zone growth, the DOF damage zone dimensions remain fairly constant (at offsets
exceeding 0.05 km).
1554 Y. Finzi et al. Pure appl. geophys.,
damage away from the active fault core (Fig. 5a). The width of the LAF damage
represents the maximum width of the localized damage along the fault core, and its depth
is the maximum depth extent of the damage zone (Fig. 5a). To facilitate comparison with
geodetic studies we define also the Fault Compliant Zone (FCZ) in our models as the
volume in which the average material rigidity is reduced by 50% relative to the host rock,
consistent with the compliant zones of FIALKO et al. (2002). The simulated FCZ typically
consists of the entire LAF damage and most of the DOF damage.
Strike-slip fault systems evolve over time, first becoming complex and then gradually
simplifying to a more continuous configuration with fewer fault segments (e.g., BEN-ZION
and SAMMIS, 2003 and references therein; LYAKHOVSKY and BEN-ZION, 2009). This
complicates directly comparing model runs that may have been cut off at different
evolutionary stages. Figure 6 illustrates that the width and depth of the DOF damage
initially grows rapidly, starting to stabilize after a total relative displacement of
approximately 0.05 km. This simulated stage of rapid DOF damage growth represents the
initial stage of fault growth and complexity increase after which the fault configuration
starts to stabilize and the strain localizes along the fault. Hence to analyze mature damage
zone structures we can only use fault simulations with a total displacement larger than
0.05 km.
All results displayed on subsequent plots are for models with mature damage zones in
which at least 0.05 km of displacement has accrued (corresponding to a modeled time
interval of about 1600 years).
Since brittle failure in our simulations is associated with an abrupt transition from
initial (static) to final (dynamic) stress levels, the numerical models are inherently
discrete (e.g., RICE and BEN-ZION, 1996) and some aspects of the results are expected to be
grid-dependent. An analysis of our entire set of damage zone simulations indicates that
while the spatial extent of damage is somewhat grid-size dependent, the average level of
damage within voluminous damage zones (e.g., stepover zones) is probably not grid-size
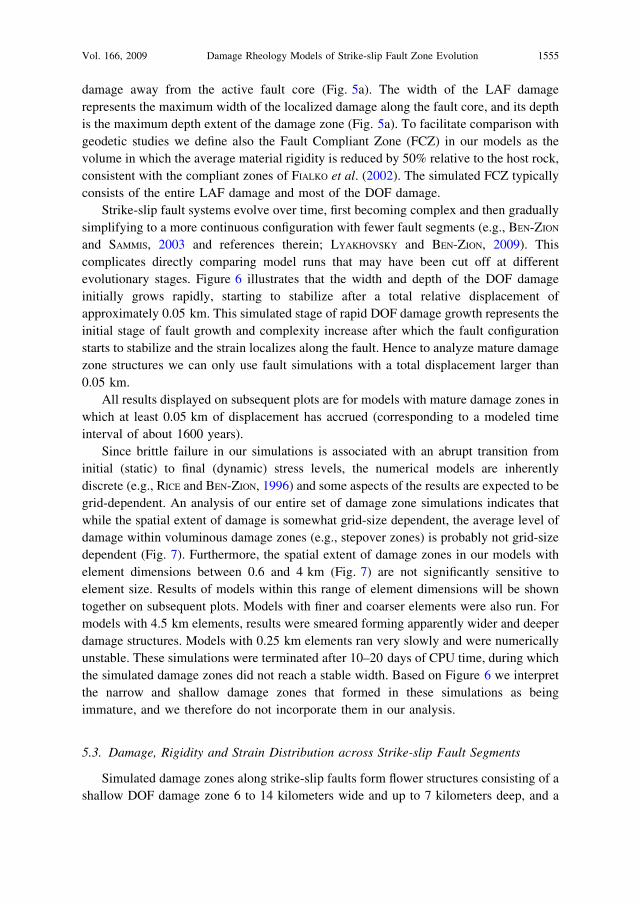
dependent (Fig. 7). Furthermore, the spatial extent of damage zones in our models with
element dimensions between 0.6 and 4 km (Fig. 7) are not significantly sensitive to
element size. Results of models within this range of element dimensions will be shown
together on subsequent plots. Models with finer and coarser elements were also run. For
models with 4.5 km elements, results were smeared forming apparently wider and deeper
damage structures. Models with 0.25 km elements ran very slowly and were numerically
unstable. These simulations were terminated after 10–20 days of CPU time, during which
the simulated damage zones did not reach a stable width. Based on Figure 6 we interpret
the narrow and shallow damage zones that formed in these simulations as being
immature, and we therefore do not incorporate them in our analysis.
5.3. Damage, Rigidity and Strain Distribution across Strike-slip Fault Segments
Simulated damage zones along strike-slip faults form flower structures consisting of a
shallow DOF damage zone 6 to 14 kilometers wide and up to 7 kilometers deep, and a
Vol. 166, 2009 Damage Rheology Models of Strike-slip Fault Zone Evolution 1555
more intense LAF damage zone around the fault core. The DOF damage is the result of
cumulative damage from past earthquakes (Figs. 5, 6). The LAF damage is narrow and
steeply dipping, and it may extend to the bottom of the seismogenic zone (Figs. 4, 5)
coseismically and in the early postseismic interval. The deeper parts of the LAF damage
zone are only one model element wide and appear discontinuous (Figs. 4, 5). This
probably indicates a tendency to evolve to a much narrower extent than our model
element dimensions, in agreement with observed extreme localization of active slip zones
(e.g., CHESTER and CHESTER, 1998; SIBSON, 2003; ROCKWELL and BEN-ZION, 2007). The
highest damage levels along fault segments are usually found at the shallowest part of the
LAF damage zone. The parts of the LAF damage in the shallow crust that are more than
one element thick may correspond to the observed distributed DZ along the surface trace
of large strike-slip faults.
The flower structure in our simulations is a robust feature that shows little dependence
on damage parameters (C1, C2, v, sr), and limited sensitivity to the presence of various
0.5 1 1.5 2 2.5 3 3.5-8
0
8
16
Element size (km)
DZ
dim
ensi
ons
(km
)
0.5 1 1.5 2 2.5 3 3.50.4
0.6
0.8 Z = 5-6 km
Z = 10-12 km
Element size (km)
(a)
(b)
DOF damage width
DOF damage depth
Dam
age
leve
l (α )
Figure 7
Sensitivity of model results to element size. (a) For models with element dimensions between 0.6 and 3.2 km,
DOF damage zone dimensions are fairly insensitive to grid size. (b) Damage levels in fault stepovers at depth of
5–6 km and 10–12 km. These damage levels are insensitive to element size within the range we model. The
scatter in results on both panels is due to different values of damage model parameters and variations in
cumulative slip.
1556 Y. Finzi et al. Pure appl. geophys.,

degrees of material heterogeneities (Table 2). The insensitivity of the DOF damage to
healing parameters (Fig. 8) may imply that the shallow crust is readily damaged and it
experiences limited healing regardless of material parameters. This apparent insensitivity
to the healing parameters may also indicate that the current range of modeled healing
parameters is insufficient and further analysis is needed to understand the role of healing
in damage zone evolution. The deeper sections of the LAF damage are more sensitive to
the healing rate parameters (Fig. 9a). This reflects the fact that healing processes are
sensitive functions of the normal stress. Our results indicate that the depth extent of the
LAF damage (after the early postseismic interval) ranges from the entire seismogenic
zone for materials with extremely slow healing (C2 > 0.05; sh > 55 yrs; Fig. 9b) to a few
-14.0 -13.0 -12.0 -11.0 -10.0 -9.0 -8.0-8
0
8
16
DOF width
DOF depth
DZ
dim
ensi
ons
(km
)
0.50 0.60 0.70 0.80 0.90 1.00-8
0
8
16
DOF width
DOF depth
DZ
dim
ensi
ons
(km
)
0 0.02 0.04 0.06 0.08-8
0
8
16
DOF width
DOF depthD
Z d
imen
sion
s (k
m)
C2 healing parameter
log(C1) healing parameter
seismic coupling ratio χ
Figure 8
Width and depth of the distributed part of the damage zone (DOF damage) for models with a wide range of
material parameters. DOF damage zone dimensions are insensitive to the healing parameters and the seismic
coupling ratio.
Vol. 166, 2009 Damage Rheology Models of Strike-slip Fault Zone Evolution 1557

kilometers for the faster healing materials (C2 < 0.03; sh > 25 yrs; Fig. 9c). Model
realizations with healing parameters representative of natural processes (see Section 4)
indicate that during most of the seismic cycle the contiguous well-developed LAF
damage is limited to the top section of the crust (e.g., Figs. 9c, 10a). These results are
consistent with numerical simulations of plastic strain generation during dynamic rupture
(BEN-ZION and SHI, 2005), and analyses of large seismic data sets recorded around active
faults (e.g., BEN-ZION et al., 2003; PENG et al., 2003; KORNEEV et al., 2003; COCHRAN et al.,
2003; LEWIS et al., 2005; GRAYMER et al., 2007).
The elastic strength of simulated fault zones is reduced as the damage level increases.
The relation between rigidity and damage level (equation (2)) implies that the effective
rigidity is primarily a function of a. However, the effective rigidity is further reduced near
the surface and along the fault core because the strain invariants ratio n is higher at these
0
-10
-20
-30
0 0.02 0.04 0.06 0.08-24
-20
-16
-12
-8
-4
0
4
LAF width
LAF depthD
Z d
imen
sion
s (k
m)
(a)
(b) (c)
C2 values representative
of natural
C2 healing parameter
Dep
th (
km)
30 40 50 40 50 60
0α 0.80.70.60.5
0
-10
-20
-30
X (km) X (km)
Figure 9
(a) Width and depth of the LAF damage zone as a function of healing parameter C2 (width measured at 5–8 km
depth, just below the DOF damage). The hatched region indicates admissible values of C2 for modeling
natural processes (see section 4). (b, c) Examples of deep and shallow fault core damage zones in models with
long (b) and short (c) healing time scales. The geometry of these zones is stable through most of the interseismic
interval.
1558 Y. Finzi et al. Pure appl. geophys.,
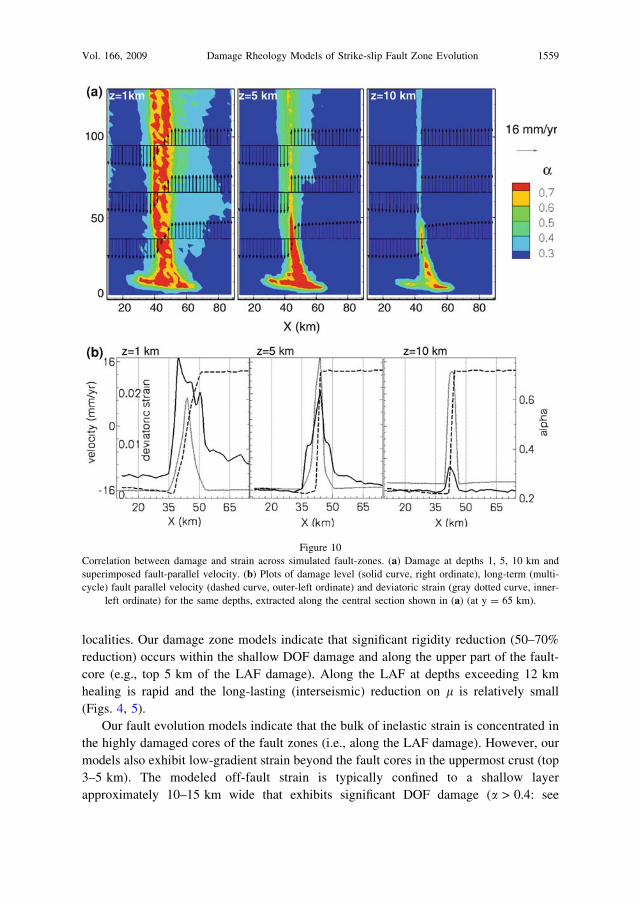
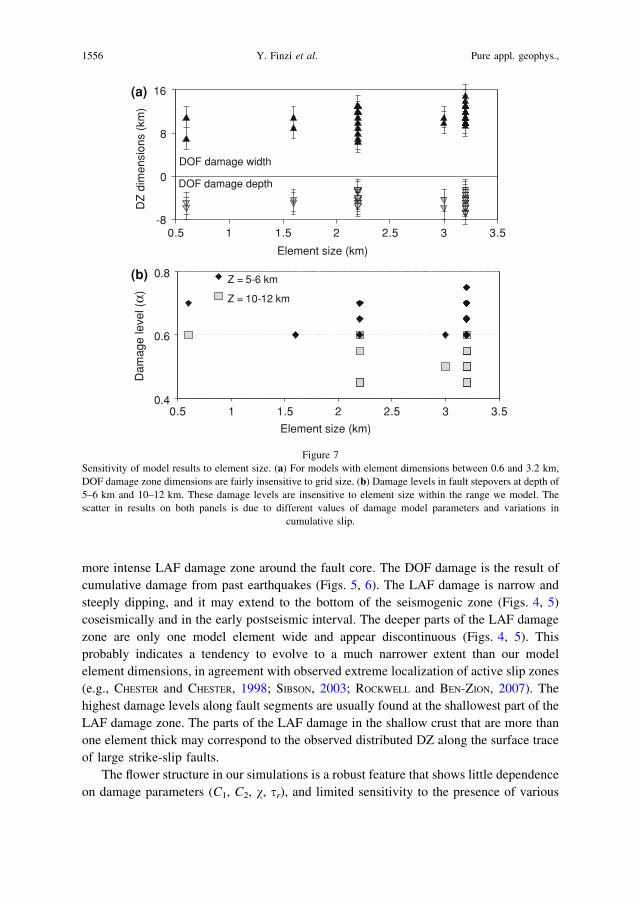
localities. Our damage zone models indicate that significant rigidity reduction (50–70%
reduction) occurs within the shallow DOF damage and along the upper part of the fault-
core (e.g., top 5 km of the LAF damage). Along the LAF at depths exceeding 12 km
healing is rapid and the long-lasting (interseismic) reduction on l is relatively small
(Figs. 4, 5).
Our fault evolution models indicate that the bulk of inelastic strain is concentrated in
the highly damaged cores of the fault zones (i.e., along the LAF damage). However, our
models also exhibit low-gradient strain beyond the fault cores in the uppermost crust (top
3–5 km). The modeled off-fault strain is typically confined to a shallow layer
approximately 10–15 km wide that exhibits significant DOF damage (a > 0.4: see
Figure 10
Correlation between damage and strain across simulated fault-zones. (a) Damage at depths 1, 5, 10 km and
superimposed fault-parallel velocity. (b) Plots of damage level (solid curve, right ordinate), long-term (multi-
cycle) fault parallel velocity (dashed curve, outer-left ordinate) and deviatoric strain (gray dotted curve, inner-
left ordinate) for the same depths, extracted along the central section shown in (a) (at y = 65 km).
Vol. 166, 2009 Damage Rheology Models of Strike-slip Fault Zone Evolution 1559

Fig. 10). Where the shallow DOF damage is of lower intensity (a < 0.4) our models do
not display significant strain, suggesting that relatively thin layers of slightly damaged
rock may not modify regional surface deformation patterns and may not be easily
detectable by means of geodesy. At distances greater than 10 km from fully formed fault-
zones, the total deviatoric strain is negligible and the long-term average strain rate is
uniform, indicating that the undamaged upper crust behaves kinematically as a rigid
block. The correlation between damage and strain distribution confirms recent
interpretations of observed surface deformation patterns above fault-related compliant
zones (e.g., FIALKO et al., 2002; FIALKO, 2004). This correlation indicates that geodetically
observed compliant zones are related to relatively high damage levels (a > 0.4), and
suggests that parts of the damage zones (a < 0.4) may not be geodetically observable.
5.4. Fault Stepovers
While major fault segments display a positive feedback of strain-weakening and
localization along highly damaged fault cores, persisting geometrical features such as
fault offsets, kinks, and bends, may display strain-hardening and produce local
complexity and new fractures at different scales (BEN-ZION and SAMMIS, 2003). In our
models, segmented fault zones display continuous distributed seismic and aseismic
deformation within fault stepover zones. This consists of aseismic strain and small
earthquakes; however, moderate earthquakes (ML < 5.5) also occur occasionally. While
much of the damage along fault segments heals during the interseismic stage, the damage
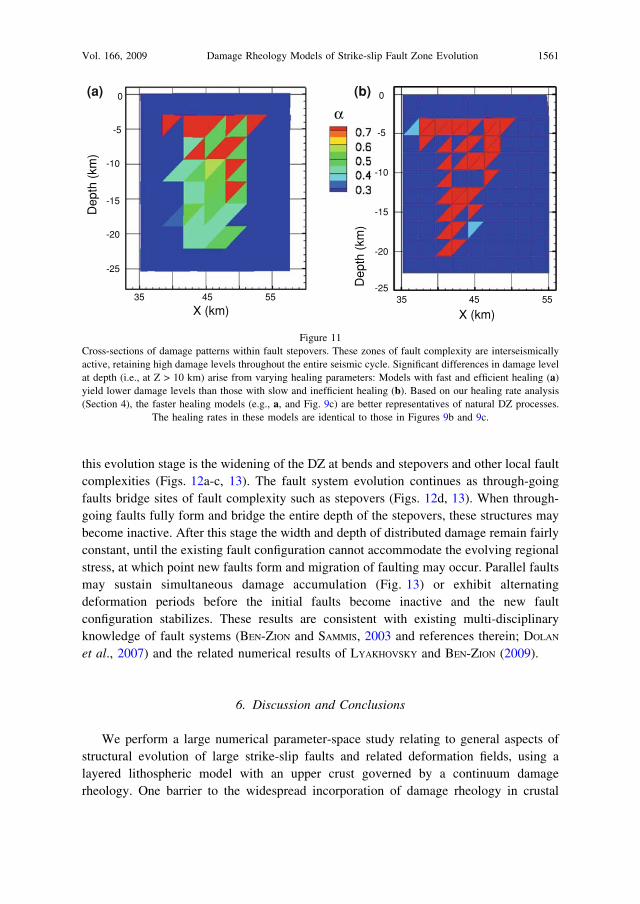
level at stepovers remains persistently high (Fig. 11a, compare with Fig. 9c). Fault
stepovers and segment termination zones undergo significant damage accumulation
during the interseismic stage, typically displaying average a between 0.5 and 0.75
(measured at a depth of 5–10 km), depending on the healing rate parameters. The damage
within stepovers extends to greater depths than along fault segments, and in many
simulations it reaches the bottom of the seismogenic zone (Figs. 11, 4). Models with
realistic healing parameters typically exhibit significant damage (a > 0.5) to depths of
10–15 km (Fig. 11). An important implication of the permanently elevated damage level
within fault stepovers is that these regions of reduced l (Fig. 4) affect rupture
propagation and strong ground motion patterns.
5.5. Fault System Complexity as a Function of Time
According to our results, the DOF damage dimensions depend on the maturity of the
fault system. Simulations with a wide range of material properties and numerical
characteristics (e.g., element dimensions and boundary conditions) indicate that the
damage zone grows until the fault accumulates an offset of about 0.05–0.1 km (Fig. 6).
During this early evolutionary stage, the fault system’s complexity increases as additional
segments nucleate and propagate, forming new damage zones. This stage culminates as
deformation localizes along narrow slip zones. As mentioned, an important exception to
1560 Y. Finzi et al. Pure appl. geophys.,
this evolution stage is the widening of the DZ at bends and stepovers and other local fault
complexities (Figs. 12a-c, 13). The fault system evolution continues as through-going
faults bridge sites of fault complexity such as stepovers (Figs. 12d, 13). When through-
going faults fully form and bridge the entire depth of the stepovers, these structures may
become inactive. After this stage the width and depth of distributed damage remain fairly
constant, until the existing fault configuration cannot accommodate the evolving regional
stress, at which point new faults form and migration of faulting may occur. Parallel faults
may sustain simultaneous damage accumulation (Fig. 13) or exhibit alternating
deformation periods before the initial faults become inactive and the new fault
configuration stabilizes. These results are consistent with existing multi-disciplinary
knowledge of fault systems (BEN-ZION and SAMMIS, 2003 and references therein; DOLAN
et al., 2007) and the related numerical results of LYAKHOVSKY and BEN-ZION (2009).
6. Discussion and Conclusions
We perform a large numerical parameter-space study relating to general aspects of
structural evolution of large strike-slip faults and related deformation fields, using a
layered lithospheric model with an upper crust governed by a continuum damage
rheology. One barrier to the widespread incorporation of damage rheology in crustal
0
-5
-10
-15
-20
-25
Dep
th (
km)
Dep
th (
km)
35 45 55
0
-5
-10
-15
-20
-2535 45 55
α
X (km) X (km)
(a) (b)
Figure 11
Cross-sections of damage patterns within fault stepovers. These zones of fault complexity are interseismically
active, retaining high damage levels throughout the entire seismic cycle. Significant differences in damage level
at depth (i.e., at Z > 10 km) arise from varying healing parameters: Models with fast and efficient healing (a)
yield lower damage levels than those with slow and inefficient healing (b). Based on our healing rate analysis
(Section 4), the faster healing models (e.g., a, and Fig. 9c) are better representatives of natural DZ processes.
The healing rates in these models are identical to those in Figures 9b and 9c.
Vol. 166, 2009 Damage Rheology Models of Strike-slip Fault Zone Evolution 1561

deformation models has been the numerous damage model parameters, whose
relationships with observable phenomena are sometimes unclear. Considerable work in
recent years has gone into relating these parameters to results of brittle deformation
experiments and thermodynamic theory (e.g., LYAKHOVSKY et al., 2001, 2005; HAMIEL
et al., 2004, 2006). We take this further by using the observed shear modulus reduction
in damaged fault zones to constrain the ranges of likely values for healing parameters
C1 and C2. We find that admissible values of C1 and C2 are 10-24 to 10-10 s-1 and 0.015
Figure 12
Fault stepover evolutionary stages displayed in four snap-shots of damage levels around a stepover zone (at
3 km depth). (a) Segmented fault. (b, c) Extensive damage accumulation within the stepover zone. In (c) distinct
lateral (subsidiary) ‘‘faults’’ (regions of high damage) link between the two fault segments. (d) Formation of a
through-going fault through the entire stepover zone. These results are from high-resolution, small-domain
models focusing on stepovers.
1562 Y. Finzi et al. Pure appl. geophys.,

to 0.035, respectively (Fig. 2). This range is significantly reduced relative to previous
studies (e.g., LYAKHOVSKY et al., 2005).
Our models with reasonable damage and viscoelastic parameters yield general
deformation patterns that are comparable to those seen in natural strike-slip fault systems.
Flower structures, stepovers, localized strain around fault segments and permanent
damage in the shallow upper crust and within stepovers are all reproduced. Due to model
simplifications (e.g., no damage accumulation in the surface layer) and element size
limitations, our models cannot conclusively predict the details of surface damage
patterns, the width of the fault core, or the geometry of small faults and fractures within
flower structures and stepover regions. Our simulations would probably yield narrower
damage zones if we incorporated depth-dependent damage-rate parameters as suggested
by LYAKHOVSKY et al. (2005).
Figure 13
Fault evolution snap-shots showing damage levels at 10 km depth. The originally segmented fault (left panel;
notice large stepovers) is smooth with time (right, mature fault 1; note that some of the apparent small stepovers
are actually numerical artifacts formed because the fault is not parallel to the grid). An additional fault formed
after approximately 5000 yrs to better accommodate regional stress (right, fault 2). Annotations of times in the
images indicate the age of each fault in the simulation. Finely dashed line long fault 1 in both panels indicates its
original segmented outline (as shown in left panel).
Vol. 166, 2009 Damage Rheology Models of Strike-slip Fault Zone Evolution 1563

The fault stepover zones in our models exhibit extensive damage and elasticity
degradation sustained during many earthquake cycles. The simulated tensional stepovers
show damage patterns consistent with intense tensile fracturing and dilation, and
therefore are expected to exhibit long-lived enhanced permeability. Such damage patterns
are consistent with recent structural evolution models for dilational stepovers (DE PAOLA
et al., 2007), and with mineral exploration studies that relate hydrothermal ore deposits to
long-lasting extensive damage and increased permeability within fault stepovers
(MICKLETHWAITE and COX, 2004; SHELDON and MICKLETHWAITE, 2007). The permanent
damage zones our models predict should be detectable with detailed seismic and geodetic
imaging studies.
An important implication of the predicted damage zones at stepovers concerns the
interaction between damaged material and propagating earthquakes. During the
interseismic stage, weakened stepover zones experience continuous earthquakes and
proportionally more inelastic strain than the surrounding crust. This reduces the
interseismic stress accumulation in the stepover region, which could aid earthquake
rupture arrest. Various studies address rupture propagation across stepovers using quasi-
static models (e.g., SEGALL and POLLARD, 1980), dynamic models (HARRIS and DAY, 1999;
HaRRIS et al., 1991) and field observations (e.g., WESNOUSKY, 2006). Such studies show
that it is easier for a rupture to jump across dilational stepovers (such as those our model
produces) than compressional stepovers, because dilational normal stress brings nearby
faults closer to failure. SIBSON (1985) and HAMIEL et al. (2005) argue, however, that
during an earthquake, the normal stress change in a dilational stepover could lead to a
sudden opening of fluid-filled cracks, reducing pore pressure and causing material
hardening. An analogous effect is also seen in some of the models of HARRIS and DAY
(1993), where fluid within a dilational stepover inhibits the ability of rupture to propagate
across it. As long-term damage accumulation and coseismic pore pressure decrease have
competing effects on the elastic strength of a stepover, further study will be required to
clarify the ramifications of damage for rupture propagation and arrest. We also note that
the extensive rock damage near stepovers should produce amplified ground motion, and
hence higher seismic hazard, at those regions.
While the presented model simulations have several limitations, the following
features appear to be robust:
• Distributed fault zone damage develops early in the evolution of a fault system
(approaching steady-state damage zone dimensions after .05 km of total slip in our
models).
• The strain generally localizes to narrow segments which are wider near the surface than
at depth (representing flower structures).
• Along fault segments, the damage heals postseismically at depths exceeding 5–10 km
and is permanent at shallower depths.
• The off-fault strain distribution correlates with the permanent shallow damage
exhibited along fault-zones.
1564 Y. Finzi et al. Pure appl. geophys.,

• Stepover regions may be permanently damaged to mid-crustal depths, and such
damage zones should be detectable with focused seismic and geodetic studies.
Our numerical simulations of fault zone evolution suggest that the overall aspects of
fault zone deformation along large faults at seismogenic depths can be modeled
effectively over time intervals of several large earthquake cycles by a collection of
narrow segmented zones or planar surfaces (i.e., without incorporating off-fault damage
evolution). However, the evolving fault zone structures and off-fault damage play
important roles in the evolution of geometrical properties of fault sections, the formation
of fault systems, and in the deformation patterns along plate boundaries. Although
regional scale static stress transfer in the crust is probably only moderately affected by the
presence of shallow weakened damage zones along fault segments, long-lived volumes of
extensively damaged material within fault stepovers and near other persistent geometrical
irregularities can significantly affect earthquake propagation, strong ground motion,
(locally) crustal stress state and surface deformation patterns.
Acknowledgments
We thank Yann Klinger and Harsha Bhat for useful comments that enhanced the
readability of the paper. The study was supported by the Southern California Earthquake
Center (based on NSF Cooperative Agreement EAR-0106924 and USGS Cooperative
Agreement 02HQAG0008) and the US–Israel Binational Science Foundation, Jerusalem
Israel (2004046).
Appendix 1: Numerical Procedure
The numerical code we use for our modeling utilizes the Fast Lagrangian Analysis of
Continua (FLAC) method (e.g., CUNDALL and BOARD, 1988; POLIAKOV et al., 1993). This
formulation is explicit in time and it continuously updates the shape functions of
tetrahedral elements allowing large deformations to be simulated. The general procedure
involves solving the equations of motion to determine nodal velocities and to calculate the
elastic component of the element strains. The total strain tensor is calculated by summing
the elastic strain component, a viscous strain component and a component representing the
damage-related inelastic strain eijv . HAMIEL et al. (2004) introduced the gradual inelastic
strain, eijv , whose accumulation rate is proportional to the rate of damage accumulation:
devij
dt¼
Cvdadt
sij fordadt
[ 0
0 fordadt� 0
8
>
<
>
:
ðA1Þ
Vol. 166, 2009 Damage Rheology Models of Strike-slip Fault Zone Evolution 1565
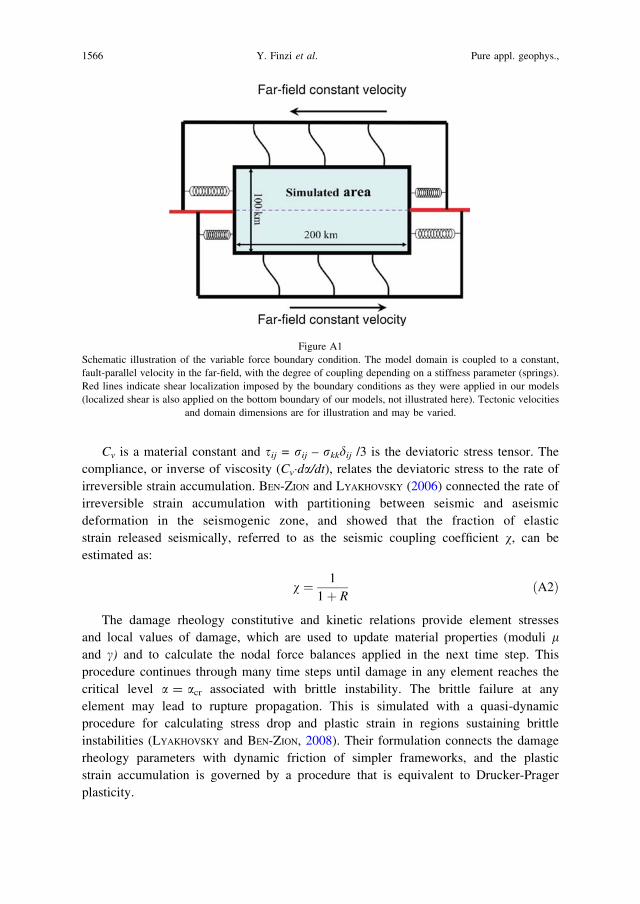
Cv is a material constant and sij = rij – rkkdij /3 is the deviatoric stress tensor. The
compliance, or inverse of viscosity (Cv�da/dt), relates the deviatoric stress to the rate of
irreversible strain accumulation. BEN-ZION and LYAKHOVSKY (2006) connected the rate of
irreversible strain accumulation with partitioning between seismic and aseismic
deformation in the seismogenic zone, and showed that the fraction of elastic
strain released seismically, referred to as the seismic coupling coefficient v, can be
estimated as:
v ¼ 1
1þ RðA2Þ
The damage rheology constitutive and kinetic relations provide element stresses
and local values of damage, which are used to update material properties (moduli land c) and to calculate the nodal force balances applied in the next time step. This
procedure continues through many time steps until damage in any element reaches the
critical level a = acr associated with brittle instability. The brittle failure at any
element may lead to rupture propagation. This is simulated with a quasi-dynamic
procedure for calculating stress drop and plastic strain in regions sustaining brittle
instabilities (LYAKHOVSKY and BEN-ZION, 2008). Their formulation connects the damage
rheology parameters with dynamic friction of simpler frameworks, and the plastic
strain accumulation is governed by a procedure that is equivalent to Drucker-Prager
plasticity.
Figure A1
Schematic illustration of the variable force boundary condition. The model domain is coupled to a constant,
fault-parallel velocity in the far-field, with the degree of coupling depending on a stiffness parameter (springs).
Red lines indicate shear localization imposed by the boundary conditions as they were applied in our models
(localized shear is also applied on the bottom boundary of our models, not illustrated here). Tectonic velocities
and domain dimensions are for illustration and may be varied.
1566 Y. Finzi et al. Pure appl. geophys.,

Appendix 2: Boundary Conditions
Numerical models of evolving fault systems typically incorporate either constant
velocity or constant stress boundary conditions. LYAKHOVSKY and BEN-ZION (2008) show
that these boundary conditions may generate very different velocity distributions during
the interseismic period, and they conclude that neither of these boundary conditions is
appropriate for simulations of fault system evolution over many earthquake cycles. To
perform such simulations, LYAKHOVSKY and BEN-ZION (2008) introduced a modified
boundary condition in which forces are proportional to a stiffness of virtual springs
multiplied by the mismatch (slip-deficit) between the far-field plate motion and
displacement of the boundary nodes (Fig. A1). Unlike the constant-velocity or constant-
stress boundary conditions, this boundary condition accounts for stress accumulation and
strain-rate decrease during the interseismic periods, as well as abrupt stress reduction at
the model boundary during seismic events. The variable force condition realistically
adjusts the forces applied on the model domain boundaries according to the evolution of
elastic properties, stress state, and seismic events within the simulated domain
(LYAKHOVSKY and BEN-ZION, 2008).
We constructed a series of test models to demonstrate the performance of this
boundary condition and to study the spring stiffness parameter. Using these models we
compared postseismic deformation in large domain models with fixed fault parallel
boundaries, to results obtained from narrow-domain models with the variable force
boundary condition. In the large models the domain width was set to be twenty times
larger than the prescribed rupture depth (so that minor deformation is expected to occur
near the fault parallel boundaries), and the fault-parallel boundaries were fixed. In the
narrow-domain models, the fault perpendicular width was 140 km (i.e., fault parallel
Fau
lt pa
ralle
l vel
ocity
(m
m/y
r)
50 150 250X (km)
1 yr2 yr
5 yr
18 yr
20
0
-20
Figure A2
Surface velocities from our damage-disabled model (points) compared to a finite element solution of viscoelastic
postseismic deformation (solid lines). The various lines and points represent velocities after 1 year (red), 2 years
(black), 5 years (purple) and 18 years (green) of postseismic deformation. Maxwell time Tm¼ 110 years, other
model detail are given in Appendix 2.
Vol. 166, 2009 Damage Rheology Models of Strike-slip Fault Zone Evolution 1567

boundaries were 70 km from the fault). In both the narrow- and wide- domain models the
rheology was set to be viscoelastic without damage evolution, and with realistic material
properties (l = 30 GPa, m = 0.25, elastic plate thickness 20 km, and Newtonian
substrate viscosity of 1019 Pa s). The analysis of stiffness values and their effect on
boundary forces and velocities shows that using a very large spring stiffness
(> 5�106 MPa) results in a constant velocity on the boundary nodes. Free boundary
conditions are approximated with the use of very low (< 5�102 MPa) stiffness values.
Using intermediate stiffness values, the force applied on boundary nodes varies as a
response to deformation processes within the model domain, except for rare instances in
which a constant force is applied on boundary nodes that experience a very large
mismatch between the plate motion and the boundary displacement. To best represent
constant velocities far from the fault zone (i.e., at the boundaries of the very large
models) the spring stiffness in the narrow-domain models was set to 5�103 to 104 MPa.
This is similar to the value used in the models presented in this paper (104 MPa).
Appendix 3: Code Verification: Viscoelastic Component
To verify that the numerical procedure properly models viscoelastic deformation, we
simulated postseismic surface deformation following a kinematically imposed earth-
quake, using a model in which no damage evolution was allowed. We compared our
results with those from a viscoelastic finite-element model (GAEA, SAUCIER and
HUMPHREYS, 1992). This extends previous comparisons which yielded interseismic
velocities comparable to analytic solutions (LYAKHOVSKY et al., 2001).
The two models were set up with identical domain size (300 9 250 9 100 km), fault
depth (20 km), coseismic stress drop (20 MPa), lithospheric structure, and material
properties (l = 30 GPa, m = 0.25, elastic plate thickness 20 km, and Newtonian
substrate viscosity of 1019 Pa s). In both models the fault-parallel side and bottom
boundaries were fixed, and the top boundary was stress-free. To simulate stress-free fault-
perpendicular end boundaries our damage-disabled model incorporated the variable force
boundary condition with a low stiffness, which is approximately equivalent to the stress-
free boundary condition used in the FEM. Figure A2 shows surface velocities calculated
with both models, for several time epochs after the modeled earthquake (1, 2, 5, and
18 years). The minor differences between the models are due in part to applying the
variable force boundary condition with spring stiffness slightly too high (103 MPa) and
therefore not simulating completely stress-free end boundaries. This slightly suppressed
the velocities away from the fault.
REFERENCES
AGNON, A. and LYAKHOVSKY, V. Damage distribution and localization during dyke intrusion. In (G. Baer and
A. Heimann, eds), The Physics and Chemistry of Dykes (Rotterdam, Balkema, 1995) pp. 65–78.
1568 Y. Finzi et al. Pure appl. geophys.,
AMBRASEYS, N. N. (1970), Some characteristic features of the North Anatolian fault zone, Tectonophysics 9,
143–165.
AMPUERO, J.-P. and BEN-ZION, Y. (2008), Cracks, pulses and macroscopic asymmetry of dynamic rupture on a
bimaterial interface with velocity-weakening friction, Geophys. J. Int. 173, 674–692, doi: 10.1111/j.1365-
246X.2008.03736.x.
ANDREWS, D. J. (2005), Rupture dynamics with energy loss outside the slip zone, J. Geophys. Res. 110, B01307,
doi:10.1029/2004JB003191.
AYDIN, A. and JOHNSON, A.M. (1983), Analysis of faulting in porous sandstones, J. Struct. Geol. 5, 19– 31.
ARMIJO, R., MEYER, B., KING, G. C. P., RIGO, A., and PAPANASTASSIOU, D. (1996), Quaternary evolution of the
Corinth Rift and its implications for the Late Cenozoic evolution of the Aegean, Geophys. J. Int. 126, 11–53.
BAISCH. S., and BOKELMANN, G. H. R. (2001), Seismic waveform attributes before and after the Loma Prieta
earthquake: Scattering change near the earthquake and temporal recovery, J. Geophys. Res. 106, 16,323-
16,337.
BEN-ZION, Y. (1996), Stress, slip and earthquakes in models of complex single-fault systems incorporating brittle
and creep deformations, J. Geophys. Res. 101, 5677–5706.
BEN-ZION, Y. and AKI, K. (1990), Seismic radiation from an SH line source in a laterally heterogeneous planar
fault zone, Bull. Seismol Soc. Am. 80, 971–994.
BEN-ZION, Y. and ANDREWS, D. J. (1998), Properties and implications of dynamic rupture along a material
interface, Bull. Seismol. Soc. Am. 88(4), 1085–1094.
BEN-ZION, Y., HENYEY, T., LEARY, P. and LUND, S. (1990), Observations and implications of water well and
creepmeter anomalies in the Mojave segment of the San Andreas fault zone, Bull. Seismol. Soc. Am. 80,
1661–1676.
BEN-ZION, Y. and LYAKHOVSKY, V. (2006), Analysis of aftershocks in a lithospheric model with seismogenic zone
governed by damage rheology, Geophys. J. Int. 165, 197–210.
BEN-ZION, Y., PENG, Z., OKAYA, D., SEEBER, L., ARMBRUSTER, J. G., OZER, N., MICHAEL, A. J., BARIS, S. and
AKTAR, M. (2003), A shallow fault zone structure illuminated by trapped waves in the Karadere-Duzce branch
of the North Anatolian Fault, western Turkey, Geophys. J. Int. 152, 699–717.
BEN-ZION, Y. and SAMMIS, C. (2003), Characterization of Fault Zones, Pure Appl. Geophys. 160, 677–715.
BEN-ZION, Y. and SHI, Z. (2005), Dynamic rupture on a material interface with spontaneous generation of
plastic strain in the bulk, Earth Planet. Sci. Lett. 236, 486–496, doi: 10.1016/j.epsl.2005.03.025.
BERCOVICI, D. and RICARD, Y. (2003), Energetics of a two-phase model of lithospheric damage, shear
localization and plate-boundary formation, Geophys. J. Int. 152 (3), 581–596 doi:10.1046/j.1365-
246X.2003.01854.x
BUDIANSKY, B. and O’CONNELL, R. J. (1976), Elastic moduli of a cracked solid, Int. J. Sol. Struct. 12, 81–97.
CARTER, N. L. and TSENN, M. C. (1987), Flow properties of continental lithosphere, Tectonophysics 136, 27–63.
CHESTER, F. M. and CHESTER, J. S. (1998), Ultracataclasite structure and friction processes of the Punchbowl
Fault, San Andreas System, California, Tectonophysics 295, 199–221.
CHESTER, F. M. (1995), Geologic studies of deeply exhumed faults of the San Andreas System, Southern
California: Collaborative research with Saint Louis University and Utah State University: NEHRP annual
project summary, award No. 94G2457, v. 37.
CHESTER, F. M., EVANS, J. P., and BIEGEL, R. L. (1993), Internal structure and weakening mechanisms of the San
Andreas Fault, J. Geophys. Res. 98, 771–786.
CHRISTENSEN, N. I., and MOONEY, W. D. (1995), Seismic velocity structure and composition of the continental
crust: A global view, J. Geophys. Res. 100 (B6), 9761–9788.
COCHRAN, E. S., VIDALE, J. E., and LI, Y. G. (2003), Near-fault anisotropy following the Hector Mine earthquake,
J. Geophys. Res. 108(B9), 2436, doi:10.1029/2002JB002352.
COWIE, P. A., VANNESTE, C., and SORNETTE, D. (1993), Statistical Physics Model for the Spatiotemporal Evolution
of Faults, J. Geophys. Res. 98(B12), 21,809–21,821.
CUNDALL, P. A. and BOARD, M. A microcomputer program for modeling large-strain plasticity problems. In
Numerical Methods in Geomechanics, Proc. 6th Int. Conf. Numerical Methods in Geomechanics, Innsbruck,
(ed. Swoboda), (C., Rotterdam, Balkema, 1988) pp. 2101–2108.
DE PAOLA, N., HOLDSWORTH, R. E., COLLETTINI, C., MCCAFFREY, K. J. W., and BARCHI, M. R. (2007), The
structural evolution of dilational step-overs in regional transtensional zones. (Cunningham W. D. and Mann,
Vol. 166, 2009 Damage Rheology Models of Strike-slip Fault Zone Evolution 1569

P., eds), Tectonics of Strike-Slip Restraining and Releasing Bends (Geolog. Soc., London. Special
Publications), 290, pp. 433–445.
DIETERICH, J. H. (1972), Time-dependent friction in rocks, J. Geophys. Res. 77, 3690–3697.
DIETERICH, J. H. (1978), Time-dependent friction and the mechanics of stick-slip, Pure Appl. Geophys. 116, 790–
805.
DIETERICH, J. H. (1979), Modeling of rock friction 1. Experimental results and constitutive equations, J. Geophys.
Res. 84, 2161–2168.
DOLAN, J. F., BOWMAN, D. D., and SAMMIS, C. G. (2007), Long-range and long-term fault interactions in Southern
California, Geology, 35, 855–858.
DOR, O., ROCKWELL, T. K. and BEN-ZION, Y. (2006), Geological observations of damage asymmetry in the
structure of the San Jacinto, San Andreas and Punchbowl Faults in Southern California: A possible indicator
for preferred rupture propagation direction, Pure Appl. Geophys. 163, 301–349, doi:10.1007/s00024-005-
0023-9.
DOR, O., YILDIRIM, C., ROCKWELL, T.K., BEN-ZION, Y., EMRE, O., SISK, M., DUMAN, T. Y. (2008), Geologic and
geomorphologic asymmetry across the rupture zones of the 1943 and 1944 earthquakes on the North
Anatolian Fault: Possible signals for preferred earthquake propagation direction, Geophys. J. Int., doi:
10.1111/j.1365-246X.2008.03709.x.
DUNHAM, E. M. and RICE, J. R. (2008), Earthquake slip between dissimilar poroelastic materials, J. Geophys.
Res., in press.
EISSA, E. A. and KAZI, A. (1988), Relation between static and dynamic Young’s Moduli of Rocks, Int. J. Rock
Mech. Min. Sci. Geomech. Abstr. 25 (6), 479–482.
EVANS, J. P., SHIPTON, Z. K., PACHELL, M. A., LIM, S. J., and ROBESON, K. The structure and composition of
exhumed faults, and their implication for seismic processes. In Proc. of the 3rd Confer. on Tecto. problems of
the San Andreas system, (Stanford University 2000).
FIALKO, Y. (2004), Probing the mechanical properties of seismically active crust with space geodesy: Study of
the coseismic deformation due to the 1992 Mw7.3 Landers (southern California) earthquake, J. Geophys Res.
109, B03307, doi:10.1029/2003JB002756.
FIALKO, Y., SANDWELL, D., AGNEW, D., SIMONS, M., SHEARER, P., and MINSTER, B. (2002), Deformation on nearby
faults induced by the 1999 Hector Mine earthquake, Science 297, 1858–1862.
FINZI, Y., HEARN, E. H., LYAKHOVSKY, V., and BEN-ZION., Y. (2006), 3-D viscoelastic damage rheology models of
strike-slip fault systems and their associated surface deformation, EOS Trans. AGU, 87(52), Fall Meet.
Suppl., Abstract T21C-0425.
GRAYMER, R.W., LANGENHEIM, V.E., SIMPSON, R.W., JACHENS, R.C., and PONCE, D.A. (2007), Relatively simple
through-going fault planes at large-earthquake depth may be concealed by the surface complexity of strike-
slip faults. In (Cunningham, W.D., and Mann, Paul, eds.) Tectonics of Strike-Slip Restraining and Releasing
Bends, (Geological Society of London Special Publication 2007), vol. 290, pp. 189–201, doi: 10.1144/
SO290.5 0305-8719/07.
HAMIEL, Y., LYAKHOVSKY, V., and AGNON, A. (2005), Rock dilation, nonlinear deformation, and pore pressure
change under shear, Earth Planet. Sci. Lett. 237, 577–589.
HAMIEL, Y., KATZ, O., LYAKHOVSKY., RECHES, Z. and FIALKO, Y. (2006), Stable and unstable damage evolution in
rocks with implications to fracturing of granite, Geophys. J. Int. 167, 1005–1016.
HAMIEL, Y., LIU, Y., LYAKHOVSKY, V., BEN-ZION, Y., and LOCKNER, D. (2004), A visco-elastic damage model with
applications to stable and unstable fracturing, Geophys. J. Int. 159, 1155–1165.
HAMIEL, Y. and FIALKO, Y. (2007), Structure and mechanical properties of faults in the North Anatolian Fault
system from InSAR observations of coseismic deformation due to the 1999 Izmit (Turkey) earthquake,
J. Geophys Res. 112, B07412, doi:10.1029/2006JB004777.
HARRIS, R. A. and DAY, S. M. (1999), Dynamic 3-D simulations of earthquakes on en echelon faults, Geophys.
Res. Lett. 26, 2089–2092.
HARRIS, R. A. and DAY, S. M. (1993), Dynamics of fault interaction: Parallel strike-slip faults, J. Geophys. Res.
98, 4461–4472.
HARRIS, R. A., ARCHULETA, R. J., and DAY, S. M. (1991), Fault steps and the dynamic rupture process: 2-D
numerical simulations of a spontaneously propagating shear fracture, Geophys. Res. Lett. 18, 893–896.
HEARN, E. H. and FIALKO, Y. (2009), Coseismic deformation of Mojave compliant zones and crustal stresses,
J. Geophys. Res., in press.
1570 Y. Finzi et al. Pure appl. geophys.,
HICKMAN, S., SIBSON, R.H., and BRUHN, R. (1995), Introduction to a special section, mechanical involvement of
fluids in faulting, J. Geophys. Res. 100, 12,831–12,840.
IDE, J. M. (1936), Comparison of statically and dynamically determined Young’s modulus of rocks, Proc. Nat.
Acad. Sci., U.S.A. 22, 81–92.
KARABULUT, H. and BOUCHON, M. (2007), Spatial variability and non-linearity of strong ground motion near a
fault, Geoph. J. Int. 170, 1, 262–274.
KIM, Y. S., PEACOCK, D. C. P., and SANDERSON, D. J. (2004), Fault damage zones, J. Struct. Geology 26, 503–517.
KING, G. (1986), Speculations on the geometry of the initiation and termination processes of earthquake rupture
and its relation to morphology and geological structure, Pure Appl. Geophys. 124, 567–585.
KIRBY, S. H. and KRONENBERG, A. K. (1987), Rheology of the lithosphere: Selected topics, Rev. Geophys. 25,
1219–1244.
KORNEEV, V.A., NADEAU, R.M., and MCEVILLY, T.V. (2003), Seismological studies at Parkfield IX: Fault-one
imaging using guided wave attenuation, Bull. Seismol. Soc. Am. 93, 1415–1426.
LEWIS, M. A., PENG, Z., BEN-ZION, Y., and VERNON, F. (2005), Shallow seismic trapping structure in the San
Jacinto fault zone, Geophys. J. Int. 162, 867–881, doi:10.1111/j.1365-246X.2005.02684.x.
LI, Y. G., LEARY, P., AKI, K., and MALIN, P. (1990), Seismic trapped modes in the Oroville and San Andreas fault
zones, Science, 249, 763–766.
LI, Y.-G., AKI, K., ADAMS, D., HASEMI, A., and LEE, W. H. K. (1994), Seismic guided waves trapped in the fault
zone of the Landers, California, earthquake of 1992, J. Geophys. Res. 99(B6), 11,705–11,722.
LI, Y.-G., CHEN, P., COCHRAN, E. S., VIDALE, J. E., and BURDETTE, T. (2006), Seismic evidence for rock damage
and healing on the San Andreas fault associated with the 2004 M 6.0 Parkfield Earthquake, Bull. Seismol.
Soc. Am. 96, 4B, S349–S363.
LIU, Y., TENG T. L., and BEN-ZION, Y. (2004), Systematic analysis of shear-wave splitting in the aftershock
region of the 1999 Chi-Chi earthquake: Evidence for shallow anisotropic structure and lack of systematic
temporal variations, Bull. Seismol. Soc. Am. 94, 2330–2347.
LYAKHOVSKY, V. and MYASNIKOV, V. P. (1984), On the behavior of elastic cracked solid, Phys. Solid Earth 10,
71–75.
LYAKHOVSKY, V. and MYASNIKOV, V. P. (1985), On the behavior of visco-elastic cracked solid, Phys. Solid Earth
4, 28–35.
LYAKHOVSKY, V., BEN-ZION, Y., and AGNON, A. (1997a), Distributed damage, faulting, and friction, J. Geophys.
Res. 102, 27,635–27,649.
LYAKHOVSKY, V., RECHES, Z., WEINBERGER, R., and SCOTT, T.E. (1997b), Non-linear elastic behavior of damaged
rocks, Geophys. J. Int. 130, 157–166.
LYAKHOVSKY, V., BEN-ZION, Y., and AGNON, A. (2001), Earthquake cycle, faults, and seismicity patterns in
rheologically layered lithosphere, J. Geophys. Res. 106, 4103–4120.
LYAKHOVSKY, V., BEN-ZION, Y., and AGNON, A. (2005), A viscoelastic damage rheology and rate- and state-
dependent friction, Geophys. J. Int. 161, 179–190.
LYAKHOVSKY, V. and BEN-ZION, Y. (2008), Scaling relations of earthquakes and aseismic deformation in a
damage rheology model, Geophys. J. Int. 172, 651–662, doi: 10.1111/j.1365-246X.2007.03652.x.
LYAKHOVSKY, V., and BEN-ZION, Y. (2009), Evolving fault zone structures in a damage rheology model,
Geochemistry, Geophysics, Geosystems, in review.
MALVERN, L.E. Introduction to the Mechanics of a Continuum Medium (New Jersey, Prentice-Hall, Inc., 1969),
713 pp.
MCGUIRE, J. and BEN-ZION, Y. (2005), High-resolution imaging of the Bear Valley section of the San Andreas
Fault at seismogenic depths with fault-zone head waves and relocated seismicity, Geophys. J. Int. 163, 152–
164, doi: 10.1111/j.1365-246X.2005.02703.x.
MICKLETHWAITE, S. and COX, S. F. (2004), Fault-segment rupture, aftershock-zone fluid flow and mineralization,
Geology 32, 813–816.
MOONEY, W. D. and GINZBURG, A. (1986), Seismic measurements of the internal properties of fault zones, Pure
Appl. Geophys. 124, 141–157.
NADEAU, R., ANTOLIK, M., JOHNSON, P., FOXALL, W., and MCEVILLY, T. V. (1994), Seismological studies at
Parkfield III: Microearthquake clusters in the study of fault-zone dynamics, Bull. Seismol. Soc. Am. 83, 247–
263.
Vol. 166, 2009 Damage Rheology Models of Strike-slip Fault Zone Evolution 1571

OGLESBY, D. D., DAY, S. M., LI, Y.-G., and VIDALE, J. E. (2003), The 1999 Hector Mine Earthquake: The
dynamics of a branched fault system, Bull. Seismol. Soc. Am. 93, 6, 2459–2476.
OLSON, J., and POLLARD, D. D. (1989), Inferring paleostresses from natural fracture patterns: A new method,
Geology 17, 4, 345–348.
PENG, Z. and BEN-ZION, Y. (2004), Systematic analysis of crustal anisotropy along the Karadere- Duzce branch
of the north Anatolian fault, Geophys. J. Int. 159, 253-274, doi:10.1111/j.1365-46X.2004.02379.x.
PENG, Z. and BEN-ZION, Y. (2005), Spatio-temporal variations of crustal anisotropy from similar events in
aftershocks of the 1999 M7.4 _Izmit and M7.1 Duzce, Turkey, earthquake sequences, Geophys. J. Int. 160(3),
1027–1043, doi: 10.1111/j.1365-246X.2005.02569.x.
PENG, Z. and BEN-ZION, Y. (2006), Temporal changes of shallow seismic velocity around the Karadere-Duzce
branch of the north Anatolian fault and strong ground motion, Pure Appl. Geophys. 163, 567–600, doi:
10.1007/s00024-005-0034-6.
PENG, Z., BEN-ZION, Y., MICHAEL, A. J., and ZHU, L. (2003), Quantitative analysis of seismic trapped waves in the
rupture zone of the 1992 Landers, California earthquake: Evidence for a shallow trapping structure,
Geophys. J. Int. 155, 1021–1041.
POLIAKOV, A., CUNDALL, P., PODLADCHIKOV, Y., and LYAKHOVSKY, V. An explicit inertial method for the simulation
of viscoelastic flow: an evaluation of elastic effects on diapiric flow in two- and three-layers model. In Proc.
NATO Advanced Study Institute on Dynamic Modeling and Flow in the Earth and Planets, (Runcorn, K.E.
and Stone, D., eds) (Dordrecht, Kluwer, 1993) pp. 175–195.
POUPINET, G., ELLSWORTH, W. L., and FRECHET, J. (1984), Monitoring velocity variations in the crust using
earthquake doublets: An application to the Calaveras Fault, California, J. Geophys. Res. 89(B7), 5719–5731.
POWELL, R. E. and WELDON, R. J. (1992), Evolution of the San Andreas Fault, Annu. Rev. Earth Planet. Sci. 20,
431–468.
REVENAUGH, J. (2000), The relation of crustal scattering to seismicity in southern California, J. Geophys. Res.
105(B11), 25,403–25,422.
RICE, J.R. and BEN-ZION, Y. (1996), Slip complexity in earthquake fault models, Proc. Natl. Acad. Sci. U.S.A. 93,
3811–1818.
ROCKWELL, T. K. and BEN-ZION, Y. (2007), High localization of primary slip zones in large earthquakes from
paleoseismic trenches: Observations and implications for earthquake physics, J. Geophys. Res. 112, B10304,
doi:10.1029/2006JB004764.
RUBINSTEIN, J.L. and BEROZA, G.C. (2004), Evidence for widespread strong ground motion in the Mw 6.9 Loma
Prieta eartquake, Bull. Seismol. Soc. Am. 94, 1595–1608.
RUDNICKI, J. W. and RICE, J. R. (2006), Effective normal stress alteration due to pore pressure changes induced
by dynamic slip propagation on a plane between dissimilar materials, J. Geophys. Res. 111, B10308,
doi:10.1029/2006JB004396.
SAUCIER, F. and HUMPHREYS, E.D. (1993), Horizontal crustal deformation in Southern California from joint
models of geologic and very long baseline interferometry measurements. In Contributions of Space Geodesy
to Geodynamics (D.E. Smith and D.L. Turcotte, eds.), pp. 139–176, (AGU Geodyn. Ser. Vol. 23, Washington
D.C. 1993).
SCHAFF, D. P., BOKELMANN, G. H. R., BEROZA, G. C., WALDHAUSER, F., and ELLSWORTH, W. L. (2002), High-
resolution image of Calaveras Fault seismicity, J. Geophys. Res. 107(B9), 2186, doi:10.1029/2001JB000633.
SCHAFF, D. P. and BEROZA, G. C. (2004), Coseismic and postseismic velocity changes measured by repeating
earthquakes, J. Geophys. Res. 109, B10302, doi:10.1029/2004JB003011.
SCHULZ, S. E. and EVANS, J. P. (2000), Mesoscopic structure of the Punchbowl Fault, Southern California and
the geologic and geophysical structure of active strike-slip faults, J. of Struct. Geol. 22, 913–930.
SEGALL, P. and POLLARD, D. D. (1980), Mechanics of discontinuous faults, J. Geophys. Res. 85, 4337–4350,
1980.
SENGOR, A. M. C., TUYSZ, O., IMREN, C., SAKINC, M., EYIDOGAN, H., GORUR, N., LE PICHON, X., and RANGIN, C.
(2005), The North Anatolian Fault: A new look, Annu. Rev. Earth Planet. Sci. 33, 37–112.
SHELDON, H. A., and MICKLETHWAITE, S. (2007), Damage and permeability around faults: Implications for
mineralization, Geology 35, 10, 903–906.
SHIPTON, Z. K., and COWIE, P. A. (2003), A conceptual model for the origin of fault damage zone structures in
high-porosity sandstone, J. Struct. Geol. 25, 3, 333–344
SIBSON, R.H. (1985), Stopping of earthquake ruptures at dilational fault jogs, Nature 316, 248–251.
1572 Y. Finzi et al. Pure appl. geophys.,

SIBSON, R. H. (2003), Thickness of the seismic slip zone, Bull. Seismol. Soc. Am. 93, 3, 1169–1178.
STIRLING, M. W., WESNOUSKY, S. G., and SHIMAZAKI, K. (1996), Fault trace complexity, cumulative slip, and the
shape of the magnitude-frequency distribution for strikeslip faults: a global survey, Geophys. J. Int. 124, 833–
868.
STIERMAN, D. J. (1984), Geophysical and geological evidence for fracturing, water circulation and chemical
alteration in granitic rocks adjacant to major strike-slip faults, J. Geophys. Res. 89, B7, 5849–5857.
SYLVESTER, A. G. (1988), Strike-slip faults, Geol. Soc. Am. 100, 1666–1703.
SYLVESTER, A. G. and SMITH, R., (1976), Tectonic transpretions and basement controlled deformation in the San
Andreas fault zone, Salton trough, California, AAPG Bull. 60, 2081–2102.
TCHALENKO, J. S. (1970), Similarities between shear zones of different magnitudes, Geolog. Soc. Am. Bull. 81,
1625–1640.
TEMPLETON, E. L. and RICE, J. R. (2008), Off-fault plasticity and earthquake rupture dynamics, 1. Dry materials
or neglect of fluid pressure changes, J. Geophys. Res.
TENTHOREY, E., COX, S. F., and TODD, H. F. (2003), Evolution of strength recovery and permeability during fluid-
rock reaction in experimental fault zones, Earth Planet. Sci. Lett. 206(1–2), 161–172.
THURBER, C., ZHANG, H., WALDHAUSER, F., HARDEBECK, J., MICHAEL, A., and EBERHART-PHILLIPS, D. (2006), Three-
dimensional compressional wavespeed model, earthquake relocations, and focal mechanisms for the
Parkfield, California, Region, Bull. Seismol. Soc. of Am. 96, 4B, S38–S49, doi: 10.1785/0120050825.
TURCOTTE, D. L. and GLASSCOE, M.T. (2004), A damage model for the continuum rheology of the upper
continental crust, Tectonophysics 383, 71–80.
WESNOUSKY, S. G. (2006), Predicting the endpoints of earthquake ruptures, Nature 444, 358–360.
WESNOUSKY, S. (1994), The Gutenberg-Richter or characteristic earthquake distribution, which is it?, Bull.
Seismol. Soc. Am. 84, 1940–1959.
WILCOX, R. E., HARDING, T. P., and SEELY, D. R. (1973), Basic wrench tectonics, AAPG Bull. 57, 74–96.
WU, C., PENG, Z. and BEN-ZION, Y. (2009), Non-linearity and temporal changes of fault zone site response
associated with strong ground motion, Geophys. J. Int. 176, 265–278, doi: 10.1111/j.1365-
246x.2008.04005.x.
YAMASHITA, T. (2007), Postseismic quasi-static fault slip due to pore pressure change on a bimaterial interface,
J. Geophys. Res. 112, B05304, doi:10.1029/2006JB004667.
YANG, W. and BEN-ZION, Y. (2009), Observational analysis of correlations between aftershock prodectivities
and regional conditions in the context of a damage rheology model, Geophys. J. Int., 177, 481–499 doi:
10.1111/j.1365-246x.2009.0414s.
(Received May 7, 2008, revised September 30, 2008)
Published Online First: June 30, 2009
To access this journal online:
www.birkhauser.ch/pageoph
Vol. 166, 2009 Damage Rheology Models of Strike-slip Fault Zone Evolution 1573
Related Documents