For a two-choice response time (RT) task the observed variables are response speed and response accuracy In experimental psychology inference usually concerns the mean response time for correct decisions (ie MRT ) and the proportion of correct decisions (ie Pc) The immedi-ate problem is that MRT and Pc are in a trade-off relation-ship Participants can respond faster and hence decrease MRT at the expense of making more errors thereby de-creasing Pc (see eg Pachella 1974 Schouten amp Bekker 1967 Wickelgren 1977) This so-called speedndashaccuracy trade-off has for a long time bedeviled the field Consider 2 participants in an experiment Amy and Rich Amyrsquos and Richrsquos performance is summarized by MRT 5 0422 sec Pc 5 881 and MRT 5 0467 sec Pc 5 953 respectively Amy responds faster than Rich but she also commits more errors Thus it could be that Amy and Rich have the same ability but Amy risks making more mistakes It could also be that Amyrsquos ability is higher than that of Rich or vice versa If we only consider MRT and Pc there ap-pears to be no way to tell which of these three possibilities is in fact true
Now consider George whose performance is character-ized by MRT 5 0517 sec Pc 5 953 George responds more slowly than Rich whereas their error rates are identi-cal An explanation solely in terms of the speedndashaccuracy trade-off cannot account for this pattern of results and therefore most researchers would confidently conclude that Rich performs better than George Unfortunately if we only consider MRT and Pc it is impossible to go beyond these conclusions in terms of ordinal relations and quan-tify how much better Rich does than George Note that
the same arguments would hold if the example above had been in terms of 1 participant who responds in three dif-ferent experimental conditions presented in three separate blocks of trials In this case comparison of performance across the different conditions is complicated by the fact that task performance may be simultaneously influenced by task difficulty and response conservativeness
In sum both MRT and Pc provide valuable information about task difficulty or subject ability but neither of these variables can be considered in isolation When MRT and Pc are considered simultaneously however it is not clear how to weigh their relative contributions to arrive at a sin-gle index that quantifies subject ability or task difficulty
A way out of this conundrum is to use cognitive process models to estimate the unobserved variables assumed to underlie performance in the task at hand The field of re-search that uses cognitive models for measurement has been termed cognitive psychometrics (Batchelder 1998 Batchelder amp Riefer 1999 Riefer Knapp Batchelder Bamber amp Manifold 2002) and similar approaches in other paradigms have included those of Busemeyer and Stout (2002) Stout Busemeyer Lin Grant and Bonson (2004) and Zaki and Nosofsky (2001) Here the focus is on the diffusion model for two-choice RT tasks (see eg Ratcliff 1978) In the diffusion model the three most important unobserved variables are the quality of informa-tion response conservativeness and nondecision time A statistical analysis of these unobserved variables is not only immune to speedndashaccuracy trade-offs but also af-fords an unambiguous quantification of performance dif-ferences This article introduces the EZ-diffusion model
3 Copyright 2007 Psychonomic Society Inc
TheoreTical and review arTicles
An ez-diffusion model for response time and accuracy
eric-Jan wagenmakers han l J van der maas and raoul P P P grasmanUniversity of Amsterdam Amsterdam The Netherlands
The EZ-diffusion model for two-choice response time tasks takes mean response time the variance of re-sponse time and response accuracy as inputs The model transforms these data via three simple equations to produce unique values for the quality of information response conservativeness and nondecision time This transformation of observed data in terms of unobserved variables addresses the speedndashaccuracy trade-off and allows an unambiguous quantification of performance differences in two-choice response time tasks The EZ- diffusion model can be applied to data-sparse situations to facilitate individual subject analysis We studied the performance of the EZ-diffusion model in terms of parameter recovery and robustness against misspecification by using Monte Carlo simulations The EZ model was also applied to a real-world data set
Psychonomic Bulletin amp Review2007 14 (1) 3-22
e-J Wagenmakers ewagenmakersfmguvanl
4 Wagenmakers van der maas and grasman
a simplified version of the diffusion model that is able to uniquely determine these three important unobserved vari-ables from just three observed quantities MRT Pc and the variance of response times for correct decisions (VRT ) Our mathematical analysis will show that VRT is much more informative with respect to subject ability or task difficulty than is MRT echoing recent empirical insights in the aging literature and elsewhere (eg Hultsch Mac-Donald amp Dixon 2002 Li 2002 MacDonald Hultsch amp Dixon 2003 Shammi Bosman amp Stuss 1998)
An important practical advantage of the EZ-diffusion model is that it does not require a parameter fitting routine (cf signal detection theory) Also the EZ-diffusion model can be applied to common experimental setups in which each participant contributes only a moderate amount of data and error rate is low (ie 5ndash10)
The outline of this article is as follows The next sec-tion briefly discusses the methods of analysis that are cur-rently standard in the field Then we briefly describe the ldquofullrdquo Ratcliff diffusion model and introduce the simpli-fied ldquoEZrdquo version Subsequent sections detail the perfor-mance of the EZ method in terms of parameter recovery and robustness against misspecification Then we use a real-world data set to compare parameter estimates for the EZ model against those for the Ratcliff diffusion model We conclude by stressing the practicality of the present approach and by acknowledging the potential dangers of blindly applying the EZ model to situations in which its assumptions do not hold
The Standard Analysis of Two-Choice RT Tasks and Its Limitation
For many decades the analysis of data from two-choice RT tasks has remained unchanged The standard analy-sis separately considers MRT and Pc Specifically one ANOVA is performed for MRT and a second for Pc The standard analysis is simple but crude and it can be im-proved in various ways For instance Rouder Lu Speck-man Sun and Jiang (2005) recently introduced a Bayes-ian hierarchical model of Weibull distributions that bases inference not just on MRT but on the entire RT distribu-tion for correct decisions Similar sophistications (eg hierarchical logistic regression) can be proposed for the analysis of Pc
Regardless of the statistical sophistication that the stan-dard method may undergo the general framework fails to address the core problem of the two-alternative RT task This is the problem of how to combine response speed and
accuracy in a single index that reflects subject ability or task difficulty
To highlight the limitations of the standard method of inference consider the performance of our hypotheti-cal participants in a two-alternative RT task as shown in Table 1 Assume that the imaginary experiment involves very many trials so that measurement error is negli-gible The standard analysis method is perfectly able to rank-order the participants according to either MRT (ie 1 Mark 2 Amy 3 Rich 4 George) Pc (ie 1amp2 George amp Rich 3amp4 Mark amp Amy) or VRT (ie 1amp2 Mark amp Amy 3amp4 George amp Rich) However the standard method cannot rank-order the 4 participants on ldquoabilityrdquo since this requires response speed and response accuracy to be com-bined in some unspecified manner This also means that the standard method cannot inform us as to how much bet-ter or worse one participant performs than another
The Ratcliff Diffusion ModelA solution to the problem of how to combine response
speed and response accuracy is to analyze the data in terms of the parameters of a cognitive model such as a diffusion model In a diffusion model illustrated in Figure 1 noisy accumulation of information drives a decision process that terminates when the accumulated evidence in favor of one or the other response alternative exceeds threshold Thus the diffusion model is a continuous-time continuous-state random-walk sequential sampling model (see Laming 1968 Link 1992 Link amp Heath 1975 Ratcliff 1978 Stone 1960) The reader is referred to Luce (1986) Rat-cliff (2002) Ratcliff and Smith (2004) and Townsend and Ashby (1983) for detailed accounts of the diffusion model to Gardiner (2004) Honerkamp (1994) and Smith (2000) for mathematical foundations and to Diederich and Buse-meyer (2003) Ratcliff and Tuerlinckx (2002) Tuerlinckx (2004) and Voss Rothermund and Voss (2004) for a dis-cussion of several methods to fit the model to data
For concreteness our focus is on the diffusion model as it applies to the lexical decision task (Ratcliff Gomez amp McKoon 2004) In lexical decision the participant is pre-sented with a letter string that needs to be classified either as an English word (eg zebra) or as a nonword (eg drapa) The diffusion model has also been successfully applied to many other two-choice RT paradigms including short- and long-term recognition memory tasks sameshydifferent letter string matching numerosity judgments visual-scanning tasks brightness discrimination and letter discrimination (see eg Ratcliff 1978 1981 2002 Ratcliff amp Rouder 1998 2000 Ratcliff Van Zandt amp McKoon 1999) In all these applications the diffusion model provided a close fit to response accuracy and the observed RT distributions for both correct and error responses
In the application of the diffusion model to lexical deci-sion presentation of a word stimulus will generally lead to the accumulation of evidence that supports the correct ldquowordrdquo response as in the two examples shown in Figure 1 In the model easy-to-classify letter strings have relatively high absolute drift rate values that is these letter strings are associated with relatively high signal-to-noise ratios in the evidence accumulation process Drift rate ξ is defined
Table 1 Performance of 4 Hypothetical Participants in a
Two-Alternative Forced Choice Task
Participant
RT Mean (sec)
RT Variance
Pc
George 0517 0024 953Rich 0467 0024 953Amy 0422 0009 881Mark 0372 0009 881
NotemdashWhich participant did best RT denotes response time and Pc the proportion of correct responses See the text for details
eZ diffusion 5
on the real line ξ 0 and ξ 0 lead to evidence accumu-lation consistent with a ldquowordrdquo or a ldquononwordrdquo response respectively The case of ξ 5 0 corresponds to a process that at each point in time is equally likely to move upward as it is to move downward Drift rate is assumed to vary over trials according to ξ sim N(v η) Because drift rate quantifies the deterministic component of the noisy information ac-cumulation process it can be interpreted as an index for the signal-to-noise ratio of the information processing system Therefore drift rate is an excellent candidate for a mea-sure that combines respond speed and response accuracy to quantify subject ability or task difficulty
The stochastic nonsystematic component of the infor-mation accumulation process on each trial is quantified by s The factor s2 dt is the variance of the change in the accumulated information for a small time interval dt (Cox amp Miller 1970 p 208) The s parameter is a scaling pa-rameter which means that if s doubles other parameters in the model can be doubled to obtain exactly the same result Thus the choice of a specific value for s 0 is arbitrary in practice s is usually set to 01 and we ad-here to this convention throughout the article Two further important parameters are the boundary separation a and the starting point z The boundary separation parameter a is especially important here because large values of a indicate the presence of a conservative response criterion When a is large the system requires more discriminative information before deciding on one or the other response alternative A conservative response criterion results in long response times but also in highly accurate perfor-mance since with large a it is unlikely that the incorrect boundary will be reached by chance fluctuations There-fore in the diffusion model one of the main mechanisms by which speedndashaccuracy trade-off phenomena arise is through changes in a
The a priori bias against one or the other response alter-native is given by z As with drift rate the exact location of z may fluctuate from trial to trial This fluctuation is quanti-fied by a uniform distribution with range sz As shown later in most applications z is estimated to be about equidistant from both response boundaries (ie z asymp ashy2) Finally the diffusion model captures the nondecision component of RT by a parameter Ter that varies over trials according to a uniform distribution with range st As is often assumed in RT modeling the total RT is a sum of the nondecision and decision components of processing (Luce 1986)
RT 5 DT 1 Ter (1)
where DT denotes decision timeIn sum the Ratcliff diffusion model estimates the fol-
lowing seven parameters1
1 Mean drift rate (v)2 Across-trials variability in drift rate (η)3 Boundary separation (a)4 Mean starting point (z)5 Across-trials range in starting point (sz)6 Mean of the nondecision component of processing
(Ter)7 Across-trials range in the nondecision component of
processing (st)
In theory these seven parameters could be estimated sepa-rately for each experimental condition In practice how-ever only parameters that are believed to be affected by the experimental manipulation are free to vary between conditions
In order to provide some perspective regarding the ranges of parameter values that may be expected when fitting the Ratcliff diffusion model to data Figure 2 pro-vides a visual overview of the best-fitting parameter val-
st across-trialsvariability in
the nondecisioncomponent of RT
(eg encodingand response
processes)
Ter
timeNondecision Time Decision Time
Response Time = Nondecision Time + Decision Time
s z ac
ross
-tria
ls va
riabi
lity
insta
rtin
g po
int z
a
z
0
ldquowordrdquo boundary
ξ drift rate which varies across trialsaccording to N(v η)
Variable sample paths illustrate within-trialsvariability in drift rate (ie s)
ldquononwordrdquo boundary
time
Figure 1 Diffusion model account of evidence accumulation in the lexical decision task (see Ratcliff et al 2004)
6 Wagenmakers van der maas and grasman
ues encountered in previous experiments (ie Ratcliff Gomez amp McKoon 2004 Ratcliff amp Rouder 2000 Rat-cliff amp Smith 2004 Ratcliff Thapar Gomez amp McKoon 2004 Ratcliff Thapar amp McKoon 2001 2004 Ratcliff et al 1999 Van Zandt Colonius amp Proctor 2000 Voss et al 2004) These experiments used tasks such as lexi-cal decision letter identification asterisks discrimina-tion recognition memory and color discrimination Stud-ies that manipulated starting point were excluded from consideration Whenever there was a choice we selected parameter values estimated from averaged data2 Almost all experiments vary task difficulty (ie drift rate in the model) and this is the reason why the top left panel con-tains relatively many valuesmdashwhen a manipulation is thought to affect drift rate only this parameter is free to vary across conditions The bottom right panel plots the
best-fitting values for the st parameter It represents rela-tively few experiments because this parameter has been recently added to the diffusion model Figure 3 shows the relation between boundary separation and starting point as obtained in earlier experiments The solid line has a slope of 2 Figure 3 confirms the earlier assertion that in many applications z asymp ashy2
The data needed to fit the Ratcliff diffusion model are error rate and RT distributions for correct and error re-sponses As mentioned earlier participants usually do not commit very many errors In most tasks error rate is lower than 10 This means that it may take a substantial num-ber of trials to accurately estimate the entire RT distribu-tion for error responses On the basis of prior experience with the model a rule of thumb is that about 10 error RTs are needed in order to estimate the error RT distribution
Drift Rate
v
Freq
uen
cy
0 01 02 03 04 05
0
5
10
15
20
25
N = 145
Boundary Separation
a
Freq
uen
cy
006 010 014 018
0
5
10
15N = 44
Mean of Nondecision Time
Ter
Freq
uen
cy
03 04 05 06 07
0
2
4
6
8
10 N = 41
Trial-to-Trial Variabilityin Drift Rate
η
Freq
uen
cy
0 010 020
0
5
10
15
20
N = 41
Trial-to-Trial Variabilityin Starting Point
sz
Freq
uen
cy
0 002 004 006 008
0
2
4
6
8
N = 35
Trial-to-Trial Variabilityin Nondecision Time
st
Freq
uen
cy
0 010 020
0
2
4
6
8
N = 20
Figure 2 Best-fitting diffusion model parameter values as encountered in previous research The top left panel plots the absolute values of drift rates (ie negative drift rates have been multiplied by 1) The scaling parameter s is always fixed at 01
eZ diffusion 7
with an acceptable degree of reliability This means that with an error rate of say 5 each experimental condition should contain about 200 observations
The model is then fit to the data using one of several methods (see eg Ratcliff amp Tuerlinckx 2002) Each method uses the facts that in the diffusion model the probability of an error (Pe) is given by
P P
av
s
zv
se c
= minus =minus
minus minus
minus1
2 22 2
exp exp
exp22
12
av
s
minus
(2)
and the probability of an error response before time t is given by Equation 3 at the bottom of this page (Cox amp Miller 1970) where k indexes the infinite series and a z ξ and Ter are free parameters As t` the part that involves the infinite sum goes to zero and what remains is simply the probability of an error response Thus Equa-tion 3 computes the defective distribution (see eg Rat-cliff amp Tuerlinckx 2002) To obtain the equation that gives the probability of a correct response before time t z and ξ should be replaced by a z and ξ respectively
Although Equation 3 may look daunting3 the real prob-lem in fitting the diffusion model is in the fact that param-eters Ter z and ξ vary across trials Finding the best-fitting values for the across-trials variability parameters st sz and η necessitates the use of time-consuming numerical integration procedures The reason that mathematical psy-chologists use such a complicated method is the substantial payoff involved The Ratcliff diffusion model provides a description of response time that is extremely detailed Per-haps more important however is the fact that the param-eter values of the model can provide insights that standard more superficial methods of analysis cannot
For instance in an application of the diffusion model to aging (Ratcliff et al 2001) it was found that in an as-terisks discrimination task older participants responded more slowly but also a little more accurately than the younger participants The diffusion model was fitted to the data and the resulting parameter estimates indicated that the parameter that varied between the different age groups was boundary separation a (and Ter the nondeci-sion RT component which was about 50 msec longer for older adults) whereas mean drift rate v remained fairly constantmdashif anything drift rate was a little higher for the group of older participants This analysis supports the notion that in this particular task the observed dif-ferences in performance arose because the older adults adopted more conservative response criteria than did the younger participants Such detailed and quantitative con-
clusions could not be based on a standard ANOVA on the RTs and error rates (see also Oberauer 2005 Voss et al 2004)
THe ez-DIFFuSIon MoDeL
For a wide range of two-alternative forced choice tasks the Ratcliff diffusion model provides a principled and seem-ingly satisfactory solution to the speed-versus-accuracy dilemma that plagues standard methods of analysis This raises the question as to why the diffusion model is not standardly applied as a psychometric analysis tool One of the answers is that the Ratcliff diffusion model requires the entire RT distribution as input critically this includes the RT distribution for incorrect decisions In many ex-periments participants commit few errors overall and it may take very many trials to obtain an accurate estimate of the error RT distribution Therefore in most practical settings it is unclear whether or not the Ratcliff diffusion model can be applied When a model with at least seven free parameters is unleashed on a small data set problems such as high-variance parameter estimates and sensitivity to starting values may become prominent
Another important reason why the diffusion model is not used more often in empirical studies is the complexity of the parameter-fitting procedure (see Diederich amp Buse-meyer 2003 Ratcliff amp Tuerlinckx 2002 Tuerlinckx
Pr experror eT t Ps
a
z
s kle( ) = minus minus
=sumπ ξ2
2 2
1
2 kkkz
a s
k s
at Tsin exp
π ξ π
minus +
minus1
2
2
2
2 2 2
2 eer( )
+
ξ π2
2
2 2 2
2s
k s
ak51
`
(3)
003 005 007 009
006
008
010
012
014
016
018
020
B
ou
nd
ary
Sep
arat
ion
Starting Point
N = 44
Figure 3 The relationship between starting point and bound-ary separation as encountered in previous research The solid line has a slope of 2 suggesting that in many situations the starting point is about equidistant from the two response boundaries
8 Wagenmakers van der maas and grasman
2004) Many experimental psychologists even those with a firm background in mathematics and computer pro-gramming will find the amount of effort required to fit the Ratcliff diffusion model rather prohibitive
The EZ-diffusion model constitutes an attempt to popu-larize a diffusion model analysis of two-alternative forced choice tasks In order to achieve this goal we have consid-erably simplified the Ratcliff diffusion model These sim-plifications are warranted by the fact that the aim of the EZ model is much more modest than that of the Ratcliff model The EZ model tries to determine only the most psychologically relevant parameters of the Ratcliff model drift rate v (ie quality of information) boundary separa-tion a (ie response conservativeness) and nondecision time Ter The EZ model does not seek to address the issue of RT distributions especially not for error responses Thus the price that has to be paid for the simplification of the diffusion model is that it no longer provides a very detailed account of the observed behavior but instead op-erates at a more macroscopic level Of course with few data this may be the only available option We will return to this issue in the General Discussion section
The first simplification is that the EZ-diffusion model does not allow across-trials variability in parameters This means that st sz and η are effectively removed from the model The effect of stmdashthat is the across-trials variabil-ity in Termdashis usually not very pronounced (see Ratcliff amp Tuerlinckx 2002) The effect of szmdashthat is across-trials variability in starting pointmdashallows the model to handle error responses that are on average faster than correct re-sponses The effect of ηmdashthat is across-trials variability in drift ratemdashis to produce error responses that are on average slower than correct responses From the birdrsquos-eye perspective taken by the EZ-diffusion model these aspects of the data are outside the focus of interest
The second and final simplification is that the starting point z is assumed to be equidistant from the response
boundaries so that z 5 ashy2 As mentioned earlier in prac-tical applications of the diffusion model this is often found to be approximately true (see Figure 3) For instance Rat-cliff et al (2001) had participants decide whether a screen with asterisks came from a ldquohighrdquo or ldquolowrdquo distribution Since the design of the stimulus materials was symmetric one would not expect participants to be biased toward ei-ther the ldquohighrdquo or the ldquolowrdquo response category (Ratcliff et al 2001 p 332)
In other experiments however biases in starting point are more plausible Consider a hypothetical situation in which participants have an a priori bias to respond ldquowordrdquo to letter strings presented in a lexical decision task When such a bias exists the ldquovanillardquo version of the EZ-diffusion model presented here is inappropriate For-tunately there exists an easy check for the presence of bias in the starting point When participants have a start-ing point bias that favors the ldquowordrdquo response in a lexical decision task this means that for word stimuli the correct responses are faster than the error responses whereas for nonword stimuli the correct responses are slower than the error responses Such a pattern of results indicates a bias in starting point and this bias renders the results from an EZ-diffusion model analysis suspect In the General Dis-cussion we will discuss an extension of the EZ-diffusion model that can be applied to situations in which the start-ing point is biased For now we will work under the as-sumption that the starting point is equidistant from the response boundariesmdashthat is that z 5 ashy2
As will soon be apparent the simplifications above allow the EZ-diffusion model to determine v a and Ter without a complicated parameter-fitting exercise Fig-ure 4 shows the EZ-diffusion model and its streamlined set of parameters
Before proceeding we should issue a general disclaimer Any analysis that involves unobserved variables may lead to misleading results when the hypothesized model radically
Ter
Nondecision Time Decision TimeResponse Time = Nondecision Time + Decision Time
a
a2
0
ldquowordrdquo boundary
v = drift rate
Variable sample paths illustrate within-trialsvariability in drift rate (ie s)
ldquononwordrdquo boundary
time
Figure 4 The ez-diffusion model
eZ diffusion 9
deviates from reality This holds for both the EZ-diffusion model and the Ratcliff diffusion model As an example classical signal detection theory assumes the distributions for ldquosignal plus noiserdquo and ldquonoise onlyrdquo to have equal vari-ances When assumptions such as this one are violated care must be taken with the interpretation of unobserved variables Fortunately almost all studies using the diffusion model have shown that the model provides a good descrip-tion of the RT distributions (Ratcliff 2002) and that the spe-cific experimental manipulations have selectively affected the modelrsquos parameters in the expected direction (see eg Voss et al 2004) Nevertheless as with any statistical pro-cedure one is generally well advised to check whether the data are consistent with the assumptions of the model We will revisit this issue several times throughout the article
Mathematical DerivationThe EZ-diffusion model determines drift rate v boundary
separation a and nondecision time Ter from just MRT VRT and Pc This is possible because we have three unknowns (v a and Ter) and also three diffusion model equations (for MRT VRT and Pc) As will be apparent later VRT and Pc uniquely determine the values for v and a so that MRT is necessary only to determine Ter This result contrasts sharply with the popular analysis of RTs which focuses on MRT and ignores VRT (but see eg Slifkin amp Newell 1998)
The first equation refers to the probability of a correct responsemdashthat is the probability that the stochastic process first arrives at the correct response boundary Using the fact that z 5 ashy2 in the EZ model Equation 2 simplifies to
Pav s
c=
+ minus( )1
1 2exp
(4)
which can be rewritten as
a
s P
v=
( )2 log
itc
(5)
where
log log itc
c
c
PP
P( ) minus
1
The second equation refers to the variance of a sym-metrical diffusion process (Wagenmakers Grasman amp Molenaar 2005) The variance is given by
VRTas
v
y y y
y=
( ) minus ( ) +
( ) +
2
32
2 2 1
1
exp exp
exp 2
(6)
where y 5 vashys2 and v 0 If v 5 0
VRTa
s=
4
424
Palmer Huk and Shadlen (2005) independently derived the same equation in terms of hyperbolic functions Their equation contains a typographical error and the correct equation is
VRT z z v z v z v v= ( ) minus ( )
tanh sec h2 3
where v 5 vshys and z 5 zshys
Substituting Equation 5 for a in Equation 6 and solving for v yields Equation 7 at the bottom of this page The sign function returns 1 for all negative numbers and 1 for all positive numbers Inclusion of the sign(Pc 1shy2) term en-sures that v will take on positive values when Pc 1shy2 and negative values when Pc 1shy2 Using the variance equa-tion derived by Palmer et al (2005) Equation 7 can also be written as shown at the top of the next page where L logit(Pc) Equation 7 shows that for fixed accuracy drift rate v in the EZ-diffusion model is inversely proportional to VRT1shy4 which is the square root of the standard deviation of the RT distribution When 2 participants respond at the same level of accuracy their difference in drift rate comes about solely through their difference in VRT
After v has been determined by Equation 7 this allows a to be determined from Equation 5 At this point the two key parameters v and a have been determined without any recourse to MRT It turns out that MRT is useful only to determine the final parameter of the EZ-diffusion model Ter Recall that in the EZ-diffusion model as in the Ratcliff diffusion model MRT contains not just the time to classify the stimulus (ie decision time) but also the time to visu-ally encode the stimulus and the time to produce a motor response (ie nondecision time Ter) That is
MRT MDT T= +
er
(8)
where MDT denotes mean decision timeGiven both v and a MDT can be determined from a
third equation which refers to the mean time until arrival at a response threshold4
MDTa
v
y
y=
minus ( )+ ( )2
1
1
exp
exp
(9)
where again y 5 vashys2 Given MDT we can now use Equation 8 to obtain Ter Thus the foregoing discussion
v P s
P P P P
= minus
( ) ( ) minussign
it it
c
c c2
c c1
2
log log loogitc c
P P
VRT
( ) + minus
1
2
1
4
(7)
10 Wagenmakers van der maas and grasman
shows how the EZ-diffusion model transforms MRT VRT and Pc to v a and Ter without any parameter fit-ting all that is needed to determine the parameters is a straightforward computation The Appendix contains R code (R Development Core Team 2004) that imple-ments the EZ-diffusion model
Conceptual Similarity to Signal Detection Analysis
The EZ-diffusion model is very similar to classical signal detection theory (see eg Green amp Swets 1966) in its aim scope and method Figure 5 highlights these similarities In fact the EZ-diffusion model can arguably be considered the response time analogue of signal detection theory5
As can be seen from Figure 5 signal detection theory takes hit rate and false alarm rate as input As output it produces unique values for discriminability (dprime) and bias ( β) The statistic dprime is a fixed property of the condition or the participant but β is under the control of the participant Conclusions regarding participant ability or task difficulty that are based solely on hit rates are suspect since the par-ticipant may change the response threshold β to increase hit rates at the expense of increasing false alarm rates
The EZ-diffusion model takes MRT VRT and Pc as input As output it produces unique values for drift rate (v) boundary separation (a) and nondecision time (Ter) The drift rate v is a fixed property of the condition or the participant but a is under the control of the participant Conclusions regarding participant ability or task difficulty that are based solely on MRT or VRT are suspect since the participant may here change the response threshold a to decrease MRT and VRT at the expense of decreasing Pc
PARAMeTeR ReCoveRy FoR THe ez-DIFFuSIon MoDeL
This section evaluates performance of the EZ-diffusion model in terms of the accuracy with which the model re-covers parameter values used to generate simulated data The Monte Carlo simulations show that the parameters recovered by the model are relatively close to their true values The variability of the recovered parameter values is acceptable and decreases with sample size Bias (ie systematic deviation from the true value) is virtually non-existent One of the main reasons why the EZ model is able to recover parameters accurately with only few data
RT Variance
Accuracy
EZ-Diusion
Dri RateBoundarySeparation
NondecisionTime
RT MeanHit Rate
Discriminability
False AlarmRate
Signal Detectioneory
Bias
Figure 5 Schematic representation of the similarity between a signal detection analysis and an ez-diffusion model analysis The circles at the bottom denote unobserved variables and the squares at the top denote observed variables RT response time
v P s
L L L
= minus
minus
signc
1
2
1
2
1
2
1 tanh sech22
2
2
L
VRT
1
4
eZ diffusion 11
is that the observed quantities of interest (ie MRT VRT and Pc) are estimated relatively efficiently
In the Monte Carlo simulations reported here we simu-lated an experiment with only one condition and a single participant The experiment had either 50 250 or 1000 observations6 Also drift rate v and boundary separation a could each take on one of three values (ie v P 01 02 03 a P 008 011 014) These values were combined to yield 3 3 5 9 separate sets of parameters that were used to generate simulated data These parameter values were chosen so as to span a wide range of plausible values (see Wagenmakers et al 2005) In the simulations Ter was fixed at 0300 This Ter value is arbitrary in the sense that it is an additive constant the value of which is determined by subtracting the mean decision time from MRT Thus if Ter had been fixed at 0250 the parameter recovery results would remain the same save for a constant 50-msec shift The scaling parameter s was fixed at 01 a convention that we adhere to throughout the article
Next each of the nine separate parameter combina-tions was used to generate 1000 different data sets For each data set MRT VRT and Pc were calculated and the EZ-diffusion model transformations were then applied
to yield estimates for v a and Ter Note that MRT and VRT were exclusively based on response times for correct decisions7
When the true values for drift rate v and boundary sepa-ration a are relatively large (eg v 5 03 and a 5 014) this may result in error-free performance When Pc 5 1 Equations 5 and 7 include the undefined term logit(1) The problem is similar to that of applying signal detection theory to a participant who has either a perfect hit rate or a zero false alarm ratemdashthis yields an estimate for d prime that is infinite Several solutions have been proposed to address this issue (see eg Macmillan amp Creelman 2004) Here we chose to apply one of the standard edge-correction methods replacing Pc 5 1 with a value that corresponds to one half of an errormdashthat is
P
nc= minus1
1
2
For example when n 5 50 and Pc 5 1 the replacement value for Pc is 99 but when n 5 250 the replacement value is 998
Figure 6 shows the results for the parameter recovery simulations with respect to drift rate v Each panel plots
50 250 1000
0
01
02
03
04
05
v = 01 a = 008
N
v
50 250 1000
0
01
02
03
04
05
v = 03 a = 008
N
v
50 250 1000
0
01
02
03
04
05
v = 02 a = 008
N
v
0
01
02
03
04
05
v
0
01
02
03
04
05
v
0
01
02
03
04
05
v
50 250 1000
v = 01 a = 011
N
50 250 1000
v = 03 a = 011
N
50 250 1000
v = 02 a = 011
N
0
01
02
03
04
05
v
0
01
02
03
04
05
v
0
01
02
03
04
05
v
50 250 1000
v = 01 a = 014
N
50 250 1000
v = 03 a = 014
N
50 250 1000
v = 02 a = 014
N
Figure 6 Drift rate parameter recovery for the ez-diffusion model each panel corresponds to a different combination of data-generating parameter values for v and a The data-generating values for drift rate are indicated by horizontal lines each box-plot is based on 1000 replications
12 Wagenmakers van der maas and grasman
three box-and-whisker plots one for each value of N P 50 250 1000 A box-and-whisker plot (Tukey 1977 pp 39ndash43) provides an efficient way to summarize an en-tire distribution in this case a distribution of recovered pa-rameter values The box extends from the 25 quantile to the 75 quantile and the dot in the middle of the box is the 50 quantile (ie the median) The whiskers extend to the far-thest points that are within 3shy2 times the height of the box
As can be seen from Figure 6 for all panels the me-dian of the recovered parameter values (ie the dots in the boxes) tends to coincide with the horizontal line that in-dicates the generative parameter value Hence parameter recovery for v is unbiased Also note that the whiskers gen-erally extend as far upward as they extend downward and the dots are in the middle of the boxes This means that the distributions of recovered parameter values are symmet-ric As is to be expected Figure 6 also clearly shows that the spread of the distributions decreases as N increases Upon close examination it appears that recovery of v is subject to more variability when boundary separation a is decreased or drift rate v is increased Thus in Figure 6 variability is highest when v 5 03 and a 5 008 (ie the leftmost bottom panel) and variability is lowest when v 5 01 and a 5 014 (ie the rightmost upper panel)
Figure 7 shows parameter recovery for the boundary separation parameter a Again the distributions are sym-metric there is little indication of any bias and the vari-ability decreases with N The variability of the distribution of recovered parameter values increases as the true value of a increasesmdashthat is variability increases as we move from the leftward panels to the rightward panels
Finally Figure 8 displays the Monte Carlo results for non-decision time Ter Again there is little evidence of any bias the distributions appear to be symmetric and variability decreases markedly with N The variability for Ter increases rather dramatically as boundary separation is increased and drift rate is decreased Hence variability in recovery for Ter is lowest for the v 5 03 a 5 008 leftmost bottom panel whereas it is highest for the v 5 01 a 5 014 rightmost top panel In other words variability in Ter 5 MRT MDT increases as MDT (ie mean decision time) lengthens
In sum the Monte Carlo simulations show that the EZ- diffusion model is able to recover the parameter values for v a and Ter with virtually no bias For N 5 50 the vari-ability in the parameter estimates is considerable How-ever it is important to note that this variability is based on a single participant contributing 50 observations In an experiment with multiple participants the mean of the in-
005
010
015
020v = 01 a = 008
a
50 250 1000
N
005
010
015
020v = 02 a = 008
a
50 250 1000
N
005
010
015
020v = 03 a = 008
a
50 250 1000
N
005
010
015
020
a
005
010
015
020
a
005
010
015
020
a
v = 01 a = 011
50 250 1000
N
v = 02 a = 011
50 250 1000
N
v = 03 a = 011
50 250 1000
N
005
010
015
020
a
005
010
015
020
a
005
010
015
020
a
v = 01 a = 014
50 250 1000
N
v = 02 a = 014
50 250 1000
N
v = 03 a = 014
50 250 1000
N
Figure 7 Boundary separation parameter recovery for the ez-diffusion model each panel cor-responds to a different combination of data-generating parameter values for v and a The data- generating values for boundary separation are indicated by horizontal lines each box-plot is based on 1000 replications
eZ diffusion 13
dividual parameters will obviously be much less variable than any individual parameter In practical applications the variability of the obtained parameter values can always be assessed by sampling the observed data with replace-ment (ie the nonparametric bootstrap see eg Efron amp Tibshirani 1993) For N 5 250 and N 5 1000 the vari-ability is low even for a single participant
RoBuSTneSS To MISSPeCIFICATIon
The previous section demonstrated that the EZ-diffusion method adequately recovers its parameter values It is an open question however how well the model performs when the data-generating mechanism is different from the one that the EZ-diffusion model assumes For instance the EZ-diffusion model assumes that there is no variabil-ity across trials in any of the diffusion model parameters That is the EZ-diffusion model assumes no across-trials variability in nondecision time (ie st 5 0) starting point (ie sz 5 0) and drift rate (ie η 5 0)
In this section we focus on three situations in which the EZ-diffusion model is ldquomisspecifiedrdquo First we con-sider a data-generating mechanism that has a considerable
amount of across-trials variability in nondecision time Next we evaluate parameter recovery performance of the EZ-diffusion model in the case in which across-trials vari-ability in drift rate is very high and across-trials variability in starting point is relatively low Finally we consider the reverse situation in which across-trials variability in drift rate is relatively low and across-trials variability in starting point is relatively high The latter two situations closely re-semble those examined by Ratcliff and Tuerlinckx (2002)
In each of the three misspecification analyses reported here data were generated using three values of drift rate v P 01 02 03 Boundary separation a was fixed at a medium value of 011 and nondecision time Ter was fixed at 0300 This yielded three different sets of parameter values Next each set of parameter values was used to generate 3000 data sets 1000 data sets with 50 observa-tions each 1000 data sets with 250 observations each and 1000 data sets with 1000 observations each EZ- diffusion parameters were calculated for each data set
Across-Trials variability in nondecision TimeIn the first Monte Carlo simulation the misspecification
refers to the presence of across-trials variability in nondeci-
50 250 1000
015020025030035040045
v = 01 a = 008
N
Ter
Ter
Ter
50 250 1000
015020025030035040045
v = 02 a = 008
N
50 250 1000
015020025030035040045
v = 03 a = 008
N
015020025030035040045
Ter
Ter
Ter
015020025030035040045
015020025030035040045
50 250 1000
v = 01 a = 011
N
50 250 1000
v = 02 a = 011
N
50 250 1000
v = 03 a = 011
N
015020025030035040045
Ter
Ter
Ter
015020025030035040045
015020025030035040045
50 250 1000
v = 01 a = 014
N
50 250 1000
v = 02 a = 014
N
50 250 1000
v = 03 a = 014
N
Figure 8 nondecision time parameter recovery for the ez-diffusion model each panel cor-responds to a different combination of data-generating parameter values for v and a The data- generating value for boundary separation was fixed at Ter 0300 and is indicated by horizontal lines each box-plot is based on 1000 replications
14 Wagenmakers van der maas and grasman
sion time The range of the uniform distribution on Ter was set at 02 sec which is at the high end of what is found in empirical research (see eg Ratcliff Gomez amp McKoon 2004 Ratcliff amp Tuerlinckx 2002 p 467 see Figure 2 above bottom right panel) Figure 9 shows the results of the parameter recovery analysis using box-and-whisker plots Panels in the top middle and bottom rows were generated using v 5 01 v 5 02 and v 5 03 respectively The hori-zontal lines indicate the true parameter values
The panels in the first column of Figure 9 show that the estimation of drift rate remains relatively unaffected by across-trials variability in Ter The values are recovered with little bias and the variability is not much increased relative to the situation in which st 5 0 (see Figure 6) The panels in the second column show that boundary separa-tion is somewhat overestimated especially for high values of drift rate Finally panels in the third column reveal that nondecision time is somewhat underestimated and this
bias increases with drift rate Overall the parameter val-ues are relatively robust against across-trials variability in nondecision time
Across-Trials variability in Drift RateIn the second misspecification analysis we examined
the case of large across-trials variability in drift rate (ie normal standard deviation η 5 016) and much smaller across-trials variability in starting point (ie range of a uniform distribution sz 5 002) Note that the extent of across-trials variability in η is rather extreme in empirical work η is usually smaller (Ratcliff amp Tuerlinckx 2002 see Figure 2 above bottom left panel)
Figure 10 shows the results As in the previous figure panels in the top middle and bottom rows were generated using v 5 01 v 5 02 and v 5 03 respectively It is evi-dent from Figure 10 that the inclusion of a large amount of across-trials variability in drift rate leads to a systematic
50 250 1000
0
01
02
03
04
05
Drift Rate v
N
v
50 250 1000
0
01
02
03
04
05
Drift Rate v
N
v
50 250 1000
0
01
02
03
04
05
Drift Rate v
N
v
50 250 1000
005
010
015
020
Boundary Separation a
N
a
50 250 1000
005
010
015
020
Boundary Separation a
N
a
50 250 1000
005
010
015
020
Boundary Separation a
N
a
50 250 1000
015020025030035040045
Nondecision Time Ter
N
Ter
50 250 1000
015020025030035040045
Nondecision Time Ter
N
Ter
50 250 1000
015020025030035040045
Nondecision Time Ter
N
Ter
Figure 9 Parameter recovery for the ez-diffusion model under misspecification with the data-generating process affected by across-trials variability in nondecision time The uniform distribu-tion of nondecision time has a range of 0200 sec which is at the extreme end of what is observed in practice (Ratcliff amp Tuerlinckx 2002) Boundary separation a was fixed at an intermediate value of 011 and the mean of the nondecision time Ter was fixed at 0300 Panels in the top middle and bottom rows were generated using drift rate values of 01 02 and 03 respectively Data-generating parameter values are indicated by horizontal lines each box-plot is based on 1000 replications
eZ diffusion 15
underestimation of all three parameters This bias is not very pronounced for boundary separation (middle column) and nondecision time (right column) but it is quite sub-stantial for drift rate (left column) This drift rate bias is not affected by the number of observations Although the bias is tolerable for v 5 01 it increases with the estimand and when v 5 03 the bias is a sizable 07 In sum a substantial amount of across-trials variability in drift rate leads to un-derestimation of all EZ parameters This underestimation is particularly pronounced for high values of drift rate
Across-Trials variability in Starting PointA third misspecification analysis was done for the case
in which across-trials variability in drift rate is relatively low (ie η 5 008) whereas across-trials variability in starting point is relatively high (ie sz 5 007 see Fig-ure 2 bottom middle panel) Figure 11 shows that the re-sults are remarkably similar to those of Figure 10 Adding
the across-trials variabilities leads to an underestimation of all parameters and this effect is particularly pronounced for high values of the drift rate parameter (ie the leftmost bottom panel) When v 5 03 the bias is a sizeable 055
Overall the misspecification analyses have shown that for the parameter values under consideration the EZ- diffusion method is fairly robust to across-trials variability in nondecision time With large across-trials variabilities in drift rate and starting point however all parameters are systematically underestimated This underestimation is particularly pronounced for high values of drift rate
These results mean that when the EZ-diffusion model is applied to experimental data its estimates for drift rate may turn out to be somewhat lower than those of the Rat-cliff diffusion model The empirical data presented later support this assertion Although the correlations between the EZ parameters and the parameters of the Ratcliff dif-fusion model are generally quite high the values for drift
50 250 1000
50 250 1000
50 250 1000
0
01
02
03
04
05
Drift Rate v
N
v
0
01
02
03
04
05
Drift Rate v
N
v
0
01
02
03
04
05
Drift Rate v
N
v
50 250 1000
50 250 1000
50 250 1000
005
010
015
020
Boundary Separation a
N
a
005
010
015
020
N
a
005
010
015
020
Boundary Separation a
N
a
Boundary Separation a
50 250 1000
50 250 1000
50 250 1000
015020025030035040045
Nondecision Time Ter
N
Ter
015020025030035040045
N
Ter
015020025030035040045
Nondecision Time Ter
N
Ter
Nondecision Time Ter
Figure 10 Parameter recovery for the ez-diffusion model under misspecification with the data-generating process affected by high across-trials variability in drift rate (ie η 016) and low across-trials variability in starting point (ie sz 002) The value for η is at the extreme end of what is observed in practice (Ratcliff amp Tuerlinckx 2002) Boundary separation a was fixed at an intermediate value of 011 and the mean of the nondecision time Ter was fixed at 0300 Panels in the top middle and bottom rows were generated using drift rate values of 01 02 and 03 respectively Data-generating parameter values are indicated by horizontal lines each box-plot is based on 1000 replications
16 Wagenmakers van der maas and grasman
rate are systematically lower for the EZ-diffusion model This effect is magnified for high values of drift rate as our simulations anticipate
Three ez Checks for MisspecificationIn practical applications the assumptions of the EZ-
diffusion model may be violated Depending on the nature and the seriousness of the violation the results from the EZ-diffusion model should be interpreted with caution or the model should not be applied at all In order to test whether the EZ-diffusion model is misspecified we sug-gest carrying out the following three simple checks Each check tests a prediction of the model that follows from one of its implicit assumptions
Check the shape of the RT distributions The EZ model should be applied only to RT data that show at least some amount of right skew In addition the skew should become more pronounced as task difficulty increases Fortunately
these regularities are present in the wide majority of data sets (see Ratcliff 2002) If the data are not skewed to the right or if the skew does not increase with task difficulty application of the EZ-diffusion model is inappropriate A statistical test for skewness was proposed by DrsquoAgostino (1970)8
Check the relative speed of error responses As mentioned above the EZ-diffusion model predicts that the RT distri-butions of correct and error responses are identical When the starting point is equidistant from the response boundar-ies fast error responses come about through across-trials variability in starting point and slow error responses come about through across-trials variability in drift rate Fast or slow errors therefore indicate the presence of across-tri-als variability in starting point or drift rate respectively As shown above the EZ-diffusion model ignores the across-trials variabilities and this leads to an underestimation of all parameters in particular drift rate Standard parametric and
Figure 11 Parameter recovery for the ez-diffusion model under misspecification with the data-generating process affected by low across-trials variability in drift rate (ie η 008) and high across-trials variability in starting point (ie sz 007) The value for sz is at the extreme end of what is observed in practice (Ratcliff amp Tuerlinckx 2002) Boundary separation a was fixed at an intermediate value of 011 and the mean of the nondecision time Ter was fixed at 0300 Panels in the top middle and bottom rows were generated using drift rate values of 01 02 and 03 respectively Data-generating parameter values are indicated by horizontal lines each box-plot is based on 1000 replications
50 250 1000
50 250 1000
50 250 1000
50 250 1000
50 250 1000
50 250 1000
50 250 1000
50 250 1000
50 250 1000
0
01
02
03
04
05
Drift Rate v
N
v
0
01
02
03
04
05
Drift Rate v
N
v
0
01
02
03
04
05
Drift Rate v
N
v
005
010
015
020
Boundary Separation a
N
a
005
010
015
020
N
a
005
010
015
020
Boundary Separation a
N
a
Boundary Separation a
015020025030035040045
Nondecision Time Ter
N
Ter
015020025030035040045
N
Ter
015020025030035040045
Nondecision Time Ter
N
Ter
Nondecision Time Ter
eZ diffusion 17
nonparametric tests may be used to check whether errors are systematically faster or slower than correct responses
Check whether the starting point is unbiased The pres-ent version of the EZ-diffusion model assumes that the two stimulus categories in a two-alternative response time task are a priori equally attractive This means that the starting point z is equidistant from the two response boundariesmdashthat is z 5 ashy2 In many situations this simplification may be acceptable (see Figure 3) In other situations (eg when experimental manipulations include differential payoffs or different presentation rates) the EZ assumption that z 5 ashy2 is almost surely violated and the model should then be applied only with extreme caution In order to check whether or not the data show evidence of a bias in start-ing point one can compare the relative speed of correct and error responses for the different stimulus categories When participants have an a priori bias that favors Catego-ry A over Category B correct responses should be faster than error responses for Category A stimuli whereas cor-rect responses should be slower than error responses for Category B stimuli As a statistical test one can first de-termine whether or not stimulus category interacts with re-sponse correctness and then plot the mean RTs to visually judge whether the interaction crosses over in such a way that errors are fast for one stimulus category and slow for the other
APPLICATIon To An exPeRIMenT on PeRCePTuAL DISCRIMInATIon
One of the most convincing ways to show that the EZ- diffusion model presents a reasonable alternative to the Ratcliff diffusion model is to compare the parameter es-timates for both models on a set of empirical data Here we consider data from a perceptual discrimination experi-ment (Meevis Luth vom Kothen Koomen amp Verouden 2005) to which we fit both the EZ model and the Ratcliff model on a participant-by-participant basis
The task of each participant was to indicate as quickly as possible without making errors which of two vertical line segments was longer The line segments were presented side by side and were joined by a horizontal line either at the top or at the bottom The 100-msec presentation of the line segments was terminated by the presentation of a mask Task difficulty was manipulated on three levels (ie easy medium and difficult) by varying the difference in length between the vertical line segments In the easy me-dium and difficult conditions the length difference was 2 4 and 6 mm respectively
Eighty-eight university students completed an 18-trial practice block followed by a total of 1992 experimen-tal trials in two blocks (ie 1992shy3 5 664 trials for each level of difficulty) Twelve participants had an excessive number of fast guesses (ie over 100 trials with response times below 250 msec) and these participants were ex-cluded from the analysis Their exclusion did not affect the qualitative pattern of results Thus the EZ-diffusion model and the Ratcliff diffusion model were applied to the data from N 5 76 participants9 The EZ-diffusion model was then used to determine v a and Ter for each partici-
pant and each difficulty level separately yielding 76 3 5 228 sets of parameter values The Ratcliff diffusion model was likewise used to determine v a and Ter10 The EZ-diffusion model parameters were used as starting val-ues for the Ratcliff diffusion model fitting routine
Figure 12 shows that the EZ parameters correlate quite highly with parameter estimates obtained using the Ratcliff diffusion model Averaged across all nine panels the corre-lation is 867 In the panels that correspond to drift rate and boundary separation the slope of the best-fitting line is de-cidedly smaller than 1 This indicates that the EZ-diffusion estimates are lower than those of the Ratcliff diffusion model For drift rate this effect is most pronounced for high drift rates as is evident from the flattening that occurs in the panels corresponding to the easy and medium conditions As mentioned earlier this effect may well be due to the fact that the Ratcliff diffusion model has three variability param-eters that soak up some of the variance that the EZ-diffusion model attributes to drift rate and boundary separation
To verify that the implicit assumptions of the EZ- diffusion model had been met the EZ checks were carried out for all 76 participants and all 3 difficulty levels result-ing in 228 statistical comparisons for each check The first check used the DrsquoAgostino test for skewness (DrsquoAgostino 1970) and confirmed that the RT distributions were clearly right-skewed The results from the second and third checks were more ambiguous The second check used the ANOVA procedure to test whether correct responses were as fast as error responses Without any correction for multiple test-ing and an alpha level of 05 14 out of 76 participants failed this test for all three levels of difficulty The majority of the participants failed this test for at least one level of difficulty For some of the participants errors were sys-tematically faster than correct responses and for others errors were systematically slower than correct responses After the Bonferroni correction was applied and the alpha level consequently reduced to 05shy228 5 0002 6 partici-pants still failed the test for all three levels of difficulty and 19 failed the test for at least one level of difficulty These results suggest that there might have been substan-tial across-trials variability in starting point and drift rate at least for some of the participants
The third check used the ANOVA procedure to test whether errors were fast for one stimulus category and slow for the other since this pattern is indicative of a bias in starting point (ie z ashy2) If the starting point is bi-ased one would expect the interaction between stimulus category and response correctness to be present for all three difficulty levels Without any correction for multiple testing and an alpha level of 05 6 out of 76 participants showed a significant crossover interaction for at least two of the levels of difficulty Twenty-two participants showed at least one significant crossover interaction After applying the Bonferroni correction none of the participants showed the crossover interaction for at least two levels of difficulty and only 2 out of 76 showed at least one significant cross-over interaction These results suggest that some partici-pants might have had a bias in starting point Exclusion of the participants that failed the second or third EZ checks did not greatly influence the pattern of correlations
18 Wagenmakers van der maas and grasman
In sum the parameter values as determined by the EZ- diffusion model correlate highly with those estimated by the diffusion model Despite this high correlation the EZ- diffusion model systematically yields estimates of drift rate and boundary separation that are lower than those of the Ratcliff diffusion model For the drift rate parameter this effect is most pronounced when drift rate is high
DISCuSSIon
In the context of psychometric testing Dennis and Evans state that ldquoit is important to recognize that there is no lsquomagic formularsquo which will solve the problem of
different individuals adopting different speedndashaccuracy compromises by collapsing the two measures into a sin-gle number representing abilityrdquo (Dennis amp Evans 1996 p 123) The aim of the present article was to present just such a formula for the kinds of speeded two-choice tasks that have been popular in experimental psychology for decades The EZ-diffusion model does not just compute a measure of ability or information uptake (ie drift rate) it also yields measures for response conservativeness (ie boundary separation) and nondecision time (for ap-proaches with a similar focus see Balakrishnan Buse-meyer MacDonald amp Lin 2002 Palmer et al 2005 Reeves Santhi amp Decaro 2005)
Thus the EZ-diffusion model transforms the observed variables to three unobserved variables so that statistical inference can be performed on the latent rather than on the observed variables The advantages of operating on the level of latent variables is that each variable has a clear psychological interpretationmdashin contrast the traditional method of analysis considers both response speed and re-sponse accuracy but is at a loss as to how to combine these measures The conceptual advantages of the EZ-diffusion model are illustrated by Table 2 which shows the latent variables for the data from Table 1 presented at the start of this article
Table 2 Performance of the 4 Participants From Table 1 in Terms
of ez-Diffusion Model Parameters
Participant
Drift Rate
Boundary Separation
Nondecision Time
George 025 012 0300Rich 025 012 0250Amy 025 008 0300Mark 025 008 0250
NotemdashParticipants differed in terms of response conservativeness and nondecision time but not in terms of efficiency of stimulus processing See the text for details
0 04 08
0
02
04
06
08
10
Easy
v Full Model
v E
Z M
od
el
r = 907
020 030 040 050
025020
030035040045050
Easy
Ter Full Model
T er
EZ M
od
el
r = 812
Easy
a Full Model
a E
Z M
od
el r = 708
006 010 014
006
008
010
012
014
0 04 08
0
02
04
06
08
10
v E
Z M
od
el
020 030 040 050
025020
030035040045050
T er E
Z M
od
ela
EZ
Mo
del
006 010 014
006
008
010
012
014
r = 857
r = 924
r = 873
Medium
v Full Model
Medium
Ter Full Model
Medium
a Full Model
0 04 08
0
02
04
06
08
10
v E
Z M
od
el
020 030 040 050
025020
030035040045050
T er E
Z M
od
ela
EZ
Mo
del
006 010 014
006
008
010
012
014
Difficult
v Full Model
Difficult
Ter Full Model
r = 889
r = 936
Difficult
r = 897
a Full Model
Figure 12 Parameter estimates of the Ratcliff diffusion model and the ez-diffusion model for a two-choice perceptual discrimination experiment (N 76) featuring three difficulty levels
eZ diffusion 19
From the EZ parameters in Table 2 it is immediately clear that information uptake (ie drift rate) is the same for all par-ticipants The reason that George responds relatively slowly is because he is cautious not to make errors (ie boundary separation a 5 012) and has a relatively long nondecision time (ie Ter 5 0300) Mark the fastest responder is the op-posite of George in that Mark is a risky decision maker (ie a 5 008) who has relatively short nondecision time Amy and Rich differ from each other in that Amy is less cautious than Rich but Rich has a shorter nondecision time These kinds of psychologically meaningful conclusions can never be derived by the standard analysis of two-choice tasks
A Cautionary note on Transformations and Falsifiability
A considerable practical advantage of the EZ-diffusion model is that it does not require any fitting The EZ equa-tions simply transform the observed quantities of MRT VRT and Pc to the unobserved quantities of drift rate boundary separation and nondecision time This practi-cal advantage however does come at a theoretical cost That is the EZ equations will do their job regardless of whether or not the EZ model is appropriate to the situa-tion at hand For instance the data under consideration could be uniformly distributed left-skewed or even multi-modal In these cases it is almost certain that the data do not originate from a diffusion process with absorbing boundaries as shown in Figure 4
Despite the fact that the EZ model is not appropriate for say multimodal distributions the EZ transformation will nevertheless return estimated values of drift rate bound-ary separation and nondecision time Consequently these estimated values may very well lead to conclusions that are unwarranted It should always be kept in mind that the EZ-diffusion transformation is only appropriate when the implicit assumptions of the EZ-diffusion model are met In sum the EZ-diffusion model cannot be falsified on the basis of a poor fit to the data It will always produce a perfect fit to the data since it simply transforms the ob-served variables to unobserved variables without any loss of information (see Figure 5)
What this means is that some attention should be paid to the underlying assumptions of the EZ-diffusion model when applying it to data For instance both the EZ- and Ratcliff diffusion models are currently limited to tasks that require only a single process for their completion That is the present model should not be applied to tasks such as the Eriksen flanker task (Eriksen amp Eriksen 1974) in which one process may correspond to information accumulation from the target arrow and another process may correspond to information accumulation from the distractor arrows We strongly recommend that the three EZ checks for mis-specification mentioned earlier (ie check the shape of the RT distributions check the relative speed of error re-sponses and check whether the starting point is unbiased) be carried out when the model is applied to data
Future Directions and extensionsThe EZ-diffusion model described here can be extended
in several ways First and foremost the current ldquovanillardquo
version of the EZ-diffusion model assumes that both stimulus alternatives are equally preferable a priorimdashthat is that z 5 ashy2 However it is possible to extend the EZ- diffusion model to handle biased starting pointsmdashthat is cases for which z ashy2 Consider again the lexical deci-sion task and assume that we need to estimate a number of variables drift rate for word stimuli vw drift rate for non-word stimuli vnw boundary separation a starting point z nondecision time for word stimuli Terw and nondecision time for nonword stimuli Ternw These six parameters can be obtained by transformation from the six observed vari-ables MRTw MRTnw VRTw VRTnw Pcw and Pcnw
Second the present version of the EZ-diffusion model does not allow parameters to be constrained across condi-tions This may be desirable for several reasons Consider for instance an experiment designed to compare task per-formance of young adults with that of older adults The hy-pothesis that the locus of the aging effect is in the efficiency of information processing corresponds to an EZ-diffusion model in which only drift rate is free to vary between the age groups A rival hypothesis may entail that the locus of the aging effect is in response conservativeness and this cor-responds to an EZ-diffusion model in which only boundary separation is free to vary between the age groups
When parameters are constrained across experimen-tal conditions or groups of participants the number of observed variables becomes larger than the number of unobserved parameters and this necessitates the use of model fitting This fitting procedure requires that the lack of fit for MRT VRT and Pc be weighted for in-stance by the precision with which these quantities are estimated (ie weighted least squares Seber amp Lee 2003) Once parameters have been constrained and their optimal values determined by the weighted least-squares model-fitting procedure the model selection issue be-comes prominent again Which model is better the one in which the effect of age is attributed to differences in information uptake or the one in which the age effect is due to differences in response conservativeness For the EZ-diffusion model an attractive model selection procedure would be to use split-half cross-validation (see eg Browne 2000) That is the parameters of the model could be determined by fitting one half of the data set These particular parameter estimates could then be used to assess the prediction error for the second half of the data set The model with the lowest prediction error would be preferred
ez Diffusion or Ratcliff DiffusionThe EZ-diffusion model is a considerable simplifica-
tion of the Ratcliff diffusion model This is both good and bad One of the advantages of using a simple model is that the results are more readily interpretablemdashhence more easily communicated to other researchers Another advan-tage is that simple models are easily implemented Fur-thermore simple models such as the EZ-diffusion model can be applied to very large data sets in a matter of sec-onds Finally simple models are less prone to overfitting (ie modeling noise) and may therefore yield relatively low prediction errors to unseen data from the same source
20 Wagenmakers van der maas and grasman
ematical Psychology Memphis Tennessee (August 2005) We thank Andrew Heathcote and Francis Tuerlinckx for making their diffusion model fitting routines available to us Correspondence concerning this article may be addressed to E-J Wagenmakers Department of Psychol-ogy University of Amsterdam Roetersstraat 15 1018 WB Amsterdam The Netherlands (e-mail ewagenmakersfmguvanl)
ReFeRenCeS
Balakrishnan J D Busemeyer J R MacDonald J A amp Lin A (2002) Dynamic signal detection theory The next logical step in the evolution of signal detection analysis (Cognitive Science Tech Rep No 248) Bloomington Indiana University Cognitive Science Program
Batchelder W H (1998) Multinomial processing tree models and psychological assessment Psychological Assessment 10 331-344
Batchelder W H amp Riefer D M (1999) Theoretical and empirical review of multinomial process tree modeling Psychonomic Bulletin amp Review 6 57-86
Botvinick M M Braver T S Barch D M Carter C S amp Cohen J D (2001) Conflict monitoring and cognitive control Psy-chological Review 108 624-652
Box G E P (1979) Robustness in scientific model building In R L Launer amp G N Wilkinson (Eds) Robustness in statistics (pp 201-236) New York Academic Press
Browne M W (2000) Cross-validation methods Journal of Math-ematical Psychology 44 108-132
Busemeyer J R amp Stout J C (2002) A contribution of cognitive decision models to clinical assessment Decomposing performance on the Bechara gambling task Psychological Assessment 14 253-262
Cox D R amp Miller H D (1970) The theory of stochastic processes London Methuen
DrsquoAgostino R B (1970) Transformation to normality of the null dis-tribution of g1 Biometrika 57 679-681
Dennis I amp Evans J B T (1996) The speedndasherror trade-off problem in psychometric testing British Journal of Psychology 87 105-129
Diederich A amp Busemeyer J R (2003) Simple matrix methods for analyzing diffusion models of choice probability choice response time and simple response time Journal of Mathematical Psychology 47 304-322
Efron B amp Tibshirani R J (1993) An introduction to the bootstrap New York Chapman amp Hall
Emerson P L (1970) Simple reaction time with Markovian evolution of Gaussian discriminal processes Psychometrika 35 99-109
Eriksen B A amp Eriksen C W (1974) Effects of noise letters upon the identification of a target letter in a nonsearch task Perception amp Psychophysics 16 143-149
Gardiner C W (2004) Handbook of stochastic methods (3rd ed) Berlin Springer
Gilden D L (2001) Cognitive emissions of 1shyf noise Psychological Review 108 33-56
Green D M amp Swets J A (1966) Signal detection theory and psy-chophysics New York Wiley
Honerkamp J (1994) Stochastic dynamical systems Concepts nu-merical methods data analysis (K Lindenberg Trans) New York VCH
Hultsch D F MacDonald S W S amp Dixon R A (2002) Vari-ability in reaction time performance of younger and older adults Jour-nals of Gerontology 57B P101-P115
Jones A D Cho R Y Nystrom L E Cohen J D amp Braver T S (2002) A computational model of anterior cingulate function in speeded response tasks Effects of frequency sequence and conflict Cognitive Affective amp Behavioral Neuroscience 2 300-317
Laming D R J (1968) Information theory of choice-reaction times London Academic Press
Laming D R J (1973) Mathematical psychology London Academic Press
Li S-C (2002) Connecting the many levels and facets of cognitive aging Current Directions in Psychological Science 11 38-43
Link S W (1992) The wave theory of difference and similarity Hills-dale NJ Erlbaum
Link S W amp Heath R A (1975) A sequential theory of psychologi-cal discrimination Psychometrika 40 77-105
(see eg Myung Forster amp Browne 2000 Wagenmak-ers amp Waldorp 2006)
A disadvantage of a simple model such as the EZ model is that it may not capture all aspects of reality that one might consider important For instance with the starting point equidistant from the response boundaries and no across-trials variability in drift rate the diffusion model predicts that the RT distribution for correct responses is identical to the one for error responses Empirical work has shown that this is not always the case errors can be systematically faster or systematically slower than correct responses (see eg Ratcliff amp Rouder 1998) In contrast to the EZ-diffusion model the Ratcliff diffusion model provides an elegant account of the relative speed of errors versus correct responses
In this context it is important to realize that the Rat-cliff diffusion model is also a simplification of a dif-fusion process with even more variables For instance the current mainstream version of the model (see eg Ratcliff amp Tuerlinckx 2002) falsely assumes the absence of sequential effects (ie repetitions vs alternations of stimuli see Luce 1986 pp 253ndash271) and serial corre-lations (see eg Gilden 2001 but see Wagenmakers Farrell amp Ratcliff 2004) Furthermore the Ratcliff dif-fusion model does not assume any across-trials variabil-ity in boundary separation despite the fact that it is very unlikely that participants are equally cautious on every trial of an experiment Finally the diffusion model does not have a control structure that is able to set keep track of and adjust the boundary separation parameter (see Botvinick Braver Barch Carter amp Cohen 2001 Jones Cho Nystrom Cohen amp Braver 2002 Vickers amp Lee 1998)
At this point it is useful to recall George Boxrsquos famous adage ldquoAll models are wrong but some are usefulrdquo (Box 1979 p 202) The EZ-diffusion model is certainly useful in that it estimates the three most important unobserved variables of the Ratcliff diffusion model with minimal demands regarding the amount of data and the level of mathematical sophistication of the researcher
In sum the EZ-diffusion model cannot and should not replace the Ratcliff diffusion model in the same way that the US ldquoEZrdquo tax forms cannot and should not replace the more elaborate tax forms The choice of whether to apply the EZ-diffusion model or the Ratcliff diffusion model may therefore be determined to a large extent by the spe-cific aim of the researcher When the aim is to precisely describe the RT distributions or to study the relation be-tween correct and error response times the Ratcliff dif-fusion model is obviously the right choice When the aim is to address the speedndashaccuracy trade-off and estimate unobserved variables such as nondecision time drift rate and boundary separation the EZ-diffusion model presents an attractive alternative
AuTHoR noTe
This research was funded by a VENI grant from the Dutch Organiza-tion for Scientific Research (NWO) Part of this work was presented at the 4th Annual Summer Interdisciplinary Conference Brianccedilon France (July 2005) and at the 38th Annual Meeting of the Society for Math-
eZ diffusion 21
Luce R D (1986) Response times Their role in inferring elementary mental organization New York Oxford University Press
MacDonald S W S Hultsch D F amp Dixon R A (2003) Perfor-mance variability is related to change in cognition Evidence from the Victoria longitudinal study Psychology amp Aging 18 510-523
Macmillan N amp Creelman C D (2004) Detection theory A userrsquos guide (2nd ed) Mahwah NJ Erlbaum
Meevis M Luth I vom Kothen L Koomen A amp Verouden J (2005) IQ en reactiesnelheid Een experiment en een wiskundige analyse (Tech Rep) Amsterdam University of Amsterdam
Myung I J Forster M R amp Browne M W (eds) (2000) Model selection [Special issue] Journal of Mathematical Psychology 44(1)
Oberauer K (2005) Binding and inhibition in working memory In-dividual and age differences in short-term recognition Journal of Ex-perimental Psychology General 134 368-387
Pachella R G (1974) The interpretation of reaction time in information- processing research In B H Kantowitz (Ed) Human information processing Tutorials in performance and cognition (pp 41-82) Po-tomac MD Erlbaum
Palmer J Huk A C amp Shadlen M N (2005) The effect of stimu-lus strength on the speed and accuracy of a perceptual decision Jour-nal of Vision 5 376-404
Pew R W (1969) The speedndashaccuracy operating characteristic Acta Psychologica 30 16-26
Ratcliff R (1978) A theory of memory retrieval Psychological Re-view 85 59-108
Ratcliff R (1981) A theory of order relations in perceptual matching Psychological Review 88 552-572
Ratcliff R (2002) A diffusion model account of response time and accuracy in a brightness discrimination task Fitting real data and fail-ing to fit fake but plausible data Psychonomic Bulletin amp Review 9 278-291
Ratcliff R Gomez P amp McKoon G (2004) A diffusion model account of the lexical decision task Psychological Review 111 159-182
Ratcliff R amp Rouder J N (1998) Modeling response times for two-choice decisions Psychological Science 9 347-356
Ratcliff R amp Rouder J N (2000) A diffusion model account of masking in two-choice letter identification Journal of Experimental Psychology Human Perception amp Performance 26 127-140
Ratcliff R amp Smith P L (2004) A comparison of sequential sam-pling models for two-choice reaction time Psychological Review 111 333-367
Ratcliff R Thapar A Gomez P amp McKoon G (2004) A diffu-sion model analysis of the effects of aging in the lexical-decision task Psychology amp Aging 19 278-289
Ratcliff R Thapar A amp McKoon G (2001) The effects of aging on reaction time in a signal detection task Psychology amp Aging 16 323-341
Ratcliff R Thapar A amp McKoon G (2004) A diffusion model analysis of the effects of aging on recognition memory Journal of Memory amp Language 50 408-424
Ratcliff R amp Tuerlinckx F (2002) Estimating parameters of the dif-fusion model Approaches to dealing with contaminant reaction times and parameter variability Psychonomic Bulletin amp Review 9 438-481
Ratcliff R Van Zandt T amp McKoon G (1999) Connectionist and diffusion models of reaction time Psychological Review 102 261-300
R Development Core Team (2004) R A language and environment for statistical computing Vienna Author
Reeves A Santhi N amp Decaro S (2005) A random-ray model for speed and accuracy in perceptual experiments Spatial Vision 18 73-83
Riefer D M Knapp B R Batchelder W H Bamber D amp Manifold V (2002) Cognitive psychometrics Assessing storage and retrieval deficits in special populations with multinomial process-ing tree models Psychological Assessment 14 184-201
Rouder J N amp Lu J (2005) An introduction to Bayesian hierarchical models with an application in the theory of signal detection Psycho-nomic Bulletin amp Review 12 573-604
Rouder J N Lu J Speckman P Sun D amp Jiang Y (2005) A
hierarchical model for estimating response time distributions Psycho-nomic Bulletin amp Review 12 195-223
Schouten J F amp Bekker J A M (1967) Reaction time and accu-racy Acta Psychologica 27 143-153
Seber G A F amp Lee A J (2003) Linear regression analysis (2nd ed) Hoboken NJ Wiley
Shammi P Bosman E amp Stuss D T (1998) Aging and variability in performance Aging Neuropsychology amp Cognition 5 1-13
Slifkin A B amp Newell K M (1998) Is variability in human perfor-mance a reflection of system noise Current Directions in Psychologi-cal Science 7 170-177
Smith P L (2000) Stochastic dynamic models of response time and accuracy A foundational primer Journal of Mathematical Psychol-ogy 44 408-463
Stone M (1960) Models for choice-reaction time Psychometrika 25 251-260
Stout J C Busemeyer J R Lin A Grant S J amp Bonson K R (2004) Cognitive modeling analysis of decision-making processes in cocaine abusers Psychonomic Bulletin amp Review 11 742-747
Townsend J T amp Ashby F G (1983) The stochastic modeling of el-ementary psychological processes Cambridge Cambridge University Press
Tuerlinckx F (2004) The efficient computation of the cumulative dis-tribution and probability density functions in the diffusion model Be-havior Research Methods Instruments amp Computers 36 702-716
Tukey J W (1977) Explanatory data analysis Reading MA Addison-Wesley
Van Zandt T Colonius H amp Proctor R W (2000) A compari-son of two response time models applied to perceptual matching Psy-chonomic Bulletin amp Review 7 208-256
Vickers D amp Lee M D (1998) Dynamic models of simple judg-ments I Properties of a self-regulating accumulator module Nonlin-ear Dynamics Psychology amp Life Sciences 2 169-194
Voss A Rothermund K amp Voss J (2004) Interpreting the param-eters of the diffusion model An empirical validation Memory amp Cog-nition 32 1206-1220
Wagenmakers E-J Farrell S amp Ratcliff R (2004) Estimation and interpretation of 1shyf α noise in human cognition Psychonomic Bulletin amp Review 11 579-615
Wagenmakers E-J Grasman R P P P amp Molenaar P C M (2005) On the relation between the mean and the variance of a dif-fusion model response time distribution Journal of Mathematical Psychology 49 195-204
Wagenmakers E-J amp Waldorp L (eds) (2006) Model selection Theoretical developments and applications [Special issue] Journal of Mathematical Psychology 50(2)
Wickelgren W A (1977) Speedndashaccuracy trade-off and information processing dynamics Acta Psychologica 41 67-85
Zaki S R amp Nosofsky R M (2001) Exemplar accounts of blending and distinctiveness effects in perceptual oldndashnew recognition Journal of Experimental Psychology Learning Memory amp Cognition 27 1022-1041
noTeS
1 Recently Ratcliff and Tuerlinckx (2002) proposed parameter num-ber eight which is the probability of an RT ldquocontaminantrdquo The inclusion of this parameter can improve the fit of the model but in many applica-tions the estimated percentage of contaminants is relatively low The data reported later that are simulated by the Ratcliff diffusion model will not include any contaminants
2 A complete description of the parameter values is available at the first authorrsquos home page
3 As a matter of fact the equation is daunting in the sense that the infinite series does not have an analytical solution so one must resort to numerical solutions
4 Equations 6 and 9 hold for both correct and error responses (see eg Laming 1973 p 192 footnote 7 Link amp Heath 1975)
5 The close conceptual link between sequential sampling models (eg the diffusion model) and signal detection theory has also been a motivating factor in the work of Pew (1969) Emerson (1970) Balakrish-nan et al (2002) and Palmer et al (2005)
22 Wagenmakers van der maas and grasman
APPenDIx R Code for the ez-Diffusion Model
This appendix lists the R function (R Development Core Team 2004) that implements the EZ-diffusion model As mentioned by Rouder and Lu (2005 p 603) ldquoR is a freely available easy-to-install open-source statistical package based on SPlus It runs on Windows Macintosh and UNIX platforms and can be downloaded from wwwR-projectorgrdquo
The R function getvaTer takes Pc VRT and MRT as input arguments and returns v a and Ter
getvaTer 5 function(Pc VRT MRT s501)
s2 5 s^2 The default value for the scaling parameter s equals 01if (Pc 55 0) cat(ldquoOops Pc 55 0nrdquo)if (Pc 55 05) cat(ldquoOops Pc 55 5nrdquo)if (Pc 55 1) cat(ldquoOops Pc 55 1nrdquo) If Pc equals 0 5 or 1 the method will not work and an edge correction is requiredL 5 qlogis(Pc) The function ldquoqlogisrdquo calculates the logitx 5 L(LPc^2 - LPc 1 Pc - 5)shyVRTv 5 sign(Pc-5)sx^(1shy4) This gives drift ratea 5 s2qlogis(Pc)shyv This gives boundary separationy 5 -vashys2MDT 5 (ashy(2v)) (1-exp(y))shy(11exp(y))Ter 5 MRT - MDT This gives nondecision timereturn(list(v a Ter))
Now consider an EZ-diffusion process for which drift rate v 5 01 boundary separation a 5 014 Ter 5 0300 and s is set at its arbitrary default value of 01 With very many observations this process will result in MRT 5 0723 VRT 5 0112 and Pc 5 802 (these values are rounded) To illustrate and check the above code the following command may be executed at the R prompt
pars 5 getvaTer(802 112 723)
Typing ldquoparsrdquo at the R prompt will then display the following
[[1]][1] 009993853[[2]][1] 01399702[[3]][1] 030003
These values correspond to v a and Ter respectively The code above can of course also be easily implemented in programs such as SPSS or Excel A JavaScript program that implements the EZ-diffusion model can be found at usersfmguvanlshyewagenmakersshyEZhtml
(Manuscript received October 31 2005 revision accepted for publication June 12 2006)
6 Ratcliff and Tuerlinckx (2002) studied model recovery of the Rat-cliff diffusion model using 250 and 1000 observations
7 When the data are generated by the EZ-diffusion model it is more efficient to include the error RTs in the calculation of MRT and VRT However this may not be the case when the model is misspecified In addition the focus on correct RTs is consistent with current practice in experimental psychology For these reasons we choose not to include the error RTs in the computations of MRT and VRT
8 This test is available in R (R Development Core Team 2004) as the function agostinotest() in the moments package
9 This experiment was originally designed to study IQ differences in response speed using the diffusion model Since the effects of IQ were not statistically reliable the present analysis collapses over participants with relatively low IQ (n 5 32) and those with relatively high IQ (n 5 44)
10 We thank Andrew Heathcote for sending us his R routines for fit-ting the Ratcliff diffusion model
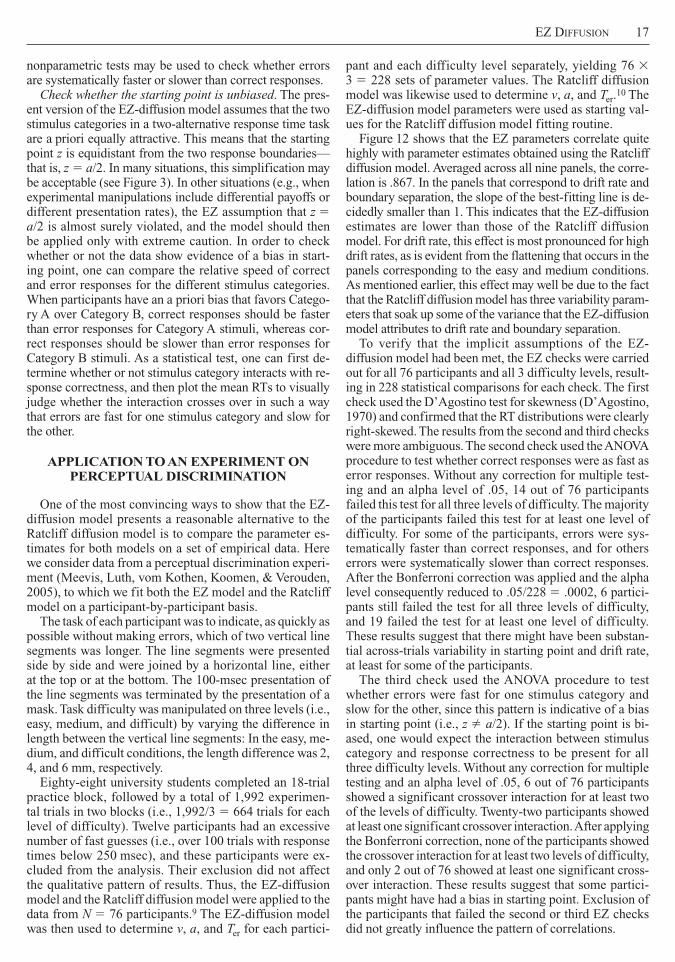