An Empirical Analysis of European IPO Markets
Josef Anton Schuster
London School o f Economics and Political Science
Submitted in partial fulfilment of the requirements of the degree ofDoctor of Philosophy
University of London
May 2003

UMI Number: U183310
All rights reserved
INFORMATION TO ALL USERS The quality of this reproduction is dependent upon the quality of the copy submitted.
In the unlikely event that the author did not send a complete manuscript and there are missing pages, these will be noted. Also, if material had to be removed,
a note will indicate the deletion.
Dissertation Publishing
UMI U183310Published by ProQuest LLC 2014. Copyright in the Dissertation held by the Author.
Microform Edition © ProQuest LLC.All rights reserved. This work is protected against
unauthorized copying under Title 17, United States Code.
ProQuest LLC 789 East Eisenhower Parkway
P.O. Box 1346 Ann Arbor, Ml 48106-1346

I H-£ Sc S
!'
i

A cknow ledgem ents
I am greatly indebted to David Webb for his uncompromising support throughout the
past years. This work has also benefited from comments made by Dan Bradley,
Margaret Bray, Gregory Connor, Francesca Comelli, Jon Danielson, Darrell Duffle,
Charles Goodhart, Bob Nobay, Jay Ritter, Jean-Charles Rochet, Hyun Song Shin, Ian
Tonks and seminar participants at the Eastern Finance Association Meeting (2003),
European Financial Management Association Meeting (2002), German Finance
Association Meeting (2002), Goldman Sachs International, London School of
Economics, Midwest Finance Association Meeting (2003), Seoul National University
and Stanford University. Special thanks to Jinhui Luo for many useful discussions.

Abstract
This analysis provides evidence regarding the performance of Initial Public Offerings
(IPOs) in Europe during a time of dramatic change. For the sample of 973 IPOs taken
from the six major Continental European markets and Sweden during 1988-98, there is
significant underpricing and autocorrelation in IPO underpricing and activity.
Privatization programs account for most of the “money left on the table”. For the
sample as a whole, we do not find long-run underperformance. Over shorter
measurement horizons, IPOs outperform the market. The favourable performance is
driven by New Economy IPOs, which account for 28 percent of the sample. The
pervasiveness of these results across various methodological choices is puzzling and
shows one of the forces behind the dramatic shift in industry composition of IPOs in
favour of New Economy IPOs during the “Internet Bubble” o f 1999 and 2000.
Underpricing extends across all countries studied, with IPO activity being partially
influenced by changes in tax regimes or in the regulatory framework. There is also a
strong link between IPO performance and the national exchanges’ ability to attract New
Economy IPOs. This fundamentally explains why stock exchanges have attempted to
establish “New Market” segments during the 1990s. Tests for performance differences
between countries confirm the homogeneity of the European IPO market. In order to
shed more light on the results, we study the relationship between management
behaviour towards earnings management and the subsequent market response for the
German IPO market. When applying two forms of earnings management, issuers that
overperform in the long-run tend to manage earnings less aggressively. Over shorter
measurement horizons, however, the performance is sensitive to the starting date of the
measurement period. The market takes a considerable amount of time to respond to the
fundamental message conveyed by management behaviour towards earnings
management. Within the first four months, IPO returns are essentially driven by factors
other than fundamentals. Apart from casting doubt on the efficiency of the IPO
aftermarket, this can explain the observed negative relationship between short- and
long-run IPO returns and the rationale behind investing in IPOs.

Contents
Chapter I Introduction 8
Chapter II The Cross-Section of European IPO Returns 151 Introduction 152 Patterns in IPOs 18
2.1 Initial Pricing 182.1.1 Theories assuming a passive role of the underwriter 192.1.2 Theories assuming an active role of the underwriter 24
2.2 Cycles in IPO activity 292.3 Return Dynamics in Aftermarket Trading 30
3 Data, Sample and Methodology 343.1 Data 343.2 Sample 393.3 Methodology 42
4 Performance Analysis of European Initial Public Offerings 464.1 Initial Returns 464.2 Aftermarket Returns 494.3 Cross-Sectional Results 52
4.3.1 Performance Categorized by Initial Returns 524.3.2 Performance Categorized by Age 554.3.3 Performance Categorized by Size 574.3.4 Performance Categorized by Public Float 594.3.5 Performance Categorized by Sector 61
5 Regression Results 656 Summary and Conclusion 67
Chapter III IPOs: Insights from seven European countries 701 Introduction 702 Going public in European countries 1988-1998 73
2.1 Institutional arrangements 732.2 Previous literature 77
2.2.1 Germany 772.2.2 France 782.2.3 Italy 792.2.4 The Netherlands 802.2.5 Spain 812.2.6 Sweden 822.2.7 Switzerland 84
3 Data and Methodology 843.1 Data 843.2 Methodology 90
4 Performance Analysis of IPOs in European countries 934.1 Aftermarket Performance 934.2 Cross-Sectional Performance Patterns 100
4.2.1 Germany 1024.2.2 France 1024.2.3 Italy 1044.2.4 The Netherlands 106
1

4.2.5 Spain 1094.2.6 Sweden 1094.2.7 Switzerland 111
5 Checks of Performance Differences 1136 Summary and Conclusion 117
Chapter IV Management Behaviour and Market Response 1201 Introduction 1202 Market Background and Data 124
2.1 Market Background 1242.2 Data 125
3 Market Response to Management Behaviour around the IPO year 1303.1 Measuring Management Behaviour using Discretionary Current 130
Accruals (DCA)3.2 Time-Series Properties of Discretionary Current Accrual (DCA) 1333.3 Discretionary Current Accruals (DCA) and Stock Returns 135
4 Market Response to Income Reporting Strategies 1404.1 Measuring Management Behaviour with Income Smoothing (IS) 1404.2 Income Smoothing (IS) and Stock Returns 142
5 Comparative Analysis of Methods of Earnings Management 1456 Aftermarket Return Dynamics and Earnings Management 1487 Summary and Conclusion 153
References 156
Appendix A: Sector Classification 165
Appendix B: Alternative Performance Tests 166
Appendix C: Listing Requirements 184
Appendix D: Tests of Country Differences 186
Appendix E: Sensitivity Analysis 198
Appendix F: DCA and IS Methodology 199
2

List of Tables
1 Market Conditions and Sample Characteristics 38
2 Initial Returns of European IPOs 45
3 Aftermarket Performance of European IPOs 50
4 Aftermarket Performance Categorized by Initial Return 53
5 Aftermarket Performance Categorized by Age 56
6 Aftermarket Performance Categorized by Size 58
7 Aftermarket Performance Categorized by Public Float 60
8 Aftermarket Performance Categorized by Sector 62
9 OLS Regression Results for Aftermarket Performance 66
10 Sample Characteristics 88
11 Sample Distribution 89
12 Cumulative Average Returns (CARs) 94
13 Distribution of unadjusted Three-year Buy-and-Hold Returns 98
14 Initial Returns and the Long-Run performance of German IPOs 101
15 Initial Returns and the Long-Run performance of French IPOs 103
16 Initial Returns and the Long-Run performance of Italian IPOs 105
17 Initial Returns and the Long-Run performance of Dutch IPOs 107
18 Initial Returns and the Long-Run performance of Spanish IPOs 108
19 Initial Returns and the Long-Run performance of Swedish IPOs 110
20 Initial Returns and the Long-Run performance of Swiss IPOs 112
21 Test for Significance of Initial Return Differences 114
22 Test for Significance of Long-Run Return Differences 115
23 Sample Distribution and Firm Characteristics 128
3

24 Time Series and Cross-Sectional Characteristics of Discretionary 134Current Accruals (DCA)
25 IPO performance categorized by Issue Year DCA Quartiles 136
26 Distribution of the Income Smoothing (IS) coefficient 141
27 IPO performance categorized by Issue Year IS Quartiles 143
28 Discretionary Current Accruals (DCA) versus Income Smoothing (IS) 146
29 IPO performance of companies in the DC A/IS intersection 147
30 OLS Regression Results for the Aftermarket Performance 150
31 Global Sector Classification Standard 165
32 Aftermarket Performance (Value-Weighted) 166
33 Cumulative Average Returns (CARs) for Alternative Benchmarks 167
34 Aftermarket Performance - constant sample size (686 IPOs) 170
35 Aftermarket Performance - constant sample size (381 IPOs) 171
36 Aftermarket Performance Categorized by Initial Return - 172constant sample size (686 IPOs)
37 Aftermarket Performance Categorized by Age - 173constant sample size (686 IPOs)
38 Aftermarket Performance Categorized by Size - 174constant sample size (686 IPOs)
39 Aftermarket Performance Categorized by Public Float - 175constant sample size (686 IPOs)
40 Aftermarket Performance Categorized by Sector - 176constant sample size (686 IPOs)
41 OLS Regression Results for Aftermarket Performance - 177constant sample size (686 IPOs)
42 Aftermarket Performance Categorized by Initial Return - 178constant sample size (381 IPOs)
43 Aftermarket Performance Categorized by Age - 179constant sample size (381 IPOs)
4

44
45
46
47
48
49
50
51
52
53
54
55
56
57
58
59
60
Aftermarket Performance Categorized by Size - 180constant sample size (381 IPOs)
Aftermarket Performance Categorized by Public Float - 181constant sample size (381 IPOs)
Aftermarket Performance Categorized by Sector - 182constant sample size (381 IPOs)
OLS Regression Results for Aftermarket Performance - 183constant sample size (381 IPOs)
Listing Requirements on European Market Segments 184
Significance Tests of Country Differences categorized by IPO year - 186Mean Difference Test
Significance Tests of Country Differences categorized by IPO year - 187Wilcoxon Rank Sum Test
Significance Tests of Country Differences categorized by Sector - 188Mean Difference Test
Significance Tests of Country Differences categorized by Sector - 189Wilcoxon Rank Sum Test
Significance Tests of Country Differences categorized by Age - 190Mean Difference Test
Significance Tests of Country Differences categorized by Age - 191Wilcoxon Rank Sum Test
Significance Tests of Country Differences categorized by Size - 192Mean Difference Test
Significance Tests of Country Differences categorized by Size - 193Wilcoxon Rank Sum Test
Significance Tests of Country Differences categorized by Public Float - 194 Mean Difference Test
Significance Tests of Country Differences categorized by Public Float - 195 Wilcoxon Rank Sum Test
Significance Tests of Country Differences categorized by Initial Return -196 Mean Difference Test
Significance Tests of Country Differences categorized by Initial Return -197 Wilcoxon Rank Sum Test
5

Relationship between findings in Chapter II and Chapter III
Specimen Balance Sheet and Profit and Loss Account
Calculation of DCA and IS coefficients
List of Figures
Figure 1 IPO Activity and Stock Market Returns 47
Figure 2 Average market-adjusted aftermarket Performance 63Categorized by Sector
Figure 3 IPO Activity and Performance of New Economy IPOs 65
Figure 4 IPO activity and Stock Market Returns in European Countries 85
Figure 5 The Long-Run Performance of IPOs in European Countries 95
Figure 6 Time line 127
Figure 7 Market-adjusted buy-and-hold returns of DCA Quartiles (%) 139
Figure 8 Market-adjusted buy-and-hold returns of IS Quartiles (%) 144
Figure 9 Model Explanatory Power Dynamics and Weekly Abnormal 151 Returns
Figure 10 The Long-Run Performance of European IPOs 169
7

Chapter I
Introduction
DURING THE ELEVEN-YEAR PERIOD between 1988-1998, almost 1,000
companies raised a total of €126.6 billion on the seven major European markets,
excluding the UK. This figure, when compared to the number o f already listed
companies in Europe as well as to the US, is considerably large and shows the growing
significance of the European marketplace for issuers, investors and underwriters.1 It
also demonstrates the declining cultural aversion of entrepreneurs and investors to the
stock market. The large number o f firms “going public” include well-known companies
in a variety of industries such as Adidas AG, a sportswear company famous for its
three-stripe logo, France Telecom SA, a leading telecommunications company, or
SAP AG, the world’s third largest software company measured by market
capitalization. This development has allowed us to investigate the phenomena
associated with Initial Public Offerings (IPOs) from the perspective of other, non
Anglo-Saxon countries, where stock markets play an increasingly crucial role in
company financing.
In the US, a large body o f empirical and theoretical research has focused on
phenomena associated with IPOs. Such phenomena concern, for example, abnormal
initial returns, whereby the first market price is on average significantly higher than the
offering price. This adjustment is typically interpreted as evidence of “underpricing” o f
IPOs (e.g., Ibbotson (1975), Ibbotson, Sindelar, and Ritter (1988) or Ritter and Welch
(2002)). Another observed anomaly associated with IPOs is the “hot issue”
1 Ritter and Welch (2002) report that during the same period 3,872 firms raised a total of $237.9 billion in the US.

phenomenon, whereby the observed issuing activity exhibits significant, recurring, and
to some extent predictable variations over time (Ibbotson and Jaffe (1975), Ritter (1984)
or Lowry and Schwert (2002)). The facet that has attracted most academic interest is the
aftermarket performance of IPOs. IPOs seem, on average, to perform poorly in the long-
run (Stoll and Curley (1970), Ritter (1991) or Brav and Gompers (1997)). Their poor
stock price performance is reportedly also accompanied by poor operating performance,
post-IPO relative to pre-IPO (Jain and Kini (1994)), and by an overly aggressive
management of earnings during the IPO year (Teoh, Welch and Wong (1998)).
One key question that is the starting point for a number of further considerations
is how these phenomena relate to companies going public in Continental Europe and
Sweden during 1988 and 1998. We address this question in three independent, yet
complimentary, research projects from three different geographical perspectives taking
into account various methodological choices. These research projects form the core of
the following empirical analysis o f European IPO markets.
In Chapter II, “The Cross-Section o f European IPO Returns”, our motivation is
to study the phenomena associated with IPOs from a pan-European perspective. Here,
we pool the data from a set of 973 European IPOs between 1988 and 1998. By taking a
pan-European perspective, we are able to investigate a large enough sample of IPOs that
stretch beyond the rising markets of the late 1990s. The sample is interesting because
European IPOs, unlike IPOs in the US, come from a broad mix of industries with a
potentially different rational behind the going public decision.
In this chapter, we first review the theoretical literature on the IPO phenomena.
We then present the data and empirical methodology that is needed to shed light on how
2 Helwege and Liang (2001) find that US IPOs from 1982-93 are largely concentrated in die same narrow set of high-tech industries. Interestingly, Ritter (2001) reports that the median age of US IPOs in 2001 was 12 years, the highest in any year since 1980. Because this starts to resemble our sample mix, this analysis may provide a useful guide for US practitioners.
9

some of those phenomena relate to European IPOs. In the first part of the empirical
analysis, we study the underpricing phenomenon. Second, we show how European IPOs
have performed in the aftermarket. Because we are particularly interested in the
dynamics of aftermarket performance, we report absolute and relative returns over a
variety o f methodological choices and also for IPOs issued in “hot” and “cold” markets.
Finally, we study how the sample of European IPOs perform based on a set of issuing
characteristics over various measurement horizons and market conditions.
For the sample of European IPOs, we find considerable underpricing which is
time-varying and related to company characteristics. IPOs offered in “hot” markets are
substantially more underpriced than IPOs offered in “cold” markets. There is also
significant autocorrelation in IPO underpricing and activity. This is higher for firms in
the New Economy. Much of the large “amounts of money left on the table” can be
explained by the influence of privatization issues with an arguably different rationale for
underpricing. For the sample as whole, we find that IPOs did not underperform in the
long-run. This underlines the more recent US evidence which argues that poor long-run
IPO performance is a time-varying phenomenon. Over short measurement horizons we
find significant absolute and relative overperformance. IPOs offered in “hot” markets
have the best relative and absolute performance whereas IPOs offered in “cold” markets
fare worst. These results are pervasive and extend across sampling periods and
measurement horizons. Our findings also underline significant differences in IPO
performance in sub-groups of the sample. There is particularly strong support for
signaling theories that postulate a negative relationship between the size of the public
float and aftermarket performance. A notion, which runs through the whole analysis and
is reflective of global equity markets in the 1990s, concerns the influence o f the New
Economy. We find that the favourable performance of the sample as a whole is driven
10

by New Economy IPOs, which account for 28 percent of the sample as a whole. The
pervasiveness of this performance across time and measurement horizons sheds some
light on the drivers behind the dramatic shift in industry composition of IPOs in favor of
New Economy IPOs during the “Internet Bubble” of 1999 and part of 2000.
In Chapter III, “Initial Public Offerings: Insights from seven European
countries”, we extend the evidence by studying European IPOs from the perspective of
seven individual countries: Germany, France, Italy, The Netherlands, Spain, Sweden
and Switzerland. The major purpose of this chapter is to study the robustness o f the
phenomena associated with IPOs by applying a common empirical framework to each
European country. By extending our analysis to the individual countries, we improve
our understanding about the potential drivers o f the IPO performance patterns as well as
the homogeneity of the European IPO market.
We first provide a detailed overview o f the institutional arrangements in the
individual European IPO markets under study, describe the data and review the existing
empirical literature from the individual countries. By using a variety o f empirical
measurement techniques, we then present the evidence on underpricing and long-run
performance. We also study time-series and cross-sectional performance patterns in
individual European countries and perform a number o f robustness checks for the
significance of country-by-country differences.
The findings show that the underpricing phenomenon, while time-varying, is a
consistent feature across all the countries under study. Our results also underline the
effect of changes in tax regimes (in the case of France and Sweden) or the regulatory
framework (in the case of Spain) on pricing and IPO activity. Evidence on long-run
performance of IPOs in the individual European countries suggests that
underperformance is a time-varying phenomenon and sensitive to benchmark
11

adjustment and measurement period. When performing significance tests of
performance differences between the individual countries, we can generally confirm the
similarity of the patterns for the sample as a whole as well as in the cross-section of the
returns. This evidence underlines the homogeneity of the European IPO market. Finally,
we find a pervasive link between the performance of IPOs and the exchanges’ ability to
attract IPOs from the New Economy. This helps to shed some light on the rationale
behind the big efforts made by stock exchanges across Europe to establish “New
Market” segments during the 1990s.
Further, this study underlines the general impression that long-horizon return
studies can yield bizarre results. This is reinforced in our work which demonstrates that
results can be interpreted differently depending on the experimental setting, therefore
underlining recent simulation results in the academic literature.
Chapter IV, “Management Behaviour and Market Response”, joint with Jinhui
Luo, studies a set of 126 companies going public between 1988 and 1997 in Germany,
with the aim of broadening our understanding o f several unexplored issues relating to
IPOs. Here, we examine the relationship between management behaviour towards
earnings management and aftermarket performance in the German market.
By applying a similar measuring specification as found in the US literature, we
first test the relationship between management behaviour, proxied by the aggressiveness
of using discretionary current accruals and income smoothing, and aftermarket IPO
performance. We then deviate from this benchmark measuring specification to test
whether the IPO market is informationally efficient in the sense that management
behaviour can be efficiently inferred by the market. We also go beyond the prior work
in the literature to examine further the relationship between the two forms of earnings
management and test how the market responds to their interaction. Finally, we combine
12

the typical empirical IPO methodology of Ritter (1991) and the framework o f
discretionary current accruals and income smoothing to examine the driving sources o f
the dynamics of aftermarket IPO performance.
The results show that managers of IPO firms tend to use discretionary current
accruals to buoy up earnings during the IPO year and, to some extent, manage a firms’
income. The long-run performance of German IPOs is related to such earnings
management behaviour. The firms that use discretionary accruals more conservatively
during the IPO year and the firms that smooth their reported income more, outperform
their counterparts in the long-run. Moreover, we find that the two commonly identified
earnings management strategies in IPOs are not deterministic, yet complementary. In
the long-run, firms that use discretionary current accruals during the IPO year more
conservatively also tend to smooth their reported income more. The firms undertaking
both strategies outperform the market and other IPOs that only apply any one of the two
strategies. We also find that the relationship between IPO aftermarket performance and
the strategic earnings reporting behaviour documented in the literature is sensitive to
both measurement horizon and starting date. Ironically, firms managing their earnings
more opportunistically perform better than those managing their earnings more
conservatively when performance is measured from a date closer to the IPO and when
measured over short horizons. This sheds some light on the pervasive influence of the
New Economy. Finally, we show that the market takes a considerable time to
incorporate fundamentals into IPO prices. During this period, fundamental information
about the IPO has weak explanatory power for long-run performance suggesting that the
returns in the immediate IPO aftermarket are dominated by factors other than
fundamentals. After a period o f learning, the market starts to respond and the power of
13

fundamentals to explain long-run IPO returns increases substantially. This sheds light
on the negative relationship between the short- and long-run dynamics in IPO returns.
14

Chapter II
The Cross-Section of European IPO Returns
1 Introduction
The academic literature on Initial Public Offering (IPOs) has grown rapidly over the
past decade. Much of this literature has focused on documenting and explaining
empirical patterns associated with the phenomena surrounding IPOs: underpricing, “hot
issue” markets, and long-run underperformance. The patterns and models that try to
explain them are mostly from an American perspective whereas the European
marketplace has received considerably less attention.
In this chapter, we seek to close this gap by extending the international evidence
on IPOs to include 973 companies which went public on the six largest Continental
European markets and Sweden between 1988 and 1998. The extension of empirical IPO
work to a pan-European scale responds to a number o f fundamental developments
during the past decade which have shaped European stock markets. First, throughout
the 1990s, the European IPO market has developed as one of the cornerstones of the
worldwide IPO market. This has been fostered either by privatization programs
introducing “equity culture” to the Continental European marketplace, by initially
highly successful stock exchange segments catering to companies in high-growth
industries, or by the convergence of listing requirements, reporting rules and pricing
mechanisms across Europe. Within this setting, European IPO activity has overtaken
US IPO activity. During the late 1990s, more companies went public and more fUnds
were raised by companies on the European market segments than in the US. Second,
3 Jenkinson and Ljungqvist (2001) provide a comprehensive coverage of the theory, empirical evidence, international patterns and institutional practices.
15

European integration has been at work for some time now, and the changes brought
about by the introduction of the European single currency and the adoption of a
common monetary policy have resulted in a dramatic change in portfolio allocation
decisions. As the barriers to cross-border investing have declined, it has become/
increasingly important for issuers and investors alike to evaluate the European market
from the perspective of a full set of available opportunities across countries. One of
those consequences has been the rise of pan-European sector analysis at the expense of
individual country analysis.
By taking a pan-European perspective, we are able to investigate the performance
patterns of a large enough sample of IPOs over a period that stretches beyond the rising
markets of the late 1990s. This allows us to shed more light on the generality of the
empirical patterns and theoretical foundations associated with IPOs. In this respect,
some issues are of particular interest.
Our first objective is to study the underpricing phenomenon for European IPOs.
Here, we are interested in whether initial returns are time-varying and related to
company characteristics. We are also interested in studying the relation between short-
run and long-run IPO returns because institutional arrangements in the IPO aftermarket
that are unrelated to fundamentals seem to affect IPO price dynamics. These
institutional arrangements include short-selling restrictions (Geczy, Musto and Reed
(2002)), the “quiet period” (Bradley, Jordan and Ritter (2002)), aftermarket stabilization
through price support (Aggarwal (2002)) and the expiration of the “lock-up” period
(Bradley, Jordan, Roten, and Yi, (2001)). Recent studies show that IPO
underperformance is a time-varying phenomenon (Gompers and Lemer (2001)) or
disappears in sub-sample analysis (Brav and Gompers (1997)). We study how European
IPO returns relate to this evidence. Finally, the sample period has also been
16

characterized by unprecedented changes in global economies caused by the increasing
role o f technology, the effects of which are still subject to intense debate (Gordon
(2000)). This has had a dramatic impact on the composition of equity indices in general,
and the nature of companies seeking an IPO in particular. We are interested in finding
out whether the performance patterns of European IPOs mirror this change.
In this respect we make a number o f interesting observations that appear robust
across various methodological choices:
(1) For the sample o f 973 European IPOs offered between 1988 and 1998, we
find considerable underpricing which is time-varying and related to proxies of
uncertainty, such as age or sector. There is a large discrepancy between the
mean and median amount of “money left on the table” which is due to the
impact of large privatizations.
(2) For the sample as a whole we do not find long-run underperformance. This is
consistent with Gompers and Lemer’s (2001) conjecture that long-run IPO
underperformance is a time-varying phenomenon. Over the short-run, there is
significant absolute and relative overperformance. This result supports the
growing literature that addresses the effect of institutional practices on the
IPO return dynamics (Duffie, Garleanu and Pedersen (2002)).
(3) IPOs offered in “hot” markets, during which the general market is generally
rising and which have the highest initial return, are associated with the best
absolute and relative IPO performance. IPOs offered in “cold” markets,
where underpricing is lower and stock markets are either stable or falling,
experience poorer absolute and relative aftermarket performance. For the
sample as a whole, this does not necessarily indicate that European IPOs
17

issued in “hot” markets were aggressively priced in order to take advantage
of “windows of opportunity”.
(4) The study emphasizes the significant difference in IPO performance of sub
groups of IPOs (Brav and Gompers (1997)). There is strong evidence to
support the fact that aftermarket performance is positively related to
underpricing and negatively related to the size of the public float. Moreover,
the relatively favourable aftermarket performance throughout the sample
period is driven by New Economy IPOs, which account for 28 percent of the
sample on average. This can help to explain the dramatic shift in industry
composition of IPOs towards New Economy IPOs during the “Internet
Bubble” of 1999 and 2000.
The rest of this chapter is organized as follows: Section 2 discusses the empirical
anomalies associated with IPOs and surveys some of the main theories that try to
explain them. The data, sample and methodology are described in Section 3. In Section
4, we turn to the examination of initial and aftermarket performance. Here, we also
study aftermarket performance when categorized according to issuing characteristics.
Regression results are presented in Section 5. Section 6 concludes the chapter and
discusses the significance of our findings in order to help to explain recent events.
2 Patterns in IPOs
2.1 Initial Pricing
One observed pattern in IPOs concerns the existence of abnormal initial returns,
whereby the first market price is on average significantly higher than the offering price.
This adjustment is usually interpreted as evidence of IPO underpricing. Over the years,
a large body of literature has documented the underpricing phenomenon (Logue (1973),
18

Ibbotson (1975), Ritter (1984), Ibbotson, Sindelar and Ritter (1988)). In a recent study,
Ritter and Welch (2002) find an average first-day return of 18.8 percent when looking at
6,240 US IPOs issued between 1980 and 2001. The underpricing phenomenon has also
been documented internationally (Loughran and Ritter (1995)).
A number of papers reviewing the theoretical literature classify the theories o f
underpricing based on whether the information between issuer, underwriter and
different groups of investors is assumed to be symmetric or not. The underwriter plays a
particularly crucial role. It performs three main functions: underwriting, advising and
distribution. Owing to the potentially conflicting incentives offered by these functions,
underwriters may face a trade-off between the costs and benefits of underpricing. On the
one hand, for instance, underpricing may lower both the risk that the issue fails as well
as the efforts in marketing. On the other hand, since underwriting fees are typically
proportional to gross floatation proceeds, and thus negatively related to the degree of
underpricing, investment banks should have an incentive to minimize underpricing.
Because of the important role of an investment bank in practice, we divide the theories
related to underpricing into two sections on the premise that explanations related to the
underpricing phenomenon assume a more passive or active role of the underwriter.4 It
must be noted that many of the underpricing theories are not mutually exclusive.
2.1.1 Theories assuming a passive role o f the underwriter
Winner’s Curse
One model, in which underwriters act primarily as passive agents for the issuing
firm, has been developed by Rock (1986). His winner’s curse hypothesis explains the
4 The recent literature on IPO underpricing focuses on the institutional aspects of underpricing and the role of the underwriter. In particular, the theory and evidence concerning the allocation of shares has stimulated a large number of papers. See Ritter and Welch (2002) for a literature survey.
19

underpricing phenomenon in terms of information asymmetry among the different
groups of investors, the issuing firm and the underwriter. The information asymmetry
arises because an issuer faces an unknown demand for its shares from two types of
investors. The first group consists of outside or informed investors who have better
knowledge about the prospective cash flow than does the issuing firm and its
underwriter for which it incurred a cost. These informed investors will only submit
purchase orders if the offering price is less than the true value o f the IPO. The second
type, uninformed investors, lack special knowledge about firm value. They may
participate in the market even though they did not purchase information. Consequently,
informed investors will bid for more shares of the more successful firms, which will
leave the uninformed investors with a disproportionate amount of the less successful
IPOs. In addition, since the allocation is not made on a pro rata basis and over
subscription and rationing can occur, the bias against uninformed investors can be even
larger if the underwriters favor the informed investors. This information asymmetry
may lead to Akerlof s (1970) ‘lemons problem’, where the uninformed investor ends up
primarily with the less successful issues. Underpricing the issue results in compensating
uninformed investors for the bias in the allocation mechanism. The model generates a
number of empirical predictions. For example, underpricing will be directly
proportionate to the ex-ante uncertainty surrounding the issue.
The empirical literature is supportive o f the model’s predictions in countries
where underwriters play a relatively passive role in bringing new issues to market. Koh
and Walter (1989), using information on rationing, find that an uninformed strategy in
Singapore just about broke even. Keloharju (1993) also finds evidence of a winner’s
curse in Finland. Ritter (1984) verifies some predictions and finds a monotonous link
between underpricing and empirical proxies for uncertainty, such as sales and the daily
20
aftermarket standard deviation of stock returns for the first month in aftermarket
trading.
Information Cascades
In the information cascades or “herding” hypothesis, developed by Welch
(1992), it is assumed that, in aggregate, investors hold perfectly accurate information
about the issuing firm. However, information concerning the value o f the shares is
highly uncertain for investors. Furthermore, it is assumed that it takes investment
bankers time to approach interested investors because of their limited distribution
channels. The hypothesis draws from the notion that potential investors base their
investment decisions not only on their own information about the issue, but also on
whether or not other investors, who were approached earlier, are purchasing. Thus,
subsequent investors will view the actions o f previous investors as an indication of what
information they hold privately. Thus, they will imitate the purchasing decisions of their
predecessors. Consequently, an issuer may want to underprice an offering to induce the
first few potential investors to buy and induce a cascade in which all subsequent
investors want to buy irrespective o f their own information. When combining the
cascades hypothesis within a setting o f a pricing process in which the underwriter
dynamically adjusts the IPO price, positively sloped demand curves can result.5
Empirical support for the cascades hypothesis is mixed. Barry and Jennings
(1992) reject the cascades model in favor of the dynamic information acquisition
argument, while in a recent work, Amihud, Hauser and Kirsh (2002) test the theory on a
5 Similar dynamics can be applied when a cut in the offer price may actually scare away potential investors. See Financial Times (June 26, 2002) for the dynamics leading to the postponement and eventual cancellation of the IPO of Prada SpA, and CBS Marketwatch.com (July 2, 2002), describing the circumstances surrounding the IPO of CIT Group Inc., an insurance company and Tyco International Inc. spin-off, which offered shares at $23 against an expected range of $25 to $29 and closed at $22 after the first day of trading in an adverse company and market environment.
21

sample of 284 IPOs in the Tel Aviv Stock Exchange between 1989 and 1993 and find
evidence consistent with herding. More specifically, they found that investors either
subscribed overwhelmingly to new issues, which resulted in very small allocations, or
largely abstained from subscribing so that the issue was undersubscribed and
subscribers received full allocations, with very few cases in-between.
Signaling
Another line of theoretical literature reverses Rock’s assumption regarding
informational asymmetry and assumes that the issuer is better informed than investors.
Here, underpricing is a means for high quality firms to distinguish themselves from low
quality issuers. These studies are motivated by Ibbotson’s (1975) conjecture that the
issuer may want to “leave a good taste in investors’ mouths.” In the signaling models,
banks are simply assumed to be passive distributors of shares to the general public.
In Allen and Faulhaber (1989), bad managers, who are more likely to run bad
firms, are deterred from mimicking good managers who underprice, because subsequent
cash flows partially reveal the firm’s type. Consequently, their model implies that firms
that underprice more are likelier to have higher dividends, and that the market reacts
more favourably to dividend announcements by firms that underprice more. In Welch’s
(1989) model, risk-neutral entrepreneurs sell a fraction of their firm in an unseasoned
offering and the remainder in a subsequent seasoned offering. Low-quality firms that
mimic high quality firms must pay an exogenously specified operation cost, which the
high-quality firms do not incur. In some cases, this cost may be insufficient to deter
mimicking, and underpricing becomes the additional wedge that deters low-quality
firms in the separating equilibrium. In Grinblatt and Hwang (1989), a firm employs two
signals to convey the mean and variance o f its future cash flow: the degree of
22

underpricing and the fraction of shares held by insiders. To overcome the asymmetric
information problem, the issuer signals the true value of the firm by offering shares at a
discount and by retaining some o f the shares. In the model’s separating equilibrium, a
firm’s intrinsic value is positively related to underpricing. This model is a generalization
of Leland and Pyle’s (1977) signaling hypothesis which suggests that, by retaining a
significant ownership stake in the firm, entrepreneurs can signal project quality as false
representation can be costly. The hypothesis therefore predicts relatively superior
performance of IPO firms with high entrepreneurial ownership.
The empirical support for the signaling models o f underpricing is mixed.
Michaely and Shaw (1994) find no support for signaling. They find no evidence of
either a higher propensity to pay dividends for IPOs that were more underpriced or of a
higher propensity to return to the market for a seasoned equity offering. The insider
holding variable has no significant power to explain initial returns and there is no
evidence to suggest that insider holdings provide a credible signal of firm quality that
reduces uncertainty and, therefore, initial underpricing. Neither the initial-day return nor
the fraction held by insiders seems to explain the value of the firm two years after going
public. Jegadeesh, Weinstein and Welch (1993) find that returns after the first day are
just as effective in inducing future issuing activity as the first-day returns are. While
providing evidence suggesting a positive relation between managerial ownership
retention and post-IPO operating performance, Jain and Kini (1994) find no support that
firms that underprice more produce superior operating performance after the IPO.
Legal Liability
A further line of research does not rely on asymmetric information that is
resolved on the first day of trading. Ibbotson (1975) and Tinic (1988) have suggested
23

that the issuing firm may underprice to reduce the legal liability arising from any false
or inadequate information in the prospectuses.
Drake and Vetsuypens (1992), however, call such a conclusion into question. By
examining a sample of 93 US firms from 1969 to 1990 that are sued after their IPO,
they find that the average initial return for the sample firms is approximately the same
as that for a control group of IPOs of similar size. They also present evidence that
litigation typically results from some unfavourable company-specific news in the
aftermarket and not from IPO overpricing on the first trading day. Keloharju (1993)
argues that, given the paucity of legal liabilities associated with the process o f going
public in Finland, it is unlikely that potential legal liability has much to do with the
observed initial returns.6
2.1.1 Theories assuming an active role o f the underwriter
Underwriter Reputation
While their focus was on signaling firm quality through underpricing, Allen and
Faulhaber (1989) and Welch (1989) had already noted that signaling could also be
accomplished through the choice o f underwriter.
Carter and Manaster (1990) uncovered that high-quality underwriters are
typically associated with less underpricing. Findings in Beatty and Welch (1996) and
Cooney, Singh, Carter and Dark (2001) document, however, that the relationship
between underwriter reputation and underpricing has changed over time, casting doubt
on the theory. Loughran and Ritter (2001) report that unlike the 1980s, IPOs that are
6 Chalmers, Dann and Harford (2002) analyze a sample of 72 US IPOs between 1992 and 1996 and investigate the amount and cost of D&O liability insurance. They find a significant negative relation between the three-year post-IPO stock price performance and the insurance coverage purchased in conjunction with the IPO.
24

managed by high-prestige underwriters during the internet boom in the late 1990s are
associated with more underpricing than IPOs managed by less prestigious underwriters.
Underwriter Price support
Ruud (1993) challenges the conventional view that positive average initial IPO
returns result from deliberate underpricing. By investigating the distribution of initial
returns o f469 IPOs in 1982 and 1983, she shows that positive mean initial returns result
from a partially censored left (negative) tail. She argues that underwriter price support
or stabilization can account for this censoring of the distribution of initial returns
because in the US regulatory framework, the practice is not considered manipulative as
long as it is disclosed in the offering prospectus. The theory predicts that a large
percentage o f stocks should experience positive initial and short-run abnormal
aftermarket returns. More specifically, because underwriters remove price support over
time, prices of fully priced or just-underpriced IPOs are more likely to fall than to rise
over the short-term.7
Miller and Reilly (1987) examine the returns and spread behaviour of IPOs over
the first five days of trading and find that the relation of the spread and its determinants
differs between overpriced and underpriced issues only on the first trading day. For a
sample of 1,523 NASDAQ IPOs issued between 1982 and 1987, Hanley, Kumar and
Seguin (1993) find evidence suggesting that stabilization significantly affects quoted
spreads. Moreover, significant negative returns are documented after the termination of
stabilization.
7 Aggarwal (2000) provides a detailed account of the mechanics of stabilization in the aftermarket.
25
Dynamic Information Acquisition
The dynamic information acquisition argument - also referred to as bookbuilding
theory or information-gathering theory (Beneviste and Spindt (1989), Beneviste and
Wilhelm (1990) and Spatt and Srivastava (1991)) - studies the process whereby the
offer price is set and its effect on underpricing. The assumed pricing mechanism is the
bookbuilding process, whereby, after setting a preliminary offer price range, the
underwriter and issuer solicit “indications of interest” from prospective investors during
the “road show”, where the company is marketed to selected, typically institutional
investors. Through bookbuilding, investment banks extract information about the true
value from investors.8 The investors natural inclination to bid lower during the
marketing phase entails a trade-off: while it increases the potential profit from selling
the IPO in the immediate aftermarket, assuming shares have been allocated at the
offering price, it also jeopardizes the probability and size o f their allocations. In order to
induce investors to reveal that they want to purchase shares at a high price, the
investment banker must offer them a combination of underpricing and share allocations
in return.
There is strong empirical support for the bookbuilding theory o f underpricing.
Hanley (1993) documents that the relation of the final offer price to the range of
anticipated offer prices disclosed in the preliminary prospectus, is a good predictor of
initial returns. Having documented evidence for the partial adjustment phenomenon for
a sample of 1,430 US IPOs from January through September 1987, she finds that issuers
that have final offer prices exceeding the limits of the offer range have greater
underpricing than all other IPOs, and are also more likely to increase the number of
shares issued. The final offer price only “partially adjusts” to new information. Using a
8 In a more general context, Jenkinson, Ljungqvist, and Wilhelm (2000) use a dataset of 2,051 IPOs in 61 non-US markets during the period 1992-1999 and find that bookbuilding - while costing around twice as much as the fixed costs offering - leads to substantially less underpricing.
26

unique dataset from 39 international equity issues that used bookbuilding between 1995
and 1997, Comelli and Goldreich (2001) find that the investment banker awards more
shares to bidders who provide information in their bids or to those who bid regularly.
Investment Banker’s Monopsony Power
Baron (1982) offers an agency-based explanation for underpricing. His theory
assumes that the value of a new issue is affected by market demand and by the
investment banker’s selling effort. In the model, the investment banker is better
informed about market demand than the issuer, but his distribution effort is
unobservable. To address this moral hazard, the optimal contract sets the issue’s
offering price below its “true value”, defined as the equilibrium offering price when the
investment banker expends his best effort.
Some empirical evidence of self-underwritten IPOs refutes this theory.
Muscarella and Vetsuypens (1989) find that when underwriters themselves go public,
their shares are just as underpriced, even though there is no monitoring problem.
Loughran and Ritter (2002) argue that agency problems between underwriters
and issuing firms, largely latent in the 1980s, have become increasingly important and
are partly responsible for the high initial returns of Internet stocks during the late 1990s.
They postulate that higher valuations have resulted in issuers being more complacent
about “leaving money on the table”. In this context, they apply Prospect Theory,
developed by Kahneman and Tversky (1979), to the IPO market. Here, individuals
often violate Bayes’ Rule and rational choice theories when making decisions under
uncertainty in experimental settings. Loughran and Ritter (2002) predict that in most
situations issuers will sum the wealth loss from underpricing with the larger wealth gain
on the retained shares from a price jump, producing a net increase in wealth for pre-
27

issue shareholders. They empirically show that most of the money left on the table
comes from a minority of IPOs. In the cross-section, the IPOs that were underpriced
most were those where the offer price was revised upwards from what had been
anticipated at the time of filing the initial price range. This observation is consistent
with the dynamic information acquisition theory of Beneviste and Spindt (1989) and the
empirical documentation of the partial adjustment phenomenon by Hanley (1993). It is
also in line with Habib and Ljungqvist (2001) who argue that the opportunity cost of
underpricing is less if the relative float is small. The complacency about underpricing,
combined with the desire of underwriters to leave money on the table so as to receive
indirect compensation from buy-side clients that were favoured in IPO allocations,
resulted in even greater underpricing during the boom in Internet stocks during the late
1990s.9
This conjecture is similar to Shiller’s (1990) “Impresario” hypothesis of
underpricing, whereby underwriters choose a lower offering price because they know
that the cumulative profit o f underpricing (through less transparent forms of revenue
streams such as brokerage commissions) will be higher than maximizing revenue for the
single event (compensation in the form of the gross underwriter spread).10
9 For a related article see, Wall Street Journal Europe (Mai 05, 2002): eToys Sues Goldman Sachs Over Management of Its IPO. “...The relatively low price set for the IPO, the suit alleges, robbed eToys of hundreds of millions of dollars of cash that could have helped the company to stave off bankruptcy. The shares nearly quadrupled in the price on their first day of trading. The suit charged Goldman induced some investors to agree to give the firm a portion of the profits they later made on eToys shares in exchange for getting IPO stock allocation ...”10 On January 22, 2002, Credit Suisse First Boston (CSFB), an investment bank, agreed to settle a $100 million with the Securities and Exchange Commission (SEC), the US regulatory agency, based on the following allegations: “... From at least April 1999 through June 2000, CSFB employees allocated shares of IPOs to over 100 customers who were willing to funnel between 33 and 65 percent of their IPO profits to CSFB. The profits were channeled to CSFB in the form of excessive brokerage commissions generated by the customers in unrelated securities trades that the customers effected solely to satisfy CSFB’s demands for a share of the IPO profits...” (Source: SEC Litigation Release No. 17327). Ritter and Welch (2002) calculate that the practice of funneling back IPO profits through excessive trading may have accounted for up to 250 million shares per trading day during 1999 to 2000.
28

2.2 Cycles in IPO activity
Another anomaly associated with IPOs is the “hot issue” phenomenon, whereby
the observed issuing activity exhibits significant, recurrent, and to some extent
predictable variations over time. Ibbotson and Jaffe (1975) were among the first to
identify significant autocorrelation in both the monthly number o f IPOs and the monthly
average underpricing of IPOs. Ritter (1984) studies initial returns for US IPOs between
1960 and 1982 and finds highly significant autocorrelation in monthly average initial
returns and in monthly IPO volume. He also observes that periods of high volume tend
to follow periods of high average initial returns. In the cross-section o f the data, he
identifies a 15-month period during which the average initial return was 48.4 percent, as
contrasted with an average initial return o f 16.3 percent for the rest o f the period. This
“hot” IPO market is also concentrated in a certain class of industries and a certain group
of underwriters.
In a recent study, Lowry and Schwert (2002) find an autocorrelation coefficient
o f monthly average first-day returns of 0.60 between 1960 and 1997, which increased
during the Internet boom in the late 1990s. They confirm a significant positive relation
between initial returns and future IPO volume and note that, “increased numbers of
companies go public after observing that IPOs are being underpriced by the greatest
amount.” They associate the cycles in initial returns with the investment bankers’
learning process. Because the registration periods of many IPOs overlap, the
information that underwriters learn during one firm’s registration period will contribute
to the first-day returns of many IPOs.
The prospect theory explanation of the partial adjustment phenomenon addresses
the phenomenon of “hot issue” markets in a similar fashion (Loughran and Ritter
(2001)). It predicts that all IPOs that are in the “road show” stage o f going public when
29
there is an overall market rally, will have higher expected underpricing because offer
prices are not raised as much as they could be. Because of the length of the
bookbuilding period, which can take from four weeks to four months, the first day
returns of these IPOs will be correlated.
Shifter’s (1990) “Impresario” hypothesis can also explain the positive
autocorrelation in IPO activity and initial returns reported in the literature. “Hot”
markets appear when underwriters exploit a segment sought to be ripe for a ”fad”. Even
though many investors may be unwilling to follow a “fad”, they may find it profitable to
follow positive feedback investment strategies (Rajan and Servaes (1993)). Acting this
way, they may actually have caused the positive autocorrelation themselves. In the more
general setting of “fads” described by Aggarwal and Rivoli (1990), “fads” occur in “hot
issue” periods when investors are especially overoptimistic about the growth potential
of the firms that go public, induced by the “Impresario”, the investment bank taking the
company public. Firms time their IPOs in precisely these periods in order to take
advantage of “windows of opportunity”. It follows that “hot” markets for IPOs should
be concentrated in certain industry classes, dominated by specific underwriters and that
IPO activity should come from those companies for which issuing equity is always the
least favoured choice o f financing. Moreover, companies with the largest initial returns
should have the lowest subsequent aftermarket returns.
2.3 Return Dynamics in Aftermarket Trading
Most of the literature on aftermarket performance concentrates on how IPO
shares perform over three- to five years. Over those time horizons, IPO shares seem, on
average, to perform poorly when measured against various benchmarks. Ritter (1991)
finds that every dollar invested in a portfolio o f IPOs purchased at the closing market
30

price on the end of the first day of trading results in a terminal wealth of $1.3447 over
three years, while every dollar in the matching firm results in $1.6168, a ratio of only
0.841 during the same period. He performs the study for a total sample of 1,526 US
IPOs of common stock in 1975-84. The international evidence also supports the notion
of poor long-run performance. Alvarez and Gonzales (2001), Espenlaub, Gregory and
Tonks (1998), Giudici and Paleari (1999), Leleux and Muzyka (1998) or Schuster
(1996) all highlight low market-adjusted long-run returns for various European IPO
markets. Jain and Kini (1994) extend this evidence to show that long-run performance is
also accompanied by poor financial accounting performance post-IPO relative to pre-
IPO performance. However, because there has been a sustained effort to extend
empirical evidence on IPO performance beyond the past two decades, it has become
apparent that the results on long-run performance are sensitive to the time-period
chosen. In a large out-of-sample test, Gompers and Lemer (2001) study the five-year
aftermarket performance of a sample of 3,661 US IPOs from 1935 to 1972 and find that
the long-run performance of IPOs depends considerably on the method used for
calculating returns and performance. The authors conclude that “...While the results do
not rule out the possibility o f more broad-based sentiment-driven mispricing, they
provide little support of a distinct IPO effect.”
Another facet that has attracted much academic interest addresses the relation
between short- and long-run IPO returns. One of the first to document the dynamics in
aftermarket trading was Stoll and Curley (1970). They found that investors in new small
issues floated under Regulation A in 1957, 1959, and 1963, experienced lower long-run
rates of return than if they had invested in a portfolio of large stocks represented by the
Standard & Poor’s 425 Industrial Average. However, short-run price appreciation o f the
643 companies in the sample was considerably greater than the appreciation of large-
31
cap stocks. Considerable short-run overperformance is also reported in Ritter (1991)
and Schuster (1996).
It is difficult to explain these price dynamics in the IPO aftermarket within a
semi-rational setting. Miller (1977) proposes a theory that is consistent with the
empirical findings. Assuming the presence of short-selling constraints and
heterogeneous investors’ expectations, he argues that the prices of new issues are set not
by the appraisal of the typical investor, but by the small minority who think highly
enough o f the investment merits of the new issue to include it in their portfolio. This
“divergence of opinion” about a new issue is greatest when the stock is issued, either
because the company has not yet started operations, or because there is uncertainty
about the success of new products or the profitability of a major business expansion. As
a result, short-sale constraints lead to upward biases in stock prices, as pessimistic
investors are restricted from short-selling. Over time, as the variance o f opinion
decreases and the company acquires a history of earnings, the marginal investor’s
valuation will converge towards the mean valuation and IPOs will start to
underperform. Duffie, Garleanu and Pedersen (2002) present a dynamic model of the
determination of prices, lending fees and short interest that is consistent with this
theory. They show that, if lendable securities are difficult to locate, then the price of the
security is initially elevated and expected to decline over time. This decline increases in
the degree of heterogeneity o f beliefs of investors about the future value o f the security.
Harrison and Kreps (1978), Morris (1996) and Scheinkman and Xiong (2002) show that
short-selling constraints can lead to prices higher than the valuations o f all investors.
Empirically, Gecy, Musto and Reed (2001) find an extra cost to shorting hotter IPOs.
A number of other institutional arrangements in the short-run aftermarket,
unrelated to fundamentals, have an effect on prices. For example, some recent studies
32

examine the expiration of IPO lockup agreements. Lockup agreements are a feature of
US and IPOs in international markets and prohibit insider sales before a pre-specified
date, usually 180 calendar days after the IPO. Since insiders often own a majority of the
firm, the potential for an increase in the supply of tradable shares following lockup
expiration could have a significant effect on the value of the stock. Bradley, Jordan,
Roten, and Yi (2001), Brav and Gompers (2002) and Field and Hanka (2001) document
significant negative abnormal returns o f approximately two percent around lockup
expiration. Moreover, Bradley, Jordan and Ritter (2002) investigate the performance o f
IPOs around the expiration of the “quiet period” - typically the first 25 calendar days in
aftermarket trading when a company is still “in registration” and subject to a number of
regulatory restrictions that prohibit certain activities, such as analyst coverage. Using a
sample of 1,611 firms going public over the period 1996 to 2000, they find that firms,
for which coverage is initiated, experience a significantly positive abnormal return of
4.1 percent in a five-day period surrounding the end of the “quiet period”. This
compares to an insignificant 0.1 percent for firms that do not have coverage initiated.
Most of these abnormal returns experienced by firms with coverage occur in the days
before the quiet period expires. Furthermore, Aggarwal (2000) pays attention to the
stabilization activities of underwriters in the aftermarket and their influence on prices by
studying a sample of 137 US IPOs going public during May and July 1997. She finds
that direct intervention or “pure” stabilization, in which an identified stabilizing bid is
posted, is never done, and that aftermarket short-covering, which has the same result as
pure stabilization, but has no disclosure requirements, is the principal form of
stabilization. Stabilization by short-covering can occur because the underwriter initially
sells shares in excess o f the original amount offered, which is then covered by
exercising the overalottment option and/or by short covering in the aftermarket during
33

30 calendar days after the offering. She also finds that stabilization seems to have a
permanent rather than a temporary effect on prices, a similar observation made by
Schultz and Zaman (1994).
Several behavioural explanations have also been advanced for the empirical
findings. Teoh, Welch and Wong (1998) relate the analysis o f IPO performance to
earnings management and find that investors do not fully take into consideration that
financial accounts of companies going public are managed before the IPO, and therefore
base their valuation on a nai've extrapolation of the past. They use discretionary current
accruals as a proxy for earnings management and show that companies, which boost
their earnings most in the IPO year, also have the worst long- run performance. Ritter
(1991), Lemer (1994), Loughran and Ritter (1995, 2001) or Baker and Wurgler (2000)
discuss another set of behavioural explanations for poor long-run performance. They
suggest that stock prices periodically diverge from fundamental values, and that
managers and investment bankers take advantage of overpricing by selling stock to
overly optimistic investors. This in line with De Bondt and Thaler’s (1985) conjecture
that, at least for low-capitalization stocks, there is a negative relation between past and
subsequent abnormal returns on individual securities using holding periods of one year
or more which they interpret as evidence of market overreaction.
3 Data, Sample and Methodology
3.1 Data
In order to be included in the sample, the relevant companies pursuing an IPO
had to meet the following criteria: (1) the company’s main headquarter is registered in
Germany, France, Italy, The Netherlands, Spain, Sweden or Switzerland with the
34

obligation to publish consolidated and/or parent company accounts, (2) the company is
listed on one of the three tiers of the main stock exchange in the respective country: the
Official Market, the Official Parallel Market or the New Market, and meets the relevant
listing requirements,11 (3) each share is given an offer price o f 5.00 units of national
currency or more, (4) gross proceeds, measured in terms of end-1998 purchasing power,
of the equivalent of Euro (€) 2.0 million or more, and (5) the offering being unseasoned
1 ^and involved common and/or preferred stock. While the sample includes
Privatizations (13), spin-offs and equity-carve outs (26), we have excluded foreign
listings, Real Estate Investment Trusts (REITs), investment trust and certificates,
• 1 demutualizations and companies that transferred from one market segment to another .
The data was hand-collected individually from each of the respective country. It
is unique in its entirety as it spans over a relatively long period of time covering at least
one market cycle of IPO activity in the seven largest European countries ranked in terms
of market capitalization, excluding the UK, and is not commercially available.14 The
data collection involved a two-stage process:
First, in order to insure a most complete sample, we identified the IPOs by
collecting information from the individual stock exchanges, national publications in the
respective country or other sources such as regulatory agencies, central banks,
commercial providers and, if necessary, by directly contacting the issuing company.
This step included the search for full name o f the offering company, nationality, IPO
date and place o f the offering, total number of shares issued, public float adjusted for
11 Appendix C, Table 48, lists listing requirements in European countries in detail.12 The large number of IPOs issuing dual-class shares is a relatively unique feature of the Swedish IPO market. For Germany, for example, only seven companies issued dual-class shares during the sample period 1988 to 1998.13 For empirical evidence relating to privatizations or equity carve-outs, see D’Souza and Megginson (1999) or Vijh (1999).14 Capitaldata, a division of Euromoney PLC, is a commercial provider of IPO information. For the period 1988 to 1998, their IPO database includes around 550 companies, almost half of our database. This commercially available data includes only limited cross-sectional IPO characteristics.
35

overalottment options exercised, issue price, sector and year of foundation. We did not
collect data for issuing activity in the secondary market.15
For Germany, information provided by the Frankfurt Stock Exchange and the
various yearly issues of the Saling Aktienfuhrer were primary data sources of company
data.16 Data on French issuers and issuing characteristics was obtained from the annual
lists published by Euronext France and Societes cotees, 1996 and 1999 edition,
Cofisem. Italian IPO data came from Indici e Dati, 1992 and 1999 edition, Mediobanca,
and from the Italian Stock Exchange. Euronext Netherlands and Effectengids, 2000
edition, Kluwer, were the primary source for data on Dutch IPOs. Spanish IPO
company data was obtained from the Madrid Official Stock Exchange Bulletins and
from CNMV, the Spanish regulating agency. Swedish data is from annual reports of the
OM Stockholm Exchanges and from Six AB. The Swiss Stock Exchange and Swiss
Central Bank were sources of the data for the sample of Swiss IPOs.17
Second, we collected daily closing stock prices from the national stock market
operators, academic institutions and, if necessary, commercial services. Sources of the
German stock price data included the University of Karlsruhe Stock Price Database, the
Frankfurt Stock Exchange and daily issues o f the Frankfurter Allgemeine Zeitung.
French, Italian and Spanish Stock Price data was made available by Euronext Paris and
the Italian and Madrid Stock Exchange, respectively. Data on Swedish stock returns
was obtained from Six AB. Dutch and Swiss stock price data was collected from
Datastream. We used Dow Jones for the time-series data for the four size-based
benchmark indices. Macroeconomic data such as Exchange rates and GDP deflators was
collected from Datastream.
15 A large number of empirical studies link seasoned issuing activity with IPO performance. For European markets see, for example, Espenlaub and Tonks (1998) or Stehle, Erhardt and Przyborowsky (1998).16 We want to thank Hoppenstedt Finanzinformationen GmbH, for allowing access to their archives.17 Prof. Alfred Mettler kindly supplied fundamental data on Swiss IPOs issued between 1988 and 1990.
36

Stock prices are adjusted for dividends, stock splits or rights offerings and were,
for this section, calibrated to a European trading day calendar and converted into Euro
(€). Share prices represent closing prices and care was taken that quotations represented
actual trades. For our sector analysis, we use the Dow Jones STOXX global sector
classification standard.18
The resulting IPO sample is comprised of 973 companies that conducted an IPO
of common and/or preferred stock between 1988 and 1998 on one of the three main
market segments of the main national stock exchange operator in Germany (219
companies), France (323), Italy (77), The Netherlands (75), Spain (88), Sweden (148)
and Switzerland (43).19 Based on our original stock exchange records, this represents at
least 90 percent of IPO activity in Continental Europe between 1988 and 1998,
measured in terms of number of IPOs and aggregate gross proceeds.
The sample does not suffer from survivorship bias. Only seven companies were
delisted before their third-year anniversary. In this section, we look at IPOs issued over
the period 1988 to 1998 using stock returns through February 23, 2001. This implies a
declining sample size of 686 companies when measuring returns over three years and
381 companies when measuring returns over a five-year window. In Appendix B, Table
34 - 47, we provide results based on constant sample sizes o f 686 and 381 IPOs,
respectively. The results confirm that changes in measurement periods and sample sizes
do not change the qualitative nature o f the results presented in this section.
18 The Dow Jones STOXX global industry classification standard is displayed in Appendix A.19 The market segments are (Number of IPOs in brackets): Germany (Deutsche Borse AG: Amtlicher Handel (80), Geregelter Markt (89), Neuer Markt (50)); France (SBF-Paris Bourse SA*: Premier Marche (21), Second Marche (231), Nouveau Marche (71)); Italy (Borsa Italiana SpA: Borsa Valori (70) Mercato Ristretto (7)); The Netherlands (Amsterdam Exchanges NV*: Officiele Markt, (56) Officiele Parallel Markt (8)); Spain (Bolsa de Madrid SA: Primer Mercado (56), Segundo Mercado (32)); Sweden (OM Stockholm Exchanges AB: A-list (15), OTC-list (52), O-list (81)); and Switzerland (SWX Swiss Exchange AG: SWX Hauptsegment, (35) SWX Nebensegment (8)). ""Merged to Euronext SA.
37

Table 1Market Conditions and Sample Characteristics
The sample is comprised of 973 European IPOs. Age is defined as the year of going public minus the year of foundation, with firms founded before 1901 assumed to be founded in 1901. New Economy firms (as a percentage of total number of issues) belong to market sectors 5,13,16 and 17 representing Technology, Media, Telecommunication and Healthcare, respectively, in the attached Dow Jones STOXX global sector classification standard. Public Float is the percentage of equity offered. Initial Return is defined as the percentage difference between the final offer price and the first-day closing price. Market measures stock market momentum using the value- weighted Dow Jones STOXX broad-market index, excluding the UK. Size is the total number of shares issued times the final offer price and is expressed in constant end- 1998 prices using monthly national consumer price indices. Issuing Volume is defined as the total number of shares issued multiplied by the final offer price and expressed in constant end-1998 prices. For the measurement of inflation-adjusted size and issuing volume, amounts in national currency were concerted using the appropriate € exchange rate at the IPO date. The monthly distribution of European IPOs is as follows: Month of January (25 IPOs), February (30), March (59), April (65), May (95), June (184), July (131), August (25), September (57), October (107), November (98) and December (97)._____________________________________________________________________
IPO Market
Conditions
Duration
Months
Months Offerings
Number Number
Age
Years
New
Economy
Percent
Public
Float
Percent
Initial Returns
Mean Median
Percent Percent
Market
Change
Percent
Size
Median
€ million
Issuing Volume
Total Mean Median
€ billion € million € million
Cold Market Jan-88 - Aug-88 8 41 26 27 36 7.08 4.00 18.66 78.45 2,425.1 59,15 24.74Cold Market Apr-90 - Sep-93 42 127 40 10 31 6.13 1.70 8.52 108.97 12,078.6 95.11 35.29Cold Market May-94 - Mar-96 23 148 34 20 35 8.25 3.80 12.57 85.56 26,700.0 180.41 26.82All Cold Markets 73 316 35 17 34 7.25 2.65 90.32 41,203.7 130.39 30.14
Hot Market Sep-88 - Mar-90 19 130 35 18 31 17.66 10.00 41.94 105.57 12,708.2 97.76 27.09Hot Market Oct-93 - Apr-94 7 31 30 35 31 24.49 20.90 13.12 73.28 6,505.8 209.86 22.44Hot Market Apr-96 - Dec-98 33 496 21 37 34 21.64 9,00 92.46 60.32 63,219.0 127.46 16.52All Hot Markets 59 657 24 33 33 20.98 9.52 66.24 82,433.0 125.47 18.33
All 973 issues Jan-88 - Dec-98 132 973 28 28 33 16.52 7.14 347.97 73.93 123,636.8 127.07 22.02
38

3.2 Sample
In Table 1, we provide some summary statistics for our sample. While
presenting evidence for the sample as a whole, we also divide IPOs based on whether
they were issued in “hot” or “cold” markets. Because of big fluctuations in the level o f
the stock market and IPO activity throughout the sample period, this potentially enables
us to draw more inferences about the robustness of the patterns associated with IPOs.
The most frequently used definition of “hot” IPO markets is based on “volume”.
Loughran and Ritter (1995), for example, describe the 1980s as “hot” because most of
that decade had much higher issuance volume than the 1970s. Helwege and Liang
(2001) define “hot” and “cold” months according to volume of issuance, based on a
three-month centred moving average o f the number of IPOs for each month in the
sample. Similar to Ritter (1984) and Ibbotson and Jaffe (1975), we define “hot” IPO
markets based on the level o f underpricing.21 We also include a proxy for the general
level of the stock market into the analysis. Initially, we define those months with higher
average monthly underpricing compared to median underpricing for the total sample as
“hot” IPO months; we consider those months during which the mean is lower than the
median as “cold” IPO months. We apply the same procedure to our proxy for market
returns. Months during which the market return exceeds the median for the monthly
series o f 132 months (January 1988 - December 1998), are defined as “hot” market
months. Likewise, months during which the market return is less than the median are
considered “cold” months. Finally, we match “hot” (“cold”) IPO months with “hot”
20 The sample differs from US studies in some important respects. Our sample period does not overlap with Ritter (1991) who looks at IPOs from 1971 to 1988. Neither does it completely overlap with Brav and Gompers (1997) who study 3,407 non venture-backed and 934 venture-backed US IPOs between 1975 and 1992. Moreover, while Ritter (1991) and Brav and Gompers (1997) focus on reporting long-run returns over three and five years, we present evidence on the dynamics of short- and long-run performance over a variety of dimensions.
Because of the presence of some very large IPOs, defining “hot” and “cold” markets by volume does potentially lead to misleading results.
39

(“cold”) market months to identify “hot” and “cold” IPO markets. During 118 months,
(89 percent of the entire period), a “hot” (“cold”) IPO month corresponds to a “hot”
(“cold”) market month. During 14 months, a “hot” (“cold”) IPO month does not
correspond to a “hot” (“cold”) market months. We attribute part of this to seasonalities
in the underwriting industry. The overall pattern confirms our earlier conjecture about
the close link between the level o f the stock market and underpricing.
Of the 132 months, we identify 73 months as “cold” markets and 59 months as
“hot” markets and mark three individual “hot” and “cold” market periods. In more than
half of the 132 issuing months, the general market was either stable or falling. For
example, the longest “cold” market period occurred between April 1990 and September
1993. During this period, only 127 IPOs went public, averaging 6.13 percent initial
return. This period was characterized by subdued economic conditions in Continental
Europe following the German Unification. During the 42-month period, the Dow Jones
STOXX broad-market index recorded a rise of 8.52 percent. Conversely, during the 33-
month “hot” market period between April 1996 and December 1998, 496 IPOs went
public with an average initial return of 21.64 percent. During this period, the general
level of the market rose by 92.46 percent. Interestingly, the Asian and Russian Financial
Crises in the autumn of 1998 did not have an impact on European IPO activity.
Between 1988 and 1998, 973 European companies raised a total o f €123.6 billion
on the stock market. Ritter (2001) reports that during the same period, 3,872 IPOs raised
a total of $237.9 billion in the US. The average issuing volume o f European IPOs o f
€127.1 million, however, is higher than the one reported for the US ($61.4 million).
Some large offerings such as privatizations (13) and equity carveouts (26) account for
part of the difference. For example, privatizations raised a total o f €44.4 billion with a
median issuing volume of €2.6 billion. On average, European companies going public
40
have sold 33 percent of their company to the public (henceforth “public float”), which
remained stable throughout the sample period. This observation is within the close
range o f 30 percent and 36 percent reported by Ritter (2001) for US IPOs issued
between 1992 and 1998. Moreover, the average European IPO was 28 years old at the
time of going public. While the average age of European IPOs has declined throughout
the sample period, it is still high compared to companies going public in the US. Ritter
(1991), for example, finds an average age of six years. As shown in Appendix A,
European IPOs are clearly widespread among the various industries. This is different to
Helwege and Liang (2001) who study 2,072 US IPOs between 1982 and 1993 and point
out that US IPOs during this period are drawn largely from the same set of high-
technology industries.
Table 1 shows that the sample composition is clustered in certain industries: in
“cold” markets, the percentage of New Economy companies o f total IPO activity is
almost half o f what is observed for IPOs issued under “hot” markets. Moreover, the
average size of European IPOs in “cold” markets is €90.3 million compared to €66.2
million in “hot” markets. This reinforces the fact that IPO activity in “cold” markets,
during which the stock market is generally more stable or declining, is associated with
larger and more mature IPOs in Old Economy industries. Table 1 also demonstrates the
changing composition of IPO issuers. It indicates that during the 1990s, New Economy
sectors have gradually taken a bigger share of the total IPO market. During this time
IPO age, size and median issuing volume has also declined considerably. This
highlights the fact that money, previously flowing into mature industries with lower
growth prospects, had started to flow into young, technology-oriented companies
focusing on growth.
41

3.3 Methodology
While the estimation of initial returns is less problematic, there are several
factors that must be taken into account when estimating abnormal returns over longer
time horizons. Barber and Lyon (1997) and Kothari and Warner (1997) both highlight
the problems associated with calculating long-run abnormal returns using either a
reference portfolio or an asset pricing model.
Barber and Lyon (1997) demonstrate that many of the commonly used matching
procedures are poorly specified and abnormal return estimates can be systematically
nonzero. They also show that seemingly minor changes in experimental features can
have a major impact on the results. These include the benchmark for measuring
abnormal returns, cumulating procedures or the populations from which securities are
drawn.22 In this context, they isolate one parametric procedure that may be well-
specified, specifically to calculate abnormal returns as the buy-and-hold returns on a
sample firm less the buy-and-hold return on a control firm with similar size and book-
to-market characteristics.23 The authors also suggest a rebalancing bias that arises
because the compounded returns o f a reference portfolio, such as an equally weighted
market index, are usually calculated assuming periodic rebalancing, whereas the returns
of sample firms are compounded without rebalancing. Furthermore, they also point out
that a new listing bias arises when an IPO firm, which is known to perform badly
following an IPO, is added to an index which will cause the index to underperform.
Kothari and Warner (1997) also show that long-horizon tests are misspecified. They
22 In context of European Markets, Dimson and Marsh (1986), report the importance of controlling for the size effect in the United Kingdom. Moreover, Brav and Gompers (1997) find that most institutional investors will not be significantly hurt by investing in IPOs because they usually do not buy the small issues that underperform most.23For the European market, this is difficult because of the relative infancy of many of the stock markets in the study, with few comparable quoted firms and benchmarks available over a long period of time. The use of the Eurostoxx value-weighted size indices as benchmarks may also induce biases that result from the feet that these market indices are value-weighted
42

find that parametric long-horizon tests will often indicate abnormal performance when
none is present and suggest that bootstrap procedures might be a promising way to
minimize test statistic misspecification. Moreover, they suggest a survivorship bias,
which occurs when the de-listed firms are simply removed and the index is rebalanced.
This bias tends to cause the index to outperform a portfolio that includes delisted firms.
It must be noted that the inferences drawn by these authors can themselves be
sensitive to experimental design. Both Barber and Lyon (1997) and Kothari and Warner
(1997), for example, focus on measuring portfolio long-horizon performance in event
time, rather than calendar time. As Fama (1998) points out, event time results may be
misleading about the pervasiveness of performance because any verification of an
observed puzzle may only reflect investor sentiment. Moreover, as noted in Shleifer and
Summers (1990), many trading strategies are based on pseudo-signals, noise, and
popular models are correlated, leading to aggregate demand shifts. Consequently, to the
degree that the design of the empirical experiment has an impact on the confidence of
the reliability of inferences from long-horizon studies, the interpretation of the results
on the performance of European IPOs requires caution.
For the evaluation of aftermarket IPO returns, our approach is similar to the
empirical methodology in Ritter (1991). Consequently, we show results using but-and-
hold returns (BHRs), when reporting long-term abnormal performance of IPOs. This
procedure assumes no monthly portfolio rebalancing.24 However, we extend the
performance analysis across several dimensions for the European market. Because we
are interested in the dynamics of aftermarket performance, we report aftermarket returns
over various holding periods. Furthermore, we also determine how the aftermarket
24 We have also calculated performance using Cumulative Abnormal Returns (CARs). While not shown separately in this section, we report the results in Appendix B, Table 33 amd Appendix B, Figure 10, respectively. The results cm monthly portfolio rebalancing confirm that the use of BHRs biases the long- run performance upwards, a finding consistent with the literature (Ritter (1991) or Teoh, Welch and Wong (1998)). For evidence on the individual European countries, we refer to Chapter III.
43

performance o f European IPOs issued in “hot” and “cold” markets differs. Finally, we
are also interested in whether issuing characteristics are related to these performance
dynamics and time-varying market conditions. We calculate equally-weighted raw- and
benchmark-adjusted returns over 1, 3, 12, 36 and 60 months, whereas one month is
defined as a consecutive 21-day-trading interval after the close of the first day of
trading. In order to eliminate the effect of national holidays, stock prices for the national
countries were first calibrated to a European trading day calendar. Returns were then
calculated whenever at least one of the seven markets covered in this study was trading.
If the IPO was delisted before the end o f the measurement period, we computed the
return until the delisting date. Aftermarket returns are compared with four alternative
size-based benchmarks, all o f which are value-weighted: (1) The Dow Jones STOXX
broad-market index, excluding UK, which captures the ffee-float adjusted market
capitalization o f around 95 percent of the market capitalization o f the countries in our
sample, includes 404 European companies and is similar in terms of industry
composition to the IPO sample, (2) the Dow Jones STOXX large-cap index, excluding
UK companies, (3) the Dow Jones STOXX mid-cap index, excluding UK companies,
and (4) the Dow Jones STOXX small-cap index, excluding UK companies. These
indices have a history dating back to the start of the sample period in January 1988.
For this section, we also report wealth relatives (WR) by taking the ratio of one
plus the IPO return divided by one plus the chosen benchmark return. A wealth relative
less than one indicates that the IPO underperforms the chosen benchmark. Similarly, a
wealth relative greater than one indicates that the IPO outperforms the chosen
benchmark.26
25 The chosen benchmarks also form the basis of derivative products and exchange-traded funds (ETFs).26 We do not adjust for betas. A broad literature argues that differences in betas are too small to have significant effects on the conclusions (Ibbotson (1975), Clarkson and Thomson (1990) or Chan and Lakonishok (1992) for the US market, and Keloharju (1993) or Leleux (1996) for European Markets).
44

Table 2Initial Returns of European IPOs
Descriptive statistics for the initial return performance of European IPOs (1988-1998) under alternative market conditions and categorized according to age, sector, size, public float (%), and average daily standard deviation (S.D.) for the first 21 days of trading (unadjusted). The initial return is the difference from the final offering price to the first-day closing price. For example, for the youngest age group in “hot” markets, the initial return is 0.2496*100 = 24.96 percent. Based on 132 monthly observations, the first-order autocorrelation coefficient is i) for number of offerings: 0.597“ (0.086), ii) for average monthly initial returns: 0.300* (0.086). In the cross-section of observations, we find a first-order autocorrelation coefficient for initial returns of 0.180 for Old Economy Stocks versus 0.481 for New Economy stocks. The first-order autocorrelation is higher for the number of offerings: 0.238 for Old Economy Stocks and 0.639 for New Economy stocks. All coefficients are highly significant at conventional levels. Because of the influence of few large privatization offerings, we do not find significant autocorrelation in issuing volume; Standard Errors (S.E.) in parenthesis.________________________________________________
Year Market Condition Number of Issues
Category 1988-1998 Hot Cold Hot-Cold All Hot Cold
Age < 14 0.2068* 0.2496* 0.0766“ 0.1731* 420 316 104(0.0186) (0.0239) (0.0126)
15 < Age <36 0.1654* 0.1990* 0.0893* 0.1096* 297 206 91(0.0156) (0.0204) (0.0194)
Age> 37 0.0969* 0.1333* 0.0562* 0.0770* 256 135 121(0.0130) (0.0165) (0.0199)
New Economy 0.2718* 0.3126* 0.1048* 0.2078* 270 217 53(0.0259) (0.0313) (0.0198)
Old Economy 0.1243* 0.1592* 0.0659* 0.0932* 703 440 263(0.0092) (0.0127) (0.0117)
Small firms 0.1847* 0.2129* 0.1089* 0.1040* 361 263 98(0.0176) (0.0221) (0.0249)
Medium firms 0.1729* 0.2259* 0.0619* 0.1639* 421 285 136(0.0161) (0.0223) (0.0124)
Large firms 0.1114* 0.1604* 0.0463* 0.1141* 191 109 82(0.0153) (0.0231) (0.0158)
Public Float < 20 0.1413* 0.1743* 0.0794* 0.0950* 273 178 95(0.0121) (0.0166) (0.0134)
20 < Public Float < 30 0.2143* 0.2619“ 0.0880* 0.1740* 241 175 66(0.0229) (0.0277) (0.0359)
30 < Public Float < 50 0.1795* 0.2399* 0.0580“ 0.1819* 283 189 94(0.0225) (0.0322) (0.0132)
Public Float > 50 0.1122* 0.1360“ 0.0672* 0.0688* 176 115 61(0.0199) (0.0278) (0.0225)
0.0000 < S.D. < 0.0124 0.0542* 0.0810“ 0.0352* 0.0458* 245 102 143(0.0054) (0.0104) (0.0051)
0.0125 < S.D. < 0.0196 0.0969* 0.1288* 0.0485* 0.0803* 244 147 97(0.0108) (0.0158) (0.0109)
0.0197 < S.D. < 0.0314 0.1333* 0.1403* 0.1032* 0.0370 243 197 46(0.0119) (0.0134) (0.0258)
0.0315 < S.D. < oo 0.3794* 0.3935“ 0.2804* 0.1131 241 211 30(0.0329) (0.0357) (0.0828)
All IPOs (Mean) 0.1652* 0.2098* 0.0725* 0.1374* 973 657 316(0.0100) (0.0137) (0.0103)
All IPOs (Median) 0.0714 0.0952 0.0265 0.0687 973 657 316
a’b,c denote statistical significance at the 0.01, 0.05, and 0.10 levels, respectively, based on a simple t-test.
45

4 Performance Analysis of European Initial Public Offerings
4.1 Initial Returns
In Table 2, we present evidence concerning the underpricing phenomenon. The
average initial return for the 973 European firms that went public between 1988 and
1998 is 16.52 percent. The median is positive 7.14 percent where only 86 o f the 973
offerings (8.84 percent) had negative unadjusted initial returns. 129 IPOs (13.26
percent) did not change from the offering price, supporting the conjecture that positive
mean initial returns result from a partially censored left tail, which itself stems from
stabilization activities by underwriters (Ruud (1993) or Aggarwal (2000)). The findings
are generally consistent with US evidence. For a sample of 6,249 US IPOs between
1980 and 2001, Ritter and Welch (2002) find average underpricing to be 18.8 percent,
ranging from 5.4 percent to 22.3 percent during our sample period.
In Figure 1, we graph IPO activity and stock market returns for the sample o f
European IPOs. The first-order autocorrelation coefficient for the time series o f 132
monthly observations o f average initial returns between January 1988 and December
1998 is 0.300. The autocorrelation is higher when looking at the monthly number of
offerings, with a first-order autocorrelation coefficient of 0.597 during the period
between 1988 and 1998. Both coefficients are highly significant at conventional levels.
Figure 1 also underlines that initial returns and issuing activity in Europe are sensitive
to the general state of the stock market.
Table 2 shows the substantial variability in average underpricing when
categorizing the sample according to the issuing characteristics. The model uses age,
market sector and the standard deviation of aftermarket stock prices as measures o f
uncertainty, producing results that confirm the monotonic relationship between risk and
46
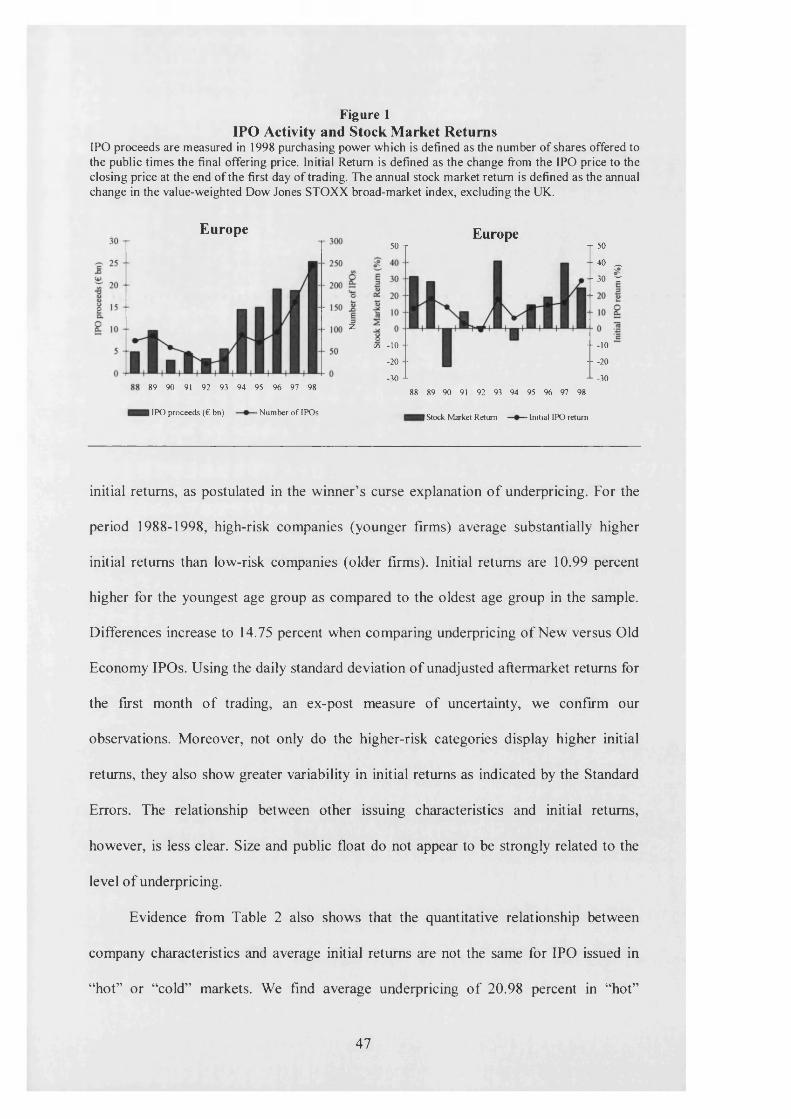
Figure 1IPO Activity and Stock Market Returns
IPO proceeds are measured in 1998 purchasing power which is defined as the number of shares offered to the public times the final offering price. Initial Return is defined as the change from the IPO price to the closing price at the end of the first day of trading. The annual stock market return is defined as the annual change in the value-weighted Dow Jones STOXX broad-market index, excluding the UK.
Europe Europe
89 90 91 92 93 94 95 % 97 98
50 T T 50
-4 0 _
-3 0 'T
zCn -1 0 - - - -10
- - -20-20 -
-30-30 -188 89 90 91 92 93 94 95 % 97 98
I IPO proceeds (€ bn) ■ Number o f IPOs I Stock Market Return - Initial IPO return
initial returns, as postulated in the winner’s curse explanation o f underpricing. For the
period 1988-1998, high-risk companies (younger firms) average substantially higher
initial returns than low-risk companies (older firms). Initial returns are 10.99 percent
higher for the youngest age group as compared to the oldest age group in the sample.
Differences increase to 14.75 percent when comparing underpricing of New versus Old
Economy IPOs. Using the daily standard deviation o f unadjusted aftermarket returns for
the first month of trading, an ex-post measure of uncertainty, we confirm our
observations. Moreover, not only do the higher-risk categories display higher initial
returns, they also show greater variability in initial returns as indicated by the Standard
Errors. The relationship between other issuing characteristics and initial returns,
however, is less clear. Size and public float do not appear to be strongly related to the
level of underpricing.
Evidence from Table 2 also shows that the quantitative relationship between
company characteristics and average initial returns are not the same for IPO issued in
“hot” or “cold” markets. We find average underpricing of 20.98 percent in “hot”
47
markets versus 7.25 percent in “cold” markets, a difference of 13.74 percent. Much of
this difference is attributable to underpricing among New Economy IPOs. This
observation is similar to Ritter (1984) who relates the “hot issue” market of 1980-1981
to IPOs in the natural resources sector. For each issuing characteristic, we also find that
average initial returns are significantly higher in “hot” as opposed to “cold” markets.
This difference is most pronounced in the category of New Economy IPOs, where the
difference amounts to 20.78 percent. The findings confirm the effect o f clustering by
industry in “hot” markets.
It is important to put the magnitude of initial returns into perspective. Loughran
and Ritter (2002) report that from 1990 to 1998, companies going public in the US left a
total o f $27.6 billion on the table, calculated by multiplying the first-day price gain by
the number of shares sold. Investment bankers collected fees of €13 billion during this
period. They found that most of the money left on the table came from a minority o f
IPOs whose offering price had been revised upwards in the filing range, a finding
consistent with the partial adjustment phenomenon (Hanley (1993)). Although the
average amount left on the table is $9.1 million, the median is only $2.3 million.
Loughran and Ritter (2002) attribute the willingness to leave such large amounts on the
table to Prospect Theory, whereby, in most situations, issuers will sum-up the wealth
loss from underpricing with the larger wealth gain obtained from the retained shares.
They also argue that leaving money on the table is an indirect form of underwriter
compensation.
For the sample of European IPOs, we find similar tendencies. The total amount of
money left on the table during the period 1990-1998 amounted to €10.9 billion with
underwriters collecting fees upwards o f €6 billion. We also find that most IPOs left
relatively little money on the table. The average amount left on the table amounted to
48

€13.4 million while the median was only €1.1 million. However, government
privatizations had a strong effect on the results. When excluding privatization issues,
which accounted for €5.2 billion o f money left on the table, the average amount of
money left on the table falls to €7.2 million.27 As Perotti and Guney (1993), Perotti
(1995), Shafik (1996), and Jones, Megginson, Nash, and Netter (1999) all point out,
governments and their investment bankers have become extremely adept at
manipulating the offer price and allocation terms of IPOs in order to achieve multiple,
often competing, political and economic objectives. During the 1990s, for example,
European governments decided to kick-start the development of a European equity
culture by allocating discounted shares from formerly state-owned monopolies, such as
telecommunications companies, to individual retail investors.
4.2 Aftermarket Returns
In Table 3, we report the buy-and-hold performance for European IPOs issued
between 1988 and 1998 over different holding periods starting from the close o f the first
day o f trading. In Panel A, we report the benchmark-adjusted equally-weighted
aftermarket performance for different holding periods, independent of the market
condition at the IPO date. The results indicate that the sample o f European IPOs
outperformed all the benchmarks up to the first year of aftermarket trading. Over 12
months, for example, the IPOs earned 27.79 percent, on average, while the broad market
index earned 15.50 percent, a wealth relative o f 1.11. However, the broad-market and
large-cap market-adjusted wealth relatives fall substantially when measuring
the aftermarket performance over longer periods. Over three years, for example, IPOs
27 While raising €27.5 billion, four privatizations (Deutsche Telecom AG, France Telecom SA, TNT Poest Group NV and Swisscom AG) accounted for €4.0 billion of money left on the table. From 1996 onwards, each of these companies were brought to the market by using the bookbuilding procedure and recorded significant average underpricing (14.02 percent).
49

Table 3Aftermarket Performance of European IPOs
The sample contains 973 European IPOs between 1988 and 1998. Aftermarket returns are measured as equally-weighted buy-and-hold returns, whereas one month is defined as a consecutive 21-day trading interval from the first closing price, using European trading days, assuming a declining sample size. The value-weighted Dow Jones STOXX size indices (Broad-Market, Large-Caps, Mid-Caps and Small-Caps), excluding UK, were used as a proxy for the market benchmark. The wealth relative is the ratio of one plus the average aftermarket period buy-and-hold IPO return, divided by one plus the average aftermarket period benchmark buy-and-hold return. For example, for the month 36 adjustment of IPO returns for the movement in the broad- market benchmark, (1 + 0.6791)7(1+0.5947) = 1.05; Standard Errors (S.E.) in
Panel A: Mean Aftermarket Performance o f IPOs: All Market Conditions
IPO and Benchmark ReturnsIPO Broad- Wealth Large- Wealth Mid- Wealth Small- Wealth
Aftermarket Return11 xL 1 A AA 1 AH
Market Relative Caps Relative Caps Relative Capsa m n n a 1 m b n n ' i n * - a i n i a a i a j ! i n i l a a a i / -
Relative1 AAfl
(N=973) Month 3
(N=972) Month 12
(N=970) Month 36
(N=686) Month 60
(N=381)
(0.0068) (0.0016) 0.0591* 0.0276* (0.0111) (0.0035) 0.2779* 0.1550* (0.0582) (0.0057) 0.6791* 0.5947* (0.1746) (0.0172) 0.5974* 0.6179* (0.1245) (0.0351)
(0.0066)1.03*
(0.0104)l . l l b
(0.0575)1.05
(0.1729)0.99
(0.0017)0.0339*(0.0035)0.1791*(0.0057)0.7037*(0.0184)1.1974*
(0.1204) (0.0426)
(0.0066)1.02b
(0.0105)1.08°
(0.0575)0.99
(0.1729)0.73*
(0.1177)
(0.0015) (0.0066) 0.0102* 1.05*(0.0036) (0.0105) 0.0910* 1.17*(0.0058) (0.0575) 0.3462* 1.25°(0.0120) (0.1733) 0.5313* 1.04(0.0228) (0.1193)
(0.0016)- 0 . 0101*
(0.0039)0.0173*(0.0061)0.0951*(0.0091)0.0933*(0.0151)
(0.0066)1.07*
(0.0105)1.26*
(0.0578)1.53*
(0.1735)1.46*
(0.1209)
Panel B: Mean Aftermarket Performance o f IPOs: Hot Markets
IPO and Benchmark Returns
AftermarketIPO Broad-
Retum MarketWealthRelative
Large-Caps
WealthRelative
Mid-Caps
WealthRelative
Small-Caps
WealthRelative
Month 1 (N=657)
Month 3 (N=656)
Month 12 (N=655)
Month 36 (N=389)
Month 60 (N=119)
0.0442*(0.0094)0.0829*(0.0156)0.3439*(0.0845)0.8568*(0.3014)0.2795b(0.1231)
0.0232“(0.0021)0.0371*(0.0047)0.1825*(0.0075)0.6120*(0.0239)0.1264*(0.0310)
1.02°(0.0093)
1.04*(0.0147)
1.14c(0.0837)
1.15(0.2997)
1.14(0.1228)
0.0264*(0.0022)0.0436*(0.0047)0.2068*(0.0076)0.7244*(0.0255)0.6066*(0.0343)
1.02°(0.0093)
1.04*(0.0147)
1.11(0.0837)
1.08(0.2997)
0.80*(0.1229)
0.0131*(0.0020)0.0145*(0.0048)0 . 1022*
(0.0075)0.3146*(0.0151)0.2257*(0.0194)
1.03*(0.0092)
1.07*(0.0147)
1.22*
(0.0836)1.41°
(0.3001)1.04
(0.1212)
0.0039(0.0020)-0.0066(0.0052)0.0292*(0.0078)0.0775*(0.0124)-0.0903*(0.0100)
1.04*(0.0092)
1.09“(0.0148)
1.31*(0.0839)
1.72*(0.3002)
1.41*(0.1222)
Panel C: Mean Aftermarket Performance o f IPOs: Cold Markets
IPO and Benchmark ReturnsIPO
Aftermarket ReturnBroad- Wealth Large- Wealth Mid- Wealth Small- WealthMarket Relative Caps Relative Caps Relative Caps Relative
Month 1 0.0041 0.0066* 1.00(N=316) (0.0069) (0.0022) (0.0068)
Month 3 0.0097 0.0077° 1.00(N=316) (0.0103) (0.0043) (0.0098)
Month 12 0.1406* 0.0978* 1.04(N=315) (0.0352) (0.0074) (0.0333)
Month 36 0.4465* 0.5719* 0.92°(N=297) (0.0810) (0.0243) (0.0734)
Month 60 0.7418* 0.8412* 0.95(N=262) (0.1716) (0.0425) (0.1658)
0.0087* 1.00 0.0048° 1.00 -0.0033 1.01(0.0022) (0.0068) (0.0023) (0.0068) (0.0024) (0.0069)0.0137“ 1.00 0.0014 1.01 -0.0175* 1.03*(0.0042) (0.0098) (0.0045) (0.0098) (0.0051) (0.0100)0.1215* 1.02 0.0679* 1.07b -0.0076 1.15*(0.0067) (0.0334) (0.0085) (0.0333) (0.0097) (0.0338)0.6766* 0.86* 0.3875* 1.04 0.1182* 1.29“(0.0262) (0.0733) (0.0191) (0.0742) (0.0133) (0.0764)1.4657* 0.71* 0.6701* 1.04 0.1766* 1.48*
(0.0522) (0.1614) (0.0281) (0.1646) (0.0194) (0.1669)*’b,c denote statistical significance at the 0.01,0.05, and 0.10 levels, respectively, based on a simple t-test.
50
returned 67.91 percent on average while the broad market returned 59.47 percent, a ratio
of 1.05. Panel A also shows that IPO performance is sensitive to the benchmark
employed. Across all measurement horizons, IPOs perform better relative to small-caps
than relative to large-caps. In Panels B and C of Table 3, we present results calculated
according to the market condition at the time of the IPO. We find that the favourable
aftermarket IPO performance is mainly driven by outperformance o f IPOs issued in
“hot” markets. IPOs issued in “cold” markets underperform in the long-run. For
example, investing in the average sample o f IPOs in “cold” markets would have left the
investor with only €0.92 relative to each Euro invested in the broad-market index after
three years, while rendering €1.15 if invested during a “hot” market period.
While not reported separately, the long-run performance picture changes
dramatically when looking at the median IPO. A strategy of investing in the median IPO
at the end of the first day of trading and holding over a three-year period, would have
left the investor with only €0.67 relative to each Euro invested in the broad-market
index. This underlines the skewness of the return distribution with only 28 percent o f
the issuers reporting positive broad-market-adjusted returns, and some extreme winners
dominating the mean return picture. In Appendix B, Table 32, we have also calculated
value-weighted results for the aftermarket performance o f European IPOs. Brav and
Gompers (1997) find that value-weighting significantly reduces performance
differences. For the sample o f European IPOs, however, value-weighting does not
significantly change the results from equally-weighting. Indeed, the three-year broad-
market-adjusted wealth relative is 1.06 compared to 1.05 for the equally-weighted
sample of European IPOs. The wealth relatives fall to 0.73 (equally-weighted) and 0.74
(value-weighted) when measured over five years, respectively.
51

4.3 Cross-Sectional Results
4.3.1 Performance Categorized by Initial Returns
In order to shed more light on the dynamics o f European IPO performance, this
section distinguishes firms by issuing characteristic and provides time-series evidence
of performance. For each issuing characteristic, we divide the sample into sub-samples
and use dummy variables to distinguish each subsample. The resulting regression
coefficients measure the difference in average market-adjusted returns across
subsamples, calculated for each measurement horizon and market condition. In the rest
of this chapter, we will focus on reporting the results adjusted for movements in the
value-weighted Dow Jones STOXX broad-market index, excluding the UK.
In Table 4, firms are segmented by the initial return of the IPO. The results are
categorized according to four initial return categories and across three dimensions: IPOs
issued in all market conditions, “hot” markets, and “cold” markets. Panel A reveals that
there is a tendency for companies that have the highest initial returns to have the best
aftermarket performance across all measurement horizons. Companies that have the
lowest initial returns also exhibit the worst aftermarket performance. The result extends
to all measurement horizons and is most significant in the short-run. Over 36 months,
for example, the difference between the market-adjusted aftermarket performance
between highest and lowest initial returns category is 65.52 percent. In Panels B and C,
we are able to disentangle this observation by looking at IPOs issued in “hot” and
“cold” markets separately. For IPOs issued in “cold” markets, we find that the positive
relationship between initial returns and broad-market-adjusted aftermarket performance
is more consistent and more significant, albeit less in magnitude, compared
52

Table 4Aftermarket Performance Categorized by Initial Return
Ri = a + /?iDu + + PiDx + EjThe model is estimated for each of the return measurement horizons (1,3, 12, 36 and 60 months) and for different market conditions (All Market Conditions, Hot Markets and Cold Markets). R* is the broad-market-adjusted return. Du, D2i, and D3j are (0,1) dummy variables taking the value of 1 if the IPO falls into the specified initial return category and 0 otherwise. The initial return is the percentage difference from the final offering price to the first-day closing price and divided into four categories: IPOs with initial returns of not more than 0%, IPOs with more than 0% but less than 7% initial returns, IPOs with at least 7% but less than 20% initial returns and IPOs with more than 20% initial returns; Standard Errors (S.E.) in parentheses. This table assumes a declining sample size.________________________________________________________
Panel A: Aftermarket Performance o f IPOs Categorized by Initial Return: All Market ConditionsNumber of Issues
Aftermarket Ri a S.E. P \ S.E. P i S.E. f i i S.E. Total D=0 D=1 D=2 D=3Month 1 0.0134” -0.0226 (0.0138) -0.0180 (0.0184) 0.0678“ (0.0188) 0.0963“ (0.0190) 973 215 270 250 238Month 3 0.0315“ -0.0424 (0.0219) 0.0217 (0.0293) 0.1227“ (0.0298) 0.1483“ (0.0301) 972 214 270 250 238Month 12 0.1229b -0,0436 (0,1225) 0.1826 (0.1643) 0.2671 (0.1669) 0.1923 (0.1688) 970 214 268 250 238Month 36 0.0845 -0.3006 (0.3676) 0.6181 (0.4882) 0.2319 (0.4961) 0.6552 (0.5216) 686 152 199 185 150Month 60 -0.0205 -0.1792 (0.2375) -0.0035 (0.3140) -0.1228 (0.3341) 1.1742“ (0.3779) 381 95 127 97 62
Panel B: Aftermarket Performance o f IPOs Categorized by Initial Return: Hot MarketsNumber of Issues
Aftermarket Ri a S.E. fix S.E. f i i S.E. f i i S.E. Total D=0 D=1 D=2 D=3Month 1 0.0210b -0.0146 (0.0209) -0.0407 (0.0282) 0.06506 (0.0272) 0.0876“ (0.0265) 657 123 151 178 205Month 3 0.0458“ -0.0367 (0.0337) 0.0153 (0.0453) 0.1275“ (0.0437) 0.1419“ (0.0426) 656 122 151 178 205Month 12 0.1614° -0.0705 (0.1939) 0.3656 (0.2611) 0.3311 (0.2517) 0.1859 (0.2449) 655 122 150 178 205Month 36 0.2448 -0.5121 (0.7391) 1.5288 (0.9714) 0.5059 (0.9166) 0.8449 (0.9179) 389 64 88 119 118Month 60 0.1531 0.1761 (0.2912) 0.0266 (0.4028) -0.3238 (0.3597) 0.2747 (0.3684) 119 21 23 40 35
Panel C: Aftermarket Performance o f IPOs Categorized by Initial Return: Cold MarketsNumber of Issues
Aftermarket Ri a S.E. fix S.E. P i S.E. f i i S.E. Total D=0 D=1 D=2 D=3Month 1 -0.0025 -0.0333“ (0.0120) 0.0112 (0.0160) 0.0657“ (0.0182) 0.1111“ (0.0234) 316 92 119 72 33Month 3 0.0020 -0.0499“ (0.0173) 0.0300 (0.0230) 0.1043“ (0.0261) 0.1604“ (0.0336) 316 92 119 72 33Month 12 0.0427 -0.0080 (0.0604) -0.0515 (0.0806) 0.1397 (0.0912) 0.3652“ (0.1176) 315 92 118 72 33Month 36 -0.1254° -0.1468 (0.1339) -0.0900 (0.1792) -0.0346 (0.2045) 0.5819b (0.2592) 297 88 111 66 32Month 60 -0.0994 -0.2800 (0.3055) 0.0121 (0.3997) -0.1302 (0.4632) 1.9807“ (0.5909) 262 74 104 57 27
“* ,c denote statistical significance at the 0.01,0.05, and 0.10 levels, respectively, based on a simple t-test.
53

to that for “hot” markets. The underperformance of IPOs is most pervasive in the
category of IPOs with zero or negative initial returns. In this category, IPOs issued in
“hot” markets underperformed the market by 51.21 percent, while IPOs in “cold”
markets underperformed by 14.68 percent over three years.
The findings reveal a number o f interesting patterns related to the literature.
When considering the short-run dynamics, the result indicates a clearly significant
relation between underpricing and performance under the market conditions studied.
Underpricing indeed seems to induce sentiment-driven short-run positive feedback
strategies (Rajan and Servaes (1993)). The significantly negative returns of IPOs with
least underpricing are also indicative of the effect of the cessation of stabilization
activities of underwriters in the immediate aftermarket (Hanley, Kumar and Seguin
(1992), Ruud (1993)). Moreover, the results for long-run performance contrast with
Ritter’s (1991) findings which reveal a tendency for firms with high initial returns to
have the worst aftermarket performance. This, according to the author, mildly supports
DeBondt and Thalers (1985) “overreaction hypothesis” as an explanation for the poor
long-run performance of US IPOs. The results are also not consistent with Shiller’s
(1990) “Impresario” hypothesis, which predicts a negative relation between initial
returns and aftermarket performance, in particular for IPOs issued in “hot” markets. As
well, our findings do not correspond to the desire of issuers to avoid future lawsuits by
underpricing (Tinic (1988)). The results, however, do support the various signaling
theories of underpricing (Allen and Faulhaber (1989) or Grinblatt and Hwang (1989)).
Here, underpricing separates low-quality firms from high-quality firms, since only high
quality firms are expected to recoup the initial loss of underpricing once their true value
is revealed.
54
4.3.2 Performance Categorized by Age
In Table 5, we segment firms according to their age at the time of going public.
Ritter (1991) finds poor long-run performance with younger US IPOs and interprets this
as being consistent with investor overoptimism and “fads”.
For the sample of European IPOs, we find that young IPOs fare substantially
better than old IPOs. The pattern consistently extends across all measurement horizons.
The magnitude of the market-adjusted return difference is economically significant and
accounts for 86.84 percent of return performance, when comparing the youngest with
the oldest age group over 36 months. In the short-run, the patterns confirm the large
performance differences in favor of the youngest IPO firms. For example, the 419 firms
in the youngest age category outperform the market by 31.20 percent over one year. In
this case, the difference with their oldest counterparts accounts for 37.90 percent.
Results in Panels B and C of Table 5 indicate that the relationship between age and
aftermarket returns is not the same for IPOs issued during “hot” and “cold” markets. In
“hot” markets, the youngest IPOs have overperformed old firms by 150.79 percent over
three years, with similarly positive dynamics over shorter measurement horizons.
However, there is no clear indication that could postulate a link between age and
aftermarket returns for IPO issued in “cold” markets. Here, the youngest firms
underperform the market as well as old firms over three years.
The results for the European IPO market suggest that riskier issues require
higher initial returns and that age is a proxy for risk. This also suggests that the role o f
age differs for “hot” and “cold” markets and that age is a good proxy for investor
sentiment, particularly for IPOs in “hot” markets. This is consistent with Helwege and
Liang (2001) who find that “... investors are much more (perhaps overly)
55

Table 5Aftermarket Performance Categorized by Age
Ri = a + + &D2i+ SiThe model is estimated for each of the return measurement horizons (1,3, 12, 36 and 60 months) and for different market conditions (All Market Conditions, Hot Markets and Cold Markets). R, is the broad-market-adjusted return. Dn and D2i are (0,1) dummy variables taking the value of 1 if the IPO falls into the specified age category and 0 otherwise. Age is defined as the year of going public minus the year of foundation, with firms founded before 1901 assumed to be founded in 1901. Observations of company age are divided into three categories: IPOs with age between 0-14 years (young firms), 15-36 years (medium-young firms) and IPOs older than 37 years (old firms); Standard Errors (S.E.) in parentheses. This table assumes a declining sample size._________________________________________________________________________________
Aftermarket Ri
Panel A: Aftermarket Performance o f IPOs Categorized by Initial Return: All Market Conditions
a S.E. A S.E. Pi S.E. Total
Number of Issues
D=0 D=1 D=2Month 1 0.0134b 0.0370“ (0.0100) -0.0244 (0.0156) -0.0613“ (0.0163) 973 420 297 256Month 3 0.0315“ 0.0800“ (0.0158) -0.0646“ (0.0245) -0.1091“ (0.0256) 972 419 297 256Month 12 0.1229b 0.3120“ (0.0872) -0.2935b (0.1354) -0.3790“ (0.1420) 970 419 297 254Month 36 0.0845 0.5794b (0.2792) -0,7318° (0.4186) -0.8684b (0.4164) 686 262 210 214Month 60 -0.0205 0.0404 (0.2110) 0.1410 (0.3100) -0.2554 (0.2852) 381 124 107 150
Panel B: Aftermarket Performance o f IPOs Categorized by Initial Return: Hot MarketsNumber of Issues
Aftermarket Ri a S.E. Pi S.E. Pi S.E. Total D=0 D=1 D=2Month 1 0.0210b 0.0494“ (0.0132) -0.0388° (0.0211) -0.0789“ (0.0242) 657 316 206 135Month 3 0.0458“ 0.1060“ (0.0210) -0.1007“ (0.0334) -0.1387“ (0.0383) 656 315 206 135Month 12 0.1614° 0.3992“ (0.1201) -0.4396b (0.1910) -0.4867b (0.2199) 655 315 206 134Month 36 0.2448 1.1135b (0.4635) -1.4614b (0.6995) -1.5079b (0.7443) 389 161 126 102Month 60 0.1531 0.2806 (0.2312) -0.1643 (0.3224) -0.1889 (0.3009) 119 34 36 49
Panel C: Aftermarket Performance of IPOs Categorized by Initial Return: Cold MarketsNumber of Issues
Aftermarket Ri a S.E. Pi S.E. Pi S.E. Total D=0 D=1 D=2Month 1 -0.0025 -0.0008 (0.0118) 0.0178 (0.0173) -0.0178 (0.0161) 316 104 91 121Month 3 0.0020 0.0014 (0.0169) 0.0372 (0.0247) -0.0264 (0.0230) 316 104 91 121Month 12 0.0427 0.0478 (0.0576) 0.1038 (0.0844) -0.0919 (0.0788) 315 104 91 120Month 36 -0.1254° -0.2720b (0.1251) 0.4129b (0.1857) 0.0791 (0.1726) 297 101 84 112Month 60 -0.0994 -0.0503 (0.2830) 0.2647 (0.4261) -0.3134 (0.3891) 262 90 71 101 ° denote statistical significance at the 0.01,0.05, and 0.10 levels, respectively, based on a simple t-test.
56

optimistic in hot markets, as hot market firms may be able to go public at a more
favourable price and certainly raise more money in their offering.”
4.3.3 Performance Categorized by Size
In Table 6, firms are segmented by market capitalization (size) into three size
categories. As shown in Table 2, small offerings have slightly higher initial returns.
Table 6 discloses that smaller offering tend to have the best long-run performance. For
example, the smallest IPOs with a market capitalization below €100 million at the first
day o f trading outperform the largest IPO firms by 57.86 percent over three years. This
is similar for IPOs issued in “hot” and “cold” markets. As shown in Panels A, B, and C,
the smallest IPOs outperform their larger peers for 27 of the 30 measurement horizons.
Table 6 also reveals a tendency for the smallest offerings in the immediate
aftermarket to outperform the market and larger offerings. As seen earlier, our sample
of small European IPOs is clustered in “hot” markets, indicated by the relatively small
median size of companies going public (€66.2 million). Because small offerings
typically have a small public float, they are particularly susceptible to institutional
frictions prevailing in the immediate IPO aftermarket and to investor sentiment.
Conversely, Ritter (1991) finds a tendency for smaller offerings, which also have the
highest initial returns, to have the worst aftermarket performance. In his sample, all
size-categories display poor long-run performance. Our results are consistent with our
earlier observation that, in contrast to Brav and Gompers (1997), value-weighting does
not change the results on aftermarket performance. Owing to their weak statistical
power, however, results regarding the role of size in the European market need to be
treated with caution.
57
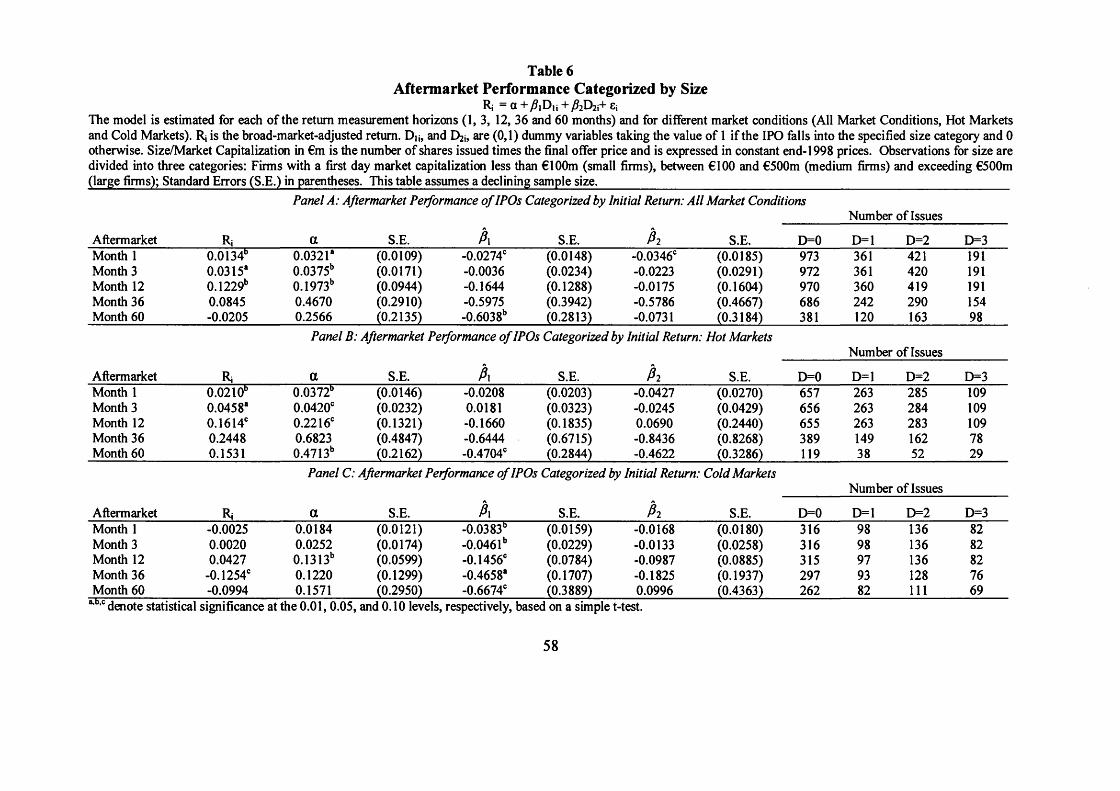
Table 6Aftermarket Performance Categorized by Size
Ri = a + y9iDn + /?2D2i+ e;The model is estimated for each of the return measurement horizons (1, 3, 12, 36 and 60 months) and for different market conditions (All Market Conditions, Hot Markets and Cold Markets). Rj is the broad-market-adjusted return. Du, and D*, are (0,1) dummy variables taking the value of 1 if the IPO falls into the specified size category and 0 otherwise. Size/Market Capitalization in €m is the number of shares issued times the final offer price and is expressed in constant end-1998 prices. Observations for size are divided into three categories: Firms with a first day market capitalization less than €100m (small firms), between €100 and €500m (medium firms) and exceeding €500m (large firms); Standard Errors (S.E.) in parentheses. This table assumes a declining sample size.______________________________________________________________
Panel A: Aftermarket Performance o f IPOs Categorized by Initial Return: All Market ConditionsNumber of Issues
Aftermarket Ri a S.E. A S.E. P i S.E. D=0 D=1 D=2 D=3Month 1 0.0134b 0.0321“ (0.0109) -0.0274° (0.0148) -0.0346° (0.0185) 973 361 421 191Month 3 0.0315“ 0.0375b (0.0171) -0.0036 (0.0234) -0.0223 (0.0291) 972 361 420 191Month 12 0.1229b 0.1973b (0.0944) -0.1644 (0.1288) -0.0175 (0.1604) 970 360 419 191Month 36 0.0845 0.4670 (0.2910) -0.5975 (0.3942) -0.5786 (0.4667) 686 242 290 154Month 60 -0.0205 0.2566 (0.2135) -0.6038b (0.2813) -0.0731 (0.3184) 381 120 163 98
Panel B: Aftermarket Performance o f IPOs Categorized by Initial Return: Hot MarketsNumber of Issues
Aftermarket Ri a S.E. A S.E. P i S.E. D=0 D=1 D=2 D=3Month 1 0.0210b 0.0372b (0.0146) -0.0208 (0.0203) -0.0427 (0.0270) 657 263 285 109Month 3 0.0458“ 0.0420° (0.0232) 0.0181 (0.0323) -0.0245 (0.0429) 656 263 284 109Month 12 0.1614° 0.2216° (0.1321) -0.1660 (0.1835) 0.0690 (0.2440) 655 263 283 109Month 36 0.2448 0.6823 (0.4847) -0.6444 (0.6715) -0.8436 (0.8268) 389 149 162 78Month 60 0.1531 0.4713b (0.2162) -0.4704° (0.2844) -0.4622 (0.3286) 119 38 52 29
Panel C: Aftermarket Performance o f IPOs Categorized by Initial Return: Cold MarketsNumber of Issues
Aftermarket Ri a S.E. A S.E. P i S.E. D=0 D=1 D=2 D=3Month 1 -0.0025 0.0184 (0.0121) -0.0383b (0.0159) -0.0168 (0.0180) 316 98 136 82Month 3 0.0020 0.0252 (0.0174) -0.0461b (0.0229) -0.0133 (0.0258) 316 98 136 82Month 12 0.0427 0.1313b (0.0599) -0.1456° (0.0784) -0.0987 (0.0885) 315 97 136 82Month 36 -0.1254° 0.1220 (0.1299) -0.4658“ (0.1707) -0.1825 (0.1937) 297 93 128 76Month 60 -0.0994 0.1571 (0.2950) -0.6674° (0.3889) 0.0996 (0.4363) 262 82 111 69
“■° denote statistical significance at the 0.01,0.05, and 0.10 levels, respectively, based on a simple t-test.
58

4.3.4 Performance Categorized by Public Float
Table 7 segments the firms by the size of the public float. Here, we divide the
sample into four groups. Based on the results from Table 2, public float does not appear
to be strongly related to the level of underpricing.
Three interpretations of Table 7 are possible: First, there appears to be a linear
relation between public float and market-adjusted aftermarket performance. These
performance dynamics are pervasive. Companies issuing least, fare the best. Companies
issuing most, fare the worst. For example, after three months of trading, the difference
in the broad-market-adjusted return between companies with the smallest and the largest
public float is 10.66 percent. This difference increases to 64.23 percent after three years
in the aftermarket. The performance patterns are manifested particularly in firms that
bring at least 50 percent of their company to the market. Second, the relation between
public float and IPO return dynamics is relatively insensitive to the market condition at
the IPO date. For instance, companies with the largest public float underperform
companies with the lowest public float by 72.61 percent over three years when issued
during “hot” markets, and by 54.86 percent during “cold” markets. Third, public float is
significantly related to IPO performance in the immediate aftermarket. This effect
appears to be stronger under “hot” markets than under “cold” markets. This is indicative
of the strong influence of investor sentiment in driving a limited supply o f shares, in a
market characterized by institutional arrangements unrelated to fundamentals.
The negative relation between public float and aftermarket performance for the
European IPO market is consistent with several explanations in the literature. Primary
among these are the Jensen and Meckling (1976) agency hypothesis and the Leland and
Pyle (1977) signaling hypothesis. In Jensen and Meckling (1976), a higher ownership
retention rate, hence lower public float, reduces incentives to undertake non value
59

Table 7Aftermarket Performance Categorized by Public Float
Ri = a + /fjDii + /?2D2i + /?3D3i + 6iThe model is estimated for each of the return measurement horizons (1,3, 12, 36 and 60 months) and for different market conditions (All Market Conditions, Hot Markets and Cold Markets). R* is the broad-market-adjusted return. Du, D2i, and D3j are (0,1) dummy variables taking the value of 1 if the IPO falls into the specified category of public float and 0 otherwise. Public Float is defined as the percentage of equity offered to the public at the IPO date. Observations on the public float are divided into four categories: Firms with less than 20% of public float, with at least 20% but less than 30% of public float, with at least 30% but less than 50% of public float, and at least 50% of public float; Standard Errors (S.E.) in parentheses. This table assumes a declining sample size.___________________________________________________________
Panel A: Aftermarket Performance o f IPOs Categorized by Initial Return: All Market ConditionsNumber of Issues
Aftermarket Ri a S.E. P \ S.E. P i S.E. 0 3 S.E. Total D=0 D=1 D=2 D=3Month 1 0.0134° 0.0625“ (0.0124) -0.0416° (0.0181) -0.0845“ (0.0173) -0.0788“ (0.0197) 973 273 241 283 176Month 3 0.0315“ 0.0850“ (0.0195) -0.0292 (0.0285) -0.0931“ (0.0274) -0.1066“ (0.0313) 972 273 241 283 175Month 12 0.1229b 0.1774 (0.1083) 0.1012 (0.1584) -0.1118 (0.1520) -0.2609 (0.1734) 970 273 240 282 175Month 36 0.0845 0.2513 (0.3158) -0.2374 (0.4744) 0.0321 (0.4566) -0.6423 (0.5114) 686 206 164 189 127Month 60 -0.0205 0.2162 (0.2095) -0.2859 (0.3195) -0.3244 (0.3215) -0.4907 (0.3556) 381 126 95 93 67
Panel B: Aftermarket Performance o f IPOs Categorized by Initial Return: Hot MarketsNumber of Issues
Aftermarket Ri a S.E. A S.E. 0 2 S.E. 0 3 S.E. Total D=0 D=1 D=2 D=3Month 1 0.0210b 0.0828“ (0.0175) -0.0485° (0.0249) -0.1043“ (0.0244) -0.1076“ (0.0279) 657 178 175 189 115Month 3 0.0458“ 0.1175“ (0.0279) -0.0315 (0.0396) -0.1249“ (0.0389) -0.1570“ (0.0447) 656 178 175 189 114Month 12 0.1614c 0.1956 (0.1604) 0.1698 (0.2279) -0.1121 (0.2239) -0.2726 (0.2568) 655 178 175 188 114Month 36 0.2448 0.3654 (0.5624) -0.2107 (0.8127) 0.2581 (0.8086) -0.7261 (0.8965) 389 111 102 104 72Month 60 0.1531 0.0872 (0.2165) 0.1776 (0.3042) -0.1006 (0.3605) 0.1641 (0.3852) 119 39 40 22 18
Panel C: Aftermarket Performance o f IPOs Categorized by Initial Return: Cold MarketsNumber of Issues
Aftermarket Ri a S.E. P i S.E. 0 2 S.E. 0 3 S.E. Total D=0 D=1 D=2 D=3Month 1 -0.0025 0.0246° (0.0123) -0.0389° (0.0192) -0.0475“ (0.0174) -0.0249 (0.0196) 316 95 66 94 61Month 3 0.0020 0.0243 (0.0178) -0.0482° (0.0278) -0.0335 (0.0252) -0.0121 (0.0284) 316 95 66 94 61Month 12 0.0427 0.1432b (0.0604) -0.0984 (0.0947) -0.1135 (0.0856) -0.2390b (0.0965) 315 95 65 94 61Month 36 -0.1254° 0.1180 (0.1289) -0.3357 (0.2051) -0.2506 (0.1876) -0.5486“ (0.2129) 297 95 62 85 55Month 60 -0.0994 0.2740 (0.2878) -0.5870 (0.4624) -0.4115 (0.4293) -0.7416 (0.4795) 262 87 55 71 49
“• ,c denote statistical significance at the 0.01, 0.05, and 0.10 levels, respectively, based on a simple t-test.
60
maximizing projects. Leland and Pyle (1977) suggest that, by retaining a significant
stake in the firm, entrepreneurs can signal the quality of their firm since ramification
can be costly. For US IPOs, Jain and Kini (1994) confirm the relatively superior post-
IPO operating performance where entrepreneurs retain a large stake in the firm.
4.3.5 Performance Categorized by Sector
The sample period has been characterized by an unprecedented change caused
by the increasing role of information and communications technologies. In our final
analysis o f cross-sectional offerings characteristics, we study whether the aftermarket
performance of European IPOs mirrors this change.
For this purpose, we segment firms according to the attached Dow Jones
STOXX global sector classification scheme. Initially, we categorize IPOs according to
18 market sectors. Then, we pool all companies in Sectors 5, 13, 16 and 17 into one
group that represents the New Economy sectors (Technology, Media,
Telecommunications and Healthcare). For our sample o f 973 European IPOs, 270
accounted for New Economy IPOs (28 percent). All other IPOs are classified as Old
Economy firms. The average New Economy firm is 16 years old and has a median size
o f €51.7 million when going public. Conversely, we record an average age of 32 years
and a median size of €84.9 million for Old Economy firms. As seen in Table 1, the
sample composition of European IPOs has changed in favor of New Economy IPOs at
the expense of Old Economy IPOs over time. The change in industry representation is
indicative of the flow of capital into growth industries.
Table 2 displays significant differences in terms of underpricing between New
and Old Economy IPOs. The findings on aftermarket performance o f New Economy
versus Old Economy IPOs reported in Table 8 follow a similar, clearly distinctive
61

Table 8Aftermarket Performance Categorized by Sector
Ri = a + pD{ + £jThe model is estimated for each of the return measurement horizons (1,3, 12, 36 and 60 months) and for different market conditions (All Market Conditions, Hot Markets and Cold Markets). Rj is the broad- market-adjusted return. Dj is a (0,1) dummy variable taking the value of 0 if the firm belongs to a market sector defined as New Economy and 1 otherwise. New Economy firms belong to Market Sectors 5,13, 16 and 17, representing Technology, Media, Telecommunication and Healthcare, respectively. Old economy firms belong to all other sectors; Standard Errors (S.E.) in parentheses. This table assumes a declining sample size.__________________________________________________________________________
Panel A: Aftermarket Performance Categorized by Market Sector: All Market ConditionsNumber of Issues
Aftermarket Ri a S.E. P S.E. Total D=0 D=1Month 1 0.0134b 0.0477* (0.0125) -0.0475* (0.0147) 973 270 703Month 3 0.0315* 0.1160* (0.0196) -0.117* (0.0230) 972 270 702Month 12 0.1229b 0.3685* (0.1087) -0.340* (0.1280) 970 270 700Month 36 0.0845 1.3080* (0.3555) -1.593* (0.4056) 686 159 527Month 60 -0.0205 0.7982* (0.2733) -1.010* (0.3034) 381 72 309
Panel B: Aftermarket Performance Categorized by Market Sector: Hot MarketsNumber of Issues
Aftermarket Ri a S.E. P S.E. Total D=0 D=1Month 1 0.0210b 0.0566* (0.0160) -0.053* (0.0196) 657 217 440Month 3 0.0458“ 0.1315* (0.0253) -0.128* (0.0309) 656 217 439Month 12 0.1614° 0.3749* (0.1451) -0.319° (0.1774) 655 217 438Month 36 0.2448 1.8065* (0.5673) -2.147* (0.6651) 389 106 283Month 60 0.1531 0.5148° (0.2663) -0.458 (0.2997) 119 25 94
Panel C: Aftermarket Performance Categorized by Market Sector: Cold MarketsNumber of Issues
Aftermarket Ri a S.E. P S.E. Total D=0 D=1Month 1 -0.0025 0.0114 (0.0166) -0.017 (0.0182) 316 53 263Month 3 0.0020 0.0524b (0.0236) -0.06 lb (0.0259) 316 53 263Month 12 0.0427 0.3420* (0.0792) -0.360* (0.0869) 315 53 262Month 36 -0.1254° 0.3109° (0.1718) -0.531* (0.1895) 297 53 244Month 60 -0.0994 0.9490b (0.3857) -1.278* (0.4257) 262 47 215*• 'denote statistical significance at the 0.01,0.05, and 0.10 levels, respectively, based on a simple t-test.
performance pattern. New Economy stocks outperform the market as well as their peers
during all measurement periods. Figure 2 graphs the performance dynamics. The return
differences are pervasive. For example, the spread in benchmark adjusted returns
between New and Old Economy IPOs widened from 4.75 percent after the first month,
to 34.0 percent over one year and to 159.30 percent after three years of aftermarket
trading. Associated statistics underline the significance of the results that also prevail
for IPOs issued in “hot” and “cold” markets. Within sectors, telecommu
nications, technology and healthcare had the best long-run performance, benefiting from
62

Month of seasoning60
Figure 2. Average market-adjusted aftermarket Performance Categorized by Sector. The initial sample is comprised of 703 Old Economy IPOs and 270 New Economy IPOs. New Economy firms belong to Market Sectors 5, 13, 16 and 17, representing Technology, Media, Telecommunication and Healthcare. Old Economy firms belong to all other economic sectors in the Dow Jones STOXX global sector classification standard. Returns are measured as buy-and-hold returns from the close at the day of going public where one month is defined as consecutive 21-day-trading period using European trading days.
deregulation, the global technology boom and the shift towards private medical care in
Continental Europe. IPOs in sectors representing basic materials or industrial firms
(many o f which went public in the early 1990s during the boom in German construction
activity following the German Unification) fared the worst. All but 5 of the 18 industry
groups recorded long-run underperformance.
The magnitude of the performance differences in New versus Old Economy
IPOs over such a long time period is puzzling. Generally, the findings are strongly
supportive o f Brav and Gompers’ (1997) conjecture that investors should not treat IPOs
as a homogenous group and that subsample analysis can shed more light on the
generality of the performance patterns. For Old Economy IPOs, the findings can be
interpreted as evidence that is consistent with the fact that firms take advantage of
63
“windows o f opportunity” in bringing their relatively old, mature companies with less
growth and earnings potential to the market. The evidence on New Economy IPOs,
however, is not consistent with the predictions o f either the “windows o f opportunity”
(Ritter (1991)) or “fads” (Shiller (1990)) hypothesis. It is also not consistent with
theories that address the negative link between short- and long-run performance from an
institutional perspective (Miller (1977)). The overperformance in New Economy stocks
may stem from risk mismeasurement, investor sentiment or unexpected positive shocks,
such as the sharp increase o f the contribution of the New Economy to productivity
growth during a period of unexpectedly prolonged economic growth during the 1990s
(Gordon (2000)).28
In Figure 3, we graph the difference in three-year performance of New Economy
IPOs versus Old Economy IPOs for IPOs issued on a year-by-year basis. We also
display the composition o f the European IPO sample and extend the information to
include the sample composition o f European IPOs during 1999 and 2000, the period
commonly referred to as “Internet Bubble”. Figure 3 underlines how New Economy
IPOs issued between 1988 and 1998 outperformed their Old Economy peers
consistently over a three-year horizon. The possible exceptions are Old Economy IPOs
90issued during 1992, which slightly overperformed over a three-year return window.
We also find a remarkable change in the sample composition during the “Internet
Bubble”. This seems to be at least partly driven by the outperformance of previous
years’ New Economy IPOs.
28 See also Fortune (March 18,2002): “The productivity miracle is for real” (page 51).29 We also perform the analysis for the three individual “hot” and three “cold” markets defined in Table 1 and find that Old Economy IPOs issued in each of the “hot” and “cold” markets underperform.
64
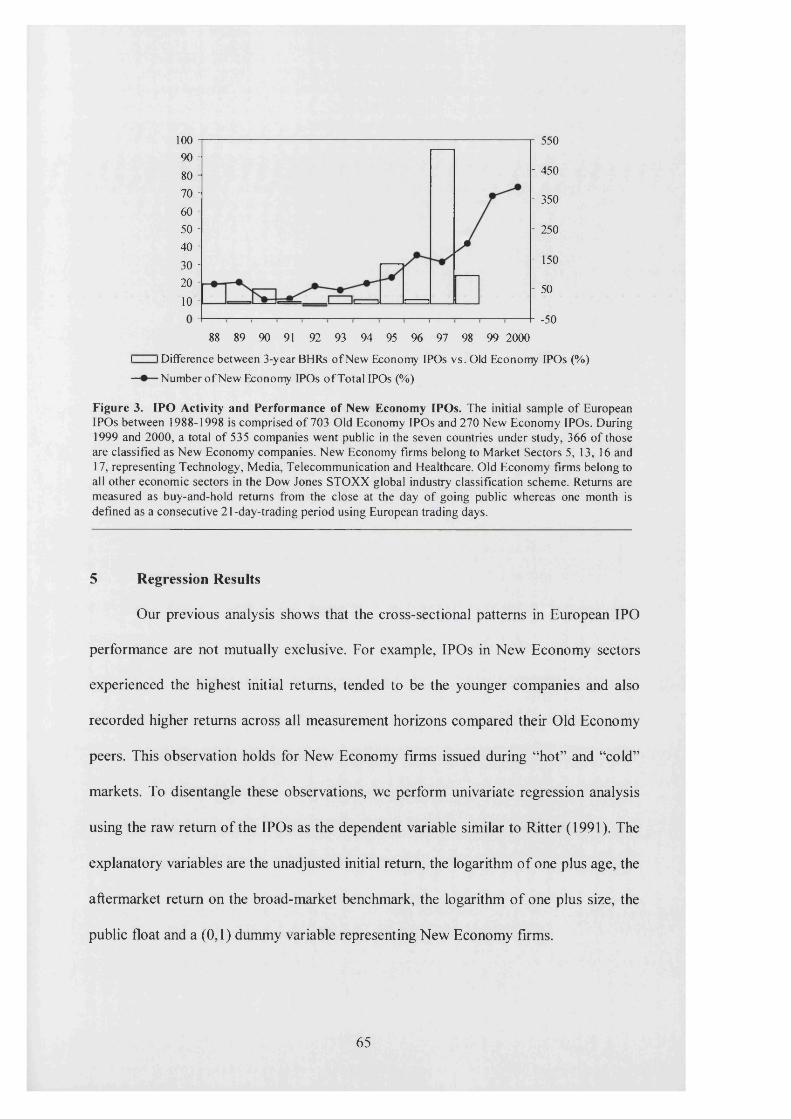
100 190 - 80 70 - 60 - 50 - 40 - 30 - 20 -
10 -
550
- 450
- 350
- 250
- 150
- 50
-5088 89 90 91 92 93 94 95 % 97 98 99 2000
i i Difference between 3-year BHRs o f New Economy IPOs vs. Old Economy IPOs (%)— Number o f New Economy IPOs o f Total IPOs (%)
Figure 3. IPO Activity and Performance of New Economy IPOs. The initial sample of European IPOs between 1988-1998 is comprised o f 703 Old Economy IPOs and 270 New Economy IPOs. During 1999 and 2000, a total of 535 companies went public in the seven countries under study, 366 of those are classified as New Economy companies. New Economy firms belong to Market Sectors 5, 13, 16 and 17, representing Technology, Media, Telecommunication and Healthcare. Old Economy firms belong to all other economic sectors in the Dow Jones STOXX global industry classification scheme. Returns are measured as buy-and-hold returns from the close at the day of going public whereas one month is defined as a consecutive 21 -day-trading period using European trading days.
5 Regression Results
Our previous analysis shows that the cross-sectional patterns in European IPO
performance are not mutually exclusive. For example, IPOs in New Economy sectors
experienced the highest initial returns, tended to be the younger companies and also
recorded higher returns across all measurement horizons compared their Old Economy
peers. This observation holds for New Economy firms issued during “hot” and “cold”
markets. To disentangle these observations, we perform univariate regression analysis
using the raw return of the IPOs as the dependent variable similar to Ritter (1991). The
explanatory variables are the unadjusted initial return, the logarithm of one plus age, the
aftermarket return on the broad-market benchmark, the logarithm o f one plus size, the
public float and a (0,1) dummy variable representing New Economy firms.
65

Table 9OLS Regression Results for Aftermarket Performance
R* = a + PiIRt + p2Log (1+ageO + p3Market; + p4Log(Sizej) + p5PublicFloati + p6D; + 8t R, is the raw return (not reported separately), measured from the first closing price. IR« is the initial return, defined as the difference between the first closing price and the offering price. Log (l+agej) is the natural logarithm of one plus the difference between the year of going public and the year of foundation, with firms founded before 1901 assumed to be founded in 1901. Market; is the return on the value-weighted Dow Jones STOXX broad-market index for the same return interval as the dependent variable. Log (Size;) is the natural logarithm of inflation adjusted size/market capitalization, defined as the total number of shares issued times the first closing price. PublicFloat; is the Percentage of Equity offered to the public. D; is a (0,1) Dummy variable taking on the value of 0 if the issuing firm belongs to a New Economy sector, and 1 otherwise.
Aftermarket a S.E. fixPanel A: Aftermarket Performance Categorized by Size: All Market Conditions
S.E. fii S.E. A S.E. A S.E. A S.E. A S.E. R2 NMonth 1 0.209b (0.0886) 0.060“ (0.0215) -0.026 (0.0156) 0.835* (0.1303) -0.018° (0.0109) -0.103* (0.0307) 0.028° (0.0154) 0.082 973Month 3 0.056 (0.1389) 0.028 (0.0338) -0.050b (0.0246) 1.106* (0.0947) 0.006 (0.0172) -0.140* (0.0485) 0.100* (0.0242) 0.155 972Month 12 -0.386 (0.7798) -0.024 (0.1888) -0.137 (0.1375) 1.730* (0.3240) 0.083 (0.0958) -0.513° (0.2709) 0.304b (0.1350) 0.041 970Month 36 0.438 (2.3137) 0.480 (0.7465) -0.196 (0.4008) 1.282* (0.3892) -0.047 (0.2790) -0.862 (0.7806) 1.439* (0.4259) 0.044 686Month 60 0.045 (1.5609) 1.466* (0.5574) 0.149 (0.2641) 0.950“ (0.1737) -0.039 (0.1899) -0.806 (0.5330) 0.934* (0.3092) 0.116 381
Panel B: Aftermarket Performance Categorized by Size: Hot Markets
Aftermarket a S.E. fix S.E. P i S.E. P i S.E. P a S.E. P s S.E. f ie S.E. R2 NMonth 1 0.276b (0.1287) 0.036 (0.0267) -0.039° (0.0226) 0.868“ (0.1695) -0.023 (0.0157) -0.136* (0.0438) 0.033 (0.0204) 0.078 657Month 3 0.071 (0.2031) -0.003 (0.0423) -0.073b (0.0356) 1.179* (0.1208) 0.012 (0.0249) -0.223* (0.0697) 0.114* (0.0323) 0.158 656Month 12 -0.785 (1.1858) -0.075 (0.2463) -0.210 (0.2073) 1.788“ (0.4429) 0.151 (0.1440) -0.670° (0.4037) 0.316° (0.1868) 0.035 655Month 36 1.017 (4.2188) 0.095 (1.1723) -0.636 (0.7309) 1.079 (0.6607) -0.036 (0.4931) -0.828 (1.3604) 1.955* (0.7043) 0.040 389Month 60 2.556 (1.7854) 0.557 (0.4746) -0.228 (0.2906) 0.497 (0.3643) -0.275 (0.2035) 0.102 (0.5341) 0.286 (0.3167) 0.073 119
Panel C: Aftermarket Performance Categorized by Size: Cold Markets
Aftermarket a S.E. fix S.E. fii S.E. f i i S.E. P a S.E. fis S.E. P e S.E. R2 NMonth 1 0.036 (0.0847) 0.200* (0.0361) -0.036 (0.0151) 0.739* (0.1657) -0.005 (0.0106) -0.037 (0.0294) 0.010 (0.0179) 0.145 316Month 3 -0.097 (0.1263) 0.176“ (0.0530) 0.003 (0.0224) 0.766* (0.1297) 0.009 (0.0158) 0.005 (0.0436) 0.066b (0.0270) 0.166 316Month 12 0.255 (0.4229) 0.271 (0.1789) 0.038 (0.0753) 1.515* (0.2553) -0.037 (0.0531) -0.262° (0.1472) 0.304* (0.0915) 0.179 315Month 36 0.514 (0.9272) 1.049* (0.3974) -0.298° (0.1613) 1.423* (0.1700) -0.148 (0.1158) -0.794b (0.3214) 0.474b (0.1899) 0.263 297Month 60a,b,c j ____. . _
-0.630 (2.1128) 2.437“ (0.9183) 0.272 (0.3631) 0.983* (0.2388) 0.024 (0.2650) -1.296° (0.7414) 1.279* (0.4302) 0.134 262
66

The results are displayed in Table 9. For the sample as a whole, the coefficient
of determination is rather low across the measurement periods.30 It is markedly higher
for IPOs issued in “cold” than in “hot” markets. The parameter estimates support the
conclusions that were obtained earlier. The initial return category is correlated with the
aftermarket performance o f IPOs issued in “cold” markets, with four out of five
measurement horizons being significantly positive. Age is correlated with immediate
aftermarket returns for IPOs issued in “hot” markets, with all signs being negative
across return windows. The coefficient on the market indicates that the beta for our
sample o f European IPOs is time-varying. Given the techno logy-led rise in share prices,
particularly throughout the second half o f the sample period, the coefficient on the
market return of 1.28 over three years is in line with our expectation that IPOs are
slightly riskier than the market. There is only weak evidence to support that size is
correlated with returns, confirming our finding that value-weighting does not change
our findings regarding aftermarket performance. Moreover, during 14 out of the 15
return horizons studied, the coefficient on the public float is negative, supporting the
signaling hypothesis. We also find a strong correlation between market sector and raw
returns, underlining the substantial impact of the New Economy sectors on the results of
overall aftermarket performance.
6 Summary and Conclusion
The European IPO market has gone through a period o f unprecedented change.
New Economy sectors have gradually taken a bigger share of total IPO activity,
indicating that money previously flowing into mature industries with lower growth
prospects had started to flow into young, technology-oriented companies that focus on
30 We have also experimented with adjusted R* s, and do not find qualitatively different results.
67

growth. This process was facilitated by rising stock markets, the initial success o f
privatizations fuelling a boom in European share ownership, and the creation of market
segments dedictated to young, growth-oriented companies. However, it is unclear
whether these developments represent either a structural shift or are just symptoms of a
time-varying market condition.
This chapter has focused on the return performance o f a large sample of
European IPOs during the period 1988-1998. The analysis has been pursued for the
sample as a whole and also under two alternative market conditions: for IPOs issued in
“hot” markets, when initial returns are high and the general level of the stock market is
increasing; and for IPOs issued in “cold” markets, when initial returns are low and the
general stock market level is stable or declining. We have split the research agenda into
two units: the examination of initial returns and the examination o f aftermarket
performance. We find significant autocorrelation, which is higher for the number o f
offerings than for the initial returns. Not surprisingly, we also find significant
underpricing, which is related to ex-ante characteristics of uncertainty. We attribute the
large amounts of money left on the table during our sample period to some large
privatizations.
While we present evidence of short-term overperformance, the results do not
indicate that IPOs offered underperform in the long-run. This result appears to be robust
across time periods underlining the most recent literature arguing that the long-run
underperformance of IPOs is a time-varying phenomenon. Our results are also sensitive
to the benchmark employed and return methodology with IPO outperformance being
most magnified when compared against small- and medium- sized company
benchmarks. The long-run positive aftermarket performance, however, is limited to
IPOs issued in “hot” markets. In “cold” markets, the broad-market-adjusted equally-
68

weighted performance is strongly negative. Moreover, the results on aftermarket
performance worsen substantially when looking at the median picture, with some
extreme returns driving the performance.
In order to shed some light on the underlying dynamics of aftermarket
performance, we categorize returns according to a set of issuing characteristics. We find
a strong impact of the initial return category. Here, companies with higher initial returns
fare best, underlining the role of underpricing as a signal o f firm quality. The quality of
the underpricing signal is best in “cold” markets which are characterised by less
“noise”. The evidence also points to a strong signaling role of the size of the public
float, in the sense that it is positively related to aftermarket performance across
measurement horizons. This is true for IPOs issued in both “hot” and “cold” markets.
Moreover, the cross-sectional findings in this study provide definitive testimony of the
overriding influence of the New Economy during the 1990s, which had a dramatic
impact on the investment world in general and the European IPO market in particular.
We show that the relatively good average performance of European IPOs issued
between 1988 and 1998 is due to offerings in the New Economy that account for just 28
percent of the sample. While we do not adjust for risk, it is unlikely that beta alone can
account for the performance differences. These results extend across all measurement
horizons. Through the outburst of IPO activity in the New Economy sectors relative to
the Old Economy on the “New Market” segments during the height of the “Internet
Bubble” in 1999 and part o f2000, this multi-year pattern ultimately reversed.
69

Chapter III
IPOs: Insights from seven European countries
1 Introduction
In recent years, a large body of literature has documented the returns on Initial Public
Offerings (IPOs) earned by investors in Europe. For example, using a sample of 712
UK IPOs between 1985 and 1992, Espenlaub, Gregory and Tonks (1998) find that there
are negative abnormal returns to a number of alternative benchmark portfolios. They
conclude that there are negative abnormal returns from an IPO such that a one-pound
investment is worth less than 85 pence after three years. Leleux and Muzyka (1998)
analyse the performance o f 307 IPOs in France, the UK, Germany, The Netherlands and
Belgium, issued between 1987 and 1993. The authors find that European IPO shares
exhibit the pattern of long-term underperformance highlighted in the US. Summarizing
evidence from a large number of countries, Loughran, Ritter and Rydqvist (1994) report
that underpricing, “hot issue” markets and long-run underperformance are global IPO
phenomena.
The evidence on IPO performance can also be addressed in a more general
context of “Why do companies go public?”. In this respect, Ellingsen and Rydqvist
(1997) argue that companies tend to emphasize the following reasons for going public:
(1) to obtain finance for growth opportunities, (2) to enhance a company’s image and•i %
mcrease its publicity, (3) to motivate managers and other employees, and (4) to “cash
in” by selling off the financial interest in the company. However, the more fundamental
question is why firms go public to achieve these goals. For example, direct sales of
31 When asked about the reasons for raising funds on the stock market, Nick Ogden, founder of Ogden, an UK-based Internet company, said the flotation “will be as much about raising our profile as raising money”. (Source: Sunday Business, March 12th 2000).
70
stock and bank financing are alternative sources of funds that could potentially finance
new projects or allow for transfer of ownership. Moreover, funds raised through stock
market introduction are often very expensive. It is generally perceived that the total cost
of going public lies between 20 cents and 30 cents per dollar, depending on the size of
the firm. The only reasonable explanation for the initial offer is that there are some
further future benefits associated with going public that outweigh the high cost of doing
so. In this context, Roell (1996) concludes that the reasons why firms pursue an IPO are
due to “an informative stock price, a more liquid stock, and increased competition
among providers of finance”.
Our objective in this chapter is to extend the evidence on IPOs by applying a
common empirical research framework to companies that went public between 1988
and 1998 in the following seven individual European Countries: Germany, France,
Italy, The Netherlands, Spain, Sweden and Switzerland. This period is o f considerable
importance as it begins with the aftermath o f the 1987 stock market crash, followed by
large privatization programmes and eventually by a big boom in European equity
culture and issuing activity towards the late 1990s. These individual markets provide a
unique opportunity to examine the robustness of findings on the performance o f UK and
US IPOs within the setting of other market-based financial systems, in which stock
markets play an increasingly crucial role in company financing. Moreover, by extending
our analysis of the European IPO market to individual countries, we can improve our
understanding about the robustness of the patterns reported in Chapter II and the
homogeneity of the European IPO market.
Some of our findings include the following:
(1) The underpricing phenomenon, while time-varying, is a consistent feature
across all the countries in the study. There is tentative evidence to suggest
71

that changes in tax regimes (in the case of Sweden and France), the
regulatory framework (in the case of Spain) or the IPO mechanism (in the
case of France) have had a significant impact on pricing and IPO activity.
The results for the long-run performance of IPOs in individual European
countries indicate that long-run underperformance is a time-varying
phenomenon and sensitive to measurement technique and benchmark
adjustment.
(2) When performing significance tests of performance differences between the
individual countries, the results, for overall and cross-sectional patterns,
confirm similar initial and aftermarket performance of IPOs for each
European country. This underlines the homogeneity of the European IPO
market in general and the pervasiveness o f the observed IPO patterns in
particular.
(3) Throughout the sample period, there appears to be a clearly positive link
between the degree of a countries’ involvement in New Economy IPO
activity and long-run IPO performance. While IPOs in Germany, The
Netherlands or Sweden perform relatively well over the long-run, IPOs in
countries with no New Economy IPO activity, such as Italy and Spain, fared
worse. This can help to shed some light on the rationale behind major efforts
made by stock exchanges across Europe to establish “New Market”
segments during the 1990s.
(4) As demonstrated by the comparison of findings from Chapter II and this
Chapter, the design o f the empirical experiment, in particular return
methodology and benchmark choice, can have an impact on the confidence
and reliability of inferences from long-horizon studies.
72

The structure of this Chapter is as follows: Section 2 describes the institutional
arrangements for IPOs in the seven countries under study and reviews the existing
empirical literature. In Section 3, we describe the data and methodology. Section 4
presents evidence regarding aftermarket performance. Section 5 presents cross-sectional
and time-series evidence on the performance of European IPOs. In Section 6, we check
to see whether the results are robust across countries. Section 7 concludes with a
summary and interpretation of the findings.
2 Going public in European countries 1988-1998
2.1 Institutional arrangements
In each of the seven countries under study, the regulations regarding an initial
public offering (IPO) are set and maintained by the relevant exchange itself, with the
consent of the Secretary of the Treasury, and must also be in accordance with legal
guidelines that are set under the European Investment Services Directive.
Before a firm can make an IPO, it must first obtain permission from the Ministry
of Finance to have its shares listed on an exchange. The request for a listing must be
made on the basis of a “notice of introduction”, whose contents are subject to detailed
regulation and is generally filed 120 days before a company starts trading. In the case
that the shares are listed, the professional association or government body acts as the
regulatory agency. The issuing firm must also meet certain criteria such as providing
annual accounts over a certain period of time, specifying the uses to which the proceeds
of the offering will be put, and disclosing the shareholdings o f the management and
board of directors. Moreover, a chartered accountant must certify the firm’s annual
accounts, and an offering prospectus must be submitted to the stock exchange by a
73

member of the association, who sponsors the request. In the countries under study, a
universal or an investment bank typically underwrites the IPO.32 The underwriter is not
only involved in working out the registration statement, but is also responsible for
managing the underwriting and floatation process.
A company has, in principle, a choice between three market segments in which
to list its shares: The Official Market, the Official Parallel Market or the New Market.
The choice of market segment is mainly based upon the minimum size of the issue.
Moreover, while the minimum Public Float on the Official Market is at least 25 percent,
no such requirements exist for shares seeking admission to the Official Parallel Market
or the New Market. New Market segments, added since the mid-1990s to many
European stock exchanges, cater exclusively to young, high-growth companies in
technology-oriented market sectors. Lower requirements for companies listed on the
New Market segments in terms o f capital and operating history are offset by more
stringent transparency and reporting rules after the IPO date. It must be stressed that the
relevant authority has the right to waive certain listing requirements.34 While electronic
trading of shares takes place in all market segments in France, Italy, Sweden and
Switzerland, the main stock exchange operators in Germany, The Netherlands and
Spain have maintained a hybrid system of floor-based and electronic trading.
Firms that intend to go public have - at least in principle - a choice of which
method their shares are offered to the public. A company can use one of the following
methods to obtaining a listing and issuing equity: “private placing”, “offer for sale by
32 Particularly in Germany, companies seeking a listing have usually been engaged in a long-run relationship with its underwriter (“Hausbankbeziehung”).33 In Appendix C, Table 48, we summarize the main listing requirements that applied to the stock exchanges in the countries under study between 1988 and 1998. We do not cover companies going public in other market segments, such as the Unregulated Market or NASDAQ Europe (formerly EASDAQ).34 This is explicitly stated in the statutes of the Milan Stock Exchange. For companies going public in Sweden, because of the prevalence of dual-class shares, direct focus is given to the voting and ownership structure of companies going public. Here, the minimum number of shareholders necessary for floatation is explicitly stated.
74

“J c
tender”, also referred to as “bookbuilding”, and “offer for sale at a fixed price”. In an
“offer for sale at a fixed price”, the fixed price element is designed to widen the appeal
of the issue for investors by eliminating price uncertainty. The prospectus states the
number of shares being offered for sale and the price per share. Investors can then
submit bids for the number of shares they wish to take up at the stated price. In “offers
for sale at a fixed price”, while applications are invited from the general public, the
issue is sub-underwritten, at the same price, by a group of financial institutions. Once
the price of the issue is fixed, it can neither be changed in response to emerging
demand, nor withdrawn. With the possible exception of France, the majority of
companies going public in the countries under observation went public through “offers
for sale at a fixed price” until the mid-1990s. The major proclaimed disadvantage of an
“offer for sale by tender” which uses “bookbuilding” procedure is that it cannot
eliminate price uncertainty. However, with strong issuing activity and rising equity
markets since 1995, during which companies, led by E Merck AG, a German
pharmaceutical company, issued high volumes o f shares, the bookbuilding method has
been increasingly used as a means for going public as it allows the market itself “much
more power in the issuance process”. Since the mid-1990s, bookbuilding has become
the pricing mechanism of choice for 70 percent of the IPOs in our sample. The inherent
advantages o f this procedure are that it seeks to assess market conditions before pricing,
and that the final issue price is conditioned on market demand.
The average total direct cost for a company going public in the sample varies
7between 5 percent and 7 percent. This fee structure has been relatively stable over
35 We do not discuss “Private Placements” in detail because they apply to low volume issues only. Derrien and Womack (1998) and Biais and Faugeron-Crouzet (2002) discuss other IPO mechanism unique to the French market.36 Reuters News Service, (December 27, 1995): “German IPO pace to slow but demand still strong.”37 Kaserer and Kraft (2000) provide a detailed study of floatation costs in Germany. Chen and Ritter (1999) document that in the US, at least 90 percent of deals that raised between 20 and 80 million Dollars
75

year and country, despite growing competition for mandates between investment banks,
and seems to exist irrespectively of type, nature and risk profile of the company. Using
2,051 IPOs in 61 non-US markets between 1992 and 1999, Jenkinson, Ljungqvist and
Wilhelm (2000) study whether the introduction of bookbuilding has increased the
efficiency o f IPOs. They find that - while the direct costs of bookbuilding are typically
twice that for fixed-price offers - bookbuilding leads to substantially less underpricing.
In general, the relevant stock exchange operators do not have any rules on how
oversubscribed issues are to be allocated, beyond the general principle that the
allocation must be done systematically.38 The degree and method of scaling down is
entirely at the discretion of the issuing house and may involve any form or pattern that
best suits the particular circumstances or interests of the company and its underwriter.39
This may involve a ballot and/or scaling down of applications. In fact, the adopted
method of allocation reflects the company’s preference regarding the profile o f its new
shareholders, for example a large number o f small individual investors versus
institutional investors. Reimer (1998) discusses hot German IPOs where institutional
investors received a disproportionately large fraction of the shares on sale. This is
consistent with the empirical findings by Comelli and Goldreich (2001) who find that
“bidders who participate in many issues receive favourable treatment especially in the
more successful (i.e. oversubscribed) issues”. Furthermore, Ljungqvist and Wilhelm
(2002) document that the frequency of directed share programs (friends and family
shares) increased dramatically between 1996 and 1999.
have underwriting spreads exactly equal to 7 percent, and relate this to the lack of competition between investment bankers.38 Oversubscription is a common feature for the IPOs under study. In Germany and The Netherlands, for example, oversubscription has been ftielled by the fact that there is no pre-payment for IPOs. Payment for the shares is made after the allocation of the bids is announced and trading starts.39 The fairness of the allocation mechanism has been subject to constant public debate and increasing regulatory scrutiny. See Forbes, (June 22, 1992), pp. 156-162, or Wall Street Journal Europe, (June 15, 1994): “Investors in US Question Access to IPOs, raising issue of Fairness”, or Reimer (1998).
76

2.2 Previous Literature
The focus of the empirical literature on IPOs in Continental Europe and
Scandinavia has shifted over time. While most of the studies in the early 1990s focus on
the underpricing phenomenon and its theoretical foundations, the research has
increasingly concentrated on the cross-sectional study of aftermarket performance with
respect to unique aspects of each country under observation. This has also involved
going beyond the analysis of time-series stock price data to include the evaluation of
operating performance data, the types of earnings management around the IPO date, and
aspects of finance and law.40
2.2.1 Germany
Stehle, Erhardt and Przyborowsky (1998) study the short- and long-run
performance of a sample of 222 German IPOs between 1960 and 1995. The authors find
statistically and economically significant underpricing of 15.7 percent. Using an
equally-weighted market portfolio as a benchmark, they also find a statistically
insignificant buy-and-hold performance of negative 5.0 percent over a 36-month time
horizon. Moreover, they argue that, because IPO stocks are typically small- or medium
sized, market portfolios might not make ideal benchmarks in IPOs studies. According to
the study, the results on long-term performance are fully in line with the efficient
market hypothesis and the hypothesis o f deliberate underpricing. Schuster (1996)
focuses on the performance of 126 German IPOs issued between 1988 and 1995. He
finds significant short-run overperformance. Moreover, he finds variations in year-to-
year performance, across industries and other issuing characteristics, with larger
companies as well as those with lower initial returns faring the worst. Due to the high
40 Using inferences from individual country studies to make general statements about patterns in the European IPO market is difficult because o f varying empirical methodologies, different sample sizes, measurement periods and the quality o f data.
77

median age of 49 years, it is hypothesized that the German IPO market is more of an
M&A market than a venture capital market, indicated by the fact that IPO proceeds flow
into maturing and declining industries, rather than those that are growing and dynamic.
Other studies for the German IPO market include Ljungqvist (1997), Uhlir (1989) and
Weinberger (1995) who reported evidence concerning underpricing and long-term
performance.
2.2.2 France
Derrien and Womack (2002) focus on the efficiency of the main procedures of
going public in France under different market conditions and mechanisms: a
bookbuilding mechanism similar to the one used in the US, a fixed-price procedure and
an auction-like procedure. They show that overall market momentum in the three
months prior to an offering is a significant ex ante predictor of the level of underpricing.
In the sample o f 264 French IPOs that went public on the French Official Parallel
Market and New Market between 1992 and 1998, mean underpricing reached 13.2
percent. After controlling for issuer and industry specific factors, they also find that the
auction mechanism is associated with less underpricing and lower variance of
underpricing. Using Cumulated Average Returns (CARs) starting from the eleventh
trading day, they find insignificant average adjusted underperformance of negative 6.2
percent for the sample over a two-year horizon. More generally, their work provides
empirical support for the theoretical work of Biais, Bossaerts & Rochet (2002), who
find that an IPO mechanism similar to France’s auction-like Offre a Prix Minimum
(OPM) is optimal.41 Faugeron-Crouzet, Ginglinger and Vijayraghavan (2001) focus on
the relationship between the initial underpricing and the subsequent recourse to the
41 W.R. Hambrecht, a US investment bank, has recently used a similar procedure called “OpenlPO” for US IPOs. This procedure resulted in substantially less underpricing.
78

capital market for a sample 288 firms that made an IPO on the French Official Parallel
Market between 1983 and 1994. While they find positive initial returns of 18.7 percent
for the sample as a whole, they also find that firms which are more undervalued tend to
subsequently issue shares, while firms which are not as undervalued tend to
subsequently issue other kinds of hybrid security. Degeorge and Derrien (2000)
examine the long-run stock price performance and earnings forecasts at the time of the
IPO using a sample of 243 French IPOs that went public on the Official Parallel and
New Market between 1991 and 1998. Using a variety of benchmarks and calculation
methods, they show that IPOs performed normally over a two-year horizon. They also
find that the best proxy for investors’ expectations is the average forecast issued by
financial analysts unaffiliated with the underwriter taking the company public.
2.2.3 Italy
Giudici and Paleari (1999) conduct an empirical study of 135 IPOs on the Milan
Stock Exchange between 1985 and 1998. Their analysis shows the existence o f two
periods characterized by different levels o f underpricing. Between 1985 and 1993, the
findings are consistent with the empirical results in other countries during this time,
such as the negative correlation between underpricing and the firm size, a positive
correlation between underpricing and the market trend and the price volatility in the
aftermarket, and the fraction of the equity maintained by the controlling shareholders. In
the second period between 1994 and 1998, underpricing is lower and the correlation is
less significant, which, according to the authors, confirms the “information gathering”
theory o f Beneviste and Spindt (1989) and validates the importance of placing
strategies. For the sample as a whole, they find average underpricing of 23.9 percent.
Using buy-and-hold returns, Italian IPOs also underperform the broad market
79

benchmark by 2.5 percent over three years. This work follows an earlier study done by
Cherubini and Ratti (1992), who investigate the underpricing of a sample o f 75 Italian
companies that were introduced to the Milan main market between 1985 and 1991.
They find average underpricing of 29.7 percent and postulate a positive correlation
between oversubscription, issuing activity in the secondary market and the degree of
underpricing.
2.2.4 The Netherlands
Bosveld and Venneman (2000) analyse the investment and operating
performance of a sample of 120 Dutch IPOs between 1983 and 1999 that went public on
the three market segments of the Amsterdam Exchanges. They find highly significant
average adjusted initial returns of 9.9 percent. The significance and magnitude o f these
returns, however, do vary widely over time. When calculated without outliers, it appears
that the influence of the few extremely high returns is larger than that of the few
extremely low returns. Furthermore, when using either of three benchmark adjustments,
the authors do not find underperformance during the first three years o f trading.
Regardless of the benchmark choice, however, IPOs underperform the market after four
or five years of trading. They find that, on average, for every Dutch Guilder (NLG) 100
invested in the benchmark, one would have had to invest NLG118 in the IPOs to obtain
the same terminal wealth level after four years of trading, or even NLG 124 to obtain the
same terminal wealth level after five years of trading. They also show that Dutch IPOs
are timed to coincide with periods of unusually good operating performance levels and
find that the practise of “window dressing” is common prior to the IPO. Roosenboom,
Van der Goot, and Mertens (2001) examine the relationship between two forms of
earnings management and the fortunes of a sample of 80 IPO firms that went public on
80

the Amsterdam Exchanges between 1984 and 1994. Their result provides evidence that
the form of earnings management during the IPO year can partially explain the cross-
sectional variation in long-run stock price performance. Using buy-and-hold returns,
firms in which managers tend to overreport earnings during the IPO year subsequently
perform poorly, and IPO firms in which managers smooth their income overperform
their counterparts by a margin of more than 100 percent during a period of three years,
adjusted for a number of different benchmarks. Van der Goot (1997) focuses on the
quality of information by studying the offering prospectuses of 74 IPOs on the
Amsterdam Exchanges between 1983 and 1992. He finds that cash flow statements do
not contribute to reducing information inequality between a firm’s management and its
investors. Moreover, he stresses that valuation models based on Price-Earnings Ratios
or Price-Book Ratios can only explain little o f the observed variance in the issuing
firm’s value. The author also points to a statistically significant negative relationship
between firm value and the number of takeover defences introduced by a firm.
2.2.5 Spain
Alvarez and Gonzales (2001) provide a detailed analysis o f the short- and long-
run performance of 56 Spanish IPOs, including four foreign issues, on the Madrid Stock
Exchange between 1987 and 1997. The authors also investigate the influence of IPO
prospectus information on the long-run returns of IPOs. For the sample of companies,
they report a highly significant unadjusted underpricing of 12.3 percent. With event
windows of three and five years, they report mixed results for long-run performance.
The magnitude of abnormal returns depends on the methodology, the weighting method
and the benchmark used for the adjustment of IPO returns. While long-run
underperformance is present when calculating buy-and-hold returns, it is not present
81

when using other methodologies for returns measurement, such as calendar time returns
or the Fama-French three factor model. Long-run underperformance is also
concentrated in small firms. Moreover, none but two of the issuing characteristics of the
offer are related to the behaviour of the stock price over three to five years. They find a
positive relationship between initial underpricing, long-run performance and the
percentage of shares retained confirming the signaling hypothesis. In a similar work,
Olcoz and Feldsztaijn (2000) report 10.6 percent initial underpricing of a sample o f 99
IPOs in the Madrid and Barcelona Stock Exchanges between 1986 and 1998. This
sample also underperformed the Madrid Stock Exchanges General Index (IGBM) by
29.0 percent over three years. Companies with the highest Return on Equity (ROE) at
the time o f going public tend to be the best performers in the long-run. Rahnema,
Fernandez, and Martinez Abascal (1992) examine the short- and long-run performance
of 85 Spanish IPOs over the period 1985-1990. Here, Spanish IPOs experience, on
average, 10.8 percent underpricing. “Handsome returns” may be earned by investing in
new issues, but the authors recommend liquidating within the first 90 days after the first
market price. In addition, they argue that it is possible to reduce the degree of
underpricing by selecting the optimal timing, underwriter, and type of placement.
2.2.6 Sweden
Rydqvist (1993, 1997) documents IPO underpricing from the perspective of
companies going public in Sweden. In his sample, composed of 224 new firms and 84
equity carve-outs during 1970-1991, average underpricing reached 39 percent. He
stresses the uniqueness of the Swedish IPO market: The significant difference in
marginal tax rates between salary increases (85 percent marginal tax) and capital gains
(20 percent marginal tax) led firms to allocate a significant portion of the offer to firm
82
employees and key decision makers of the firm’s creditors, suppliers and customers.
Therefore, underpricing was driven by an incentive to replace salary increases with tax-
efficient capital gains. The tax motivation for underpricing disappeared when a new tax
code was introduced in 1990. This led to a subsequent drop in underpricing. In a similar
analysis o f IPOs between 1970 and 1991, Hogholm (1994) finds a positive relationship
between the level of underpricing and the level of ex-ante uncertainty surrounding the
IPO. Firms belonging to the service sector seem to underprice their IPOs more than
other firms. He also finds different levels o f underpricing depending on the motive for
going public. Using a sample of 162 Swedish IPOs between 1980 and 1990, Loughran,
Ritter and Rydqvist (1994) find initial returns of 38.2 percent and a market-adjusted
three-year return of 1.2 percent.
A different line of research provides a legal and financial commentary of
Swedish IPOs. Holmen and Hogfeldt (2000) study how a legal regime, that provides
weak minority protection and allows for the separation of votes from capital, affects
behavior at the time o f and after the IPO. They study 229 Swedish IPOs (excluding
equity-carve-outs and spin-offs) between 1979 and 1997, when close to 90 percent of all
privately controlled Swedish IPOs used dual-class shares and issued only low-voting B-
shares. They find that private owners who place much emphasis on being in control
design the corporate charter and the initial ownership structure to maintain control after
the IPO. Five years after the IPO, the original private owners o f the companies in their
sample retained 2/3 of the votes and 44 percent of the capital. Moreover, if the firm has
dual-class shares, the controlling owner has a stronger incentive to invest and acquire
other firms in stock financed takeovers since the owner only contributes a smaller
fraction of the capital but exclusively enjoys all control rights of the larger firms.
Furthermore, they find that private owners in control firms that later undertake seasoned
83
equity offerings retain a significantly higher proportion of votes and capital at the IPO
date compared to other privately controlled firms. According to the authors, differences
in ownership concentration, investment behavior and takeover frequency between
Continental European/Scandinavian and the Anlgo-Saxon countries are, to a large
extent, determined by endogenously established differences in security design and
initial ownership structure at the IPO date that reflect differences in legal regimes.
2.2.7 Switzerland
Kunz and Aggarwal (1994) study underpricing of a sample o f 42 IPOs that were
issued in Switzerland between 1983 and 1989. They find a 35.8 percent average initial
return between the offering price and the closing price on the first day of trading for 42
Swiss IPOs. No long-run underperformance in the aftermarket is observed. The average
excess returns remain well above 30 percent up to three years after the IPO. The authors
point to a decrease of underpricing over time, indicating growing competition between
investment banks. They also argue that companies may intentionally underprice their
stocks in order to invest into their reputation by getting “free publicity”. Moreover, they
find that the reserved disclosure policy o f Swiss companies and the traditionally close
ties between issuer and underwriter, may possibly explain the high average underpricing
in Switzerland as compared to other countries.
3 Data and Methodology
3.1 Data
For our study of IPO performance in the individual European countries, we use
the same company and returns data as in the previous chapter with the initial sample
84

Figure 4IPO activity and Stock Market Returns in European Countries
IPO proceeds are measured in end-1998 purchasing power and defined as the number of shares offered to the public times the final offering price and include overalottment options (greenshoe), where applicable. The Initial Return is defined as the change from the IPO price to the closing price at the end of the first day of trading. The annual stock market return is defined as the annual change in the national stock market in the country under study. The following indices (all value-weighted) were used as a proxy for the respective national stock market: the FAZ Index (Germany), the SBF 250 Index (France), the MIB Historical Index (Italy), the CBS Index (The Netherlands), the Madrid General Index (Spain), the Affarsvarlden General Index (Sweden) and the Swiss Total Market Index (Switzerland).
G erm a n y G erm a n yT 7025 T T 70 70 T-- 6060 --- - 60
2- - 5040 --
30 --
- 3 0 | z
20
20 -
10 - -
- 20
- 10-1 0 - - - -1 0
-20 -L ^ -20
89 90 91 92 93 94 95 96 97 98 88 89 90 91 92 93 94 95 % 97 98
I IPO proceeds (DM bn) • Number o f IPOs I Stock Market Return ■Initial IPO return
F ran ce60 t T 120
50 -- - 100
- 80
30 - - 60
- 40
10 - - 20
F ra n ce
89 90 91 92 93 94 95 96 97 98
I IPO proceeds (FRF bn) —• — Number o f IPOs
60 -
50 -
40 -
30 - !
20 - -
10 -
0 - -
-1 0 -
-20 -
-30 -
- 60-- 50- 40 g
¥- 30 5
- 202
- 10 rz
- 0 _E- -10- -20- -30
89 90 91 92 93 94 95 96 97 98
IStock Market Return — Initial IPO return
Italy
89 90 91 92 93 94 95 96 97 98
I IPO proceeds (ITL trill) —• — Number o f IPOs
89 90 92 93 94 95 96 97
IStock Market Return ■Initial IPO return
85

IPO proceeds (CHFbn)
0000
V©Ui
© oo
Number o f IPOs
IPO proceeds (SKR bn)
o U* — CA ls> OJ
00oo
_________
o
vO■4
Number of IPOs00ON
Stock Market Return (%)
— N> U> 4a-O O © O O ©
1
Stock Market Return (%)
Initial IPO return (%) Initial IPO return (%)
Sweden
Sw
eden
IPO proceeds (ESP trill)
8-
0000
00SO
SOo
ts©
>©00
O
Number o f IPOs
IPO proceeds (NLG bn)
O K J ' U O ' O O O K ) ' * -
0000
00s©
S©o
s©
o
Number o f IPOs
Stock Market Return (%)
0000
sou>
o § §Initial IPO return (%)
Stock Market Return (%)
— NJ U>
0000
so
2so
sO
o
2nSPn5“3C.w
Initial IPO return (%)
Figure 4: continued

being comprised of 219 German, 323 French, 77 Italian, 75 Dutch, 88 Spanish, 148
Swedish and 43 Swiss IPOs. For this section, however, we calculate returns in local
currency using a local trading day calendar. Figure 4 shows that the number and value
of IPOs was unevenly distributed across the sample period in each country under study.
It underlines that the sample consists of stocks issued in both high activity and low
activity markets, in which the underlying momentum in the general level of the stock
market is positive. In this respect the sample is consistent with most of the empirical
studies in the literature. Figure 4 also underlines the link between IPO activity and
general level o f the stock market.42
Table 10 summarizes the IPO sample characteristics for the individual European
countries. The size of the public float (in percent) is relatively uniform across countries.
It is also consistent with findings by Espenlaub and Tonks (1998), who report that for a
sample of 428 IPOs of UK incorporated, non-financial companies issued during 1986-
1991, the average proportion of equity sold was 29.49 percent. Initially, IPOs came
from a variety of industries and were carried out by larger and older firms. This
coincides with the evidence provided by Loughran, Ritter and Rydqvist (1994) who
show that in Continental Europe, most of the firms that enter the market are more
mature, larger and more established than their counterparts in the US. However, average
age and number of industries represented has declined during the sample period. This is
not surprising considering the large number of service- and technology-related IPOs in
the German, French and Swedish market segments since the mid-1990s, combined with
the rapid rise in equity ownership and financial integration in Continental Europe
toward the late 1990s.
42 Loughran, Ritter and Rydqvist (1994) provide evidence that companies successfully time their offerings for periods when valuations are high, with investors receiving low returns in the long-run.
87
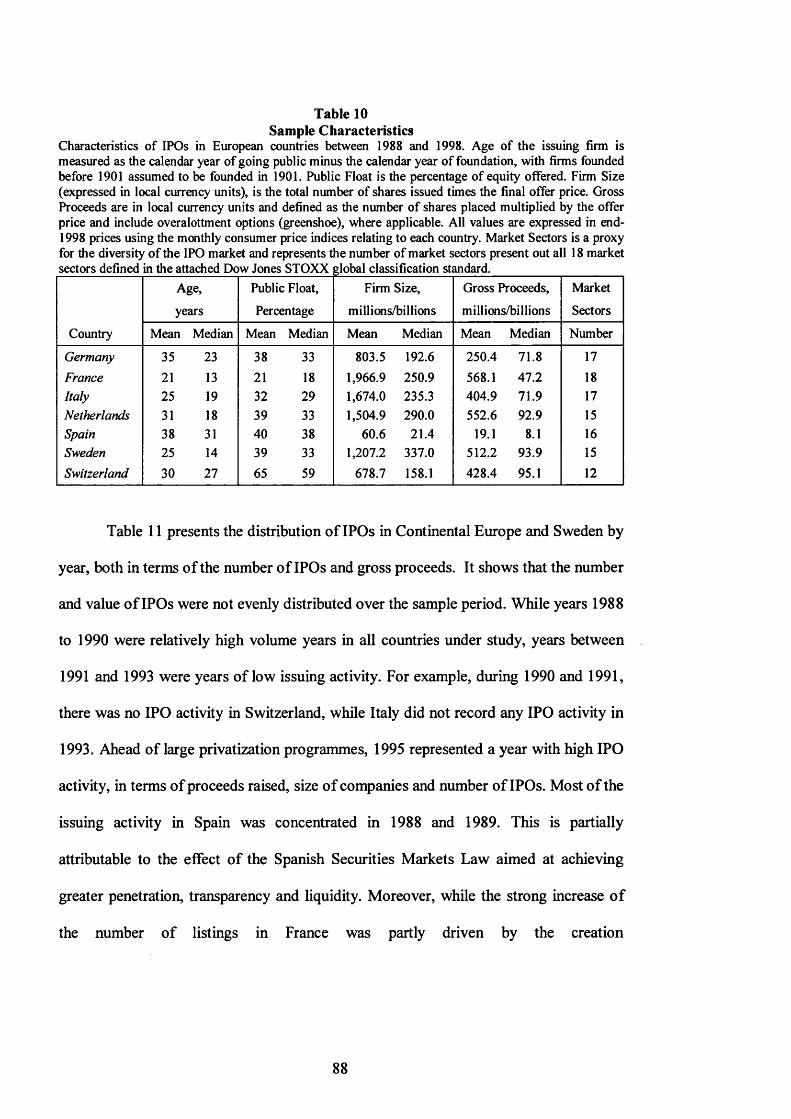
Table 10 Sample Characteristics
Characteristics of IPOs in European countries between 1988 and 1998. Age of the issuing firm is measured as the calendar year of going public minus the calendar year of foundation, with firms founded before 1901 assumed to be founded in 1901. Public Float is the percentage of equity offered. Firm Size (expressed in local currency units), is the total number of shares issued times the final offer price. Gross Proceeds are in local currency units and defined as the number of shares placed multiplied by the offer price and include overalottment options (greenshoe), where applicable. All values are expressed in end- 1998 prices using the monthly consumer price indices relating to each country. Market Sectors is a proxy for the diversity of the IPO market and represents the number of market sectors present out all 18 market
Country
Age,
years
Public Float,
Percentage
Firm Size,
millions/billions
Gross Proceeds,
millions/billions
Market
Sectors
Mean Median Mean Median Mean Median Mean Median Number
Germany 35 23 38 33 803.5 192.6 250.4 71.8 17France 21 13 21 18 1,966.9 250.9 568.1 47.2 18Italy 25 19 32 29 1,674.0 235.3 404.9 71.9 17Netherlands 31 18 39 33 1,504.9 290.0 552.6 92.9 15Spain 38 31 40 38 60.6 21.4 19.1 8.1 16Sweden 25 14 39 33 1,207.2 337.0 512.2 93.9 15Switzerland 30 27 65 59 678.7 158.1 428.4 95.1 12
Table 11 presents the distribution of IPOs in Continental Europe and Sweden by
year, both in terms of the number of IPOs and gross proceeds. It shows that the number
and value o f IPOs were not evenly distributed over the sample period. While years 1988
to 1990 were relatively high volume years in all countries under study, years between
1991 and 1993 were years of low issuing activity. For example, during 1990 and 1991,
there was no IPO activity in Switzerland, while Italy did not record any IPO activity in
1993. Ahead of large privatization programmes, 1995 represented a year with high IPO
activity, in terms of proceeds raised, size of companies and number of IPOs. Most of the
issuing activity in Spain was concentrated in 1988 and 1989. This is partially
attributable to the effect of the Spanish Securities Markets Law aimed at achieving
greater penetration, transparency and liquidity. Moreover, while the strong increase o f
the number of listings in France was partly driven by the creation
88

Table 11 Sample Distribution
Distribution of Initial Public Offerings (IPOs) by country and year of issuance from 1988 to 1998, excluding demutualizations, investment companies and foreign issues. Equity carve-outs, spin-offs and privatizations are included. Gross proceeds are in local currency units and defined as the number of shares placed multiplied by the offer price, and include overalottment options (greenshoe), where applicable. Aggregate gross proceeds are expressed in end-1998 prices using monthly consumer price indices of the respective country._________________________________________________________________________________________________________________________
Distribution of European IPOs by Country and Year of Issuance
Germany France Italy Netherlands Spain Sweden SwitzerlandAggregate Aggregate Aggregate Aggregate Aggregate Aggregate Aggregate
Number Gross Number Gross Number Gross Number Gross Number Gross Number Gross Number Gross
IPO of Proceeds Of Proceeds of Proceeds Of Proceeds of Proceeds of Proceeds of ProceedsYear IPOs DMm IPOs FRFm IPOs ITLbn IPOs NLGm IPOs ESPbn IPOs SKRm IPOs CHFm
1988 13 979.0 7 721.6 11 2,214.2 4 402.5 18 246.5 12 1,658.3 8 755.51989 22 2,534.2 20 13,493.9 7 2,415.3 10 4,843.3 19 309.8 6 2,480.5 1 191.31990 25 3,648.9 10 652.2 3 66.1 3 286.3 9 57.8 8 2,652.9 0 -
1991 18 3,753.3 10 3,316.4 4 238.2 2 48.2 9 256.0 2 439.2 0 -
1992 8 709.3 4 1,551.5 2 2,083.5 3 1,485.2 3 73.8 2 143.9 1 158.11993 7 890.4 11 23,589.7 0 - 1 16.8 2 144.1 10 4,488.8 1 63.51994 10 1,218.9 35 19,674.2 3 8,095.7 5 8,783.5 4 72.7 27 18,782.9 3 269.41995 20 8,129.1 16 24,020.3 11 7,810.5 7 2,766.4 1 0.4 12 9,881.2 3 818.51996 9 20,854.7 47 5,810.6 12 3,324.3 7 4,209.0 5 75.2 8 21,267.2 6 1,031.41997 24 5,696.3 55 47,754.1 10 1,659.2 12 5,161.0 9 268.9 43 10,833.5 8 4,492.61998 63 6,413.8 108 42,923.4 14 3,269.7 21 13,442.5 9 177.3 18 3,175.8 12 10,640.9
Total 219 54,828.2 323 183,508.0 77 31,176.7 75 41,444.6 88 1,682.7 148 75,804.1 43 18,421.2
89
of the Nouveau Marche in 1996, it was also driven by a change in French tax law.43 In
the other countries under study, there is no relevant legislation in place that would offer
any incentive o f a fiscal or financial nature to venture capitalists and venture capital
companies similar to those in France.
There were also some key institutional determinants of the emergence and
growth of firms in Sweden. For example, a gradual deregulation of the capital markets
during the sample period, a cut in corporate taxes and the deregulation of previously
regulated markets have spurred-on entrepreneurial activity and stock market listings in
Sweden since the mid-1990s. This came against the backdrop of traditionally high share
ownership: around 60 percent of the Swedish adult population own shares. Davidsson
and Henrekson (2000) identify some of the factors that have been particularly
favourable for the emergence of Swedish firms, such as deregulation and “fortuitous”
facts such as being a ffontrunner in certain areas of technology, like telecommunications
equipment manufacturing, for example.
3.2 Methodology
As reported earlier, the results of long-term performance studies are very
sensitive to methodological choices. Here, we take this robustness issue seriously and
present our results using a variety o f methods. As in the previous chapter, we use an
event-study methodology similar to Ritter (1991) for the evaluation o f short- and long-
run IPO performance. In this Chapter, two measures of abnormal returns are computed
43 Under French legislation, there are two primary venture capital vehicles: the Societe de capital risque (“SCR”) and the Fonds commun de placement a risques (“FCPR”). In order to obtain certain tax benefits, these vehicles are required to invest at least 50 percent of their assets in qualifying non-quoted securities of EU companies. Moreover, when unquoted securities or shares which are eligible to be included in the 50 percent limit upon acquisition by the SCR or FCPR and subsequently become listed on a regulated stock market, they continue to be included within such 50 percent limit during the five-year period following the IPO date. Under certain conditions, if a SCR or a FCPR acquires shares that are listed on the Nouveau Marche, these shares will be considered as non-quoted shares for the purpose of the 50 percent quote. (Source: European Venture Capital Association).
90
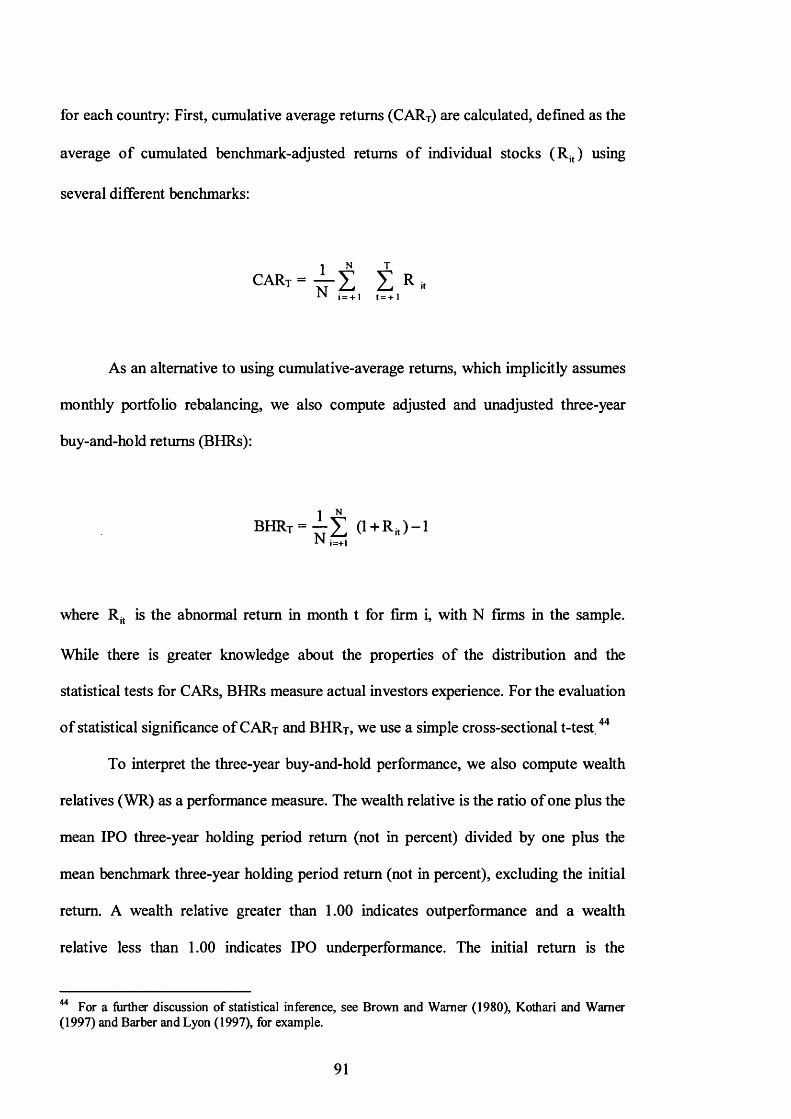
for each country: First, cumulative average returns (CART) are calculated, defined as the
average of cumulated benchmark-adjusted returns of individual stocks (R it) using
several different benchmarks:
cart = ^ E E r »i n i = + i t = + i
As an alternative to using cumulative-average returns, which implicitly assumes
monthly portfolio rebalancing, we also compute adjusted and unadjusted three-year
buy-and-hold returns (BHRs):
BHRt = ^ E 0 + R » ) - ii=+l
where Rit is the abnormal return in month t for firm i, with N firms in the sample.
While there is greater knowledge about the properties of the distribution and the
statistical tests for CARs, BHRs measure actual investors experience. For the evaluation
of statistical significance of C ARj and BHRt, we use a simple cross-sectional t-test 44
To interpret the three-year buy-and-hold performance, we also compute wealth
relatives (WR) as a performance measure. The wealth relative is the ratio of one plus the
mean IPO three-year holding period return (not in percent) divided by one plus the
mean benchmark three-year holding period return (not in percent), excluding the initial
return. A wealth relative greater than 1.00 indicates outperformance and a wealth
relative less than 1.00 indicates IPO underperformance. The initial return is the
44 For a further discussion of statistical inference, see Brown and Warner (1980), Kothari and Warner (1997) and Barber and Lyon (1997), for example.
91
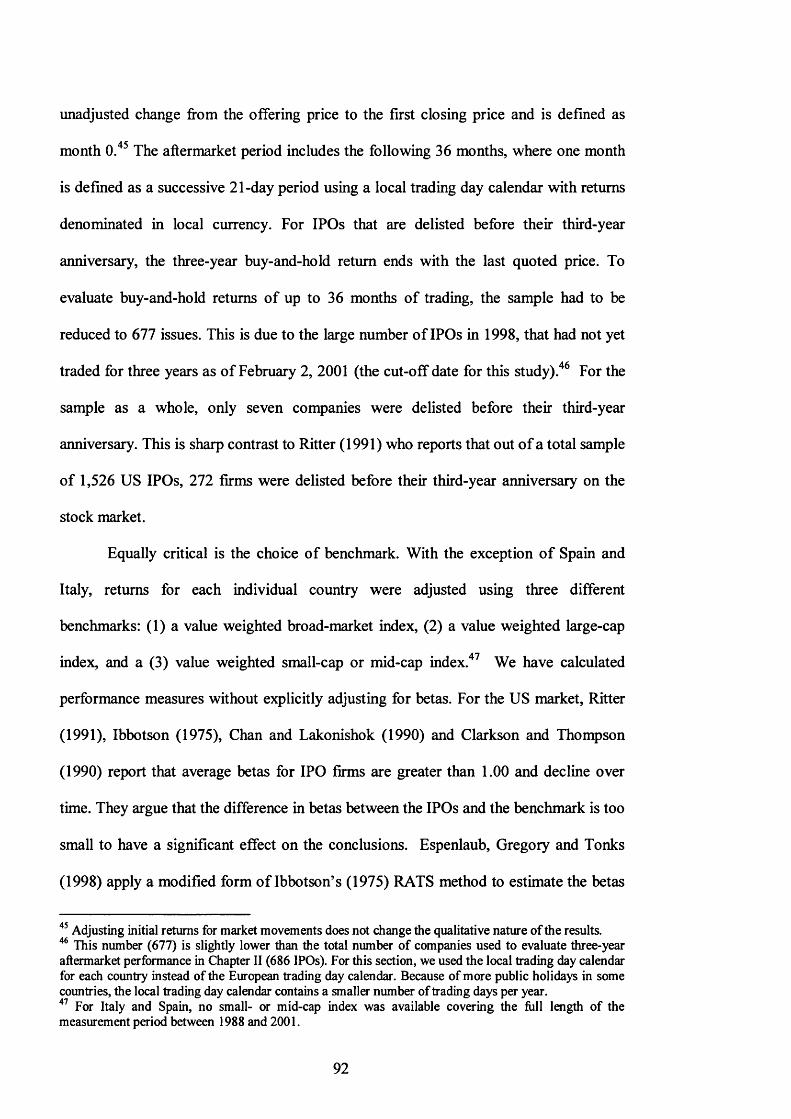
unadjusted change from the offering price to the first closing price and is defined as
month 0.45 The aftermarket period includes the following 36 months, where one month
is defined as a successive 21-day period using a local trading day calendar with returns
denominated in local currency. For IPOs that are delisted before their third-year
anniversary, the three-year buy-and-hold return ends with the last quoted price. To
evaluate buy-and-hold returns of up to 36 months of trading, the sample had to be
reduced to 677 issues. This is due to the large number of IPOs in 1998, that had not yet
traded for three years as of February 2, 2001 (the cut-off date for this study).46 For the
sample as a whole, only seven companies were delisted before their third-year
anniversary. This is sharp contrast to Ritter (1991) who reports that out of a total sample
of 1,526 US IPOs, 272 firms were delisted before their third-year anniversary on the
stock market.
Equally critical is the choice of benchmark. With the exception o f Spain and
Italy, returns for each individual country were adjusted using three different
benchmarks: (1) a value weighted broad-market index, (2) a value weighted large-cap
index, and a (3) value weighted small-cap or mid-cap index.47 We have calculated
performance measures without explicitly adjusting for betas. For the US market, Ritter
(1991), Ibbotson (1975), Chan and Lakonishok (1990) and Clarkson and Thompson
(1990) report that average betas for IPO firms are greater than 1.00 and decline over
time. They argue that the difference in betas between the IPOs and the benchmark is too
small to have a significant effect on the conclusions. Espenlaub, Gregory and Tonks
(1998) apply a modified form of Ibbotson’s (1975) RATS method to estimate the betas
45 Adjusting initial returns for market movements does not change the qualitative nature of the results.46 This number (677) is slightly lower than the total number of companies used to evaluate three-year aftermarket performance in Chapter II (686 IPOs). For this section, we used the local trading day calendar for each country instead of the European trading day calendar. Because of more public holidays in some countries, the local trading day calendar contains a smaller number of trading days per year.47 For Italy and Spain, no small- or mid-cap index was available covering the full length of the measurement period between 1988 and 2001.
92
in their sample of 588 UK IPO firms between 1985 and 1995. Similar to US evidence,
they find that the significance of the result of underperformance is likely to be
understated rather than over-stated and that it is unlikely that the magnitude of the
results can be explained away by specification errors. In his sample of 80 Finnish IPOs
between 1984 and 1989, Keloharju (1993) concludes that given the magnitude of the
cross-sectional betas, it is unlikely that risk mismeasurement alone could account for the
result of underperformance of Finish IPOs. For their sample o f Dutch IPOs,
Roosenboom, Van der Goot, and Mertens (2001) find a beta range between 0.55 and
1.16 over the first 36 months of trading. Similarly, using a sample of 307 firms that
went public in five European countries between 1983 and 1991, Leleux and Muzyka
(1998) did not record betas in excess of 1.00.
4 Performance Analysis of IPOs in European countries
4.1 Aftermarket Performance
Table 12 reports initial returns and cumulative average returns (CARs) measured
up to 36 months after the offering date using a broad-market benchmark for each
individual country. The results indicate the complexity of the IPO performance picture.
With the exception of Italy, Spain and Switzerland, IPOs experience positive
aftermarket performance before the end of the first year of trading. Over the long-term,
however, the picture changes dramatically. When assuming monthly portfolio
rebalancing, IPOs in all countries record negative average adjusted returns at their third-
year anniversary, with French, Italian and Spanish IPOs showing significant
underperformance. With the exception of Sweden and Switzerland, the firm’s negative
performance is reflected in a steady decline in the CARs after their one-year
93

Table 12Cumulative Average Returns (CARs)
Aftermarket Returns are measured as Cumulative Average Returns (CARs), with associated Standard Errors (S.E.) (in parentheses) for the 36 months after going public, excluding the initial return. One month is defined as a consecutive 21-trading interval using local trading days. For each country, raw returns were adjusted for the following broad-market value-weighted benchmarks: German IPO returns were adjusted for the FAZ Index, French IPO returns for the SBF 250 Index, Italian IPO returns were adjusted for the MIB Historical Index, and the CBS Index, excluding Royal-Dutch, was the benchmark for the Dutch market. Spanish IPO returns were adjusted form movements in the Madrid General Market (IGBM) Index, the Affarsvarlden General Price (AFG) Index was used for the Swedish market, and the Swiss Total Market (STM) Index was the benchmark for the sample of Swiss IPOs. An adjustment for the relevant MSCI national indices does not change the results. Month 0 is the Initial Return interval._______Panel A: Germany
Month of trading 0 1 6 12 18 24 30 36Number of firms 219 219 219 219 219 219 190 155CAR,,, 0.2566® 0.0208 0.1585® 0.1608® 0.1419b 0.1003 -0.1067 -0.1166S.E. (0.0334) (0.0159) (0.0417) (0.0531) (0.0700) (0.0725) (0.0739) (0.0852)
Panel B: France
Month of trading 0 1 6 12 18 24 30 36Number of firms 323 323 323 323 321 315 284 213CAR,,, 0.1237® 0.0343® 0.0045 -0.0280 -0.0748 -0.0666 -0.2227® -0.1901®S.E. (0.0104) (0.0121) (0.0232) (0.0339) (0.0475) (0.0529) (0.0553) (0.0715)
Panel C: Italy
Month of trading 0 1 6 12 18 24 30 36Number of firms 77 77 77 77 76 74 70 59CAR,,, 0.1303® -0.0454® -0.0376 -0.0903 -0.1198 -0.1783b -0.2596® -0.4185®S.E. (0.0327) (0.0124) (0.0470) (0.0613) (0.0780) (0.0859) (0.0777) (0.0918)
Panel E: The Netherlands
Month of trading 0 1 6 12 18 24 30 36Number of firms 75 75 75 75 74 72 67 53CAR,,, 0.1346® 0.0163 0.0221 0.0018 -0.0981 -0.1103 -0.1297 -0.1558S.E. (0.0259) (0.0298) (0.0450) (0.0667) (0.0713) (0.0931) (0.1091) (0.1248)
Panel F: Spain
Month of trading 0 1 6 12 18 24 30 36Number of firms 88 88 88 87 87 87 80 68CAR,,, 0.1475® -0.0015 -0.0161 -0.0782b -0.1756® -0.2661“ -0.3500“ -0.3021®S.E. (0.0260) (0.0154) (0.0303) (0.0388) (0.0495) (0.0688) (0.0761) (0.1667)
P an el G: Sw eden
Month of trading 0 1 6 12 18 24 30 36Number of firms 148 148 147 146 141 132 119 99CAR,,, 0.1846® 0.0071 0.0295 0.0140 0.0418 0.0523 0.0493 -0.1270S.E. (0.0233) (0.0158) (0.0286) (0.0392) (0.0570) (0.0644) (0.0760) (0.0789)
Panel H: Switzerland
Month of trading 0 1 6 12 18 24 30 36Number of firms 43 43 43 43 43 43 42 31CAR,,, 0.0971® -0.0217 -0.0226 -0.0646 -0.0485 -0.0446 -0.0502 -0.1817S.E. (0.0228) (0.0166) (0.0312) (0.0518) (0.0735) (0.0998) (0.1127) (0.1378)a,b,c denote statistical significance at the 0.01, 0.05, and 0.10 levels, respectively, based on a simple t-test.
94

CAR
(%)
, CA
R (%
) CA
R (%
)G erm any
-10-20
0 6 12 8 24 30 36MONTHS RELATIVE TO IPO DATE
Raw Return - - Broad Market adjusted" Large-Cap adj usted ------- Smal 1-Cap adj usted
Italy50 t 4 0 - 30 — 2 0 -
- 1 0 -
- 2 0 -
-3 0 - -40 -L
0 6 12 18 24 30 36MONTHS RELATIVE TO IPO
Raw Return — •— Broad-Market adjusted— «— Large-Cap adjusted
Spain4 0 -3 0 -2 0 -
1 0 -
- 1 0 -
0 6 12 18 24 30 36MONTHS RELATIVE TO IPO DATE
Raw Return — •— Broad-Market adjusted— "— Large-Cap adjusted
Switzerland
0 6 12 18 24 30 36
M ONTHS RELATIVE TO IPO DATE
Raw Return — •— Broad-Market adjusted— °— Large-Cap adjusted Small-Cap adjusted
France70- 60- 50-
£ 40- * 30- < 2 0 -
10-
0 6 12 18 24 30 36MONTHS RELATIVE TO IPO DATE
Raw Return --"--Broad Market adjusted— ®— Large-Cap adjusted ---------Small-Cap adjusted
Netherlands70-60-50-40-30-2 0 -
10-
0 6 12 18 24 30 36MONTHS RELATIVE TO IPO DATE
Raw Return - - Broad Market adjusted— "— Large-Cap adjusted Mid-Cap adjusted
Sweden706050403020100
-10-20
0 186 12 24 30 36MONTHS RELATIVE TO IPO DATE
Raw Return — •— Broad-Market adjusted— »— Large-Cap adjusted Small-Cap adjusted
95

Figure 5. The Long-Run Performance of IPOs in European Countries. Cumulative average returns (CARs) for an equally-weighted portfolio of Initial Public Offerings in Germany, France, Italy, The Netherlands, Spain, Sweden and Switzerland between 1988 and 1998, with monthly rebalancing, month 1 to 36. One month is defined as a consecutive 21-day trading interval using local trading days. With the exception of Italy and Spain, four CAR series are plotted for each country for the 36 months after the IPO date: 1) raw returns (no adjustment); 2) a broad-market value-weighted index adjustment; 3) a value- weighted large-cap index adjustment; and 4) a value-weighted small-cap or mid-cap index adjustment. The FAZ Index (broad-market), the DAX 30 Index (large-caps) and the GSC100 Index (small-caps) were used as benchmarks for the adjustment of raw German IPO returns. French IPO returns were adjusted for the SBF 250 Index (broad-market), the CAC40 Index (large-caps) and the AGEFI Second Market Index (small-caps). Because of a lack of a small-cap benchmark over the full measurement period, Italian IPO returns were adjusted for the following two benchmarks: the MIB Historical Index (broad-market) and the MIB 30 Index (large-caps). Dutch IPO returns were adjusted using the CBS Index, excluding Royal Dutch (broad-market), the EOE Index (large-caps) and the MKAP Index (small/mid-caps) as benchmarks. Due to a lack of benchmarks for small-cap stocks over the sample period, Spanish IPO returns were adjusted using the IGBM Index (broad-market) and the IBEX35 Index (large-caps). The Affarsvarlden General Index (broad-market), the OMX 30 Index (large-caps) and the James Capel Smaller Companies Index (small-caps) were used for the adjustment of raw Swedish IPO returns. Finally, Swiss IPO returns were adjusted for the Swiss Total Market Index (broad-market), the SBC 100 Index (large-caps) and the Swiss Small Cap Index (small-caps). An adjustment for the set of Morgan Stanley country indices (MSCI) leads to similar results. Month 0 is the initial return interval. Returns were calculated on the basis of final closing prices.
anniversary on the stock market. In Figure 5, we have plotted three CAR series, where
the initial return is also included. The individual benchmarks are main indices used in
each country to describe either the state of the broad-market, the market for large-caps
or the market for small- and mid-cap stocks. The distribution of initial returns varies
across time and country, and is generally positively skewed. While the initial return
picture is broadly similar, Figure 2 confirms that the dynamics in aftermarket
performance is not uniform across countries. For German and Dutch IPOs, positive
initial returns are followed by months o f strongly positive outperformance, until the
relative performance picture changes quite dramatically after around six month of
trading. The best overall performance picture emerges for Swedish IPOs that start to
underperform relatively late. As inspection o f Table 12 shows, high Swedish IPO
activity in technology- and service-related firms in 1997 preceded the large wave in IPO
activity in other European countries in 1998. Many of the Swedish IPOs reached their
third-year anniversary by mid-2000, a time when the NASDAQ Index traded slightly
off its highs reached in March 2000. The return picture for the Southern European
96
countries o f Italy and Spain is dismal. While both countries experience large initial
returns, IPO performance starts to deteriorate early at least until the third-year
anniversary. We also find that the performance of IPOs is sensitive to the benchmark
employed. IPOs generally perform much better when adjusted for movements in small-
or mid-cap indices and perform worse against large-cap indices. One reason why some
small- and mid-cap indices match the IPO performance more closely is that index
constituents are firms that have recently gone public. This issue is inherent in the
countries under study due to a relatively small universe of listed companies.
The reported results are generally in line with the existing empirical literature in
the countries under study. Looking at the first 36 months of trading, underperformance
across the individual countries does not, however, reach the degree of significance
reported in Ritter (1991) who uses a much larger sample and matching firms as a
benchmark for reporting abnormal returns.
In Table 13, we show the distribution o f unadjusted three-year buy-and-hold
(BHRs) returns for the individual countries under study. Median IPO three-year returns
are positive in only three countries: The Netherlands, Sweden and Switzerland.
Swedish IPOs performed best with a median three-year buy-and-hold return o f 26.76
percent. This is due to a large number of companies that recorded a positive
performance in absolute terms as well as the existence o f few extreme winners. The
worst three-year median performance belongs to Spain and Germany. Examination o f
Table 13 underlines that three-year holding period return distributions are skewed
across the countries with few extreme winners dominating the mean return picture. The
highest three-year total return of 8,900.0 percent, excluding the initial return of 4.4
percent, belongs to EM.TV AG, a German media company that was introduced
97

Table 13Distribution of unadjusted Three-Year Buy-And-Hold Returns
Distribution of unadjusted three-year holding period returns, exclusive of the initial returns, for IPOs in European countries between 1988 and 1998. Returns are measured as three-year unadjusted buy-and-hold returns. One month is defined as a consecutive 21-day trading interval after the first closing price using local trading days. Prices are adjusted for dividends, stock splits and rights offerings._______________________________________________________________________________________________
Three-year unadjusted holding period returnGermany France Italy Netherlands Spain Sweden Switzerland
Rank IPOs Rank IPOs Rank IPOs Rank IPOs Rank IPOs Rank IPOs Rank IPOs
1 (lowest) -0.9123 1 (lowest) -0.9491 1 (lowest) -0.8748 1 (lowest) -0.9865 1 (lowest) -0.9948 1 (lowest) -0.9455 1 (lowest) -0.986510 -0.6418 14 -0.7914 4 -0.6790 4 -0.6548 5 -0.8766 6 -0.7250 2 -0.531219 -0.5890 27 -0.6962 7 -0.5891 7 -0.5537 9 -0.7784 12 -0.4293 4 -0.487229 -0.4378 40 -0.5372 11 -0.4609 10 -0.5346 13 -0.7213 19 -0.3333 6 -0.330639 (25th) -0.3853 53 (25th) -0.4193 15 (25th) -0.2762 13 (25th) -0.3976 17 (25th) -0.6952 24 (25th) -0.2571 8 (25th) -0.251149 -0.3308 67 -0.3316 18 -0.2544 17 -0.2384 21 -0.6160 30 -0.2151 10 -0.157958 -0.2695 80 -0.1864 22 -0.1861 20 -0.1045 25 -0.5283 36 -0.1317 12 -0.101368 -0.1848 92 -0.1047 25 -0.1157 23 0.0000 30 -0.4264 42 0.0284 14 0.024578 (median) -0.1323 107 (median) -0.0283 30 (median) -0.5700 26 (median) 0.0240 34 (median) -0.3621 49 (median) 0.2676 16 (median) 0.081287 -0.0528 120 0.0855 34 0.0966 29 0.2285 38 -0.2867 55 0.4445 18 0.420097 0.0657 133 0.1698 38 0.1478 32 0.4948 43 -0.2229 61 0.5625 20 0.9241
106 0.3652 146 0.4124 42 0.2877 36 0.7243 47 -0.0690 66 0.6170 21 0.9533116 (75th) 0.6049 160 (75th) 0.8869 45 (75th) 0.3510 39 (75th) 1.0086 51 (75th) 0.0799 72 (75th) 0.8733 23 (75th) 1.0227126 0.7535 173 1.2511 48 0.6507 42 1.3438 55 0.2175 79 1.3151 25 1.2810136 1.1216 187 1.7708 52 0.8801 46 2.0831 60 0.6593 86 1.6540 27 1.4113146 2.0478 200 2.3948 56 1.6319 49 2.9176 64 1.1939 92 3.6296 29 2.2388155 (highest) 89.0000 213 (highest) 22.4783 59 (highest) 3.4651 53 (highest) 9.1250 68 (highest) 7.8378 99 (highest) 10.1489 31 (highest) 4.2268
All (Mean) 1.3892 All (Mean) 0.5369 All (Mean) 0.1794 All (Mean) 0.7369 All (Mean) -0.0465 All (Mean) 0.7290 All (Mean) 0.5595Ex. Top 1% 0.1754 Ex. Top 1% 0.3319 Ex. Top 1% 0.1190 Ex. Top 1% 0.5756 Ex. Top 1% -0.1642 Ex. Top 1% 0.6329 Ex. Top 1% 0.4373Ex. Top 10% -0.0314 Ex. Top 10% 0.0584 Ex. Top 10% -0.0581 Ex. Top 10% 0.2067 Ex. Top 10%-0.3501 Ex. Top 10% 0.2195 Ex. Top 10% 0.2937
98

in 1997 on the Neuer Markt as one of its first companies. This is followed by a three-
year unadjusted return of 6,823.1 percent recorded by Mobilcom AG, the first company
on the Neuer Markt, which jumped 52.0 percent on its first day of trading. The best
French performer was Eurofins Scientific SA with a 2,247.8 percent three-year buy-
and-hold return. Sylis SA, a 1997 IPO on the Second Marche, recorded a three-year raw
return of 676.3 percent and an initial return of 14.3 percent. The best three-year
performance of an Italian IPO belongs to Mediolanum SpA, an Italian Financial
Services Company, with an unadjusted return of 346.5 percent, excluding the initial
return of 30.8 percent. This is followed by Bulgari Spa, the international fashion and
jewellery house that recorded an initial return of 5.7 percent and an unadjusted
performance of 317.0 percent over three years. ASM Lithography NV, a 1995 IPO on
the Amsterdam Exchanges, was the best Dutch performer. It returned 912.5 percent
over three years, excluding the initial return of 22.6 percent. The second best Dutch
performer was Baan NV, a software company, with a three-year unadjusted buy-and-
hold return of 826.8 percent, excluding the initial return of 55.0 percent. Among the
best of the Spanish performers was Tele Pizza SA, a Pizza home delivery service, with a
three-year buy-and-hold return of 394.6 percent, excluding its initial return o f 34.8
percent. Moreover, Compania Vinicola del Norte de Espana SA, a Spanish Wine
producer, had a first day return of 28.5 percent and a three-year raw performance o f
119.4 percent. In Sweden, LGP Telecom AB, a technology company going public in
June 1997 on the OTC list of the OM Stockholm Exchanges, ranked highest with an
unadjusted return of 1,014.9 percent, excluding its initial return of 8.5 percent. Sigma
AB, a technology company, ranked second highest, recording an unadjusted three-year
buy-and-hold return of 962.8 percent, excluding the initial return o f 62.3 percent. In the
sample of Swiss IPOs, there were several IPOs that had triple-digit investment gains in
the three years after their IPO. Clariant AG, a chemicals company, rose by 422.68
99

percent since its 1995 IPO, excluding the initial return of 0.7 percent. Moreover,
Phoenix Mecano AG, an IPO on the Swiss market in September 1988, recorded an
unadjusted return of 265.7 percent, excluding the initial return of 5.7 percent.
4.2 Cross-Sectional Performance Patterns
This section documents cross-sectional patterns in the aftermarket performance
of IPOs. We perform this analysis for each individual country under study by
segmenting the sample by a number of cross-sectional characteristics such as IPO year,
sector, age, size, public float and initial return category. For each country, we conduct
the analysis for initial and aftermarket returns. This permits examination as to whether
initial and aftermarket performance are related to the issuing characteristics of the offer
and allows for a more detailed look at IPO performance in general and pan-European
IPO performance in particular.
As shown in Figure 5, the quantitative measurement of long-run IPO
performance is sensitive to the benchmark employed. For evaluating the long-run
performance of the IPOs in the sample, it is not at all clear what constitutes the
appropriate benchmark portfolio. As mentioned earlier, the use of small- or mid-cap
indices as benchmarks may bias the results in favour of finding no abnormal market-
adjusted returns. Throughout the rest of the paper, we will therefore adjust IPO returns
for movements in the broad-market value-weighted indices. While not capturing the
complete picture of the market for small- and medium-sized stocks, broad-market
indices also include large offerings similar to mature IPOs, privatization issues and
equity carve-outs. We will also focus on reporting three-year wealth relatives (WR) as
the primary measure of IPO aftermarket performance.
100
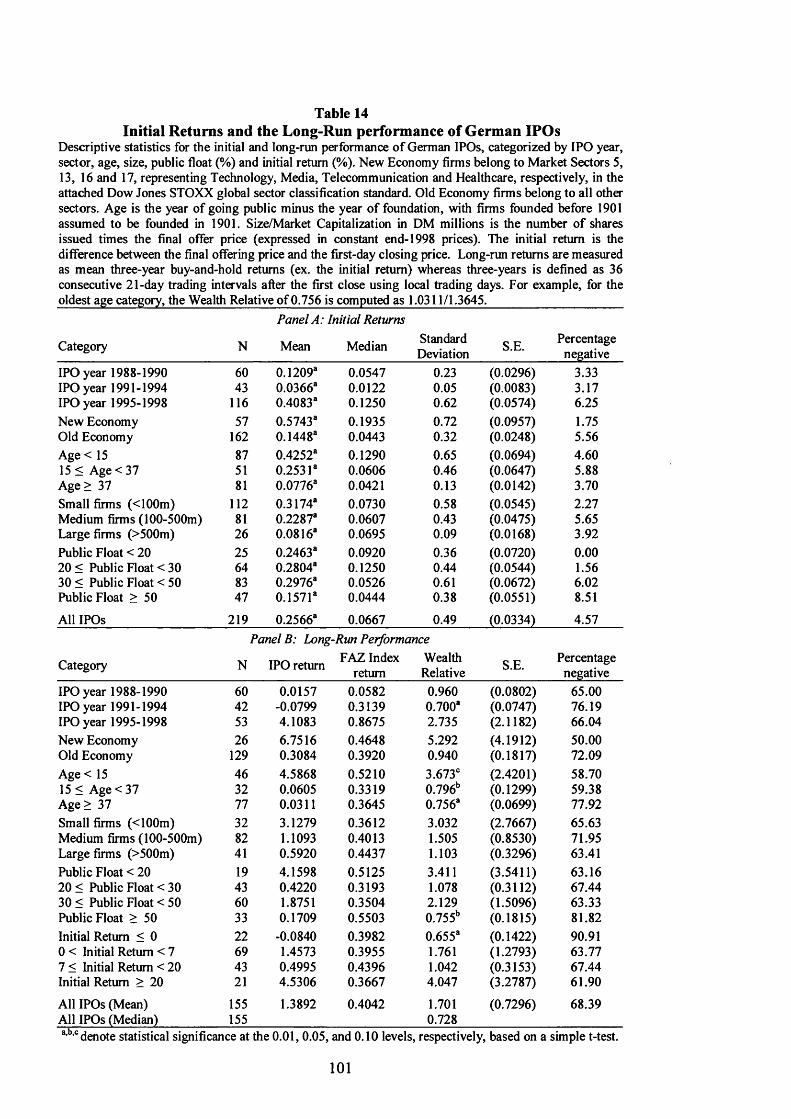
Table 14Initial Returns and the Long-Run performance of German IPOs
Descriptive statistics for the initial and long-run performance of German IPOs, categorized by IPO year, sector, age, size, public float (%) and initial return (%). New Economy firms belong to Market Sectors 5, 13, 16 and 17, representing Technology, Media, Telecommunication and Healthcare, respectively, in the attached Dow Jones STOXX global sector classification standard. Old Economy firms belong to all other sectors. Age is the year of going public minus the year of foundation, with firms founded before 1901 assumed to be founded in 1901. Size/Market Capitalization in DM millions is the number of sharesissued times the final offer price (expressed in constant end-1998 prices). The initial return is th<difference between the final offering price and the first-day closing price. Long-run returns are measurecas mean three-year buy-and-hold returns (ex. the initial return) whereas three-years is defined as 3(consecutive 21-day trading intervals after the first close using local trading days. For example, for th<oldest age category, the Wealth Relative of 0.756 is computed as 1.0311/1.3645.
Panel A: Initial Returns
Category N Mean Median StandardDeviation S.E. Percentage
negativeIPO year 1988-1990 60 0.1209s 0.0547 0.23 (0.0296) 3.33IPO year 1991-1994 43 0.0366s 0.0122 0.05 (0.0083) 3.17IPO year 1995-1998 116 0.4083s 0.1250 0.62 (0.0574) 6.25New Economy 57 0.5743s 0.1935 0.72 (0.0957) 1.75Old Economy 162 0.1448s 0.0443 0.32 (0.0248) 5.56Age < 15 87 0.4252s 0.1290 0.65 (0.0694) 4.6015 < Age <37 51 0.2531s 0.0606 0.46 (0.0647) 5.88Age> 37 81 0.0776s 0.0421 0.13 (0.0142) 3.70Small firms (<100m) 112 0.3174s 0.0730 0.58 (0.0545) 2.27Medium firms (100-500m) 81 0.2287s 0.0607 0.43 (0.0475) 5.65Large firms (>500m) 26 0.0816s 0.0695 0.09 (0.0168) 3.92Public Float < 20 25 0.2463s 0.0920 0.36 (0.0720) 0.0020 < Public Float < 30 64 0.2804s 0.1250 0.44 (0.0544) 1.5630 < Public Float < 50 83 0.2976s 0.0526 0.61 (0.0672) 6.02Public Float > 50 47 0.1571s 0.0444 0.38 (0.0551) 8.51
All IPOs 219 0.2566s 0.0667 0.49 (0.0334) 4.57Panel B: Long-Run Performance
Category N IPO return FAZ Index return
WealthRelative S.E. Percentage
negativeIPO year 1988-1990 60 0.0157 0.0582 0.960 (0.0802) 65.00IPO year 1991-1994 42 -0.0799 0.3139 0.700s (0.0747) 76.19IPO year 1995-1998 53 4.1083 0.8675 2.735 (2.1182) 66.04New Economy 26 6.7516 0.4648 5.292 (4.1912) 50.00Old Economy 129 0.3084 0.3920 0.940 (0.1817) 72.09Age < 15 46 4.5868 0.5210 3.673c (2.4201) 58.7015 < Age <37 32 0.0605 0.3319 0.796b (0.1299) 59.38Age> 37 77 0.0311 0.3645 0.756s (0.0699) 77.92Small firms (<100m) 32 3.1279 0.3612 3.032 (2.7667) 65.63Medium firms (100-500m) 82 1.1093 0.4013 1.505 (0.8530) 71.95Large firms (>500m) 41 0.5920 0.4437 1.103 (0.3296) 63.41Public Float < 20 19 4.1598 0.5125 3.411 (3.5411) 63.1620 < Public Float < 30 43 0.4220 0.3193 1.078 (0.3112) 67.4430 < Public Float < 50 60 1.8751 0.3504 2.129 (1.5096) 63.33Public Float > 50 33 0.1709 0.5503 0.755b (0.1815) 81.82Initial Return < 0 22 -0.0840 0.3982 0.655s (0.1422) 90.910 < Initial Return < 7 69 1.4573 0.3955 1.761 (1.2793) 63.777 < Initial Return < 20 43 0.4995 0.4396 1.042 (0.3153) 67.44Initial Return > 20 21 4.5306 0.3667 4.047 (3.2787) 61.90
All IPOs (Mean) 155 1.3892 0.4042 1.701 (0.7296) 68.39All IPOs (Median) 155 0.728^ d e n o te statistical significance at the 0.01,0.05, and 0.10 levels, respectively, based on a simple t-test.
101
4.2.1 Germany
In Table 14, we present evidence concerning the initial (Panel A) and long-run
performance (Panel B) for the sample of German IPOs as a whole, and characterised
according to a number of cross-sectional characteristics. Underpricing is a cyclical but
consistent feature throughout the sample period and confirms the positive link between
initial returns and the general level o f the stock market. Only 4.57 percent of the IPOs in
the sample experienced negative unadjusted initial returns. We also find that, when
using buy-and-hold returns, average long-run returns for German IPOs were positive.
This positive performance, however, is due to IPOs issued between 1995 and 1998.
IPOs issued in “cold” markets during the early 1990s significantly underperform the
market. For example, a strategy of investing in all IPOs issued during 1991 and 1994
would have left the investor with only Deutsche Mark (DM) 0.700 relative to each DM
invested in the FAZ Index. The underperformance is concentrated in older companies
that also exhibit the lower initial returns. Companies in the New Economy, companies
with a small public float and companies with higher initial returns perform substantially
better. The findings in Table 14 also confirm that the median picture is substantially
worse than the mean picture. In our sample, 68.39 percent of the companies
underperformed the market with a median wealth relative of 0.728.
4.2.2 France
In Table 15, we summarize the findings on initial and aftermarket performance
for the sample o f French IPOs. There is significant underpricing, which, however, is
less cyclical and lower than in some other countries. This may serve to highlight the
efficiency of auction-like IPO mechanisms prevalent in France. Only 6.50 percent of
companies had negative first -day initial returns. Contrary to Germany, IPOs issued in
102

Table 15Initial Returns and the Long-Run performance of French IPOs
Descriptive statistics for the initial and long-run performance of French IPOs, categorized by IPO year, sector, age, size, Public Float (%) and initial return (%). New Economy firms belong to Market Sectors 5, 13, 16 and 17, representing Technology, Media, Telecommunication and Healthcare, respectively, in the attached Dow Jones STOXX global sector classification standard. Old Economy firms belong to all other sectors. Age is the year of going public minus the year of foundation, with firms founded before 1901 assumed to be founded in 1901. Size/Market Capitalization in FRF billions is the number of shares issued times the final offer price (expressed in constant end-1998 prices). Long-run returns are measured as mean three-year buy-and-hold returns (ex. the initial return) whereas three-years is defined as 36 consecutive 21-day trading intervals after the first close using local trading days. For example, for the
Category N
Panel A:
Mean
Initial Returns
Median StandardDeviation S.E. Percentage
negativeIPO year 1988-1990 37 0.0759s 0.0769 0.08 (0.0136) 0.00IPO year 1991-1994 60 0.0869s 0.0323 0.13 (0.0169) 3.33IPO year 1995-1998 226 0.1413s 0.0880 0.21 (0.0138) 8.41New Economy 102 0.1533s 0.1000 0.22 (0.0216) 5.88Old Economy 221 0.1100s 0.0556 0.17 (0.0114) 6.79Age < 15 168 0.1299s 0.0698 0.21 (0.0165) 9.5215 < Age <37 105 0.1352s 0.0833 0.17 (0.0166) 1.90Age> 37 50 0.0785s 0.0398 0.10 (0.0143) 6.00Small firms (<0.33bn) 186 0.1236s 0.0790 0.20 (0.0145) 8.60Medium firms (0.33-1.65bn) 101 0.1352s 0.0789 0.18 (0.0181) 0.99Large firms (>1.65bn) 36 0.0922s 0.0286 0.14 (0.0236) 11.11Public Float < 20 183 0.1216s 0.0827 0.16 (0.0115) 2.1920 < Public Float < 30 73 0.1452s 0.0769 0.23 (0.0272) 12.3330 < Public Float < 50 58 0.1159s 0.0260 0.22 (0.0292) 12.07Public Float > 50 9 0.0422s 0.0000 0.08 (0.0264) 11.11
All IPOs 323 0.1237s 0.0714 0.19 (0.0104) 6.50
Category
Panel B: Long-
N IPO return
Run PerformanceSBF 250 Wealth
Index return Relative S.E. Percentage
IPO year 1988-1990 37 -0.0879 0.0369 0.880 (0.0800) 59.46IPO year 1991-1994 60 0.4750 0.3190 1.118 (0.1381) 60.00IPO year 1995-1998 116 0.7682 1.1899 0.807 (0.2603) 74.14New Economy 64 1.0565 0.8161 1.132 (0.4293) 64.06Old Economy 149 0.3137 0.7134 0.767s (0.1049) 69.13Age < 15 102 0.6181 0.7993 0.899 (0.2704) 70.5915 < Age <37 71 0.6740 0.7995 0.930 (0.1961) 60.56Age> 37 40 0.0863 0.5059 0.721s (0.1560) 72.50Small firms (<0.33bn) 112 0.6933 0.8729 0.904 (0.2603) 68.75Medium firms (0.33-1.65bn) 70 0.2771 0.6367 0.780b (0.1456) 68.57Large firms (> 1.651xi) 31 0.5583 0.5226 1.023 (0.1983) 61.29Public Float < 20 133 0.4450 0.6391 0.882 (0.1252) 63.9120 < Public Float < 30 43 1.1452 0.8571 1.155 (0.6002) 69.7730 < Public Float < 50 32 0.1451 1.0262 0.565s (0.2214) 81.25Public Float > 50 5 0.2576 0.7676 0.711 (0.3446) 60.00Initial Return < 0 67 0.3856 0.6792 0.825 (0.1790) 73.130 < Initial Return < 7 39 1.1740 0.7888 1.215 (0.5926) 58.977 < Initial Return < 20 64 0.5543 0.7078 0.910 (0.2437) 62.50Initial Return > 20 43 0.1688 0.8597 0.628s (0.2014) 74.42
All IPOs (Mean) 213 0.5369 0.7443 0.881 (0.1481) 67.61All IPOs (Median) 213 0.631a,b,c denote statistical significance at the 0.01,0.05, and 0.10 levels, respectively, based on a simple t-test.
103
France between 1991 and 1994 overperformed the market. There is also significant
long-term underperformance in Old Economy stocks that make up 70 percent of the
sample. While the long-run average performance is negative, it is not statistically
significant when assuming conventional measures of significance. The data also
confirms a tendency for older companies and companies with a large public float to
underperform the market and their younger counterparts in the long-run. 67.61 percent
of IPOs in the sample underperformed the market, a value similar to one reported for
Germany. A strategy of investing in the median French IPO at the end o f the first day of
trading, and holding it over 36 months, would have left the investor with only French
Franc (FRF) 0.631 relative to each FRF invested in the SBF 250 Index.
4.2.3 Italy
Evidence on the performance of Italian IPOs is summarized in Table 16. Here,
the following inferences can be drawn: First, Italian IPOs are underpriced on average by
13.03 percent. Underpricing, however, is less significant and more time-varying than for
any other country in this study. Indeed, 20.78 percent of Italian IPOs had negative initial
returns. Second, only seven percent of the companies under study were New Economy
companies, a finding that offers a key insight about the composition of the Italian IPO
market during the sample period. Moreover, our results also clearly confirm findings by
Giudici and Paleari (1999) who distinguish two separate periods in which aftermarket
performance varies substantially: a period up to 1989, when IPOs significantly
overperformed the broad-market benchmark, and the remaining period that was
characterized by strong underperformance. In our sample, the percentage of companies
reporting underperformance rose from 52.63 percent between 1988 and 1990 to 84.85
percent between 1995 and 1998. Furthermore, the cross-sectional patterns exhibit a
104
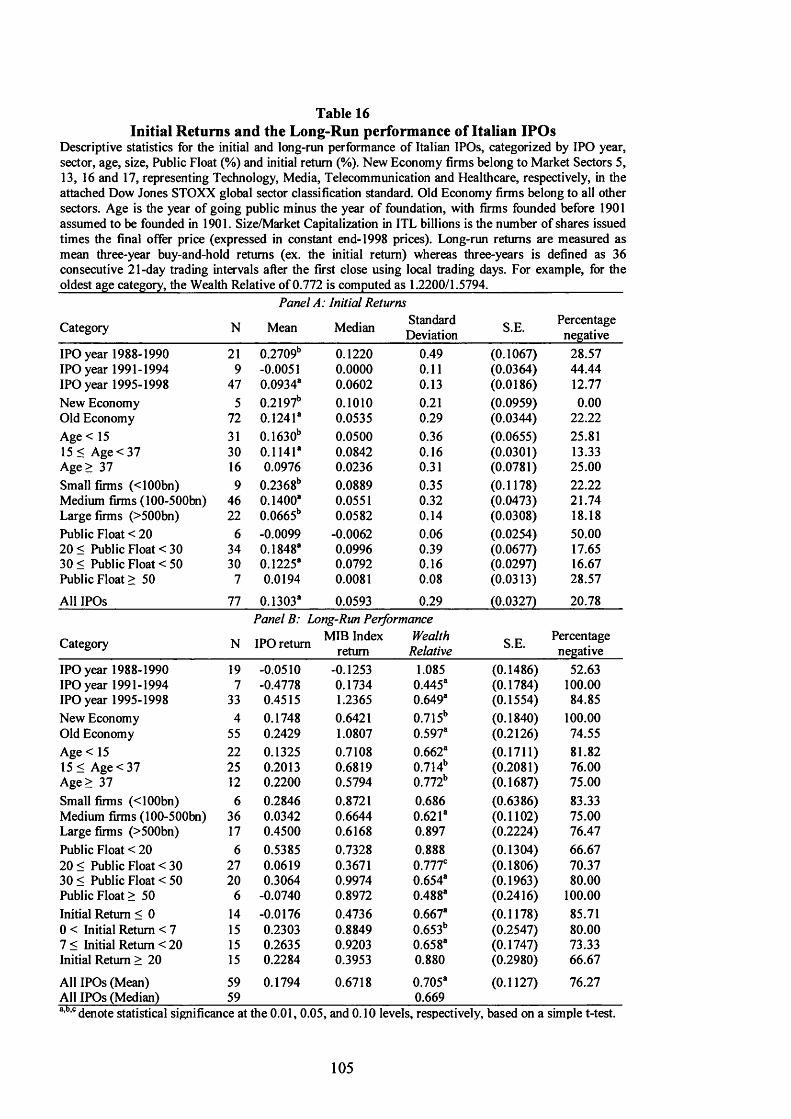
Table 16Initial Returns and the Long-Run performance of Italian IPOs
Descriptive statistics for the initial and long-run performance of Italian IPOs, categorized by IPO year, sector, age, size, Public Float (%) and initial return (%). New Economy firms belong to Market Sectors 5, 13, 16 and 17, representing Technology, Media, Telecommunication and Healthcare, respectively, in the attached Dow Jones STOXX global sector classification standard. Old Economy firms belong to all other sectors. Age is the year of going public minus the year of foundation, with firms founded before 1901 assumed to be founded in 1901. Size/Market Capitalization in ITL billions is the number of shares issued times the final offer price (expressed in constant end-1998 prices). Long-run returns are measured as mean three-year buy-and-hold returns (ex. the initial return) whereas three-years is defined as 36 consecutive 21-day trading intervals after the first close using local trading days. For example, for the
Category N
Panel A: Initial Returns. . . . Standard Mean Median ~ ..Deviation S.E. Percentage
negativeIPO year 1988-1990 21 0.2709b 0.1220 0.49 (0.1067) 28.57IPO year 1991-1994 9 -0.0051 0.0000 0.11 (0.0364) 44.44IPO year 1995-1998 47 0.09348 0.0602 0.13 (0.0186) 12.77New Economy 5 0.2197b 0.1010 0.21 (0.0959) 0.00Old Economy 72 0.1241s 0.0535 0.29 (0.0344) 22.22Age < 15 31 0.1630b 0.0500 0.36 (0.0655) 25.8115 < Age <37 30 0.1141s 0.0842 0.16 (0.0301) 13.33Age> 37 16 0.0976 0.0236 0.31 (0.0781) 25.00Small firms (<100bn) 9 0.2368b 0.0889 0.35 (0.1178) 22.22Medium firms (100-500bn) 46 0.1400s 0.0551 0.32 (0.0473) 21.74Large firms (>500bn) 22 0.0665b 0.0582 0.14 (0.0308) 18.18Public Float < 20 6 -0.0099 -0.0062 0.06 (0.0254) 50.0020 < Public Float < 30 34 0.1848s 0.0996 0.39 (0.0677) 17.6530 < Public Float < 50 30 0.1225s 0.0792 0.16 (0.0297) 16.67Public Float > 50 7 0.0194 0.0081 0.08 (0.0313) 28.57
All IPOs 77 0.1303s 0.0593 0.29 (0.0327) 20.78
Category
Panel B: Long-Run PerformanceMIB Index Wealth
return RelativeN IPO return S.E. Percentage
IPO year 1988-1990 19 -0.0510 -0.1253 1.085 (0.1486) 52.63IPO year 1991-1994 7 -0.4778 0.1734 0.445s (0.1784) 100.00IPO year 1995-1998 33 0.4515 1.2365 0.649s (0.1554) 84.85New Economy 4 0.1748 0.6421 0.715b (0.1840) 100.00Old Economy 55 0.2429 1.0807 0.597s (0.2126) 74.55Age < 15 22 0.1325 0.7108 0.662s (0.1711) 81.8215 < Age <37 25 0.2013 0.6819 0.714b (0.2081) 76.00Age> 37 12 0.2200 0.5794 0.772b (0.1687) 75.00Small firms (<100bn) 6 0.2846 0.8721 0.686 (0.6386) 83.33Medium firms (100-500bn) 36 0.0342 0.6644 0.621s (0.1102) 75.00Large firms (>500bn) 17 0.4500 0.6168 0.897 (0.2224) 76.47Public Float < 20 6 0.5385 0.7328 0.888 (0.1304) 66.6720 < Public Float < 30 27 0.0619 0.3671 O U T (0.1806) 70.3730 < Public Float < 50 20 0.3064 0.9974 0.654s (0.1963) 80.00Public Float > 50 6 -0.0740 0.8972 0.488s (0.2416) 100.00Initial Return < 0 14 -0.0176 0.4736 0.667s (0.1178) 85.710 < Initial Return < 7 15 0.2303 0.8849 0.653b (0.2547) 80.007 < Initial Return < 20 15 0.2635 0.9203 0.658s (0.1747) 73.33Initial Return > 20 15 0.2284 0.3953 0.880 (0.2980) 66.67
All IPOs (Mean) 59 0.1794 0.6718 0.705s (0.1127) 76.27All IPOs (Median) 59 0.669a,b,c denote statistical significance at the 0.01, 0.05, and 0.10 levels, respectively, based on a simple t-test
105

similar tendency to the patterns reported for Germany: there is a clear tendency for IPOs
with higher initial returns and higher ownership retention rate to do better in the long-
run. Finally, the low number of New Economy IPOs, which has been identified as the
main driver behind the relatively favourable IPO performance in other countries, can
explain the strong average and median underperformance of Italian IPOs.48
4.2.4 The Netherlands
In Table 17, we present evidence concerning the performance of Dutch IPOs.
There is significant underpricing that depends on either the market condition at the time
of going public or the sector. Only 8.00 percent of the IPOs recorded negative
unadjusted initial returns. The long-run performance picture is similar to the one
reported for Germany: On average, IPOs have overperformed the market. This
overperformance is driven by New Economy stocks, which make up 31 percent of the
sample. While an investment in the sample of New Economy IPOs leaves the average
investor with Dutch Guilder (NLG) 1.373 relative to each NLG invested in the CBS
Index over three years, an investment in Old Economy IPOs leaves the average investor
with only 0.868 NLG relative to each NLG invested in the CBS Index. There is also a
positive link between offering retention, initial return and long-run performance. We
also note that, unlike for Italy, the average and median IPO long-run performance is
clearly different, thus underlying the higher probability of finding extremely positive
returns in New Economy IPOs, which made up a large percentage of IPOs. O f all the
companies, 66.04 percent recorded negative long-run market adjusted performance, a
result similar to the one presented for Germany and France.
48 During the early 1990s, a number of Italian companies such as Luxoticca Group, an eye-ware company, pursued their IPO on a foreign exchange, such as on the New York Stock Exchange (NYSE). Some of these shares substantially outperformed the market in the long-run.
106

Table 17Initial Returns and the Long-Run performance of Dutch IPOs
Descriptive statistics for the initial and long-run performance of Dutch IPOs, categorized by IPO year, market sector, age, size, Public Float (%) and initial return (%). New Economy firms belong to Sectors 5, 13, 16 and 17, representing Technology, Media, Telecommunication and Healthcare, respectively, in the attached Dow Jones STOXX global sector classification standard. Old Economy firms belong to all other sectors. Age is the year of going public minus the year of foundation, with firms founded before 1901 assumed to be founded in 1901. Size/Market Capitalization in NLG millions is the number of shares issued times the final offer price (expressed in constant end-1998 prices). Long-run returns are measured as mean three-year buy-and-hold returns (ex. the initial return) whereas three-years is defined as 36 consecutive 21-day trading intervals after the first close using local trading days. For example, for the oldest age category, the Wealth Relative o f0.829 is computed as 1.4695/1.7722.____________________
Panel A : Initial Returns
Category N Mean Median StandardDeviation S.E. Percentage
negativeIPO year 1988-1990 17 0.0644s 0.0250 0.09 (0.0224) 21.43IPO year 1991-1994 11 0.0116s 0.0068 0.01 (0.0038) 0.00IPO year 1995-1998 47 0.1888s 0.0780 0.26 (0.0384) 6.38New Economy 30 0.1964s 0.0479 0.29 (0.0521) 3.33Old Economy 45 0.0934s 0.0317 0.16 (0.0241) 11.11Age < 15 27 0.1683s 0.0828 0.25 (0.0471) 7.4115 < Age <37 27 0.1641s 0.0741 0.26 (0.0503) 3.70Age> 37 21 0.0534s 0.0239 0.09 (0.0204) 14.29Small firms (<113m) 17 0.2117s 0.0828 0.30 (0.0730) 11.76Medium firms (113-550m) 31 0.1156s 0.0263 0.24 (0.0428) 12.90Large firms (>550m) 27 0.1079s 0.0590 0.13 (0.0245) 0.00Public Float < 20 20 0.1441s 0.0323 0.24 (0.0538) 5.0020 < Public Float < 30 13 0.202 lb 0.0250 0.34 (0.0949) 15.3830 < Public Float < 50 20 0.1349s 0.0683 0.21 (0.0465) 5.00Public Float > 50 22 0.0859s 0.0345 0.12 (0.0248) 9.09
All IPOs 75 0.1346s 0.0333 0.22 (0.0259) 8.00Panel B: Long-Run Performance
Category N IPO return CBS Index return
WealthRelative S.E. Percentage
negativeIPO year 1988-1990 17 0.0296 0.1844 0.869 (0.4074) 57.89IPO year 1991-1994 11 0.4455 0.7175 0.842 (0.2495) 77.78IPO year 1995-1998 25 1.3460 0.9670 1.193 (0.5493) 68.00New Economy 17 1.4789 0.8056 1.373 (0.6412) 58.82Old Economy 36 0.3865 0.5974 0.868 (0.2268) 69.44Age < 15 18 1.1299 0.6651 1.279 (0.5884) 50.0015 < Age <37 18 0.5964 0.5613 1.022 (0.3191) 77.78Age> 37 17 0.4695 0.7722 0.829 (0.1978) 70.59Small firms (<113m) 12 1.1578 0.3696 1.575 (0.5186) 33.33Medium firms (113-550m) 18 0.2512 0.6354 0.765c (0.1991) 72.22Large firms (>550m) 23 0.8974 0.8405 1.031 (0.5690) 78.26Public Float < 20 16 1.8536 0.6981 1.680 (0.7089) 56.2520 < Public Float < 30 8 0.4678 0.3716 1.070 (0.1503) 37.5030 < Public Float < 50 13 0.0001 0.6100 0.62 lb (0.2401) 84.62Public Float > 50 16 0.3533 0.8206 0.743b (0.1877) 75.00Initial Return < 0 11 0.3486 0.3945 0.967 (0.2869) 54.550 < Initial Return < 7 21 0.6089 0.7589 0.915 (0.3061) 76.197 < Initial Return < 20 9 0.1234 0.4853 0.756 (0.3067) 77.78Initial Return > 20 12 1.7769 0.8799 1.477 (0.8881) 50.00
All IPOs (Mean) 53 0.7369 0.6642 1.044 (0.2796) 66.04All IPOs (Median) 53 0.737a,b,c denote statistical significance at the 0.01,0.05, and 0.10 levels, respectively, based on a simple t-test.
107

Table 18Initial Returns and the Long-Run performance of Spanish IPOs
Descriptive statistics for the initial and long-run performance of Spanish IPOs, categorized by IPO year, sector, age, size, Public Float (%) and initial return (%). New Economy firms belong to Market Sectors 5, 13, 16 and 17, representing Technology, Media, Telecommunication and Healthcare, respectively, in the attached Dow Jones STOXX global sector classification standard. Old Economy firms belong to all other sectors. Age is the year of going public minus the year of foundation, with firms founded before 1901 assumed to be founded in 1901. Size/Market Capitalization in ESP billions is the number of shares issued times the final offer price (expressed in constant end-1998 prices). Long-run returns are measured as mean three-year buy-and-hold returns (ex. the initial return) whereas three-years is defined as 36 consecutive 21-day trading intervals after the first close using local trading days. For example, for the
Category N
Panel A: Initial Returns
Mean Median StandardDeviation S.E. Percentage
negativeIPO year 1988-1990 46 0.1650s 0.0835 0.24 (0.0350) 2.17IPO year 1991-1994 18 0.0064 0.0128 0.10 (0.0237) 27.78IPO year 1995-1998 24 0.2197s 0.0853 0.29 (0.0600) 4.17New Economy 3 0.3182b 0.3165 0.26 (0.1515) 0.00Old Economy 85 0.1414s 0.0764 0.24 (0.0263) 8.24Age < 15 14 0.1146s 0.0590 0.12 (0.0318) 0.0015 < Age <37 38 0.1821s 0.1055 0.28 (0.0454) 10.53Age> 37 36 0.1237s 0.0646 0.24 (0.0400) 8.33Small firms (<7bn) 14 0.1691b 0.0680 0.31 (0.0833) 0.00Medium firms (7-33bn) 45 0.1577s 0.0764 0.26 (0.0387) 8.89Large firms (>33 bn) 29 0.1211s 0.0797 0.18 (0.0335) 10.34Public Float < 20 11 0.0887b 0.0444 0.14 (0.0411) 0.0020 < Public Float < 30 18 0.1001s 0.0799 0.15 (0.0358) 11.1130 < Public Float < 50 40 0.1478s 0.1150 0.18 (0.0284) 10.00Public Float > 50 19 0.2258b 0.0716 0.42 (0.0961) 5.26
All IPOs 88 0.1475s 0.0781 0.24 (0.0260) 7.95
Category N
Panel B: Long-Run PerformanceIGBM Index Wealth
return RelativeIPO return S.E. Percentage
IPO year 1988-1990 37 -0.4826 -0.1255 0.592s (0.0589) 81.08IPO year 1991-1994 14 0.0977 0.4334 0.766s (0.1190) 85.71IPO year 1995-1998 17 0.7840 0.9658 0.907 (0.4545) 82.35New Economy 2 -0.0367 0.2806 0.752 (0.5202) 50.00Old Economy 66 -0.3705 -0.3362 0.948s (0.0133) 83.33Age < 15 11 -0.0651 0.1044 0.847 (0.3027) 72.7315 < Age <37 30 -0.0375 0.2272 0.784 (0.2282) 86.67Age> 37 27 -0.0490 0.3659 0.696s (0.1137) 81.48Small firms (<7bn) 12 0.2739 0.1981 1.063 (0.5414) 75.00Medium firms (7-33bn) 32 -0.1721 0.2408 0.667s (0.1449) 84.38Large firms (>33bn) 24 -0.0393 0.3233 0.726s (0.0841) 83.33Public Float < 20 10 0.3279 0.4430 0.920 (0.1265) 70.0020 < Public Float < 30 14 -0.2643 0.1337 0.649b (0.1723) 78.5730 < Public Float < 50 29 -0.2775 0.0954 0.660s (0.1147) 89.66Public Float > 50 15 0.3537 0.5851 0.854 (0.4722) 80.00Initial Return < 0 12 -0.4100 0.0831 0.545s (0.0736) 91.670 < Initial Return < 7 18 -0.0001 0.3215 0.757s (0.1157) 72.227 < Initial Return < 20 18 -0.3256 0.2322 0.547s (0.1007) 94.44Initial Return > 20 20 0.3810 0.3441 1.027 (0.3690) 75.00
All IPOs (Mean) 68 -0.0465 0.2624 0.755s (0.1193) 82.35All IPOs (Median) 68 0.55387 ,c denote statistical significance at the 0.01,0.05, and 0.10 levels, respectively, based on a simple t-test.
108

4.2.5 Spain
We report the results for IPOs issued on the Madrid Stock Exchange in Table
18. The findings are similar to the one presented for IPOs issued on the Milan Stock
Exchange. There is significant underpricing which is higher in rising stock markets than
in stable and falling stock markets. For the sample as a whole, 7.95 percent recorded
negative returns based on the closing price after the first day of trading. Companies
from Old Economy sectors dominate the Spanish IPO market during the sample period.
Less than four percent of companies are from New Economy sectors. When evaluating
aftermarket performance, we can clearly distinguish between two periods: First, a
period up to 1990, in which IPOs substantially underperform the market. This period is
characterised by regulatory changes following the Spanish Securities Market Reform
Act of 1989. Over three years, a strategy o f investing in the sample of Spanish IPOs
between 1988 and 1990 would have left the average investor with only Spanish Pesetas
(ESP) 0.755 relative to each ESP invested in the Madrid General Index (IGBM).
Second, the period from 1991 and 1998 was characterized by subdued IPO activity and
generally a more favourable long-run performance picture of the companies going
public. The results also confirm the signaling role of underpricing for the Spanish IPO
market. Looking at the sample as a whole, the mean and median long-run performance
of Spanish IPO is dismal, with 82.35 percent of companies underperforming the market
benchmark. This could be partly due to the absence of IPOs in New Economy sectors.
4.2.6 Sweden
In Table 19, we display the results for the initial and long-run performance of
Swedish IPOs. The overall long-run performance of Swedish IPOs was mixed with
71.72 percent of the IPOs underperforming the market after three years. Without IPOs
109

Table 19Initial Returns and the Long-Run performance of Swedish IPOs
Descriptive statistics for the initial and long-run performance of Swedish IPOs, categorized by IPO year, sector, age, size, Public Float (%) and initial return (%). New Economy firms belong to Market Sectors 5, 13, 16 and 17, representing Technology, Media, Telecommunication and Healthcare, respectively, in the attached Dow Jones STOXX global sector classification standard. Old Economy firms belong to all other sectors. Age is the year of going public minus the year of foundation, with firms founded before 1901 assumed to be founded in 1901. Size/Market Capitalization in SEK billions is the number of shares issued times the final offer price (expressed in constant end-1998 prices). Long-run returns are measured as mean three-year buy-and-hold returns (ex. the initial return) whereas three-years is defined as 36 consecutive 21-day trading intervals after the first close using local trading days. For example, for the oldest age category, the Wealth Relative of 1.070 is computed as 1.8417/1.7211.____________________
Panel A: Initial Returns
Category N Mean Median StandardDeviation S.E. Percentage
negativeIPO year 1988-1990 26 0.2618a 0.1755 0.23 (0.0457) 0.00IPO year 1991-1994 41 0.1178" 0.0568 0.21 (0.0334) 21.95IPO year 1995-1998 81 0.1937" 0.0846 0.32 (0.0358) 13.58New Economy 55 0.2629" 0.1474 0.29 (0.0390) 5.45Old Economy 93 0.1383" 0.0714 0.27 (0.0281) 18.28Age < 15 76 0.1997" 0.0961 0.27 (0.0306) 13.1615 < Age <37 33 0.1752" 0.1000 0.22 (0.0377) 3.03Age> 37 39 0.1634" 0.0500 0.36 (0.0577) 23.08Small firms (<0.4bn) 84 0.2204" 0.1027 0.32 (0.0346) 11.90Medium firms (0.4-2.0bn) 48 0.1232“ 0.0508 0.21 (0.0304) 18.37Large firms (>2.0bn) 16 0.1810" 0.0902 0.27 (0.0680) 6.67Public Float < 20 26 0.2407“ 0.1841 0.22 (0.0434) 7.6920 < Public Float < 30 37 0.3278" 0.1446 0.41 (0.0676) 2.7030 < Public Float < 50 42 0.1361" 0.0823 0.23 (0.0354) 16.67Public Float > 50 43 0.0750" 0.0500 0.15 (0.0225) 23.26
All IPOs 148 0.1846" 0.0866 0.28 (0.0233) 13.51Panel B: Long-Run Performance
Category N IPO return AFG Index return
WealthRelative S.E. Percentage
negativeIPO year 1988-1990 22 -0.2906 -0.0289 0.731" (0.0798) 77.27IPO year 1991-1994 32 0.4835 0.9123 0.776" (0.1218) 81.25IPO year 1995-1998 45 1.4020 1.1286 1.128 (0.3695) 62.22New Economy 30 1.5212 0.9592 1.287 (0.4887) 60.00Old Economy 69 0.3846 0.7329 0.799" (0.1231) 76.81Age < 15 46 0.7928 0.8842 0.952 (0.2688) 69.5715 < Age <37 22 0.4368 0.7419 0.825 (0.2564) 77.27Age> 37 31 0.8417 0.7211 1.070 (0.3446) 70.97Small firms (<0.4bn) 52 0.9782 0.7905 1.105 (0.3077) 69.23Medium firms (0.4-2.0bn) 35 0.4692 0.8851 0.779b (0.1677) 77.78Large firms (>2.0bn) 12 0.4071 0.6051 0.877 (0.1414) 63.64Public Float < 20 19 1.2267 0.7956 1.240 (0.4899) 73.6820 < Public Float < 30 24 0.4439 0.6520 0.874 (0.2020) 62.5030 < Public Float < 50 26 1.0572 0.9014 1.082 (0.5026) 65.38Public Float > 50 30 0.3575 0.8382 0.739" (0.1498) 83.33Initial Return < 0 19 0.7819 1.1597 0.825 (0.3498) 84.210 < Initial Return < 7 24 0.3794 0.7821 0.774b (0.1927) 75.007 < Initial Return < 20 26 0.9686 0.7319 1.137 (0.4552) 69.23Initial Return > 20 30 0.7676 0.6504 1.071 (0.3256) 63.33
All IPOs (Mean) 99 0.7290 0.8015 0.960 (0.1768) 71.72All IPOs (Median) 99 0.726a,b,c denote statistical significance at the 0.01,0.05, and 0.10 levels, respectively, based on a simple t-test.
110
in New Economy sectors, the average long-run IPO performance would have been
dismal. The 148 Swedish IPOs record an average underpricing of 18.46 percent, with
13.51 percent trading in negative territory based on their first close. Underpricing was
highest between 1988 and 1990. None of the 26 IPOs between 1988 and 1990 recorded
a negative initial return. This can be explained by the fact that underpricing up until
1990 was driven by an incentive to replace salary increases by tax efficient capital
gains. Another important feature of the Swedish IPO market is that 37 percent of
Swedish IPOs during the sample period belong to the New Economy sectors, the
highest compared to the other six countries in this study. Most of the New Economy
stocks went public between 1995 and 1997, which is strongly apparent when dividing
IPO performance by IPO year. For example, a strategy of investing in the basket of
Swedish IPOs between 1991 and 1994 at the first closing price and then holding them
over a three-year period, would have left the investor with only Swedish Krona (SEK)
0.776 relative to each SEK invested in the AFG Index. In contrast, Swedish IPOs issued
between 1995 and 1998 rose, on average, by 140.20 percent over three years while the
AFG Index recorded a rise of 112.86 percent, a ratio of 1.128. The results displayed in
Table 19 also verify our previous observations that the magnitude o f long-run
performance is sensitive to the size of the public float and the degree of underpricing.
4.2.7 Switzerland
In Table 20, we present evidence concerning the performance of Swiss IPOs
going public on the respective market segments of the SWX stock exchange between
1988 and 1998. We cannot reject that Swiss IPOs were underpriced, on average, across
the sample period. However, the recorded degree of underpricing is markedly lower
than for other European countries across the sample period. An interesting feature of the
111

Table 20Initial Returns and the Long-Run performance of Swiss IPOs
Descriptive statistics for the initial and long-run performance of Swiss IPOs, categorized by IPO year, sector, age, size, Public Float (%) and initial return (%). New Economy firms belong to Market Sectors 5, 13, 16 and 17, representing Technology, Media, Telecommunication and Healthcare respectively in the attached Dow Jones STOXX global sector classification standard. Old Economy firms belong to all other sectors. Age is the year of going public minus the year of foundation, with firms founded before 1901 assumed to be founded in 1901. Size/Market Capitalization in CHF millions is the number of shares issued times the final offer price (expressed in constant end-1998 prices). Long-run returns are measured as mean three-year buy-and-hold returns (ex. the initial return) whereas three-years is defined as 36 consecutive 21-day trading intervals after the first close using local trading days. For example, for the oldest age category, the Wealth Relative of 0.835 is computed as 1.4691/1.7601.____________________
Category N
Panel A :
Mean
Initial Returns
Median StandardDeviation S.E. Percentage
negativeIPO year 1988-1990 10 0.0343 0.0149 0.07 (0.0216) 30.00IPO year 1991-1994 4 0.09088 0.0882 0.07 (0.0349) 0.00IPO year 1995-1998 29 0.1196“ 0.0489 0.17 (0.0319) 10.34New Economy 18 0.1444“ 0.1169 0.16 (0.0387) 16.67Old Economy 25 0.0629b 0.0227 0.13 (0.0260) 12.00Age < 15 17 0.0965b 0.0400 0.18 (0.0431) 23.5315 < Age <37 13 0.1120“ 0.0765 0.10 (0.0264) 7.69Age> 37 13 0.0829° 0.0194 0.16 (0.0451) 3.85Small firms (<80m) 6 0.0642b 0.0438 0.08 (0.0319) 0.00Medium firms (80-450m) 28 0.1235“ 0.0529 0.17 (0.0329) 17.86Large firms (>450m) 9 0.0368° 0.0194 0.06 (0.0203) 11.11Public Float < 20 2 0.0496° 0.0496 0.04 (0.0270) 0.0020 < Public Float < 30 2 0.1301 0.1301 0.15 (0.1033) 0.0030 < Public Float < 50 10 0.1377b 0.0854 0.18 (0.0567) 0.00Public Float > 50 29 0.0841“ 0.0375 0.15 (0.0271) 20.69
All IPOs 43 0.0971“ 0.0400 0.15 (0.0228) 13.95Panel B: Long-Run Performance
Category N IPO return STM Index return
WealthRelative S.E. Percentage
negativeIPO year 1988-1990 10 0.2754 0.1997 1.063 (0.3785) 70.00IPO year 1991-1994 4 0.8104 0.9888 0.910 (0.4351) 75.00IPO year 1995-1998 17 0.6676 0.8422 0.905 (0.2459) 64.71New Economy 12 0.7337 0.7534 0.989 (0.2814) 66.67Old Economy 19 0.4495 0.5910 0.911 (0.2398) 68.42Age < 15 13 0.5727 0.6278 0.966 (0.3061) 69.2315 < Age <37 9 0.6309 0.5852 1.029 (0.2539) 55.56Age> 37 9 0.4691 0.7601 0.835 (0.3932) 77.78Small firms (<80m) 6 -0.1098 0.4164 0.628° (0.2726) 83.33Medium firms (80-450m) 19 0.6779 0.6889 0.993 (0.2200) 63.16Large firms (>450m) 6 0.8539 0.7803 1.041 (0.5257) 66.67Public Float < 20 1 -0.1579 0.2933 0.651 - 100.0020 < Public Float < 30 1 0.9913 1.1113 0.943 - 100.0030 < Public Float < 50 8 1.1413 0.8974 1.129 (0.4435) 50.00Public Float > 50 21 0.3515 0.5564 0.868 (0.2134) 71.43Initial Return < 0 5 0.5664 0.4028 1.117 (0.4195) 80.000 < Initial Return < 7 15 0.5731 0.6100 0.977 (0.3075) 66.677 < Initial Return < 20 6 0.7013 0.9044 0.893 (0.3627) 66.67Initial Return > 20 5 0.3415 0.7355 0.773 (0.4062) 60.00
All IPOs (Mean) 31 0.5595 0.6538 0.943 (0.1849) 67.74All IPOs (Median) 31 0.774% ° denote statistical significance at the 0.01, 0.05, and 0.10 levels, respectively, based on a simple t-test.
112
Swiss IPO market is the large number o f New Economy IPOs that drive both initial and
long-run aftermarket returns. For the sample as a whole, we do not find significant long-
run underperformance. Of all the IPOs in the sample, 67.74 percent recorded negative
market adjusted returns in the long-run, a number slightly lower than reported for other
European countries. Owning to the small sample sizes, it is difficult to draw inferences
about the explanatory power of cross-sectional characteristics and long-run aftermarket
performance of Swiss IPOs.
5 Checks of Performance Differences
Putting the methodological issues in performance differences between Chapter II
and Chapter III aside, in order to investigate the patterns in IPO performance across
countries, we measure the significance o f country-by-country performance differences.
This analysis is performed for 21 pairs o f countries for the sample as a whole and for
IPOs categorized by the issuing characteristics identified above using the conventional
two samples test for Mean Difference. Moreover, because the results may be biased
because of the skewness of the return distributions, we perform further robustness
checks using the nonparametric Wilcoxon rank sum test.
In Table 21, we report the result for the significance of differences in initial
returns. The findings confirm our earlier observation. While significantly higher
underpricing o f Swedish IPOs offered between 1988 and 1990 indicates the effect of
underpricing as tax-efficient compensation o f management, the large number of young
companies going public during 1998 explains the significantly higher level of
underpricing for German IPOs, when compared to their European counterparts. German
and Swedish underpricing was particularly significantly different when compared to
France. This underlines the effect of certain IPO mechanisms that are relatively unique
113

Table 21Test for Significance of Initial Return Differences
In each Panel, we measure whether the adjusted initial return performance in one country is significantly different from the adjusted long-run IPO performance in another country. This analysis is performed for 21 country pairs using the conventional two samples test for Mean Difference and the nonparametric Wilcoxon rank sum test. The initial return (IR) is the percentage difference between the final offering price and the first-day closing price. Significance values correspond to p-values.____________________
Tests for significance o f Initial Returns (IR) Differences
Country IR Conventional two samples test for Mean Difference (p-value)BD FR IT NL ES SD SW
Germany (BD) 0.2566 0.0000 0.0348 0.0396 0.0489 0.1098 0.3690France (FR) 0.1237 0.8034 0.6613 0.3243 0.0059 0.3704Italy (IT) 0.1303 0.9185 0.6790 0.1764 0.4811Netherlands (NL) 0.1346 0.7282 0.1847 0.3288Spain (ES) 0.1475 0.3071 0.2158Sweden (SD) 0.1846 0.0533Switzerland (SW) 0.0971
Country IR Nonparametric Wilcoxon rank sum test (p-value)BD FR IT NL ES SD SW
Germany (BD) 0.2566 0.0296 0.0729 0.1044 0.6884 0.4381 0.0751France (FR) 0.1237 0.6488 0.9817 0.3350 0.0273 0.5481Italy (IT) 0.1303 0.7137 0.2950 0.0569 0.9172Netherlands (NL) 0.1346 0.3256 0.0466 0.6464Spain (ES) 0.1475 0.2960 0.1675Sweden (SD) 0.1846 0.0295Switzerland (SW) 0.0971
to the French IPO market during the sample period. For other country pairs, the results
do not indicate a significant difference in underpricing.
Findings for the significance in long-run performance differences between IPOs
in the seven European countries under study are shown in Table 22. O f the 21 country
pairs, 17 do not indicate significant differences in long-run IPO performance. An
exception is the sample of German IPOs, which, on average, have substantially
outperformed French IPOs. Much like for Initial Returns, this is due to the favourable
performance o f German IPOs issued during the late 1990s. Italy ranks lowest in the
long-run performance ranking. It substantially underperformed most of the other
countries in the study, which, as argued earlier, could be due to the lack of IPO activity
in the New Economy sectors in this market.
114

Table 22Test for Significance of Long-Run Return Differences
In each Panel, we measure whether the adjusted long-run IPO performance in one country is significantly different from the adjusted long-run IPO performance in another country. This analysis is performed for 21 country pairs using the conventional two-sample test for Mean Difference and the nonparametric Wilcoxon rank sum test. Long-run returns are measured as broad-market adjusted mean three-year buy- and-hold returns (BHRT) whereas three years is defined as 36 consecutive 21-day trading intervals using local trading days. Significance values correspond to p-values.__________________________________
Tests for significance o f Long-Run Performance (BHRT) Differences
Country BHRt Conventional two samples test for Mean Difference (p-value)BD FR IT NL ES SD SW
Germany (BD) 0.9850 0.0664 0.1999 0.4667 0.2446 0.2550 0.5118France (FR) -0.2074 0.2293 0.3991 0.7086 0.5869 0.7753Italy (IT) -0.5584 0.0222 0.1441 0.0499 0.0305Netherlands (NL) 0.0649 0.1502 0.6480 0.6554Spain (ES) -0.3089 0.3116 0.3223Sweden (SD) -0.0725 0.9471Switzerland (SW) -0.0943
Country BHRt Nonparametric Wilcoxon rank sum test (p-value)BD FR IT NL ES SD SW
Germany (BD) 0.9850 0.0261 0.0158 0.6398 0.2611 0.2565 0.9098France (FR) -0.2074 0.5102 0.1872 0.4764 0.2786 0.1615Italy (IT) -0.5584 0.0908 0.2084 0.1383 0.0782Netherlands (NL) 0.0649 0.8345 0.7337 0.7386Spain (ES) -0.3089 0.9844 0.5043Sweden (SD) -0.0725 0.4314Switzerland (SW) -0.0943
The analysis of cross-sectional results for the significance in performance
differences across the seven European countries also helps to shed some more light on
some of the cross-sectional findings reported earlier. In Appendix D, Tables 49 - 60,
significance tests are conducted by categorizing IPOs in each of the seven countries
according to the issuing characteristic at the IPO date. We can infer that the
significantly negative performance of Spanish IPOs was an isolated event limited to
IPOs issued between 1988 and 1990, a time when changes in Spain’s securities markets
law facilitated the process of going public. Moreover, tests for New Economy IPOs
indicate insignificant performance differences across countries. The same result applies
when comparing the significance o f performance differences of IPOs categorized by
issuing characteristics such as Old Economy sector, oldest age category or largest size.
115

In our pooled sample of 973 European IPOs in Chapter II, we found a tendency
for companies that retained the least at the IPO date to underperform the most in the
long-run. The results displayed in Appendix D, Tables 57 - 58, confirm significant
underperformance of companies with the highest public float at the IPO date. The result
is not driven by one single country, but extends across all countries in this study. A
slightly different picture emerges when categorizing long-run returns according to the
initial returns category. While there is a clear tendency for companies with the lowest
initial returns to perform similarly, French IPOs in the highest initial return category
perform significantly worse. In this respect, the majority of all other IPOs in the
countries do not show significant performance differences when compared with each
other. This result is robust to both forms o f statistical measurement used. For France,
therefore, there is weak support for the signaling explanation of underpricing.
In order to underline the sensitivity of our analysis to methodological choices
extensively addressed in Barber and Lyon (1997) and Kothari and Warner (1997), we
compare the findings on the aftermarket performance of IPOs in the individual
European countries pursued in this section to the results using the pooled sample of
European IPOs in the previous chapter. The results are shown in Appendix E, Table 61,
and indicate methodological issues across two dimensions: First, in both studies (Table
61, Panel A and B), the results on monthly portfolio rebalancing (CARs) confirm that
the use of buy-and-hold returns (BHRs) biases the long-run performance upwards, a
findings consistent with Ritter (1991), Schuster (1996) or Teoh, Welch and Wong
(1998). Second, while there is overall consistency in the findings on raw and adjusted
returns between Chapter II and Chapter III - the slight difference being due to the use of
a European versus Local Trading Day Calendar resulting in different sample sizes at the
and the conversion of stock prices into Euro (€) when appropriate at the individual
116

country level - the choice of a pan-European benchmark index versus a local benchmark
index with a potentially large divergence in sector weightings has a clear influence on
the results.
6 Summary and Conclusion
In this chapter, we have analysed the short- and long-run performance of Initial
Public Offerings (IPOs) in seven individual European countries between 1988 and
1998, a time characterized by a rapid change. In all countries, companies going public
were significantly underpriced. Average initial returns are also related to age and the
percentage of New Economy stocks of total IPO activity. In each country under study,
there appears to be a close link between IPO activity, the level of underpricing and the
general level o f the stock market. Moreover, the results point to the effects of tax
incentives (in the case of Sweden or France), the IPO mechanism (in the case of France)
and changes in the regulatory environment (in the case of Spain) on the level of
underpricing and IPO activity.
The long-run aftermarket performance of IPOs issued in the seven European
countries is mixed. We find that a strategy o f investing in IPOs at the end of the first
day of trading, and holding them over a three-year period, would have left the investor
in German IPOs with DM1.701 relative to each DM invested in the FAZ Index, and the
investor in Dutch IPOs with NLG1.044 relative to each NLG invested in the CBS
Index. Investors in other countries would have underperformed the market: the investor
in Swedish IPOs would have been left with only SEK0.960 to each SEK invested in the
AFG Index, the investor in Swiss IPOs would have been left with CHF0.943 relative to
each CHF invested in the STM Index, and the investor in French IPOs with FRF0.881
relative to each FRF invested in the SBF 250 Index. Spanish and Italian IPOs fared the
117

worst: an investment in the sample of Spanish IPOs resulted in ESP0.755 for each ESP
invested in the IGBM Index after three years. The investor in Italian IPOs would have
been left with only ITL0.705 for each ITL invested in the MIB Historical Index over
three years.
We have also shown that aftermarket performance is sensitive to benchmark
adjustment and return methodology. In the countries under study, returns on IPOs were
more favourable when adjusted for movements in small- or mid-cap indices, when
available. We also found that the use of cumulative average returns (CARs) results in a
more negative long-run performance picture when compared to buy-and-hold returns
(BHRs). An analysis of CARs of German, Dutch and Swedish IPOs indicates strong
overperformance during the first months on the stock market. Capturing the positive
returns in the countries faring best depends on the investor’s ability o f finding the
extreme winner. This describes the essence of the IPO market.
For each individual country, we have also documented various cross-sectional
and time-series patterns in long-run performance by segmenting IPOs according to a
number of issuing characteristics. When categorizing performance according to the
public float at the IPO date, for example, we find that companies retaining the least
amount of equity at the IPO date perform particularly poorly. We also show that the
relatively favourable average return picture is driven by the outperformance of IPOs in
sectors representing the New Economy. This applies to Germany, France, The
Netherlands, Sweden and Switzerland, the five countries with significant New Economy
IPO activity during the sample period. Stock exchanges in countries that did not manage
to cater to companies in New Economy sectors during the sample period via New
Market segments, such as Italy or Spain, did the worst. Moreover, the poor performance
of Old Economy IPOs relative to the market and their New Economy peers is not an
118

isolated event as it extends to all countries under study. Significance tests of
performance differences indicate broad similarity in underpricing and long-run return
behaviour of IPOs in the seven countries under study, which underlines the
homogeneity of the European IPO market and the pervasiveness of the reported IPO
patterns.
119
Chapter IV
Management Behaviour and Market Response
1 Introduction
A recent line o f empirical research on Initial Public Offerings (IPOs) links the
conventional measurement of stock returns with accounting information, aimed at
providing more insights into the phenomena associated with IPOs and the decision for
going public. Using a sample of 1,649 US IPOs issued between 1980 and 1992, Theo,
Welch and Wong (1998) document the effect of the choice of accounting method
towards earnings management during the IPO year on aftermarket stock price
performance. They find that IPO issuers that use discretionary current accruals
aggressively during the IPO year have a three-year aftermarket stock return of
approximately 20 percent less than IPO issuers who manage their earnings more
conservatively during this time.
One o f the important implications o f this study is that the market does respond to
earnings management behaviour which signals fundamental information about the IPO
firms. This result, however, draws heavily on the fact that three-year aftermarket
performance is measured starting from a substantial period of time after the IPO date.49
This measurement procedure leaves open the question o f when the market starts to
respond to fundamental information. The measuring strategy should not matter if the
market is efficient as thought. However, if the market is not perfectly efficient, then the
market learning process is an important issue to both economists and practitioners. It
49 Teoh, Welch and Wong (1998) measure the stock performance from three to six months after the end of the first fiscal year, that is itself several months after the IPO date (an average six months in the German market, for example).
120
might well be true that the market responds earlier than the time the previous literature
has implied.
It is well known that IPOs perform poorly in the long-run, but outperform the
market in the short-run (e.g., Stoll and Curley (1970), Ritter (1991), Schuster (1996)).
This perplexing evidence might indicate that the IPO market is not largely determined
by fundamental information of IPO firms in the short-run. In another paper, using a
sample of 489 US IPOs between 1974 and 1984, Chaney and Lewis (1998) study the
relationship between IPO aftermarket performance and yet another form of earnings
management: income smoothing. They find that firms that report earnings with less
variability relative to cash earned from operations perform better than other firms.
Chaney and Lewis (1998) measure the stock performance from the IPO date, but their
horizon is five years. Since income smoothing is an ex-post measurement, a long
measurement horizon is very likely to bury the time characteristic of a market learning
process. The result therefore gives little clue to the question o f when the market
responds.
The short-run overperformance of IPO stocks has drawn increasing attention in
the recent literature. Several papers have tried to build-up theoretical models to explain
this phenomenon. Scheinkman and Xiong (2002) derive an equilibrium model of
bubbles where overconfidence and differences o f beliefs can push the stock price above
its fundamentals. In another recent paper, Duffie, Garleanu and Pederson (2002) present
a model in which short-selling constraints can drive the IPO stock price to an
excessively high level before it declines. These models claim that the IPO market is at
least partially determined by factors such as divergence of opinion (Miller (1977)),
overconfidence or other institutional arrangements unique to the IPO market, such as
121

stabilization, the “quiet period” or lock-up rules. Obviously, none o f them is
fundamental information about IPO firms.
In this paper, we study a set of 126 companies going public between 1988 and
1997 in the German market, with the aim to broaden our understanding of several
unexplored issues related to IPOs. Using the same framework of Teoh, Welch and
Wong (1998) and Chaney and Lewis (1998), we examine the relationship between the
management behaviour towards earnings management and aftermarket performance in
the German IPO market. By applying a similar measurement specification, we test
whether the relationship between management behaviour, proxied by the aggressiveness
o f using discretionary current accruals and income smoothing, and the aftermarket IPO
performance identified in the US market, also holds in one other major IPO market. We
then deviate from this benchmark measuring specification to test whether the IPO
market is informationally efficient in the sense that management behaviour can be
efficiently inferred by the market. We also go beyond prior work to further examine the
relationship between the two forms o f strategic behaviour towards earnings
management, and test how the market responds to their interaction. Finally, we combine
the typical empirical IPO methodology o f Ritter (1991) and the framework of
discretionary current accruals and income smoothing to examine the driving sources of
the dynamics of aftermarket IPO performance.
Our major findings in this chapter include the following:
(1) Managers o f IPO firms tend to use discretionary current accruals to buoy up
earnings during the IPO year and, to some extent, manage the firms’ income.
The long-run performance o f German IPOs is related to such eamings-
management behaviour. Firms that use discretionary current accruals more
conservatively during the IPO year and firms that smooth their reported
122
income more, outperform their counterparts in the long-run. These results are
generally consistent with US evidence.
(2) The two commonly identified earnings management strategies in IPOs are
found to be not deterministic, yet complementary. In the long-run, firms that
use discretionary current accruals during IPO years more conservatively also
tend to smooth their reported income more. Firms undertaking both strategies
outperform the market and IPOs that only apply any one o f the two
strategies.
(3) The relationship between IPO aftermarket performance and strategic
eamings-reporting behaviour documented in the previous literature is
sensitive to both the measurement horizon and the starting date. Ironically,
we find that firms managing their earnings more opportunistically perform
better than those managing their earnings more conservatively, when
performance is measured from a date closer to the IPO and also when it is
measured over shorter horizons.
(4) The market takes a significant period of time to incorporate fundamentals
into IPO prices. During this period, fundamental information about the IPO
has weak explanatory power for long-run performance and the IPO market is
dominated by other non-fundamental “noise”. After a period of learning, the
market starts to respond and the power of fundamentals to explain long-run
IPO returns increases substantially.
The structure of the chapter is as follows. Section 1 describes the data and
sample characteristics. In Section 2, we measure Management Behaviour with
Discretionary Current Accruals (DCA). Section 3 deals with the measurement of
Management Behaviour with Income Smoothing (IS). A comparative analysis of the
123

two methods o f earnings management is provided in Section 4. In Section 5, we study
the dynamics of the explanatory power of fundamentals related to aftermarket
performance. Section 6 concludes the paper with a summary and a discussion of the
findings.
2 Market Background and Data
2.1 Market Background
During the past decade, German Financial Markets have gone through some
radical developments. One o f the fundamental features of these developments has been
the increasing tendency of companies towards going public. At the end of 2001, more
than 1,000 German companies were listed on the Deutsche Borse AG or on one of the
regional stock exchanges, double the number from the beginning o f 1988, the start of
our sample period. While this number seems to be small compared to worldwide
figures, it indicates the structural shift towards an equity culture in Continental Europe
in general and Germany in particular.
This structural shift has been enforced by developments such as the initial
success o f the much publicized flotation of Deutsche Telecom AG, the country’s former
telecommunications monopoly, in November 1996. By the end of 2000, 12.33 million
people - or 19.3 percent of the adult population in Germany - owned shares, 50 percent
more than the previous year and double the level at the end of 1997, a change
unprecedented in Germany’s post-war financial history.50 During this period, the
German IPO market has also developed as one of the fundamental pillars of Continental
European IPO activity. For our sample period between 1988 and 1997, for example,
50 Source: Financial Times. Glagau (1876) documents evidence of a flurry of IPO activity on the Berlin Stock Exchange between 1871 and 1875 which indeed has some strikingly similar features to the IPO wave in the late 1990’s on the Neuer Markt, the market segment for growth companies set up in 1997.
124

German IPO activity accounted, on average, for more than 25 percent of total IPO
activity in Continental Europe based on number, funds raised and market capitalization.
2.2 Data
Our original sample consists of 156 companies from a total of 162 companies
going public between 1988 and 1997 on the German domestic market, meeting the
following criteria: (1) an offer price of Deutsche Mark (DM) 5.00 per share or more; (2)
a market capitalization, measured in terms of end-1997 purchasing power, of DM 5.0
million or more; (3) the offering being unseasoned and involving common and/or
preferred stock; and (4) the company being listed either on the Official Market
(Amtlicher Handel), the Official Parallel Market (Geregelter Markt) or the New Market
(Neuer Markt). We exclude foreign listings, investment companies, companies that
changed the market segment and Real Estate Investment Trusts (REITs).51
In addition to these criteria, we must also have a minimum of one year pre-IPO
and four years post-IPO accounting and stock price data available. After excluding IPOs
from the Financial Sector (12), Privatization Issues (1) and IPOs with no reliable pre-
IPO accounting information (17), the original sample falls to 126 companies for which
we have a complete set of accounting and stock price data available. The total sample of
companies represents around 88 percent of all IPOs in the respective market segments
going public in Germany between 1988 and 1997. An interesting feature of our data is
that it does not suffer from survivorship bias. Accounting for survivorship is a frequent
issue in US studies. This has to do with the large number of mergers, acquisitions,
takeovers and bankruptcies in the US market. Moreover, the delisting rules are clearly
51 We account for issues on the Frankfurt stock exchange and all regional stock exchanges. During the sample period, the share of the Frankfurt Stock Exchange, in terms of total German turnover in equity trading, has risen from 52 percent to 85 percent, underlying the increasing significance of the exchange. (Source: Deutsche Borse AG). We exclude offerings on the Over-the-Counter market (Freiverkehr).
125

set out in the US regulatory framework. Until recently, this has not been the case in
Germany. All the IPOs from the original sample were still listed after their fifth-year
anniversary on the stock market. We therefore conclude that our sample is highly
representative of the German IPO market during the sample period.
Due to a lack of accounting data spanning over a reasonably long period of time,
this study does not include IPOs issued between 1998 and 2000. For the evaluation of
earnings management, we use the frill version (Vollbilanz) of balance sheets and income
statements (inflation-adjusted) available from Hoppenstedt Verlag, a provider of
financial data.52 Other information such as year of foundation or market sector was
taken from the yearly issues of Hoppenstedt’s Saling Aktienfuhrer. To evaluate
accounting numbers, we use consolidated financial statements, when available.
Consolidated financial statements (Weltbilanz) are not the basis for either taxation or
profit distribution. However, Financial Analysts draw heavily upon information
contained in consolidated statements because they capture a more complete picture of,
for example, the operating activities of companies with foreign subsidiaries. The full set
of consolidated statements is available for 58 percent of the companies in our study.
For the rest, we extract the accounting information from parent company accounts
(Muttergesellschaft).53 The stock price data and GDP deflators were taken from
Datastream and our own IPO database. We use the Dow Jones STOXX global sector
classification standard for market sector classification.54
In Figure 6, we illustrate our timing convention. The fiscal year in which the IPO
occurs is Year 0 and includes both pre- and post-IPO information. Fiscal year -1 ends
before the IPO. The large majority of German companies in our sample end their fiscal
52 A Specimen Balance Sheet and Profit and Loss Account shown in Appendix F, Table 62.53 Due to the lack of foreign subsidiaries, for example, parent company accounts are equivalent to consolidated accounts for most of the 42 percent of companies that report only parent company accounts.54 The Dow Jones STOXX global sector classification standard is displayed in Appendix A, Table 31.
126

Calendar Year (-1) Calendar Year (0) Calendar Year (+1)
First AnnualFiscal Fiscal IPO Fiscal ShareholderYear Year Date Year Meeting
End-2 End -1 EndO
FiscalYear
End+1
n = 3
n = 9
n = 12Return measurement starts n months after IPO Date
- >
- >
- >
Figure 6. Time line
year with the calendar year. Our initial screening of IPOs is based on the company
characteristics around the IPO date. It is important to note that, on average, German
IPOs went public towards the middle o f the calendar year. For example, as illustrated in
Table 1, 65 percent of the companies in the sample conducted their IPO between May
and October.
Because one of our main goals is to shed some light on the relationship between
management behaviour and market response, we measure returns over 36 months. In
order to compare our findings with the literature, we chose our benchmark starting date
as nine months after the IPO. To study the dynamics in the relationship, we then move
our starting date away and closer to the IPO date. In this case, we measure long-run
performance after three and twelve months following the IPO. Interestingly, our
benchmark starting date corresponds closely to the First Annual Shareholder Meeting
(Erste Allgemeine Aktionarsversammlung).55
55 Based on the observations taken from a sample of 785 Annual Shareholder Meetings in 2002, almost 75 percent of the meetings took place during May, June and July (Source: Schutzgemeinschaft der Kleinaktionare e.V.)
127

Table 23Sample Distribution and Firm Characteristics
The sample consists o f 126 IPOs going public between 1988 and 1997. The initial return is defined as the percentage change from the offering price to the first-day closing price. Age is defined as the year of going public minus the year o f foundation, with companies founded before 1901 assumed to be founded in 1901. Size is defined as the number o f shares times the closing price at the first day o f trading, including overalottment options, where applicable, and expressed in end-1997 prices. The retention ratio (in percent) is defined as one minus the size o f the public float (in percent). Underpricing is defined as the percentage change from the final offering price to the closing price after the first day o f trading. Privatizations (1) and Financial Companies are excluded (12). We use the Dow Jones STOXX global sector classification standard for market sector classification._________________________________________
Panel A: Sample Distribution classified by Market Sector
Market Sector Sector Code Frequency Percentage
Basic Resources 1 3 2.4Chemicals 2 3 2.4Automobiles 3 8 6.3Cyclical Goods & Services 4 27 21.4Retail 6 9 7.1Food & Beverages 7 5 4.0Non-Cyclical Goods & Services 8 8 6.3Healthcare 13 6 4.8Construction 14 16 12.7Industrial Goods & Services 15 24 19.0Technology 16 14 11.1Utilities 18 3 2.4Total 126 100.0
Panel B: Sample Distribution classified by IPO Year and Calendar Month
Year Frequency Percentage Month Frequency Percentage
1988 10 7.9 Jan. 3 2.41989 17 13.5 Feb. 5 4.01990 22 17.5 Mar. 4 3.21991 14 11.1 Apr. 6 4.81992 8 6.3 May 10 7.91993 6 4.8 Jun. 17 13.51994 8 6.3 Jul. 24 19.01995 16 12.7 Aug. 3 2.41996 6 4.8 Sep. 9 7.11997 19 15.1 Oct. 19 15.1
Nov. 15 11.9Dec. 11 8.7
All firms 126 100.0 All firms 126 100.0
Panel C: Firm CharacteristicsMean Median
Age (years) 44.2 39.5Underpricing (percent) 11.6 4.8Retention Ratio (percent) 66.2 66.7Debt/Equity Ratio (pre- IPO) 1.429 1.093Debt/Equity Ratio (post- IPO) 0.779 0.643Size (DM millions) 437.5 195.9
128

In this study, we report performance using equally-weighted buy-and-hold
returns (BHRs) because it measures actual investors’ experience.56 Aftermarket returns
are measured as equally-weighted buy-and-hold returns, whereas one month is defined
as a consecutive 21-day trading interval from the close of the first day of trading, using
local trading days over the respective measurement interval. We adjust returns for
movements in the value-weighted FAZ Index (Index der Frankfurter Allgemeinen
Zeitung). This index is composed of the 100 most actively traded companies, adjusted
for rights offerings and stock splits, and embraces about 75 percent of stock volume
traded in German shares.
Table 23 provides some descriptive statistics for the 126 IPOs in our sample.
Panel A indicates that there is some industry clustering in the sample of IPOs, with four
sectors representing almost 65 percent of the sample. It is not surprising to see so many
construction-related companies in the sample, representing a large proportion o f IPO
activity following German unification and the subsequent surge in construction activity.
Limiting this analysis to IPOs before 1998 eliminates the dominance in technology-
related companies. Panel B documents considerable differences in issuing activity when
characterizing the sample according to the calendar year of going public. In line with
low IPO activity in other Continental European countries, there is also a considerably
low level in issuing activity during the early 1990s in Germany. Apart from the reasons
addressed earlier, the reversal o f fortunes in the German IPO market after 1994 can also
be linked to the success of some large offerings from companies such as Adidas AG, a
sportswear company, and in particular the phenomenal long-run performance o f SAP
AG, an enterprise software company that recorded, and MLP AG, a financial services
company, two IPOs in 1988.
56 For a complete discussion of BHRs versus Cumulative Average Returns (CARs), see e.g., Fama (1998), Barber and Lyon (1997), Brown and Warner (1980), Kothari and Warner (1997) and Loughran and Ritter (2000).
129

In Panel C, reports number of characteristics for our IPO sample. The average
IPOs is 44 years old before going public. IPOs retain 66 percent of their equity after
going public and are underpriced by 11.69 percent, on average. The IPOs have an
average market capitalization of DM437.5 million, consistent with the average IPO in
Continental Europe during this period. As we have excluded privatizations, the size of
Deutsche Telecom AG, a telecommunications company, does not influence the mean
picture. As seen in Panel C, the IPO has a strong effect on the capital structure: The
average debt-equity ratio declines from 1.429 pre-IPO to 0.779 post-IPO.
3 Market Response to Management Behaviour around the IPO year
3.1 Measuring Management Behaviour using Discretionary Current Accruals (DCA)
It is well known that there is high information asymmetry between issuers and
public investors during the IPO process (Rao (1993)). Investors draw heavily on the
financial statements published by issuers. For issuers, higher reported earnings lead to
higher offering prices and hence higher IPO proceeds. This high information asymmetry
provides issuers with both the incentive and the opportunity to window-dress their
company accounts, in order to present better-looking financial statements for the IPO
year. Furthermore, after the IPO, the firm also has an incentive to boost earnings at least
for some time. The well-known reasons include inside interest (managers or
entrepreneurs might want to sell part of personal holdings after the lock-up period) and
outside pressure from underwriters or regulatory aspects.57 Firms that wish to
manipulate their earnings can achieve this goal by various means. One o f the typical
57 Theo, Welch and Wong (1998) provide a full discussion on the incentives o f firms to boost their earnings before and after the IPO date.
130

ways to do so is to use accruals.58 Accruals are changes in non-cash working capital
before income taxes payable, less total depreciation expenses and can be decomposed
into current accruals and long-term accruals.59 Current accruals include short-term
assets and liabilities from the day-to-day operations o f the firm. Managers can
deliberately increase current accruals in various ways, including advancing recognition
of revenues with credit sales, delaying the recognition of expenses, decreasing bad-debt
expenses or decreasing inventory write-offs. Long-term accrual adjustment, which
involves long-term assets, is, if at all, harder to achieve.60 We base our measures of
managers’ opportunistic behaviour around the IPO date on their discretionary use o f
current accruals because managers have greater flexibility and control over current
accruals as those are less prone to changes in firm business conditions.
From the investors’ perspective, it is difficult to distinguish the accrual
adjustment that is aimed at boosting higher short-term share prices from that aimed at
reconciling the mismatch of economic realities between accrual accounting events and
timing of cash flows. Given the fact that some of the accrual adjustments are
appropriate and necessary for certain business conditions, it is even harder to infer how
much of the proportion of the accrual adjustment is discretionary. The justified use of
accruals, however, is not something that is totally independent from the firm’s business
activity. As pointed out in Kaplan (1985), changes in some working capital accounts
and, thereby, accruals depend on the business activity of the firm. All things being
equal, the accrual of a firm should be a relatively stable function of the firm’s economic
activities. Indeed, this is the spirit of the widely used accrual decomposing expectations
model of Jones (1991). As in Teoh, Welch and Wong (1998), we use a variation of
58 Under Generally Accepted Accounting Principles, GAAP, the firms using accrual accounting systems are allowed to make adjustments when reporting earnings.59 This definition is adopted from Jones (1991) who tests in the context of earnings management during import relief investigations by the United States International Trade Commission (ITC).60 See, for example, Guenther (1994) and Teoh, Welch and Wong (1998).
131

Jones’ model because the emphasis is to decompose current accruals into a non-
discretionary and discretionary part. This variation assumes that the current accruals,
other things being equal, are a function o f the amount of the firm’s business activities,
which are proxied by sales.61
The model specification is:
CAn l ASales it — = a ( ) + p (--------- —) + industry dummies + £ it (1)TA TA TA JJ
j . t-1 j , t-1 j j -1
where j is the IPO firm index ( /- I , ...,126). CA measures Current Accruals. TA is Total
Assets. ASales is the change in sales from Yeart-i to Yeart. Industry dummies are aimed
at capturing the different features of the Accrual-Sales relationship across different
industries.62
In this paper, Current Accruals (CA) are calculated as:
CA = Aaccounts receivables + Ainventory + Aother current assets
- [Aaccounts payable + Atax payable + Aother current liabilities] (2)
Given the current accruals of a firm i at year t, CAjjt, the firm’s discretionary
current accruals of that year is the difference between its actual current accruals and
expected current accruals:
CADCAit = ---- ^
TA,,.,
1 ^ A S a le s -A T R a h p —
TA TAi ,t- \( 3 )
where DCA is Discretionary Current Accruals, ATR is the change in Trade Receivables.
Trade receivables represent amounts on open account owed by customers for goods and
61 The derivation of the DCA and IS coefficients is illustrated in Appendix F, Table 63.62 We also experimented with year dummies, not reported, to capture any cyclical and seasonal effects. The result is similar to the one that is reported.
132
services sold in the ordinary course of the business. We subtract the increase in trade
receivables from changes in sales to allow for the possibility o f credit sales
manipulation by the issuer (for example, by allowing generous credit policies to obtain
high sales prices ahead of the offering), a and p are estimations of regression
coefficients from equation (1) using a pooled estimation sample.
Following Roosenboom, van der Goot and Mertens (2000), who study the
relationship between methods of earnings management and aftermarket performance for
a sample of 64 firms going public on the Amsterdam Exchanges between 1984 and
1994, we estimate model (1) using pooled time-series and cross-sectional data. Once
estimated, a and P can be used to estimate the discretionary current accruals.64
3.2 Time-Series Properties O f Discretionary Current Accruals (DCA)
In Table 24, we present evidence concerning the time-series and cross-sectional
characteristics o f Discretionary Current Accruals (DCA) for German IPOs. Panel A
displays the distribution of DCA by year relative to the IPO year for the sample as a
whole.
The results indicate a clear tendency towards earnings management by using
DCA around the IPO year. For example, the average percentage of DCA in Year -1
amounts to minus nine percent of total o f the previous years’ assets. The DCA rises to
positive seven percent during the year o f going public and remains positive during the
first fiscal year. The strongly positive and significant mean and median confirms that
63 This is similar to Teoh, Welch and Wong (1998) who also subtract the increase in Trade Receivables from changes in Sales to allow for the possibility of Credit Sales. Their results are robust to omitting this adjustment. Teoh, Wong and Rao (1998) discuss the robustness of this valuation method relative to other measures.64 By using the pooled data, we have 1,170 firm-year observations in our estimation sample. We did not exclude observations for the year that firms conducted the IPO, from the sample. We experimented without IPO year observations and find that the results do not change qualitatively.
133
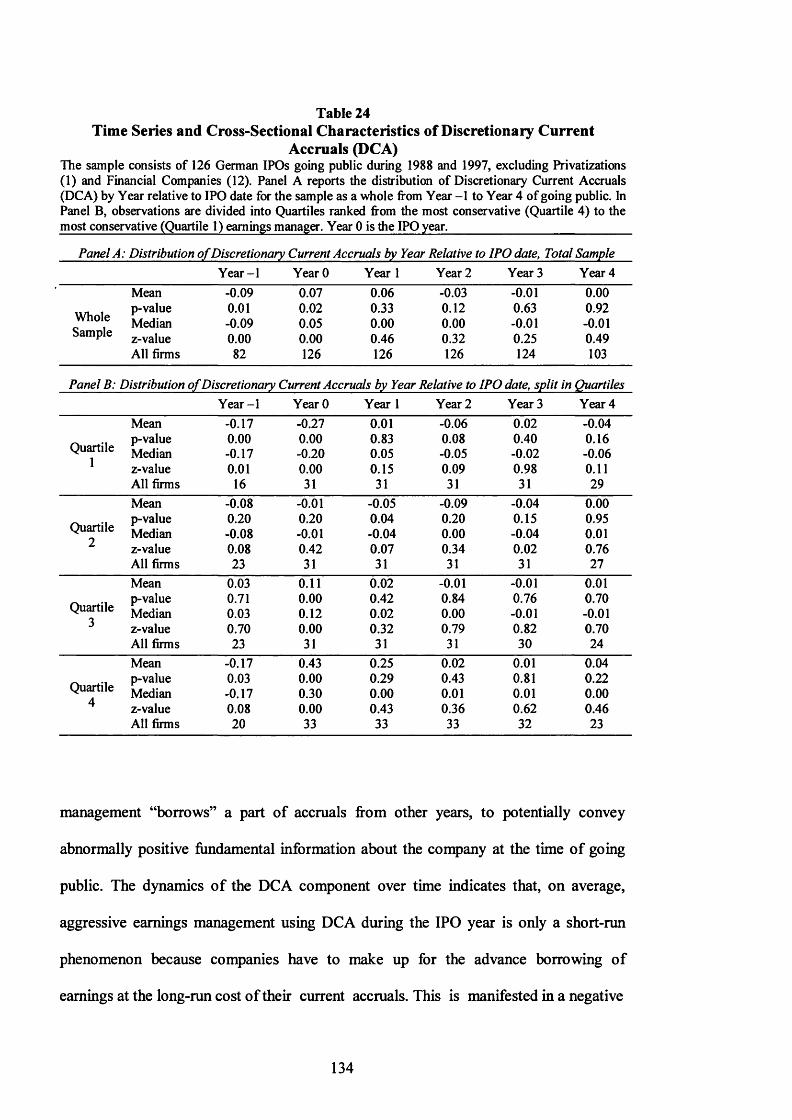
Table 24Time Series and Cross-Sectional Characteristics of Discretionary Current
Accruals (DCA)The sample consists of 126 German IPOs going public during 1988 and 1997, excluding Privatizations (1) and Financial Companies (12). Panel A reports the distribution of Discretionary Current Accruals (DCA) by Year relative to IPO date for the sample as a whole from Year -1 to Year 4 of going public. In Panel B, observations are divided into Quartiles ranked from the most conservative (Quartile 4) to the most conservative (Quartile 1) earnings manager. Year 0 is the IPO year.___________________________
Panel A: Distribution o f Discretionary Current Accruals by Year Relative to IPO date, Total SampleYear -1 YearO Year 1 Year 2 Year 3 Year 4
Mean -0.09 0.07 0.06 -0.03 -0.01 0.00
WholeSample
p-value 0.01 0.02 0.33 0.12 0.63 0.92Median -0.09 0.05 0.00 0.00 -0.01 -0.01z-value 0.00 0.00 0.46 0.32 0.25 0.49All firms 82 126 126 126 124 103
Panel B: Distribution o f Discretionary Current Accruals by Year Relative to IPO date, split in QuartilesYear-1 YearO Year 1 Year 2 Year 3 Year 4
Mean -0.17 -0.27 0.01 -0.06 0.02 -0.04
Quartile1
p-value 0.00 0.00 0.83 0.08 0.40 0.16Median -0.17 -0.20 0.05 -0.05 -0.02 -0.061 z-value 0.01 0.00 0.15 0.09 0.98 0.11All firms 16 31 31 31 31 29Mean -0.08 -0.01 -0.05 -0.09 -0.04 0.00
Quartilep-value 0.20 0.20 0.04 0.20 0.15 0.95Median -0.08 -0.01 -0.04 0.00 -0.04 0.012 z-value 0.08 0.42 0.07 0.34 0.02 0.76All firms 23 31 31 31 31 27Mean 0.03 0.11 0.02 -0.01 -0.01 0.01
Quartilep-value 0.71 0.00 0.42 0.84 0.76 0.70Median 0.03 0.12 0.02 0.00 -0.01 -0.01
3 z-value 0.70 0.00 0.32 0.79 0.82 0.70All firms 23 31 31 31 30 24Mean -0.17 0.43 0.25 0.02 0.01 0.04
QuartileA
p-value 0.03 0.00 0.29 0.43 0.81 0.22Median -0.17 0.30 0.00 0.01 0.01 0.004 z-value 0.08 0.00 0.43 0.36 0.62 0.46All firms 20 33 33 33 32 23
management “borrows” a part of accruals from other years, to potentially convey
abnormally positive fundamental information about the company at the time of going
public. The dynamics o f the DCA component over time indicates that, on average,
aggressive earnings management using DCA during the IPO year is only a short-run
phenomenon because companies have to make up for the advance borrowing of
earnings at the long-run cost of their current accruals. This is manifested in a negative
134
DCA from Year 2 of going public to the end of the measurement period. The results in
Panel A are remarkably similar to the findings reported in Theo, Welch and Wong
(1998) and Roosenboom, van der Goot and Mertens (2000), who find the same patterns
for the US and Dutch IPO markets.
In Panel B, we rank the companies into quartiles depending on the
aggressiveness of using DCA during the IPO year. Here, we can distinguish between
companies that manage their earnings most conservatively around the IPO year,
summarized in Quartile 1 (Ql), and companies that manage their earnings most
aggressively, summarized in Quartile 4 (Q4). Panel B verifies our earlier results that
show a wide variation in the opportunistic behaviour towards earnings management via
DCA during the IPO year. For example, while the average DCA for the most
conservative companies (Ql) deviates negative 27 percent from its mean during the IPO
year, the deviation for the most aggressive group (Q4) is positive 43 percent. Panel B
also explores the dynamics of DCA in more detail. While the most conservative
companies manage their earnings more aggressively following the IPO, the most
aggressive earnings managers have to life up to reality and apply a much more
conservative use of DCA in later years.
3.3 Discretionary Current Accruals (DCA) and IPO Stock Returns
In this section, we extend the analysis to include the relation between Discretionary
Current Accruals (DCA) and the short- and long-run stock price performance o f
German IPOs. Because our focus is on the dynamics o f aftermarket returns, we measure
aftermarket performance starting after three, nine and twelve months following the first
day of trading. This procedure marks a crucial difference in comparison to the existing
135

Table 25IPO performance categorized by Issue Year DCA Quartiles
The sample consists of 126 German IPOs between 1988 and 1997. Returns are calculated as equally-weighted buy-and-hold returns. One month is defined as a consecutive 21-day trading interval using the local trading calendar. Returns are reported separately as raw returns and returns adjusted by the broad-based value-weighted FAZ Index. The raw and market-adjusted buy-and-hold return is calculated after three, nine and twelve months following the IPO. Difference (Diff.) refers to the percentage change between the most aggressive earnings manager (Q4) and the most conservative earnings manager (Ql) in terms of DCA. Associated test statistics for Diff. refer to mean difference tests.
Year 1 (one year)Panel A: Measurement period starts three months after the IPO date
Year 2 (two years) Year 3 (three years)Return All Ql Q2 Q3 Q4 Diff. All Ql Q2 Q3 Q4 Diff. All Ql Q2 Q3 Q4 Diff.
Raw returns p-valueAdjusted returns p-value
0.42690.20010.35610.2835
0.12450.10190.05190.4618
-0.0318 0.3671 0.6330 0.0177 -0.0765 0.2727 0.1959 0.0656
1.19780.34821.12650.3765
1.07330.41241.07460.4110
1.0428 0.3541 -0.0632 0.4786 3.2587 2.9047 0.2403 0.1003 0.5032 0.0209 0.3408 0.4077 0.8121 0.1409 -0.2812 0.1932 3.0510 2.9101 0.3586 0.4736 0.0047 0.3072 0.3708 0.4055
0.18360.0815-0.17710.0959
0.4358 -0.1457 0.2963 0.1503 -0.2855 0.0656 0.1658 0.0497 0.6078 0.4456 0.1082 -0.4654 -0.1976 -0.1550 -0.2632 0.6407 0.0002 0.1831 0.5995 0.4851
Year 1 (one year)Panel B: Measurement period starts nine months after the IPO date
Year 2 (two years) Year 3 (three years)Return All Ql Q2 Q3 Q4 Diff. All Ql Q2 Q3 Q4 Diff. All Ql Q2 Q3 Q4 Diff.
Raw returns p-valueAdjusted returns p-value
0.05270.2372-0.05740.2032
0.11750.0591-0.03160.5930
-0.0305 0.1379 0.6241 0.0491 -0.1264 0.0127 0.0502 0.8332
-0.00980.9427-0.08280.5645
-0.12720.4030-0.05110.7463
0.1047 0.2991 -0.1470 0.2509 0.0213 -0.2777 0.1532 0.0893 0.0913 0.0651 0.9002 0.2515 -0.1465 0.0523 -0.4016-0.0846-0.1518-0.2041 0.0454 0.7604 0.0001 0.5076 0.3810 0.4009
-0.1010 0.1287 -0.1748 -0.0378 -0.3070 -0.4357 0.0280 0.2745 0.0310 0.6625 0.0000 0.0014 -0.4579 -0.2040 -0.5658 -0.5237 -0.5332 -0.3292 0.0000 0.1808 0.0000 0.0000 0.0000 0.0550
Year 1 (one year)Panel C: Measurement period starts twelve months after the IPO date
Year 2 (two years) Year 3 (three years)Return All Ql Q2 Q3 04 Diff. All Ql Q2 Q3 Q4 Diff. All Ql Q2 Q3 Q4 Diff.
Raw returns p-valueAdjusted returns p-value
0.05840.1389-0.07130.0490
0.10250.1338-0.02090.7462
-0.0014 0.1566 0.9820 0.0391 -0.1361 -0.0083 0.0130 0.8892
-0.01920.8533-0.11710.2458
-0.12170.3310-0.09620.4242
0.0550 0.2672 -0.1329 0.1458 -0.0532-0.3204 0.3743 0.1253 0.1314 0.1854 0.6289 0.1125 -0.2167 0.0311 -0.4110-0.2317-0.2528-0.2839 0.0004 0,8539 0.0000 0.0264 0.0284 0.1565
-0.1130 0.0801 -0.1641 -0.0777 -0.2797-0.3597 0.0192 0.5350 0.0319 0.4018 0.0006 0.0158 -0.4732 -0.2755 -0.5859 -0.5094 -0.5192 -0.2437 0.0000 0.0954 0.0000 0.0000 0.0000 0.1731
136

US literature, in which the evaluation of investment performance starts three to six
months after the publication of the first annual report.65
In Table 25, we report the adjusted and unadjusted buy-and-hold performance of
German IPOs, categorized by DCA quartiles and calculated across various measurement
periods and different starting dates. The results do confirm evidence that German IPOs
issued during the sample period have underperformed, on average, in the long-run.
When measured over three years, this underperformance is statistically and
economically significant. For example, when viewing our return window after nine
months o f trading, the sample o f 126 German IPOs underperformed the FAZ
Index by 45.79 percent. When looking at shorter measurement horizons, however, the
underperformance falls substantially to 14.54 percent over two years and 5.74 percent
when measured over one year. Table 25 also shows that the magnitude of IPO
aftermarket performance is not only sensitive to the length o f the measurement period,
but also to its starting date. Results in Panel A, B, and C indicate that the closer the
starting point of the measurement period to the IPO date, the more favourable the long-
run performance picture. The discrepancy is particularly large when calculating returns
over short measurement horizons. For the sample as a whole, the two-year market-
adjusted performance is positive 81.21 percent when measured after three months of
trading and negative 21.67 percent when the two-year measurement begins after twelve
months of trading.
Apart from the results obtained for the sample as whole, we also document
aftermarket performance when categorizing the sample by DCA Quartile. This allows
us to take a closer look at the cross-section o f earnings management behaviour and
market response. When return measurement starts after nine or twelve months following
65 Starting performance measurement after three to six months following the publication of the First Annual Report roughly corresponds to our benchmark starting date of nine months.
137

the IPO, companies that are less opportunistic towards earnings management during the
IPO year outperform their counterparts over three years. When measuring three year
returns starting after nine and twelve month o f trading, for example, the market-adjusted
return difference between the most conservative (Q l) and most aggressive (Q4) groups
is 24.37 percent and 32.92 percent, respectively. When applying these starting times,
this difference also generally applies when looking at shorter return horizons.
Companies that manage earnings more conservatively during the IPO year consistently
outperform their more aggressive counterparts. The longer the measurement horizon,
the larger and more significant is this difference. When measuring from the benchmark
starting date and afterwards, the results clearly indicate that the market identifies
earnings management behaviour.
However, when measuring performance after month three following the IPO, the
one-year and two-year return picture changes dramatically. The results are displayed in
Panel A of Table 25. The most aggressive managers substantially outperform their
conservative counterparts. The difference o f the market-adjusted return between the
most aggressive (Q4) and the most conservative group (Ql) amounts to 107.46 percent
over one year and 291.01 percent over two years. One reason for this discrepancy is that
the more opportunistic managers in the IPO year tend to be the more aggressive
managers in the year following the IPO. When measuring returns over three-years
starting after three month of trading, however, this “wrong” relationship is corrected.66
The result is plotted in Figure 7.
66 The company with the largest price increase was EM.TV AG, a Media company, which recorded a DCA coefficient of 0.8962 and a three-year market-adjusted buy-and-hold return of positive 817.78 percent when measured after three months following the IPO, negative 63.56 percent when measured after nine month and negative 77.37 percent after twelve months after the IPO.
138
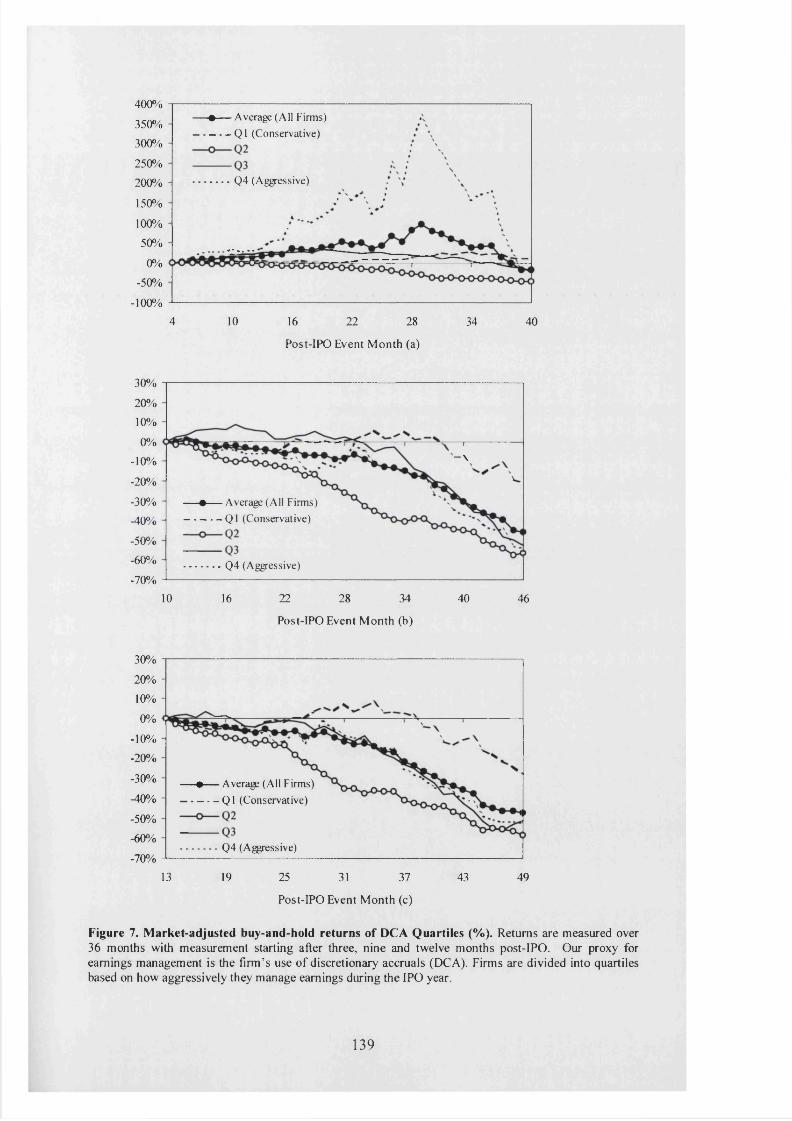
400%♦ Average (All Firms) Ql (Conservative)
350%300%
250%200% Q4 (Aggressive)
150%
100%50%
0%-50%
- 100%
4 10 16 22 28 34 40
Post-IPO Event Month (a)
30%
20%10%0%
- 10% - \
-20%
-30%-40%
♦ Average (All Firms) Ql (Conservative)
-50%-60% Q4 (Aggressive)-70%
1610 22 28 34 40 46
Post-IPO Event Month (b)
30%
20%10%o%
- 10%
-20%
-30% -•— Average (All Firms) Q1 (Conservative)-40%
-50%-60%
Q4 (Aggressive)-70%
13 19 25 31 37 43 49
Post-IPO Event Month (c)
Figure 7. Market-adjusted buy-and-hold returns of DCA Quartiles (%). Returns are measured over 36 months with measurement starting after three, nine and twelve months post-IPO. Our proxy for earnings management is the firm’s use of discretionary accruals (DCA). Firms are divided into quartiles based on how aggressively they manage earnings during the IPO year.
139
4. Market Response to Income Reporting Strategies
4.1 Measuring Management Behaviour with Income Smoothing (IS)
In contrast to firms using accruals to boost earnings in the short-term, firms
might want to smooth their income to signal the firm’s long-term strategy. As in Chaney
and Lewis (1998), smoothing income is a long-term strategy and, in doing so, managers
communicate the firm’s “permanent earnings”, a strategy which enhances investors’
current and future perception of a firm. It is believed that firms with good future
prospects will be able to smooth their income more effectively than firms that use
accruals aggressively for window dressing, as discretionary accruals must reverse in the
future. Thus, whether income is smoothed can be viewed as a management strategy that
conveys fundamental information of a firm.
In this paper, the measure o f income smoothing is the same as in Roosenboom,
van Goot and Mertens (2000). The income smoothing (IS) coefficient is defined as the
ratio of the variance in operating cash flow changes to variance of operating income
changes:
VaKACF^Var(AOI' )
where ACF, is defined as changes in operating cash flow for firm i, and AO/, is defined
as the changes in operating income for firm i.
The income smoothing (IS) coefficient defined in (4) compares the relative
variability o f changes in operating cash flow with the relative variability of changes in
operating income. Since the operating cash flow is essentially not manageable, a
successful income smoothing strategy will lead to a smaller variability in the changes of
140
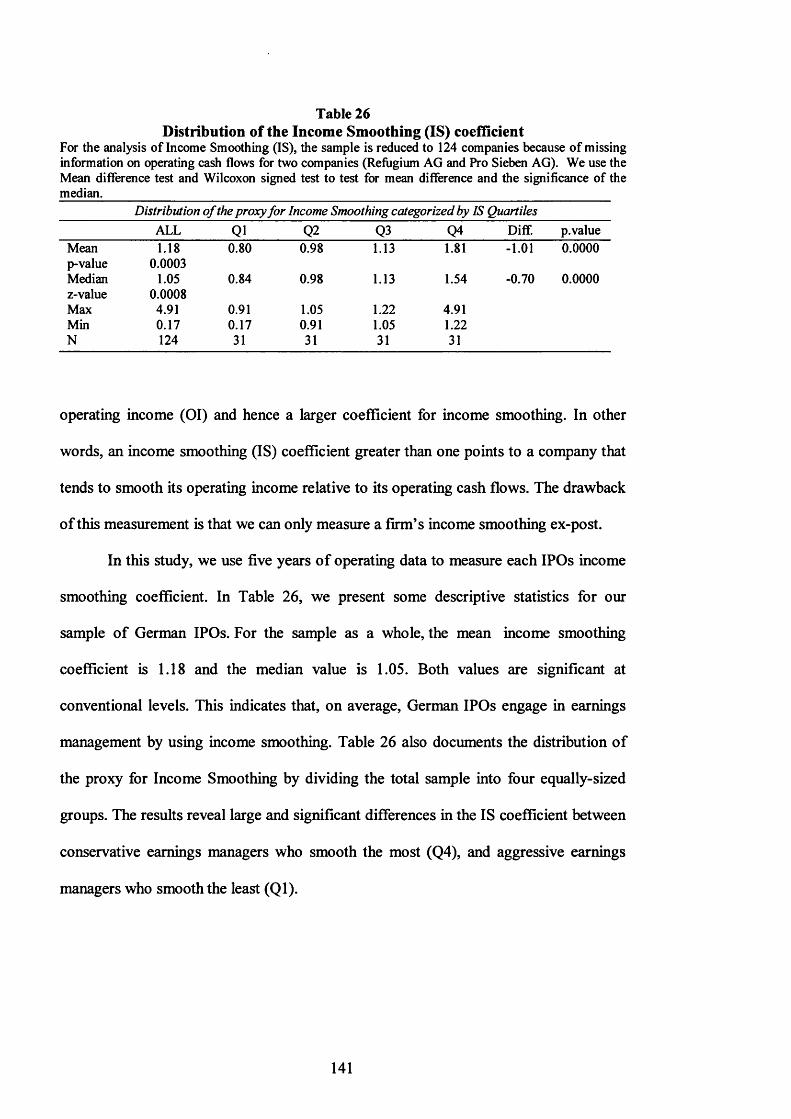
Table 26Distribution of the Income Smoothing (IS) coefficient
For the analysis of Income Smoothing (IS), the sample is reduced to 124 companies because of missing information on operating cash flows for two companies (Refiigium AG and Pro Sieben AG). We use the Mean difference test and Wilcoxon signed test to test for mean difference and the significance of the median.
Distribution o f the proxy for Income Smoothing categorized by IS QuartilesALL Ql Q2 Q3 Q4 Diff. p.value
Mean 1.18 0.80 0.98 1.13 1.81 -1.01 0.0000p-value 0.0003Median 1.05 0.84 0.98 1.13 1.54 -0.70 0.0000z-value 0.0008Max 4.91 0.91 1.05 1.22 4.91Min 0.17 0.17 0.91 1.05 1.22N 124 31 31 31 31
operating income (01) and hence a larger coefficient for income smoothing. In other
words, an income smoothing (IS) coefficient greater than one points to a company that
tends to smooth its operating income relative to its operating cash flows. The drawback
of this measurement is that we can only measure a firm’s income smoothing ex-post.
In this study, we use five years o f operating data to measure each IPOs income
smoothing coefficient. In Table 26, we present some descriptive statistics for our
sample of German IPOs. For the sample as a whole, the mean income smoothing
coefficient is 1.18 and the median value is 1.05. Both values are significant at
conventional levels. This indicates that, on average, German IPOs engage in earnings
management by using income smoothing. Table 26 also documents the distribution of
the proxy for Income Smoothing by dividing the total sample into four equally-sized
groups. The results reveal large and significant differences in the IS coefficient between
conservative earnings managers who smooth the most (Q4), and aggressive earnings
managers who smooth the least (Ql).
141

4.2. Income Smoothing (IS) and IPO Stock Returns
In Table 27, we present the main findings. The results are reported both for the
sample as a whole and for the individual Quartiles. Similarly, we measure performance
with a benchmark starting date of nine months after the IPO. We also deviate from this
benchmark starting date in order to study the dynamics o f the market response. The
result for measuring starting time of three-month, nine-month and twelve-month
performance dynamics are presented in Panel A, B and C of Table 27.
The results underline some earlier observations that the degree of aggressiveness
in earnings management is related to the stock price performance. Over the long-run,
companies with a higher IS coefficient tend to outperform their most aggressive
counterpart regardless o f the starting date of the measurement period. Based on market-
adjusted three-year stock returns, the difference is 57.47 percent, 30.75 percent and
28.01 percent when measured from month three, nine and twelve following the IPO,
respectively. The difference is consistently large and significant when measuring
returns over two or three years after the start of the measurement periods. When
measured over a one-year horizon, however, the difference in performance between
companies that apply income smoothing most and those that do least, is not significant.
This finding confirms our earlier result that the market is not able to respond to earnings
management choices effectively in the short-run. However, the result here is less
significant than the one when we used DCA. In Figure 8, the dynamics of aftermarket
performance are shown graphically. Here, a similar picture to the one observed in
Figure 7 emerges. The most conservative companies (Q4) display a significantly better
performance than their more aggressive counterparts over the long-run. In the short-run,
however, the differences are less clear. For example, in Graph (a) the second most
aggressive group (Q2) outperforms others up until the medium-term.
142
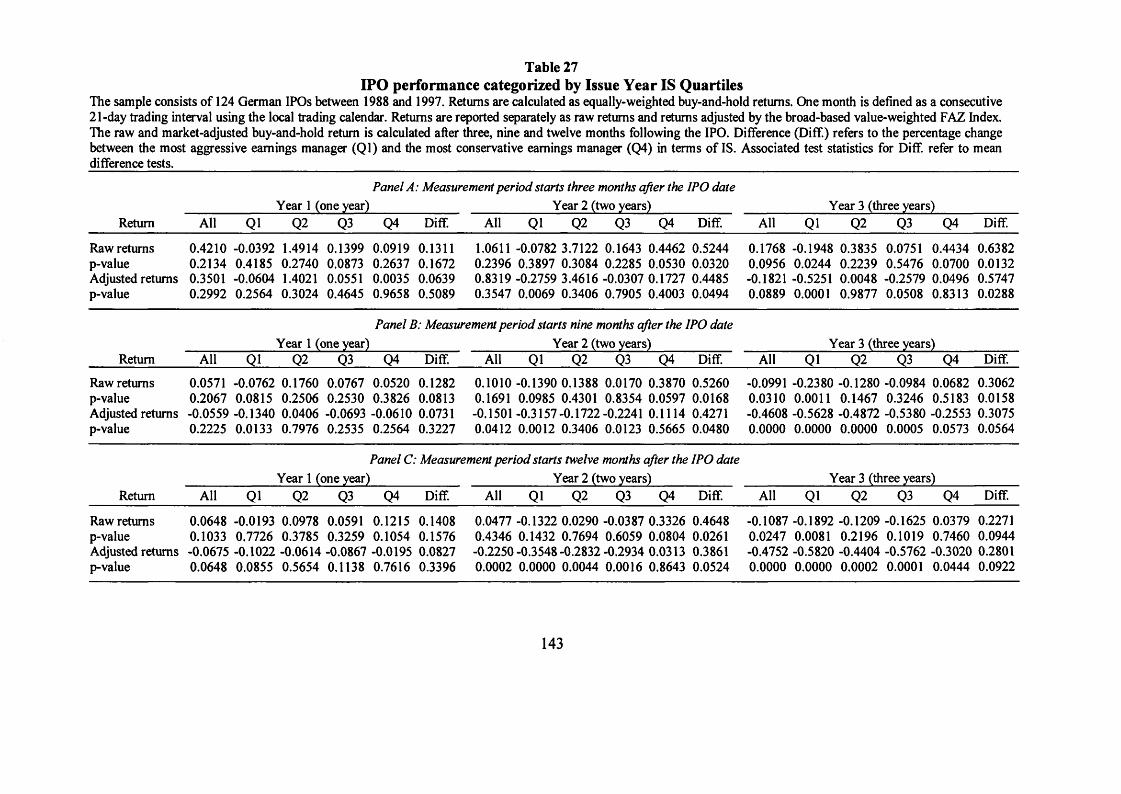
Table 27IPO performance categorized by Issue Year IS Quartiles
The sample consists of 124 German IPOs between 1988 and 1997. Returns are calculated as equally-weighted buy-and-hold returns. One month is defined as a consecutive 21-day trading interval using the local trading calendar. Returns are reported separately as raw returns and returns adjusted by the broad-based value-weighted FAZ Index. The raw and market-adjusted buy-and-hold return is calculated after three, nine and twelve months following the IPO. Difference (Diff.) refers to the percentage change between the most aggressive earnings manager (Ql) and the most conservative earnings manager (Q4) in terms of IS. Associated test statistics for Diff. refer to mean difference tests.
Year 1 (one year)Panel A: Measurement period starts three months after the IPO date
Year 2 (two years) Year 3 (three years)Return All Ql Q2 Q3 Q4 Diff. All Ql Q2 Q3 Q4 Diff. All Ql Q2 Q3 Q4 Diff.
Raw returns p-valueAdjusted returns p-value
0.42100.21340.35010.2992
-0.03920.4185-0.06040.2564
1.49140.27401.40210.3024
0.13990.08730.05510.4645
0.09190.26370.00350.9658
0.13110.16720.06390.5089
1.0611 -0.0782 3.7122 0.1643 0.4462 0.2396 0.3897 0.3084 0.2285 0.0530 0.8319 -0.2759 3.4616 -0.0307 0.1727 0.3547 0.0069 0.3406 0.7905 0.4003
0.52440.03200.44850.0494
0.17680.0956-0.18210.0889
-0.19480.0244-0.52510.0001
0.3835 0.0751 0.2239 0.5476 0.0048 -0.2579 0.9877 0.0508
0.44340.07000.04960.8313
0.63820.01320.57470.0288
Year 1 (one year)Panel B: Measurement period starts nine months after the IPO date
Year 2 (two years) Year 3 (three years)Return All Ql Q2 Q3 Q4 Diff. All Ql Q2 Q3 Q4 Diff. All Ql Q2 Q3 Q4 Diff.
Raw returns p-valueAdjusted returns p-value
0.05710.2067-0.05590.2225
-0.0762 0.1760 0.0815 0.2506 -0.1340 0.0406 0.0133 0.7976
0.07670.2530-0.06930.2535
0.0520 0.1282 0.3826 0.0813 -0.0610 0.0731 0.2564 0.3227
0.1010 -0.1390 0.1388 0.0170 0.3870 0.1691 0.0985 0.4301 0.8354 0.0597 -0.1501 -0.3157-0.1722-0.2241 0.1114 0.0412 0.0012 0.3406 0.0123 0.5665
0.52600.01680.42710.0480
-0.09910.0310-0.46080.0000
-0.23800.0011-0.56280.0000
-0.1280 -0.0984 0.1467 0.3246 -0.4872 -0.5380 0.0000 0.0005
0.06820.5183-0.25530.0573
0.30620.01580.30750.0564
Year 1 (one year)Panel C: Measurement period starts twelve months after the IPO date
Year 2 (two years) Year 3 (three years)Return All Ql Q2 Q3 04 Diff. All Ql Q2 Q3 Q4 Diff. All Ql Q2 Q3 Q4 Diff.
Raw returns p-valueAdjusted returns p-value
0.06480.1033-0.06750.0648
-0.01930.7726-0.10220.0855
0.09780.3785-0.06140.5654
0.05910.3259-0.08670.1138
0.12150.1054-0.01950.7616
0.14080.15760.08270.3396
0.0477 -0.1322 0.0290 -0.0387 0.3326 0.4346 0.1432 0.7694 0.6059 0.0804 -0.2250 -0.3548 -0.2832 -0.2934 0.0313 0.0002 0.0000 0.0044 0.0016 0.8643
0.46480.02610.38610.0524
-0.10870.0247-0.47520.0000
-0.18920.0081-0.58200.0000
-0.1209 -0.1625 0.2196 0.1019 -0.4404 -0.5762 0.0002 0.0001
0.0379 0.2271 0.7460 0.0944 -0.3020 0.2801 0.0444 0.0922
143

500%-•— Average (All Firms) Ql (Aggressive)400%
300%Q4 (Conservative)
200%
100%
0%
- 100%
4 10 16 22 28 34 40
Post-EPO Event Month (a)
30%20%10%0%
- 10%
-20%
-30%-40%-50%
-•— Average (All Firms) Ql (Aggressive)
-60%-70%
Q4 (Conservative)
4622 28 34 4010 16
Post-IPO Event Month (b)
30%20%10%0%
- 10%
-20%
-30%-40%
-• Average (All Firms) Ql (Aggressive)
-50%-60%-70%
Q4 (Conservative)
37 43 4913 19 25 31
Post-IPO Event Month (c)
Figure 8. Market-adjusted buy-and-hold returns of IS Quartiles (%). Returns are measured over 36 months with measurement starting after three, nine and twelve months post-IPO. Our proxy for earnings management is the firm’s use o f income smoothing (IS). Firms are divided into Quartiles based on how aggressively they manage earnings during the IPO year.
144
\

Figure 8 underlines the importance of the month of seasoning when measuring
aftermarket returns. Results reported from a date closer to the IPO make the distribution
of returns more susceptible to the effect of other factors, such as extreme returns. It
should be noted that the magnitude o f long-run returns in the most conservative group
of income smoothers (Q4) is clearly different from the rest of the sample companies
which, in turn, do not display a large divergence in performance among them.
5 Comparative Analysis of Methods of Earnings Management
Thus far, we have investigated two widely cited forms of earnings management
and the market response. While we have shown that the use of DCA is a predominantly
short-term tool for opportunistic earnings managers, the nature of IS lies clearly in its
ability to provide a framework for strategic long-run earnings management. In this
section, we focus on the relation between these two forms, which thus far has been left
unexplored in the literature. Based on our earlier results, we hypothesize a link between
DCA and IS and design our research methodology accordingly.
In Panel A of Table 28, we replicate the distribution of the DCA coefficients (in
Quartiles) from Table 24 and calculate the IS coefficient of each DCA group. There is a
tendency that companies, which manage their earnings least opportunistically in terms
of DCA, also have the highest IS coefficient. For example, the most conservative group
in terms o f DCA recording a DCA of -0.27 also has the highest IS coefficient of 1.30.
In Panel B, we replicate the distribution o f our IS coefficient (in Quartiles) from Table
26 and calculate the DCA of each IS group. Here, we find a similar tendency to the one
reported above: companies with a higher income smoothing coefficient, that are also
67 This notion is similar to Brav and Gompers (1997) who find that the widely acclaimed underperformance reported for US IPOs in Ritter (1991) is due to nonventure-backed IPOs, and that venture-backed IPOs, which make up 21.52 percent of the sample, do not significantly underperform. Schuster (2002) finds that New Economy stocks, that account for around 28 percent of the sample, drive the positive aftermarket performance of a sample of 973 European IPOs issued between 1988 and 1998.
145

Table 28Discretionary Current Accruals (DCA) versus Income Smoothing (IS)
In this table, we compare the two proxies for earnings management: Discretionary Current Accruals (DCA) and Income Smoothing (IS). We set the number of companies to 124, the sample size used when we measured the IS coefficient. In Panel A, companies are grouped by their DCA quartile. In Panel B, companies are grouped by their IS quartile. Diff. refers to the mean difference of Q1 and Q4. We use the Mean difference test and Wilcoxon signed test to test for mean difference and the significance of the median difference.
Proxy
Panel A: DCA and IS Grouped by DCA in
All Ql 02 03
the IPO year
04 Diff. p-value
DCA Mean 0.07 -0.27 -0.01 0.11 0.43 -0.70 0.0000Median 0.05 -0.20 -0.01 0.12 0.30 -0.50 0.0000
IS Mean 1.18 1.30 1.16 1.11 1.15 0.15 0.3854Median 1.05 1.11 1.06 1.06 1.02 0.03 0.1440N 124 31 31 31 31
Panel B: DCA and IS Grouped by IS
Proxy All Ql Q2 Q3 Q4 Diff. p-value
IS Mean 1.18 0.80 0.98 1.13 1.81 -1.01 0.0000Median 1.05 0.84 0.98 1.13 1.54 -0.70 0.0000
DCA Mean 0.07 0.11 0.03 0.08 0.05 0.06 0.3434Median 0.05 0.12 0.05 0.04 0.02 0.10 0.2503N 124 31 31 31 31
better stock market performers over the long-term, have a tendency to manage their
earnings less opportunistically during the year o f going public. In contrast, companies
which have a low tendency to smooth their income are also likely to manage their
earnings more aggressively. For example, the most aggressive group in terms of IS (Ql)
recording a median IS coefficient of 0.84, has the highest median DCA of 0.12. The
results suggest that the two forms of earnings management are clearly not mutually
exclusive. The column headed Diff. shows the difference in the coefficient between Ql
and Q4. The last column in Table 28 reports the p-value of the mean difference test of
coefficients between Ql and Q4. While there is a tendency for companies to apply
various techniques for earnings management, either equally aggressively or
conservatively, the lack o f statistical significance for both the mean and median might
suggest that the two strategies are not deterministic.
146

Table 29IPO performance of companies in the DCA/IS intersection
Table VII presents the adjusted and unadjusted buy-and-hold performance of the Best DCA/IS (Panel A) and Worst DCA/IS intersection (Panel B). The sample consists of 124 German IPOs going public between 1988 and 1997. Aftermarket returns are calculated as equally-weighted returns whereas one month is defined as a consecutive 21-day trading period using the local trading calendar. Adjusted and Unadjusted mean and median returns are calculated from month three, nine and twelve following the IPO date. Returns are adjusted using the broad-based value-weighted FAZ Index as the benchmark.________
Panel A : Best DCA/IS intersectionReturns 3 months after IPO 9 months after IPO 12 Months after IPO
Raw returns 1.2981 0.4119 0.3760Median 0.6616 0.3830 0.2780Adjusted returns 0.8577 0.1900 0.1785Median 0.2456 0.1856 0.0243Number of IPOs 10 10 10
Panel B: Worst DCA/IS intersectionReturns 3 months after IPO 9 months after IPO 12 Months after IPO
Raw returns -0.2241 -0.2641 -0.2013Median -0.3524 -0.3797 -0.2972Adjusted returns -0.4995 -0.3965 -0.4398Median -0.3515 -0.4413 -0.3670Number of IPOs 9 9 9
In Table 29, we analyse the impact of the interaction of these two forms of earnings
management on the dynamics of aftermarket returns. In Panel A, we present evidence
concerning the long-run performance of companies, which fall into the intersection o f
companies with the most conservative form o f earnings management in terms of DCA
(Ql) and IS (Q4). Panel B contains the result of those companies that fall into the
intersection that applies the most aggressive behaviour towards earnings management in
terms o f DCA (Q4) and IS (Ql). This approach allows us to study whether companies
that use both forms o f earnings management most conservatively (Best DCA/Best IS
Quartile) do in fact experience performance differences and vice versa.
Overall, the results do confirm our earlier observation that the magnitude o f
long-run performance is sensitive to the start o f the measurement period. There is a
strong indication that mean and median returns of companies falling into the
intersection o f Best DCA/Best IS outperform other companies, that do not fall into this
147

intersection, by a considerable margin. This result extends to all starting dates of our
measurement period. For example, when measuring performance following the ninth
month o f aftermarket trading, the ten companies which fell into the Best DCA/Best IS
intersection returned a market-adjusted 19.00 percent, while in Table 25, the best DCA
group (Q l) only enjoyed a negative 20.40 percent three-year market-adjusted return.
Similarly, in Table 27, the best IS Group (Q4) recorded a negative 25.53 percent three-
year market-adjusted return when measured after nine months of trading.
The results are less robust for the intersection of Worst DCA/Worst IS, which is
generally in line with the returns of the worst DCA and worst IS Quartiles reported in
Tables 25 and 27.68 This is not surprising as 75 percent of the sample in both earnings
management regimes produced similar long-run underperformance. It must be noted
that, due to the small sample size, reported results must be treated with caution.
6 Aftermarket Return Dynamics and Earnings Management
As documented throughout the paper, the dynamics of aftermarket performance
are sensitive to the start of the period from which returns are measured. Starting the
measurement period at a date closer to the date of going public has a dramatically
different effect on the return dynamics than when measuring returns from a date further
away from the IPO date. In this section, we combine the empirical methodology of
Ritter (1991) with the framework for analysing DCA and IS, in order to disentangle the
observations. We include the two major explanatory variables DCA and IS, which are
proxies for the fundamentals of IPO firms, into the regression model described in Ritter
(1991) where most of the explanatory variables have no accounting features.
68 Three out of the nine companies in the Worst DCA/Worst IS intersection are companies associated with strong retail brands: Jil Sander AG, a fashion company; Leica Camera AG, a camera manufacturer; and Marbert AG, a cosmetics company.
148
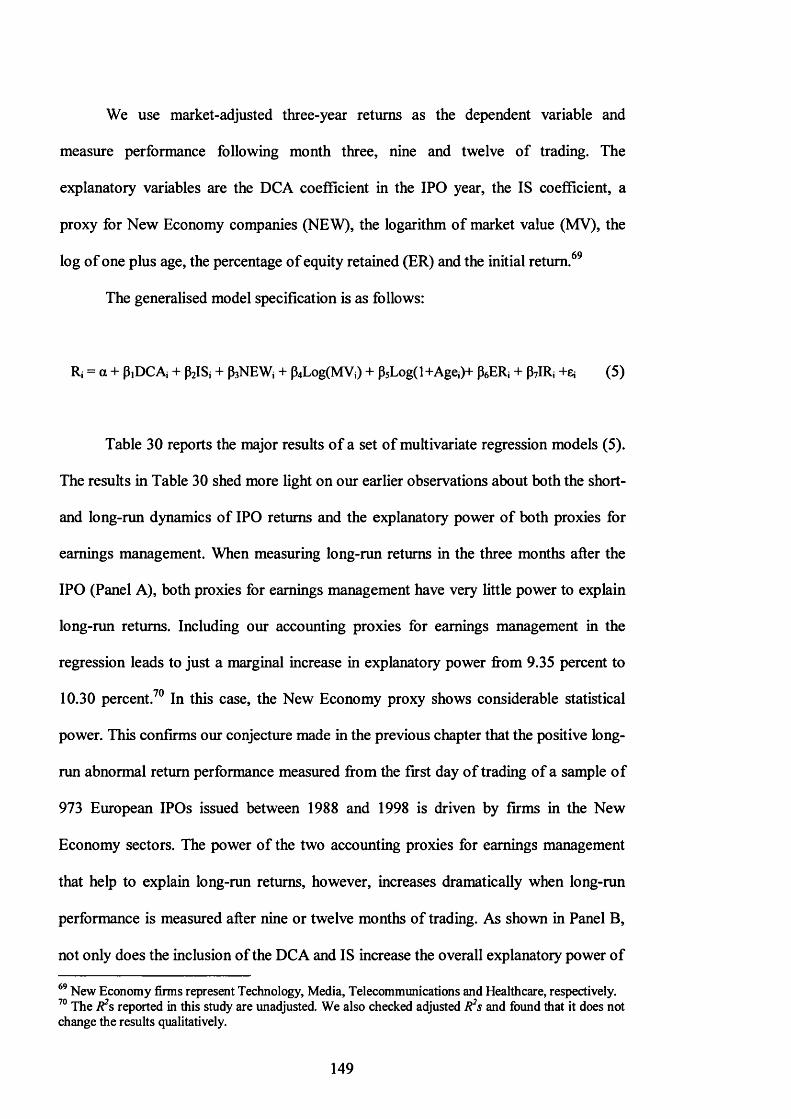
We use market-adjusted three-year returns as the dependent variable and
measure performance following month three, nine and twelve of trading. The
explanatory variables are the DCA coefficient in the IPO year, the IS coefficient, a
proxy for New Economy companies (NEW), the logarithm of market value (MV), the
log of one plus age, the percentage of equity retained (ER) and the initial return.69
The generalised model specification is as follows:
Rj = a + PiDCAj + |ySi + fbNEWj + P4Log(MVj) + P5Log(l+Agej)+ P6ERj + P?IRj +£i (5)
Table 30 reports the major results o f a set of multivariate regression models (5).
The results in Table 30 shed more light on our earlier observations about both the short-
and long-run dynamics of IPO returns and the explanatory power of both proxies for
earnings management. When measuring long-run returns in the three months after the
IPO (Panel A), both proxies for earnings management have very little power to explain
long-run returns. Including our accounting proxies for earnings management in the
regression leads to just a marginal increase in explanatory power from 9.35 percent to
10.30 percent.70 In this case, the New Economy proxy shows considerable statistical
power. This confirms our conjecture made in the previous chapter that the positive long-
run abnormal return performance measured from the first day o f trading of a sample o f
973 European IPOs issued between 1988 and 1998 is driven by firms in the New
Economy sectors. The power of the two accounting proxies for earnings management
that help to explain long-run returns, however, increases dramatically when long-run
performance is measured after nine or twelve months of trading. As shown in Panel B,
not only does the inclusion of the DCA and IS increase the overall explanatory power of
69 New Economy firms represent Technology, Media, Telecommunications and Healthcare, respectively.70 The R2s reported in this study are unadjusted. We also checked adjusted R2s and found that it does not change the results qualitatively.
149
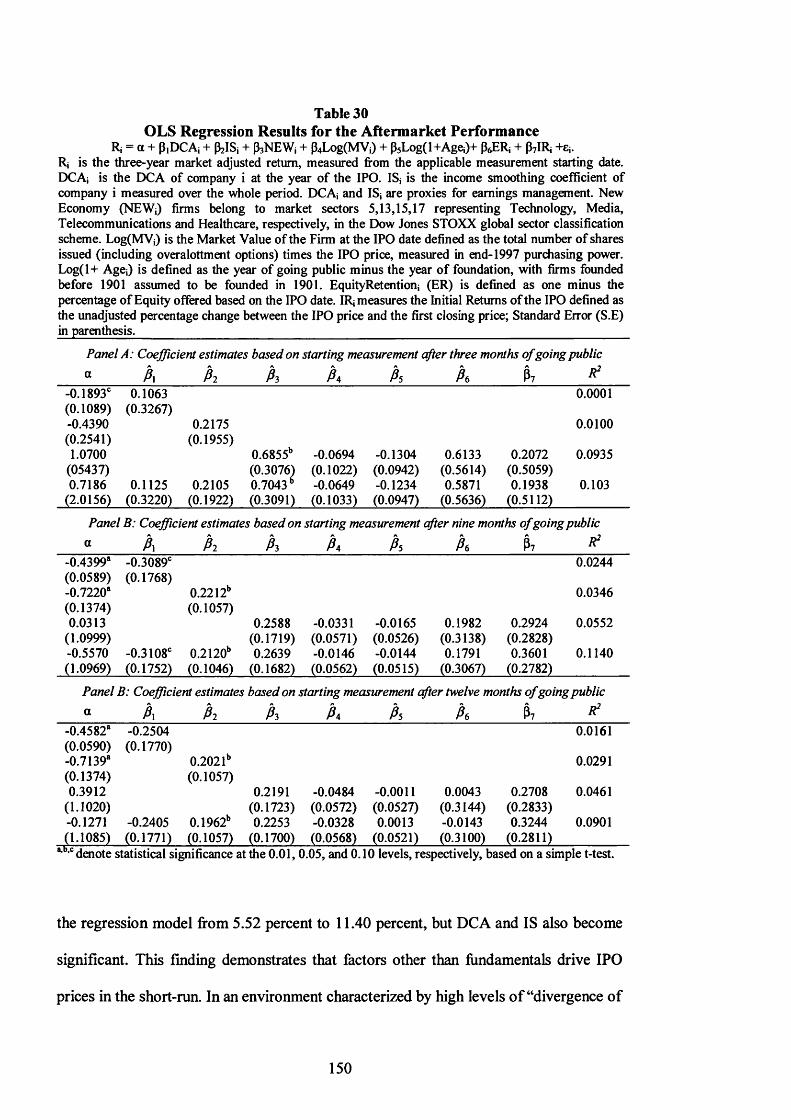
Table 30OLS Regression Results for the Aftermarket Performance
Rj = a + PiDCAj + ffelSj + p3NEWj + p4Log(MVj) + p5Log(l+A gei)+ P6ERi + p7IR, +£j.Ri is the three-year market adjusted return, measured from the applicable measurement starting date. DCA* is the DCA of company i at the year of the IPO. ISj is die income smoothing coefficient of company i measured over the whole period. DCAj and ISj are proxies for earnings management. New Economy (NEW*) firms belong to market sectors 5,13,15,17 representing Technology, Media, Telecommunications and Healthcare, respectively, in the Dow Jones STOXX global sector classification scheme. Log(MVj) is the Market Value of the Firm at the IPO date defined as the total number of shares issued (including overalottment options) times the IPO price, measured in end-1997 purchasing power. Log(l+ AgeO is defined as the year of going public minus the year of foundation, with firms founded before 1901 assumed to be founded in 1901. EquityRetentionj (ER) is defined as one minus the percentage of Equity offered based on the IPO date. IR, measures the Initial Returns of the IPO defined as the unadjusted percentage change between the IPO price and the first closing price; Standard Error (S.E) in parenthesis.__________________________________________________________________________
Panel A: Coefficient estimates based on starting measurement after three months ofgoing public
P \ P i P i Pa Ps Pt> P 7
-0.1893c 0.1063 0.0001(0.1089) (0.3267)-0.4390 0.2175 0.0100(0.2541) (0.1955)1.0700 0.6855b -0.0694 -0.1304 0.6133 0.2072 0.0935
(05437) (0.3076) (0.1022) (0.0942) (0.5614) (0.5059)0.7186 0.1125 0.2105 0.7043 b -0.0649 -0.1234 0.5871 0.1938 0.103
(2.0156) (0.3220) (0.1922) (0.3091) (0.1033) (0.0947) (0.5636) (0.5112)
Panel B: Coefficient estimates based on starting measurement after nine months o f going publica A P i A P a Ps A P 7 R2
-0.4399“ -0.3089c 0.0244(0.0589) (0.1768)-0.7220“ 0.2212b 0.0346(0.1374) (0.1057)0.0313 0.2588 -0.0331 -0.0165 0.1982 0.2924 0.0552
(1.0999) (0.1719) (0.0571) (0.0526) (0.3138) (0.2828)-0.5570 -0.3108° 0.2120b 0.2639 -0.0146 -0.0144 0.1791 0.3601 0.1140(1.0969) (0.1752) (0.1046) (0.1682) (0.0562) (0.0515) (0.3067) (0.2782)
Panel B: Coefficient estimates based on starting measurement after twelve months o f going publica A A A A A A P7
-0.4582“ -0.2504 0.0161(0.0590)-0.7139“
(0.1770)0.202 lb 0.0291
(0.1374)0.3912
(0.1057)0.2191 -0.0484 -0.0011 0.0043 0.2708 0.0461
(1.1020)-0.1271 -0.2405 0.1962b
(0.1723)0.2253
(0.0572)-0.0328
(0.0527)0.0013
(0.3144)-0.0143
(0.2833)0.3244 0.0901
(1.1085)(L b ,c J ___
(0.1771) (0.1057) (0.1700) (0.0568) (0.0521) (0.3100) (0.2811)*,c denote statistical significance at the 0.01,0.05, and 0.10 levels, respectively, based on a simple t-test.
the regression model from 5.52 percent to 11.40 percent, but DCA and IS also become
significant. This finding demonstrates that factors other than fundamentals drive IPO
prices in the short-run. In an environment characterized by high levels of “divergence of
150
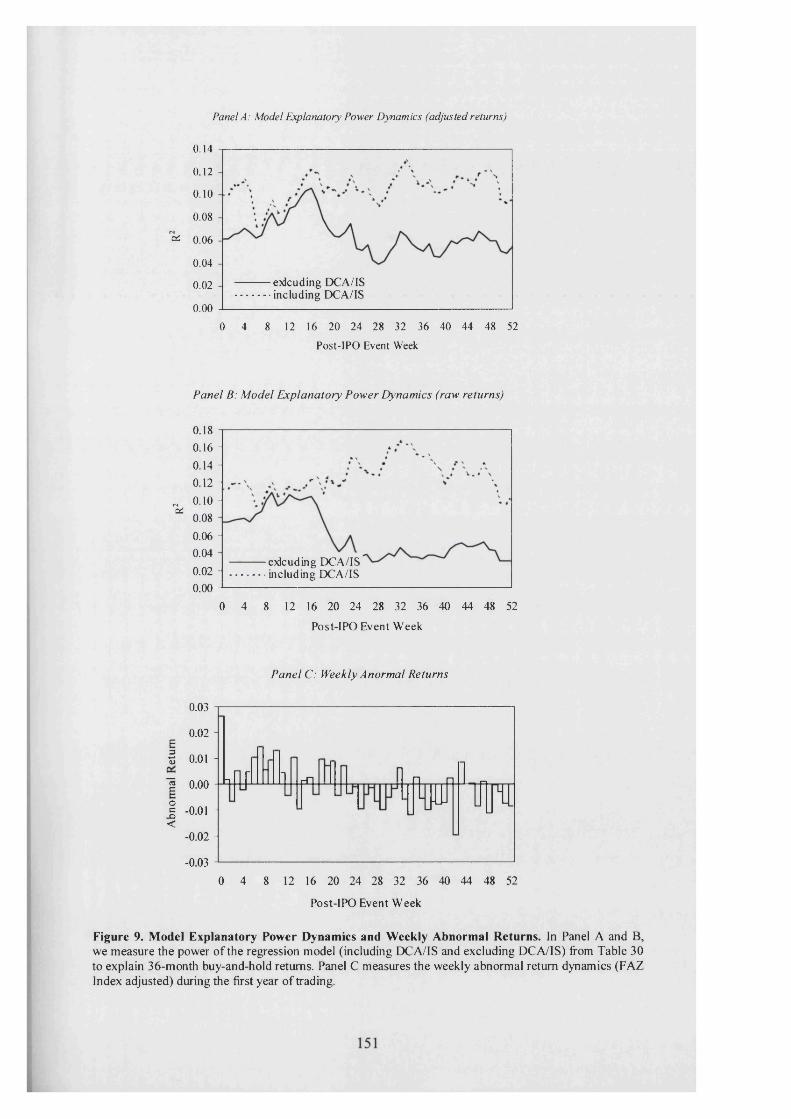
Panel A: Model Explanatory Power Dynamics (adjusted returns)
0.14
0.12
0.10
0.08
* 0.06
0.04
0.02
0.000 4 8 12 16 20 24 28 32 36 40 44 48 52
Post-IPO Event Week
Panel B: Model Explanatory Power Dynamics (raw returns)
0.18 0.16 - 0.14 - 0 .12 -
M 0 .10 -
* 0.08 0.06 - 0.04 0.02 -
0.000 4 8 12 16 20 24 28 32 36 40 44 48 52
Post-IPO Event Week
0.03 -
0.02 -
BI 0.01 -
I 0.00 -
1 - 0.01 -
<- 0.02 -
-0.03 -0 4 8 12 16 20 24 28 32 36 40 44 48 52
Post-IPO Event Week
Figure 9. Model Explanatory Power Dynamics and Weekly Abnormal Returns. In Panel A and B, we measure the power of the regression model (including DCA/IS and excluding DCA/IS) from Table 30 to explain 36-month buy-and-hold returns. Panel C measures the weekly abnormal return dynamics (FAZ Index adjusted) during the first year of trading.
Panel C: Weekly Anormal Returns
-i n r i rn n n "L np f T p
exlcuding DCA/IS including DCA/IS
exlcuding DCA/IS including DCA/IS

opinion” (Miller (1977)), factors such as company characteristics (such as age, initial
return, free-float, size or economic sector), short-selling constraints (Duffie, Garleanu
and Pederson (2002) and Gecy, Musto and Reed (2001)), lock-up periods (Brav and
Gompers (2002)), underwriter stabilization (Aggarwal (2000)) or the expiration of the
“quiet period” (Bradley, Jordan and Ritter (2002)) may be the driving forces behind
short-run IPO returns.
In Figure 9, we study the explanatory power dynamics of model (5) in more
detail. The 36-months returns (both raw and adjusted) are measured starting from the
first week to 52 weeks after the IPO date. The R2s of the regression with and without the
proxies for fundamentals (DCA and IS) are plotted in Panels A and B, respectively.
Clearly, the R2s of the model, with and without the variables explaining fundamentals,
are almost the same for the first several months after the IPO date. Take, for example,
the adjusted return (Panel A). The model explanatory power with and without
fundamentals starts to diverge only four to five months after the IPO date. After that, the
explanatory power of the typical IPO explaining variables (such as size, age, initial
returns, economic sector) starts to decrease while the explanatory power of
fundamentals starts to increase dramatically. Both of them remain relatively stable one
or two months afterwards. This pattern also holds when the raw return is used (Panel
B).71 The substantially increased model explanatory power with DCA and IS after four
to five months indicates that fundamentals start to play a bigger role in determining the
long-run return of IPO stocks. After that time, the non-fundamental factors lessen their
impact in determining IPO long-run performance.
We investigate this issue further by examining the actual short-term return
dynamics of IPO stocks. The results are reported in Panel C of Figure 9. In Panel C, we
71 When the raw return is used, the market return is added the right-hand side of the model (5).
152
document average weekly abnormal returns of IPO stocks. Clearly, during the first five
to six months (the time that the fundamentals take to establish their role), the IPO stocks
perform well relative to the market. After that, however, they start to underperform.
When comparing the time when the fundamental factors start to play a bigger role with
the time when the IPO stocks start to underperform, a clear picture emerges: in the
short-run, IPO stocks outperform the market and their return dynamics are essentially
driven by factors other than fundamentals. After some period of learning, fundamentals
start to play a bigger role and IPOs start to underperform. This result casts light upon
the reported anomaly documenting the significant short-run overperformance in IPOs in
general and German IPOs in particular, as well as the sharp drop-off in performance
thereafter.
7 Summary and Conclusion
This paper has analysed management behaviour towards earnings management
and the dynamics of the subsequent market response. The analysis has been conducted
through the evaluation of accounting information and stock prices of a large number of
companies that chose to go public in Germany over the ten-year period between 1988
and 1997. We have defined two widely acknowledged forms of earnings management
and have investigated some issues that have so far remained unexplained. To our
knowledge, this is the first study that applies this concept to German IPOs, a market
which has gained considerable international attention during the past decade.
For the sample o f German IPOs, we provide evidence that the IPO event itself
may give managers an incentive to opportunistically manage earnings so as to maximize
IPO proceeds. We also find that the form of earnings management during the IPO year
is indeed linked to the long-run aftermarket performance. Firms that perform best over
153

the long-run manage earnings least opportunistically. This applies to the two methods of
earnings management studied. We also find that two types o f earnings management are
not deterministic, yet complementary. The ten IPOs that fall into the intersection of
companies with the lowest DCA and highest IS substantially outperform the rest of the
sample and the market.
The outperformance of the less aggressive companies could be due to a variety
of reasons such as varying risk premia, the empirical methodology or simply bad luck.
To check for the robustness of our results, we exercised a set of robustness analyses. We
found that the risk premium proxied by the standard deviation of monthly returns or age
does not show significant difference between the more conservative and more
aggressive earnings management groups. Since a broad set of the empirical literature
(Clarkson and Thompson (1990), Ritter (1991), Chan and Lakonishok (1992),
Keloharju (1993), Leleux and Muzyka (1998)) rejects the notion that beta can explain
away the differences in return performance o f IPO stocks, we believe that beta
adjustments cannot account for the large performance discrepancies identified in this
study. Moreover, using cumulative returns, another conventional method of returns
measurement, we find that the qualitative nature of the results does not change.
This analysis has also been set up with the aim of shedding some light on the
forces behind the return dynamics in aftermarket trading of IPOs. We find that the long-
run performance is sensitive to the starting date of the measurement period. The
explanatory power of both DCA and IS for long-run returns, proxies for fundamentals
of IPO firms, increases dramatically when the performance is measured after some time
of trading in the aftermarket (four to five months). This result indicates that investor
sentiment, driven by institutional peculiarities in an IPO market typically characterised
by high levels of “divergence o f opinion” (such as the immediate IPO aftermarket),
154

replaces fundamentals as the driving force behind the short-run price dynamics. It takes
many months for the market to catch-up to the company fundamentals conveyed in the
proxies for earnings management.
For academics and practitioners alike, the findings presented here have a number
of repercussions: for academics, it matters when to start measuring performance.
Delaying the start of the measurement period beyond the first four months is most likely
going to improve the explanatory power of accounting information. Investors should not
treat IPOs like any other firm that is being traded in the market, particularly during a
firm’s first year o f trading because IPO returns, as shown in this analysis, are largely
driven by factors other than fundamentals in the short-run. The message for firms is that
there is always a trade-off between short-term gains and long-term losses. If a firm is
concerned about its long-term perspective, it should not manage its earnings
aggressively, because the market is going to catch up sooner or later.
The findings also provide a potential rational for investors to ignore IPO
fundamentals in the short-run, because the extreme winner is likely to be found in those
companies that manage earnings more aggressively. This indeed sheds light on the
short-run aftermarket return dynamics o f US IPOs during Internet bubble of 1999 and
part of 2000, and on the even more extreme events that took place on the Neuer Markt
and its subsequent fall.
155

References
Aggarwal, Reena, 2000, Stabilization Activities by Underwriters after Initial Public Offerings, Journal of Finance 55, 1075-1103.
Aggarwal, Reena, and Pietra Rivoli, 1990, Fads in the Initial Public Offering Market?, Financial Management 1990,45-57.
Akerlof, George A., 1970, The Market for “Lemons”: Quality Uncertainty and the Market Mechanism, The Quarterly Journal o f Economics 84, 488-500.
Allen, Franklin, and Gerald R. Faulhaber, 1989, Signaling by underpricing in the IPO market, Journal o f Financial Economics 23, 303-324.
Alvarez, Susana and Victor M. Gonzales, 2001, Long-Run Performance of Initial Public Offerings (IPOs) In the Spanish Capital Market, Working Paper, University of Oviedo.
Amihud, Yakov, Shmuel Hauser, and Amir Kirsh, 2002, Allocations, adverse selection and cascades in IPOs: Evidence from Israel, Working paper, New York University.
Baker, Malcolm P., and Jeffrey Wurgler, 2000, The equity share in new issues and aggregate stock returns, Journal o f Finance 55, 2219-2257.
Barry, Christopher B, and Robert H. Jennings, 1992, Information and Diversity of Analyst Opinion, Journal of Financial and Quantitative Analysis 27, 169-183.
Barber, Brad and John Lyon, 1997, Detecting long-horizon abnormal stock returns: the empirical power and specification o f test statistics, Journal o f Financial Economics 43, 341-372.
Baron, David P., 1982, A model of the demand for investment banking advising and distribution services of new issues, Journal o f Finance 37, 955-976.
Beatty, Randolph P., and Ivo Welch, 1996, Issuer expenses and legal liability initial public offerings, Journal o f Law and Economics 39, 545-602.
Beneviste, Lawrence M., and Paul A. Spindt, 1989, How investment bankers determine the offer price and allocation of new issues, Journal o f Financial Economics 24, 343-362.
Beneviste, Lawrence M., and William J. Wilhelm, 1990, A comparative analysis of IPO proceeds under alternative regulatory environments, Journal o f Financial Economics 28, 173-208.
Biais, Bruno, Peter Bossaerts and Jean-Charles Rochet, 2002, An Optimal IPO Mechanism, Review o f Economic Studies 69, 117-146.
156

Biais, Bruno, and Anne-Marie Faugeron-Crouzet, 2002, IPO Auctions: English, Dutch, ... French and Internet, Journal o f Financial Intermediation, forthcoming.
Bosveld, Rudolf and Merel A. Venneman, 2000, Initial Public Offerings on the Amsterdam Stock Exchange, Working Paper, NUON and Boston Consulting Group.
Bradley, Daniel, and Brad Jordan, and Jay R. Ritter, 2002, The quiet period goes out with a bang, Working paper, University o f Kentucky.
Bradley, Daniel, Brad Jordan, Ivan Roten, and Ha-Chin Yi, 2001, Venture capital and IPO lockup expirations: An empirical analysis, Journal o f Financial Research 24, 465-492.
Brav, Alon and Paul Gompers, 1997, Myth or reality? The long-run underperformance of initial public offerings: Evidence from venture and nonventure capital-backed companies, Journal o f Finance 52, 1791-1821.
Brav, Alon, and Paul Gompers, 2002, Insider trading subsequent to initial public offerings: Evidence from the expiration o f lockup provisions, Review o f Financial Studies, forthcoming.
Brav, Alon, Christopher Geczy, and Paul Gompers, 2000, Is the Abnormal Return Following Equity Issuance Anomalous?, Journal o f Financial Economics 56, 209-249.
Brown, Stephen J., and Jerry Warner, 1980, Measuring security price performance, Journal of Financial Economics 8, 205-258.
Carter, Richard B., and Steven Manaster, 1990, Initial public offerings and underwriter reputation, Journal of Finance 45, 1045-1067.
Chalmers, John M. R., Larry Y. Dann, and Jarrad Harford, 2000, Managerial Opportunism? Evidence form Directors’ and Officers’ Insurance Purchases, Working Paper, University of Oregon.
Chan, Louis K.C. and Josef Lakonishok, 1992, Robust measurement of beta risk, Journal o f Financial and Quantitative Analysis 27, 265-282.
Chaney, Paul K. and Craig M. Lewis, 1998, Income smoothing and underperformance in initial public offerings, Journal o f Corporate Finance 4, 1-29.
Chen, Hsuan-Chi, and Jay R. Ritter, 2000, The Seven Percent Solutions, Journal o f Finance 55, 1105-1131.
Cherubini, Umberto, and Marco Ratti, 1992, Underpricing o f Initial Public Offerings in the Milan Stock Exchange, 1985-91, Working Paper, Banca Commerciale Italiana.
157

Clarkson, Peter and Rex Thompson, 1990, Empirical estimates of beta when investors face estimation risk, Journal o f Finance 45,431-453.
Cooney, John W., Ajai K. Singh, Richard B. Carter, and Frederick H. Dark, 2001, IPO initial returns and underwriter reputation: Has the inverse relationship flipped in the 1900s?, Working paper, University of Kentucky, Case Western Reserve University, and Iowa State University.
Comelli, Francesca, and David Goldreich, 2001, Bookbuilding and strategic allocation, Journal o f Finance 56, 2337-2369.
Davidsson, Per and Magnus Henrekson, 2000, Institutional Determinants of the Prevalence of Start-ups and High-Growth Firms: Evidence from Sweden, Working Paper, Stockholm School of Economics.
Degeorge, Francois, and Francois Derrien, 2000, IPO performance and earnings expectations: some French evidence, Working paper, HEC School of Management.
Derrien, Francois, and Kent L. Womack, K. (2002): Auctions vs. Bookbuilding and the Control of Undepricing in Hot IPO Markets, Review o f Financial Studies, forthcoming.
De Bondt, Werner F. M., and Richard Thaler, 1985, Does the Stock Market Overreact?, Journal o f Finance 40, 793-805.
Dimson, Elroy and Paul Marsh, 1986, Event study methodologies and the size effect, Journal of Financial Economics 17, 113-142.
D’Souza Juliet, and William L. Megginson, 1999, The Financial and Operating Performance of Privatized Firms during the 1990s, Working Paper, Mercer University and University of Oklahoma.
Drake, Philip D., and Michael R. Vetsuypens, 1993, IPO underpricing and insurance against legal liability, Financial Management 22, 64-73.
Duffie, Darrell, Nicolae Garleanu and Lasse H. Pederson, 2002, Securities Lending, Shorting and Pricing, Working Paper, Graduate School of Business, Stanford University.
Ellingsen, Tore, and Kristian Rydqvist, 1997, The Stock Market as a Screening Device and the Decision to Go Public, Working Paper, Stockholm School o f Economics.
Espenlaub, Susanne and Ian Tonks, 1998, Post-Directors’ Sales and Reissuing Activity: An Empirical Test of IPO Signalling Models, Discussion Paper 283, LSE Financial Markets Group.
158

Espenlaub, Susanne, Alan Gregory and Ian Tonks, 1998, Testing the Robustness of Long-Term Underperformance of UK Initial Public Offerings, Discussion Paper 285, LSE Financial Markets Group.
Fama, Eugene F., 1998, Market efficiency, long-term returns, and behavioural finance, Journal o f Financial Economics 49, 283-306.
Faugeron-Crouzet, Anne-Marie, Edith Ginglinger, and Vasumathi Vijayraghavan, 2001, French IPO returns and subsequent security offerings: Signaling hypothesis versus market feedback hypothesis, Working Paper, University Paris 12.
Field, Laura C., and Gordon Hanka, 2001, The expiration of IPO share lockups, Journal o f Finance 56, 471-500.
Geczy, Christopher, C., David K. Musto and Adam V. Reed, 2002, Stocks are Special Too: An Analysis o f the Equity Lending Market, Journal o f Financial Economics, forthcoming.
Giudici, Giancarlo, and Stefano Paleari, 1999, Underpricing, Price Stabilization and Long Run Performance in Initial Public Offerings: A Study on the Italian Stock Market Between 1985 and 1998, Working Paper, Politecnico di Milano.
Glaugau, Otto, 1876, Der Borsen- und Griindungs-Schwindel in Berlin Gesammelte und stark vermehrte Artikel der “Gartenlaube ”, (Verlag von Paul Frohberg, Leipzig, Germany).
Gompers, Paul, and Josh Lemer, 2001, The really long-term performance of initial public offerings: The pre-NASDAQ experience, Working paper, Harvard Business School.
Gordon, Robert J., 2001, Technology and Economic Performance in the American Economy, Working Paper, Northwestern University.
Grinblatt, Mark, and Chuan Yang Hwang, 1989, Signalling and the Pricing of New Issues, The Journal o f Finance 44, 393-420.
Guenther, David A., 1994, Earnings management in response to corporate tax rate changes: Evidence from the 1986 tax reform act, Accounting Review 69, 230-243.
Habib, Michel, and Alexander Ljungqvist, 2001, Underpricing and entrepreneurial wealth losses in IPOs: Theory and evidence, Review o f Financial Studies 14, 433-458.
Harrison, J. Michael and David M. Kreps, Speculative Investor Behavior in a Stock Market with Heterogeneous Expectations, Quarterly Journal o f Economics 92, 323-336.
Hanley, Kathleen Weiss, 1993, The underpricing of initial public offerings and the partial adjustment phenomenon, Journal o f Financial Economics 34,231-250.
159

Hanley, Kathleen Weiss, Arun Kumar, and Paul Seguin, 1993, Price stabilization in the market for new issues, Journal o f Financial Economics 34, 177-197.
Helwege, Jean and Nellie Liang, 2001, Initial Public Offerings in Hot and Cold Markets, Working Paper, Ohio State University and Board of Governors of the Federal Reserve System.
Holmen, Martin, and Peter Hogfeldt, 2000, A Law and Finance Analysis of Initial Public Offerings, Working Paper, Stockholm University and Stockholm School of Economics.
Hogholm, Kenneth, 1994, Determinants of the Underpricing o f Initial Public Offerings in Sweden, Working Paper, Swedish School of Economics and Business Administration.
Ibbotson, Roger G., 1975, Price performance of common stock new issues, Journal o f Financial Economics 2, 235-272.
Ibbotson, Roger G., Jody L. Sindelar, and Jay R. Ritter, 1988, Initial public offerings, Journal o f Applied Corporate Finance 1, 37-45.
Ibbotson, Roger G., and Jeffrey F. Jaffe, 1975, “Hot Issue” Markets, Journal o f Finance 30, 1027-1042.
Jain, Bharat A., and Omesh Kini, 1994, The post-issue operating performance of IPO firms, Journal o f Finance 49, 1699-1726.
Jegadeesh, Narasimhan, Mark Weinstein, and Ivo Welch, 1993, An empirical investigation of IPO returns and subsequent equity offerings, Journal o f Financial Economics 34, 153-175.
Jensen, Michael and William H. Meckling, 1976, Theory of the firm: Managerial behavior, agency costs and ownership structure, Journal o f Financial Economics 3, 306-360.
Jenkinson, Tim, Alexander P. Ljungqvist and William J. Wilhelm, 2000, Has the Introduction of Bookbuilding Increased the Efficiency o f International IPOs?, Working Paper, Oxford University.
Jenkinson, Tim, and Alexander Ljungqvist, 2001, Going Public: The Theory and Evidence on How Companies Raise Equity Finance, 2nd edition (Oxford University Press, Oxford, UK).
Jones, Jennifer, 1991, Earnings management during import relief investigations, Journal o f Accounting Research 29 193-228.
Jones, Steven L., William L. Megginson, Robert C. Nash, and Jeffry M. Netter, 1999, Share Issue Privatization as Financial Means to Political and Economic Ends, Journal o f Financial Economics, 217-253.
160

Kahneman, Daniel, and Amos Tversky, 1979, Prospect theory: An analysis of decision under risk, Econometrica 47, 263-291.
Kaplan, Robert S., 1985, Comments on Paul Healy: Evidence on the Effect of Bonus Schemes on Accounting Procedure and Accrual Decisions, Journal o f Accounting and Economics 7, 109-113.
Kaserer, Christoph and Marcus Kraft, 2000, How Issue Size, Risk, and Complexity Influence External Financing Costs - The Case of IPO’s in Germany, Working Paper, University of Fribourg and University of Wurzburg.
Keloharju, Matti, 1993, The winners’s curse, legal liability, and the long-runperformance of initial public offerings in Finland, Journal o f FinancialEconomics 34, 251-277.
Koh, Francis, and Terry Walter, 1989, A direct test of Rocks model of the pricing of unseasoned issues, Journal o f Financial Economics 23, 251-272.
Kothari, S. P. and Jerry Warner, 1997, Measuring long-horizon security price performance, Journal o f Financial Economics 43, 301-339.
Kunz, Roger M and Reena Aggarwal, 1994, Why initial public offerings areunderpriced: Evidence form Switzerland, Journal o f Banking and Finance18, 705-723.
Leland, Hayne E., and David H. Pyle, 1977, Informational Asymmetries, Financial Structure, and Financial Intermediation, Journal o f Finance 32, 371-387.
Leleux, Benoit and Daniel Muzyka, 1998, European IPO Markets: A Post-Issue Performance Study, in Mike Right and Ken Robie, ed.: Management Buy-Outs and Venture Capital: Into the Next Millenium (Manchester University Press, Manchester, England).
Lemer, Josh, 1994, Venture capitalists and the decision to go public, Journal o f Financial Economics 35, 293-316.
Ljungqvist, Alexander P., 1997, Pricing initial public offerings: Further evidence from Germany, European Economic Review 41, 1309-1320.
Ljungqvist, Alexander, and William Wilhelm, 2002, IPO pricing in the dot-com bubble: Complacency or incentives?, Working paper, New York University.
Logue, Dennis E., 1973, On the pricing o f unseasoned equity issues: 1965-1969, Journal o f Financial and Quantitative Analysis 8,91-103.
Loughran, Tim, and Jay R. Ritter and Kristian Rydqvist, 1994, Initial public offerings: International insights, Pacific-Basin Finance Journal 2, 165-199.
Loughran, Tim, and Jay R. Ritter, 1995, The New Issues Puzzle, Journal o f Finance 50, 23-51.
161

Loughran, Tim, and Jay R. Ritter, 2000, Uniformly least powerful tests of market efficiency, Journal o f Financial Economics 55, 361-389.
Loughran, Tim, and Jay R. Ritter, 2001, Why has IPO underpricing increased over time?, Working paper, University o f Florida.
Loughran, Tim, and Jay R. Ritter, 2002, Why don’t issuers get upset about leaving money on the table in IPOs?, Review o f Financial Studies 15, 413-443.
Lowry, Michelle, and G. William Schwert, 2002, IPO Market Cycles: Bubbles or Sequential Learning?, Journal o f Finance 57, 1171-1198.
Lyon, John D., Brad M. Barber, and Chih-Ling Tsai, 1999, Improved Methods forTests o f Long-Run Abnormal Stock Returns, Journal o f Finance 54, 165-201.
Michaely, Roni, and Wayne H. Shaw, 1994, The pricing of initial public offerings: Tests of adverse-selection and signaling theories, Review o f Financial Studies 7, 279-319.
Miller, Edward M., 1977, Risk, uncertainty, and divergence o f opinion, Journal o f Finance 32, 1151-1168.
Miller, Robert E., and Frank Reilly, 1987, An Examination o f Mispricing, Returns and Uncertainty for Initial Public Offerings, Financial Management 16, 33-38.
Morris, Steven, 1996, Speculative Investor Behavior and Learning, Quarterly Journal o f Economics 111, 1111-1133.
Mitchell, Mark L., and Erik Stafford, 1999, Managerial Decisions and Long-Term Stock Price Performance, Working Paper, Harvard Business School.
Muscarella, Chris J., and Michael R. Vetsuypens, 1989, A simple test of Baron’s model of IPO underpricing, Journal o f Financial Economics 24, 125-136.
Olcoz, Ansotegui Carmen and Feldsztajn Fabregat Jordi, 2000, Initial Public Offerings on the Spanish Stock Exchange, Working Paper, ESADE - URL.
Perotti, Enrico, 1995, Credible Privatization, American Economic Review 85, 847-859.
Perotti, Enrico, and Serhat E. Guney, 1993, Successful privatisation plans: Enhanced credibility through timing and pricing of sales, Financial Management 22, 84-98.
Rahnema, Ahmad, Pablo Fernandez and Eduardo Martinez Abascal, 1992, Initial Public Offerings (IPOs): The Spanish Experience, Working Paper, IESE.
Rajan, Raghuram, and Henri Servaes, 1993, The Effect of Market Conditions on Initial Public Offerings, Working Paper, University of Chicago.
162

Rao, Gita R., 1993, The Relation between Stock Returns and Earnings: A Study of Newly-Public Firms, Working Paper, Kidder Peabody and Co, New York.
Reimer, Hauke, 1998, Das Kartell der Absahner, Wirtschaftswoche 26, 160-173.
Rock, Kevin, 1986, Why new issues are underpriced, Journal o f Financial Economics 15, 187-212.
Roell, Ailsa, 1996, The Decision to Go Public: An Overview, European Economic Review 40, 1071-1081.
Ritter, Jay R., 1984, The “hot issue” market of 1980, Journal o f Business 57, 215-240.
Ritter, Jay R., 1991, The Long-Run Performance of Initial Public Offerings, Journal o f Finance 46, 3-27.
Ritter, Jay R., 2001, Some Factoids about the US IPO market, mimeo, University of Florida.
Ritter, Jay R., and Ivo Welch, 2002, A Review of IPO Activity, Pricing, and Allocations, Journal o f Finance, forthcoming.
Roosenboom, Peter, Tjalling van der Goot and T., Gerald Mertens, 2000, Earnings Management and the Fortunes of IPOs: A Tale of Two Forms. Working Paper, Tilburg University.
Ruud, Judith S., 1993, Underwriter Price Support and the IPO Underpricing Puzzle, Journal o f Financial Economics 34, 135-151.
Rydqvist, Kristian, 1993, Initial Public Offerings in Sweden, Working Paper, Stockholm School of Economics.
Rydqvist, Kristian, 1997, IPO underpricing as tax-efficient compensation, Journal o f Banking and Finance 21, 295-313.
Scheinkman, Jose, Wei Xiong, 2002, Overconfidence and Speculative Bubbles, Working Paper, Department of Economics and Bendheim Center for Finance, Princeton University.
Schultz, Paul H., and Mir Zaman, 1994, Aftermarket support and underpricing of initial public offerings, Journal of Financial Economics 35, 199-219.
Schuster, Josef A., 1996, Underpricing and crises - IPO performance in Germany, Discussion Paper 252, Financial Markets Group, London School ofEconomics.
Shafik, Nemat, 1996, Selling privatization politically, Columbia Journal o f World Business 31, 20-29.
Shiller, Robert J., 1990, Speculative Prices and Popular Models, Journal of Economic Perspectives 4, 55-65.
163

Shleifer, Andrei and Larry Summers, 1990, The Noise Trader Approach to Finance, Journal o f Economic Perspectives 4, 19-33.
Spatt, Chester S., and Sanjay Srivastava, 1991, Preplay communication, participation restrictions, and efficiency in initial public offerings, Review o f Financial Studies 4, 709-726.
Stehle, Richard, Olaf Erhardt and Rene Przyborowsky, 1998, Long-run stock performance after initial public offerings and seasoned equity issues, Working Paper, Humboldt Universitat Berlin.
Stoll, Hans R., and Anthony J. Curley, 1970, Small Business and the New Issues Market for Equities, Journal o f Financial and Quantitative Analysis 5, 309-322.
Teoh, Siew Hong, Ivo Welch and T. J. Wong, 1998, Earnings Management and the Long-Run Market Performance o f Initial Public Offerings, Journal o f Finance 53, 1935-1974.
Teoh, Siew Hong, T. J. Wong and Gita Rao, 2002, Are the Accruals during IPOs Opportunistic? Review o f Accounting Studies, forthcoming.
Tinic, Seha M., 1988, Anatomy of initial public offerings of common stock, Journal o f Finance 43, 789-822.
Uhlir, Helmut, 1989, Der Gang an die Borse und das Underpricing-Phanomen: Eine empirische Untersuchung deutscher Emissionen (1977-1987), Zeitschrift fur Bankrecht und Bankwirtschaft 1,2-16.
Van der Goot, Tjalling, 1997, Valuing New Issues - Information Quality o f Initial Public Offerings at the Amsterdam Stock Exchange (Thesis Publishers, Amsterdam, The Netherlands).
Vijh, Anand M., 1999, Long-term returns form equity carveouts, Journal o f Financial Economics 51, 273-308.
Weinberger, Andreas, 1995, Die Vorteilhaftikeit von Aktienerstemissionen, Underpricing, Fair Valuing oder Overpricing? Erfolg oder MiBerfolg?, Working Paper, Universitat Koln.
Welch, Ivo, 1989, Seasoned offerings, imitation costs, and the underpricing of initial public offerings, Journal o f Finance 44, 421-450.
Welch, Ivo, 1992, Sequential sales, learning, and cascades, Journal o f Finance 47, 695-732.
164

Appendix A: Sector Classification Table 31: Global Sector Classification Standard59
The Dow Jones STOXX global sector classification standard groups companies that have similar primary revenue sources. There are 10 economic sectors and derived from these - in increasingly finer classifications - are 18 market sectors (used for this study), 51 industry groups and 89 sub-groups. New Economy firms (270) belong to Market Sectors 5, 13, 16 and 17, representing Media [MDI], Healthcare [HCR], Technology [TEC] and Telecommunications [TLS], respectively. For the purpose of this study, all other Market Sectors are defined as belonging to the Old Economy. Europe (EU) = Total Number of IPOs issued between 1988 and 1998 in Germany (BD), France (FR), Italy (IT), the Netherlands (NL), Spain (SP), Sweden (SD) and Switzerland (SW). _________________________________________
Market Sectors
EU BD
Country and Number o f IPOs
FR IT NL SP SD SW
1 Basic Resources [BAS] 46 5 13 3 3 9 11 2
2 Chemicals [CHM] 27 4 1 0 4 5 1 0 33 Automobiles [ATO] 36 1 0 11 4 4 1 6 0
4 Cyclical Goods and Services [CGS] 124 33 39 2 1 6 9 1 0 6
5 Media [MDI] 32 3 18 3 1 2 5 0
6 Retail [RTS] 44 16 19 1 3 1 4 0
7 Food & Beverage [FOB] 51 7 24 2 1 1 2 3 2
8 Non-Cyclical Goods & Services [NCG] 63 13 26 1 8 9 5 1
9 Energy [ENE] 11 0 4 2 1 2 2 0
1 0 Banks [BNK] 2 0 3 2 6 0 6 2 1
11 Financial Services [FSV] 58 1 2 13 6 4 9 13 1
1 2 Insurance [INS] 17 4 5 5 0 2 0 1
13 Healthcare [HCR] 54 7 2 2 1 4 0 14 6
14 Construction [CNS] 47 18 8 2 3 13 3 0
15 Industrial Goods & Services [IGS] 147 32 45 1 2 7 9 34 8
16 Technology [TEC] 170 43 56 1 24 1 34 11
17 Telecommunications [TLS] 14 4 6 0 1 0 2 1
18 Utilities [UTI] 1 2 5 2 3 0 2 0 0
Total 973 219 323 77 75 8 8 148 43
59 For the complete classification standard see: http://www.stoxx.com/indexes/guide/index_guide.pdf
165

Appendix B: Alternative Performance Tests Table 32: Aftermarket Performance (Value-Weighted)
The sample contains 973 European Initial Public Offerings between 1988 and 1998. Aftermarket returns are measured as value-weighted buy-and-hold returns whereas one month is defined as consecutive 2 1 - day trading interval from the close of the first day of trading using European trading days, assuming a declining sample size. If the IPO is delisted before the end of the measurement period, we calculate the return until the delisting date. Aftermarket returns are compared with alternative benchmarks. The Dow Jones STOXX, size-based benchmarks, ex. UK, were used as a proxy for the European market. The wealth relative (WR) is the ratio on one plus the average aftermarket period buy-and-hold IPO return divided by one plus the average aftermarket benchmark buy-and-hold return. For example, for the month 36 adjustment of IPO returns for the movement in the broad market, (l+0.7414)/(l+0.6495) = 1.06; Standard Errors (S.E.) in parentheses.______________________________________________________
Aftermarket Performance o f IPOs: All Market Conditions
IPO and Benchmark ReturnsRaw Broad- Wealth Large- Wealth Mid- Wealth Small- Wealth
Aftermarket Return Market Relative Caps Relative Caps Relative Caps RelativeMonth 1 0.0059 0.0116 0.99 0.0147 0.99 0.0057 1 . 0 0 -0.0049 1 . 0 1
(N=973) (0.0068) (0.0117) (0.0067) (0.0148) (0.0067) (0.0057) (0.0053) (-0.0048) (0.0066)Month 3 0.0374s 0.0463 0.99 0.0526 0.99 0.0321 1 . 0 1 0.0096 1.03s
(N=972) (0 .0 1 1 1 ) (0.0467) (0.0104) (0.0534) (0.0104) (0.0319) (0.0105) (0.0093) (0.0105)Month 12 0.2422s 0.1513 1.08 0.1766 1.06 0.0882 1.14s 0.0147 1 .2 2 s
(N=970) (0.0582) (0.1402) (0.0575) (0.1673) (0.0576) (0.0773) (0.0576) (0 .0 1 2 0 ) (0.0578)Month 36 0.7412s 0.6495 1.06 0.7625 0.99 0.3784 1.26b 0.1128 1.56s
(N=6 8 6 ) (0.1746) (0.6153) (0.1729) (0.7718) (0.1733) (0.2996) (0.1733) (0.0721) (0.1735)Month 60 0.7763s 1.1732 0.82s 1.4143 0.74s 0.6698 1.06 0.2003 1.48s
(N=381) (0.1245) (1.4353) (0.1178) (1.9223) (0.1177) (0.6296) (0.1193) (0.1353) (0 .1 2 1 0 )),c denote statistical significance at the 0.01,0.05, and 0.10 levels, respectively, based on a simple t-test.
166

Appendix B: Alternative Performance Tests Table 33: Cumulative Average Returns (CARs) for
Alternative BenchmarksAftermarket Returns are measured as Cumulative Average Returns (CARs) (not in percent), withassociated Standard Errors (S.E.) (in parentheses) for 60 months after going public, excluding the initialreturns. One month is defined as a consecutive 21-day trading interval using European trading days. Thevalue-weighted Dow Jones STOXX size indices (Broad-Market, Large-Caps, Mid-Caps and Small Caps),excluding UK, were used as a proxy for the market benchmark respectively.________________________
IDr,n Broad Market Large-Cap . . . . ~ .. . . Small-CapMonth IPO Return ,. A . ,r x / Mid-Cap adjusted ,. . /adjusted adjusted J adjustedCAR S.E. CAR S.E. CAR S.E. CAR S.E. CAR S.E.
1 0.0312“ (0.0068) 0.0134b 0.0066) 0.0106 0.0067) 0.0208* (0.0066) 0.0296“ (0.0066)2 0.0461“ (0.0087) 0.0215b 0.0084) 0.0166b 0.0084) 0.0347“ (0.0084) 0.0500“ (0.0085)3 0.0512“ (0.0105) 0.0252* 0.0098) 0.0187° 0.0098) 0.0431“ (0.0098) 0.0646“ (0.0098)4 0.0678“ (0.0122) 0.0346“ 0 .0 1 1 2 ) 0.0263b 0 .0 1 1 2 ) 0.0569“ (0.0113) 0.0857“ (0.0114)5 0.0862“ (0.0141) 0.0432* 0.0131) 0.0332b 0.0131) 0.0685“ (0.0131) 0.1054“ (0.0133)6 0.0933“ (0.0151) 0.0327b 0.0141) 0.0203 0.0142) 0.0636“ (0.0142) 0.1083“ (0.0143)7 0.1036“ (0.0158) 0.0205 0.0149) 0.0060 0.0150) 0.0582“ (0.0149) 0.1091“ (0.0151)8 0.1097“ (0.0165) 0.0115 0.0156) -0.0045 0.0159) 0.0540* (0.0156) 0.1094“ (0.0158)9 0.1247“ (0.0173) 0.0093 0.0162) -0.0085 0.0162) 0.0577* (0.0162) 0.1176“ (0.0164)
1 0 0.1339* (0.0179) 0.0097 0.0171) -0.0091 0.0171) 0.0605“ (0.0170) 0.1227“ (0.0172)11 0.1391“ (0.0183) 0.0069 0.0176) -0.0127 0.0175) 0.0593* (0.0174) 0.1246“ (0.0176)1 2 0.1499“ (0.0197) -0.0005 0.0204) -0.0226 0.0188) 0.0588“ (0.0188) 0.1322“ (0.0190)13 0.1588“ (0.0210) -0.0081 0 .0 2 0 1 ) -0.0323 0 .0 2 0 1 ) 0.0564“ (0 .0 2 0 0 ) 0.1374“ (0 .0 2 0 2 )14 0.1651“ (0.0226) -0 . 0 1 1 0 0.0215) -0.0370° 0.0215) 0.0590“ (0.0214) 0.1440“ (0.0216)15 0.1800“ (0.0240) -0.0089 0.0227) -0.0368 0.0228) 0.0673“ (0.0228) 0.1550“ (0.0228)16 0.1917“ (0.0257) -0.0065 0.0242) -0.0361 0.0242) 0.0738“ (0.0242) 0.1662“ (0.0243)17 0.1977“ (0.0264) -0.0188 0.0250) -0.0512b 0.0250) 0.0688* (0.0251) 0.1673“ (0.0251)18 0.2028“ (0.0272) -0.0346 0.0257) -0.0694“ 0.0258) 0.0579b (0.0258) 0.1662“ (0.0258)19 0.2170* (0.0275) -0.0424 0.0261) -0.0794“ 0.0262) 0.0560b (0.0262) 0.1697“ (0.0262)2 0 0.2413“ (0.0282) -0.0408 0.0268) -0.0795* 0.0269) 0.0636b (0.0270) 0.1793“ (0.0269)2 1 0.2688“ (0.0292) -0.0342 0.0279) -0.0743“ 0.0280) 0.0758“ (0.0281) 0.1930“ (0.0280)2 2 0.2762“ (0.0290) -0.0349 0.0281) -0.0758“ 0.0281) 0.0772“ (0.0282) 0.1959“ (0.0280)23 0.2902“ (0.0295) -0.0294 0.0285) -0.0717 b 0.0286) 0.0856“ (0.0286) 0.206“ (0.0285)24 0.2893“ (0.0301) -0.0388 0.0291) -0.0833“ 0.0292) 0.0817“ (0.0292) 0.2066* (0.0291)25 0.2733“ (0.0302) -0.062lb 0.0291) -0.1088“ 0.0292) 0.0628b (0.0293) 0.1945“ (0.0291)26 0.2748“ (0.0305) -0.0703b 0.0294) -0.1181“ 0.0295) 0.0572° (0.0295) 0.1928“ (0.0294)27 0.2661“ (0.0307) -0.0860“ 0.0295) -0.1351“ 0.0296) 0.0438 (0.0296) 0.1832“ (0.0295)28 0.2548“ (0.0311) -0 .1 0 2 2 “ 0.0297) -0.1538“ 0.0298) 0.0321 (0.0299) 0.1794“ (0.0299)29 0.2574“ (0.0313) -0.1109“ 0.0298) -0.1645“ 0.0298) 0.0269 (0.0300) 0.1812* (0.0299)30 0.2250“ (0.0316) -0.1482“ 0.0302) -0.2043“ 0.0302) -0.0060 (0.0302) 0.1567* (0.0303)31 0.2258* (0.0319) -0.1599“ 0.0303) -0.2179“ 0.0304) -0.0134 (0.0306) 0.1551“ (0.0305)32 0.2315“ (0.0327) -0.1718“ 0.0312) -0.2315“ 0.0312) -0.0223 (0.0313) 0.1505“ (0.0313)33 0.2325* (0.0342) -0.1951“ 0.0323) -0.2575“ 0.0324) -0.0434 (0.0324) 0.1397“ (0.0325)34 0.2569“ (0.0353) -0.1850“ 0.0332) -0.2495“ 0.0333) -0.0317 (0.0333) 0.1579“ (0.0335)35 0.2595“ (0.0365) -0.1929“ 0.0342) -0.2591“ 0.0343) -0.0381 (0.0343) 0.1550“ (0.0344)36 0.2658“ (0.0376) -0.2052“ 0.0350) -0.2742* 0.0350) -0.0467 (0.0351) 0.1552“ (0.0353)37 0.2854“ (0.0383) -0.2082“ 0.0356) -0.2808“ 0.0357) -0.0407 (0.0357) 0.1730* (0.0359)38 0.2938* (0.0388) -0.2199“ 0.0362) -0.2947“ 0.0362) -0.0451 (0.0363) 0.1742“ (0.0364)39 0.2952“ (0.0391) -0.2293“ 0.0365) -0.3053“ 0.0365) -0.0519 (0.0366) 0.1708“ (0.0368)
167

Appendix C continued: 40 0.2898* (0.0403) -0.2399* (0.0378) -0.3175“ (0.0378) -0.0607 (0.0379) 0.1658* (0.0381)41 0.2651* (0.0389) -0.2748* (0.0362) -0.3548* (0.0362) -0.0923b (0.0363) 0.1396* (0.0367)42 0.2736* (0.0394) -0.2732* (0.0368) -0.3551* (0.0368) -0.0874b (0.0370) 0.1511* (0.0373)43 0.2652* (0.0400) -0.2926“ (0.0375) -0.3767* (0.0375) -0.1024* (0.0376) 0.1433* (0.0379)44 0.2752* (0.0403) -0.2986* (0.0376) -0.3838* (0.0376) -0.1065* (0.0377) 0.1436* (0.0381)45 0.2968* (0.0413) -0.2951* (0.0384) -0.3826“ (0.0385) -0.1012* (0.0386) 0.1552* (0.0389)46 0.2930* (0.0416) -0.3097* (0.0386) -0.3995* (0.0386) -0.1133* (0.0388) 0.1490* (0.0392)47 0.3083* (0.0440) -0.2975* (0.0411) -0.3882* (0.0411) -0.1012b (0.0412) 0.1634* (0.0416)48 0.3210* (0.0452) -0.2934* (0.0423) -0.3855* (0.0423) -0.0946b (0.0425) 0.1742* (0.0429)49 0.2990* (0.0450) -0.3239* (0.0419) -0.4188* (0.0419) -0.1194* (0.0421) 0.1565* (0.0427)50 0.3113* (0.0448) -0.3212* (0.0420) -0.4174* (0.0420) -0.1141* (0.0422) 0.1696* (0.0427)51 0.3181* (0.0455) -0.3232* (0.0430) -0.4205* (0.0430) -0.1136* (0.0431) 0.1735* (0.0435)52 0.3000* (0.0465) -0.3296* (0.0444) -0.4289* (0.0444) -0.1200* (0.0445) 0.1733* (0.0449)53 0.3011* (0.0464) -0.3295* (0.0444) -0.4305* (0.0443) -0.1181* (0.0443) 0.1814* (0.0446)54 0.2895* (0.0474) -0.3448* (0.0451) -0.4480* (0.0451) -0.1310* (0.0450) 0.1756* (0.0454)55 0.3057* (0.0481) -0.3432“ (0.0459) -0.4483* (0.0459) -0.1251* (0.0459) 0.1876* (0.0462)56 0.3281* (0.0480) -0.3394* (0.0459) -0.4456* (0.0459) -0.1167b (0.0459) 0.1991* (0.0462)57 0.3385* (0.0493) -0.3339* (0.0474) -0.4413* (0.0474) -0.1114b (0.0473) 0.2075* (0.0474)58 0.3388* (0.0501) -0.3322* (0.0482) -0.4412* (0.0483) -0.1094b (0.0480) 0.2127* (0.0482)59 0.3347* (0.0505) -0.3404* (0.0487) -0.4501* (0.0487) -0.1157b (0.0485) 0.2061* (0.0485)60 0.3525* (0.0532) -0.3220* (0.0506) -0.4328* (0.0506) -0.0964c (0.0505) 0.2263* (0.0506)
*,b,c denote statistical significance at the 0.01, 0.05, and 0.10 levels, respectively, based on a simple t-test.
168

EUROPE
Om<u
-10
-20-30
-400 6 12 18 24 30 36 42 48 54 60
MONTHS RELATIVE TO IPO DATE.............Raw Return — •— Broad Market adjusted — °— Large-Cap adjusted Mid-Cap adjusted — "— Small-Cap adjusted
Appendix B, Figure 10. The Long-Run Performance of IPOs in Europe. Cumulative average returns (CARs) for an equally-weighted portfolio of European Initial Public Offerings, with monthly rebalancing, month 1 to 60. One month is defined as a consecutive 21-day trading interval using European trading days. Five CAR series are plotted for the first 60 months after the IPO date: 1) Raw returns (no adjustment), 2) broad-market adjustment using the STOXX broad-market index (value-weighted), excluding UK, 3) large-cap adjustment using the STOXX large-cap index (value-weighted), excluding UK, 4) mid-cap adjustment using the STOXX mid-cap index (value-weighted), excluding UK and 5) small-cap adjustment using the STOXX small-cap index (value-weighted), excluding UK. Month 0 is the initial return interval. Returns were calculated on the basis of final closing prices.
169

Appendix B: Alternative Performance Tests Table 34: Aftermarket Performance -
constant sample size (686 IPOs)The sample contains 6 8 6 European IPOs between 1988 and 1997. Aftermarket returns are measured as equally-weighted buy-and-hold returns, whereas one month is defined as a consecutive 2 1 -day trading interval from the first closing price, using European trading days. The value-weighted Dow Jones STOXX size indices (Broad-Market, Large-Caps, Mid-Caps and Small-Caps), excluding UK, were used as a proxy for the market benchmark. The wealth relative is the ratio of one plus the average aftermarket period buy-and-hold IPO return, divided by one plus the average aftermarket period benchmark buy-and- hold return. For example, for the month 36 adjustment of IPO returns for the movement in the broad- market benchmark, (1 + 0.6791)/(l+0.5947) = 1.05; Standard Errors (S.E.) in parentheses.____________
____________ Panel A: Mean Aftermarket Performance o f IPOs: All Market Conditions____________
IPO and Benchmark Returns
AftermarketIPO
ReturnBroad-Market
WealthRelative
Large-Caps
WealthRelative
Mid-Caps
WealthRelative
Small-Caps
WealthRelative
Month 1 (N=6 8 6 )
Month 3 (N=6 8 6 )
Month 12 (N=6 8 6 )
Month 36 (N=6 8 6 )
Month 60 (N=381)
0.0233“(0.0065)0.0682“(0.0110)0.3308“(0.0788)0.6791“(0.1746)0.5974“(0.1245)
0.0164“(0.0016)0.0473“(0.0030)0.1708“(0.0073)0.5947“(0.0172)0.6179“(0.0351)
1.01(0.0064)
1.02b(0.0105)
1.14b(0.0780)
1.05(0.1729)
0.99(0.1204)
0.0184“(0.0017)0.0517“(0.0030)0.1933“(0.0073)0.7037“(0.0184)1.1974“
(0.0426)
1.00(0.0064)
1.02(0.0106)
1. 12°
(0.0780)0.99
(0.1729)0.73“
(0.1177)
0 .0120“
(0.0016)0.0374“(0.0030)0.1252“(0.0070)0.3462“(0.0120)0.5313“(0.0228)
l . o r(0.0064)
1.03“(0.0105)
1.18“(0.0781)
1.25°(0.1733)
1.04(0.1193)
0.0065“(0.0016)0.0244“(0.0033)0.0418®(0.0073)0.0951“(0.0091)0.0933“(0.0151)
1.02“(0.0064)
1.04®(0.0105)
1.28“(0.0784)
1.53“(0.1735)
1.46“(0.1209)
Panel B: Mean Aftermarket Performance o f IPOs: Hot Markets
IPO and Benchmark Returns
AftermarketIPO
ReturnBroad-Market
WealthRelative
Large-Caps
WealthRelative
Mid-Caps
WealthRelative
1.02b(0.0099)
1.05“(0.0168)
1.27b(0.1349)
1.41°(0.3001)
1.04(0.1212)
Small-Caps
WealthRelative
1.02b(0.0098)
1.05“(0.0168)
1.37“(0.1354)
1.72“(0.3002)
1.41“(0 .1222)
Month 1 (N=389)
Month 3 (N=389)
Month 12 (N=389)
Month 36 (N=389)
Month 60 (N=119)
0.0369“(0.0100)0.1119“(0.0174)0.4752*(0.1357)0.8568“(0.3014)0.2795b(0.1231)
0.0231“(0.0022)0.0759“(0.0036)0.2238“(0.0108)0.6120“(0.0239)0.1264®(0.0310)
1.01(0.0099)
1.03b(0.0169)
1.21c(0.1349)
1.15(0.2997)
1.14(0.1228)
0.0252“(0.0023)0.0794“(0.0037)0.2457“(0 .0110)0.7244“(0.0255)0.6066“(0.0343)
1.01(0.0099)
1.03c(0.0170)
1.18°(0.1348)
1.08(0.2997)
0.80“(0.1229)
0.0168®(0.0020)0.0633“(0.0035)0.1661“(0.0098)0.3146“(0.0151)0.2257*(0.0194)
0.0129“(0.0022)0.0545“(0.0035)0.0768“(0 .0100)0.0775“(0.0124)-0.0903“(0 .0100)
Panel C: Mean Aftermarket Performance o f IPOs: Cold Markets_______________
_____________________IPO and Benchmark Returns____________________IPO Broad- Wealth Large- Wealth Mid- Wealth Small- Wealth
Aftermarket Return Market Relative Caps Relative Caps Relative Caps RelativeMonth 1 0.0054 0.0075“ L00 0.0096* L00 0.0058b L00 -0.0019 L01
(N=297) (0.0072) (0.0022) (0.0071) (0.0022) (0.0071) (0.0024) (0.0071) (0.0025) (0.0072)Month 3 0.0108 0.0097b 1.00 0.0156“ 1.00 0.0033 1.01 -0.0151“ 1.03b
(N=297) (0.0107) (0.0043) (0.0101) (0.0042) (0.0101) (0.0046) (0.0101) (0.0051) (0.0103)Month 12 0.1417“ 0.1014“ 1.04 0.1247“ 1.02 0.0716“ 1.07b -0.0040 1.15“
(N=297) (0.0369) (0.0076) (0.0349) (0.0069) (0.0350) (0.0087) (0.0349) (0.0100) (0.0355)Month 36 0.4465“ 0.5719“ 0.92c 0.6766“ 0.86“ 0.3875“ 1.04 0.1182“ 1.29“
(N=297) (0.0810) (0.0243) (0.0734) (0.0262) (0.0733) (0.0191) (0.0742) (0.0133) (0.0764)Month 60 0.7418“ 0.8412“ 0.95 1.4657“ 0.71“ 0.6701“ 1.04 0.1766“ 1.48“
(N=262) (0.1716) (0.0425) (0.1658) (0.0522) (0.1614) (0.0281) (0.1646) (0.0194) (0.1669)“’D,c denote statistical significance at the 0.01, 0.05, and 0.10 levels, respectively, based on a simple t-test.
170

Appendix B: Alternative Performance Tests Table 35: Aftermarket Performance of European IPOs -
constant sample size (381 IPOs)The sample contains 381 European IPOs between 1988 and 1995. Aftermarket returns are measured as equally-weighted buy-and-hold returns, whereas one month is defined as a consecutive 2 1 -day trading interval from the first closing price, using European trading days. The value-weighted Dow Jones STOXX size indices (Broad-Market, Large-Caps, Mid-Caps and Small-Caps), excluding UK, were used as a proxy for the market benchmark. The wealth relative is the ratio of one plus the average aftermarket period buy-and-hold IPO return, divided by one plus the average aftermarket period benchmark buy-and- hold return. For example, for the month 36 adjustment of IPO returns for the movement in the broad- market benchmark, (1 + 0.6791)/(l+0.5947) = 1.05; Standard Errors (S.E.) in parentheses.____________
_____________Panel A: Mean Aftermarket Performance o f IPOs: All Market Conditions____________
IPO and Benchmark Returns
AftermarketMonth 1
(N=381) Month 3
(N=381) Month 12
(N=381) Month 36
(N=381) Month 60
(N=381)
IPOReturn
Broad- Wealth Large- Wealth Mid- Wealth Small- WealthMarket Relative Caps Relative Caps Relative Caps Relative
0.0144°(0.0061)0.0379*(0.0094)0.1358*(0.0294)0.3266*(0.0632)0.5974*(0.1245)
0.0118*(0.0020)0.0226*(0.0035)0.0753*(0.0076)0.4184*(0.0223)0.6179“(0.0351)
1.00 (0.0061)
1.02c (0.0088)
1.06b (0.0278)
0.94 (0.0568)
0.99 (0.1204)
0.014* (0.0020) 0.027*
(0.0034) 0.093 *
(0.0072) 0.517*
(0.0237) 1.1974“
(0.0426)
1.00(0.0061)
1.01(0.0089)
1.04(0.0279)
0.87*(0.0569)
0.73*(0.1177)
0.009“(0.0020)0.017*
(0.0039)0.054*
(0.0084)0.262*
(0.0179)0.5313“(0.0228)
1.00(0.0060)
1.02b(0.0088)
1.08*(0.0277)
1.05(0.0572)
1.04(0.1193)
0.004°(0.0021)
0.006(0.0043)-0.008
(0.0093)0.019
(0.0133)0.0933“(0.0151)
1.01c (0.0061)
1.03* (0.0088)
1.15* (0.0281)
1.30* (0.0588)
1.46* (0.1209)
Panel B: Mean Aftermarket Performance o f IPOs: Hot Markets
IPO and Benchmark Returns
AftermarketIPO Broad-
Retum MarketWealthRelative
Large-Caps
WealthRelative
Mid-Caps
WealthRelative
1.02°
(0.0098)1.05*
(0.0165)1. 10*
(0.0361)1.01
(0.0619)1.04
(0 .1212)
Small-Caps
WealthRelative
Month 1 (N=119)
Month 3 (N=119)
Month 12 (N=l 19)
Month 36 (N=119)
Month 60 (N=119)
0.0363*(0.0098)0.0952*(0.0172)0.1334*(0.0393)-0.0199(0.0648)0.2795b(0.1231)
0.0207*(0.0033)0.0505*(0.0046)0.0290c(0.0165)0.0508*(0.0158)0.1264*(0.0310)
1.02(0.0101)
1.04*(0.0168)
1. 10*
(0.0365)0.93
(0.0624)1.14
(0.1228)
0.0225*(0.0035)0.0508*(0.0046)0.0327b(0.0154)0.1291“(0.0144)0.6066*(0.0343)
1.01(0.0103)
1.04*(0.0171)
1. 10*
(0.0369)0.87b
(0.0627)0.80*
(0.1229)
0.0171*(0.0032)0.0476*(0.0057)0.0313°(0.0180)-0.0276(0.0168)0.2257*(0.0194)
0.0174*(0.0030)0.0537*(0.0052)0.0033
(0.0196)-0.1993*(0.0166)-0.0903*(0.0100)
1.02°
(0.0098)1.04b
(0.0166)1.13“
(0.0363)1.22*
(0.0620)1.41*
(0.1222)
Panel C: Mean Aftermarket Performance o f IPOs: Cold Markets_______________
_____________________IPO and Benchmark Returns____________________IPO Broad- Wealth Large- Wealth Mid- Wealth Small- Wealth
Aftermarket Return Market Relative Caps Relative Caps Relative Caps RelativeMonth 1 0.0044 0.0077* L00 0.0097* 099 0.0060° L00 -0.0018 L01
(N=262) (0.0077) (0.0024) (0.0076) (0.0024) (0.0076) (0.0025) (0.0075) (0.0026) (0.0076)Month 3 0.0119 0.0099b 1.00 0.0157* 1.00 0.0034 1.01 -0.0152* 1.03*
(N=262) (0.0109) (0.0045) (0.0102) (0.0043) (0.0102) (0.0048) (0.0103) (0.0053) (0.0104)Month 12 0.1370* 0.0963* 1.04 0.1210* 1.01 0.0639* 1.07b -0.0138 1.15*
(N=262) (0.0389) (0.0078) (0.0369) (0.0072) (0.0370) (0.0090) (0.0369) (0.0101) (0.0375)Month 36 0.4840* 0.5854* 0.94 0.6932* 0.88* 0.3931* 1.07 0.1186“ 1.33*
(N=262) (0.0854) (0.0257) (0.0777) (0.0276) (0.0777) (0.0203) (0.0783) (0.0141) (0.0806)Month 60 0.7418* 0.8412* 0.95 1.4657* 0.71* 0.6701* 1.04 0.1766* 1.48*
(N=262) (0.1716) (0.0425) (0.1658) (0.0522) (0.1614) (0.0281) (0.1646) (0.0194) (0.1669)*,b,° denote statistical significance at the 0.01,0.05, and 0.10 levels, respectively, based on a simple t-test.
171

Appendix B: Alternative Performance Tests Table 36: Aftermarket Performance Categorized by Initial Return - constant sample size (686 IPOs)
Ri = a. + +The model is estimated for each of the return measurement horizons (1,3, 12, 36 and 60 months) and for different market conditions (All Market Conditions, Hot Markets and Cold Markets). Rj is the broad-market-adjusted return. Du, D2j, and D3j are (0,1) dummy variables taking the value of 1 if the IPO falls into the specified initial return category and 0 otherwise. The initial return is the percentage difference from the final offering price to the first-day closing price and divided into four categories: IPOs with initial returns of not more than 0%, IPOs with more than 0% but less than 7% initial returns, IPOs with at least 7% but less than 20% initial returns and IPOs with more than 20% initial returns; Standard Errors (S.E.) in parentheses._____________________________________________________________________________________________
Aftermarket Ri
Panel A: Aftermarket Performance o f IPOs Categorized by Initial Return: All Market Conditions
a S.E. P\ S.E. P i S.E. Pi, S.E. Total
Number of Issues
D=0 D=1 D=2 D=3Month 1 0.0069 -0.0323b (0.0132) 0.0013 (0.0176) 0.0724s (0.0179) 0.0886s (0.0188) 6 8 6 152 199 185 150Month 3 0.0290b -0.0470b (0.0219) 0 . 0 2 0 2 (0.0291) 0.1118s (0.0296) 0.1456s (0.0311) 6 8 6 152 199 185 150Month 12 0.1600b -0.0707 (0.1658) 0.2302 (0 .2 2 0 2 ) 0.3567 (0.2237) 0.2993 (0.2352) 6 8 6 152 199 185 150Month 36 0.0845 -0.3006 (0.3676) 0.6181 (0.4882) 0.2319 (0.4961) 0.6552 (0.5216) 6 8 6 152 199 185 150Month 60 -0.0205 -0.1792 (0.2375) -0.0035 (0.3140) -0.1228 (0.3341) 1.1742s (0.3779) 381 95 127 97 62
Panel B: Aftermarket Performance o f IPOs Categorized by Initial Return: Hot MarketsNumber of Issues
Aftermarket Ri a S.E. P\ S.E. P i S.E. Pi S.E. Total D=0 D=1 D=2 D=3Month 1 0.0138 -0.0336s (0.0239) -0.0073d (0.0314) 0.0781s (0.0297) 0.0831s (0.0297) 389 64 8 8 119 118Month 3 0.0360b -0.0468 (0.0412) 0.0179 (0.0541) 0.1166b (0.0511) 0.1420s (0.0512) 389 64 8 8 119 118Month 12 0.2514c -0.1664 (0.3328) 0.6430 (0.4373) 0.5374 (0.4126) 0.3561 (0.4133) 389 64 8 8 119 118Month 36 0.2448 -0.5121 (0.7391) 1.5288 (0.9714) 0.5059 (0.9166) 0.8449 (0.9179) 389 64 8 8 119 118Month 60 0.1531 0.1761 (0.2912) 0.0266 (0.4028) -0.3238 (0.3597) 0.2747 (0.3684) 119 2 1 23 40 35
Panel C: Aftermarket Performance of IPOs Categorized by Initial Return: Cold MarketsNumber of Issues
Aftermarket Ri a S.E. P\ S.E. P i S.E. Pi S.E. Total D=0 D=1 D=2 D=3Month 1 -0 . 0 0 2 1 -0.0314D (0.0125) 0.0082 (0.1670) 0.0634s (0.0191) 0.1127s (0.0242) 297 8 8 1 1 1 6 6 32Month 3 0 . 0 0 1 1 -0.0471s (0.0177) 0 . 0 2 2 1 (0.0236) 0.1030s (0.0270) 0.1584s (0.0342) 297 8 8 1 1 1 6 6 32Month 12 0.0403 -0 . 0 0 1 0 (0.0627) -0.0746 (0.0839) 0.1339 (0.0957) 0.3737s (0.1214) 297 8 8 1 1 1 6 6 32Month 36 -0.1254° -0.1468 (0.1339) -0.0900 (0.1792) -0.0346 (0.2045) 0.5819b (0.2592) 297 8 8 1 1 1 6 6 32Month 60 -0.0994 -0.2800 (0.3055) 0 . 0 1 2 1 (0.3997) -0.1302 (0.4632) 1.9807s (0.5909) 262 74 104 57 27
* ° denote statistical significance at the 0.01,0.05, and 0.10 levels, respectively, based on a simple t-test.
172

Appendix B: Alternative Performance Tests Table 37: Aftermarket Performance Categorized by Age - constant sample size (686 IPOs)
Ri = a + /?iDu + /?2D2i+ EjThe model is estimated for each of the return measurement horizons (1,3, 12, 36 and 60 months) and for different market conditions (All Market Conditions, Hot Markets and Cold Markets). R, is the broad-market-adjusted return. Dn and D2j are (0,1) dummy variables taking the value of 1 if the IPO falls into the specified age category and 0 otherwise. Age is defined as the year of going public minus the year of foundation, with firms founded before 1901 assumed to be founded in 1901. Observations of company age are divided into three categories: IPOs with age between 0-14 years (young firms), 15-36 years (medium-young firms) and IPOs older than 37 years (old firms); Standard Errors (S.E.) in parentheses.____________________________________________________________________________________________________________________
Panel A: Aftermarket Performance o f IPOs Categorized by Initial Return: All Market ConditionsNumber of Issues
Aftermarket Ri a S.E. A S.E. A S.E. Total D=0 D=1 D=2Month 1 0.0069 0.0220b (0.0103) -0.0085 (0.0155) -0.0399* (0.0154) 686 262 210 214Month 3 0.0290b 0.0661* (0.0169) -0.0573b (0.0254) -0.0887* (0.0253) 686 262 210 214Month 12 0.1600b 0.4254" (0.1258) -0.3845b (0.1885) -0.4722b (0.1876) 686 262 210 214Month 36 0.0845 0.5794b (0.2792) -0.7318° (0.4186) -0.8684b (0.4164) 686 262 210 214Month 60 -0.0205 0.0404 (0.2110) 0.1410 (0.3100) -0.2554 (0.2852) 381 124 107 150
Panel B: Aftermarket Performance o f IPOs Categorized by Initial Return: Hot MarketsNumber of Issues
Aftermarket Ri a S.E. A S.E. P i S.E. Total D=0 D=1 D=2Month 1 0.0138 0.0360b (0.0153) -0.0250 (0.0231) -0.0537D (0.0246) 389 161 126 102Month 3 0.0360b 0.1057" (0.0259) -0.1152* (0.0392) -0.1236* (0.0417) 389 161 126 102Month 12 0.2514° 0.6582* (0.2085) -0.6894b (0.3146) -0.6998b (0.3347) 389 161 126 102Month 36 0.2448 1.1135b (0.4635) -1.4614b (0.6995) -1.5079b (0.7443) 389 161 126 102Month 60 0.1531 0.2806 (0.2312) -0.1643 (0.3224) -0.1889 (0.3009) 119 34 36 49
Panel C: Aftermarket Performance o f IPOs Categorized by Initial Return: Cold MarketsNumber of Issues
Aftermarket Ri a S.E. A S.E. P i S.E. Total D=0 D=1 D=2Month 1 -0.0021 -0.0003 (0.0122) 0.0175 (0.0180) -0.0179 (0.0168) 297 101 84 112Month 3 0.0011 0.0029 (0.0171) 0.0333 (0.0254) -0.0298 (0.0236) 297 101 84 112Month 12 0.0403 0.0542 (0.0595) 0.0947 (0.0883) -0.1058 (0.0820) 297 101 84 112Month 36 -0.1254° -0.2720b (0.1251) 0.4129b (0.1857) 0.0791 (0.1726) 297 101 84 112Month 60 -0.0994 -0.0503 (0.2830) 0.2647 (0.4261) -0.3134 (0.3891) 262 90 71 101
“• ° denote statistical significance at the 0.01,0.05, and 0.10 levels, respectively, based on a simple t-test
173

Appendix B: Alternative Performance Tests Table 38: Aftermarket Performance Categorized by Size - constant sample size (686 IPOs)
R, = a + /?iDii + /?2D2i+ EjThe model is estimated for each o f the return measurement horizons (1 ,3 , 12, 36 and 60 months) and for different market conditions (All Market Conditions, Hot Markets and Cold Markets). R, is the broad-market-adjusted return. Du, and D2i, are (0,1) dummy variables taking the value o f 1 if the IPO falls into the specified size category and 0 otherwise. Size/Market Capitalization in €m is the number of shares issued times the final offer price and is expressed in constant end-1998 prices. Observations for size are divided into three categories: Firms with a first day market capitalization less than €100m (small firms), between €100 and €500m (medium firms) and exceeding €500m (large firms); Standard Errors (S.E.) in parentheses.____________________________________________________________________________________________________________
Panel A: Aftermarket Performance o f IPOs Categorized by Initial Return: All Market ConditionsNumber o f Issues
Aftermarket Ri a S.E. A S.E. A S.E. D=0 D=1 D=2 D=3Month 1 0.0069 0.0344® (0.0107) -0.0467® (0.0145) -0.0341' (0.0172) 686 242 290 154Month 3 0.0290b 0.0660® (0.0176) -0.0799® (0.0239) -0.0503' (0.0283) 686 242 290 154Month 12 0.1600b 0.3112b (0.1312) -0.3113' (0.1778) -0.0857 (0.2105) 686 242 290 154Month 36 0.0845 0.4670 (0.2910) -0.5975 (0.3942) -0.5786 (0.4667) 686 242 290 154Month 60 -0.0205 0.2566 (0.2135) -0.6038b (0.2813) -0.0731 (0.3184) 381 120 163 98
Panel B: Aftermarket Performance o f IPOs Categorized by Initial Return: Hot MarketsNumber o f Issues
Aftermarket Ri a S.E. A S.E. A S.E. D=0 D=1 D=2 D=3Month 1 0.0138 0.0427® (0.0159) -0.0477b (0.0221) -0.0451' (0.0272) 389 149 162 78Month 3 0.0360b 0.0896® (0.0272) -0.0943b (0.0376) -0.0713 (0.0463) 389 149 162 78Month 12 0.2514' 0.4238' (0.2179) -0.4127 (0.3019) -0.0023 (0.3717) 389 149 162 78Month 36 0.2448 0.6823 (0.4847) -0.6444 (0.6715) -0.8436 (0.8268) 389 149 162 78Month 60 0.1531 0.4713b (0.2162) -0.4704' (0.2844) -0.4622 (0.3286) 119 38 52 29
Panel C: Aftermarket Performance of IPOs Categorized by Initial Return: Cold MarketsNumber o f Issues
Aftermarket Ri a S.E. A S.E. P i S.E. D=0 D=1 D=2 D=3Month 1 -0.0021 0.0209' (0.0126) -0.0427® (0.0166) -0.0179 (0.0188) 297 93 128 76Month 3 0.0011 0.0281 (0.0179) -0.0537b (0.0235) -0.0151 (0.0266) 297 93 128 76Month 12 0.0403 0.1308b (0.0622) -0.1449' (0.0818) -0.1064 (0.0928) 297 93 128 76Month 36 -0.1254' 0.1220 (0.1299) -0.4658“ (0.1707) -0.1825 (0.1937) 297 93 128 76Month 60 -0.0994 0.1571 (0.2950) -0.6674' (0.3889) 0.0996 (0.4363) 262 82 111 69
*’ 'denote statistical significance at the 0.01,0.05, and 0.10 levels, respectively, based on a simple t-test.
174
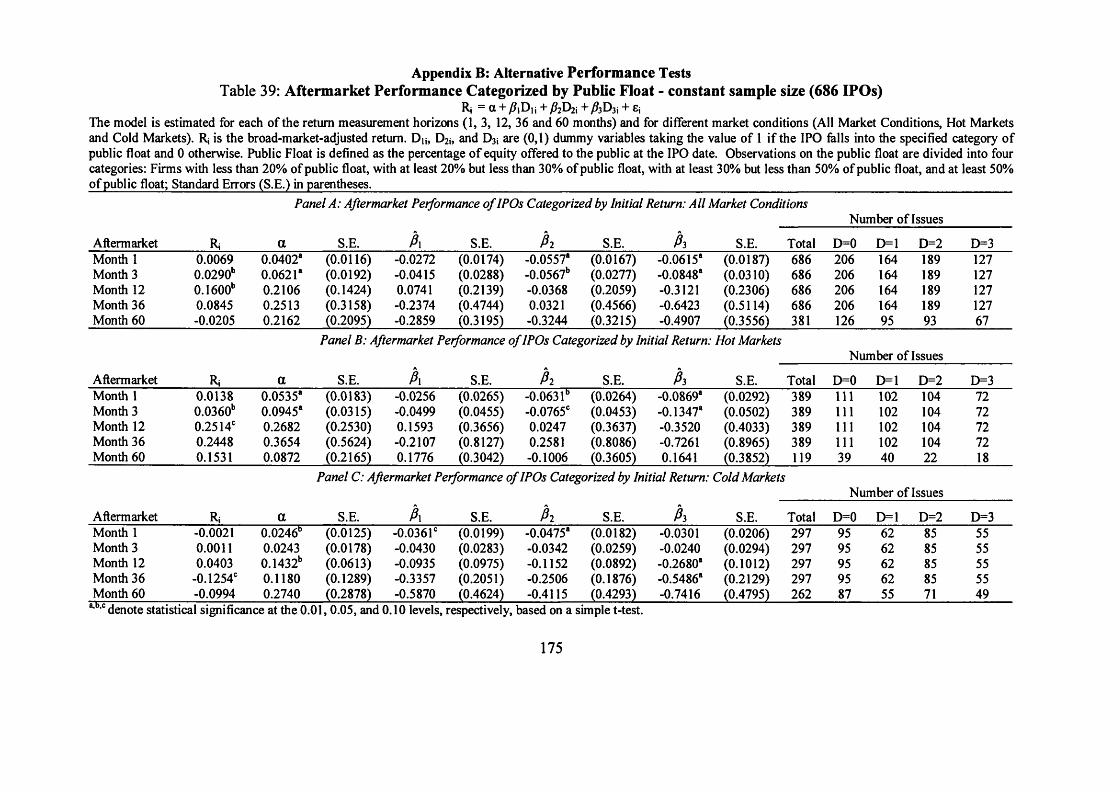
Appendix B: Alternative Performance Tests Table 39: Aftermarket Performance Categorized by Public Float - constant sample size (686 IPOs)
R , = a + / ? i D i i + /? 2 D 2 i+ /?3E>3i + e i
The model is estimated for each of the return measurement horizons (1 ,3 , 12, 36 and 60 months) and for different market conditions (All Market Conditions, Hot Markets and Cold Markets). R, is the broad-market-adjusted return. Du, D2j, and D3j are (0,1) dummy variables taking the value of 1 if the IPO falls into the specified category of public float and 0 otherwise. Public Float is defined as the percentage of equity offered to the public at the IPO date. Observations on the public float are divided into four categories: Firms with less than 20% of public float, with at least 20% but less than 30% of public float, with at least 30% but less than 50% of public float, and at least 50% of public float; Standard Errors (S.E.) in parentheses.________________________________________________________________________________________________
Panel A: Aftermarket Performance o f IPOs Categorized by Initial Return: All Market ConditionsNumber of Issues
Aftermarket Ri a S.E. A S.E. A S.E. A S.E. Total D=0 D=1 D=2 D=3Month 1 0.0069 0.0402s (0.0116) -0.0272 (0.0174) -0.0557s (0.0167) -0.0615s (0.0187) 686 206 164 189 127Month 3 0.0290b 0.0621s (0.0192) -0.0415 (0.0288) -0.0567b (0.0277) -0.0848s (0.0310) 686 206 164 189 127Month 12 0.1600b 0.2106 (0.1424) 0.0741 (0.2139) -0.0368 (0.2059) -0.3121 (0.2306) 686 206 164 189 127Month 36 0.0845 0.2513 (0.3158) -0.2374 (0.4744) 0.0321 (0.4566) -0.6423 (0.5114) 686 206 164 189 127Month 60 -0.0205 0.2162 (0.2095) -0.2859 (0.3195) -0.3244 (0.3215) -0.4907 (0.3556) 381 126 95 93 67
Panel B: Aftermarket Performance o f IPOs Categorized by Initial Return: Hot MarketsNumber of Issues
Aftermarket Ri a S.E. A S.E. A S.E. A S.E. Total D=0 D=1 D=2 D=3Month 1 0.0138 0.0535s (0.0183) -0.0256 (0.0265) -0.0631D (0.0264) -0.0869s (0.0292) 389 111 102 104 72Month 3 0.0360b 0.0945s (0.0315) -0.0499 (0.0455) -0.0765c (0.0453) -0.1347s (0.0502) 389 111 102 104 72Month 12 0.2514c 0.2682 (0.2530) 0.1593 (0.3656) 0.0247 (0.3637) -0.3520 (0.4033) 389 111 102 104 72Month 36 0.2448 0.3654 (0.5624) -0.2107 (0.8127) 0.2581 (0.8086) -0.7261 (0.8965) 389 111 102 104 72Month 60 0.1531 0.0872 (0.2165) 0.1776 (0.3042) -0.1006 (0.3605) 0.1641 (0.3852) 119 39 40 22 18
Panel C: Aftermarket Performance of IPOs Categorized by Initial Return: Cold MarketsNumber of Issues
Aftermarket Ri a S.E. A S.E. A S.E. A S.E. Total D=0 D=1 D=2 D=3Month 1 -0.0021 0.0246b (0.0125) -0.0361° (0.0199) -0.0475s (0.0182) -0.0301 (0.0206) 297 95 62 85 55Month 3 0.0011 0.0243 (0.0178) -0.0430 (0.0283) -0.0342 (0.0259) -0.0240 (0.0294) 297 95 62 85 55Month 12 0.0403 0.1432b (0.0613) -0.0935 (0.0975) -0.1152 (0.0892) -0.2680s (0.1012) 297 95 62 85 55Month 36 -0.1254° 0.1180 (0.1289) -0.3357 (0.2051) -0.2506 (0.1876) -0.5486s (0.2129) 297 95 62 85 55Month 60 -0.0994 0.2740 (0.2878) -0.5870 (0.4624) -0.4115 (0.4293) -0.7416 (0.4795) 262 87 55 71 49
“■° denote statistical significance at the 0.01, 0.05, and 0.10 levels, respectively, based on a simple t-test.
175
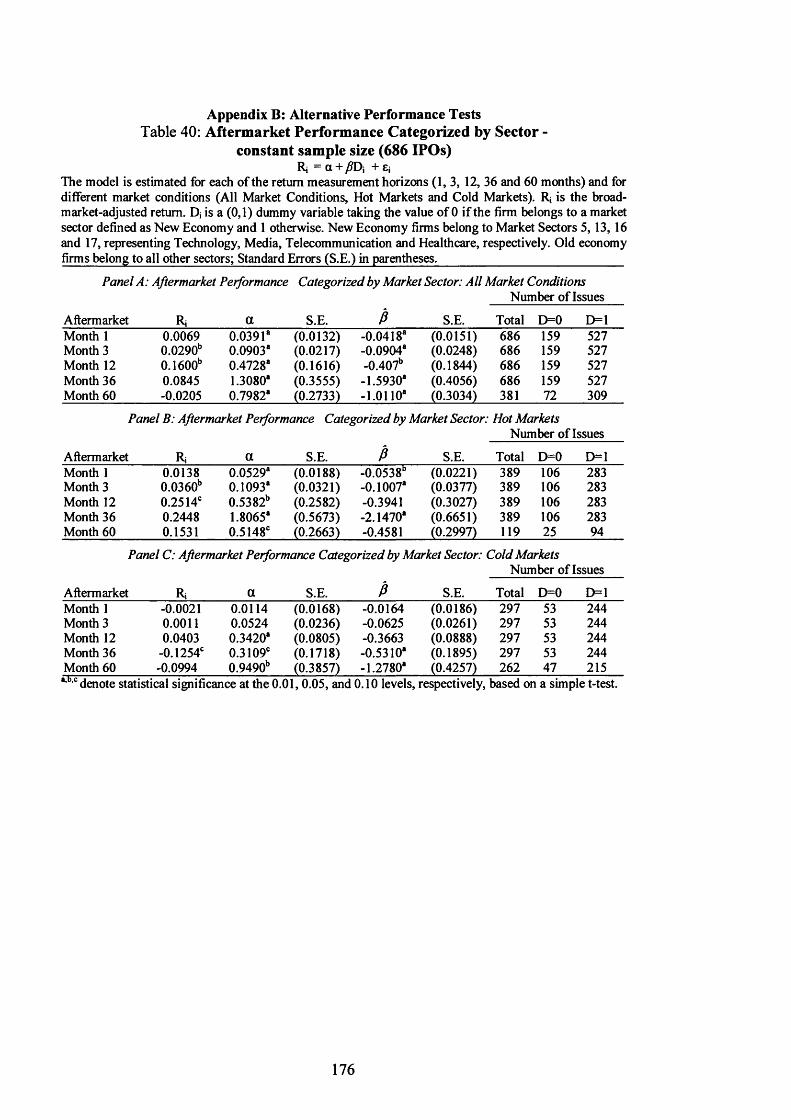
Appendix B: Alternative Performance Tests Table 40: Aftermarket Performance Categorized by Sector -
constant sample size (686 IPOs)R i = a + pD\ + £j
The model is estimated for each of the return measurement horizons (1,3, 12, 36 and 60 months) and for different market conditions (All Market Conditions, Hot Markets and Cold Markets). Rj is the broad- market-adjusted return. Dj is a (0 ,1) dummy variable taking the value of 0 if the firm belongs to a market sector defined as New Economy and 1 otherwise. New Economy firms belong to Market Sectors 5, 13, 16 and 17, representing Technology, Media, Telecommunication and Healthcare, respectively. Old economy firms belong to all other sectors; Standard Errors (S.E.) in parentheses.____________________________
Panel A: Aftermarket Performance Categorized by Market Sector: A11 Market ConditionsNumber of Issues
Aftermarket Ri a S.E. P S.E. Total D=0 D=1Month 1 0.0069 0.0391“ (0.0132) -0.0418“ (0.0151) 6 8 6 159 527Month 3 0.0290b 0.0903“ (0.0217) -0.09048 (0.0248) 6 8 6 159 527Month 12 0.1600b 0.4728“ (0.1616) -0.407b (0.1844) 6 8 6 159 527Month 36 0.0845 1.30808 (0.3555) -1.5930“ (0.4056) 6 8 6 159 527Month 60 -0.0205 0.79828 (0.2733) - 1 .0 1 1 0 “ (0.3034) 381 72 309
Panel B: Aftermarket Performance Categorized by Market Sector: Hot MarketsNumber of Issues
Aftermarket Ri a S.E. P S.E. Total D=0 D=1Month 1 0.0138 0.0529“ (0.0188) -0.0538b (0 .0 2 2 1 ) 389 106 283Month 3 0.0360b 0.1093“ (0.0321) -0.1007“ (0.0377) 389 106 283Month 12 0.2514c 0.5382b (0.2582) -0.3941 (0.3027) 389 106 283Month 36 0.2448 1.8065“ (0.5673) -2.1470“ (0.6651) 389 106 283Month 60 0.1531 0.5148c (0.2663) -0.4581 (0.2997) 119 25 94
Panel C: Aftermarket Performance Categorized by Market Sector: Cold MarketsNumber of Issues
Aftermarket Ri a S.E. P S.E. Total D=0 D=1Month 1 -0 . 0 0 2 1 0.0114 (0.0168) -0.0164 (0.0186) 297 53 244Month 3 0 . 0 0 1 1 0.0524 (0.0236) -0.0625 (0.0261) 297 53 244Month 12 0.0403 0.3420“ (0.0805) -0.3663 (0.0888) 297 53 244Month 36 -0.1254c 0.3109° (0.1718) -0.5310“ (0.1895) 297 53 244Month 60 -0.0994 0.9490b (0.3857) -1.2780“ (0.4257) 262 47 215a,b,c denote statistical significance at the 0.01,0.05, and 0.10 levels, respectively, based on a simple t-test.
176
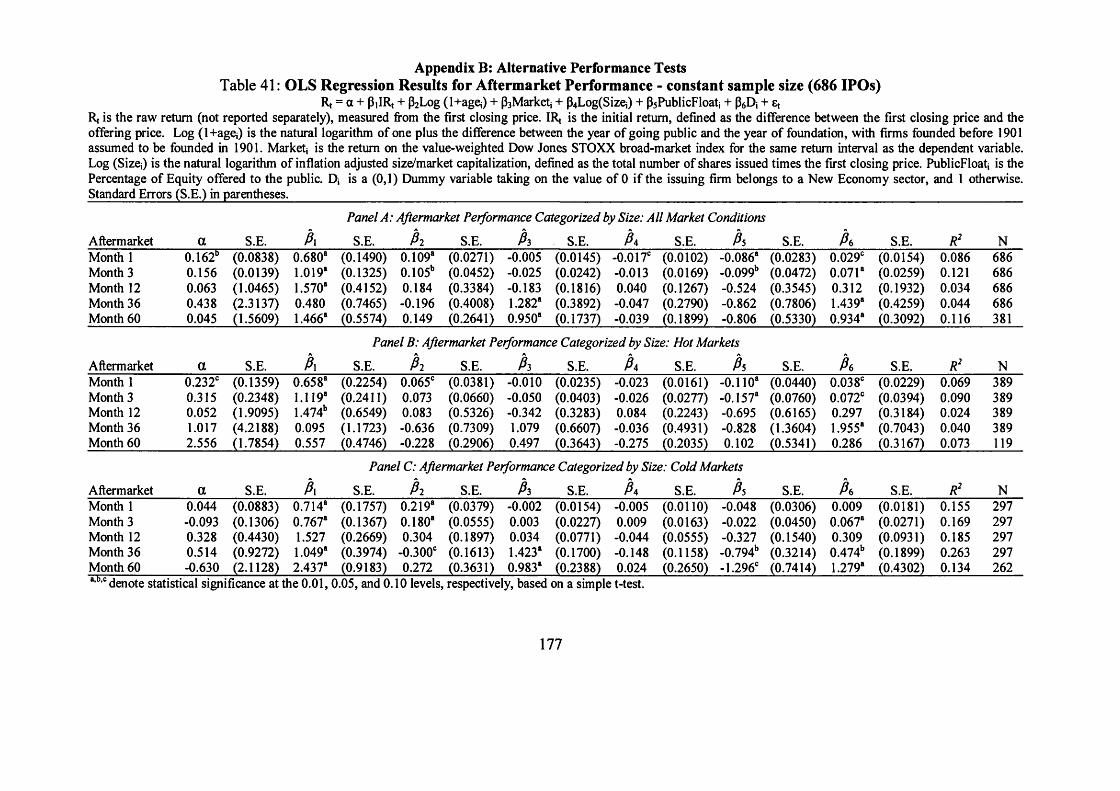
Appendix B: Alternative Performance Tests Table 41: OLS Regression Results for Aftermarket Performance - constant sample size (686 IPOs)
Rt = a + PiIRt + p2Log (1+ageO + p3Marketj + p4Log(Sizej) + p5PublicFloatj + p6Dj + et Rt is the raw return (not reported separately), measured from the first closing price. IR» is the initial return, defined as the difference between the first closing price and the offering price. Log (1+agej) is the natural logarithm of one plus the difference between the year of going public and the year of foundation, with firms founded before 1901 assumed to be founded in 1901. Market* is the return on the value-weighted Dow Jones STOXX broad-market index for the same return interval as the dependent variable. Log (Size*) is the natural logarithm of inflation adjusted size/market capitalization, defined as the total number of shares issued times the first closing price. PublicFloat* is the Percentage of Equity offered to the public. D* is a (0,1) Dummy variable taking on the value of 0 if the issuing firm belongs to a New Economy sector, and 1 otherwise. Standard Errors (S.E.) in parentheses.______________________________________________________________________________________________________________
Panel A: Aftermarket Performance Categorized by Size: All Market Conditions
Aftermarket a S.E. A S.E. A S.E. A S.E. A S.E. A S.E. A S.E. R2 NMonth 1 0.162b (0.0838) 0.680“ (0.1490) 0.109“ (0.0271) -0.005 (0.0145) -0.017° (0 .0 1 0 2 ) -0.086“ (0.0283) 0.029° (0.0154) 0.086 6 8 6
Month 3 0.156 (0.0139) 1.019“ (0.1325) 0.105b (0.0452) -0.025 (0.0242) -0.013 (0.0169) -0.099b (0.0472) 0.071“ (0.0259) 0 . 1 2 1 6 8 6
Month 12 0.063 (1.0465) 1.570“ (0.4152) 0.184 (0.3384) -0.183 (0.1816) 0.040 (0.1267) -0.524 (0.3545) 0.312 (0.1932) 0.034 6 8 6
Month 36 0.438 (2.3137) 0.480 (0.7465) -0.196 (0.4008) 1.282“ (0.3892) -0.047 (0.2790) -0.862 (0.7806) 1.439“ (0.4259) 0.044 6 8 6
Month 60 0.045 (1.5609) 1.466“ (0.5574) 0.149 (0.2641) 0.950“ (0.1737) -0.039 (0.1899) -0.806 (0.5330) 0.934“ (0.3092) 0.116 381
Panel B: Aftermarket Performance Categorized by Size: Hot Markets
Aftermarket a S.E. A S.E. A S.E. A S.E. A S.E. A S.E. A S.E. R2 NMonth 1 0.232° (0.1359) 0.658“ (0.2254) 0.065° (0.0381) -0 . 0 1 0 (0.0235) -0.023 (0.0161) -0 .1 1 0 “ (0.0440) 0.038° (0.0229) 0.069 389Month 3 0.315 (0.2348) 1.119“ (0.2411) 0.073 (0.0660) -0.050 (0.0403) -0.026 (0.0277) -0.157“ (0.0760) 0.072° (0.0394) 0.090 389Month 12 0.052 (1.9095) 1.474b (0.6549) 0.083 (0.5326) -0.342 (0.3283) 0.084 (0.2243) -0.695 (0.6165) 0.297 (0.3184) 0.024 389Month 36 1.017 (4.2188) 0.095 (1.1723) -0.636 (0.7309) 1.079 (0.6607) -0.036 (0.4931) -0.828 (1.3604) 1.955“ (0.7043) 0.040 389Month 60 2.556 (1.7854) 0.557 (0.4746) -0.228 (0.2906) 0.497 (0.3643) -0.275 (0.2035) 0.102 (0.5341) 0.286 (0.3167) 0.073 119
Panel C: Aftermarket Performance Categorized by Size: Cold Markets
Aftermarket a S.E. A S.E. A S.E. A S.E. A S.E. A S.E. A S.E. R2 NMonth 1 0.044 (0.0883) 0.714“ (0.1757) 0.219“ (0.0379) -0 . 0 0 2 (0.0154) -0.005 (0.0110) -0.048 (0.0306) 0.009 (0.0181) 0.155 297Month 3 -0.093 (0.1306) 0.767“ (0.1367) 0.180“ (0.0555) 0.003 (0.0227) 0.009 (0.0163) -0.022 (0.0450) 0.067“ (0.0271) 0.169 297Month 12 0.328 (0.4430) 1.527 (0.2669) 0.304 (0.1897) 0.034 (0.0771) -0.044 (0.0555) -0.327 (0.1540) 0.309 (0.0931) 0.185 297Month 36 0.514 (0.9272) 1.049“ (0.3974) -0.300° (0.1613) 1.423“ (0.1700) -0.148 (0.1158) -0.794b (0.3214) 0.474b (0.1899) 0.263 297Month 60 -0.630 (2.1128) 2.437“ (0.9183) 0.272 (0.3631) 0.983“ (0.2388) 0.024 (0.2650) -1.296° (0.7414) 1.279“ (0.4302) 0.134 262a’b’c denote statistical significance at the 0.01, 0.05, and 0.10 levels, respectively, based on a simple t-test.
177

Appendix B: Alternative Performance Tests Table 42: Aftermarket Performance Categorized by Initial Return - constant sample size (381 IPOs)
R i = a + / ? | D i i + / ? 2 D 2 i + /?3D 3i + e i
The model is estimated for each of the return measurement horizons (1, 3, 12, 36 and 60 months) and for different market conditions (All Market Conditions, Hot Markets and Cold Markets). R* is the broad-market-adjusted return. Du, D2i, and D3j are (0,1) dummy variables taking the value of 1 if the IPO falls into the specified initial return category and 0 otherwise. The initial return is the percentage difference from the final offering price to the first-day closing price and divided into four categories: IPOs with initial returns of not more than 0%, IPOs with more than 0% but less than 7% initial returns, IPOs with at least 7% but less than 20% initial returns and IPOs with more than 20% initial returns; Standard Errors (S.E.) in parentheses._____________________________________________________________________________________________
Aftermarket Ri
Panel A: Aftermarket Performance o f IPOs Categorized by Initial Return: All Market Conditions
a S.E. Pi S.E. P i S.E. P i S.E. Total
Number of Issues
D=0 D=1 D=2 D=3Month 1 0.0026 -0.0252b (0.0118) 0.0047 (0.0156) 0.0471* (0.0166) 0.0873“ (0.0187) 381 95 127 97 62Month 3 0.0154° -0.0303° (0.0170) 0.0110 (0.0224) 0.0806* (0.0239) 0.1319“ (0.0270) 381 95 127 97 62Month 12 0.0606b 0.0408 (0.0550) -0.0825 (0.0727) 0.0520 (0.0774) 0.2089b (0.0875) 381 95 127 97 62Month 36 -0.0918 -0.0574 (0.1171) -0.1165 (0.1548) -0.1320 (0.1648) 0.2814 (0.1864) 381 95 127 97 62Month 60 -0.0205 -0.1792 (0.2375) -0.0035 (0.3140) -0.1228 (0.3341) 1.1742* (0.3779) 381 95 127 97 62
Panel B: Aftermarket Performance o f IPOs Categorized by Initial Return: Hot MarketsNumber of Issues
Aftermarket Ri a S.E. P\ S.E. P i S.E. Pi S.E. Total D=0 D=1 D=2 D=3Month 1 0.0156 -0.0117 (0.0237) -0.0063 (0.0328) 0.0297 (0.0293) 0.06216 (0.0300) 119 21 23 40 35Month 3 0.0448* -0.0021 (0.0396) 0.0069 (0.0548) 0.0444 (0.0489) 0.1042b (0.0501) 119 21 23 40 35Month 12 0.1044* 0.0410 (0.0877) 0.0918 (0.1214) 0.0513 (0.1083) 0.0966 (0.1110) 119 21 23 40 35Month 36 -0.0707 0.0171 (0.1487) 0.0683 (0.2057) -0.2038 (0.1836) -0.1105 (0.1881) 119 21 23 40 35Month 60 0.1531 0.1761 (0.2912) 0.0266 (0.4028) -0.3238 (0.3597) 0.2747 (0.3684) 119 21 23 40 35
Panel C: Aftermarket Performance of IPOs Categorized by Initial Return: Cold MarketsNumber of Issues
Aftermarket Ri a S.E. P\ S.E. P i S.E. Pi S.E. Total D=0 D=1 D=2 D=3Month 1 -0.0033 -0.0291b (0.0137) 0.0079 (0.0179) 0.0536* (0.0208) 0.1063* (0.0265) 262 74 104 57 27Month 3 0.0020 -0.0383b (0.0184) 0.0137 (0.0241) 0.0942* (0.0279) 0.1393* (0.0356) 262 74 104 57 27Month 12 0.0407 0.0408 (0.0678) -0.1210 (0.0888) 0.0525 (0.1028) 0.3544* (0.1312) 262 74 104 57 27Month 36 -0.1014 -0.0785 (0.1497) -0.1527 (0.1958) -0.1127 (0.2269) 0.7140b (0.2895) 262 74 104 57 27Month 60 -0.0994 -0.2800 (0.3055) 0.0121 (0.3997) -0.1302 (0.4632) 1.9807* (0.5909) 262 74 104 57 27
** ’° denote statistical significance at the 0.01,0.05, and 0.10 levels, respectively, based on a simple t-test.
178

Appendix B: Alternative Performance Tests Table 43: Aftermarket Performance Categorized by Age - constant sample size (381 IPOs)
R, = a + + /?2D2i+ EjThe model is estimated for each of the return measurement horizons (1, 3, 12, 36 and 60 months) and for different market conditions (All Market Conditions, Hot Markets and Cold Markets). R< is the broad-market-adjusted return. Du and D2i are (0,1) dummy variables taking the value of 1 if the IPO falls into the specified age category and 0 otherwise. Age is defined as the year of going public minus the year of foundation, with firms founded before 1901 assumed to be founded in 1901. Observations of company age are divided into three categories: IPOs with age between 0-14 years (young firms), 15-36 years (medium-young firms) and IPOs older than 37 years (old firms); Standard Errors (S.E.) in parentheses.____________________________________________________________________________________________________________________
Panel A: Aftermarket Performance o f IPOs Categorized by Initial Return: All Market ConditionsNumber of Issues
Aftermarket Ri a S.E. fix S.E. P i S.E. Total D=0 D=1 D=2Month 1 0.0026 0.0071° (0.0106) 0.00906 (0.0156) -0.0180 (0.0144) 381 124 107 150Month 3 0.0154° 0.0171 (0.0154) 0.0174 (0.2270) -0.0168 (0.0208) 381 124 107 150Month 12 0.0606b 0.0616 (0.0486) 0.0777 (0.0715) -0.0580 (0.0657) 381 124 107 150Month 36 -0.0918 -0 . 2 0 1 2 (0.1024) 0.3494 (0.1504) 0.0483 (0.1384) 381 124 107 150Month 60 -0.0205 0.0404 (0 .2 1 1 0 ) 0.1410 (0.3100) -0.2554 (0.2852) 381 124 107 150
Panel B: Aftermarket Performance o f IPOs Categorized by Initial Return: Hot MarketsNumber of Issues
Aftermarket Ri a S.E. Pi S.E. P i S.E. Total D=0 D=1 D=2Month 1 0.0156 0.0355° (0.0190) -0.0225 (0.0265) -0.0325 (0.0247) 119 34 36 49Month 3 0.0448* 0.0849* (0.0314) -0.0781° (0.0437) -0.0399 (0.0408) 119 34 36 49Month 12 0.1044* 0.1795“ (0.0684) -0.1294 (0.0953) -0.0875 (0.0890) 119 34 36 49Month 36 -0.0707 -0.0025 (0.1175) -0.0882 (0.1638) -0.1008 (0.1529) 119 34 36 49Month 60 0.1531 0.2806 (0.2312) -0.1643 (0.3224) -0.1889 (0.3009) 119 34 36 49
Aftermarket Ri
Panel C: Aftermarket Performance of IPOs Categorized by Initial Return: Cold MarketsNumber of Issues
a S.E. fix S.E. P i S.E. Total D=0 D=1 D=2Month 1 -0.0033 -0.0037 (0.0128) 0.0213 (0.0193) -0.0140 (0.0177) 262 90 71 191Month 3 0 . 0 0 2 0 -0.0090 (0.0172) 0.0571b (0.0259) -0.0130 (0.0236) 262 90 71 191Month 12 0.0407 0.0171 (0.0624) 0.1674° (0.0940) -0.0564 (0.0858) 262 90 71 191Month 36 -0.1014 -0.2762b (0.1361) 0.5456* (0.2049) 0.0994 (0.1871) 262 90 71 191Month 60 -0.0994 -0.0503 (0.2830) 0.2647 (0.4261) -0.3134 (0.3891) 262 90 71 10 1
*•° denote statistical significance at the 0.01,0.05, and 0.10 levels, respectively, based on a simple t-test.
179
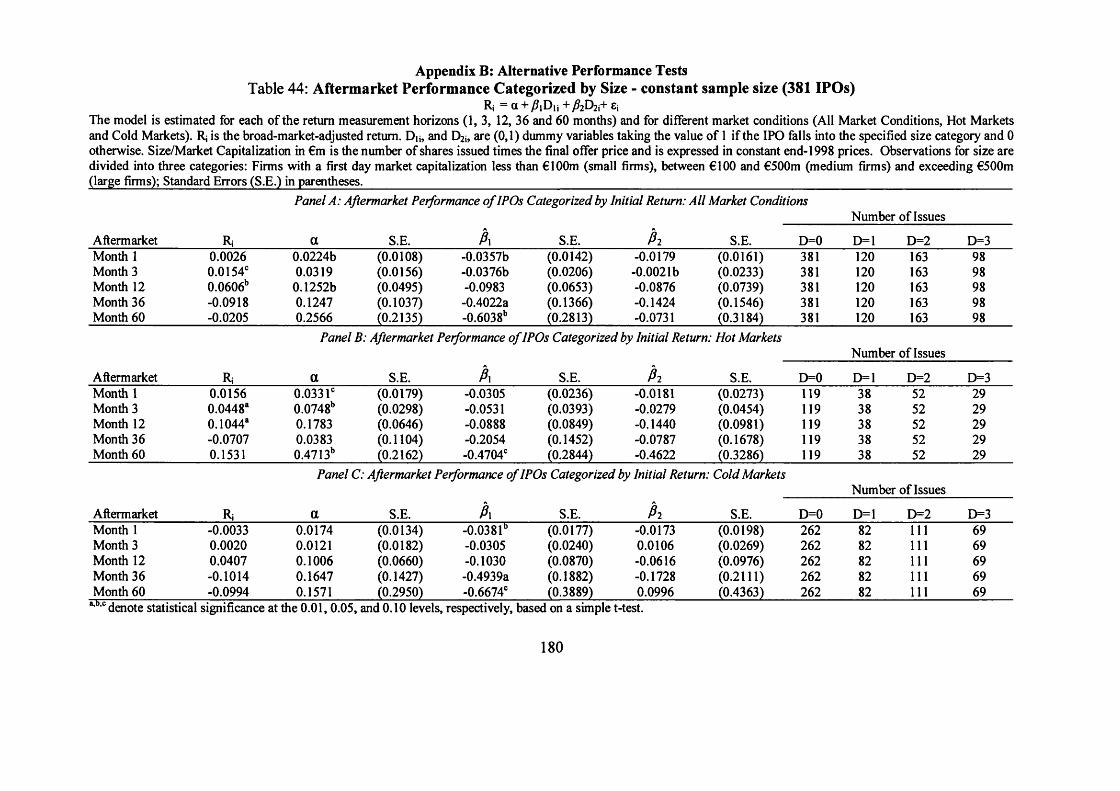
Appendix B: Alternative Performance Tests Table 44: Aftermarket Performance Categorized by Size - constant sample size (381 IPOs)
Ri = a + /?iDij +/?2D2i+ £jThe model is estimated for each of the return measurement horizons (1, 3, 12, 36 and 60 months) and for different market conditions (All Market Conditions, Hot Markets and Cold Markets). R* is the broad-market-adjusted return. Du, and D2i, are (0,1) dummy variables taking the value of 1 if the IPO falls into the specified size category and 0 otherwise. Size/Market Capitalization in €m is the number of shares issued times the final offer price and is expressed in constant end-1998 prices. Observations for size are divided into three categories: Firms with a first day market capitalization less than €100m (small firms), between €100 and €500m (medium firms) and exceeding €500m (large firms); Standard Errors (S.E.) in parentheses._________________________________________________________________________________________________
Panel A: Aftermarket Performance o f IPOs Categorized by Initial Return: All Market ConditionsNumber of Issues
Aftermarket Ri a S.E. A S.E. A S.E. D=0 D=1 D=2 D=3Month 1 0.0026 0.0224b (0.0108) -0.0357b (0.0142) -0.0179 (0.0161) 381 1 2 0 163 98Month 3 0.0154® 0.0319 (0.0156) -0.0376b (0.0206) -0 .0 0 2 1 b (0.0233) 381 1 2 0 163 98Month 12 0.0606b 0.1252b (0.0495) -0.0983 (0.0653) -0.0876 (0.0739) 381 1 2 0 163 98Month 36 -0.0918 0.1247 (0.1037) -0.4022a (0.1366) -0.1424 (0.1546) 381 1 2 0 163 98Month 60 -0.0205 0.2566 (0.2135) -0.6038b (0.2813) -0.0731 (0.3184) 381 1 2 0 163 98
Panel B: Aftermarket Performance o f IPOs Categorized by Initial Return: Hot MarketsNumber of Issues
Aftermarket Ri a S.E. A S.E. P i S.E. D=0 D=1 D=2 D=3Month 1 0.0156 0.0331® (0.0179) -0.0305 (0.0236) -0.0181 (0.0273) 119 38 52 29Month 3 0.04488 0.0748b (0.0298) -0.0531 (0.0393) -0.0279 (0.0454) 119 38 52 29Month 12 0.10448 0.1783 (0.0646) -0.0888 (0.0849) -0.1440 (0.0981) 119 38 52 29Month 36 -0.0707 0.0383 (0.1104) -0.2054 (0.1452) -0.0787 (0.1678) 119 38 52 29Month 60 0.1531 0.4713b (0.2162) -0.4704® (0.2844) -0.4622 (0.3286) 119 38 52 29
Panel C: Aftermarket Performance o f IPOs Categorized by Initial Return: Cold MarketsNumber of Issues
Aftermarket Ri a S.E. A S.E. P i S.E. D=0 D=1 D=2 D=3Month 1 -0.0033 0.0174 (0.0134) -0.038l b (0.0177) -0.0173 (0.0198) 262 82 11 1 69Month 3 0 . 0 0 2 0 0 . 0 1 2 1 (0.0182) -0.0305 (0.0240) 0.0106 (0.0269) 262 82 1 1 1 69Month 12 0.0407 0.1006 (0.0660) -0.1030 (0.0870) -0.0616 (0.0976) 262 82 1 1 1 69Month 36 -0.1014 0.1647 (0.1427) -0.4939a (0.1882) -0.1728 (0 .2 1 1 1 ) 262 82 1 1 1 69Month 60 -0.0994 0.1571 (0.2950) -0.6674® (0.3889) 0.0996 (0.4363) 262 82 1 1 1 69
* ® denote statistical significance at the 0.01,0.05, and 0.10 levels, respectively, based on a simple t-test.
180

Appendix B: Alternative Performance Tests Table 45: Aftermarket Performance Categorized by Public Float - constant sample size (381 IPOs)
Ri = a + + &D2i + $E>3i + gjThe model is estimated for each of the return measurement horizons (1, 3, 12, 36 and 60 months) and for different market conditions (All Market Conditions, Hot Markets and Cold Markets). R, is the broad-market-adjusted return. Du, D2j, and D3j are (0,1) dummy variables taking the value of 1 if the IPO falls into the specified category of public float and 0 otherwise. Public Float is defined as the percentage of equity offered to the public at the IPO date. Observations on the public float are divided into fourcategories: Firms with less than 20% of public float, with at least 20% but less than 30% of public float, with at least 30% but less than 50% of public float, and at least 50%of public float; Standard Errors (S.E.) in parentheses.________________________________________________________________________________________________
Panel A: Aftermarket Performance o f IPOs Categorized by Initial Return: All Market ConditionsNumber of Issues
Aftermarket Ri a S.E. A S.E. A S.E. A S.E. Total D=0 D=1 D=2 D=3Month 1 0.0026 0.0291“ (0.0105) -0.0366b (0.0160) -0.0452“ (0.0161) -0.0370b (0.0178) 381 126 95 93 67Month 3 0.0154° 0.0325b (0.0153) -0.0235 (0.0234) -0.0286 (0.0235) -0.0244 (0.0260) 381 126 95 93 67Month 12 0.0606b 0.1267“ (0.0482) -0.0280 (0.0735) -0.1220° (0.0740) -0.1667b (0.0818) 381 126 95 93 67Month 36 -0.0918 0.0500 (0.1021) -0.1596 (0.1557) -0.1597 (0.1566) -0.3142° (0.1732) 381 126 95 93 67.Month 60 -0.0205 0.2162 (0.2095) -0.2859 (0.3195) -0.3244 (0.3215) -0.4907 (0.3556) 381 126 95 93 67
Panel B: Aftermarket Performance o f IPOs Categorized by Initial Return: Hot MarketsNumber of Issues
Aftermarket Ri a S.E. A S.E. A S.E. A S.E. Total D=0 D=1 D=2 D=3Month 1 0.0156 0.0472“ (0.0175) -0.0476° (0.0246) -0.0402 (0.0292) -0.0579° (0.0312) 119 39 40 22 18Month 3 0.0448“ 0.0705b (0.0296) -0.0213 (0.0415) -0.0669 (0.0492) -0.0410 (0.0526) 119 39 40 22 18Month 12 0.1044“ 0.0740 (0.0638) 0.0882 (0.0896) -0.0756 (0.1062) 0.0972 (0.1135) 119 39 40 22 18Month 36 -0.0707 -0.1856' (0.1082) 0.1584 (0.1521) 0.0180 (0.1802) 0.3859b (0.1926) 119 39 40 22 18Month 60 0.1531 0.0872 (0.2165) 0.1776 (0.3042) -0.1006 (0.3605) 0.1641 (0.3852) 119 39 40 22 18
Panel C: Aftermarket Performance o f IPOs Categorized by Initial Return: Cold MarketsNumber of Issues
Aftermarket Ri a S.E. A S.E. A S.E. A S.E. Total D=0 D=1 D=2 D=3Month 1 -0.0033 0.0210 (0.0130) -0.0343 (0.0209) -0.0442b (0.0194) -0.0271 (0.0217) 262 87 55 71 49Month 3 0.0020 0.0154 (0.0177) -0.0357 (0.0285) -0.0115 (0.0264) -0.0152 (0.0295) 262 87 55 71 49Month 12 0.0407 0.1503b (0.0635) -0.0978 (0.1021) -0.1437 (0.0948) -0.2679b (0.1058) 262 87 55 71 49Month 36 -0.1014 0.1557 (0.1389) -0.3252 (0.2232) -0.2473 (0.2072) -0.5904“ (0.2314) 262 87 55 71 49Month 60 -0.0994 0.2740 (0.2878) -0.5870 (0.4624) -0.4115 (0.4293) -0.7416 (0.4795) 262 87 55 71 49
“’ c denote statistical significance at the 0.01,0.05, and 0.10 levels, respectively, based on a simple t-test
181

Appendix B: Alternative Performance Tests Table 46: Aftermarket Performance Categorized by Sector -
constant sample size (381 IPOs)R , = a + pD\ + £j
The model is estimated for each of the return measurement horizons (1,3, 12, 36 and 60 months) and for different market conditions (All Market Conditions, Hot Markets and Cold Markets). Ri is the broad- market-adjusted return. D; is a (0 ,1) dummy variable taking the value of 0 if the firm belongs to a market sector defined as New Economy and 1 otherwise. New Economy firms belong to Market Sectors 5,13, 16 and 17, representing Technology, Media, Telecommunication and Healthcare, respectively. Old economy firms belong to all other sectors; Standard Errors (S.E.) in parentheses.____________________________
Panel A: Aftermarket Performance Categorized by Market Sector: All Market ConditionsNumber of Issues
Aftermarket Ri a S.E. fi S.E. Total D=0 D=1Month 1 0.0026 0 . 0 2 2 0 (0.0140) -0.0243 (0.0155) 381 72 309Month 3 0.0154c 0.0545* (0 .0 2 0 2 ) -0.048 lb (0.0224) 381 72 309Month 12 0.0606b 0.2460* (0.0632) -0.2294* (0.0702) 381 72 309Month 36 -0.0918 0.2770b (0.1337) -0.445“ (0.1485) 381 72 309Month 60 -0.0205 0.7982* (0.2733) - 1 .0 1 1 0 “ (0.3034) 381 72 309
Panel B: Aftermarket Performance Categorized by Market Sector: Hot MarketsNumber of Issues
Aftermarket Ri a S.E. f i S.E. Total D=0 D=1Month 1 0.0156 0.0536* (0.0218) -0.0485b (0.0246) 119 25 94Month 3 0.0448* 0.0842b (0.0367) -0.0498 (0.0413) 119 25 94Month 12 0.1044* 0.1239 (0.0800) -0.0247 (0.0900) 119 25 94Month 36 -0.0707 0.1063 (0.1355) -0.2240 (0.1524) 119 25 94Month 60 0.1531 0.5148c (0.2663) -0.4581 (0.2997) 119 25 94
Panel C: Aftermarket Performance Categorized by Market Sector: Cold MarketsNumber of Issues
Aftermarket Ri a S.E. f t S.E. Total D=0 D=1Month 1 -0.0033 0.0053 (0.0178) -0.0105 (0.0197) 262 47 215Month 3 0 . 0 0 2 0 0.0387 (0.0240) -0.0447° (0.0264) 262 47 215Month 12 0.0407 0.3109* (0.0852) -0.3293“ (0.0941) 262 47 215Month 36 -0.1014 0.3672° (0.1882) -0.5572* (0.2077) 262 47 215Month 60 -0.0994 0.9490b (0.3857) -1.2780“ (0.4257) 262 47 215a,b,c denote statistical significance at the 0.01, 0.05, and 0.10 levels, respectively, based on a simple t-test.
182
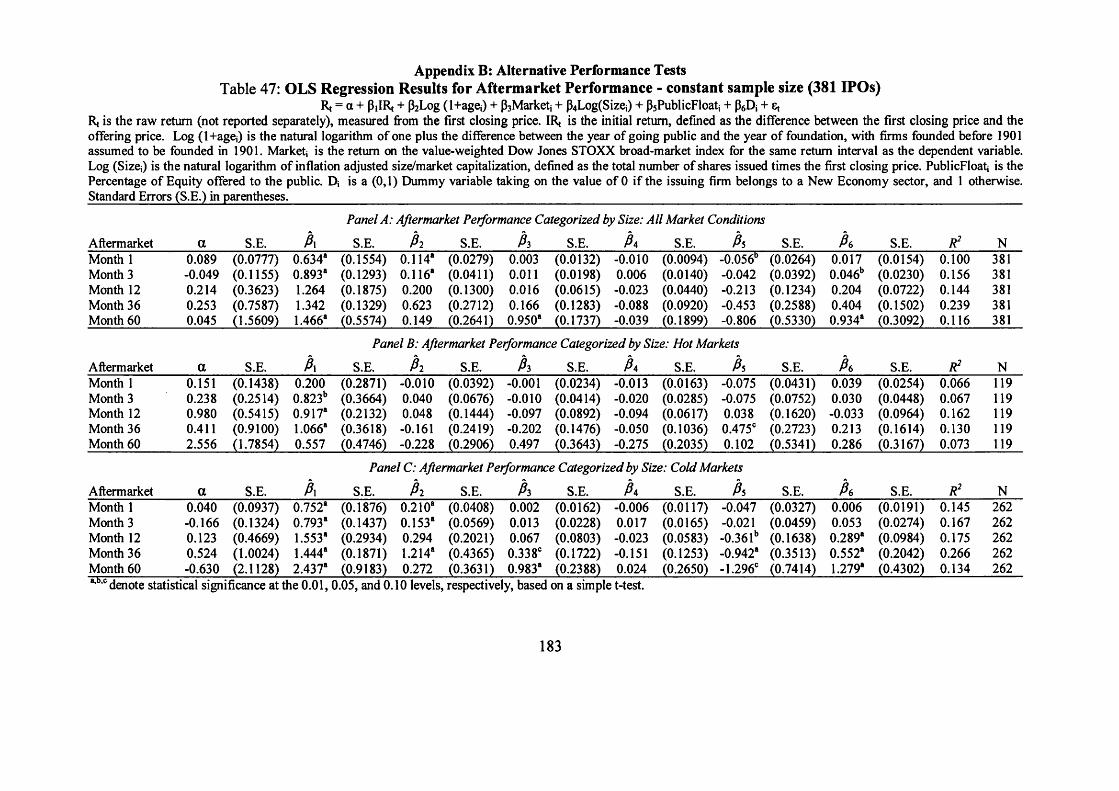
Appendix B: Alternative Performance Tests Table 47: OLS Regression Results for Aftermarket Performance - constant sample size (381 IPOs)
Rt = a + PJRt + p2Log (1+age*) + p3Marketi + p4Log(Sizej) + p5PublicFloatj + p6D* + 6t Rt is the raw return (not reported separately), measured from the first closing price. IRt is the initial return, defined as the difference between the first closing price and the offering price. Log (1+agej) is the natural logarithm of one plus the difference between the year of going public and the year of foundation, with firms founded before 1901 assumed to be founded in 1901. Market* is the return on the value-weighted Dow Jones STOXX broad-market index for the same return interval as the dependent variable. Log (Size;) is the natural logarithm of inflation adjusted size/market capitalization, defined as the total number of shares issued times the first closing price. PublicFloatj is the Percentage of Equity offered to the public. D* is a (0,1) Dummy variable taking on the value of 0 if the issuing firm belongs to a New Economy sector, and 1 otherwise. Standard Errors (S.E.) in parentheses.______________________________________________________________________________________________________________
Aftermarket a S.E. fix
Panel A: Aftermarket Performance Categorized by Size: All Market Conditions
S.E. P i S.E. A S.E. Pa S.E. A S.E. A S.E. R2 NMonth 1 0.089 (0.0777) 0.634s (0.1554) 0.114s (0.0279) 0.003 (0.0132) -0.010 (0.0094) -0.056b (0.0264) 0.017 (0.0154) 0 . 1 0 0 381Month 3 -0.049 (0.1155) 0.893s (0.1293) 0.116s (0.0411) 0 . 0 1 1 (0.0198) 0.006 (0.0140) -0.042 (0.0392) 0.046b (0.0230) 0.156 381Month 12 0.214 (0.3623) 1.264 (0.1875) 0 . 2 0 0 (0.1300) 0.016 (0.0615) -0.023 (0.0440) -0.213 (0.1234) 0.204 (0.0722) 0.144 381Month 36 0.253 (0.7587) 1.342 (0.1329) 0.623 (0.2712) 0.166 (0.1283) -0.088 (0.0920) -0.453 (0.2588) 0.404 (0.1502) 0.239 381Month 60 0.045 (1.5609) 1.466s (0.5574) 0.149 (0.2641) 0.950s (0.1737) -0.039 (0.1899) -0.806 (0.5330) 0.934s (0.3092) 0.116 381
Panel B: Aftermarket Performance Categorized by Size: Hot Markets
Aftermarket a S.E. fix S.E. P i S.E. A S.E. P a S.E. A S.E. A S.E. R2 NMonth 1 0.151 (0.1438) 0 . 2 0 0 (0.2871) -0 . 0 1 0 (0.0392) -0 . 0 0 1 (0.0234) -0.013 (0.0163) -0.075 (0.0431) 0.039 (0.0254) 0.066 119Month 3 0.238 (0.2514) 0.823b (0.3664) 0.040 (0.0676) -0 . 0 1 0 (0.0414) -0.020 (0.0285) -0.075 (0.0752) 0.030 (0.0448) 0.067 119Month 12 0.980 (0.5415) 0.917s (0.2132) 0.048 (0.1444) -0.097 (0.0892) -0.094 (0.0617) 0.038 (0.1620) -0.033 (0.0964) 0.162 119Month 36 0.411 (0.9100) 1.066s (0.3618) -0.161 (0.2419) -0 . 2 0 2 (0.1476) -0.050 (0.1036) 0.475° (0.2723) 0.213 (0.1614) 0.130 119Month 60 2.556 (1.7854) 0.557 (0.4746) -0.228 (0.2906) 0.497 (0.3643) -0.275 (0.2035) 0.102 (0.5341) 0.286 (0.3167) 0.073 119
Panel C: Aftermarket Performance Categorized by Size: Cold Markets
Aftermarket a S.E. fix S.E. P i S.E. A S.E. P a S.E. Ps S.E. fie S.E. R2 NMonth 1 0.040 (0.0937) 0.752s (0.1876) 0 .2 1 0 s (0.0408) 0 . 0 0 2 (0.0162) -0.006 (0.0117) -0.047 (0.0327) 0.006 (0.0191) 0.145 262Month 3 -0.166 (0.1324) 0.793s (0.1437) 0.153s (0.0569) 0.013 (0.0228) 0.017 (0.0165) -0.021 (0.0459) 0.053 (0.0274) 0.167 262Month 12 0.123 (0.4669) 1.553s (0.2934) 0.294 (0 .2 0 2 1 ) 0.067 (0.0803) -0.023 (0.0583) -0.361b (0.1638) 0.289s (0.0984) 0.175 262Month 36 0.524 (1.0024) 1.444s (0.1871) 1.214s (0.4365) 0.338° (0.1722) -0.151 (0.1253) -0.942s (0.3513) 0.552s (0.2042) 0.266 262Month 60 -0.630 (2.1128) 2.437s (0.9183) 0.272 (0.3631) 0.983s (0.2388) 0.024 (0.2650) -1.296' (0.7414) 1.279s (0.4302) 0.134 262“*,c denote statistical significance at the 0.01,0.05, and 0.10 levels, respectively, based on a simple t-test.
183
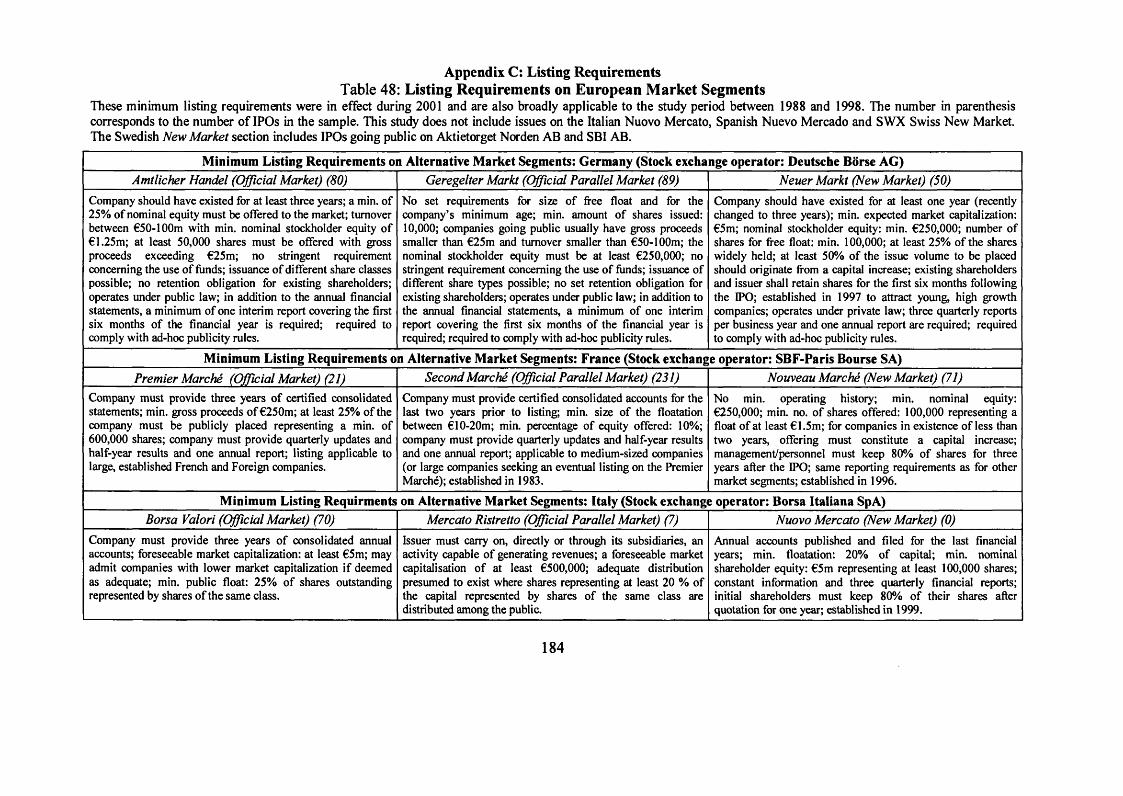
Appendix C: Listing Requirements Table 48: Listing Requirements on European M arket Segments
These minimum listing requirements were in effect during 2001 and are also broadly applicable to the study period between 1988 and 1998. The number in parenthesis corresponds to the number of IPOs in the sample. This study does not include issues on the Italian Nuovo Mercato, Spanish Nuevo Mercado and SWX Swiss New Market. The Swedish New Market section includes IPOs going public on Aktietorget Norden AB and SBI AB.
Minimum Listing Requirements on Alternative Market Segments: Germany (Stock exchange operator: Deutsche Borse AG)Amtlicher Handel (Official Market) (80) Geregelter Markt (Official Parallel Market (89) Neuer Markt (New Market) (50)
Company should have existed for at least three years; a min. of 25% of nominal equity must be offered to the market; turnover between €50-100m with min. nominal stockholder equity of € 1.25m; at least 50,000 shares must be offered with gross proceeds exceeding €25m; no stringent requirement concerning the use of funds; issuance of different share classes possible; no retention obligation for existing shareholders; operates under public law; in addition to the annual financial statements, a minimum of one interim report covering the first six months of the financial year is required; required to comply with ad-hoc publicity rules.
No set requirements for size of free float and for the company’s minimum age; min. amount of shares issued: 10,000; companies going public usually have gross proceeds smaller than €25m and turnover smaller than €50-100m; the nominal stockholder equity must be at least €250,000; no stringent requirement concerning the use of funds; issuance of different share types possible; no set retention obligation for existing shareholders; operates under public law; in addition to the annual financial statements, a minimum of one interim report covering the first six months of the financial year is required; required to comply with ad-hoc publicity rules.
Company should have existed for at least one year (recently changed to three years); min. expected market capitalization: €5m; nominal stockholder equity: min. €250,000; number of shares for free float: min. 100,000; at least 25% of the shares widely held; at least 50% of the issue volume to be placed should originate from a capital increase; existing shareholders and issuer shall retain shares for the first six months following the IPO; established in 1997 to attract young, high growth companies; operates under private law; three quarterly reports per business year and one annual report are required; required to comply with ad-hoc publicity rules.
Minimum Listing Requirements on Alternative Market Segments: France (Stock exchange operator: SBF-Paris Bourse SA)Premier Marche (Official Market) (21) Second Marche (Official Parallel Market) (231) Nouveau Marche (New Market) (71)
Company must provide three years of certified consolidated statements; min. gross proceeds of €250m; at least 25% of the company must be publicly placed representing a min. of 600,000 shares; company must provide quarterly updates and half-year results and one annual report; listing applicable to large, established French and Foreign companies.
Company must provide certified consolidated accounts for the last two years prior to listing; min. size of the floatation between €10-20m; min. percentage of equity offered: 10%; company must provide quarterly updates and half-year results and one annual report; applicable to medium-sized companies (or large companies seeking an eventual listing on the Premier Marche); established in 1983.
No min. operating history; min. nominal equity: €250,000; min. no. of shares offered: 100,000 representing a float of at least €1.5m; for companies in existence of less than two years, offering must constitute a capital increase; management/personnel must keep 80% of shares for three years after the IPO; same reporting requirements as for other market segments; established in 1996.
Minimum Listing Requirments on Alternative Market Segments: Italy (Stock exchange operator: Borsa Italiana SpA)Borsa Valori (Official Market) (70) Mercato Ristretto (Official Parallel Market) (7) Nuovo Mercato (New Market) (0)
Company must provide three years of consolidated annual accounts; foreseeable market capitalization: at least €5m; may admit companies with lower market capitalization if deemed as adequate; min. public float: 25% of shares outstanding represented by shares of the same class.
Issuer must carry on, directly or through its subsidiaries, an activity capable of generating revenues; a foreseeable market capitalisation of at least €500,000; adequate distribution presumed to exist where shares representing at least 20 % of the capital represented by shares of the same class are distributed among the public.
Annual accounts published and filed for the last financial years; min. floatation: 20% of capital; min. nominal shareholder equity: €5m representing at least 100,000 shares; constant information and three quarterly financial reports; initial shareholders must keep 80% of their shares after quotation for one year; established in 1999.
184

Appendix C continued:Minimum Listing Requirements on Alternative Market Segments: Netherlands (Stock exchange operator: Amsterdam Exchanges NV)
Officiele Markt (Official Market) (56) Officiele Parallel Markt (Official Parallel Market) (8) Nieuwe Markt (New Market) (11)
Business run by the issuer must have a track record of at least three years; at the time of first admission at least three out of five issuer’s book years preceding such admission must have closed with a net profit; issuer capital must amount to at least €5m; a min. of 10% of the capital placed must be available for trading; lock-up period: 180 days after the IPO.
Applicable to Dutch IPOs from 1988-1993; min. nominal value of shareholder equity: NGL4m; min. gross proceeds for an IPO: NGL2.5m; since 1994 the Official Parallel Market is closed for IPOs.
New economy stocks must have a track record of at least one year (other companies: three years); after admission to listing, at least 100,000 shares must be placed; tradable market value at least €5m; all listed companies are also required to satisfy the requirements that apply to the Official Market; quarterly figures and annual certified accounts; established in 1997.
Minimum Listing Requirements on Alternative Market Segments: Spain (Stock exchange operator: Bolsa de Madrid SA)Primer Mercado (Official Market) (56) Segundo Mercado (Official Parallel Market) (32) Nuevo Mercado (New Market) (0)
Provide audited financial statements for the three years prior to IPO; min. nominal shareholder equity: €1.5m, excluding stakes of 25% or more belonging to two shareholders; at least 100 shareholders must own less than 25% of the capital; (in the last two years before IPO or in three of the last five years) must have distributed a dividend of 6% of its capital.
Official prospectus has to be filed with the Spanish supervisory authority (CNMV); min. capital reserves of €250,000; in addition, 20% of the capital should be available for trading in the market; a security issue prospectus must be presented and other administrative and legal certificates provided.
Approved 1999, operational since 2000, to create a “special trading section for innovative, high technology companies offering considerable future growth prospects, although at higher levels of risk than the traditional sectors”; part of the continuous market, but subject to more information regulations than other market segments.
Minimum Listing Requirements on Alternative Market Segments: Sweden (Stock exchange operator: OM Stockholm Exchanges AB)A-list (Official Market) (15) OTC-list (Official Parallel Market) (52) O-list (New Market) (81)
Must have at least three years of verifiable history and possess documented profit earning capacity; have at least 2,000 shareholders; possess an ownership structure under which at least 25% of the equities in the company and 10% of the votes are owned by the general public; min. market value: SEK 300m; approval must be obtained from the Swedish Financial Supervisory Authority; dual class shares common.
Must have at least three years of verifiable history and possess documented profit earning capacity; have at least 500 shareholders; possess an ownership structure under which at least 25% of the equity in the company and 10% of the votes are owned by the general public; have a market value of at least SEK50m; approval must be obtained from the Swedish Financial Supervisory Authority.
No history and profit-earning capability requirement; required: at least 300 shareholders and an ownership structure under which at least 10% of the equity in the company and 10% of the votes are owned by the general public; approval granted by the Swedish Financial Supervisory Authority; dual class shares common (low voting B shares and high voting A shares).
Minimum Listing Requirements on Alternative Market Segments: Switzerland (Stock exchange operator: SWX Swiss Exchange AG)SWX Hauptsegment (Official Market) (35) SWXNebensegment (Official Parallel Market) (8) SWX New Market (New Market) (0)
Issuer must present audited accounts covering three complete financial years; issuer must have a min. nominal equity of CHF25m; at least 25% of shares must be floated publicly; sustained or expected capitalisation of at least CHF25m; no set rules on lock-up periods for insiders; price sensitive facts and relevant company events must be disclosed; reports must be provided annually with semi-annual updates.
Applicable to Swiss IPOs issued during 1988; min. nominal value of shareholder equity: CHFlm; min. gross proceeds: CHF2.5m; applicable to small- and medium-sized companies.
Shareholders’ equity must amount to at least CHF2.5m; min. 20% of the equity capital must be in diversified hands; total market cap: min. CHF8m; company must demonstrate an operating and financial track record extending over at least 12 months before the IPO; account must be in IAS or US GAAP; lock-up period: six months following the IPO; the IPO must involve a capital increase of at least 50%.
185

Appendix D: Tests o f Country Differences Table 49: Significance Tests of Country Differences categorized by IPO year -
Mean Difference TestIn each Panel, we measure whether die adjusted long-run IPO performance in one country is significantly different from the adjusted long-run IPO performance in another country. This analysis is performed for 21 country pairs using the conventional two-samples test for Mean Difference. BHRT is defined as the broad-market-adjusted buy-and-hold return from die first close to the third-year anniversary on the stock market, whereas one month is defined as a 21-day-trading period using local trading days. Significance values correspond to p-values.____________________________________________________________
Panel A: IPO year 1988 -1990Country BHRt Conventional two samples test for Mean Difference (p-■value)
BD FR IT NL ES SD SWGermany (BD) -0.0425 0.4944 0.6169 0.8884 0.0061 0.1245 0.6326France (FR) -0.1248 0.2765 0.7339 0.0223 0.2624 0.4162Italy (IT) 0.0389 0.6340 0.0031 0.0581 0.9116Netherlands (NL) -0.0675 0.0543 0.2862 0.6989Spain (ES) -0.3572 0.3347 0.0558Sweden (SD) -0.2617 0.2286Switzerland (SW) 0.0757
Panel B: IPO year 1991 -1994Country BHRt Conventional two samples test for Mean Difference (p-value)
BD FR IT NL ES SD SWGermany (BD) -0.3938 0.0024 0.1662 0.8588 0.6938 0.7986 0.4319France (FR) 0.1560 0.0477 0.1494 0.0966 0.0062 0.5462Italy (IT) -0.6713 0.4772 0.1279 0.3837 0.2439Netherlands (NL) -0.3547 0.9526 0.7929 0.7742Spain (ES) -0.3357 0.6458 0.6197Sweden (SD) -0.4288 0.5084Switzerland (SW) -0.1784
Panel C: IPO year 1995 -1998Country BHRt Conventional two samples test for Mean Difference (p-value)
BD FR IT NL ES SD SWGermany (BD) 3.2408 0.0141 0.1345 0.3538 0.3662 0.2045 0.3665France (FR) -0.4217 0.3568 0.2114 0.7338 0.1469 0.7202Italy (IT) -0.8884 0.0128 0.0884 0.0136 0.0188Netherlands (NL) 0.3397 0.4674 0.9147 0.4230Spain (ES) -0.1819 0.4950 0.9889Sweden (SD) 0.2734 0.4726Switzerland (SW) -0.1746
186
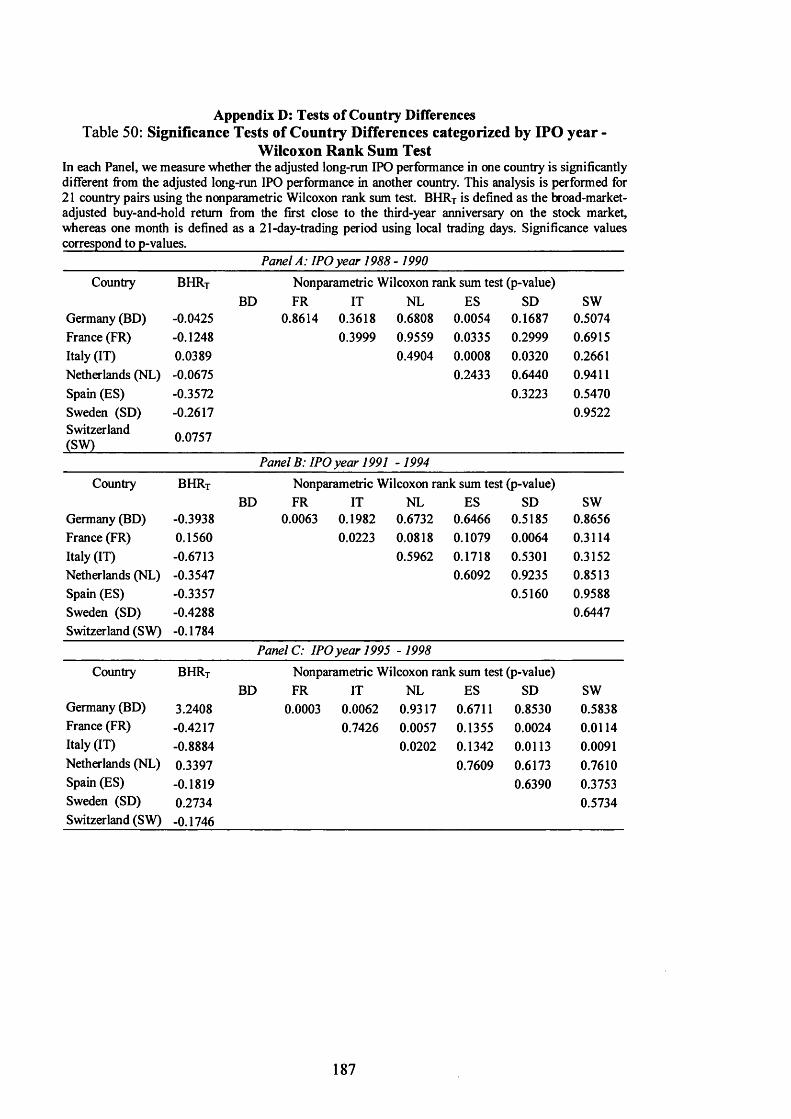
Appendix D: Tests of Country DifferencesTable 50: Significance Tests of Country Differences categorized by IPO year -
Wilcoxon Rank Sum TestIn each Panel, we measure whether the adjusted long-run IPO performance in one country is significantly different from the adjusted long-run IPO performance in another country. This analysis is performed for 21 country pairs using the nonparametric Wilcoxon rank sum test. BHRT is defined as the broad-market- adjusted buy-and-hold return from the first close to the third-year anniversary on the stock market, whereas one month is defined as a 21-day-trading period using local trading days. Significance values correspond to p-values._________________________________________________________________
Panel A: IPO year 1988 - 1990Country BHRt Nonparametric Wilcoxon rank sum test (p-value)
BD FR IT NL ES SD SWGermany (BD) -0.0425 0.8614 0.3618 0.6808 0.0054 0.1687 0.5074France (FR) -0.1248 0.3999 0.9559 0.0335 0.2999 0.6915Italy (IT) 0.0389 0.4904 0.0008 0.0320 0.2661Netherlands (NL) -0.0675 0.2433 0.6440 0.9411Spain (ES) -0.3572 0.3223 0.5470Sweden (SD) -0.2617 0.9522Switzerland 0.0757(SW)
Panel B: IPO year 1991 - 1994Country BHRj Nonparametric Wilcoxon rank sum test (p-value)
BD FR IT NL ES SD SWGermany (BD) -0.3938 0.0063 0.1982 0.6732 0.6466 0.5185 0.8656France (FR) 0.1560 0.0223 0.0818 0.1079 0.0064 0.3114Italy (IT) -0.6713 0.5962 0.1718 0.5301 0.3152Netherlands (NL) -0.3547 0.6092 0.9235 0.8513Spain (ES) -0.3357 0.5160 0.9588Sweden (SD) -0.4288 0.6447Switzerland (SW) -0.1784
Panel C: IPO year 1995 - 1998
Country BHRt Nonparametric Wilcoxon rank sum test (p-value)BD FR IT NL ES SD SW
Germany (BD) 3.2408 0.0003 0.0062 0.9317 0.6711 0.8530 0.5838France (FR) -0.4217 0.7426 0.0057 0.1355 0.0024 0.0114Italy (IT) -0.8884 0.0202 0.1342 0.0113 0.0091Netherlands (NL) 0.3397 0.7609 0.6173 0.7610Spain (ES) -0.1819 0.6390 0.3753Sweden (SD) 0.2734 0.5734Switzerland (SW) -0.1746
187

Appendix D: Tests of Country DifferencesTable 51: Significance Tests of Country Differences categorized by Sector -
Mean Difference TestIn each Panel, we measure whether the adjusted long-run IPO performance in one country is significantly different from the adjusted long-run IPO performance in another country. This analysis is performed for 21 country pairs using the conventional two-samples test for Mean Difference. BHRT is defined as the broad-market-adjusted buy-and-hold return from the first close to the third-year anniversary on the stock market, whereas one month is defined as a 21-day-trading period using local trading days. New Economy firms belong to Market Sectors 5, 13, 16 and 17, representing Technology, Media, Telecommunication and Healthcare, respectively, in the attached Dow Jones STOXX sector classification standard. Significance values correspond to p-values.__________________________________________________
Panel A: New Economy
Country BHRt Conventional two samples test for Mean Difference (p-■value)BD FR IT NL ES SD SW
Germany (BD) 6.2868 0.0291 0.5184 0.2847 0.6835 0.1499 0.3158France (FR) 0.2404 0.5523 0.6555 0.9103 0.6504 0.7951Italy (IT) -0.7864 0.2839 0.2173 0.3289 0.1925Netherlands (NL) 0.6375 0.7172 0.9249 0.4016Spain (ES) -0.0343 0.7584 0.9849Sweden (SD) 0.5621 0.4712Switzerland (SW) -0.0197
Panel B: Old Economy
Country BHRt Conventional two samples test for Mean Difference (p-■value)BD FR IT NL ES SD SW
Germany (BD) -0.0836 0.1234 0.1229 0.7405 0.3905 0.3223 0.9058France (FR) -0.3998 0.4565 0.4182 0.6428 0.7698 0.4000Italy (IT) -0.5415 0.1602 0.2080 0.2801 0.1208Netherlands (NL) -0.2054 0.6326 0.5419 0.8564Spain (ES) -0.3173 0.8585 0.5051Sweden (SD) -0.3484 0.4389Switzerland (SW) -0.1415
188

Appendix D: Tests of Country DifferencesTable 52: Significance Tests of Country Differences categorized by Sector -
Wilcoxon Rank Sum TestIn each Panel, we measure whether the adjusted long-run IPO performance in one country is significantly different from the adjusted long-run IPO performance in another country. This analysis is performed for 21 country pairs using the nonparametric Wilcoxon rank sum test. BHRT is defined as the broad-market- adjusted buy-and-hold return from the first close to the third-year anniversary on the stock market, whereas one month is defined as a 21-day-trading period using local trading days. New Economy firms belong to Market Sectors 5, 13, 16 and 17, representing Technology, Media, Telecommunication and Healthcare, respectively, in the attached Dow Jones STOXX sector classification standard. Significance values correspond to p-values.____________________________________________________________
Panel A: New EconomyCountry BHRt Nonparametric Wilcoxon rank sum test (p-value)
BD FR IT NL ES SD SWGermany (BD) 6.2868 0.0295 0.0943 0.4987 1.0000 0.2422 0.4852France (FR) 0.2404 0.6297 0.1920 0.5371 0.3365 0.2951Italy (IT) -0.7864 0.2750 0.1333 0.3639 0.2121Netherlands (NL) 0.6375 0.7485 0.7842 0.9826Spain (ES) -0.0343 0.6815 0.6593Sweden (SD) 0.5621 0.7108Switzerland (SW) -0.0197
Panel B: Old EconomyCountry BHRt Nonparametric Wilcoxon rank sum test (p-value)
BD FR IT NL ES SD SWGermany (BD) -0.0836 0.1435 0.0841 0.6816 0.5138 0.3395 0.9817France (FR) -0.3998 0.6801 0.4718 0.5692 0.6099 0.3918Italy (IT) -0.5415 0.2899 0.3036 0.3523 0.2398Netherlands (NL) -0.2054 1.0000 0.8001 0.7589Spain (ES) -0.3173 0.7580 0.9537Sweden (SD) -0.3484 0.6776Switzerland (SW) -0.1415
189

Appendix D: Tests of Country DifferencesTable 53: Significance Tests of Country Differences categorized by Age -
Mean Difference TestIn each Panel, we measure whether the adjusted long-run IPO performance in one country is significantly different from the adjusted long-run IPO performance in another country. This analysis is performed for 21 country pairs using the conventional two samples test for mean difference. BHRT is defined as the broad-market-adjusted buy-and-hold return from the first close to the third-year anniversary on the stock market, whereas one month is defined as a 21-day-trading period using local trading days. Age is the year of going public minus the year of foundation, with firms founded before 1901 assumed to be founded in 1901. Significance values correspond to p-values.____________________________________
Panel A: Age < 15
Country BHRt Conventional two samples test for Mean Difference (p-■value)BD FR IT NL ES SD SW
Germany (BD) 4.0658 0.0119 0.1957 0.3582 0.3991 0.0912 0.3723France (FR) -0.1812 0.4537 0.3611 0.9888 0.8401 0.8706Italy (IT) -0.6383 0.0640 0.1892 0.2024 0.1045Netherlands (NL) 0.4529 0.4296 0.3370 0.4908Spain (ES) -0.1695 0.8929 0.7965Sweden (SD) -0.0913 0.9466Switzerland (SW) -0.0558
Panel B: 15 < Age < 3 7
Country BHRj Conventional two samples test for Mean Difference (p-■value)BD FR IT NL ES SD SW
Germany (BD) -0.2714 0.6335 0.1978 0.3744 0.9792 0.8988 0.2655France (FR) -0.1255 0.2053 0.6976 0.6797 0.6378 0.7607Italy (IT) -0.5748 0.1523 0.3245 0.4108 0.1084Netherlands (NL) 0.0465 0.4781 0.4593 0.9989Spain (ES) -0.2646 0.9071 0.4870Sweden (SD) -0.3051 0.4282Switzerland (SW) 0.0457
Panel C: Age > 37Country BHRt Conventional two samples test for Mean Difference (p-■value)
BD FR IT NL ES SD SWGermany (BD) -0.3334 0.5620 0.7912 0.9685 0.5497 0.0649 0.8613France (FR) -0.4195 0.9090 0.7373 0.9828 0.1280 0.7343Italy (IT) -0.3846 0.8483 0.8878 0.3807 0.8199Netherlands (NL) -0.3263 0.6904 0.3690 0.9315Spain (ES) -0.4150 0.1690 0.6786Sweden (SD) 0.1206 0.5466Switzerland (SW) -0.2910
190

Appendix D: Tests of Country DifferencesTable 54: Significance Tests of Country Differences categorized by Age -
Wilcoxon Rank Sum TestIn each Panel, we measure whether the adjusted long-run IPO performance in one country is significantly different from the adjusted long-run IPO performance in another country. This analysis is performed for 21 country pairs using the nonparametric Wilcoxon rank sum test. BHRT is defined as the broad-market adjusted buy-and-hold return from the first close to the third-year anniversary on the stock market, whereas one month is defined as a 21-day-trading period using local trading days. Age is the year of going public minus the year of foundation, with firm founded before 1901 assumed to be founded in 1901. Significance values correspond to p-values._____________________________________________
Panel A: Age < 15Country BHRj Nonparametric Wilcoxon rank sum test (p-value)
BD FR IT NL ES SD SWGermany (BD) 4.0658 0.0077 0.0245 0.6949 0.7271 0.1253 0.7382France (FR) -0.1812 0.7495 0.1310 0.3303 0.2879 0.1693Italy (IT) -0.6383 0.1404 0.1368 0.1985 0.1693Netherlands (NL) 0.4529 0.7739 0.4365 0.8902Spain (ES) -0.1695 0.7159 1.0000Sweden (SD) -0.0913 0.4525Switzerland (SW) -0.0558
Panel B: 15 < Age < 37Country BHRt Nonparametric Wilcoxon rank sum test (p-value)
BD FR IT NL ES SD SWGermany (BD) -0.2714 0.7893 0.0995 0.8650 0.3028 0.3403 0.2970France (FR) -0.1255 0.2669 0.6421 0.9496 0.8142 0.3530Italy (IT) -0.5748 0.2451 0.2633 0.4919 0.0659Netherlands (NL) 0.0465 0.6053 0.5271 0.3224Spain (ES) -0.2646 0.7066 0.0423Sweden (SD) -0.3051 0.1880Switzerland (SW) 0.0457
Panel C: Age >37Country BHRt Nonparametric Wilcoxon rank sum test (p-value)
BD FR IT NL ES SD SWGermany (BD) -0.3334 0.5951 0.4600 0.4763 0.6672 0.8016 0.2305France (FR) -0.4195 0.5551 0.9106 0.8540 0.4228 0.5334Italy (IT) -0.3846 0.6160 0.3275 0.8204 0.4639Netherlands (NL) -0.3263 0.6164 0.3690 0.4910Spain (ES) -0.4150 0.5987 0.2325Sweden (SD) 0.1206 0.2105Switzerland (SW) -0.2910
191
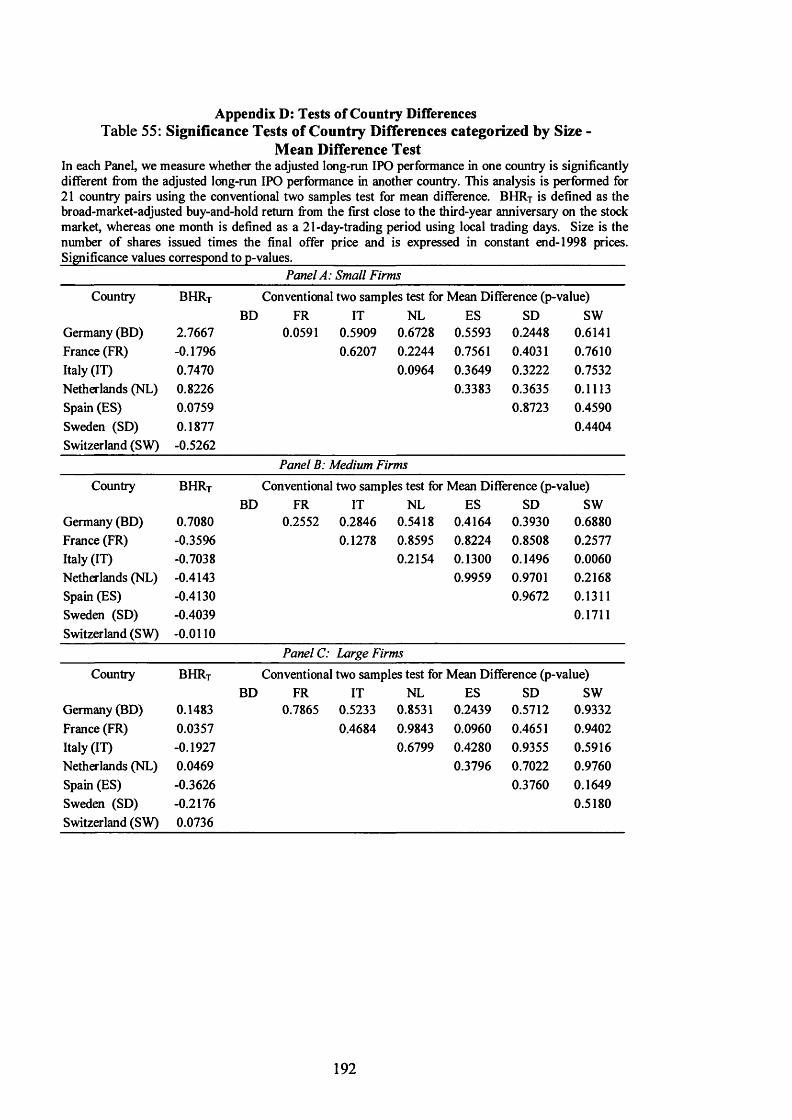
Appendix D: Tests of Country DifferencesTable 55: Significance Tests of Country Differences categorized by Size -
Mean Difference TestIn each Panel, we measure whether the adjusted long-run IPO performance in one country is significantly different from the adjusted long-run IPO performance in another country. This analysis is performed for 21 country pairs using the conventional two samples test for mean difference. BHRT is defined as the broad-market-adjusted buy-and-hold return from die first close to the third-year anniversary on the stock market, whereas one month is defined as a 21-day-trading period using local trading days. Size is the number of shares issued times the final offer price and is expressed in constant end-1998 prices.Significance values correspond to p-values.__________________________________________________
Panel A : Small FirmsCountry BHRt Conventional two samples test for Mean Difference (p-■value)
BD FR IT NL ES SD SWGermany (BD) 2.7667 0.0591 0.5909 0.6728 0.5593 0.2448 0.6141France (FR) -0.1796 0.6207 0.2244 0.7561 0.4031 0.7610Italy (IT) 0.7470 0.0964 0.3649 0.3222 0.7532Netherlands (NL) 0.8226 0.3383 0.3635 0.1113Spain (ES) 0.0759 0.8723 0.4590Sweden (SD) 0.1877 0.4404Switzerland (SW) -0.5262
Panel B: Medium FirmsCountry BHRj Conventional two samples test for Mean Difference (p-■value)
BD FR IT NL ES SD SWGermany (BD) 0.7080 0.2552 0.2846 0.5418 0.4164 0.3930 0.6880France (FR) -0.3596 0.1278 0.8595 0.8224 0.8508 0.2577Italy (IT) -0.7038 0.2154 0.1300 0.1496 0.0060Netherlands (NL) -0.4143 0.9959 0.9701 0.2168Spain (ES) -0.4130 0.9672 0.1311Sweden (SD) -0.4039 0.1711Switzerland (SW) -0.0110
Panel C: Large FirmsCountry BHRt Conventional two samples test for Mean Difference (p-■value)
BD FR IT NL ES SD SWGermany (BD) 0.1483 0.7865 0.5233 0.8531 0.2439 0.5712 0.9332France (FR) 0.0357 0.4684 0.9843 0.0960 0.4651 0.9402Italy (IT) -0.1927 0.6799 0.4280 0.9355 0.5916Netherlands (NL) 0.0469 0.3796 0.7022 0.9760Spain (ES) -0.3626 0.3760 0.1649Sweden (SD) -0.2176 0.5180Switzerland (SW) 0.0736
192

Appendix D: Tests of Country DifferencesTable 56: Significance Tests of Country Differences categorized by Size -
Wilcoxon Rank Sum TestIn each Panel, we measure whether the adjusted long-run IPO performance in one country is significantly different from the adjusted long-run IPO performance in another country. This analysis is performed for 21 country pairs using the nonparametric Wilcoxon rank sum test. BHRT is defined as the broad-market- adjusted buy-and-hold return from the first close to the third-year anniversary on the stock market, whereas one month is defined as a 21-day-trading period using local trading days. Size is the number of shares issued times the final offer price and is expressed in constant end-1998 prices. Significance values correspond to p-values.__________________________________________________________________
Panel A : Small Firms
Country BHRy Nonparametric Wilcoxon rank sum test (p-value)BD FR IT NL ES SD SW
Germany (BD) 2.7667 0.0173 0.0234 0.1000 0.3409 0.1988 0.1848France (FR) -0.1796 0.4736 0.0063 0.2418 0.0486 0.7087Italy (IT) 0.7470 0.0320 0.0182 0.0572 0.1797Netherlands (NL) 0.8226 0.0449 0.0382 0.0320Spain (ES) 0.0759 0.8432 0.3845Sweden (SD) 0.1877 0.4987Switzerland (SW) -0.5262
Panel B: Medium FirmsCountry BHRt Nonparametric Wilcoxon rank sum test (p-value)
BD FR IT NL ES SD SWGermany (BD) 0.7080 0.4631 0.0838 0.5212 0.6981 0.4996 0.2568France (FR) -0.3596 0.2492 0.9464 0.8203 0.9601 0.1565Italy (IT) -0.7038 0.3860 0.3085 0.3276 0.0399Netherlands (NL) -0.4143 0.6380 0.9348 0.2331Spain (ES) -0.4130 1.0000 0.1535Sweden (SD) -0.4039 0.1453Switzerland (SW) -0.0110
Panel C:• Large Firms
Country BHRt Nonparametric Wilcoxon rank sum test (p-value)BD FR IT NL ES SD SW
Germany (BD) 0.1483 0.4417 0.7867 0.0933 0.3983 1.0000 0.8643France (FR) 0.0357 0.3806 0.0609 0.0789 0.4626 0.5063Italy (IT) -0.1927 0.3286 0.6281 0.9263 0.8648Netherlands (NL) 0.0469 0.3070 0.2741 0.5109Spain (ES) -0.3626 0.5397 0.9799Sweden (SD) -0.2176 1.0000Switzerland (SW) 0.0736
193

Appendix D: Tests of Country DifferencesTable 57: Significance Tests of Country Differences categorized by Public Float -
Mean Difference TestIn each Panel, we measure whether the adjusted long-run IPO performance in one country is significantly different from the adjusted long-run IPO performance in another country. This analysis is performed for 21 country pairs using the conventional two samples test for Mean Difference. Public Float (%) is the percentage of equity offered. BHRT is defined as the broad-market-adjusted buy-and-hold return from the first close to the third-year anniversary on the stock market, whereas one month is defined as a 21-day-trading period using local trading days. Significance values correspond to p-values._________________
Panel A: Public Float < 20
Country BHRy Conventional two samples test for Mean Difference (p-■value)BD FR IT NL ES SD SW
Germany (BD) 3.6473 0.0053 0.5579 0.5293 0.4533 0.3760 NAFrance (FR) 0.0000 0.9684 0.0024 0.8634 0.1005 NAItaly (IT) -0.1942 0.2744 0.7934 0.5063 NANetherlands (NL) 1.1441 0.4008 NASpain (ES) -0.1151 0.4347 NASweden (SD) 0.4311 NASwitzerland (SW) -0.4512
Panel B: 20.0 < Public Float < 30
Country BHRy Conventional two samples test for Mean Difference (p--value)BD FR IT NL ES SD SW
Germany (BD) 0.1026 0.7838 0.2807 0.9386 0.3767 0.4899 NAFrance (FR) 0.2882 0.4031 0.9273 0.5187 0.5448 NAItaly (IT) -0.3596 0.1800 0.8969 0.5899 NANetherlands (NL) 0.1600 0.0734 0.3419 NASpain (ES) -0.3980 0.5267 NASweden (SD) -0.2082 NASwitzerland (SW) 0.2882
Panel C: 30.0 <; Public Float < 50
Country BHRt Conventional two samples test for Mean Difference (p-■value)BD FR IT NL ES SD SW
Germany (BD) 1.5246 0.2482 0.3896 0.5132 0.3843 0.5557 0.7584France (FR) -0.8811 0.8015 0.4811 0.0527 0.0465 0.2910Italy (IT) -0.7987 0.5505 0.0526 0.1224 0.0198Netherlands (NL) -0.6105 0.3166 0.2976 0.0809Spain (ES) -0.3787 0.2799 0.0591Sweden (SD) 0.1558 0.9254Switzerland (SW) 0.2440
Panel D: Public Float >50.0
Country BHRt Conventional two samples test for Mean Difference (p-■value)BD FR IT NL ES SD SW
Germany (BD) -0.3794 0.7905 0.1218 0.6566 0.7228 0.6721 0.5417France (FR) -0.5100 0.2082 0.9946 0.7478 0.9411 0.5222Italy (IT) -1.0803 0.1442 0.2862 0.1007 0.0494Netherlands (NL) -0.5129 0.5807 0.8999 0.3167Spain (ES) -0.2314 0.5288 0.9555Sweden (SD) -0.4807 0.2796Switzerland (SW) -0.2050
194
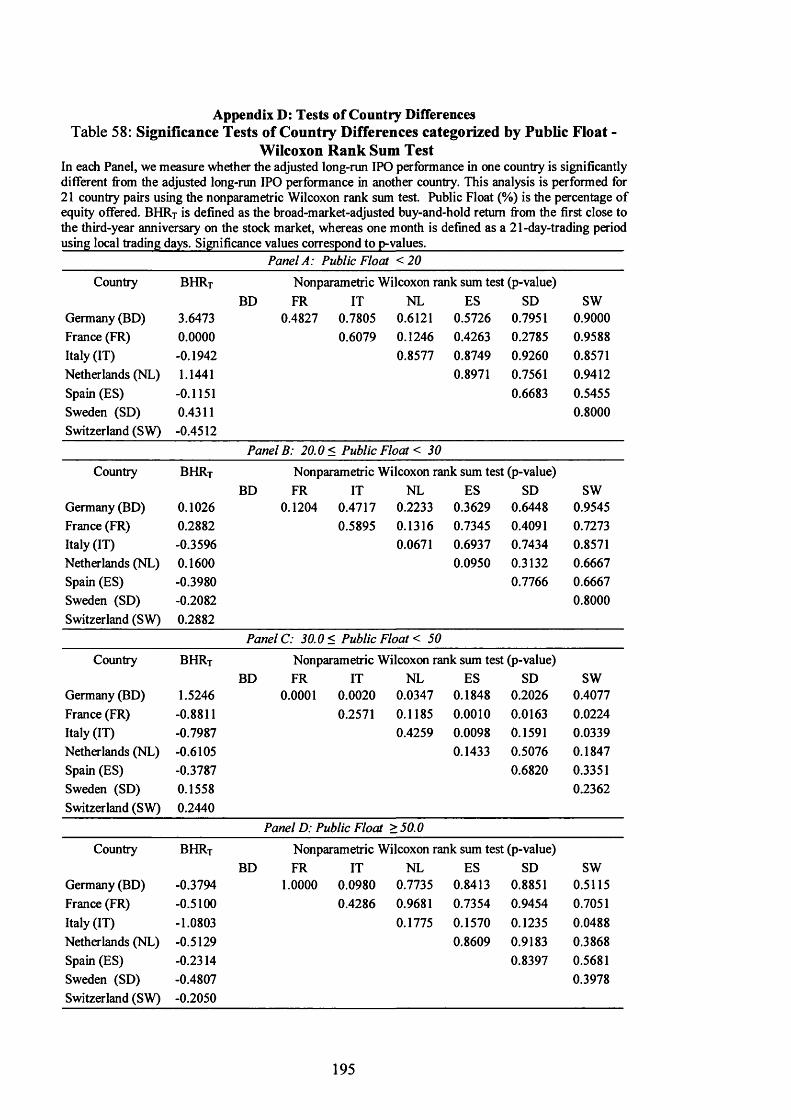
Appendix D: Tests of Country DifferencesTable 58: Significance Tests of Country Differences categorized by Public Float -
Wilcoxon Rank Sum TestIn each Panel, we measure whether the adjusted long-run IPO performance in one country is significantly different from the adjusted long-run IPO performance in another country. This analysis is performed for 21 country pairs using the nonparametric Wilcoxon rank sum test. Public Float (%) is the percentage of equity offered. BHRT is defined as the broad-market-adjusted buy-and-hold return from the first close to the third-year anniversary on the stock market, whereas one month is defined as a 21-day-trading period using local trading days. Significance values correspond to p-values._____________________________
Panel A: Public Float < 20
Country BHRt Nonparametric Wilcoxon rank sum test (p-value)BD FR IT NL ES SD SW
Germany (BD) 3.6473 0.4827 0.7805 0.6121 0.5726 0.7951 0.9000France (FR) 0.0000 0.6079 0.1246 0.4263 0.2785 0.9588Italy (IT) -0.1942 0.8577 0.8749 0.9260 0.8571Netherlands (NL) 1.1441 0.8971 0.7561 0.9412Spain (ES) -0.1151 0.6683 0.5455Sweden (SD) 0.4311 0.8000Switzerland (SW) -0.4512
Panel B: 20.0 < Public Float < 30
Country BHRt Nonparametric Wilcoxon rank sum test (p-value)BD FR IT NL ES SD SW
Germany (BD) 0.1026 0.1204 0.4717 0.2233 0.3629 0.6448 0.9545France (FR) 0.2882 0.5895 0.1316 0.7345 0.4091 0.7273Italy (IT) -0.3596 0.0671 0.6937 0.7434 0.8571Netherlands (NL) 0.1600 0.0950 0.3132 0.6667Spain (ES) -0.3980 0.7766 0.6667Sweden (SD) -0.2082 0.8000Switzerland (SW) 0.2882
PanelC: 30.0 < Public Float < 50
Country BHRt Nonparametric Wilcoxon rank sum test (p-value)BD FR IT NL ES SD SW
Germany (BD) 1.5246 0.0001 0.0020 0.0347 0.1848 0.2026 0.4077France (FR) -0.8811 0.2571 0.1185 0.0010 0.0163 0.0224Italy (IT) -0.7987 0.4259 0.0098 0.1591 0.0339Netherlands (NL) -0.6105 0.1433 0.5076 0.1847Spain (ES) -0.3787 0.6820 0.3351Sweden (SD) 0.1558 0.2362Switzerland (SW) 0.2440
Panel D: Public Float > 50.0
Country BHRt Nonparametric Wilcoxon rank sum test (p-value)BD FR IT NL ES SD SW
Germany (BD) -0.3794 1.0000 0.0980 0.7735 0.8413 0.8851 0.5115France (FR) -0.5100 0.4286 0.9681 0.7354 0.9454 0.7051Italy (IT) -1.0803 0.1775 0.1570 0.1235 0.0488Netherlands (NL) -0.5129 0.8609 0.9183 0.3868Spain (ES) -0.2314 0.8397 0.5681Sweden (SD) -0.4807 0.3978Switzerland (SW) -0.2050
195

Appendix D: Tests of Country DifferencesTable 59: Significance Tests of Country Differences categorized by Initial Return -
Mean Difference TestIn each Panel, we measure whether the adjusted long-run IPO performance in one country is significantly different from the adjusted long-run IPO performance in another country. This analysis is performed for 21 country pairs using the conventional two samples test for Mean Difference. BHRT is defined as the broad-market-adjusted buy-and-hold return from the first close to the third-year anniversary on the stock market, whereas one month is defined as a 21-day-trading period using local trading days. The initial return is the percentage difference from the final offering price to the first-day closing price. Significancevalues correspond to p-values.____________________________________________________________
Panel A: Initial Return < 0
Country BHRt Conventional two samples test for Mean Difference (p-•value)BD FR IT NL ES SD SW
Germany (BD) -0.4822 0.5607 0.5534 0.1343 0.9570 0.7720 0.0814France (FR) -0.2936 0.4252 0.5902 0.6402 0.8266 0.4948Italy (IT) -0.6006 0.0582 0.4720 0.5881 0.0236Netherlands (NL) -0.0465 0.1292 0.5204 0.6862Spain (ES) -0.4931 0.7975 0.0354Sweden (SD) -0.3778 0.4602Switzerland (SW) 0.1635
Panel B: 0 < Initial Return < 7Country BHRT Conventional two samples test for Mean Difference (p-value)
BD FR IT NL ES SD SWGermany (BD) 1.0617 0.7031 0.5664 0.6020 0.5859 0.5057 0.6932France (FR) 0.3852 0.3223 0.5148 0.4225 0.3090 0.6663Italy (IT) -0.6543 0.3271 0.2453 0.4617 0.1598Netherlands (NL) -0.1672 0.6889 0.5371 0.7872Spain (ES) -0.3216 0.7422 0.3608Sweden (SD) 1.0617 0.2944Switzerland (SW) -0.0369
Panel C: 7 < Initial Return < 20
Country BHRt Conventional two samples test for Mean Difference (p-value)BD FR IT NL ES SD SW
Germany (BD) 0.0599 0.5929 0.1370 0.5927 0.2243 0.7455 0.7655France (FR) -0.1535 0.2260 0.7949 0.3884 0.4181 0.9514Italy (IT) -0.7840 0.1894 0.2996 0.1065 0.1541Netherlands (NL) -0.3267 0.3454 0.4821 0.7878Spain (ES) -0.5578 0.1574 0.1965Sweden (SD) 0.2366 0.6527Switzerland (SW) -0.2031
Panel D: Initial Return >20.0
Country BHRt Conventional two samples test for Mean Difference (p-value)BD FR IT NL ES SD SW
Germany (BD) 4.1639 0.0383 0.2713 0.4614 0.2302 0.1494 0.5114France (FR) -0.6910 0.2152 0.0104 0.0665 0.0295 0.6283Italy (IT) -0.2076 0.2122 0.6326 0.5284 0.7519Netherlands (NL) 0.8671 0.3193 0.3209 0.3765Spain (ES) 0.0369 0.8740 0.5877Sweden (SD) 0.1172 0.5396Switzerland (SW) -0.3940
196
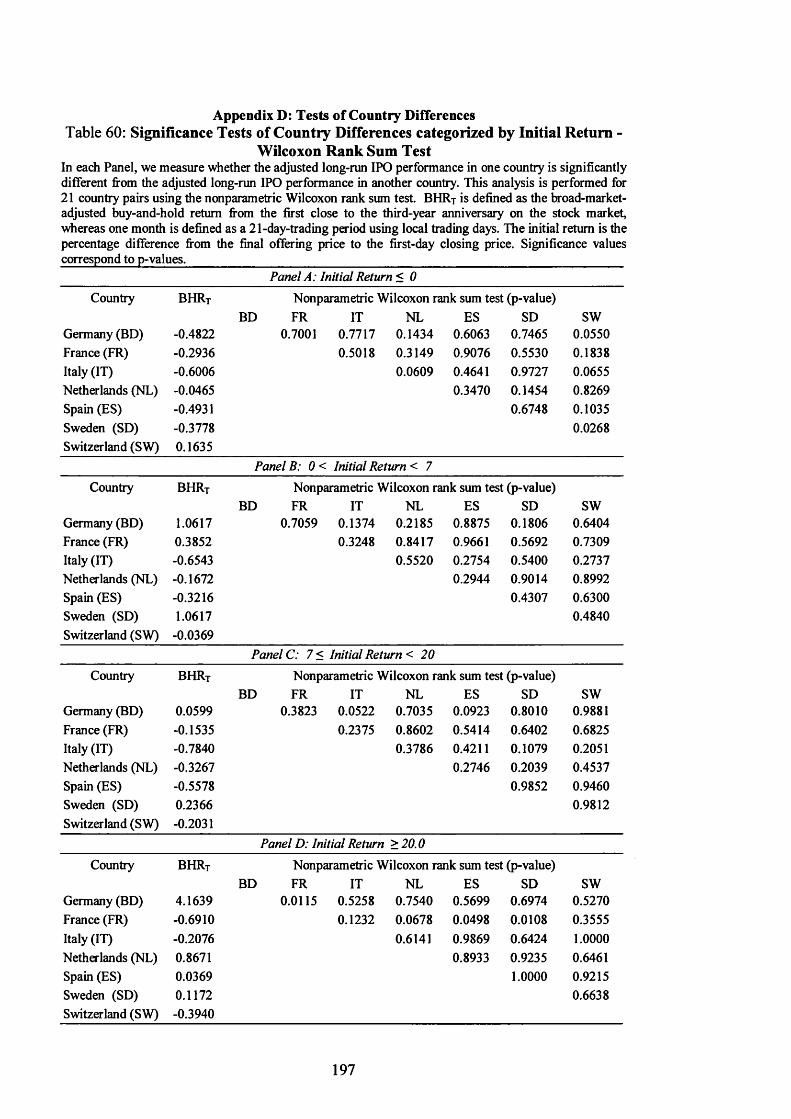
Appendix D: Tests of Country DifferencesTable 60: Significance Tests of Country Differences categorized by Initial Return -
Wilcoxon Rank Sum TestIn each Panel, we measure whether the adjusted long-run IPO performance in one country is significantly different from the adjusted long-run IPO performance in another country. This analysis is performed for 21 country pairs using the nonparametric Wilcoxon rank sum test. BHRT is defined as the broad-market- adjusted buy-and-hold return from the first close to the third-year anniversary on the stock market, whereas one month is defined as a 21-day-trading period using local trading days. The initial return is the percentage difference from the final offering price to the first-day closing price. Significance values correspond to p-values._________________________________________________________________
Panel A: Initial Return < 0
Country BHRt Nonparametric Wilcoxon rank sum test (p-value)BD FR IT NL ES SD SW
Germany (BD) -0.4822 0.7001 0.7717 0.1434 0.6063 0.7465 0.0550France (FR) -0.2936 0.5018 0.3149 0.9076 0.5530 0.1838Italy (IT) -0.6006 0.0609 0.4641 0.9727 0.0655Netherlands (NL) -0.0465 0.3470 0.1454 0.8269Spain (ES) -0.4931 0.6748 0.1035Sweden (SD) -0.3778 0.0268Switzerland (SW) 0.1635
Panel B: 0 < Initial Return < 7Country BHRt Nonparametric Wilcoxon rank sum test (p-value)
BD FR IT NL ES SD SWGermany (BD) 1.0617 0.7059 0.1374 0.2185 0.8875 0.1806 0.6404France (FR) 0.3852 0.3248 0.8417 0.9661 0.5692 0.7309Italy (IT) -0.6543 0.5520 0.2754 0.5400 0.2737Netherlands (NL) -0.1672 0.2944 0.9014 0.8992Spain (ES) -0.3216 0.4307 0.6300Sweden (SD) 1.0617 0.4840Switzerland (SW) -0.0369
Panel C: 7 < Initial Return < 20Country BHRt Nonparametric Wilcoxon rank sum test (p-value)
BD FR IT NL ES SD SWGermany (BD) 0.0599 0.3823 0.0522 0.7035 0.0923 0.8010 0.9881France (FR) -0.1535 0.2375 0.8602 0.5414 0.6402 0.6825Italy (IT) -0.7840 0.3786 0.4211 0.1079 0.2051Netherlands (NL) -0.3267 0.2746 0.2039 0.4537Spain (ES) -0.5578 0.9852 0.9460Sweden (SD) 0.2366 0.9812Switzerland (SW) -0.2031
Panel D: Initial Return > 20.0
Country BHRt Nonparametric Wilcoxon rank sum test (p-value)BD FR IT NL ES SD SW
Germany (BD) 4.1639 0.0115 0.5258 0.7540 0.5699 0.6974 0.5270France (FR) -0.6910 0.1232 0.0678 0.0498 0.0108 0.3555Italy (IT) -0.2076 0.6141 0.9869 0.6424 1.0000Netherlands (NL) 0.8671 0.8933 0.9235 0.6461Spain (ES) 0.0369 1.0000 0.9215Sweden (SD) 0.1172 0.6638Switzerland (SW) -0.3940
197

Appendix £: Sensitivity Analysis Table 61: Relationship between findings in Chapter II and Chapter III
This table demonstrates performance differences between the empirical methodology used in Chapter II and Chapter III using two methods for calculating returns (BHRs and CARs). The main differences between the empirical methodology used in Chapter II and Chapter III are the following: 1) the use of a European trading day calendar (Chapter II) versus a local trading day calendar (Chapter III) (this results in a smaller sample size for the calculation of long-run returns in Chapter III (686 versus 677 companies)), 2) stock prices in Chapter II are converted into Euro (€), whenever appropriate, versus local currency units (Chapter III), and 3) the choice of a pan-European benchmark (Chapter II) versus national benchmarks (Chapter III). Returns were calculated as buy-and-hold returns (BHRs) and Cumulative Average Returns (CARs) from the close of the first day of trading to the three-year anniversary on the stock markets with one month defined as a 21-day-trading interval. In this table, returns are reported as RAW returns (no adjustment) and returns adjusted for movements in the broad market (ADJ). The Dow Jones Eurostoxx broad-market index (Chapter II) and the respective national broad-market indices (Chapter III) are used as benchmarks. The large difference in the RAW and ADJ returns using both return methodologies between Panel A and Panel B in French IPOs is due to the additional four companies available for calculating three-year returns in Chapter II. When excluding those companies from calculation in Chapter II, the increase in French BHRs, amounts to 52.49 percent versus 47.80 reported.
Panel A: Pan-European,Study (Chapter II)Return Methodology
Buy-and-Hold Returns (BHRs) Cumulative Average Returns (CARs)
Country No % RAW S.E. ADJ S.E. RAW S.E. ADJ S.E.Germany 156 22.7 1.3654b (0.7206) 0.8872 (0.7159) 0.2279* (0.0447) -0.1557* (0.0572)
France 217 31.6 0.4780* (0.1337) -0.2135 (0.1326) 0.2892b (0.1210) -0.2511° (0.1525)
Italy 58 8.5 0.1789 (0.1119) -0.4470* (0.1009) 0.1161 (0.0974) -0.3758* (0.0910)
Netherlands 68 9.9 -0.0303 (0.1617) -0.4083* (0.1411) -0.1324 (0.0992) -0.4608* (0.1214)
Spain 55 8.0 0.7237“ (0.2549) 0.1506 (0.2396) 0.3847“ (0.1446) -0.0720 (0.0921)
Sweden 101 14.7 0.8281* (0.1997) 0.1515 (0.1870) 0.5293“ (0.0961) 0.0048 (0.0594)
Switzerland 31 4.5 0.5616* (0.1997) -0.1296 (0.1949) 0.3756b (0.1566) -0.1730 (0.1330)
All 686 100.0 0.679 la (0.1746) 0.0844 (0.1729) 0.2658“ (0.0376) -0.2052* (0.0349)
Panel B: Individual-Country Study (Chapter III)Return Methodology
Buy-and-Hold Returns (BHRs) Cumulative Average Returns (CARs)
Country No % RAW S.E. ADJ S.E. RAW S.E. ADJ S.E.Germany 155 22.9 1.3892c (0.7369) 0.9850 (0.7318) 0.2301“ (0.0448) -0.1166* (0.0439)
France 213 31.5 0.5369* (0.1490) -0.2074 (0.1483) 0.3717* (0.1413) -0.1901 (0.1388)
Italy 58 8.6 0.1794 (0.1171) -0.4924* (0.1050) 0.1104 (0.0940) -0.4185* (0.0918)
Netherlands 68 10.0 -0.0465 (0.2481) -0.3089° (0.1068) -0.1433 (0.1055) -0.3021* (0.0865)
Spain 53 7.8 0.7369“ (0.2763) 0.0727 (0.2791) 0.3725* (0.1413) -0.1558 (0.1248)
Sweden 99 14.6 0.7290“ (0.1887) -0.0725 (0.1747) 0.4786* (0.0916) -0.1270 (0.0789)
Switzerland 31 4.6 0.5595* (0.2014) -0.0943 (0.1840) 0.3510b (0.1479) -0.1817 (0.1378)
All 677 100.0 0.6888“ (0.1802) 0.0616 (0.1786) 0.2762* (0.0387) -0.1973* (0.0340)a,b,c denote statistical significance at the 0.01,0.05, and 0.10 levels, respectively, based on a simple t-test.
198

Appendix F: D C A and IS M ethodology Table 62: Specimen Balance Sheet and Profit and Loss Account
For each individual German Initial Public Offerings (IPO), we collected the information for calculating the proxies for earnings management (the Discretionary Current Accrual (DCA) and Income Smoothing (IS) coefficients) from balance sheet and profit and loss accounts based on the full version (Vollbilanz) available from Hoppenstedt Finanzinformationen GmbH (in English and German language), a Germany- based provider of financial data.___________________________________________________________row
1 Name: Company XYZ (Version in English)row
1 Name: Firma XYZ (Version in German)2 Date 2 Datum3 ASSETS 3 A K T I V A4 outstanding contributions to subscribed capital 4 Ausstehende Einlagen5 .thereof called-in 5 .(davon eingefordert)6 expenses for starting up + extending business operations 6 Aufw. f. Ingangsetz./Erweit. Geschaftsb.7 fixed assets 7 Anlagevermogen8 .gross values at the beginning of the year 8 .Anfangsbestand9 .additions 9 .Zugange10 .appreciation/write-ups 10 .Zuschreibungen11 .disposals 11 .Abgange12 .other changes 12 . Sonstige V eranderungen13 ..additions incl changes in scope of consolidation 13 ..(dav. Zug. incl. Verand. Kons.kreis)14 .accumulated depreciation and write-downs 14 .Kumulierte Abschreibungen15 ..thereof depreciation during the year 15 . .(davon Geschaftsj ahresabschreibungen)16 . .thereof appreciation/write-ups under depreciation 16 ..(dav. Zuschr. b. Abschr.)17 .intangible assets 17 .Immaterielle Vermogensgegenstande18 . .gross values at the beginning of the year 18 . .Anfangsbestand19 ..additions 19 ..Zugange20 ..appreciation/write-ups 20 ..Zuschreibungen21 ..disposals 21 ..Abgange22 ..other changes 22 ..Sonstige Veranderungen23 ...additions incl changes in scope of consolidation 23 ...(dav. Zug. incl. Verand. Kons.kreis)24 ..accumulated depreciation and write-ups 24 ..Kumulierte Abschreibungen25 ...thereof depreciation during the year 25 ...(dav. Geschaftsjahresabschreib.)26 ...thereof appreciation/write-ups under depreciation 26 ...(dav. Zuschr. b. Abschr.)27 ..franchises, patents/similar rights/assets & licences 27 ..Konzessionen28 ...gross values at the beginning of the year 28 ...Anfangsbestand29 ...additions 29 ...Zugange30 ...appreciation/write-ups 30 ...Zuschreibungen31 ...disposals 31 ...Abgange32 ...other changes 32 ...Sonstige Veranderungen33 ....additions incl changes in scope of consolidation 33 ....(dav. Zug. incl. Verand. Kons.kreis)34 ...accumulated depreciation and write-ups 34 ...Kumulierte Abschreibungen35 ....thereof depreciation during the year 35 ....(dav. Geschaftsjahresabschreib.)36 ....thereof appreciation/write-ups under depreciation 36 ....(dav. Zuschr. b. Abschr.)37 ..goodwill (from indiv statements/capital consolidation) 37 ..Geschafts- oder Firmenwert38 ...thereof goodwill from capital consolidation 38 ...(dav. Unterschiedsbetrag aus Konsol.39 ...gross values at the beginning of the year 39 ...Anfangsbestand40 ...additions 40 ...Zugange41 ...appreciation/write-ups 41 ...Zuschreibungen42 ...disposals 42 ...Abgange43 ...other changes 43 ...Sonstige Veranderungen44 ....additions incl changes in scope of consolidation 44 ....(dav. Zug. incl. Verand. Kons.kreis)45 ...accumulated depreciation and write-ups 45 ...Kumulierte Abschreibungen46 ....thereof depreciation during the year 46 ....(dav. Geschaftsjahresabschreib.)47 ....thereof appreciation/write-ups under depreciation 47 ....(dav. Zuschr. b. Abschr.)48 ..advance payments 48 ..Geleistete Anzahlungen49 ...gross values at the beginning of the year 49 ...Anfangsbestand50 ...additions 50 ...Zugange51 ...appreciation/write-ups 51 ...Zuschreibungen52 ...disposals 52 ...Abgange53 ...other changes 53 ...Sonstige Veranderungen54 ....additions incl changes in scope of consolidation 54 ....(dav. Zug. incl. Verand. Kons.kreis)55 ...accumulated depreciation and write-ups 55 ...Kumulierte Abschreibungen56 ....thereof depreciation during the year 56 ....(dav. Geschaftsjahresabschreib.)57 ....thereof appreciation/write-ups under depreciation 57 ....(dav. Zuschr. b. Abschr.)
199

APPENDIX F continued:
58 .fixed tangible assets59 ..gross values at the beginning of the year60 ..additions61 ..appreciation/write-ups62 ..disposals63 ..other changes64 ...additions incl changes in scope of consolidation65 ..accumulated depreciation and write-ups66 ...thereof depreciation during the year67 ...thereof appreciation/write-ups under depreciation68 ..real estate, leasehold rights69 ...gross values at the beginning of the year70 ...additions71 ...appreciation/write-ups72 ...disposals73 ...other changes74 ....additions incl changes in scope of consolidation75 ...accumulated depreciation and write-ups76 ....thereof depreciation during the year77 ....thereof appreciation/write-ups under depreciation78 ..technical equipment and machinery79 ...gross values at the beginning of the year80 ...additions81 ...appreciation/write-ups82 ...disposals83 ...other changes84 ....additions incl changes in scope of consolidation85 ...accumulated depreciation and write-ups86 ....thereof depreciation during the year87 ....thereof appreciation/write-ups under depreciation88 ..other equipment, fixtures and office equipment89 ...gross values at the beginning of the year90 ...additions91 ...appreciation/write-ups92 ...disposals93 ...other changes94 ....additions incl changes in scope of consolidation95 ...accumulated depreciation and write-ups96 ....thereof depreciation during the year97 ....thereof appreciation/write-ups under depreciation98 ..advance payments and construction in progress99 ...gross values at the beginning of the year100 ...additions101 ...appreciation/write-ups102 ...disposals103 ...other changes104 ....additions incl changes in scope of consolidation105 ...accumulated depreciation and write-ups106 ....thereof depreciation during the year107 ....thereof appreciation/write-ups under depreciation108 ..fixed assets leased to customers109 ...gross values at the beginning of the year110 ...additions111 ...appreciation/write-ups112 ...disposals113 ...other changes114 ....additions incl changes in scope of consolidation115 ...accumulated depreciation and write-ups116 ....thereof depreciation during the year117 ....thereof appreciation/write-ups under depreciation118 .financial assets119 ..thereof with a remaining term exceeding 1 year120 ..thereof to members of company boards121 ..thereof to partners122 ..gross values at the beginning of the year
58 .Sachanlagen59 ..Anfangsbestand60 ..Zugange61 . .Zuschreibungen62 ..Abgange63 ..Sonstige Veranderungen64 ...(dav. Zug. incl. Verand. Kons.kreis)65 ..Kumulierte Abschreibungen66 ...(dav. Geschaftsjahresabschreib.)67 ...(dav. Zuschr. b. Abschr.)68 ..Grundstucke69 ...Anfangsbestand70 ...Zugange71 ...Zuschreibungen72 ...Abgange73 ...Sonstige Veranderungen74 ....(dav. Zug. incl. Verand. Kons.kreis)75 ... Kumul ierte Abschreibungen76 ....(dav. Geschaftsjahresabschreib.)77 ....(dav. Zuschr. b. Abschr.)78 ..Technische Anlagen und Maschinen79 ...Anfangsbestand80 ...Zugange81 . ..Zuschreibungen82 ...Abgange83 ...Sonstige Veranderungen84 ....(dav. Zug. incl. Verand. Kons.kreis)85 ...Kumulierte Abschreibungen86 ....(dav. Geschaftsjahresabschreib.)87 ....(dav. Zuschr. b. Abschr.)88 ..And. Anlagen89 ...Anfangsbestand90 ...Zugange91 ...Zuschreibungen92 ...Abgange93 ...Sonstige Veranderungen94 ....(dav. Zug. incl. Verand. Kons.kreis)95 ...Kumulierte Abschreibungen96 ....(dav. Geschaftsjahresabschreib.)97 ....(dav. Zuschr. b. Abschr.)98 ..Geleistete Anzahlungen/Anlagen im Bau99 ...Anfangsbestand100 ...Zugange101 ...Zuschreibungen102 ...Abgange103 ...Sonstige Veranderungen104 ....(dav. Zug. incl. Verand. Kons.kreis)105 ...Kumulierte Abschreibungen106 ....(dav. Geschaftsjahresabschreib.)107 ....(dav. Zuschr. b. Abschr.)108 ..Vermietete Anlagengegenstande109 ...Anfangsbestand110 ...Zugange111 ...Zuschreibungen112 ...Abgange113 ...Sonstige Veranderungen114 ....(dav. Zug. incl. Verand. Kons.kreis)115 .. .Kumul ierte Abschreibungen116 ....(dav. Geschaftsjahresabschreib.)117 ....(dav. Zuschr. b. Abschr.)118 .Finanzanlagen119 ..(davon mit Restlaufzeit fiber 1 Jahr)120 ..(dav. an Mitgl. v. Gesellschaftsorg.)121 . .(davon an Gesel Ischafter)122 . .Anfangsbestand
200

APPENDIX F continued:
123 ..additions124 ..appreciation/write-ups125 ..disposals126 ..other changes127 ...additions incl changes in scope of consolidation128 ..accumulated depreciation and write-ups129 ...thereof depreciation during the year130 ...thereof appreciation/write-ups under depreciation131 ..shares in affiliated companies132 ...gross values at the beginning of the year133 ...additions134 ...appreciation/write-ups135 ...disposals136 ...other changes137 ....additions incl changes in scope of consolidation138 ...accumulated depreciation and write-ups139 ....thereof depreciation during the year140 ....thereof appreciation/write-ups under depreciation141 ..shares in associated companies142 ...thereof goodwill from equity consolidation143 ...gross values at the beginning of the year144 ...additions145 ...appreciation/write-ups146 ...disposals147 ...other changes148 ....additions incl changes in scope of consolidation149 ...accumulated depreciation and write-ups150 ....thereof depreciation during the year151 ....thereof appreciation/write-ups under depreciation152 ..loans to affiliated companies153 ...gross values at the beginning of the year154 ...additions155 ...appreciation/write-ups156 ...disposals157 ...other changes158 ....additions incl changes in scope of consolidation159 ...accumulated depreciation and write-ups160 ....thereof depreciation during the year161 ....thereof appreciation/write-ups under depreciation162 ..loans to associated companies163 ...gross values at the beginning of the year164 ...additions165 ...appreciation/write-ups166 ...disposals167 ...other changes168 ....additions incl changes in scope of consolidation169 ...accumulated depreciation and write-ups170 ....thereof depreciation during the year171 ....thereof appreciation/write-ups under depreciation172 ..other share investments173 ...gross values at the beginning of the year174 ...additions175 ...appreciation/write-ups176 ...disposals177 ...other changes178 ....additions incl changes in scope of consolidation179 ...accumulated depreciation and write-ups180 ....thereof depreciation during the year181 ....thereof appreciation/write-ups under depreciation182 ..loans to other share investments183 ...thereof with remaining term exceeding 1 year184 ...gross values at the beginning of the year185 ...additions186 ...appreciation/write-ups187 ...disposals
123 ..Zugange124 ..Zuschreibungen125 ..Abgange126 ..Sonstige Veranderungen127 ...(dav. Zug. incl. Verand. Kons.kreis)128 ..Kumulierte Abschreibungen129 ...(dav. Geschaftsjahresabschreib.)130 ...(dav. Zuschr. b. Abschr.)131 .. Anteile an verbunden Untemehmen132 ...Anfangsbestand133 ...Zugange134 ...Zuschreibungen135 ...Abgange136 ...Sonstige Veranderungen137 ....(dav. Zug. incl. Verand. Kons.kreis)138 ...Kumulierte Abschreibungen139 ....(dav. Geschaftjahresabschreib.)140 ....(dav. Zuschr. b. Abschr.)141 ..Ant. an assoz. Untem.142 ...(dav. Untersch.Betrag aus Equ.-Kons.)143 ...Anfangsbestand144 ...Zugange145 ...Zuschreibungen146 ...Abgange147 ...Sonstige Veranderungen148 ....(dav. Zug. incl. Verand. Kons.kreis)149 ...Kumulierte Abschreibungen150 ....(dav. Geschaftjahresabschreib.)151 ....(dav. Zuschr. b. Abschr.)152 ..Ausl. an verb. Untem.153 ...Anfangsbestand154 ...Zugange155 ... Zuschreibungen/ Aufzinsungen156 ...Abgange157 ...Sonstige Veranderungen158 ....(dav. Zug. incl. Verand. Kons.kreis)159 ...Kumulierte Abschreibungen160 ....(dav. Gesch.j.abschr./Abzins.)161 ....(dav. Zuschr. b. Abschr.)162 ..Ausl. an assoz. Untem.163 ...Anfangsbestand164 ...Zugange165 ...Zuschreibungen/Aufzinsungen166 ...Abgange167 ... Sonstige Veranderungen168 ....(dav. Zug. incl. Verand. Kons.kreis)169 ...Kumulierte Abschreibungen170 ....(dav. Gesch.j.abschr./Abzins.)171 ....(dav. Zuschr. b. Abschr.)172 ..Beteiligungen173 ...Anfangsbestand174 ...Zugange175 ...Zuschreibungen176 ...Abgange177 ...Sonstige Veranderungen178 ....(dav. Zug. incl. Verand. Kons.kreis)179 ...Kumulierte Abschreibungen180 ....(dav. Geschaftsjahresabschreib.)181 ....(dav. Zuschr. b. Abschr.)182 ..Ausleihungen an Betei 1 igungsuntemeh.183 ...(dav. mit Restlaufzeit fiber 1 Jahr)184 ...Anfangsbestand185 ...Zugange186 ...Zuschreibungen/Aufzinsungen187 ...Abgange
201

APPENDIX F continued:
188 ...other changes 188189 ....additions incl changes in scope of consolidation 189190 ...accumulated depreciation and write-ups 190191 ....thereof depreciation during the year 191192 ....thereof appreciation/write-ups under depreciation 192193 ..securities of fixed assets 193194 ...gross values at the beginning of the year 194195 ...additions 195196 ...appreciation/write-ups 196197 ...disposals 197198 ...other changes 198199 ....additions incl changes in scope of consolidation 199200 ...accumulated depreciation and write-ups 200201 ....thereof depreciation during the year 201202 ....thereof appreciation/write-ups under depreciation 202203 ..other financial assets 203204 ...thereof with remaining term exceeding 1 year 204205 ...thereof to members of company boards 205206 ...thereof to partners 206207 ...gross values at the beginning of the year 207208 ...additions 208209 ...appreciation/write-ups 209210 ...disposals 210211 ...other changes 211212 ....additions incl changes in scope of consolidation 212213 ...accumulated depreciation and write-ups 213214 ....thereof depreciation during the year 214215 . ...thereof appreciation/write-ups under depreciation 215216 items treated as fixed assets 216217 .leasing equipment and assets leased or rented out 217218 .nuclear fuel 218219 .special items from companies of the mining industrie 219220 .special assets 220221 ..thereof to accounting in accordance with DMBilG 1990 221222 current assets 222223 .current assets leased to customers 223224 .fixed assets intended to be sold 224225 .inventories (net value) 225226 ..inventories (gross value) 226227 ..raw material and supplies 227228 ..work in process 228229 ..finished goods and merchandise 229230 ..goods and services not yet invoiced 230231 ..goods and services not yet completed 231232 ..advance payments 232233 ...thereof with remaining term exceeding 1 year 233234 ..payments received on account of orders 234235 ...thereof with remaining term exceeding 1 year 235236 ..other deductions (part payt/provision etc) 236237 ...thereof with remaining term exceeding 1 year 237238 .receivables and other current assets 238239 ..thereof with remaining term exceeding 1 year 239240 ..thereof from affiliated companies 240241 ..thereof from associated companies 241242 ..from other co's in which participations are held 242243 ..value adjustments/over value adjustments set off direct 243244 ..thereof from members of company board 244245 ..thereof to partners 245246 ..trade receivables 246247 ...thereof with remaining term exceeding 1 year 247248 ..receivables from partially complete services 248249 ...thereof with remaining term exceeding 1 year 249250 ..receivables from goods/services not yet invoiced 250251 ...thereof with remaining term exceeding 1 year 251252 ..receivables from leasing and rental business 252
...Sonstige Veranderungen
....(dav. Zug. incl. Verand. Kons.kreis)
...Kumulierte Abschreibungen
....(dav. Geschaftsjahresabschreib.)
....(dav. Zuschr. b. Abschr.)
..Wertpapiere des Anlagevermogens
.. .Anfangsbestand
...Zugange
...Zuschreibungen
...Abgange
...Sonstige Veranderungen
....(dav. Zug. incl. Ver3nd. Kons.kreis)
...Kumulierte Abschreibungen
....(dav. Geschaftsjahresabschreib.)
....(dav. Zuschr. b. Abschr.)
..Sonstige Finanzanlagen
...(dav. mit Restlaufzeit iiber 1 Jahr)
...(dav. an Mitgl. v. Gesellsch.-Org.)
...(davon an Gesellschafter)
...Anfangsbestand
...Zugange
...Zuschreibungen
...Abgange
...Sonstige Veranderungen
....(dav. Zug. incl. Verand. Kons.kreis)
...Kumulierte Abschreibungen
....(dav. Geschaftsjahresabschreib.)
....(dav. Zuschr. b. Abschr.)Anlagevermogenahnliche Posten. V ermi et vermogen.Kembrennelemente.Vorabraum.Sondervermogen..(dav. Sonderbil. nach DMBilG)Umlaufvermfigen.Vermietete Erzeugn. im UmlaufVermogen .Zum Verkauf best. Gegenstande des AV .Vorrate (gesamt)..Vorrate (unspezifiziert)..Roh- /Hilfs-/Betriebsstoffe ..Unfertige Erzeugnisse / Arbeiten ..Fertige Erzeugnisse / Waren ..Noch nicht abgerechnete Auftrage ..In Ausfuhrung befindliche Arbeiten ..Geleistete Anzahlungen ...(dav. mit Restlaufzeit uber 1 Jahr) ..Erhaltene Anzahlungen auf Bestellung. ...(dav. mit Restlaufzeit iiber 1 Jahr) ..Sonstige AbzQge (Abschlagszahl. u.a.) ...(dav. mit Restlaufzeit iiber 1 Jahr) .Forderungen und son. Vermogensgegenst. ..(davon mit Restlaufzeit iiber 1 Jahr) ..(davon an verbundene Untemehmen) ..(davon an assoziierte Untemehmen) ..(davon an Beteiligungsuntemehmen) ..(dav. direkt abges. Wertberichtigung) ..(dav. ggu. Mitgl. v. Gesellsch.-Org.) ..(davon an Gesellschafter)..Ford, aus Lieferungen und Leistungen ...(dav. mit Restlaufzeit uber 1 Jahr)..Ford, aus teilfertigen Leistungen ...(dav. mit Restlaufzeit uber 1 Jahr)..Ford, aus noch nicht abger. Lei stung. ...(dav. mit Restlaufzeit iiber 1 Jahr)..Ford, aus Vermietung und Verpachtung
202

APPENDIX F continued’.
253 ...thereof with remaining term exceeding 1 year 253254 ..receiv. fr. contracts, prelim agreem., custmrsodial serv's 254255 ...thereof with remaining term exceeding 1 year 255256 ..receivables from affiliated companies 256257 ...thereof with remaining term exceeding 1 year 257258 ...thereof trade receivables 258259 ..receivables from associated companies 259260 ...thereof with remaining term exceeding 1 year 260261 ...thereof trade receivables 261262 ..receivables from other co's participations are held 262263 ...thereof with remaining term exceeding 1 year 263264 ...thereof trade receivables 264265 ..receivables from co brd members 265266 ...thereof with remaining term exceeding 1 year 266267 ..other receivables and other current assets 267268 ...thereof with remaining term exceeding 1 year 268269 ...contributions called-in/supplementary or contractual 269270 ..payments received 270271 ...thereof with remaining term exceeding 1 year 271272 ..other deductions (e.g. part payts) 272273 ...thereof with remaining term exceeding 1 year 273274 .securities of current assets 274275 ..shares in affiliated companies 275276 ...thereof shares in associated companies 276277 ..own shares 277278 ..other securities 278279 ...thereofbonds 279280 .liquid funds 280281 ..thereof with remaining term exceeding 1 year 281282 ..cash in hand, central bank and postal giro balances 282283 ..cheques 283284 ..bank balances 284285 ...thereof with remaining term exceeding 1 year 285286 prepaid expenses 286287 .thereof discounts in accordance with §250(3) HGB 287288 prepaid tax 288289 loss not covered by equity capital 289290 .thereof loss of shareholders with unlimited liability 290291 total assets 291292 .contingent receivables 292293 LIABILITIES AND SHAREHOLDERS’ EQUITY 293294 equity (capital and reserves) 294295 .thereof special accounting in accord with DMBilG 1990 295296 .capital 296297 ..called-in capital 297298 ...subscribed capital 298299 ...thereof value of ordinary share 299300 ...thereof value of preference share 300301 ....thereof preferred shares 301302 ...non called-in capital 302303 ..proprietary accounts of liable shareholders 303304 ..other capital 304305 ...thereof profit-sharing certificates 305306 ...thereof capital share from remaining members 306307 ...thereof capital share from retiring members 307308 ...thereof capital share from cancelled shares 308309 ...thereof contributions of limited partners 309310 .general reserves 310311 ..thereof set off direct as goodwill 311312 ..capital reserves 312313 ...thereof set off direct as goodwill 313314 ...additional pd-in capital from share issues etc. 314315 ...additional or supplementary contr. from shareholders 315316 ...funds derived from reductions in share capital etc. 316317 ..revenue reserves 317
...(dav. mit Restlaufzeit iiber 1 Jahr)
..Ford, aus Vertragen + Betreuung
...(dav. mit Restlaufzeit uber 1 Jahr)
..Ford, an verb. Untem.
...(dav. Restl. >1 Jahr)
...(dav. aus Lief. + Leist.)
..Ford, an assoz. Untem.
...(dav. Restl. >1 Jahr)
...(dav. aus Lief. + Leist.)
..Forderungen an Beteiligungen
...(dav. mit Restlaufzeit fiber 1 Jahr)
...(dav. aus Lieferungen + Leistungen)
..Ford, an Mitgl. v. Gesellsch.-Organen
...(dav. mit Restlaufzeit iiber 1 Jahr)
..Son. Forderungen + Vermogensgegenst.
...(dav. mit Restlaufzeit iiber 1 Jahr)
...(dav. eingeford. EinlTNachschusse)
..Erhaltene Anzahlungen bei Forderungen
...(dav. mit Restlaufzeit iiber 1 Jahr)
..Sonstige Abziige (Abschlagszahl. u.a.)
...(dav. mit Restlaufzeit iiber 1 Jahr)
.Wertpapiere des UmlaufVermogens
..Anteile an verbundenen Untemehmen
...(dav. Ant. an assoziierten Untem.)
..Eigene Anteile
..Sonstige Wertpapiere
...(davon Schuldscheine)
.Liquide Mittel
..(davon mit Restlaufzeit iiber 1 Jahr)
..Kasse
..Schecks
..Guthaben bei Kreditinstituten
...(dav. mit Restlaufzeit iiber 1 Jahr) Rechnungsabgrenzungsposten (Aktiva) .(davon Disagio)SteuerabgrenzungNicht d. Eigenkap. gedeckter Fehlbetr. .(dav. Verlustanteil pers. haft. Ges.) Bilanzsumme (Aktiva).Eventual forderungen
P A S S I V AEigenkapital.(dav. Sonderbil. nach DMBilG).Kapital..Eingefordertes Kapital ...Gezeichnetes Kapital ...(davon Nennwert Stammaktien) ...(davon Nennwert Vorzugsaktien) ....(davon Vorziige)...Nicht eingeford. aussteh. Einlagen ..Kapitalkonten haft. Gesellschafter ..Andere Kapitalbestandteile ...(davon GenuBscheine)...(dav. Gesch.Guth. verb. Mitgl.)...(dav. Gesch.guth. aussch. Mitgl.)...(dav. Gesch.Guth. gek. Gesch.Ant.) ...(davon Kommanditeinlage).Offene Riicklagen..(dav. direkt abges. Untersch.betr.)..Kapital riicklagen...(dav. direkt abges. Untersch.betr.)...Agio aus Wertpapieremissionen u.S....Zuzahl./Nachschiisse von Gesellsch....Betrage aus Kapitalherabsetz. u.a.. .Gewinnriicklagen
203

APPENDIX F continued:
318 ...thereof set off direct as goodwill319 ...legal reserves320 ...uncommitted reserves321 ....reserves for own shares322 thereof holdings in controlling or parent company323 ....statutory reserves324 . ...other revenue reserves325 equity part from re-instatement of original values326 equity part of tax-deductible reserves327 thereof reserves for repairs/replacements/rationalis.328 thereof contingency reserves329 thereof reserves for foundations/charities330 thereof set off direct as goodwill331 .adjustment items from consolidation332 .adjustment items for shares held by third parties333 ..thereof shares in profits334 ..thereof shares in losses335 ..thereof shares in capital336 .balance sheet result337 ..net income/loss for the year338 ..net income/loss carried forward from the previous year339 ..profit/loss340 ...net income/loss carried forward from the previous yr341 equity related funds342 .special item with an equity portion343 ..taxation reserves344 ...special items accord. to(sale of certain fixed assets)345 ...special items acc. to sect. 35 EStR (replacem. of assets)346 ...special items acc. with § 52(8) EStG (pension accruals)347 ...special items in accord with Investment Allowance Act348 ...special items in accord with Developing Countries Act349 ...special items in accord with Foreign Investment Act350 ...other special items351 ...special items in accord with foreign legal provisions352 ..special depreciation in accordance with taxation law353 ...thereof value adjustments of fixed assets354 ....thereof value adjustments of land and buildings355 ...value adjustments of current assets/import deductions356 .grants357 ..thereof declared tax-free358 ..investment grants359 ..grants to cover building costs360 ..grants on earnings361 ..other mixed grants362 outside/borrowed capital363 .provisions364 ..thereof long-term365 ..thereof special accounting in accord with DMBilG 1990366 ..adjustment items from consolidation367 ..provision for pensions and similar commitments368 ...deficit arising from non-allocation369 ..other provisions370 ...provisions for taxation371 ....thereof for deferred taxes372 ...other provisions373 ....provisions to cover guarantee claims374 ....provisions to cover repairs375 ....provisions to cover removal of waste materials376 ....all other provisions377 .liabilities378 ..thereofshort-term379 ..thereof long-term380 ..thereof secured by mortgages and similar rights381 ..secured by mortgages on real estate & similar rights382 ..thereof to members of company boards
318 ...(dav. direkt abges. Untersch.betr.)319 . ..Gesetzl iche Rucklage320 ...Freie RQcklagen321 ....Riicklage fur eigene Anteile322 (dav. Ant. an herrsch. Untem.)323 ....Satzungsmafiige Rucklagen324 ....Andere Gewinnrucklagen325 (dav. EK-Ant. v. Wertaufholung)326 (dav. EK-Ant. abzugsf. Ruckl.)327 (dav. Instandhaltungsrucklagen)328 (davon Risikorucklagen)329 (dav. Rucklagen fur Stiftungen)330 (dav. als Goodwill dir. abges.)331 .Unterschiedsbetrag aus Kapitalkonsolid.332 .Anteile anderer Gesellschafter333 ..(davon Gewinnanteile)334 ..(davon Verlustanteile)335 ..(davon Kapitalanteile)336 .Bilanzergebnis337 ..JahresuberschuB/-fehlbetrag338 ..Gewinn- / Verlustvortrag aus Vorjahr339 ..Bilanzgewinn / -verlust340 ...(dav. Gewinn-/Verlustvortr. a Vj.)341 Eigenkapitalahnliche Mittel342 .Sonderposten mit RQcklageanteil343 ..Steuerrechtliche Rucklagen344 ...Sonderposten gemafl § 6b EStG345 ...Sonderposten gem. Abschnitt 35 EStR346 ...Sonderposten gemafl § 52 (5) EStG347 ...Sonderposten gemafl InvZulG348 ...Sonderposten gemafl EntwLStG349 ...Sonderposten gemafl AuslInvG350 ...Sonstige Sonderposten351 ...Sonderposten nach ausl and. Recht352 ..Steuerrechtliche Sonderabschreibungen353 ...(dav. Wertberichtigungen zum AV)354 ....(dav. Wb. a Grundstucke/Gebaude)355 ...(dav. Wertberichtigungen zum UV)356 .Zuschusse357 ..(davon als steuerfrei bezeichnet)358 ..InvestitionszuschQsse359 . .Baukostenzuschusse/Anschluflbeitrage360 ..Ertragszuschusse361 ..Sonstige (gemischte) Zuschusse362 Fremdkapital363 .Ruckstellungen364 ..(dav. langerfristig)365 ..(dav. Sonderbil. n. DMBilG)366 ..(dav. Untbetr. a d. Kons.)367 ..PensionsrQckstellungen368 ...(Fehlbetrag aus unterl. Zufuhrung)369 ..Andere Ruckstellungen370 ...Steuerruckstellungen371 ....(davon latente Steuem)372 ...Sonstige Ruckstellungen373 ....Gewahrleistungsruckstellungen374 ....Instandhaltungsruckstellungen375 ....Abraumbeseitigungsruckstellungen376 ....Restliche Ruckstellungen377 .Verbindlichkeiten378 ..(davon kurzfristig)379 ..(davon langfristig)380 ..(dav. d. Pfandr. u.3. ges.)381 . .(durch Grundpfandrechte gesi chert)382 ..(dav. ggu. Mitgl. v. Gesellsch.-Org.)
204

APPENDIX F continued:
383 ..thereof to partners 383384 ..contributions of dormant partners 384385 ...thereof with a remaining term of up to 1 year 385386 ...thereof with a remaining term of more than 5 years 386387 ...thereof secured by mortgages and similar rights 387388 ...secured by mortgages on real estate & similar rights 388389 ..loans granted by shareholders 389390 ...thereof with a remaining term of up to 1 year 390391 ...thereof with a remaining term of more than 5 years 391392 ...thereof secured by mortgages and similar rights 392393 ...secured by mortgages on real estate & similar rights 393394 ..loans, bonds, obligations 394395 ...thereof with a remaining term of up to 1 year 395396 ...thereof with a remaining term of more than 5 years 396397 ...thereof secured by mortgages and similar rights 397398 ...secured by mortgages on real estate & similar rights 398399 ...thereof convertible 399400 ...therof profit-sharing certificates 400401 ..loans, mortgages 401402 ...thereof with a remaining term of up to 1 year 402403 ...thereof with a remaining term of more than 5 years 403404 ...thereof secured by mortgages and similar rights 404405 ...secured by mortgages on real estate & similar rights 405406 ..liabilities to banks 406407 ...thereof with a remaining term of up to 1 year 407408 ...thereof with a remaining term of more than 5 years 408409 ...thereof secured by mortgages and similar rights 409410 ...secured by mortgages on real estate & similar rights 410411 ..payments received on account of orders 411412 ...thereof with a remaining term up to 1 year 412413 ...thereof with a remaining term of more than 5 years 413414 ...thereof secured by mortgages and similar rights 414415 ...secured by mortgages on real estate & similar rights 415416 ..trade liabilities 416417 ...thereof with a remaining term up to 1 year 417418 ...thereof with a remaining term of more than 5 years 418419 ...thereof secured by mortgages and similar rights 419420 ...secured by mortgages on real estate & similar rights 420421 ..liabilities on bills accepted and drawn 421422 ...thereof with a remaining term up to 1 year 422423 ...thereof with a remaining term of more than 5 years 423424 ...thereof secured by mortgages and similar rights 424425 ...secured by mortgages on real estate & similar rights 425426 ..liabilities to affiliated companies 426427 ...thereof with a remaining term up to 1 year 427428 ...thereof with a remaining term of more than 5 years 428429 ...thereof secured by mortgages and similar rights 429430 ...secured by mortgages on real estate & similar rights 430431 ...thereof trade liabilities 431432 ..liabilities to associated companies 432433 ...thereof with a remaining term up to 1 year 433434 ...thereof with a remaining term of more than 5 years 434435 ...thereof secured by mortgages and similar rights 435436 ...secured by mortgages on real estate & similar rights 436437 ...thereof trade liabilities 437438 ..liabilities to companies in which participations are held 438439 ...thereof with a remaining term up to 1 year 439440 ...thereof with a remaining term of more than 5 years 440441 ...thereof secured by mortgages and similar rights 441442 ...secured by mortgages on real estate & similar rights 442443 ...thereof trade liabilities 443444 ..other liabilities 444445 ...thereof with a remaining term up to 1 year 445446 ...thereof with a remaining term of more than 5 years 446447 ...thereof secured by mortgages and similar rights 447
..(dav. geg. Gesellschaftem)
..Einlagen stiller Gesellschafter
...(dav. vor Abl. eines Jahres fallig)
...(dav. Restlaufzeit uber 5 Jahre)
...(dav. d. Pfandr. u .a . ges.)
...(durch Grundpfandrechte gesichert)
.. Gesel lschafterdarlehen
...(dav. vor Abl. eines Jahres fallig)
...(dav. Restlaufzeit iiber 5 Jahre)
...(dav. d. Pfandr. u .a . ges.)
...(durch Grundpfandrechte gesichert)
..Anleihen / Schuldverschreibungen
...(dav. vor Abl. eines Jahres fallig)
...(dav. Restlaufzeit iiber 5 Jahre)
...(dav. d. Pfandr. u .a . ges.)
...(durch Grundpfandrechte gesichert)
...(davon konvertibel)
...(davon GenuBscheine)
..Darlehen / Hypotheken / Schuldscheine
...(dav. vor Abl. eines Jahres fallig)
...(dav. Restlaufzeit iiber 5 Jahre)
...(dav. d. Pfandr. u .a . ges.)
...(durch Grundpfandrechte gesichert)
..Verbindlichkeiten ggii. Kreditinstit
...(dav. vor Abl. eines Jahres fallig)
...(dav. Restlaufzeit iiber 5 Jahre)
...(dav. d. Pfandr. u .a . ges.)
...(durch Grundpfandrechte gesichert)
..Erhaltene Anzahlungen auf Bestellung.
...(dav. vor Abl. eines Jahres fallig)
...(dav. Restlaufzeit iiber 5 Jahre)
...(dav. d. Pfandr. u.5. ges.)
...(durch Grundpfandrechte gesichert)
..Verblk. aus Lieferungen + Leistungen
...(dav. vor Abl. eines Jahres fSllig)
...(dav. Restlaufzeit iiber 5 Jahre)
...(dav. d. Pfandr. u .a . ges.)
...(durch Grundpfandrechte gesichert)
..Wechselverbindlichkeiten
...(dav. vor Abl. eines Jahres fallig)
...(dav. Restlaufzeit iiber 5 Jahre)
...(dav. d. Pfandr. u .a . ges.)
...(durch Grundpfandrechte gesichert)
..Verbindlk. ggu. verbundenen Untemeh.
...(dav. vor Abl. eines Jahres fallig)
...(dav. Restlaufzeit uber 5 Jahre)
...(dav. d. Pfandr. u.5. ges.)
...(durch Grundpfandrechte gesichert)
...(dav. aus Lieferungen + Leistungen)
..Verbindlk. ggu. assoziierten Untem.
...(dav. vor Abl. eines Jahres fallig)
...(dav. Restlaufzeit iiber 5 Jahre)
...(dav. d. Pfandr. u.§. ges.)
...(durch Grundpfandrechte gesichert)
...(dav. aus Lieferungen + Leistungen)
..Verbindlichkeiten ggii. Beteiligungen
...(dav. vor Abl. eines Jahres fallig)
...(dav. Restlaufzeit uber 5 Jahre)
...(dav. d. Pfandr. u .a . ges.)
...(durch Grundpfandrechte gesichert)
...(dav. aus Lieferungen + Leistungen)
..Sonstige Verbindlichkeiten
...(dav. vor Abl. eines Jahres fallig)
...(dav. Restlaufzeit uber 5 Jahre)
...(dav. d. Pfandr. u.a. ges.)
205

APPENDIX F continued.
448 ...secured by mortgages on real estate & similar rights 448449 ...liabilities for taxation 449450 ....thereof with a remaining term up to 1 year 450451 ....thereof with a remaining term of more than 5 years 451452 ...thereof secured by mortgages and similar rights 452453 ....secured by mortgages on real estate & similar rights 453454 ...liabilities relating to social security 454455 ....thereof with a remaining term up to 1 year 455456 ....thereof with a remaining term of more than 5 years 456457 ...thereof secured by mortgages and similar rights 457458 ....secured by mortgages on real estate & similar rights 458459 ...other liabilities 459460 ....thereof with a remaining term up to 1 year 460461 ....thereof with a remaining term of more than 5 years 461462 ...thereof secured by mortgages and similar rights 462463 ....secured by mortgages on real estate & similar rights 463464 deferred income 464465 total equity and liabilities 465466 .contingent liabilities and other obligations 466467 ..contingent liabilities 467468 ...thereof to affiliated companies 468469 ...contingent liabilities on discounted bills of exchange 469470 ...contingent liabilities from guarantees & indemnity 470471 ...thereof contingent liabilities arising from warranties 471472 ...contingent liabilit. fr. securit. arrang. f. cust liabilit. 472473 ..other financial obligations 473474 ...thereof to affiliated companies 474475 ...thereof liabilites from leasing and rental agreements 475476 ....thereof short-term 476477 ....thereofmedium-term 477478 ....thereof long-term 478479 ....thereof actual value 479480 ...commitments from investments 480481 PROFIT AND LOSS ACCOUNT 481482 .sales revenue/turnover 482483 ..excise duties were deducted from sales in the amount of 483484 ..equalisation levies accord, to the 3rd Coal Power Act 484485 .inc/dec in inven. of finished products/work in progress 485486 .own work capitalized 486487 .other operating income 487488 ..thereof special and not planned 488489 ..thereof expenses not related to the according period 489490 ..income from disposal of fixed assets and write-ups 490491 ..income from release of accruals 491492 ..income from liquidation of special items 492493 ...in accord with °6b EStG (sale of certain fixed assets) 493494 ...in accord with °52 EStG (provisions for pensions) 494495 ...thereof in accordance with foreign legal law 495496 ..other income 496497 .cost of materials 497498 ..cost of raw materials and supplies + of purchased goods 498499 ..cost of purchased services 499500 gross result 500501 .personnel expenses 501502 ..wages and salaries 502503 ..social security contributions/exp for pensions 503504 ...thereof compulsory social security contributions 504505 ...thereof expenses for pensions 505506 ...thereof expenses for other employee benefits 506507 .depreciation 507508 ..extraordinary & special depreciation & right-offs 508509 ..write-downs, depreciation of value adjustments 509510 ...extraordinary/special depreciation & right-offs 510511 ..depreciation on current assets 511512 ..special depreciation on current assets 512
...(durch Grundpfandrechte gesichert)
...Verbindlichkeiten aus Steuem
....(dav. vor Abl. eines Jahr. fall.)
....(dav. Restlaufzeit uber 5 Jahre)
...(dav. d. Pfandr. u.a. ges.)
....(durch Grundpfandrechte gesich.)
...Vblk. im Rahmen der soz. Sicherheit
....(dav. vor Abl. eines Jahr. fall.)
....(dav. Restlaufzeit uber 5 Jahre)
...(dav. d. Pfandr. u.a. ges.)
....(durch Grundpfandrechte gesich.)
...Restliche Verbindlichkeiten
....(dav. vor Abl. eines Jahr. fall.)
....(dav. Restlaufzeit uber 5 Jahre)
...(dav. d. Pfandr. u.a. ges.)
....(durch Grundpfandrechte gesich.) Rechnungsabgrenzungsposten (Passiva) Bilanzsumme (Passiva) .Eventualverbindlichkeiten ..Haftungsverhaitnisse ...(dav. ggu. verbundenen Untemehmen) ...(dav. aus Wechselindossamenten) ...(davon Verblk. aus Burgschaften) ...(dav. Verblk. aus Gewahrleistungen) ...(dav. Sich. -Best. f. fremde Vblk.) ..Sonstige finanzielle Verpflichtungen ...(dav. ggu. verbundenen Untemehmen) ...(dav. aus Miet-/Leasingvertragen) ....(dav. kurzfristig)....(dav. mittelfristig)....(dav. langfristig)....(dav. Barwert)...(dav. Bestellobligo fur Sachanl.)
G + V.Umsatz / AuBenumsatz / Erldse (netto) ..n. Abz. abges. Verbr.St...n. Abz. abges. Ausgl.Abgabe .BestandsverSnderungen .Aktivierte Eigenleistungen .Sonstige betriebliche ErtrSge ..(dav. als auBerordentlich bezeichnet) ..(dav. periodenfremd)..Ertr. aus Anlageabgangen/Zuschreib. ..ErtrSge aus ROckstellungsauflosungen ..Ertr. aus der Sopo-Aufl8sung ...(davon gemafl § 6b EStG)...(davon gemafl § 52 (5) EStG)...(dav. gem. ausl. Rechtsvorschr.) ..Sonstige Ertrage .Materialaufwand..Roh-/Hilfs-/Betriebsstoffe/bez. Waren..Bezogene LeistungenRohergebnis (Gesamtkostenverfahren).Personalaufwand..L6hne und Gehalter.. Soz. Abgaben/Alters versVUnterstutzung...(davon gesetzlicher Sozialaufwand)...(davon Altersversorgung)...(davon Unterstutzung).Abschreibungen..(dav. Sonderabschreibungen)..Abschr. auf SA/TV/Ingangs. G-Betrieb ...(dav. Sonderabschreibungen)..Abschr. auf UV ..Sonderabschreibungen auf UV
206

APPENDIX F continued:
513 .other operating expenses 513514 . .thereof special and not planned 514515 ..thereof expenses not related to the according period 515516 ..loss from value or disposals of current assets 516517 ..losses from value or disposals of fixed assets 517518 ..allocations to special items with reserve character 518519 ...in accord with °6b EStG (sale of certain fixed assets) 519520 ...in accord with °52 EStG (provisions for pensions) 520521 ...thereof in accordance with foreign legal law 521522 ..other expenses 522523 operating expenses of the original business 523524 .results from direct investments 524525 ..income from participation interest 525526 ...thereof from co-operation tax credit 526527 ...thereof from affiliated companies 527528 ...thereof from associated companies 528529 ..income from profit-pooling/transfer agreements 529530 ...thereof transfer to cover taxes by parent company 530531 ...thereof from affiliated companies 531532 ...thereof from associated companies 532533 ..expenses from assumption of loss 533534 ...thereof from affiliated companies 534535 ...thereof from associated companies 535536 .net interest income/loss 536537 ..interest and similar income 537538 ...thereof from affiliated companies 538539 ...thereof from associated companies 539540 ..income from financial assets 540541 ...thereof from affiliated companies 541542 ...thereof from associated companies 542543 ..interest and similar expenses 543544 ...thereof to affiliated companies 544545 ...thereof to associated companies 545546 .other financial result 546547 ..write-downs of financial assets and securities 547548 ...thereof special and not planned 548549 ...thereof write-downs from financial assets 549550 ...thereof write-downs from securities of current assets 550551 ..other financial income 551552 ..other financial expenses 552553 financial results of ordinary business 553554 results from ordinary activities 554555 .extraordinary income 555556 .extraordinary expenses 556557 extraordinary result 557558 .income taxes 558559 ..thereof corporation tax 559560 ..thereof trade profit tax 560561 .other taxes 561562 ..thereof property tax 562563 ..thereof trade capital tax 563564 .offsetting of taxation 564565 total taxes 565566 .compensation payments/equilization payments 566567 ..thereof other changes 567568 .income transferred from profit-pooling/transfer agreemts 568569 .income from transfer of losses 569570 offsetting of results before net income/loss for the year 570571 net income/loss for the year 571572 .net income/loss carried forward from the previous year 572573 .changes to reserves 573574 ..changes to revenue reserves 574575 ...additions to revenue reserves 575576 ...withdrawals from revenue reserves 576577 ..changes to capital reserves 577
.Sonstige betriebliche Aufwendungen
..(dav. als auBerordentlich bezeichnet)
..(dav. periodenfremd)
..Verluste aus Wertmind/Abgangen im UV
..Verluste aus Wertmind./Abgangen im AV
..Einstell. in Sopo mit Rucklageanteil
...(davon gemaB § 6b EStG)
...(davon gemaB § 52 (5) EStG)
...(dav. gem. ausl. Rechtsvorschrift.)
..Sonstige Aufwendungen Betriebsaufwend. des gewdhnl. GeschSfts .Beteiligungsergebnis ..Ertrage aus Beteiligungen ...(dav. aus K6-Steuer-Anrechnung) ...(davon aus verbundenen Untemehmen) ...(dav. aus assoziierten Untemehmen) ..Ertrage aus Gewinnabfiihrungsvertragen ...(dav. Abfuhrung f. ubem. Steuem) ...(davon aus verbundenen Untemehmen) ...(dav. aus assoziierten Untemehmen) ..Aufwendungen aus Verlustubemahme ...(davon fur verbundene Untemehmen) ...(davon fur assoziierte Untemehmen) .Zinsergebnis..Zinsen und ahnliche Ertrage ...(davon aus verbundenen Untemehmen) ...(dav. aus assoziierten Untemehmen) ..Ertrage aus Finanzanlagen ...(davon aus verbundenen Untemehmen) ...(dav. aus assoziierten Untemehmen) ..Zinsen und ahnliche Aufwendungen ...(davon an verbundene Untemehmen) ...(davon an assoziierte Untemehmen) .Obriges Finanzergebnis ..Abschreib. auf FA / Wertpap. des UV ...(dav. als auBerordentl. bezeichnet)...(dav. Abschreibungen auf FA)...(davon Abschreibungen auf Wertpap.) ..Sonstige Finanzertrage ..Sonstige Finanzaufwendungen Finanzergebnis d. gewohnlichen Geschafts Ergebnis der gewohnl. Geschaftstatigkeit .AuBerordentliche Ertrage .AuBerordentl iche Aufwendungen AuBerordentliches Ergebnis .EE - Steuem / Steuererstaltungen ..(davon Korperschaftsteuem)..(davon Gewerbeertragsteuem).Sonstige Steuem / Steuererstattungen ..(davon Vermogensteuem)..(davon Gewerbekapitalsteuem). Steuerverrechnungen Ausgewies. Steuem / Steuererstattungen .Ausschuttungen / Ausgleichszahlungen ..davon sonstige Veranderungen .Gewinnabfuhrung aufgrund von Vertragen .Ertrage aus Verlustubemahmen Ergebnisverrechnungen vor Jahresergebnis JahresiiberschuB / -fehlbetrag .Ergebnis vortrag aus Voijahr .Riicklagenveranderung ..Veranderung der Gewinnrucklagen ...Einstellung in Gewinnrucklagen ...Auflosung von Gewinnrucklagen ..Veranderung der Kapitalrucklagen
207

APPENDIX F continued:
578 ...additions to capital reserves 578 ...Einstellung in Kapitalriicklagen579 ...withdrawals from capital reserves 579 ...Auflosung von Kapitalriicklagen580 .profit and loss to minority interests 580 .Anteile Dritter581 ..thereof shares in profit 581 ..(davon Gewinnanteile)582 ..thereof shares in losses 582 ..(davon Verlustanteile)583 .other changes 583 .Sonstige Veranderungen584 changes before profit/loss 584 Veranderungen vor Bilanzgewinnausweis585 profit/loss 585 Bilanzgewinn / -verlust586 .dividends 586 .Dividende / Ausschuttungen587 .changes to reserves pursuant to shareholder's resolution 587 .Rucklagenveranderungen nach HV-BeschluB588 ..changes to revenue reserves 588 ..Veranderung der Gewinnrucklagen589 ...additions to revenue reserves 589 ...Einstellung in Gewinnrucklagen590 ...withdrawals from revenue reserves 590 ...Auflosung von Gewinnrucklagen591 ..changes to capital reserves 591 ..Veranderung der Kapitalriicklagen592 ...additions to capital reserves 592 ...Einstellung in Kapitalriicklagen593 ...withdrawals from capital reserves 593 ...Aufl8sung von Kapitalriicklagen594 .other changes 594 .Sonstige Veranderungen595 .profit/loss carried forward to the following year 595 .Ergebnisvortrag in das neue Jahr596 .divi. from parent co (only shown in consolid. statement) 596 .Dividende der Mutterges. bei Konzem597 sales revenue/turnover 597 Umsatzerlose598 income from participating interest 598 Ertrage aus Beteiligungen599 staff expenses 599 Personalaufwand600 .wages and salaries 600 .Lohne und Gehaiter601 .social security contributions & exp for pensions 601 . Soz. Abg./Altersversorg./Unterstiitzung602 ..thereof compulsory social security contributions 602 ..(davon Gesetzlicher Sozialaufwand)603 ..thereof expenses for pensions 603 ..(davon Altersversorgung)604 ..thereof expenses fot other employee benefits 604 ..(davon Unterstutzung)
208

Appendix F: DCA and IS Methodology Table 63: Calculation of DCA and IS coefficients
To illustrate the calculation of DCA and IS, we list each component of formula (1), (2) and (3) (for the calculation of the DCA coefficient) and formula (4) (for the calculation of the IS coefficient). The Row is associated with the position of the relevant item in the specimen balance sheet and profit and loss statement in Appendix F, Table 62.______ __________________________________________________
Panel A: Calculation o f DCA
Item Row Formula
Current Accruals (CA) = Aaccounts receivable + Ainventory + Aother current assets - [Aaccounts payable^ Atax payable + Aother current liabilities]
(2)
Accounts receivable + Other current assets 238 (2)Inventory 225 (2)Accounts Payable 407+412+417+422+427 (2)Tax payable 449 (2)Other current liabilities 433+439+445+455+460 (2)Trade receivables 246 (3)Sales 482 (3)Total assets 291 (3)
Panel B: Calculation o f IS
Item Row Formula
Operating Income (OI) = gross result - operating expenses (4)Gross result 500 (4)Operating expenses 523 (4)Operating Cash Flow = Operating Income (OI) + Depreciation (4)
- Current Accruals (CA)
Depreciation 15 (4)
209