Alternative Route Design for the WRTA
A Major Qualifying Project Report:
Submitted to Faculty of
WORCESTER POLYTECHNIC INSTITUTE
in partial fulfillment of the requirements for the
Degree of Bachelor of Science
Date: March 3, 2011
Approved:
______________________________________
Suzanne LePage, Advisor
Disclaimer: This report represents the work of three WPI undergraduate students submitted to the faculty as evidence of
completion of a degree requirement. WPI routinely publishes these reports on its website without editorial or peer review

i
ABSTRACT
The Worcester Regional Transit Authority (WRTA) desires for more students to use its
services. Students do not feel the need to leave campus or find public transit inconvenient. This
project designed bus routes with more appealing destinations that are time efficient for students.
The route design software, HASTUS, was utilized when scheduling the routes. Utility functions
were used to project ridership and a cost analysis was prepared regarding potential alternatives.
Two route designs with alternatives were proposed to the WRTA.

ii
AUTHORSHIP
Throughout this project, each member of the team contributed to presenting ideas,
performing essential calculations, and editing the work. Below is a list of the primary author(s) of
each section.
Key:
Jenna DeFilippo= JD Sean Donnelly= SD Christin Grygorcewicz= CG Equal Contribution= ALL
Abstract .................................................................................................................................................................................... CG
Capstone Design Statement ................................................................................................................................... SD & CG
1.Introduction ...................................................................................................................................................................... ALL
2.1 The Worcester Regional Transit Authority (WRTA) ................................................................................. CG
2.1.1 Financing ............................................................................................................................................................. CG
2.1.2 Service Area and Ridership.......................................................................................................................... CG
2.1.3 Attracting College Students .......................................................................................................................... JD
2.2 Trends of College Students ................................................................................................................................... CG
2.3 Other College Cities .................................................................................................................................................. JD
2.3.1 Chicago Public Transit .................................................................................................................................... JD
2.3.2 Boston Public Transit ...................................................................................................................................... JD
2.3.3 Rhode Island Public Transit ......................................................................................................................... JD
2.4 Design Criteria ............................................................................................................................................................ SD
2.4.1 Schedule Design ................................................................................................................................................. SD
2.4.2 Service Design .................................................................................................................................................... SD
2.4.3 Operational Design ........................................................................................................................................... SD
2.4.4 Bus and Rail Transit Systems ....................................................................................................................... SD
2.4.5 Design Criteria for the wrta .......................................................................................................................... SD
2.4.6 Software used by the WRTA ......................................................................................................................... SD
2.4.7 Adapting Design to College Life ....................................................................................................... JD & CG
3. Methodology .................................................................................................................................................................... ALL
3.1 Preliminary Research ........................................................................................................................................... ALL
3.1.1 Acquiring Background Information .......................................................................................................... JD

iii
3.1.2 Learning HASTUS ............................................................................................................................................. CG
3.1.3 Bus Rides ................................................................................................................................................... JD & CG
3.2 Design Alternatives .................................................................................................................................................. JD
3.3 Analysis and Calculations ..................................................................................................................................... CG
3.3.1 Projected Ridership ........................................................................................................................................ CG
3.3.2 Cost Analysis ...................................................................................................................................................... CG
3.4 Summary ....................................................................................................................................................................... JD
4.1 Choosing Routes to Modify ................................................................................................................................. ALL
4.1.1 Using HASTUS .................................................................................................................................................... SD
4.1.2 Late Night Routes .............................................................................................................................................. JD
Park Avenue .................................................................................................................................................................. CG
5. Conclusions and Recommendations .............................................................................................................. JD & CG

iv
TABLE OF CONTENTS
Abstract ......................................................................................................................................................................................... i
Authorship .................................................................................................................................................................................. ii
Table of Contents .................................................................................................................................................................... iv
Table of Figures ....................................................................................................................................................................... vi
Table of Tables ........................................................................................................................................................................ vii
Capstone Design Statement .............................................................................................................................................. viii
List of Acronyms ..................................................................................................................................................................... xi
Basic Definitions .................................................................................................................................................................... xii
1. Introduction ..................................................................................................................................................................... 1
2. Background ...................................................................................................................................................................... 3
2.1 The Worcester Regional Transit Authority (WRTA) .................................................................................... 3
2.1.1 Financing ................................................................................................................................................................ 3
2.1.2 Service Area and Ridership............................................................................................................................. 6
2.1.3 Attracting College Students ............................................................................................................................ 7
2.2 Trends of College Students ...................................................................................................................................... 8
2.3 Other College Cities .................................................................................................................................................... 9
2.3.1 Chicago Public Transit ...................................................................................................................................... 9
2.3.2 Boston Public Transit ........................................................................................................................................ 9
2.3.3 Rhode Island Public Transit ......................................................................................................................... 10
2.4 Design Criteria ............................................................................................................................................................ 10
2.4.1 Schedule Design ................................................................................................................................................. 10
2.4.2 Service Design .................................................................................................................................................... 11
2.4.3 Operational Design ........................................................................................................................................... 11
2.4.4 Bus and Rail Transit Systems ....................................................................................................................... 13
2.4.5 Design Criteria for the wrta .......................................................................................................................... 13
2.4.6 Software used by the WRTA ......................................................................................................................... 14
2.4.7 Adapting Design to College Life .................................................................................................................. 16
3. Methodology .................................................................................................................................................................. 17
3.1 Preliminary Research .............................................................................................................................................. 17
3.1.1 Acquiring Background Information .......................................................................................................... 17
3.1.2 Learning HASTUS .............................................................................................................................................. 18
3.1.3 Bus Rides .............................................................................................................................................................. 19
3.2 Design Alternatives .................................................................................................................................................. 20
v
3.3 Analysis and Calculations ...................................................................................................................................... 20
3.3.1 Projected Ridership ......................................................................................................................................... 21
3.3.2 Cost Analysis ....................................................................................................................................................... 23
3.4 Summary ....................................................................................................................................................................... 23
4. Analysis And Calculations ........................................................................................................................................ 24
4.1 Choosing Routes to Modify .................................................................................................................................... 24
4.1.1 Using HASTUS .................................................................................................................................................... 24
4.1.2 Late Night Routes .............................................................................................................................................. 27
4.1.3 Park Avenue ........................................................................................................................................................ 41
5. Conclusions and Recommendations .................................................................................................................... 55
Works Cited .............................................................................................................................................................................. 63
Appendices ............................................................................................................................................................................... 64
Appendix A: Bus Trip Details and Observations .................................................................................................. 64
Appendix B: Weekend Route Projected Ridership ............................................................................................. 66
Appendix C: New Park Ave Option 1 Projected Ridership............................................................................... 68
Appendix D: New Park Ave Option 2 Projected Ridership .............................................................................. 70
Appendix E: New Park Ave Option 3 Projected Ridership .............................................................................. 72
vi
TABLE OF FIGURES
Figure 1: Expected Funding................................................................................................................................................. 4 Figure 2: Worcester Bus Routes ........................................................................................................................................ 6 Figure 3: HASTUS Parameters.......................................................................................................................................... 15 Figure 4: Timeline ................................................................................................................................................................. 23 Figure 5: Inbound Travel Design ..................................................................................................................................... 25 Figure 6: Outbound Travel Design ................................................................................................................................. 26 Figure 7: Route 30 Travel Pattern .................................................................................................................................. 27 Figure 8: Option 1- Late Night Route 1 ......................................................................................................................... 29 Figure 9: Option 1- Late Night Route 2 ......................................................................................................................... 29 Figure 10: Option 2 Route .................................................................................................................................................. 36 Figure 11: Option 3 Route .................................................................................................................................................. 39 Figure 12: Route 27 Outbound......................................................................................................................................... 43 Figure 13: Route 27 Inbound ............................................................................................................................................ 43 Figure 15: Route 30 Inbound ............................................................................................................................................ 45 Figure 16: Route 30 Outbound......................................................................................................................................... 46 Figure 17: Park Ave Route Option 1 .............................................................................................................................. 48 Figure 18: New Park Ave. Route running from West boylston walmart to Webster Square Plaza ..... 51 Figure 19: New Park Ave Option 2 ................................................................................................................................. 53
vii
TABLE OF TABLES
Table 1: Revenue...................................................................................................................................................................... 5 Table 2: Expenses .................................................................................................................................................................... 5 Table 3: Option 1- Late Night Route 1 Information ................................................................................................. 30 Table 4: Option 1- Late Night Route Times ................................................................................................................. 30 Table 5: Option 1- Late Night Route 2 Information ................................................................................................. 31 Table 6: Option 1- Late Night Route 2 Times ............................................................................................................. 31 Table 7: Option 1- Travel Times Matrix ....................................................................................................................... 32 Table 8: Option 1- Late Night Route Gas Cost ............................................................................................................ 32 Table 9: Operator Pay .......................................................................................................................................................... 33 Table 10: Option 1- Nightly Income Expectations ................................................................................................... 33 Table 11: Option 1- Yearly Income Expectations ..................................................................................................... 34 Table 12: Option 1- Late Night Route Gas Cost (40 Weeks) ................................................................................ 34 Table 13: Operator Pay (40 Weeks) .............................................................................................................................. 35 Table 14: Yearly Income Expectations (40 Weeks) ................................................................................................. 35 Table 15: Option 2- Late Night Route Information .................................................................................................. 37 Table 16: Option 2- Times .................................................................................................................................................. 37 Table 17: Option 2- Travel Times Matrix..................................................................................................................... 38 Table 18: Option 2- Gas Cost ............................................................................................................................................. 38 Table 19: Option 3- Late Night Route Information .................................................................................................. 39 Table 20: Option 3- Times .................................................................................................................................................. 40 Table 21: Option 3- Travel Times Matrix..................................................................................................................... 40 Table 22: Option 3- Gas Cost ............................................................................................................................................. 41 Table 23: Travel Times to Auburn Mall ........................................................................................................................ 44 Table 24: Time Savings ....................................................................................................................................................... 47 Table 25: Time to Wachusett Plaza ................................................................................................................................ 49 Table 26: New Park Ave Option 1 Gas Cost ................................................................................................................ 50 Table 27: Time To W. Boylston Walmart and Webster Square Plaza .............................................................. 52 Table 28: New Park Ave Option 2 Gas Cost ................................................................................................................ 52 Table 29: Time To Greendale Mall and Auburn Mall .............................................................................................. 54 Table 30: New Park Ave Option 3 Gas Cost ................................................................................................................ 54 Table 31: Route Evaluation Rubric ................................................................................................................................ 55 Table 32: Park Ave Evaluation ......................................................................................................................................... 57 Table 33: Late Night Route Evaluation ......................................................................................................................... 59 Table 34: Late Night Option 1 Matrix ............................................................................................................................ 60 Table 35: Late Night Option 2 Matrix ............................................................................................................................ 60 Table 36: Late Night Option 3 Matrix ............................................................................................................................ 61

viii
CAPSTONE DESIGN STATEMENT
In order to meet the constraints set forth by the Accreditation Board for Engineering and
Technology (ABET) this project needed to meet the requirements of the capstone design experience
for Major Qualifying Projects. According to ABET General Criterion 4, “students must be prepared
for engineering practice through the curriculum culminating in a major design experience based on
knowledge and skills acquired in earlier course work and incorporating engineering standards and
realistic constraints that include most of the following considerations: economic; environmental;
sustainability; manufacturability; ethical; health and safety; social; and political.” (Criteria for
Accrediting Engineering Programs, 2008).A portion of this Major Qualifying Project applied an
economical approach to the design of alternative route designs for the Worcester Regional Transit
Authority (WRTA) that is more accessible to college students. Other areas that are heavily
populated by students, such as Boston, Chicago and Rhode Island have had success with student
ridership. The project analyzed these systems, Worcester’s current transit system and multiple
design factors to produce alternative route systems that better fit student needs. The project also
incorporated the following topics covered in the capstone design statement: sustainability,
economic, environmental, ethical, political, manufacturability, health and safety and social.
Sustainability
Properly developed transit routes are designed to be sustainable. The alternative routes for
this project were designed in order to save fuel and decrease the amount of privately operated, or
family, vehicles on the road. Each of these concepts reduced the impact of automobiles on the
environment so that fuel and the environment may be preserved for future generations.
Economic
Transit systems must take revenue generated from fare boxes as well as fuel costs into
consideration when creating route systems. The redesign or addition of alternative routes to

ix
Worcester’s transit system is expected to increase revenue. Alternative designs may boost revenue
through increased ridership as well as be more efficient and therefore save money in fuel costs. A
larger amount of college student riders could bring in revenue that is absent in the current system.
This project conducted a cost analysis based on projected new ridership and fuel cost.
Environmental
The WRTA is currently reducing their impact on the environment with the purchase of four
hybrid buses. These hybrid buses result in a 30% - 40% reduction in emissions (WRTA, 2010).
However, this project was more focused on transit design and the amount of emissions that could
be reduced with the design of more efficient routes. The decrease in the amount of vehicles on the
road and the pollutants they emit with more students choosing public transportation over private
transportation was also taken into consideration.
Ethical
All transportation projects follow the code of ethics for civil engineers. This project used
technology and knowledge to better the transit system for society while having as little impact on
the environment as possible. All work was done honestly and in compliance with all rules in order
to enhance knowledge.
Political
Input from the WRTA Advisory Board will be used when designing the alternative routes.
Although this project did not directly address the political effects of alternative route designs some
collaboration between colleges and the WRTA may be necessary for the funding of the proposed
routes. Issues between the WRTA, college community and city of Worcester regarding funding may
arise as well.

x
Manufacturability
This project produced realistic route designs that fit student needs. The alternative routes
were designed to be feasible for the WRTA to implement. As a result of the proposed designs the
availability of the transit system should have increased student ridership.
Health and Safety
When designing a transit system bus stop safety is priority. This project considered the
design of a hub for students placed at a central location in-between several colleges. The hub and
any additional stops for the alternative routes were located in an area that is safe from oncoming
traffic, near crosswalks or an area with safe traffic control devices and adequate lighting.
Public transportation decreases the number of vehicles on the road, increasing road safety
as well as public health. According to the American Public Transportation Association (APTA)
emissions from road vehicles are the largest contributors to smog. The goal of the project was to
increase the amount of student riders, resulting in a decreased amount of vehicles on the road
allowing for a reduction in smog and a healthier Worcester.
Social
The goal of the project was to successfully increase student ridership and promote
interaction between students of different colleges in the city of Worcester. The routes design
included more of the student population and as a result encouraged students to be more involved in
Worcester’s community. An increase in the number of student friendly routes increased the
amount of students utilizing retail areas, restaurants and cafes in the Worcester area.
xi
LIST OF ACRONYMS
ARRA- American Reinvestment and Recovery Act
APTA- American Public Transit Authority
AVA- Automatic Voice Annunciation
AVL- Automated Vehicle Locator
CBD- Central Business District
CMMPO- Central Massachusetts Metropolitan Planning Organization
CMRPC- Central Massachusetts Regional Planning Commission
CTA-Chicago Transit Authority
FTA- Federal Transit Administration
FY- Fiscal Year (ending on June 30 for the WRTA)
IQP- Interactive Qualifying Project
MBTA–Massachusetts Bay Transportation Authority
MQP- Major Qualifying Project
RIPTA- Rhode Island Public Transit Authority
RTP- Regional Transportation Plan
TIP- Transportation Improvement Program
UPT-Unlinked Passenger Trips
WRTA- Worcester Regional Transit Authority

xii
BASIC DEFINITIONS
Block- The term used for each driver whose hours worked on a route are manually inputted into the software program HASTUS.
Captive transit rider- A person without access to private transportation.
Cross-town route- A route going from the CBD of one town or city to another that has many stops in between.
Express route- A cross-town route that uses the highway and has no stops.
Headway- Time between vehicles on the same route and traveling in the same direction.
Hub - Area where all routes run and allow riders to transfer to other routes.
Major Activity Center- A place characterized by a large transient population and heavy traffic.
Modal Split- The ratio of trips made by a single mode of transportation to total trips made by all modes of transportation.
Parameter- The term used for the rules and regulations inputted into the software program HASTUS.
Shuttle system-Short routes that transfer riders from one location to another transportation system such as a rail station or airport.
Span of service- The time allotted between the first and last trip on any given route.
Trip end density- Number of transit patrons in an area.
Trunk Route- A route that runs from one hub to another.

1
1. INTRODUCTION
Transit systems are essential to communities, especially cities with large populations. They
reduce the number of cars in the streets, resulting in less traffic, and a less polluted environment.
Furthermore, they provide a means of transportation for people who do not have cars or just prefer
an alternative way of getting places. Worcester, Massachusetts has a population of approximately
182,000, over 16% being college students who may not be able to have a car at their campus (City
of Worcester, 2010). Therefore, it is essential to provide such a large population with a reliable way
of getting to their most popular destinations.
Worcester is home to a large community of college students. There are a total of 13
campuses with a total student population of over 30,000. Last year, two students from WPI
approached the WRTA with a project because they were from other parts of the world where
transit service was more heavily utilized and wanted to explore why so few college students in
Worcester took advantage of the service. That project included researching the reasons behind
students not using the transit system. Surveys and focus groups that the project team conducted
showed that students were either unaware of the transit system or found it inconvenient. Several
issues that students expressed are:
Perceived lack of safety
Inconvenience with student schedules and classes
Time inefficiency
Lack of bus stops or routes
Overall unawareness of the system
Of the reasons listed above, inconvenience with student schedules and classes, time efficiency, and
lack of bus stops or routes are the driving factors of our in-depth analysis of the bus system and

2
how to improve service to students. This Major Qualifying Project (MQP) developed alternative
route designs in an attempt to attract more college students by addressing the needs and concerns
that they have previously expressed. We conducted a cost analysis, evaluated effects on time and
scheduling, predicted new ridership and considered sustainability.

3
2. BACKGROUND
2.1 THE WORCESTER REGIONAL TRANSIT AUTHORITY (WRTA)
The Worcester Regional Transit Authority (WRTA) was created in 1974 and given the
responsibility to develop, finance and contract the operation of transportation facilities and
services within the Worcester area (WRTA, 2010). Its goal is to provide convenient, comfortable,
safe, reliable and cost efficient mobility services. The WRTA’s fleet is comprised of 48, 35-foot and
40-foot buses, four of which are clean diesel-electric hybrid. In an effort to be more
environmentally conscious all new buses purchased by the WRTA are either newer Gilligs that get
4-5 miles per gallon (mpg) or hybrid buses that get 6-7 mpg (WRTA, 2010). Compared to the older
fleet, which received only 3-4 mpg and considering the amount of mileage each bus gets, the newer
buses are much more energy efficient.
2.1.1 FINANCING
The WRTA’s $20-million operating budget is funded by federal, state and local monies and
revenue. Revenue is generated by fare box proceeds as well as money received for advertisements
on the buses. Each year state funding accounts for up to 75% of the total cost of service, fare box
proceeds account for 15%-30% of operating costs and Federal funds can be used only for tangible
objects, (buses, new fare boxes, etc.) (WRTA, 2010). Expected funding sources for the Fiscal Year
(FY) 2010 are shown in Figure 1 below.

4
FIGURE 1: EXPECTED FUNDING
Day to day business at the WRTA is managed by Stephen O’Neil, the Administrator, as well
as the WRTA Advisory Board. The Advisory Board consists of the City Manager of Worcester
(currently Michael O’Brien) as well as representatives from the 35 member communities of the
WRTA. Representatives of the 35 member communities are the City Manager or Mayor of each city,
Chairman from the Board of Selectman, or the Town Manager or Town Administrator of the town.
There are currently representatives from Auburn, Barre, Brookfield, Charlton, Clinton, Douglas,
Holden, Leicester, Millbury, Northborough, Oxford, Rutland, Shrewsbury, Spencer and West
Boylston on the Advisory Board.
In FY 2009 the WRTA was forced to cut services and raise fare prices for the first time in 5
years due to the rise in fuel costs and health insurance. Although they received $12.4 million from
the American Recovery and Reinvestment Act (ARRA) through the Federal Transit Administration
(FTA) (WRTA Advisory Board, 2009), the money was used to buy 15 new Gillig buses because
Federal funds can only be used for capital expenditures (i.e. the purchase of tangible objects). The
Advisory Board reported total revenue of $20,069,879 and net expenses of $19,282,793 for FY
Passenger Revenue
15%
Administration & Other
2%
Federal Assistance
24%
Member Communities
16%
Commonwealth of MA 43%
FY 2010 Expected Funding Sources

5
2009 (WRTA Advisory Board, 2009). Tables 1 and 2 below break down the net revenue and
expenses, respectively.
Revenue
Source Amount
Federal Government $ 4,661,770.00
Commonwealth of MA $ 8,814,942.00
Member Municipalities $ 3,313,819.00
Passenger Revenues $ 2,914,852.00
Advertising and other $ 364,496.00
NET $ 20,069,879.00
TABLE 1: REVENUE
Expenses
Source Amount
Fixed Route Transit Services $ 13,455,818.00
Demand Response $ 4,106,310.00
Administrative Expenses $ 1,321,409.00
Management Fee $ 399,256.00
NET $ 19,282,793.00
TABLE 2: EXPENSES
The major costs of the WRTA include labor, fuel, services, material and supplies,
maintenance and insurance. Although most of the WRTA’s employees are bus drivers, or operators,
they must also employ foremen, mechanics, janitors and office personnel. The total labor expense
for FY 2009 was about $1.8 million and it costs the WRTA $81 thousand (on average) to employ
each operator (WRTA, 2009). Services to maintain the WRTA facilities in FY 2009 were $61
thousand, materials and supplies for buses cost $756 thousand and insurance cost $454 thousand
(WRTA, 2009). The WRTA used an average of 34,253 gallons of diesel fuel at $3.28/gallon and
2,974 gallons of gasoline at $2.08/ gallon for a total of $118,536 per month in the FY2009 (WRTA,
2009).
6
2.1.2 SERVICE AREA AND RIDERSHIP
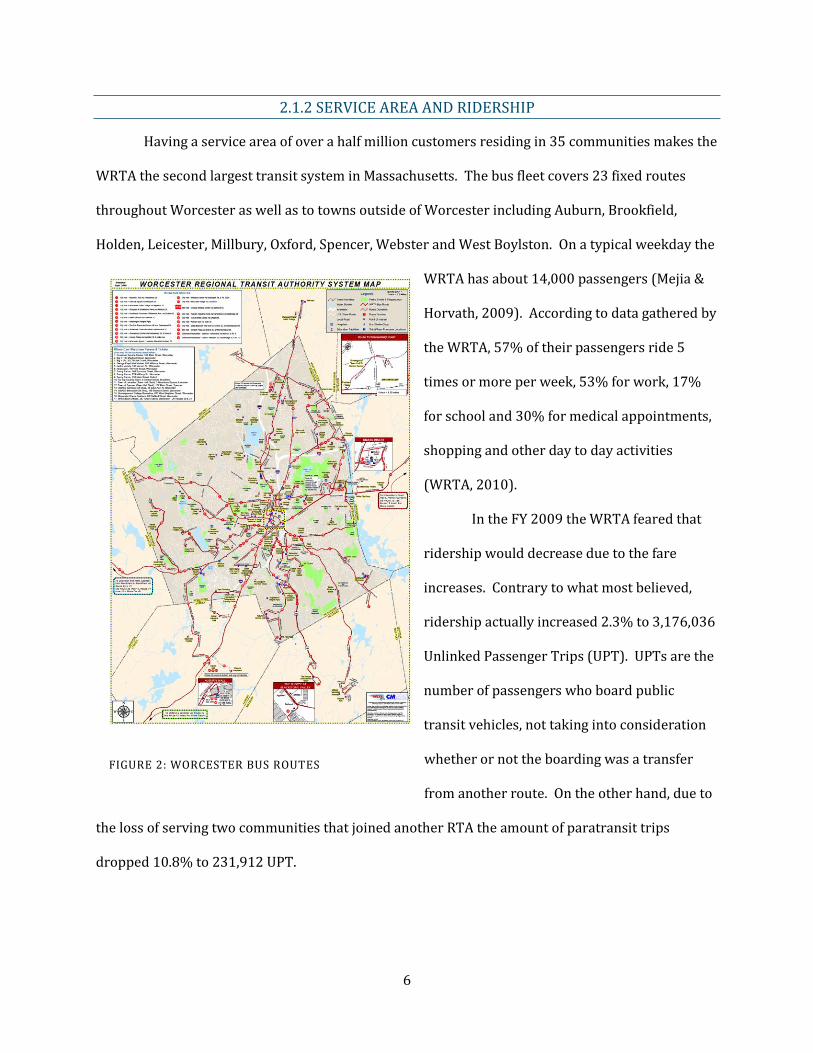
Having a service area of over a half million customers residing in 35 communities makes the
WRTA the second largest transit system in Massachusetts. The bus fleet covers 23 fixed routes
throughout Worcester as well as to towns outside of Worcester including Auburn, Brookfield,
Holden, Leicester, Millbury, Oxford, Spencer, Webster and West Boylston. On a typical weekday the
WRTA has about 14,000 passengers (Mejia &
Horvath, 2009). According to data gathered by
the WRTA, 57% of their passengers ride 5
times or more per week, 53% for work, 17%
for school and 30% for medical appointments,
shopping and other day to day activities
(WRTA, 2010).
In the FY 2009 the WRTA feared that
ridership would decrease due to the fare
increases. Contrary to what most believed,
ridership actually increased 2.3% to 3,176,036
Unlinked Passenger Trips (UPT). UPTs are the
number of passengers who board public
transit vehicles, not taking into consideration
whether or not the boarding was a transfer
from another route. On the other hand, due to
the loss of serving two communities that joined another RTA the amount of paratransit trips
dropped 10.8% to 231,912 UPT.
FIGURE 2: WORCESTER BUS ROUTES

7
2.1.3 ATTRACTING COLLEGE STUDENTS
A recent trend of the WRTA is to attract more of the college student population of
Worcester. Students are currently an untapped market and if they were to fill buses it could
increase the WRTA’s fare box revenue and generate the ridership numbers to justify additional
federal and state financial assistance. One approach taken to increase student ridership was to
more heavily advertise to colleges. The WRTA has supplied freshmen at select universities in the
area with free bus passes for their first semester because they believe that students decide what
mode of travel they will use within their first 6 months of college attendance. Additionally, they
have created a brochure that lists some attractions including stores and restaurants around
Worcester that may be appealing to college students, along with the routes to get there. The
sections of the pamphlet include route numbers to get to the library, Union Station, theatres and
museums, parks/activities, malls, shopping centers and grocery, nightlife and dining. The WRTA is
working with campus bookstores to devote a section to the bus system that will include these
brochures, route maps, schedules, and passes for purchase. They have also partnered with
Wachusett Mountain in offering a route to the ski area for $1.50 to students with monthly or
semester passes as well as discounts off of their lift tickets with the possession of any bus pass.
Furthermore, the WRTA would like to investigate new service ideas and route designs in an attempt
to better adapt to the needs of college students.
The WRTA is also investing in new technologies that make riding the bus easier and more
convenient for all riders and therefore expected to increase student ridership. These technologies
are anticipated to take at least one year (Farley, 2010) to institute and include Automated Vehicle
Locator (AVL), transit signal priority, message boards with real-time bus location, electronic bus
pass dispensers, new fare boxes and Automatic Voice Annunciation (AVA). AVL will be a program
on the WRTA website that shows where any particular bus of interest is en route, saving time
waited at bus stops for riders. Transit signal priority keeps traffic signals green longer for buses,

8
saving fuel and travel time. Electronic message boards with bus locations at each major bus stop
will be installed that will show riders when their bus will arrive. AVA will be a system on the bus
that automatically shows and tells riders what stop is approaching, making it less confusing for
inexperienced riders. The WRTA also wishes to invest in electronic bus pass dispensers that will be
situated throughout Worcester as well as new fare boxes that can be tapped by a bus pass instead
swiping the bus pass.
2.2 TRENDS OF COLLEGE STUDENTS
College students have different needs than the typical captive transit rider. They operate on
completely different schedules, want and need to go to different places and due to their
inexperience have different concerns with public transit. An evaluation of the WRTA service from a
student’s perspective was recently conducted by WPI students Adrian Mejia and Nathan Horvath.
Their project analyzed why public transit student ridership in Worcester is low and its findings
provided the WRTA with valuable information.
The evaluation found time efficiency and scheduling to be a major reason why college
students choose other modes of transportation over public transit. A college student’s life is based
around classes, homework, studying and sometimes even a part time job. Time waiting for a bus,
transferring and arriving early is valuable time lost that could have been spent finishing
assignments or preparing for tests. Students are also concerned that there is not enough time in
between classes to take a bus somewhere due to headway, transferring and delays. Often a college
student’s day runs later than the services the WRTA offers, which creates concern that they will go
somewhere using their bus pass and have no way back home.
To many college students public transit can be an unattractive and scary thing. Especially in
Worcester, students are aware of how dangerous it can be when venturing off campus. They do not
have enough information about the public transit system needed to trust it and feel safe using it.
9
Their concerns might include feeling unsafe while waiting at a stop, on the actual bus or getting lost
in an unfamiliar territory. Routes can be confusing especially when transfers are needed. This is
another major reason students would rather travel privately than using public transit.
2.3 OTHER COLLEGE CITIES
There are some areas in the United States with very successful programs to enhance college
student ridership. Specifically, Chicago, Boston and Rhode Island each have distinct systems that
can be analyzed to improve Worcester’s transit system. Although they may not be appropriate
solutions on their own, ideas can be drawn from each to create a unique service plan for Worcester.
2.3.1 CHICAGO PUBLIC TRANSIT
In Chicago, it is mandatory for all of the 140,000 full-time students at the 45 participating
colleges and universities to have a U-Pass. In most cases, the cost of the pass is built in to their
tuition. The schools are charged 81 cents per student per day for unlimited rides on the buses and
subways. This strategy produced $20 million in proceeds for the Chicago Transit Authority (CTA)
last year. The CTA says that signing up college students boosts ridership and revenues while also
helping the environment. This was originally introduced as a pilot program in 1998. The CTA
started small by getting a few schools interested to weigh the pros and cons and get all of the
glitches out. They found that it was much easier to gain interest than expected (Gurley, 2010).
2.3.2 BOSTON PUBLIC TRANSIT
Boston takes a different approach in which the MBTA semester pass program is voluntary.
However, only 20,000 of approximately 383,000 undergraduate and graduate students buy the
passes. This generates roughly $5 million a year in revenue. They have looked at the program that
Chicago uses, but do not think that it would be attractive to Boston students because most prefer to
walk or ride bikes, and it is the commuters that make the most use of the transit system. The

10
program is not considered flexible and the schools fear that it would turn students away.
Conversely, a Boston University senior thinks that the pass is a good idea, and that students and
parents would be wary at first but eventually see the benefits (Gurley, 2010).
2.3.3 RHODE ISLAND PUBLIC TRANSIT
Rhode Island’s transit (RIPTA) works with participating colleges and universities to boost
student ridership with the Providence U-Pass since 2001. Students get free or reduced fair transit
depending upon which college or university they attend. For example, all students from Brown
University and Providence College can ride the bus for free and simply have to show their student
ID when boarding. Alternatively, students at Roger Williams University can purchase 15-ride
passes at 50% off in the school bookstore (UPASS). This is possible because the colleges and
universities subsidize the program.
2.4 DESIGN CRITERIA
When designing a transit system several factors must be taken into consideration. Different
aspects that go into a transit system’s design including schedule design, service design and
operational design are essential to its successful operation. Factors that are taken into
consideration when designing a transit system are demographics such as population of the city,
employment and transit dependency. Much of the Worcester population is dependent on the use of
the transit system to get to and from work along with their other desired destinations throughout
the city (WRTA, 2010).
2.4.1 SCHEDULE DESIGN
Schedule design is based upon three main factors; span of service, frequency of service and
loading guidelines. The span of service is the time allotted between the first and last trip on any
given route. Routes may be needed specifically for weekends, weekdays, throughout the entire day

11
or specifically only one interval of time during the day. Frequency of the service is determined by
the demand of the riders and should be designed to meet those demands in order to make their
travel patterns more convenient and successful (Transit Design Manual, 2004). Scheduling is
important to the operation of a transit system because the schedule determines which buses run
which routes throughout the day, assuring that riders get to their desired destinations reasonably
on time. One goal of the WRTA is to have buses running routes in 15 minute intervals so that riders
have access to several buses throughout the day and the schedule runs smooth (Farley, 2010).
2.4.2 SERVICE DESIGN
Service design consists mostly of the types of routes offered to riders. Routes can be
designated as trunk, cross-town, circular shuttle or express routes depending upon its purpose.
The type of route should be chosen according to what is needed by the riders. Trunk design is used
for a rider to get from one central hub to another in order to transfer to other routes that may
become cross-town or express routes. Cross-town routes allow for a rider to get from one end of
the central business district to the other with several stops in between while express routes run on
highway systems and allow for riders to get from one area, such as an urban area, to the CBD.
Shuttle systems are often short routes that transfer riders from one location to another
transportation system such as a rail station or airport (Transit Design Manual, 2004).
2.4.3 OPERATIONAL DESIGN
Operational design often consists of bus design and maintenance, roadway or route design
and bus stops. Bus design begins with the selection of the vehicles used in the transit system, which
are typically 30-foot, 35-foot or 40-foot buses. Buses are selected based on their ability to travel the
terrain or roadways along their route. A smaller bus would be used on a route that has a lower
number of riders but may also travel roadways with heavy traffic flow, on-street parking, or narrow
travel lanes. The larger buses are often used on routes that are in high demand by riders and travel

12
on roadways that are wider and consist of fewer conflicts with other vehicles. The capability of the
bus to travel the roadways already existing in the city is essential to the infrastructure of the transit
system. However, transit providers will often also work with city planning officials to improve
roadway geometrics and enhance transit-friendly infrastructure.
Routes are to be designed to maximize the operating speed and minimize the travel time of
riders. Route spacing is crucial to the success of a transit system (Transit Design Manual, 2004).
For example, vehicles that travel on the same routes in opposite directions allow for a high level of
accessibility throughout the city and enhance the attractiveness of the transit system. Routes
should also be as direct as possible to make them more convenient for riders. In order to achieve
these direct routes, transit providers must design the routes based on the roadways that reach each
destination. It is essential to reach each destination in a timely manner while also allowing for the
ease of travel for the operators. The more access riders have to desired destinations throughout
the city and the more convenient it is for them to ride the more likely they are to use the city’s
transit system.
Bus stops are designed based on three major factors: safe operation of the bus, safety of the
rider and rider convenience. Safe operation pertains to the ability of the bus to safely exit and
reenter the flow of traffic with minimum interference with other vehicles on the roadway. The
position of the bus, while stopped, should not interfere with the sight or view of the other motorists
on the road. The safety of the rider pertains to the surface of the bus stops, which should be even
and allow for safe and even footing for the rider. The bus stop location should also insure that the
riders are able to wait at the stop without being subject to any danger of moving traffic along the
roadway. Bus stops are to be located, as often as possible, near crosswalks or safe traffic control
devices that allow for the riders to easily cross roadways in order to transfer from one location to a
convenient bus stop. They should also have adequate lighting for riders to be able to locate the stop
as well as allow the driver to locate the riders waiting at existing stops. The final key element

13
allowing for rider convenience is the location and identification of the bus stops. Bus stop signs
should be posted in locations that are often traveled by pedestrians and should stand out to riders
so that they know where the buses may stop and which routes run through that specific stop
(Transit Design Manual, 2004).
2.4.4 BUS AND RAIL TRANSIT SYSTEMS
One major aspect of scheduling is the relationship between bus and rail transit systems.
Many riders may take the bus to a train station and then travel by train to their desired locations.
In order for this to run smoothly bus schedules must run somewhat in line with train schedules.
Local transit bus systems may also link with larger bus systems in the area such as companies like
Peter Pan or Greyhound. These larger bus systems do not run local routes; instead they run from
city to city. For example, this may cater to an individual from a suburb working in a major city area.
2.4.5 DESIGN CRITERIA FOR THE WRTA
The WRTA routes are designed based on a radial traffic system used mainly in central
business districts (CBD) such as downtown Worcester (Basic Design Controls, 2006). Located
within Worcester’s CBD, City Hall acts as a hub or area where all routes run and allow riders to
transfer to other routes. Routes act as a web coming into the central hub, City Hall, and then
continue in the same direction out of City Hall. Several buses may run the same routes at the same
time but in different directions. The hub allows for riders to switch to another route or to stay on
the same bus while it waits for other riders transferring from a different route to the one the bus is
traveling. In Worcester every bus runs through the center of the city and passes by Union Station
or locations near Union Station making it convenient for riders to take the bus to or near Union
Station where they can then take a train to their desired destination. It has also become apparent
that the WRTA may be planning on moving their central hub to Union Station in order to increase
the ease of transferring between bus and train systems in the city.
14
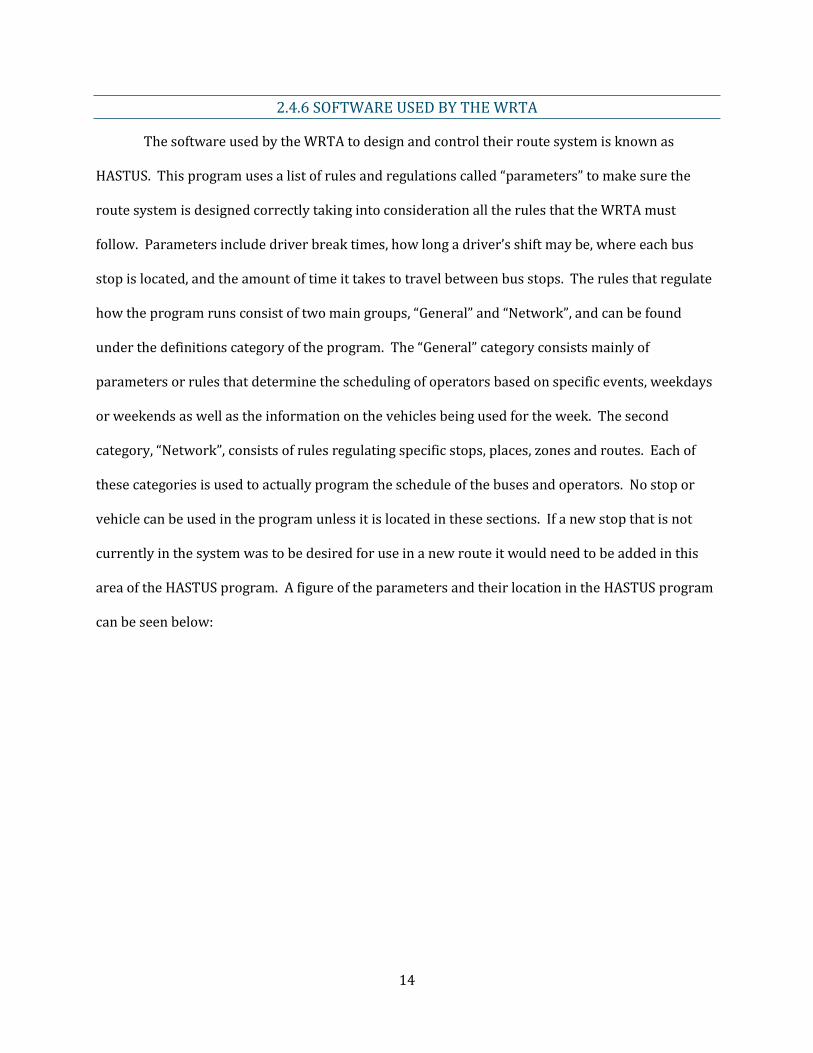
2.4.6 SOFTWARE USED BY THE WRTA
The software used by the WRTA to design and control their route system is known as
HASTUS. This program uses a list of rules and regulations called “parameters” to make sure the
route system is designed correctly taking into consideration all the rules that the WRTA must
follow. Parameters include driver break times, how long a driver’s shift may be, where each bus
stop is located, and the amount of time it takes to travel between bus stops. The rules that regulate
how the program runs consist of two main groups, “General” and “Network”, and can be found
under the definitions category of the program. The “General” category consists mainly of
parameters or rules that determine the scheduling of operators based on specific events, weekdays
or weekends as well as the information on the vehicles being used for the week. The second
category, “Network”, consists of rules regulating specific stops, places, zones and routes. Each of
these categories is used to actually program the schedule of the buses and operators. No stop or
vehicle can be used in the program unless it is located in these sections. If a new stop that is not
currently in the system was to be desired for use in a new route it would need to be added in this
area of the HASTUS program. A figure of the parameters and their location in the HASTUS program
can be seen below:
15
FIGURE 3: HASTUS PARAMETERS
The program allows the user to manually enter routes to be driven by a certain operator for
their assigned shift; each driver in the program is called a “block”. Should the route design
submitted break one of the parameters an error message will be displayed saying that the route
must change, but will not give a reason why the route does not work. The problem with the route
must be determined solely by the person operating the program. HASTUS is not necessarily a
program that is used to design a route. The program focuses more on how to schedule the desired
route by which operator will be traveling the route at what time, which routes can be broken up by
operator or when and where an operator will be located while traveling the route. The program is
most useful for breaking routes up between two different operators and having them travel two
different routes in an hour window. For example, operator 1 may travel route A for 40 minutes and
route B for 20 minutes while operator 2 travels route B for 20 minutes and then route A for 40.
This allows for each operator to have equal traveling hours as well as allowing them to travel along
different routes throughout the work week rather than repeating the same routine daily.

16
2.4.7 ADAPTING DESIGN TO COLLEGE LIFE
The WRTA is attempting to reach out to college students in order to increase the number of
students understanding and utilizing the transit system in the area. In order to increase the
number of college riders, many design aspects need to be addressed. Route designs may need to be
changed in order to make the system easier for students to ride. Such adjustments may include bus
stops located closer to college campuses in the area, changes in the existing routes and the addition
of routes or another hub. Alternative routes may need to run through or close to college campuses
if they do not currently while also taking into consideration the destinations students may wish to
reach. An extension in service hours and a weekend route to destinations frequently traveled to by
college students is another way the WRTA may increase student ridership.
Scheduling may be one of the toughest problems when attempting to attract more college
students. Many students may wish to use the bus system to get to the train, go visit other colleges
and universities or go into cities like Boston or Providence. The bus schedule currently runs
smoothly with the train schedules, but many routes operate on approximately one-hour headways.
College students have busy schedules packed with classes and extracurricular activities. If the bus
schedule can be managed in order to provide the 15-minute intervals that the WRTA desires, the
number of conflicts between the bus and college schedules should be minimized.
Route and bus design and scheduling are very important aspects of any transit system that
are critical to its success. Although much planning has already gone into the design of the current
transit system in the Worcester area, the WRTA needs more design options to attract more college
students. Adjustment of route designs, bus stops and or scheduling changes would make
Worcester’s transit system more adaptable and understandable to college students.
17
3. METHODOLOGY
The goal of this project was to assist the Worcester Regional Transit Authority in designing
a new service that will boost student ridership in Worcester, Ma. To reach this goal, the following
objectives were identified:
1. Utilize research and field observations to begin formulating potential design options.
2. Propose preliminary designs to the WRTA and continuously develop alternatives.
3. Perform cost analysis, new ridership projections, and time savings calculations for all
alternatives.
The following sections will describe the approach used to complete these objectives.
3.1 PRELIMINARY RESEARCH
A significant amount of research needed to be done in the first few weeks of the project
before the design process could begin. This research had multiple areas of focus including
background research, learning the HASTUS software, and our own personal research by taking bus
trips. The team conducted extensive research on the current system, other college city transits, and
design criteria. Additionally, bus rides were taken by the team to determine what college students
felt needed to be improved upon or changed. Each of these areas played an important role in the
designs that were developed.
3.1.1 ACQUIRING BACKGROUND INFORMATION
Informational background research was primarily conducted in three areas including the
WRTA, other college city transit systems, and design methods and criteria. It was extremely
important that the team became familiarized with the background and operational procedures of
the WRTA to ensure that they are taken into consideration. Looking at other college city transits
played a crucial role in providing ideas as to how to make the system appeal to students and how to

18
advertise it. Though they were not directly applicable, the individual elements of each enabled the
team to generate new ideas more applicable to Worcester. Finally, learning about design criteria
was a fundamental step to ensure that all of the work that is done complies with standards. Ideas
were drawn from each of these sources and areas to formulate unique ideas for the WRTA.
3.1.2 LEARNING HASTUS
Learning to use the design software, HASTUS, was a very important step. The team met
with John Farley at the WRTA for software training and each member was given remote access to
the program. With this, the team was able to get as familiar with the program as possible in order
to proceed to input design ideas in the most efficient manner possible. The system will say when
there are errors resulting from design changes, but it will not say what the errors are, so the
programmer must also be aware of all rules relating to the various lengths of time for the operators’
breaks. All of these rules were explained by John Farley and other staff members of the WRTA.
These rules can also be seen in Figure 3 of Section 2.4.6. The team was then able to enter design
ideas and changes into the system to see if they work and how they may affect times of the current
routes.
To accomplish all modifications to routes in HASTUS multiple changes and additions needed
to be made. First of all, the additional stops needed to be entered into the program. For each
modified route, these stops were manually added where needed. Stops for modified routes were
also manually deleted when necessary.
Secondly, the amount of time it takes between stops, for both inbound and outbound,
needed to be entered for each route changed or added. This number was estimated using a Google
maps travel time to HASTUS travel time ratio. A ratio was used because it takes longer for a bus to
travel than a regular vehicle due to the size of the bus and the duration of the stops. Therefore, the
travel time given by Google maps would be inaccurate to use in HASTUS. To find the ratio, multiple

19
routes already entered into HASTUS were drawn into Google maps which gave the amount of time
it takes for a regular vehicle to travel them. The two travel times were then compared in a ratio
form. A ratio of 2:1 was consistently used for the late night routes. When traveling south on the
Park Ave routes, a ratio of 2:1 was used, however when traveling north a ratio of 2.5:1 was used.
These were determined from looking at Routes 30 and 27 in HASTUS which demonstrated a longer
rate when traveling north.
New routes were added by creating a new trip, adding the necessary stops and then
manually entering the time it takes to travel between them. However, the team was never able to
determine how to make the HASTUS program understand or accept the times that were entered
into the program for each stop. The team was able to enter new, or change existing stops, but could
not make the program accept the times for when the bus would arrive at each of the new desired
stops. When this was attempted the program would enter the same time into each of the time
blocks for each stop rather than allowing the team to manually enter what time each bus would
arrive at each stop. As a result, the program would return an error message. The team was never
able to determine whether or not the new or alternative route designs would be accepted by the
HASTUS program.
After routes were modified, the routes that they affected would have needed to be changed
to work with the system. For example, if one route turned into another route at City Hall the times
would have been changed so that there were no overlaps or idle times at the switch of the route.
Stops after the switch at City Hall then needed to be changed accordingly.
3.1.3 BUS RIDES
Initially, the team was unfamiliar with how a transit system works, so it was imperative to
begin utilizing the bus around Worcester in order to understand and become comfortable with the
system. Aspects of the system that would be beneficial for college students and aspects that needed

20
improvement were noted. Specifically, ease of use and convenience were observed. These
attributes provided a better understanding of useful stop locations and destinations for students,
and also what kind of schedule would best fit the students’ needs. Riding various routes to
destinations popular with college students enabled the team to better comprehend how routes and
their timing should be changed. The group traveled to the Auburn Mall, Greendale Mall and Super
Walmart. Specific details and observations from the trip can be found in Appendix A. The most
important discovery, however, was the large amount of time it took to make these trips. The group
used this observation to formulate routes that would more easily fit into the busy schedule of a
college student.
3.2 DESIGN ALTERNATIVES
Design alternatives were developed based on all of the research performed by the group.
The team took into consideration all aspects of service discussed in the previous sections including
all of our background research for developing ideas and all of the rules within the WRTA. Designs
were entered into the HASTUS software to ensure that there were no errors. A variety of designs
from conservative to radical changes were sampled. Conservative changes included slight route
and scheduling modifications, while radical changes consisted of the addition of a hub and other
routes to the system. As the ideas were added to the software we were able to make adjustments as
needed. From there we performed all calculations necessary to determine whether or not the
design would be a useful and practical alternative for college students as well as the WRTA. The
wide range of designs helped to determine which changes will be the most successful.
3.3 ANALYSIS AND CALCULATIONS
The final step included performing calculations which were used in proposing
recommendations to the WRTA. Necessary calculations included a cost analysis, projected new
ridership and time savings. All of these factors were considered when evaluating alternatives.
21
Ideas were proposed to the WRTA to guarantee that all of their input was received and as many
edits as necessary were performed in order to arrive at the best possible alternatives.
3.3.1 PROJECTED RIDERSHIP
The WRTA does not currently use a model or formula to calculate projected ridership. For
this project, ridership for each modified or additional route was calculated using a utility function
taken from the text Traffic and Highway Engineering by Garber and Hoel (Hoel, 2008):
Utilityi = b(IVTT) + c(OVTT) + d(COST)
IVTT = in-vehicle travel time (min)
OVTT = out-of-vehicle travel time (min)
COST = out-of-pocket cost (cents)
These values varied for each route and are shown in Appendices B, C, D and E for all of the
proposed alternatives. While the cost to ride a bus was easy to calculate using the $1.50 fare that is
charged for each ride, many assumptions were made to calculate the cost to take a private vehicle.
It was first assumed that college students pay their own car insurance, maintenance and
operational costs. Next it was assumed that the average vehicle gets 25 mpg with gas being priced
at $3.00 per gallon. From personal experience and doing many online quotes the cost to insure a
vehicle for a college student per year was assumed to be about $1,000, average maintenance and
operational costs to be $500 and the average miles traveled per year to be 10,000 miles. This
makes the cost of traveling in a private vehicle $.27/mile. The text used methods published in
NCHRP Report 365 for values of coefficients b, c and d:
b = -.025
c = -.050
d = ( )( )
( )( )
TVP= (value of one hour travel time)/(hourly employment rate)=0.30

22
AI= the average income of college students
AI is usually the average annual regional household income; however this project was more
concerned with student riders. Therefore it was assumed that the average student works over the
summer and breaks, receives money from grants or their parents and maybe has a part time job
during the school year as well. Values of $5,000 and $10,000 were used.
Once the utility function was solved for both transit use and private auto a Logit Model
taken from the same text was used to calculate the percentage of students that would ride the bus:
P(T)=
Ut=Utility function for transit
Ua=Utility function for private auto
Lastly, the total student populations of WPI, Assumption College, Holy Cross, Becker College,
Worcester State University, Clark University and Quinsigamond Community College when
applicable were multiplied by the percent of projected riders to get the number of forecasted
student riders. For the weekend route, the percent of riders was multiplied by one third of the
student population since it is predicted that only people of drinking age would use the route.
Appendix B shows these calculations.

23
3.3.2 COST ANALYSIS
A cost analysis was prepared for the additional routes made which includes the weekend
routes and new Park Ave. route. The analysis took into account the number of buses that would be
driving the route, the gas consumed and payment of the operators. The most recent data available
provided by the WRTA’s financial reports was used in our calculations. The average cost of diesel
fuel for the WRTA in 2010 was $1.95 per gallon (WRTA, 2010), and the newer Gillig buses get 4-
5mpg while the hybrids get 6-7 mpg (WRTA, 2010), Doing the math out gives the costs of diesel per
bus per mile of $.43/mile for the newer Gilligs and $.30/mile for the hybrids. In 2010, the total
hourly cost of an operator including wages and fringes was $38.94/hour.
3.4 SUMMARY
Several steps were involved in our methodology including background research, developing
design alternatives, and calculations. After all of these steps were taken, this project’s objectives
were completed and recommendations for the WRTA were formed. The following chart
summarizes the time spent on each step over the course of three academic terms, approximately 21
weeks, at WPI.
Term A B C
Preliminary Research
Software Training
Design Routes
Evaluate Alternatives
Analyze Results
Finalize Recommendations
FIGURE 4: TIMELINE

24
4. ANALYSIS AND CALCULATIONS
4.1 CHOOSING ROUTES TO MODIFY
Routes that reach popular destinations of college students were the primary focus of this
project. These routes were specifically chosen to provide convenient and time effective options.
Some preliminary objectives included:
1. Having a late night route for students wishing to experience Worcester’s night life.
2. Modifying a route or routes to utilize Park Avenue and provide a more direct route to the
Auburn and Greendale Malls.
3. Providing a more direct service to the colleges and universities.
The routes chosen to modify to accomplish these goals were the 27 and 30. Three late night routes
running from 8:30 p.m. to 2:30 a.m. three nights per week were designed to pick up students from
multiple colleges and reach popular late night destinations.
4.1.1 USING HASTUS
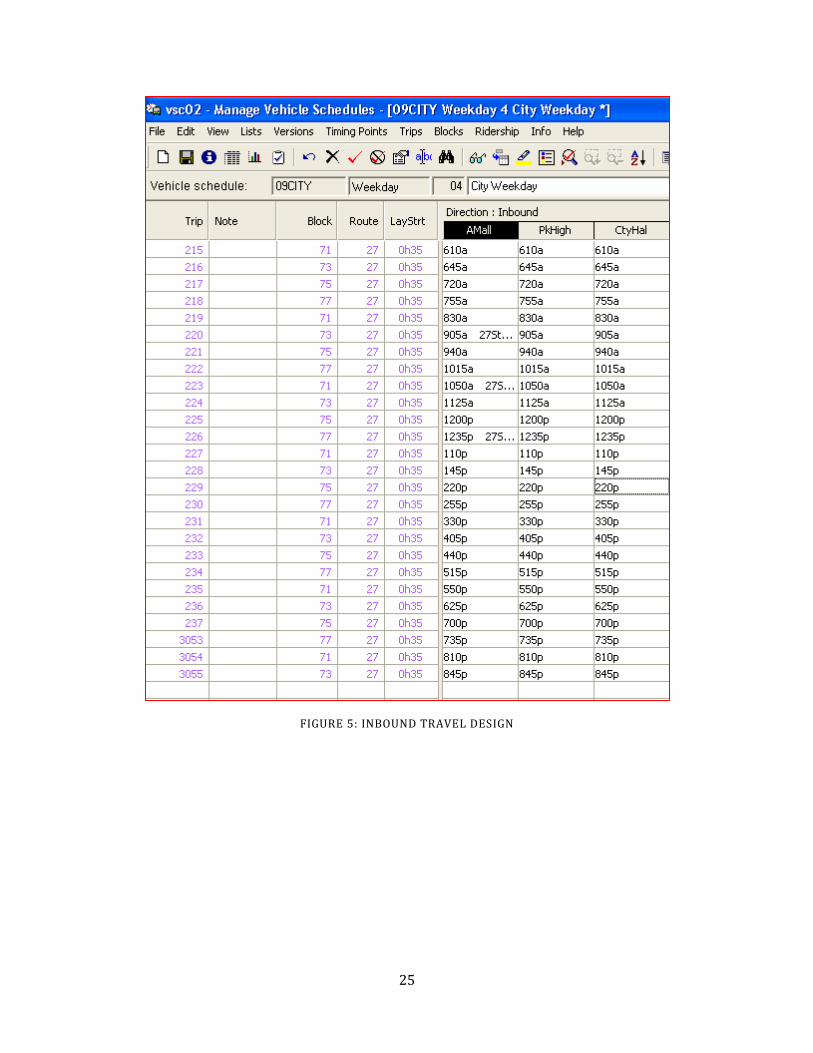
Route 27 was modified and uploaded into HASTUS, changing a few stops. The travel design
was modified in order to run from the Auburn Mall to Highland Street and then to City Hall for the
inbound. The outbound route travels from City Hall to Highland Street and then to the Auburn Mall.
Although the stops along the route were modified the time was unable to be properly modified in
order for the HASTUS program to accept the time tables entered. The travel designs can be seen
below:
25
FIGURE 5: INBOUND TRAVEL DESIGN

26
FIGURE 6: OUTBOUND TRAVEL DESIGN
Route 30 was also modified from the original travel pattern. The current route 30 travels
from City Hall to the Lincoln Plaza. However, it was determined that the route would be more
useful if it ran from City Hall to the Wachusett Plaza, running down Highland Street as well.
Although the variants and stops were changed in the HASTUS program, the program would not

27
show the new travel pattern. If the HASTUS program were to accept the manually entered time
tables they would run through the stops shown below from 5:20am to 7:20pm:
Inbound City Hall Park Ave/Highland
West Grove St
Greendale Mall
Quinsigamond CC
Wachusett Plaza
Outbound Wachusett Plaza
Quinsigamond CC
Greendale Mall
West Grove St
Park Ave/Highland
City Hall
FIGURE 7: ROUTE 30 TRAVEL PATTERN
The “New Park Ave” route along with the Late Night Weekend routes were designed from
start to finish in the HASTUS program. These routes are much more time consuming to program
due to the fact that they have to be designed from scratch and the time tables for the late night
routes are slightly more complicated to complete due to the time of night they will be running.
Since HASTUS is programmed for eight hour windows for operators, the Late Night Weekend routes
will be running from 630pm-230am, allowing for students to reach downtown locations with
restaurants, clubs or bars.
In order to successfully add the new routes that are desired into the HASTUS program, the
routes that were modified had to be manually changed based on the travel pattern and the stops
that run along the desired path of travel. The time tables must also be manually changed in order to
follow the HASTUS travel time to Google maps travel time ratio. Once this is completed the
program will either accept the new route designed or return feedback stating that the route was not
accepted.
4.1.2 LATE NIGHT ROUTES
Three separate options for a late night route were developed in order to appeal to college
students. These late night routes are being considered and proposed for multiple reasons. First is
safety; students who plan to consume alcohol should not be driving, and the buses provide a safe
alternative. Secondly, students do have the option of taking a cab, but the bus would be less

28
expensive. Thirdly, it would be convenient and easier to travel in larger groups. If buses are
constantly running from different hot spots throughout the night, students will be more likely to
take the bus to travel from one location to another, and still have a reliable ride home at the end of
the night.
OPTION 1: TWO ROUTES
Option 1 contains two separate routes that would run simultaneously. The first route
would begin at Assumption College, travel down Highland Street passing both WPI and Becker
College, down Park Ave toward Clark University, and ending at Kelley Square. This route would
provide service to students from four colleges or universities directly to desired night life locations.
The second route would begin at Worcester State University, travel on a short segment of Park Ave,
travel via Pleasant Street and Main Street to Kelley Square, and end at Holy Cross. This route would
service two colleges, while also creating the option to switch routes from the other weekend bus at
both Park Ave and Kelley Square.

29
FIGURE 8: OPTION 1- LATE NIGHT ROUTE 1
FIGURE 9: OPTION 1- LATE NIGHT ROUTE 2

30
Travel times associated with each of the routes efficiently utilize the 8 hour time period
from 6:30pm-2:30am. Assumptions of a 2:1 minute ratio as explained in Section 3.1.2 were made
based off of a bus to car ratio for Route 3. It is also recommended that two buses are traveling on
each of the routes in order to minimize headway. Using these assumptions, route 1 results in a 1
hour and 20 minute loop with 40 minute headway, while route 2 will operate in a 1 hour loop with
30 minute headway. Car travel times were based off of GoogleMaps. The information and times for
each of the two routes within Option 1 can be seen in the following tables.
Late Night Route 1
Car Travel Time- one way 18 minutes
Assumed Bus Travel Time one way 36 minutes
Break 3 minutes
Total Loop (approximately) 1 hour 20 minutes
Number of buses running 2 buses
Headway 40 minutes
TABLE 3: OPTION 1- LATE NIGHT ROUTE 1 INFORMATION
Time Assumption (bus) Kelley Square (bus)
6:30 1 2
7:10 2 1
7:50 1 2
8:30 2 1
9:10 1 2
9:50 2 1
10:30 1 2
11:10 2 1
11:50 1 2
12:30 2 1
1:10 1 2
1:50 2 1
2:30 1 2 TABLE 4: OPTION 1- LATE NIGHT ROUTE TIMES
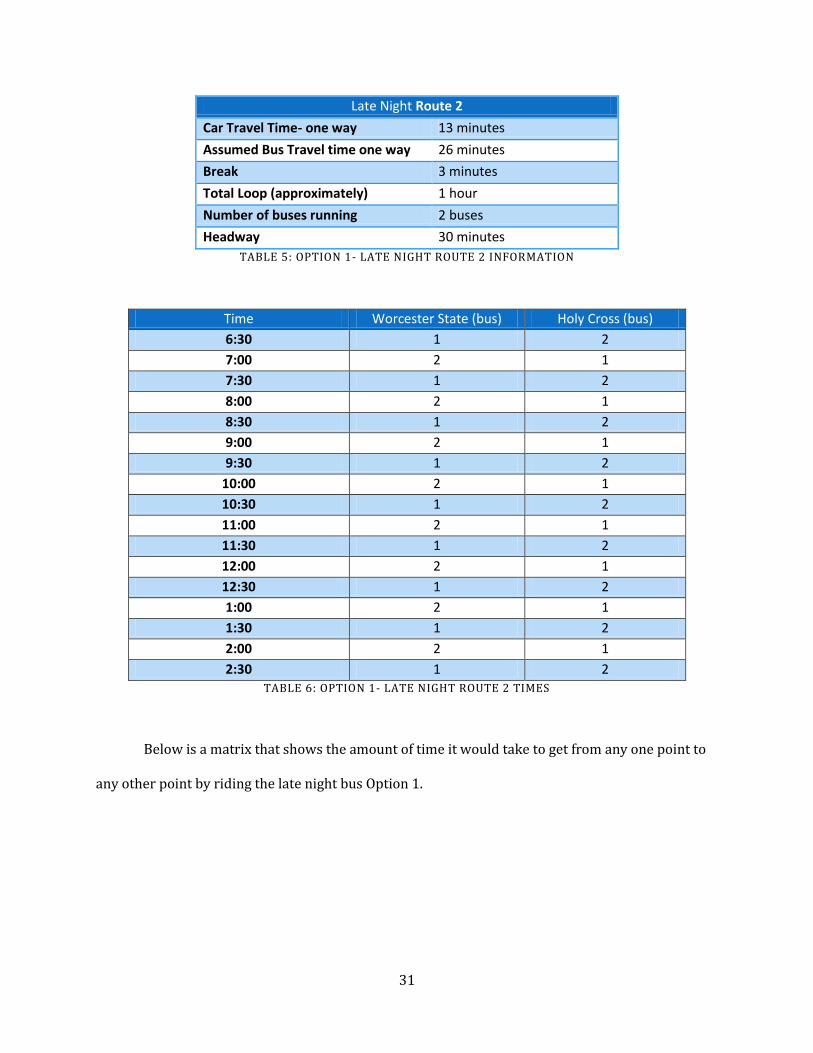
31
Late Night Route 2
Car Travel Time- one way 13 minutes
Assumed Bus Travel time one way 26 minutes
Break 3 minutes
Total Loop (approximately) 1 hour
Number of buses running 2 buses
Headway 30 minutes
TABLE 5: OPTION 1- LATE NIGHT ROUTE 2 INFORMATION
Time Worcester State (bus) Holy Cross (bus)
6:30 1 2
7:00 2 1
7:30 1 2
8:00 2 1
8:30 1 2
9:00 2 1
9:30 1 2
10:00 2 1
10:30 1 2
11:00 2 1
11:30 1 2
12:00 2 1
12:30 1 2
1:00 2 1
1:30 1 2
2:00 2 1
2:30 1 2 TABLE 6: OPTION 1- LATE NIGHT ROUTE 2 TIMES
Below is a matrix that shows the amount of time it would take to get from any one point to
any other point by riding the late night bus Option 1.

32
Option 1: Travel Time from Colleges to Destinations (minutes)
College Lietrim's Pub
Kelly Square
Worcester State
Assumption WPI/Becker Clark U
Holy Cross
Worcester State
8 20 n/a *32 *22 *26 26
Assumption 18 36 *32 n/a 14 26 *56
WPI/Becker 5 26 *23 14 n/a 12 *37
Clark U 8 14 *26 26 23 n/a *34
Holy Cross 22 10 26 *56 *37 *34 n/a
* Transferring, 10 minutes added
TABLE 7: OPTION 1- TRAVEL TIMES MATRIX
Based on the average gas costs from 2010, the following table displays the projected gas
cost ranging from one night to one year for each of the proposed routes. If the Hybrid buses are
used for each of the routes, it would require approximately an additional $17,000 per year.
However, since these numbers are based off of the average gas prices of 2010, this number would
probably be higher for 2011.
Gillig Hybrid
$.43/mile $.30/mile
Route 1 loop: 12 miles 5.16 3.60
Route 1 per night 41.28 28.80
Route 1 per night, 2 buses 82.56 57.60
Route 1 per 3 nights, 2 buses 247.68 172.80
Route 1 per year, 2 buses 12,879.36 8,985.60
Route 2 loop: 10.4 miles 4.47 3.12
Route 2 per night 35.78 24.96
Route 2 per night, 2 buses 71.55 49.92
Route 2 per 3 nights, 2 buses 214.66 149.76
Route 2 per year, 2 buses 11,162.27 7,787.52
Yearly total 24,041.63 16,773.12
TABLE 8: OPTION 1- LATE NIGHT ROUTE GAS COST
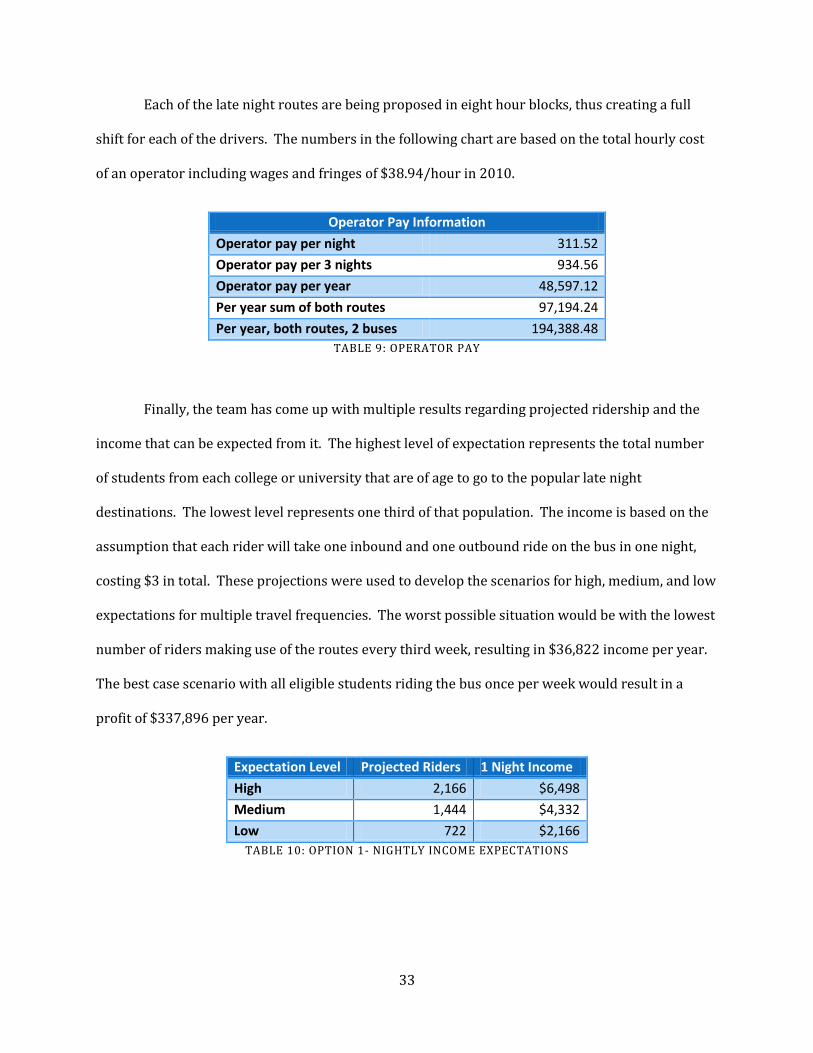
33
Each of the late night routes are being proposed in eight hour blocks, thus creating a full
shift for each of the drivers. The numbers in the following chart are based on the total hourly cost
of an operator including wages and fringes of $38.94/hour in 2010.
Operator Pay Information
Operator pay per night 311.52
Operator pay per 3 nights 934.56
Operator pay per year 48,597.12
Per year sum of both routes 97,194.24
Per year, both routes, 2 buses 194,388.48
TABLE 9: OPERATOR PAY
Finally, the team has come up with multiple results regarding projected ridership and the
income that can be expected from it. The highest level of expectation represents the total number
of students from each college or university that are of age to go to the popular late night
destinations. The lowest level represents one third of that population. The income is based on the
assumption that each rider will take one inbound and one outbound ride on the bus in one night,
costing $3 in total. These projections were used to develop the scenarios for high, medium, and low
expectations for multiple travel frequencies. The worst possible situation would be with the lowest
number of riders making use of the routes every third week, resulting in $36,822 income per year.
The best case scenario with all eligible students riding the bus once per week would result in a
profit of $337,896 per year.
Expectation Level Projected Riders 1 Night Income
High 2,166 $6,498
Medium 1,444 $4,332
Low 722 $2,166
TABLE 10: OPTION 1- NIGHTLY INCOME EXPECTATIONS

34
Per Year
Expectation Level Once per week ($) Every Other Week ($) Every Third Week ($)
High 337,896 168,948 110,466
Medium 225,264 112,632 73,644
Low 112,632 216,626 36,822 TABLE 11: OPTION 1- YEARLY INCOME EXPECTATIONS
The sum of gas usage and driver pay for two buses traveling each of the 2 routes, 3 nights
per year costs approximately $220,000. If high expectations are met, this will still result in a high
recovery rate for the WRTA. However, if low expectations are met, the WRTA will obtain
approximately 17% recovery from the addition of these routes. A possible solution to this would be
to not run these routes over the summer when students are not at school. Ridership will be at a low
over those months so it may not be necessary to have the routes running. Also, an advantage of the
addition of these routes is the exposure the WRTA will be getting. Students will realize how easy it
is to ride the bus, and then may consider riding it for other purposes. The charts below contain
numbers that were found via the same calculations, but based off of a 40 week year to account for
the months of September through May, and not running the buses during the summer.
Gillig Hybrid
$.43/mile $.30/mile
Route 1 loop: 12 miles 5.16 3.60
Route 1 per night 41.28 28.80
Route 1 per night, 2 buses 82.56 57.60
Route 1 per 3 nights, 2 buses 247.68 172.80
Route 1 per year, 2 buses 9,907.20 6,912.00
Route 2 loop: 10.4 miles 4.47 3.12
Route 2 per night 35.78 24.96
Route 2 per night, 2 buses 71.55 49.92
Route 2 per 3 nights, 2 buses 214.66 149.76
Route 2 per year, 2 buses 8,586.40 5,990.4
Yearly total 18,493.60 12,902.40
TABLE 12: OPTION 1- LATE NIGHT ROUTE GAS COST (40 WEEKS)

35
Operator Pay Information
Operator pay per night 311.52
Operator pay per 3 nights 934.56
Operator pay per year (~ 40weeks) 37,382.40
Per year sum of both routes 74,764.80
Per year, both routes, 2 buses 149,529.60
TABLE 13: OPERATOR PAY (40 WEEKS)
Per Year
Expectation Level Once per week ($) Every Other Week ($) Every Third Week ($)
High 259,920 129,960 86,640
Medium 173,280 86,640 57,760
Low 86,640 43,320 28,880
TABLE 14: YEARLY INCOME EXPECTATIONS (40 WEEKS)
By reducing the route to only running for 40 weeks out of the year and using the Hybrid
buses, the sum of gas usage and driver pay would cost approximately $162,432, which is
significantly less expensive than running the buses for the entire year. 24% recovery can be
achieved within the low expectation range.
OPTION 2: LOOP ROUTE
Another alternative would be keeping the same destinations, but creating a loop out of the
two routes mentioned in Option 1. This loop would have endpoints at Assumption College and
Worcester State University, and would still pass all of the late night hot spots.

36
FIGURE 10: OPTION 2 ROUTE
The loop would still require 4 buses in order to keep the headway comparative. All of the
same calculations that were completed for Option 1 were performed for Option 2 and can be seen
in the following charts. Operator pay would be the same as in Table 9 and Table 10 because all
options are based on the same hours per year. Projected ridership will also remain constant. This
was determined after performing the calculation multiple times for various scenarios. Below the
general information regarding Option 2 can be seen.

37
Late Night Route Option 2
Car travel time one way 36 minutes
Assumed Bus Travel time one way 1 hour 12 minutes
Break 3 minutes
Total Loop (approximately) 1 hour 20 minutes
Number of buses running 4 buses
Headway 40 minutes TABLE 15: OPTION 2- LATE NIGHT ROUTE INFORMATION
This next table shows the times that the Option 2 bus will be departing from each of the loop
endpoints, Worcester State University and Assumption College. This was based on headway of 40
minutes. More specifically, a matrix of all times to get to and from every location along the route can
be seen in Table 17.
Time Worcester State (bus) Assumption (bus)
5:50 4 3
6:30 1 2
7:10 3 4
7:50 2 1
8:30 4 3
9:10 1 2
9:50 3 4
10:30 2 1
11:10 4 3
11:50 1 2
12:30 3 4
1:10 2 1
1:50 4 3
2:30 1 2 TABLE 16: OPTION 2- TIMES

38
Option 2: Travel Time from Colleges to Destinations (minutes)
College Lietrim's Pub
Kelly Square
Worcester State
Assumption WPI/Becker Clark U
Holy Cross
Worcester State
8 22 n/a 80 12 55 38
Assumption 14 60 80 n/a 64 24 40
WPI/Becker 5 10 10 12 n/a 10 26
Clark U 7 32 58 20 12 n/a 16
Holy Cross 21 16 42 34 32 14 n/a
* WPI/Becker to Assumption and Clark walks to Park Ave
*Clark takes bus to Park Ave for WPI/Becker
TABLE 17: OPTION 2- TRAVEL TIMES MATRIX
Gas cost was calculated using averages from 2010 and can be seen below. Option 2 proves to be
significantly less expensive than Option 1.
Gillig Hybrid
$.43/mile $.30/mile
Circle Route: 12.7 miles 5.46 3.81
Circle Route per night per bus 16.38 11.43
Circle Route per night, 4 buses 65.52 45.72
Circle Route per 3 nights, 4 buses 196.56 137.16
Cirlcle Route per year (40 weeks), 4 buses 7,862.40 5,486.40
TABLE 18: OPTION 2- GAS COST
Overall, Option 2 proves to be a worthy option. It is cost effective, has a competitive
headway, and provides service to all of the colleges and universities in the area without the need to
transfer.

39
OPTION 3
FIGURE 11: OPTION 3 ROUTE
The final option is extremely similar to Option 2 because it is also a loop that connects all
points with one route. The main difference, however, is that is connects Assumption College and
Worcester State University by continuing the loop on Moreland Street. General information
regarding the route can be seen below in Table 19.
Late Night Route Option 3
Car travel time one way 44 minutes
Assumed Bus Travel time one way 1 hour 28 minutes
Break 3 minutes
Total Loop (approximately) 1 hour 31 minutes
Number of buses running 4 buses
Headway 45 minutes
* Say 1 hour 31 minutes = 1 hour 30 minutes
TABLE 19: OPTION 3- LATE NIGHT ROUTE INFORMATION

40
The route runs with 45 minute headway, and a breakdown of when the buses leave Assumption
College headed in opposite directions can be seen below. Four buses would be on the route and
each bus would travel the loop twice per night.
Time Assumption Left(bus) Assumption Right (bus)
5:45 1 2
6:30 3 4
7:15 2 1
8:00 4 3
8:45 1 2
9:30 3 4
10:15 2 1
11:00 4 3
11:45 1 2
12:30 3 4
1:15 2 1
2:00 4 3
* only 7.5 hour long shift TABLE 20: OPTION 3- TIMES
As can be seen in the following matrix, the Option 3 route greatly reduces the travel time between
Assumption College and Worcester State University. The times to the other destinations remain
similar to those of Option 2.
Option 3: Travel Time from Colleges to Destinations (minutes)
College Lietrim's Pub
Kelly Square
Worcester State Assumption WPI/Becker Clark U
Holy Cross
Worcester State
8 22 n/a 16 12 55 38
Assumption 14 60 16 n/a 14 24 40
WPI/Becker 5 10 10 12 n/a 10 26
Clark U 7 32 58 20 12 n/a 16
Holy Cross 21 16 42 34 32 14 n/a
*Assumption takes bus to Park Ave for WPI/Becker
*Clark takes bus to Park Ave for WPI/Becker
TABLE 21: OPTION 3- TRAVEL TIMES MATRIX

41
Gas cost was calculated using averages from 2010, so this number will probably increase in
upcoming years. The calculation breakdown can be seen in the following table.
Gillig Hybrid
$.43/mile $.30/mile
Option 3 Route: 15.6 miles 6.71 4.68
Circle Route per night per bus 13.42 9.36
Circle Route per night, 4 buses 53.66 37.44
Circle Route per 3 nights, 4 buses 160.99 112.32
Circle Route per year (40 weeks), 4 buses 6,439.68 4,492.8
TABLE 22: OPTION 3- GAS COST
While Option 3 does have the least expensive gas cost, this route includes a road that may
not be travelable for buses. Option 3 utilizes Moreland Street to reduce the travel time between
Assumption College and Worcester State University; however, due to a steep grade and a narrow
width this may not be a realistic option.
4.1.3 PARK AVENUE
Many of the establishments located on Park Ave. are popular destinations of college
students. These include restaurants, bars, convenience stores, Price Chopper and pharmacies.
However, there are currently no bus routes that service Park Ave. in its entirety. Modifying routes
to run down Park Ave. is therefore a possible way to increase student ridership.
ROUTE 27
Route 27 currently runs from City Hall to the Auburn Mall and back via Main Street. Once
the inbound 27 reaches City Hall, it turns into Route 26 and runs to Allegro Microsystems via
Lincoln Street. The 26 passes Lincoln Plaza and is a popular route so the least amount of effect on it
was desired. However, the following reasons made Route 27 a prime candidate to modify:
42
It could be easily switched to run down Park Ave. instead of Main St. with a minimum effect
on its timing
There are multiple routes that go to the Auburn Mall from City Hall including the 25 and 42
that regular non-student riders may take
A more direct and convenient route to the Auburn Mall may be more heavily used by
college students because it avoids the very busy Main Street
Saves time by not having to go to City Hall to transfer
The modification to route 27 from the Auburn Mall includes removing it from the Main
Street service and instead having it use the same path as route 3 to Park Ave. from City Hall. The
route would then run south down Park Ave. to Stafford Street and onto its current path to the
Auburn Mall. Stops would be added along Park Ave. at popular and convenient destinations. The
inbound route 27 would switch into route 26, as it does now, at City Hall. Once the 26 inbound
reached City Hall, it would switch back into the proposed 27 outbound to Auburn Mall as it
currently does already. Therefore, the only major affect to Route 26 is the timing of its stops.

43
FIGURE 12: ROUTE 27 OUTBOUND
Figure 13: Route 27 Inbound
According to GoogleMaps, the proposed route 27 would take 20 minutes inbound 23
minutes outbound with the use of a private vehicle. The HASTUS travel times to Google travel times

44
ratios as stated in Section 3.1.2 were used to determine the travel times of the modified routes. The
estimated amount of time it would take to travel the entire proposed route 27 would be 40 minutes
inbound, 46 minutes outbound compared to its original time of 32 minutes inbound, 35 minutes
outbound. However, for students transferring at Highland Street, their estimated times of travel
accounting for any transferring to and from the Auburn Mall are as follows:
College Original Travel Time Modified Travel Time
WPI/Becker College 1 hour 7 minutes* 32 minutes
Worcester State University 1 hour 19 minutes* 54 minutes
Clark University 30 minutes 30 minutes
*The original travel times are all based partially or wholly on firsthand experience. TABLE 23: TRAVEL TIMES TO AUBURN MALL
EFFECT ON MAIN STREET SERVICE
Switching the 27 to run down Park Ave. has a negative impact on the Main St. service. Main
Street is currently the most popular route and has an average headway of about 15 minutes when
routes 19, 27 and 33 are combined. This average headway is mostly a result of the 15 and 20
minute headways created by routes 27 and 19. Eliminating route 27 from Main Street increases the
average headway to about 25 minutes. However, without route 27 there is no distinct pattern of
time between buses and there are many occurrences where buses are 35 minutes apart.
ROUTE 30
There were two options for covering the section of Park Ave. North of Highland St. including
route 30 and route 31. The section of the routes that would be modified are currently identical, so
both were viable options. Route 30 was first chosen because the 31 goes to Lincoln Plaza and the
other route that goes to Lincoln Plaza, the 26, was already affected by modifying the 27. Other
reasons to adjust route 30 to run down Park are as follows:
To run past Price Chopper, a popular grocery store

45
Any destinations wished to be reached on Grove Street could still be attained by route
31
The small modification would create a more direct route to the Greendale Mall, West
Boylston Walmart, and Wachusett Plaza for multiple colleges without cutting out any
important stops prior to the adjustment
The proposed Route 30 outbound would run down Highland and Park instead of Grove
Street, following Rt. 3 for the section between Highland and City Hall to ensure bus
maneuverability. The proposed inbound and outbound routes are shown below.
FIGURE 14: ROUTE 30 INBOUND

46
FIGURE 15: ROUTE 30 OUTBOUND
Using Route 30 to attain a HASTUS to Google ratio of 2.5:1 minutes for its section, the
following table shows the time saved by modifying Routes 30 and 27:

47
College Destination Original Travel Time
Modified Travel Time
WPI/Becker College Greendale Mall 12 minutes* 10.2 minutes
West Boylston Walmart 28.1 minutes 27.2 minutes
Worcester State University
Greendale Mall 41.1 minutes 18.2 minutes
West Boylston Walmart 50 minutes 35.2 minutes
Clark University Greendale Mall 10 minutes 31.1 minutes
West Boylston Walmart 40 minutes 33.2 minutes
*Based partially or wholly on firsthand experience TABLE 24: TIME SAVINGS
NEW PARK AVE. ROUTE
Since changing Route 27 to run down Park Avenue had such an extreme effect on the Main
Street service an additional route to run down Park was created. Three options with different
ending destinations along the New Park Ave Route were considered. Adding a route instead of
modifying existing routes to run down Park Ave. is ideal because it has no negative effects on the
existing routes. The route would be desirable to college students because it reaches popular
destinations on Park Ave. and West Boylston Street without the need to transfer at City Hall.
There are several options to be considered when adding a route to run along Park Ave.
Option 1 runs from two stops already in the WRTA’s service, the Auburn Mall and Wachusett Plaza.
Option 2 has the route run past the Wachusett Plaza to the West Boylston Walmart as Route 30
does. The route length on the southern end is then decreased to Webster Square Plaza resulting in a
decreased headway. Option 3 considers having the bus stop at the Greendale Mall on the northern
end of the route and turn around in its driveway which decreases the total length of the trip from
the Auburn Mall by about 30 minutes, in turn decreasing the headway between buses. Since the
biggest expense of adding a new route is operator wages the cost of adding the route would be
about the same no matter which option is chosen, but one may be more attractive to riders because
of its destinations or decreased headways.

48
OPTION 1: AUBURN MALL TO WACHUSETT PLAZA
Wachusett Plaza was first chosen as the northern ending destination because it is currently
only a “by request” stop for the outbound route 30. It consists of Salter College, Planet Fitness,
Jazzercise, a few restaurants and a tanning salon. This route also offers a valuable service to the
students of Quinsigamond Community College (QCC), who already use the transit system heavily,
by adding a direct route from QCC all the way down W. Boylston and Park to the Auburn Mall. This
saves the QCC students time by omitting the need to transfer to reach any of the stores, pharmacies
or restaurants they may need to reach along Park Ave. The new route would also make traveling
down Park Ave. and West Boylston St. much easier, time and cost efficient for students of WPI and
FIGURE 16: PARK AVE ROUTE OPTION 1

49
Becker College. There would no longer be a need to travel into City Hall to take the correct
outbound bus depending on where on Park Ave. they want to go.
The amount of time to travel for students of different colleges to the Auburn mall would be
the same as in Table 23. A Google to HASTUS ratio of 2.5 northbound, 2 southbound was calculated
using Routes 30 and 31, making the amount of riding time to reach Wachusett Plaza for multiple
colleges as follows:
College Original Travel Time Modified Travel Time
WPI/Becker College 40 minutes* 27.5 minutes
Worcester State University 58 minutes 37.5 minutes
Clark University 43 minutes 40 minutes * Based partially or wholly on firsthand experience with waiting and walking time
TABLE 25: TIME TO WACHUSETT PLAZA
The Option 1 Park Avenue route would have a round trip of 85 minutes, meaning each bus
could travel the full route north and south about 5.7 times a day. If four buses were to be used a
32.5 minute headway would be created. Using methods described in Section 3.3.1, the route is
expected to attract about 33% of the population of the colleges it is designed to serve. These
schools include WPI, Becker College, Worcester State University, Clark University and
Quinsigamond Community College. This totals to about 6,900 student riders. However, one must
take into account that the desirability of the transit system to students is low due to the fact that
many don’t feel the need to leave campus, do not know how to use the transit system or feel that it
is unsafe. One must also take into account that the projected riders may only need to reach
destinations along Park once or twice a week.
Adding this route to the weekend service would cost the WRTA $108,069.12 if four hybrid
buses were to be running. At $38.94/hour, four operators alone cost $99,686.40 and a breakdown
of the cost of gas is shown in Table 26 below. If this route were to truly attract 6,900 new student

50
riders (as calculations show) and they were to take the bus only once a month for the school year
(accounting for vacations=9 months) they would account for 62,100 one way trips, or 124,200 trips
all together. If four buses were to be used, their fares would pay for all expenses as well as create
$264,530.88 in revenue.
Gillig Hybrid
Headway: 32.5 minutes (3.7 trips/bus) $.43/mile $.30/mile
Option 1 Park Ave Route: 23.6 miles (round trip) 10.15 7.08
Option 1 per day per bus 37.56 26.2
Option 1 per day, 4 buses 150.22 104.78
Option 1 for 2, 8 hour days, 4 buses 300.44 209.57
Option 1 per year (40 weeks), 4 buses 12,017.60 8,382.72 TABLE 26: NEW PARK AVE OPTION 1 GAS COST
Although this would be ideal, because of the low desirability of students to use the public
transit system these values are most likely inaccurate. However, one driver count taken in 2010
shows that on a typical day Routes 30, 31 and 27 have a ridership of 1,065 and 589 and 1,155
respectively. These routes have some of the same destinations as a Park Ave route would have. If
there is a high enough need in regular riders for a route to run along Park Ave along with any extra
ridership from college students the potential revenue recovery could be the same as any of the
current routes.

51
OPTION 2: WEBSTER SQUARE PLAZA TO W. BOYLSTON WALMART
FIGURE 17: NEW PARK AVE. ROUTE RUNNING FROM WEST BOYLSTON WALMART TO WEBSTER SQUARE PLAZA
Having Webster Square Plaza and the W. Boylston Walmart as ending destinations to the
new Park Ave. Route would reduce the headway to 21.25 minutes. Travel times to these
destinations from colleges served are shown in Table 27 below. The W. Boylston Walmart is a mere
5 minutes north from Wachusett Plaza and could potentially bring in more ridership.

52
TABLE 27: TIME TO W. BOYLSTON WALMART AND WEBSTER SQUARE PLAZA
Using the utility function described in Section 3.3.1, about 36% of students this route is intended to
serve would utilize the route, totaling 7,805 riders. Calculations are shown in Appendix D. Again,
this is unrealistic due to the low desirability or students to use public transit. The gas cost to
implement the route on the weekend over the school year using 4 buses is shown in Table 28 below
and the cost of operators would again be $99,686.40. If the calculated 7,805 student riders were to
use the bus once a month for the school year it would create $101,587.00 in revenue for the WRTA.
Gillig Hybrid
Headway: 21.25 minutes (5.7 trips/bus) $.43/mile $.30/mile
Option 2 Park Ave Route: 17.6 miles (round trip) 7.57 5.28
Option 2 per day per bus 42.39 29.56
Option 2 per day, 4 buses 169.56 118.27
Option 2 for 2, 8 hour days, 4 buses 339.12 236.54
Option 2 per year (40 weeks), 4 buses 13,564.80 9,461.60
TABLE 28: NEW PARK AVE OPTION 2 GAS COST
Travel Times from Colleges to W. Boylston Walmart
College Original Travel Time Modified Travel Time
WPI/Becker College 56 minutes* 46 minutes
Worcester State University 1 hour 14 minutes 56 minutes
Clark University 59 minutes 54 minutes
Travel Times from Colleges to Webster Square Plaza College Original Travel Time Modified Travel Time
WPI/Becker College 30 minutes* 14 minutes
WorcesterStateUniversity 40 minutes* 30 minutes
ClarkUniversity 10 minutes 10 minutes
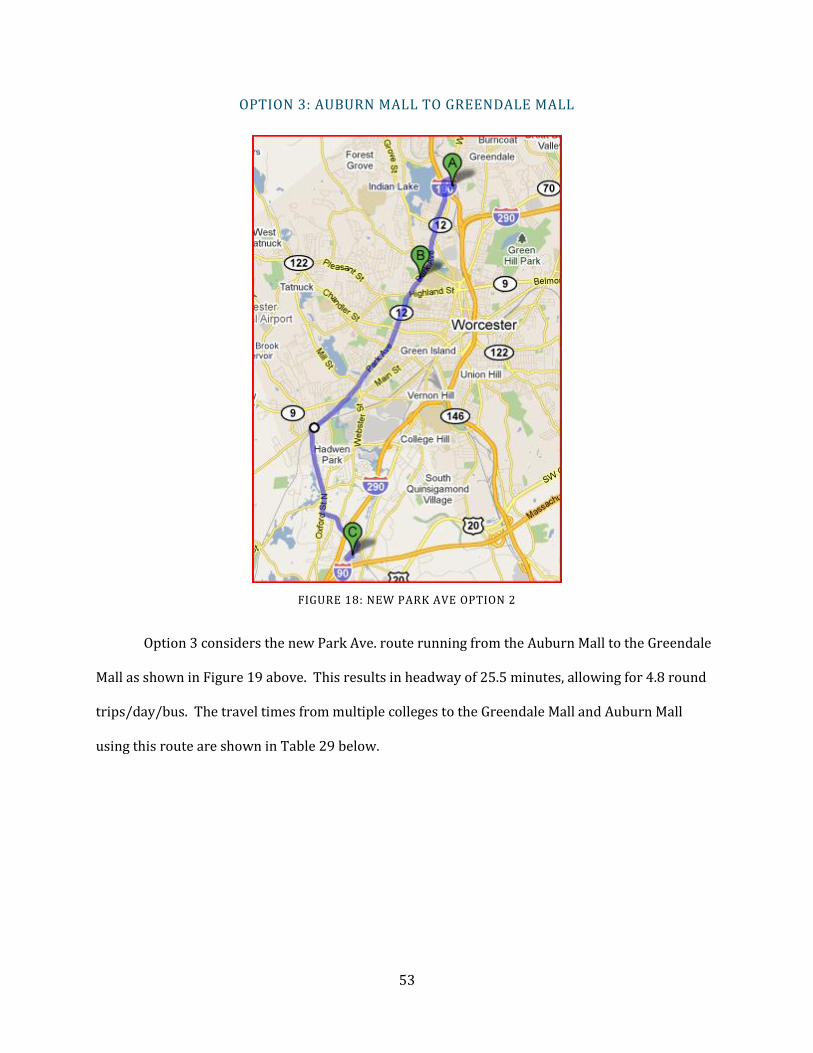
53
OPTION 3: AUBURN MALL TO GREENDALE MALL
FIGURE 18: NEW PARK AVE OPTION 2
Option 3 considers the new Park Ave. route running from the Auburn Mall to the Greendale
Mall as shown in Figure 19 above. This results in headway of 25.5 minutes, allowing for 4.8 round
trips/day/bus. The travel times from multiple colleges to the Greendale Mall and Auburn Mall
using this route are shown in Table 29 below.

54
Travel Times from Colleges to Greendale Mall
College Original Travel Time Modified Travel Time
WPI/Becker College 40 minutes* 10 minutes Worcester State University 41 minutes 18 minutes
Clark University 31 minutes 16 minutes
Travel Times from Colleges to Auburn Mall College Original Travel Time Modified Travel Time
WPI/Becker College 1 hour 7 minutes* 32 minutes
WorcesterStateUniversity 1 hour 19 minutes* 54 minutes
ClarkUniversity 30 minutes 30 minutes TABLE 29: TIME TO GREENDALE MALL AND AUBURN MALL
Calculations shown in Appendix E resulted in a projected ridership of 35% of the students serviced
for a total of 4,465 students. This number is low compared to the others because the route does not
serve QCC. Again, this is unrealistic due to the low desirability or students to use public transit.
The gas cost to implement the route on the weekend over the school year using 4 buses is shown in
Table 30 below and the cost of operators would again be $99,686.40. If the 4,465 projected student
riders were to use this route only once per month for the 9 month school year it would bring a
revenue of $13,494.80 to the WRTA.
Gillig Hybrid
Headway: 25.5 minutes (4.8 trips/day) $.43/mile $.30/mile
Option 3 Park Ave Route: 16 miles (round trip) 6.88 4.8
Option 3 per day per bus 33.02 23.04
Option 3 per day, 4 buses 132.1 92.16
Option 3 for 2, 8 hour days, 4 buses 264.19 184.32
Option 3 per year (40 weeks), 4 buses 10,567.68 7,372.80 TABLE 30: NEW PARK AVE OPTION 3 GAS COST

55
5. CONCLUSIONS AND RECOMMENDATIONS
After analyzing multiple route changes and alternatives for the WRTA, two routes are being
proposed. The first will run down Park Ave. and the second will be a late night route running to
popular night time destinations. Both routes were analyzed by the following rubric:
Route Evaluation Rubric
Category Criteria
Road Geometry Need for a snow route Ease of turning Road grade Width of road
Headway Headway with use of 4 buses Smaller headway is better
Potential Recovery/ Ridership Expectations
Calculated projected ridership
Destinations Popularity of stops
Cost Cost of gas Operator payment is constant for all
routes TABLE 31: ROUTE EVALUATION RUBRIC
This rubric lists the criteria by descending importance. Road geometry was considered most
important because the buses must be able to drive down the routes. Headway was next important
due to the fact that a decrease in headway provides more convenience to riders. In turn, people
who were previously hesitant to ride the bus due to time constraints are now more likely to make
use of the WRTA’s services. Ridership is important not only because it produces revenue but also
because as more people become comfortable riding the bus it will provide advertisement for the
WRTA through word of mouth. This project’s purpose was to increase student ridership as well as
awareness of the transit system. Cost is a major concern of the WRTA’s due to the fact that they are
given a strict budget each year. However, it is ranked lowest on the rubric because all proposed
routes will have similar costs.

56
The first route that the team will be recommending is the Park Ave. route Option 3 – Auburn
Mall to Greendale Mall. This route was decided upon after researching the major travel roads and
destinations, and then further narrowing down the end points based on the rubric in Table 32.
Although projected ridership is lowest for Option 3, it does not take into account the desirability of
the ending destinations. The initial endpoints were the Auburn Mall and Wachusett Plaza because
there is a popular gym there for students. However, WPI is constructing a new fitness center which
will deter some students from traveling to Wachusett Plaza. Therefore, the Greendale Mall would
be a more appropriate end point and it would also decrease headway. The Auburn Mall was chosen
as the other endpoint because Webster Square Plaza is not well known by college students and does
not have as many stores that appeal to college students.

57
Park Ave. Route Evaluation Rubric
Category Evaluation
Road Geometry For all alternatives: No need for snow route Route includes all major roads Alternatives travel down same path of
current routes when permissible Headway Option 1: 32.5 minutes
Option 2: 21.25 minutes Option 3: 25.5 minutes
Potential Recovery/ Ridership Expectations Option 1: 33% ( 6,900 students) Option 2: 36% (7,805 students) Option 3: 35% (4,465 students)
Destinations Option 1: o No outside factors affecting
desire to go to the mall o The desirability of Wachusett
Plaza will decrease as a destination when WPI’s fitness center is built because Planet Fitness is the biggest draw in Wachusett Plaza
Option 2: o Many students are unaware of
Webster Square Plaza and W. Boylston Walmart
o Most students would prefer the Walmart Supercenter in Worcester
Option 3: o No outside factors affecting
desire to go to the mall
Cost Operator payment is constant for all routes
Cost of Gas: o Option 1: $8,382.72 o Option 2: $9,461.60 o Option 3: $7,372.80
TABLE 32: PARK AVE EVALUATION
The group also recommends piloting the proposed Park Ave. route. The route should only
be run one day on the weekend to determine the interest on the route. Running the route for only
one day instead of two would cut costs by 50%. Eventually, if there is enough demand the route can
be expanded to run the entire weekend or be made into a weekday route.

58
The second route that is being proposed is the Late Night Route. It was initially considered
for three main reasons, with the first being safety. Students who plan to consume alcohol should
not be driving, and the buses will provide a safe alternative. Secondly, it would be cost effective.
While students do have the option of taking a cab, the bus would be less expensive. Finally, it would
provide convenience and ease for traveling in larger groups. Students would know what time to
expect the bus to show up, and would not have to split up into smaller groups. If the buses are
constantly running to and from all of the different hot spots throughout the night, students will be
more likely to utilize the bus in traveling from one location to another, and be comfortable in
knowing that they have a reliable ride home at the end of the night. Table 33 shows the evaluation
of the three options for the Late Night Route.

59
Late Night Route Evaluation Rubric
Category Evaluation
Road Geometry Option 1 o Travels down same path of current
routes when permissible Option 2
o Travels down same path of current routes when permissible
Option 3 o Moreland Street was determined too
narrow and steep for a bus to travel year round
o Travels down same path of current routes when permissible
Headway Option 1 o Route 1: 40 Minute Headway o Route 2: 30 Minute Headway
Option 2 o 40 Minute Headway
Option 3 o 45 Minute Headway
Potential Recovery/ Ridership Expectations
For all alternatives: o There is a range of 18% - 160% recovery
depending upon what level expectations are met
Destinations For all alternatives: Stops at Lietrim’s Pub, The Loft and Kelley
Square Stops at all local colleges and universities
Cost For all alternatives: o Operator pay is constant
Option 1 Gas o $12, 902.40
Option 2 Gas o $5,486.40
Option 3 Gas o $4,492.80
TABLE 33: LATE NIGHT ROUTE EVALUATION
Option 2 is the Late Night Route the team will be recommending to the WRTA based on the
evaluation rubric. It does not require transferring to reach any of the stops as Option 1 does and

60
would not require a snow route as Option 3. While it is not the most inexpensive option, it is only
slightly more expensive than Option 3 and more practical based on road geometry. The travel
times between stops on Option 2 was also deemed the best of the options, which can be seen below
in Tables 34, 35 and 36.
Option 1: Travel Time from Colleges to Destinations (minutes)
College Lietrim's Pub
Kelly Square
Worcester State
Assumption WPI/Becker Clark U
Holy Cross
Worcester State
8 20 n/a *32 *22 *26 26
Assumption 18 36 *32 n/a 14 26 *56
WPI/Becker 5 26 *23 14 n/a 12 *37
Clark U 8 14 *26 26 23 n/a *34
Holy Cross 22 10 26 *56 *37 *34 n/a
* Transferring, 10 minutes added
TABLE 34: LATE NIGHT OPTION 1 MATRIX
Option 2: Travel Time from Colleges to Destinations (minutes)
College Lietrim's Pub
Kelly Square
Worcester State
Assumption WPI/Becker Clark U
Holy Cross
Worcester State
8 22 n/a 80 12 55 38
Assumption 14 60 80 n/a 64 24 40
WPI/Becker 5 10 10 12 n/a 10 26
Clark U 7 32 58 20 12 n/a 16
Holy Cross 21 16 42 34 32 14 n/a
* WPI/Becker to Assumption and Clark walks to Park Ave
*Clark takes bus to Park Ave for WPI/Becker
TABLE 35: LATE NIGHT OPTION 2 MATRIX
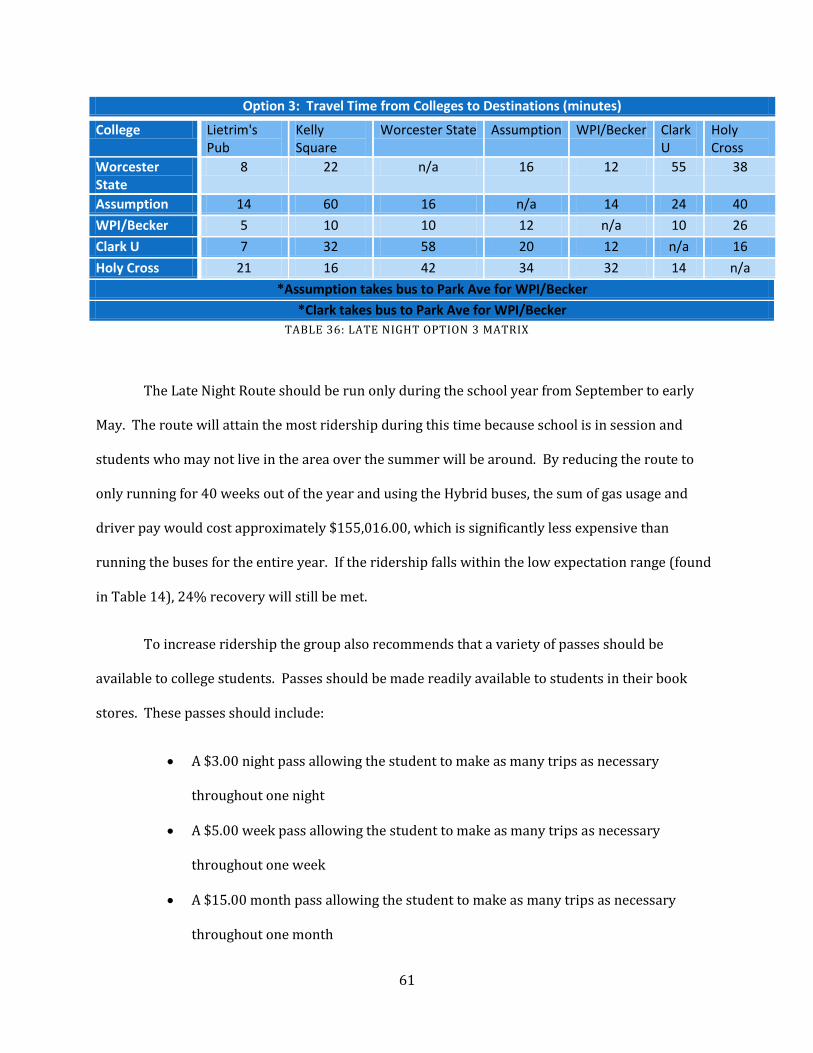
61
Option 3: Travel Time from Colleges to Destinations (minutes)
College Lietrim's Pub
Kelly Square
Worcester State Assumption WPI/Becker Clark U
Holy Cross
Worcester State
8 22 n/a 16 12 55 38
Assumption 14 60 16 n/a 14 24 40
WPI/Becker 5 10 10 12 n/a 10 26
Clark U 7 32 58 20 12 n/a 16
Holy Cross 21 16 42 34 32 14 n/a
*Assumption takes bus to Park Ave for WPI/Becker
*Clark takes bus to Park Ave for WPI/Becker
TABLE 36: LATE NIGHT OPTION 3 MATRIX
The Late Night Route should be run only during the school year from September to early
May. The route will attain the most ridership during this time because school is in session and
students who may not live in the area over the summer will be around. By reducing the route to
only running for 40 weeks out of the year and using the Hybrid buses, the sum of gas usage and
driver pay would cost approximately $155,016.00, which is significantly less expensive than
running the buses for the entire year. If the ridership falls within the low expectation range (found
in Table 14), 24% recovery will still be met.
To increase ridership the group also recommends that a variety of passes should be
available to college students. Passes should be made readily available to students in their book
stores. These passes should include:
A $3.00 night pass allowing the student to make as many trips as necessary
throughout one night
A $5.00 week pass allowing the student to make as many trips as necessary
throughout one week
A $15.00 month pass allowing the student to make as many trips as necessary
throughout one month

62
Although these prices may seem cheap, they need to be competitive with Worcester cab services.
Also, with low prices students are more likely to purchase a pass even if they are unsure of often
they will be riding that particular week or month. The team is not recommending semester or
yearly passes because students are not likely to plan that far in advance and would be hesitant to
make such a large investment, especially when they do not know what to expect of the services.
While this project will be leading the way for the implementation of new routes there are
still further details that could be worked out in future projects. One possible MQP would be
analyzing the routes this project proposed to ensure that they are travelable by large buses. The
MQP would evaluate the width and grade of the roads utilized along with any other factors they
deemed necessary. Another part of this project could be to assess the possibility of the buses
entering the campuses as well as the affect it would have on ridership. With the help of the
suggested MQP along with some further research the proposed routes could be implemented and
successful.
63
WORKS CITED
(2007). Retrieved September 2010, from CMRPC: http://www.cmrpc.org/document_display.aspx?page_id=34&cat_id=10&cat_type=CAT
(2010). Retrieved September 2010, from APTA: http://apta.com/searchcenter/pages/results.aspx?k=riding%20bus%20is%20safer
Transit Planning. In Anderson, Planning the Built Environment.
Basic Design Controls. (2006). Retrieved October 4, 2010, from MassHighway: http://www.mhd.state.ma.us/downloads/designGuide/CH_3_a.pdf
City of Worcester, D. o. (2010). Demographics & Census Information. Retrieved September 20, 2010, from City of Worcester, MA: http://www.worcestermass.org/home/about-worcester/special-events/demographics-census-information
Council, N. S. (2010, 10 2). National Safety Council. Retrieved 10 2, 2010, from National Safety Council: http://www.nsc.org/Pages/Home.aspx
Criteria for Accrediting Engineering Programs. (2008, November 1). Retrieved February 28, 2011, from http://www.abet.org/Linked%20Documents-UPDATE/Criteria%20and%20PP/E001%2009-10%20EAC%20Criteria%2012-01-08.pdf
Farley, J. (2010). MQP. (J. DeFilippo, S. Donnelly, & C. Grygorcewicz, Interviewers)
Gurley, G. (2010). Transit authority's student pass may hold lessons for MBTA. CommonWealth .
Hoel, N. G. (2008). Traffic & Highway Engineering. Toronto: Cengage Learning.
Mejia, A., & Horvath, N. (2009). Evaluation of WRTA Service. Worcester.
Transit Design Manual. (2004, August). Retrieved October 4, 2010, from PalmTran: http://www.pbcgov.com/palmtran/marketing/pdf/library/transit-design-manual.pdf
UPASS. (n.d.). Retrieved September 17, 2010, from Rhode Island Public Transit Authority: http://www.ripta.com/programs/upass.php
WRTA. (2010). Retrieved September 2, 2010, from Worcester Regional Transit Authority: http://therta.com/
WRTA Advisory Board. (2009). WRTA Annual Report 2009. Worcester: WRTA.
WRTA. (2010). Financial Report. Worcester.
WRTA. (2009). Fiscal Year 2009 Fuel Usage. Worcester: WRTA.
WRTA. (2009). Income Statement. Worcester: WRTA.

64
APPENDICES
APPENDIX A: BUS TRIP DETAILS AND OBSERVATIONS
Bus Trip to Greendale Mall 9/29/2010
Bus Routes Departure Time
Arrival Time
Number of People
Size of Bus
Notes
30 from Ralph’s to Greendale Mall
1:32 1:39 Full, had to stand
30’(bus 9307)
Mostly adults, few young people
1:17 – 1:32 walk to stop at Ralphs
Once we got to Greendale Mall were unsure of which stop to go to
o Walked around to W. Boylston Street crossed highway to Goldstar Blvd. and waited
at bus stop near Shell.
1:39 – 1:54 to get to bus stop at Shell
Waited until 2:14 then friend picked us up
Bus Trip to Auburn Mall 10/6/2010
Bus Routes Departure Time
Arrival Time
Number of People
Size of Bus
Notes
3 from Honey Farms to City Hall
2:23 2:31 Half full 40’ Mostly adults, few young people
27 From City Hall to Auburn Mall
2:55 3:30 21 people
40’
27 From Auburn Mall to City Hall
4:40 5:09
31 From City Hall to Ralph’s
5:20 5:28
5 minute walk from home to honey farms bus stop
10 minute walk from Ralphs to home
Round trip: 3 hours ten minutes including 1 hour ten minute mall trip

65
Bus Trip to Walmart
Bus Routes Departure Time
Arrival Time
Number of People
Size of Bus
Notes
30 from WRTA office to City Hall
6:49 6:57 10 w/ us 30’ All old people
11 from City Hall through Kelly Square to Walmart
7:20 7:38 5 w/ us 35’ 2 young people and 1 older man
6:30-6:45 to walk to bus stop
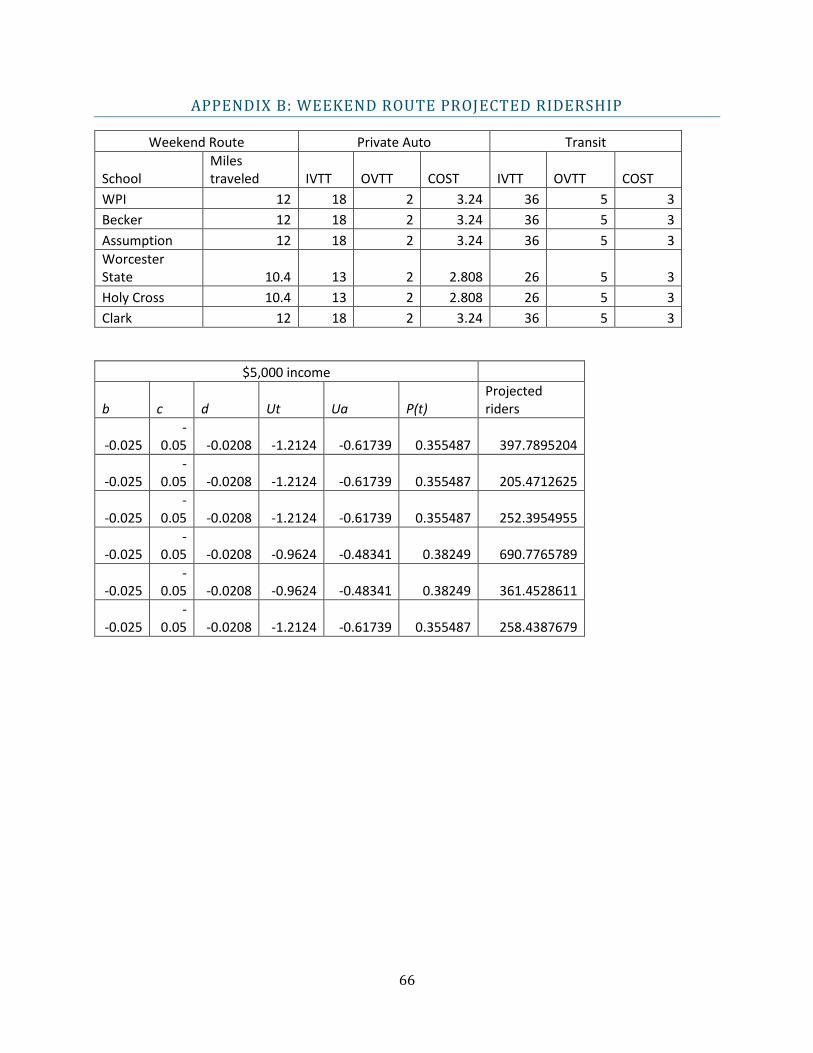
66
APPENDIX B: WEEKEND ROUTE PROJECTED RIDERSHIP
Weekend Route Private Auto Transit
School Miles traveled IVTT OVTT COST IVTT OVTT COST
WPI 12 18 2 3.24 36 5 3
Becker 12 18 2 3.24 36 5 3
Assumption 12 18 2 3.24 36 5 3
Worcester State 10.4 13 2 2.808 26 5 3
Holy Cross 10.4 13 2 2.808 26 5 3
Clark 12 18 2 3.24 36 5 3
$5,000 income
b c d Ut Ua P(t) Projected riders
-0.025 -
0.05 -0.0208 -1.2124 -0.61739 0.355487 397.7895204
-0.025 -
0.05 -0.0208 -1.2124 -0.61739 0.355487 205.4712625
-0.025 -
0.05 -0.0208 -1.2124 -0.61739 0.355487 252.3954955
-0.025 -
0.05 -0.0208 -0.9624 -0.48341 0.38249 690.7765789
-0.025 -
0.05 -0.0208 -0.9624 -0.48341 0.38249 361.4528611
-0.025 -
0.05 -0.0208 -1.2124 -0.61739 0.355487 258.4387679

67
$10,000 income
b c d Ut Ua P(t) Projected riders
-0.025 -
0.05 -0.0104 -1.1812 -0.5837 0.354915 397.1498253
-0.025 -
0.05 -0.0104 -1.1812 -0.5837 0.354915 205.1408391
-0.025 -
0.05 -0.0104 -1.1812 -0.5837 0.354915 251.9896121
-0.025 -
0.05 -0.0104 -0.9312 -0.4542 0.382962 691.6285367
-0.025 -
0.05 -0.0104 -0.9312 -0.4542 0.382962 361.8986529
-0.025 -
0.05 -0.0104 -1.1812 -0.5837 0.354915 258.0231662

68
APPENDIX C: NEW PARK AVE OPTION 1 PROJECTED RIDERSHIP
Option 1- Auburn Mall Private Auto Transit
School Miles IVTT OVTT COST IVTT OVTT COST
WPI 7 14 2 1.89 32 5 3
Becker 7 14 2 1.89 32 5 3
Worcester State 6.4 15 2 1.728 54 10 3
Clark 5 13 2 1.35 30 5 3
Quinsigamond Community College 9.5 17 2 2.565 50 5 3
$5,000 income
b c d Ut Ua P(t) Projected riders
-0.025
-0.05 -0.0208 -1.1124 -0.48931 0.349079 1183.72845
-0.025
-0.05 -0.0208 -1.1124 -0.48931 0.349079 611.5872143
-0.025
-0.05 -0.0208 -1.9124 -0.51094 0.197585 1081.382235
-0.025
-0.05 -0.0208 -1.0624 -0.45308 0.352214 775.9281706
-0.025
-0.05 -0.0208 -1.5624 -0.57835 0.272089 2271.673656
$10,000 income
b c d Ut Ua P(t) Projected riders
-0.025
-0.05 -0.0104 -1.0812 -0.46966 0.351707 1192.638678
-0.025
-0.05 -0.0104 -1.0812 -0.46966 0.351707 616.1907887
-0.025
-0.05 -0.0104 -1.8812 -0.49297 0.199691 1092.907034
-0.025
-0.05 -0.0104 -1.0312 -0.43904 0.356139 784.5751062
-0.025
-0.05 -0.0104 -1.5312 -0.55168 0.272986 2279.16214

69
Option 1- Wachusett Plaza Private Auto Transit
School Miles IVTT OVTT COST IVTT OVTT COST
WPI 6 12 2 1.62 27.5 5 3
Becker 6 12 2 1.62 27.5 5 3
Worcester State 7.5 16 2 2.025 37.5 10 3
Clark 7.5 16 2 2.025 40 5 3
Quinsigamond Community College 2.7 6 2 0.729 10 5 3
$5,000 income
b c d Ut Ua P(t) Projected riders
-0.025
-0.05 -0.0208 -0.9999 -0.4337 0.362113 1227.925836
-0.025
-0.05 -0.0208 -0.9999 -0.4337 0.362113 634.4223135
-0.025
-0.05 -0.0208 -1.4999 -0.54212 0.277323 1517.78821
-0.025
-0.05 -0.0208 -1.3124 -0.54212 0.316419 697.0700431
-0.025
-0.05 -0.0208 -0.5624 -0.26516 0.426233 3558.620227
$10,000 income
b c d Ut Ua P(t) Projected riders
-0.025
-0.05 -0.0104 -0.9687 -0.41685 0.365435 1239.189535
-0.025
-0.05 -0.0104 -0.9687 -0.41685 0.365435 640.2418356
-0.025
-0.05 -0.0104 -1.4687 -0.52106 0.27936 1528.935554
-0.025
-0.05 -0.0104 -1.2812 -0.52106 0.318616 701.9107648
-0.025
-0.05 -0.0104 -0.5312 -0.25758 0.432019 3606.926628

70
APPENDIX D: NEW PARK AVE OPTION 2 PROJECTED RIDERSHIP
Option 2-Webster Square Private Auto Transit
School Miles IVTT OVTT COST IVTT OVTT COST
WPI 3.1 9 2 0.837 14 5 3
Becker 2.8 9 2 0.756 14 5 3
Worcester State 2.9 7 2 0.783 24 10 3
Clark 1.3 5 2 0.351 10 5 3
Quinsigamond Community College 6.2 15 2 1.674 26 5 3
$5,000 income
b c d Ut Ua P(t) Projected riders
-0.025
-0.05 -0.0208 -0.6624 -0.34241 0.420678 1426.519395
-0.025
-0.05 -0.0208 -0.6624 -0.34072 0.420268 736.3087355
-0.025
-0.05 -0.0208 -1.1624 -0.29129 0.295023 1614.658897
-0.025
-0.05 -0.0208 -0.5624 -0.2323 0.418216 921.3309197
-0.025
-0.05 -0.0208 -0.9624 -0.50982 0.388747 3245.651485
$10,000 income
b c d Ut Ua P(t) Projected riders
-0.025
-0.05 -0.0104 -0.6312 -0.3337 0.42617 1445.142186
-0.025
-0.05 -0.0104 -0.6312 -0.33286 0.425964 746.2887894
-0.025
-0.05 -0.0104 -1.1312 -0.28314 0.299841 1641.02786
-0.025
-0.05 -0.0104 -0.5312 -0.22865 0.424934 936.1303309
-0.025
-0.05 -0.0104 -0.9312 -0.49241 0.392029 3273.052045

71
Option 2 - W. Boylston Walmart Private Auto Transit
School Miles IVTT OVTT COST IVTT OVTT COST
WPI 6.4 13 2 1.728 30 5 3
Becker 6.8 15 2 1.836 30 5 3
Worcester State 7.9 17 2 2.133 40 10 3
Clark 8 17 2 2.16 37.5 5 3
Quinsigamond Community College 3.2 7 2 0.864 12.5 5 3
$5,000 income
b c d Ut Ua P(t) Projected riders
-0.025
-0.05 -0.0208 -1.0624 -0.46094 0.35401 1200.448889
-0.025
-0.05 -0.0208 -1.0624 -0.51319 0.366047 641.3151078
-0.025
-0.05 -0.0208 -1.5624 -0.56937 0.270313 1479.424699
-0.025
-0.05 -0.0208 -1.2499 -0.56993 0.336268 740.7974169
-0.025
-0.05 -0.0208 -0.6249 -0.29297 0.417771 3487.97334
$10,000 income
b c d Ut Ua P(t) Projected riders
-0.025
-0.05 -0.0104 -1.0312 -0.44297 0.357041 1210.727228
-0.025
-0.05 -0.0104 -1.0312 -0.49409 0.368861 646.2447348
-0.025
-0.05 -0.0104 -1.5312 -0.54718 0.272095 1489.178618
-0.025
-0.05 -0.0104 -1.2187 -0.54746 0.33822 745.0989574
-0.025
-0.05 -0.0104 -0.5937 -0.28399 0.423184 3533.166991

72
APPENDIX E: NEW PARK AVE OPTION 3 PROJECTED RIDERSHIP
Option 3 - Auburn Mall Private Auto Transit
School Miles IVTT OVTT COST IVTT OVTT COST
WPI 7 14 2 1.89 32 5 3
Becker 7 14 2 1.89 32 5 3
Worcester State 6.4 15 2 1.728 54 10 3
Clark 5 13 2 1.35 30 5 3
$5,000 income
b c d Ut Ua P(t) Projected riders
-0.025
-0.05 -0.0208 -1.1124 -0.48931 0.349079 1183.72845
-0.025
-0.05 -0.0208 -1.1124 -0.48931 0.349079 611.5872143
-0.025
-0.05 -0.0208 -1.9124 -0.51094 0.197585 1081.382235
-0.025
-0.05 -0.0208 -1.0624 -0.45308 0.352214 775.9281706
$10,000 income
b c d Ut Ua P(t) Projected riders
-0.025
-0.05 -0.0104 -1.0812 -0.46966 0.351707 1192.638678
-0.025
-0.05 -0.0104 -1.0812 -0.46966 0.351707 616.1907887
-0.025
-0.05 -0.0104 -1.8812 -0.49297 0.199691 1092.907034
-0.025
-0.05 -0.0104 -1.0312 -0.43904 0.356139 784.5751062
Option 3 Greendale Private Auto Transit
School Miles IVTT OVTT COST IVTT OVTT COST
WPI 2.2 6 2 0.594 12.5 5 3
Becker 2.6 7 2 0.702 12.5 5 3
Worcester State 3.7 10 2 0.999 22.5 10 3
Clark 3.8 10 2 1.026 20 5 3

73
$5,000 income
b c d Ut Ua P(t) Projected riders
-0.025
-0.05 -0.0208 -0.6249 -0.26236 0.410344 1391.475424
-0.025
-0.05 -0.0208 -0.6249 -0.2896 0.416952 730.4999076
-0.025
-0.05 -0.0208 -1.1249 -0.37078 0.319924 1750.944396
-0.025
-0.05 -0.0208 -0.8124 -0.37134 0.391489 862.4494124
$10,000 income
b c d Ut Ua P(t) Projected riders
-0.025
-0.05 -0.0104 -0.5937 -0.25618 0.416411 1412.051196
-0.025
-0.05 -0.0104 -0.5937 -0.2823 0.422773 740.6987284
-0.025
-0.05 -0.0104 -1.0937 -0.36039 0.324469 1775.817215
-0.025
-0.05 -0.0104 -0.7812 -0.36067 0.39639 873.2472327