Electronic copy available at: http://ssrn.com/abstract=1917075
Preliminary Draft: Not to be Quoted
Alpha: Empirical Evidence of Mutual Fund Performance under Different
Economic Cycles and over Fund Objectives
Giovanni Fernandez
Doctoral Candidate in Finance
Florida International University
Department of Finance and Real Estate
College of Business Administration
Miami, Florida 33199
E-mail: [email protected]
Chaiyuth Padungsaksawasdi
Doctoral Candidate in Finance
Florida International University
Department of Finance and Real Estate
College of Business Administration
Miami, Florida 33199
E-mail: [email protected]
Arun J. Prakash*
Knight Ridder Research Professor of Finance
Florida International University
Department of Finance and Real Estate
College of Business Administration
Miami, Florida 33199
(O) 305-348-3324
(F) 305-348-4245
E-mail: [email protected]
* Corresponding Author

Electronic copy available at: http://ssrn.com/abstract=1917075
Page 2 of 38
Alpha: Empirical Evidence of Mutual Fund Performance under Different
Economic Cycles and over Fund Objectives
Abstract
We use daily geometric mean returns to investigate abnormal returns in
mutual funds by applying four well known models, namely the CAPM, three-
moment CAPM, Fama and French (1993) three-factor and Carhart (1997)
four-factor models under different economic cycles and over different fund
objectives. Our results show that the economic cycle does affect the mutual
fund performance especially over the bear periods. However, the results from
different fund objectives are inconclusive, implying that abnormal returns are
not objective-specific. Moreover, meta analysis shows that the abnormal
returns are statistically significantly different across deciles and models,
meaning that each decile and model yields different abnormal returns.
JEL Classification Code: G11 (Mutual Fund Performance)

Electronic copy available at: http://ssrn.com/abstract=1917075
Page 3 of 38
Alpha: Empirical Evidence of Mutual Fund Performance under Different
Economic Cycles and over Fund Objectives
1. Introduction
Mutual fund performance evaluation has been thoroughly examined in the literature. Still,
investors do not optimally allocate their funds to managers that consistently outperform the
market, nor do they use any process to properly select funds. While some articles show that a
subset of managers consistently produces positive ‘alpha,’ many investors do not truly know
what types of mutual funds do so, and when to increase their asset allocations into these mutual
funds. Mutual funds have been (falsely) sold as the ‘cure-all’ investment vehicle due to the
instant, low-cost diversification and the implied managers’ skills. However, is this skill specific
to a fund’s objective or time period? This paper attempts to answer this question.
The mean-variance portfolio concept introduced by Markowitz (1952) is the foundation
of the capital asset pricing model (CAPM). The traditional portfolio performance evaluation
measure is called Jensen’s-alpha and is obtained from the implications of the CAPM by Jensen
(1968, 1969). Jensen’s alpha is a measure of abnormal performance only if the model is properly
specified. However, this technique has led to controversy (Grinblatt and Titman (1994)). While
the CAPM is theoretically sound, it has problems empirically. Another theoretical model is the
three-moment CAPM, which incorporates the investor preference for positively skewed returns.
While this model is intuitively convenient, the marginal benefit associated with including the
third moment has not outweighed the marginal cost of adding another factor to the CAPM (Sears
and Wei (1985)).
The Fama-French (1993) three-factor (FF3) model displays a strong ability to capture
cross-sectional excess returns. The intercept (alpha) of the FF3 model is also a measure of

Page 4 of 38
mutual fund performance (Carhart (1997)). The FF3 model lacks the theoretical underpinnings of
the CAPM, but it performs better empirically as it is able to explain much of the excess returns
not explained by the CAPM through the addition of the size and book-to-market factors.
However, there is still some predictable variability not explained by the model. Carhart (1997)
includes the momentum factor and shows that it outperforms the aforementioned models. While
the four-factor model (F4) model also lacks theory, it has been widely used from inception. This
is especially true in the evaluation of mutual fund performance.
Recent literature discusses the performance of mutual funds by employing the F4 model
and using monthly data. Mutual funds account for a substantial portion of investors’ assets, and
with the ‘lost decade’ of portfolio appreciation, investors update their beliefs more frequently
than in the past. Therefore, the methodology used in the past (i.e. studying past one-year returns
and forming portfolios every year (Elton et al. (1996), Carhart (1997), and Kosowski et al.
(2006)) does not capture the landscape of the field. Using this approach, the recent literature
finds that persistence of the top mutual fund decile exists. More importantly, in practice, mutual
funds report arithmetic mean returns, which misleads investors to consider that the arithmetic
returns are their earned benefits; however, in reality investors earn the geometric mean returns as
their holding period returns (DeFusco et al. (2007)). In addition, by mathematical construction
the geometric mean is always smaller than the arithmetic mean, which overstates the actual
return earned by mutual fund investors. To mitigate this issue, we use geometric means returns
as holding period returns rather than arithmetic means to avoid overstating mutual fund
performance.
Our paper extends the previous literature by four dimensions. First, using the daily
geometric rate of return to calculate the daily mean return each month, we use daily rather than

Page 5 of 38
monthly information that is readily available to investors. Second, we study whether or not
economic conditions and fund objectives affect the intertemporal behavior of mutual fund
performance. Third, we investigate the efficacies of well known asset pricing models, namely the
CAPM, three-moment CAPM, three-factor, and four-factor models, to detect mutual fund
abnormal returns. Last, we introduce meta analysis to test the homogeneity of the abnormal
returns.
We employ the daily CRSP mutual fund database, which is free of survivorship bias,
from January 1999 to December 2009. There are two bubbles followed by severe recessions, as
defined by the NBER, over the study period. While it is expected that mutual fund abnormal
performance differs across economic cycles because of higher redemptions and more pressure on
fund managers during troubling times and higher mutual fund inflows and pressure from higher
expectations during prospering times, we break the data into periods of bull and bear markets to
study the intertemporal behavior of mutual fund performance. This will provide an answer to
whether or not the behavior of top and bottom ‘alpha’ funds changes during different economic
cycles. Furthermore, we study the abnormal returns by fund objectives and market
capitalizations, which allow us to test the existence of market anomalies (i.e. size effect and
value effect) in the stock market. As a robustness check, we employ meta analysis, which tests
the statistical differences in abnormal returns across portfolios, models, time-periods, and
objectives.
The most important finding is that positive and negative abnormal returns are not
completely dependent on economic styles or fund objectives. Top performers and worst
performers continue to have statistically significant positive and negative abnormal returns in all
economic cycles and style-objective subgroups, respectively. However, the meta analysis

Page 6 of 38
demonstrates that the under and over-performances are statistically different across bull markets
and between bear and bull markets; the abnormal returns are not different across bear markets.
Furthermore, the meta analysis of the style-objective subgroups demonstrates that while all
bottom performers have statistically significant negative abnormal returns, the returns are
different across styles.
The paper proceeds as follows: Section 2 discusses the literature and issues of mutual
fund performance. Section 3 describes the data. Section 4 explains the methodology used to
implement our analysis. Section 5 examines the results. Finally, Section 6 concludes the analysis.
2. Literature Review
Grinblatt and Titman (1992) create a multiple performance benchmark that is formed
based on the basis of securities characteristics to test how mutual fund performance relates to
past performance. They find persistence in differences in performance and it is consistent with
the ability of fund managers to earn abnormal returns. Hendricks, Patel, and Zeckhauser (1993)
find persistence in performance of no-load, growth-oriented funds in the near term (1 year). Poor
performers also persist, but it is not attributable to known anomalies or survivorship bias.
Grinblatt and Titman (1993) introduce a new measure of portfolio performance that uses
portfolio holdings and does not require a benchmark and find that aggressive growth funds
outperform. Goetzman and Ibbotson (1994) find that past performance and relative rankings are
useful in predicting performance and ranking, but they do not control for survivorship bias.
Brown and Goetzman (1995) find that mutual fund performance persists, but is mostly due to
funds that lag the S&P 500. Also, poor performance increases the probability of disappearance.
Persistence is due to common strategy amongst managers that is not captured by standard

Page 7 of 38
stylistic categories or risk adjustment procedures. Elton et al. (1996) find persistence in risk-
adjusted returns. Using modern portfolio theory techniques rather than past rankings improves
the selection and allows for the construction of portfolios of funds that outperform. They
construct a portfolio of actively managed portfolios with the same risk as a portfolio of index
funds but with higher mean returns.
In an important paper in the literature, Carhart (1997) demonstrates that the four-factor
model almost completely explains persistence in equity mutual funds’ mean returns. The best
performing funds’ results are mainly driven by momentum, but individual fund managers do not
actually earn higher returns by pursuing the momentum strategy. They typically are just holding
these stocks and get ‘lucky’ on the given year when these stocks outperform. The persistence of
the bottom decile in performance of funds is left unexplained. Carhart concludes that fund
managers do not appear to be skilled.
Continuing with the theme of ‘luck’, Kosowski et al. (2006) show that after choosing the
Carhart (1997) model as the best fit according to the SIC method, the alphas are nonnormally
distributed due to nonnormal individual funds alphas and heterogeneous risk taking among
different funds. Because of this, they examine mutual fund performance controlling for luck
without imposing an ex ante parametric distribution from which funds returns are assumed to be
drawn. They compare the distribution of actual fund alphas with those that would be expected
after creating an empirical distribution using the bootstrap methodology. They find that
significantly more funds provide large alphas than would be expected only because of luck.
Therefore, they conclude that a sizable minority of managers picks stocks well enough to cover
their expenses, and this performance persists. Barras et al. (2010) finds that 75% of mutual funds
exhibit zero alpha and that almost none have positive alpha after 2006.

Page 8 of 38
3. Data
The mutual fund data is from CRSP, which is free of survivorship bias. Daily returns for
active domestic equity funds are obtained from January 1999 through December 2009 along with
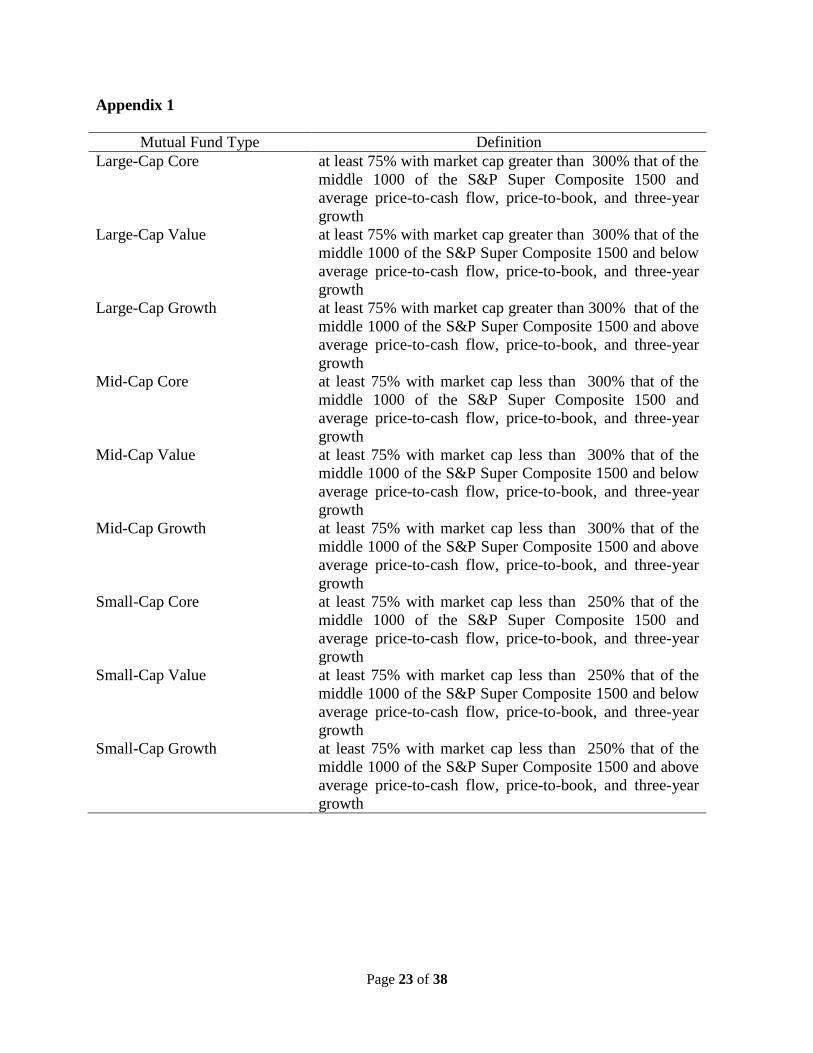
each mutual fund’s stated objective. There are a total of 13,232 funds and on average of 3,989
mutual funds each month, which are classified into nine groups by both the objective of the
mutual fund and the choice of stock market capitalization: Large-Cap Core, Large-Cap Value,
Large-Cap Growth, Mid-Cap Core, Mid-Cap Value, Mid-Cap Growth, Small-Cap Core, Small-
Cap Value, and Small-Cap Growth. Appendix 1 presents the definition of these mutual fund
types. There are approximately over a third Large-Cap funds, a third Mid-Cap funds, and less
than a third Small-Cap funds. The other daily factor returns are also collected from CRSP.
4. Methodology
We begin by computing daily geometric mean returns each month from the daily returns
of each mutual fund, which represents the holding period returns of mutual fund investors:
(1)
where and is the rate of return and the daily geometric mean return on portfolio i for
month t in excess of the daily one-month T-bill geometric return, respectively. We rank mutual
fund performance based on the previous month’s daily geometric mean. The mutual funds are
then grouped into deciles each month, creating ten equally weighted portfolios. This leads to
each portfolio having 132 observations over our entire sample. Therefore, there are a total of
1,320 observations for all portfolios. To investigate the abnormal returns of mutual fund

Page 9 of 38
portfolios we employ ex-post versions of both theoretical (the traditional CAPM and three-
moment CAPM) and empirical asset pricing models (the Fama-French (1993) three-factor and
Carhart (1997) four-factor models) as follows:
CAPM (2)
3-Moment CAPM (3)
3-Factor Model (4)
4-Factor Model (5)
where and are the daily geometric mean returns of the one-month T-bill and on the
CRSP equally weighted index portfolio for month t, respectively. and are
the daily geometric mean returns on the size factor, the value factor, and the momentum factor
for month t, respectively. is the error term of portfolio i for month t.
5. Results
5.1 Summary Statistics
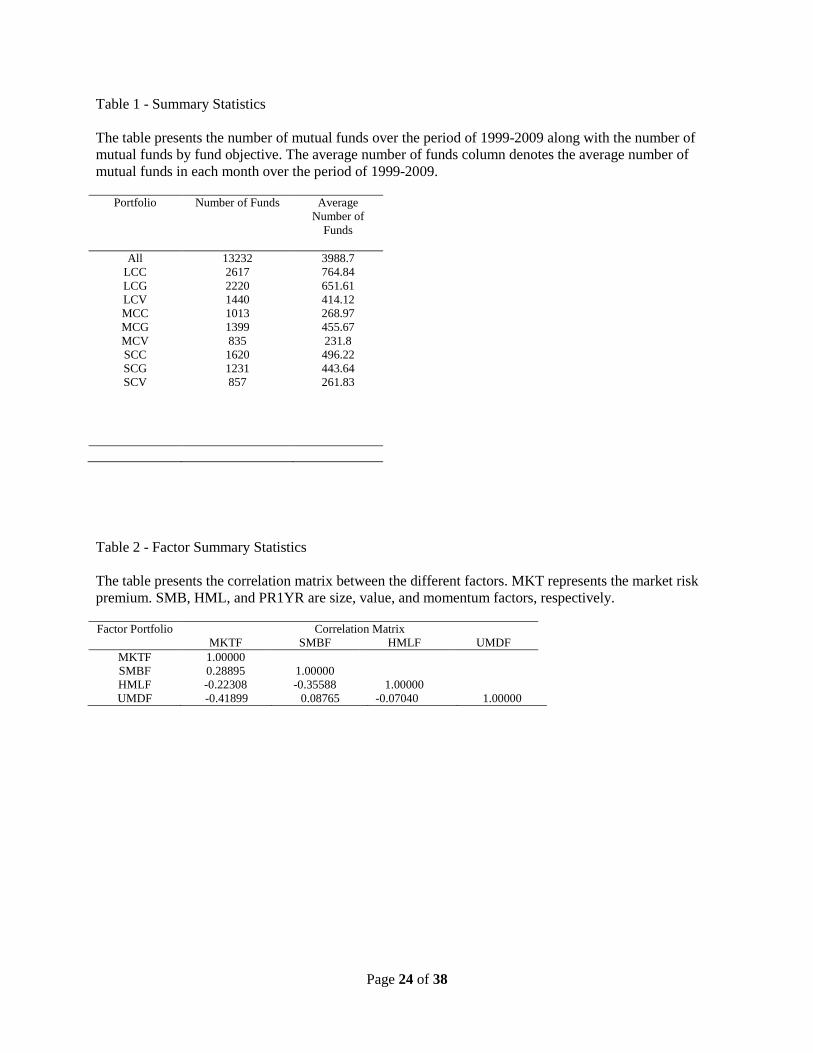
The first obvious observation is the difference between our excess monthly returns when
compared to those of the previous literature. With two recession included in our sample period,
the worst performing portfolio of funds have much lower excess returns than in the previous
literature. The five lowest deciles exhibit negative excess returns. Table II also shows more of
what is evident of this past decade; mainly, the monthly market excess return is negative. Since
negative excess returns violate assumptions underlying the theoretical models, we expect to find
conflicting results when compared to the previous literature.
Observing possible multicollinearity, it is evident from the correlation matrix that the
factors from our sample period are more highly correlated than those of the previous literature.

Page 10 of 38
The momentum factor is negatively correlated to the market factor and slightly positively
correlated with the size factor. This can be explained by a flat decade of returns. With two short
bull and bear markets, contrarian strategies were profitable during these 10 years, which implies
that the market factor would be negatively correlated with a momentum factor (i.e. positively
correlated with a contrarian factor). The relationship between the momentum factor and the size
factor might have more to do with risk. Since returns were highly volatile this decade, and small
stocks tend to show relatively more volatility than other stocks, small stocks had amplified rallies
during the bear and bull periods, leading to momentum in these stocks. The value factor is now
negatively correlated to the size factor. This could be specifically due to the two bubbles during
this time period (tech and real estate/financial). Overall, the growth stocks of the period were
small, growing companies, while the value stocks were the larger, steady companies.
5.2 Overall Mutual Fund Performance
We start our analysis by ranking mutual fund portfolios into ten deciles based on the
previous months returns and then we analyze the abnormal performance of each decile using the
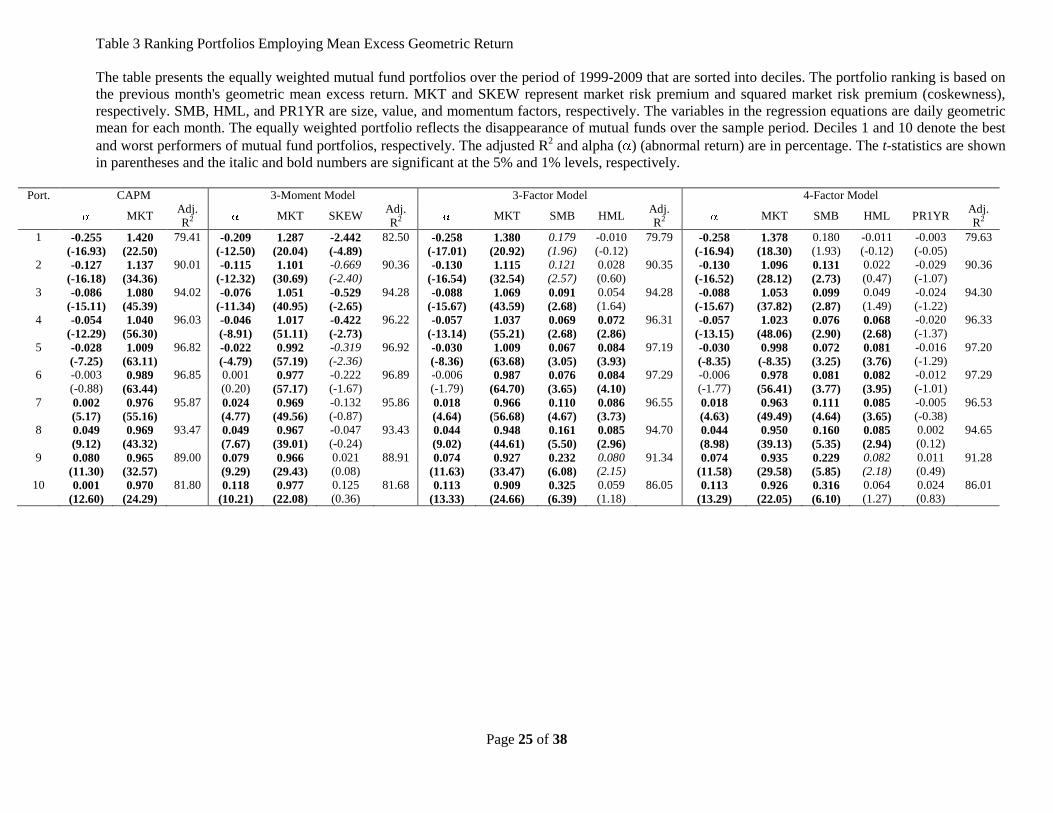
CAPM, three-moment CAPM, three-factor model, and four-factor model. Table 3 presents
equally weighted mutual fund portfolios ranked by the previous month's geometric excess
returns over the entire period. Obviously, mutual fund performance differs significantly across
deciles. The alphas, a measure of abnormal return, monotonically increase from worst
performers in decile 1 (significantly negative alphas) to best performers in decile 10
(significantly positive alphas) in all four models, i.e. -0.255% to 0.001% for the CAPM, -0.209%
to 0.118% for the three-moment CAPM, -0.258% to 0.113% for the three-factor model, and -
0.258% to 0.113% for the four-factor model. Interestingly, only the alphas in decile 6 in all the

Page 11 of 38
models do not possess significant abnormal returns. The adjusted R2 values for each decile
across models are almost indifferent, which shows that the market risk premium is the most
significant factor. However, the adjusted R2 value in decile 1 (worst performers) of the three-
moment CAPM is approximately 2% larger than the other models and the adjusted R2 values in
decile 10 (top performers) of the three-factor and four-factor models are approximately 5%
larger than the CAPM and three-moment CAPM. More importantly, the skew variable in the
three-moment CAPM is more significant for poor performing mutual fund portfolios, which
shows that poor performing mutual funds load on negatively skewed stocks, causing the
performance to suffer, i.e. the t-statistic values of worst and top performers are -4.89 and 0.36,
respectively. This is expected since successful funds would load on stocks that are positively
skewed.
For the three-factor model, the size factor is less significant for worst performing mutual
fund portfolios (deciles 1 and 2), implying that the worst performing mutual fund managers do
not exploit the size effect as successfully as those of the better performing funds do. The HML
factor best captures the excess returns in the middle decile groups. Surprisingly, the momentum
factor does not play an important role in explaining the excess mutual fund portfolio returns.
However, our finding on the four-factor model differs from Carhart's (1997) evidence that only
poor performing funds show significantly negative alphas, but the top performing funds show
insignificant positive alphas.
In conclusion, the traditional CAPM is the best model to detect mutual fund excess
returns; even though other factor loadings show significance, their explanatory power is not as
important during our sample period when compared to the previous studies (Carhart (1997) and
Kosowski et al. (2006)). However, all performers do load on small firms, while top and bottom

Page 12 of 38
performers steer clear of distinguishing between growth or value stocks. The momentum trading
strategy does not play an important role in explaining the performance of mutual fund portfolios.
Our finding reinforces the fact that returns are flat over the decade, leading momentum profits to
vanish
5.3 Mutual Fund Performance Under Different Economic Cycles
It is logical to assume that economic conditions do affect mutual fund performance
(Ferson and Schadt (1996)). Tables 4 and 5 show mutual fund performance over bull and bear
periods, respectively. The bull-bear periods are determined by the National Bureau of Economic
Research (NBER). Over our entire sample period of 1999-2009, there are two bull (years 1999-
2000 (Panel A) and years 2002-2007 (Panel B)) and two bear (year 2001 (Panel A) and years
2008-2009 (Panel B)) periods. In general, the mutual fund alphas are not statistically
significantly different but are economically significantly different during bull markets. The
alphas of worst (top) performing mutual fund portfolios over the 1999-2000 bull period as shown
in Panel A of Table 4 are -0.455% (0.243%), -0.297% (0.219%), -0.458% (0.233%), and -
0.442% (0.226%) whereby those of over the 2002-2007 bull period as shown in Panel B of Table
4 are -0.162% (0.075%), -0.124% (0.075%), -0.164% (0.071%), and -0.166% (0.071%), for the
CAPM, three-moment CAPM, three-factor, and four-factor models, respectively. The market
factor loadings are still positive but less significant than those during the overall period.
Interestingly, the SMB factor over the 1999-2000 bull period is less significant but that over the
2002-2007 bull period is more significant than found in the overall sample in deciles 1 to 5. This
implies that that during the 1999-2000 bull period, only successful managers loaded on small-cap
stocks; this is consistent with what occurred during the tech bubble since the successful tech

Page 13 of 38
firms of the time were young and small firms. The 2002-2007 bull period is less discriminating;
successful and poor performing funds all loaded on small-cap stocks. The HML factor loadings
over both bull periods are less significant than those over the entire sample. In addition, the
momentum factor loadings are still not significant, which implies that during up markets mutual
fund managers follow neither momentum nor contrarian strategies, but stick to a buy-and-hold
technique.
Focusing on the efficacy of the models, the R-squared values for all deciles and models
over the 1999-2000 bull period are smaller than those over the 2002-2007 bull period, especially
at the extreme levels. The sample size might cause this issue. During both bull periods, the R2
values of the three-factor and four-factor models are larger than those of the CAPM and three-
moment CAPM for top performers but are smaller than those of worst performers. For the
middle decile groups, the R2 values of the models are not much different.
It is natural to assume that during down markets, positive alpha should be difficult to
attain. However, we find that the dispersion in alphas, as presented in Panels A and B of Table 5,
does not, in general, drastically change from our entire sample or from bull market periods. The
coskewness factor plays a slightly less important role during bear market periods than over the
entire sample period. The SMB factor is not significant for all deciles over the 2001 bear period
as shown in Panel A of Table 5. Interestingly, the momentum factor loading is negatively
significant for better performing funds during the 2001 bear market (Panel A), but positively
significant for the worse performing funds during the 2008-2009 bear market (Panel B). We
conclude that during bear markets funds that follow momentum strategies underperform, while
funds that follow contrarian strategies over-perform. This has two possible explanations. First,
stock prices do not follow either momentum or contrarian movements during down markets,

Page 14 of 38
generally moving downward regardless of their past performance. Therefore, managers trying to
follow either strategy would not be able to add any more alpha to their portfolios. Second,
managers tend to overreact to preserve capital, forcing them to abandon certain strategies they
used during up markets. Since investment strategies do not assist managers, the dispersion in
mutual fund performance may be driven by stated fund's objective.
Again focusing on the efficacy of the models, the R2 values of all models during the 2001
bear market period are smaller than those during the 2008-2009 bear period, especially at the
extreme levels. This potentially is from the number of observations. Nevertheless, the R2 values
of all models during the bear periods are larger than those of the bull periods, demonstrating that
both theoretical and empirical models perform better when stock markets are more volatile.
5.4 Mutual Fund Performance by Different Fund Objectives and Market Capitalizations
In this section we study whether mutual fund performance is consistent among different
fund objectives and market capitalizations. We categorize the funds by market capitalization
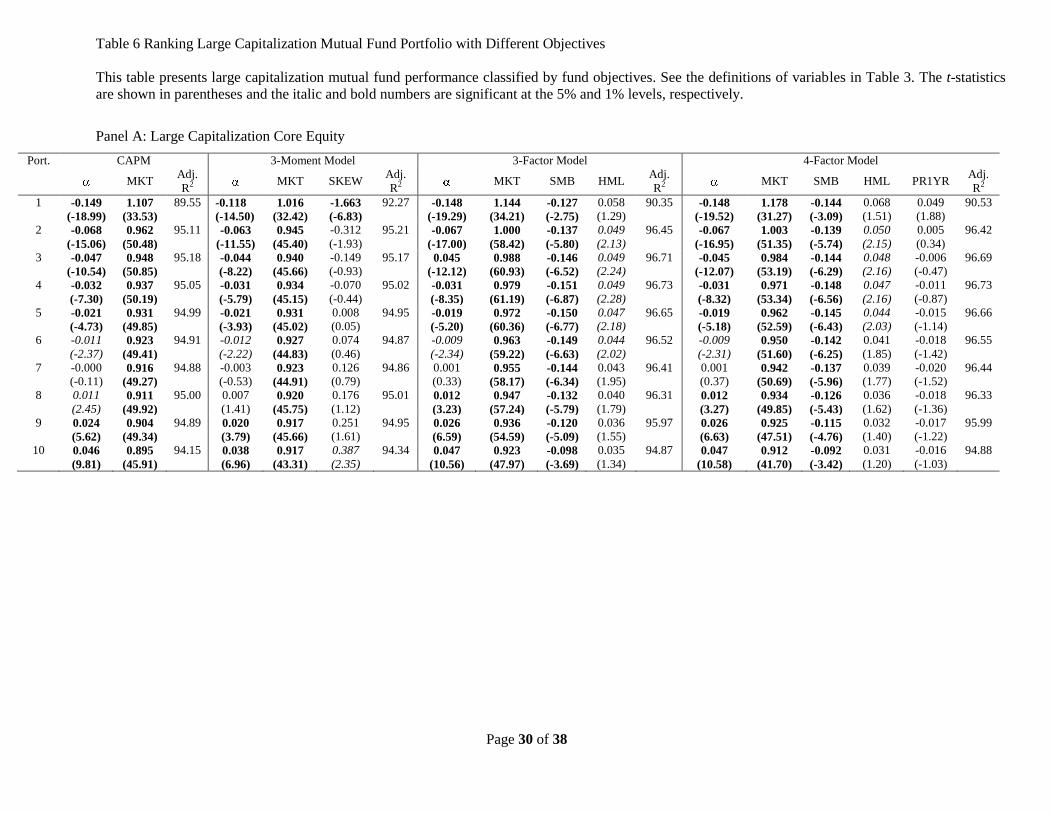
(large, mid, and small) with three fund objectives (core, growth, and value). Tables 6, 7, and 8
and their corresponding Panels A, B, and C present large, mid, and small market capitalization
mutual fund portfolios with their corresponding core, growth, and value fund objectives,
respectively.
In general, the abnormal returns of the large-cap funds (Table 6, Panels A, B, and C) are
consistent with the overall results. The relationship between excess returns and the negative
SMB factor is as expected for the large-cap core (LCC) and value (LCV) subgroups. This result
is not as strong for the large-cap growth (LCG) funds. The relationship of the positive (negative)
HML factor with the LCV (LCG) is also as expected. The momentum factor of LCG funds is

Page 15 of 38
positive but insignificant, while that of LCV funds is negative and strongly significant. This
implies that growth funds slightly follow momentum strategies, while value funds do just the
opposite.
For the mid-cap funds (Table 7, Panels A, B, and C), the efficacy of the models is inferior
to that of large-cap funds, providing lower R2 values, especially for the worst performers of the
mid-cap value (MCV) funds. The coskewness factors are negative and strongly significant
especially for poor performing portfolios for the mid-cap core (MCC) and MCV funds. The
relationship between mid-cap fund excess returns and the SMB factors for all models is positive
and significant, demonstrating that these mutual fund managers are not closely following their
stated objectives, with mid-cap fund managers buying small-cap stocks. The momentum factor is
negatively significant to the mid-cap growth (MCG) but positively significant to the MCV funds.
This opposes the results for large-cap funds, again exhibiting that mid-cap fund managers do not
invest according to their stated objectives.
For the small-cap funds (Table 8, Panel A, B, and C), like the mid-cap funds, the efficacy
of the models is also inferior to that of the large-cap funds. The relationships between returns and
the size and value factors are as expected. However, the value factor of the small-cap core (SCC)
is positive and significant, demonstrating that these funds are deviating from their ‘core’
objective. The momentum factor of the small-cap growth (SCG) funds is positive and significant
while that of small-cap value (SCV) funds is negative and significant. This shows that SCG
funds follow the momentum strategy whereas SCV funds follow the contrarian strategy.
In conclusion, the abnormal returns detected by all models are not economically different,
but the factor loadings do play an important role for different fund objectives. Specifically, the
HML loadings of the MCC and SCC are more important than that of the LCC. The results of the

Page 16 of 38
mid-cap funds contradict with our expectation. Furthermore, the empirical models are superior to
the theoretical models in explaining the abnormal returns of style-objective funds (value and
growth). Interestingly, while we find that mid-cap and small-cap funds have slightly higher
alphas than other subgroups, we cannot conclude that fund objective determines dispersion in
fund performance.
5.5 Meta Analysis
While we observe some differences in performance when focusing on the economic
cycles and fund objectives, we are further interested in whether the abnormal returns are
significantly different across subgroups for investor decision making. As a robustness check, we
employ Meta analysis, which is a statistical procedure to compare several studies or results with
the same hypothesis (Sheskin (2007)). Previous studies show that the significance of alpha
depends upon which model is employed but there is no study to show whether the significance of
alpha is homogenous across models and deciles. The same level of statistical significance does
not mean in fact that models perform equally well in detecting the abnormal returns. To test
whether there is any difference in the significance level of alpha (abnormal returns) across
models and across deciles we hypothesize as follows:
H0: The t-statistic numbers obtained for the k studies are consistent or indifferent with
one another.
H1: The t-statistic numbers obtained for the k studies are inconsistent or different with
one another.

Page 17 of 38
To test the hypothesis above, the following equation is required:
(6)
where and are the t-statistic for jth
study and the average t-statistic values obtained for the k
studies, respectively. The statistic follows the chi-square distribution with n-1 degrees of
freedom.
We start our analysis by comparing our results with Elton, Gruber, Das, and Blake (1996)
and Carhart (1997). The meta analysis shows that our findings for the entire sample differ
significantly from those in the previous studies.1 This is expected since we find that mutual fund
alphas monotonically increase from negatively significant to positively significant while the
prior literature concludes that overall mutual funds perform poorly. The more interesting
findings are those found when studying our subsamples.
Table 9 displays the results from the meta analysis performed on our subsample periods
(bull and bear markets). Panel A shows the results when comparing between the two bull market
periods (Years 1999-2000 and 2002-2007) , the two bear market periods (Years 2001 and 2008-
2009) , and the latest bull and bear market periods (Years 2002-2007 and 2008-2009).
Interestingly, the performance of top and bottom performing mutual funds differs significantly
when comparing the two bull periods and (to a lesser extent) when comparing the two bear
periods. During the 2002-2007 bull market, mutual fund alphas are more amplified for both the
top and bottom performers than for those in the first sub-period. Since the second bull market
lasts longer than the first, the ‘good and the bad’ are further weeded out. Furthermore, top and
bottom performers show significantly different alphas across the final bull and bear periods. This
1 The results are upon request.

Page 18 of 38
means that even after controlling for the risk factors of the given period, managers are able to
better perform during the bull periods than they are during the bear periods. While the overall
results are similar, this does demonstrate that the economic cycle does have an effect on a
manager’s perceived skill. As expected, the performance of the ten portfolios for each model
shows significantly different results (Table 9, Panel B).
Table 10 presents the results of the Meta analysis performed on our subsample of fund
capitalizations and objectives. While bottom performers within large- and mid-cap funds perform
differently across objectives (core, growth, and value, Panel A), most other portfolios do not
have significantly different abnormal returns. Small-cap funds all perform relatively the same
across fund objectives. This makes it difficult for investors to determine in which objective to
invest. Clearly, other factors play an important role in distinguishing between top and bottom
performers. Again, as expected, the results are significantly different across the ten portfolios for
each model, capitalization group, and objective group (Panel B). In Panel C, another interesting
finding is that across the different capitalizations for the core objective, the performance is
significantly different for almost all deciles except the top performers. The same is only true for
the growth subgroup’s middle to worst performers when focusing on the CAPM and three-
Moment CAPM results. For the value subgroup, this is only found for the worst performing
decile according to only the three-factor and four-factor models.
On a final note, the worst performing funds generate different abnormal returns across
market capitalizations and objectives, while top performing funds do not. It is interesting to find
that the meta analysis results do not differ drastically across the different models for value funds.

Page 19 of 38
6. Conclusions
Using daily data rather than monthly data, we test mutual fund performance using
different models. We find that a certain subgroup outperforms during all sub-periods and in all
sub-samples. We conclude that mutual fund performance is manager-specific and not market-
cycle or objective specific. While the previous literature found momentum to be an important
determinant of mutual fund performance, the momentum factor plays a much subdued role
during our sample. This finding agrees with the overall story during our sample-period; no
strategy assisted managers in avoiding two devastating crashes. More analysis needs to be done
to determine what allows this subgroup to succeed. While knowing that certain managers over-
perform is important, it is of little use if investors cannot distinguish between characteristics or
strategies that make mutual fund managers successful.
In this paper we use the daily CRSP mutual fund database to compute the excess
geometric mean returns, which is considered as the holding period returns by mutual fund
investors. To investigate mutual fund performance, four well known asset pricing models are
used, namely the CAPM, the three-moment CAPM, the three-factor model, and four-factor
model. We examine various aspects of mutual fund performance. First, it is whether or not
mutual fund performances depend on economic cycles and stated fund's objective. Second, we
analyze the efficacy of the asset pricing models for the mutual fund performance. As part of our
analysis we employ meta analysis to test the homogeneity of the mutual fund performances
across models and deciles.
Our results show that the dispersion of abnormal returns holds under different economic
conditions and over different style objectives. While the magnitude of positive and negative
performance slightly differs across subgroups, abnormal returns monotonically increase from

Page 20 of 38
significantly negative to significantly positive in all subgroups. While certain factors do assist in
explaining portfolio excess returns, the factors play a much subdued role than found in previous
studies. Theoretical models perform well during this sample period. However, empirical models
explain the excess returns of mutual funds by objective better than theoretical models.
Furthermore, the use of meta analysis demonstrates that the abnormal performance of mutual
funds significantly differ between bull and bear periods; this means that managers benefit from
upward trending markets and are not as well suited to counter downward trends. This is a
disadvantage to investors since protection on the downside is more important than overly
achieving on the upside (Tversky and Kahneman (1991)).The meta analysis also demonstrates
that while all bottom performers have statistically significant negative returns, these returns
significantly differ by style objedtive. It is also important to note that mid-cap funds do not
invest according to their stated objective; most mid-cap funds are heavily invested in small-cap
equities.

Page 21 of 38
References
Brown, S.J., Goetzmann, W.N., 1995. Performance persistence. Journal of Finance 50, 679-698.
Carhart, M.M., 1997. On persistence in mutual fund performance. Journal of Finance 52, 57-82.
Defusco, R.A., McLeavey, D.W., Pinto, J.E., Runkle, D.E., 2007. Quantitative Investment
Analysis. John Wiley & Sons, Inc., Hoboken, New Jersey.
Elton, E.J., Gruber, M.J., Das, S., Blake, C.R., 1996. The persistence of risk-adjusted mutual
fund performance. Journal of Business 69, 133-157.
Fama, E.F., French, K.R., 1993. Common risk factors in the returns on stocks and bonds. Journal
of Financial Economics 33, 3-56.
Ferson, W. E., Schadt, R. W, 1996. Measuring fund strategy and performance in changing
economic conditions. Journal of Finance 51, 425-461.
Goetzmann, W.N., Ibbotson, R.G., 1994. Do winners repeat? Patterns in mutual fund
performance. Journal of Portfolio Management 20, 9-18.
Grinblatt, M., Titman, S., 1992. The persistence of mutual fund performance. Journal of Finance
47, 1977-1984.
Grinblatt, M., Titman, S., 1993. Performance measurement without benchmarks: An examination
of mutual fund returns. Journal of Business 66, 47-68.
Hendricks, D., Patel, J., Zeckhauser, R., 1993. Hot hands in mutual funds: Short-run persistence
of relative performance, 1974-1988. Journal of Finance 48, 93-130.
Jensen, M.C., 1968. The performance of mutual funds in the period 1945-1964. Journal of
Finance 23, 389-416.
Jensen, M.C., 1969. Risk, the pricing of capital assets, and the evaluation of investment
portfolios. Journal of Business 42, 167-247.
Kosowski, R., Timmermann, A., Wermers, R., White, H., 2006. Can mutual fund "stars" really
pick stocks? New evidence from a bootstrap analysis. Journal of Finance 61, 2551-2595.
Markowitz, H., 1952. Portfolio selection. Journal of Finance 7, 77-91.
Sears, R. S., John Wei, K. C., 1985. Asset Pricing, Higher Moments, and the Market Risk
Premium: A Note. Journal of Finance 40, 1251-1253.

Page 22 of 38
Sheskin, D.J., 2007. Handbook of Parametric and Nonparametric Statistical Procedure (Fourth
Edition). Chapman & Hall/ CRC, Taylor & Francis Group, Boca Raton, Florida.
Tversky, A., Kahneman, D., 1991. Loss aversion in riskless choice: A reference-dependent
model. The Quarterly Journal of Economics 106, 1039-1061.
Page 23 of 38
Appendix 1
Mutual Fund Type Definition
Large-Cap Core at least 75% with market cap greater than 300% that of the
middle 1000 of the S&P Super Composite 1500 and
average price-to-cash flow, price-to-book, and three-year
growth
Large-Cap Value at least 75% with market cap greater than 300% that of the
middle 1000 of the S&P Super Composite 1500 and below
average price-to-cash flow, price-to-book, and three-year
growth
Large-Cap Growth at least 75% with market cap greater than 300% that of the
middle 1000 of the S&P Super Composite 1500 and above
average price-to-cash flow, price-to-book, and three-year
growth
Mid-Cap Core at least 75% with market cap less than 300% that of the
middle 1000 of the S&P Super Composite 1500 and
average price-to-cash flow, price-to-book, and three-year
growth
Mid-Cap Value at least 75% with market cap less than 300% that of the
middle 1000 of the S&P Super Composite 1500 and below
average price-to-cash flow, price-to-book, and three-year
growth
Mid-Cap Growth at least 75% with market cap less than 300% that of the
middle 1000 of the S&P Super Composite 1500 and above
average price-to-cash flow, price-to-book, and three-year
growth
Small-Cap Core at least 75% with market cap less than 250% that of the
middle 1000 of the S&P Super Composite 1500 and
average price-to-cash flow, price-to-book, and three-year
growth
Small-Cap Value at least 75% with market cap less than 250% that of the
middle 1000 of the S&P Super Composite 1500 and below
average price-to-cash flow, price-to-book, and three-year
growth
Small-Cap Growth at least 75% with market cap less than 250% that of the
middle 1000 of the S&P Super Composite 1500 and above
average price-to-cash flow, price-to-book, and three-year
growth
Page 24 of 38
Table 1 - Summary Statistics
The table presents the number of mutual funds over the period of 1999-2009 along with the number of
mutual funds by fund objective. The average number of funds column denotes the average number of
mutual funds in each month over the period of 1999-2009.
Portfolio Number of Funds Average
Number of
Funds
All
LCC
13232
2617
3988.7
764.84
LCG
LCV
MCC
MCG
MCV
SCC
SCG
SCV
2220
1440
1013
1399
835
1620
1231
857
651.61
414.12
268.97
455.67
231.8
496.22
443.64
261.83
Table 2 - Factor Summary Statistics
The table presents the correlation matrix between the different factors. MKT represents the market risk
premium. SMB, HML, and PR1YR are size, value, and momentum factors, respectively. Factor Portfolio Correlation Matrix
MKTF SMBF HMLF UMDF
MKTF 1.00000
SMBF 0.28895 1.00000
HMLF -0.22308 -0.35588 1.00000
UMDF -0.41899 0.08765 -0.07040 1.00000
Page 25 of 38
Table 3 Ranking Portfolios Employing Mean Excess Geometric Return
The table presents the equally weighted mutual fund portfolios over the period of 1999-2009 that are sorted into deciles. The portfolio ranking is based on
the previous month's geometric mean excess return. MKT and SKEW represent market risk premium and squared market risk premium (coskewness),
respectively. SMB, HML, and PR1YR are size, value, and momentum factors, respectively. The variables in the regression equations are daily geometric
mean for each month. The equally weighted portfolio reflects the disappearance of mutual funds over the sample period. Deciles 1 and 10 denote the best
and worst performers of mutual fund portfolios, respectively. The adjusted R2 and alpha ( ) (abnormal return) are in percentage. The t-statistics are shown
in parentheses and the italic and bold numbers are significant at the 5% and 1% levels, respectively.
Port. CAPM 3-Moment Model 3-Factor Model 4-Factor Model
MKT Adj.
R2 MKT SKEW Adj.
R2 MKT SMB HML
Adj.
R2 MKT SMB HML PR1YR Adj.
R2
1 -0.255
(-16.93)
1.420
(22.50)
79.41 -0.209
(-12.50)
1.287
(20.04)
-2.442
(-4.89)
82.50 -0.258
(-17.01)
1.380
(20.92)
0.179
(1.96)
-0.010
(-0.12)
79.79 -0.258
(-16.94)
1.378
(18.30)
0.180
(1.93)
-0.011
(-0.12)
-0.003
(-0.05)
79.63
2 -0.127
(-16.18)
1.137
(34.36)
90.01 -0.115
(-12.32)
1.101
(30.69)
-0.669
(-2.40)
90.36 -0.130
(-16.54)
1.115
(32.54)
0.121
(2.57)
0.028
(0.60)
90.35 -0.130
(-16.52)
1.096
(28.12)
0.131
(2.73)
0.022
(0.47)
-0.029
(-1.07)
90.36
3 -0.086
(-15.11)
1.080
(45.39)
94.02 -0.076
(-11.34)
1.051
(40.95)
-0.529
(-2.65)
94.28 -0.088
(-15.67)
1.069
(43.59)
0.091
(2.68)
0.054
(1.64)
94.28 -0.088
(-15.67)
1.053
(37.82)
0.099
(2.87)
0.049
(1.49)
-0.024
(-1.22)
94.30
4 -0.054
(-12.29)
1.040
(56.30)
96.03 -0.046
(-8.91)
1.017
(51.11)
-0.422
(-2.73)
96.22 -0.057
(-13.14)
1.037
(55.21)
0.069
(2.68)
0.072
(2.86)
96.31 -0.057
(-13.15)
1.023
(48.06)
0.076
(2.90)
0.068
(2.68)
-0.020
(-1.37)
96.33
5 -0.028
(-7.25)
1.009
(63.11)
96.82 -0.022
(-4.79)
0.992
(57.19)
-0.319
(-2.36)
96.92 -0.030
(-8.36)
1.009
(63.68)
0.067
(3.05)
0.084
(3.93)
97.19 -0.030
(-8.35)
0.998
(-8.35)
0.072
(3.25)
0.081
(3.76)
-0.016
(-1.29)
97.20
6 -0.003
(-0.88) 0.989
(63.44)
96.85 0.001
(0.20) 0.977
(57.17)
-0.222
(-1.67)
96.89 -0.006
(-1.79) 0.987
(64.70)
0.076
(3.65)
0.084
(4.10)
97.29 -0.006
(-1.77) 0.978
(56.41)
0.081
(3.77)
0.082
(3.95)
-0.012
(-1.01)
97.29
7 0.002
(5.17)
0.976
(55.16)
95.87 0.024
(4.77)
0.969
(49.56)
-0.132
(-0.87)
95.86 0.018
(4.64)
0.966
(56.68)
0.110
(4.67)
0.086
(3.73)
96.55 0.018
(4.63)
0.963
(49.49)
0.111
(4.64)
0.085
(3.65)
-0.005
(-0.38)
96.53
8 0.049
(9.12)
0.969
(43.32)
93.47 0.049
(7.67)
0.967
(39.01)
-0.047
(-0.24)
93.43 0.044
(9.02)
0.948
(44.61)
0.161
(5.50)
0.085
(2.96)
94.70 0.044
(8.98)
0.950
(39.13)
0.160
(5.35)
0.085
(2.94)
0.002
(0.12)
94.65
9 0.080
(11.30)
0.965
(32.57)
89.00 0.079
(9.29)
0.966
(29.43)
0.021
(0.08)
88.91 0.074
(11.63)
0.927
(33.47)
0.232
(6.08)
0.080
(2.15)
91.34 0.074
(11.58)
0.935
(29.58)
0.229
(5.85)
0.082
(2.18)
0.011
(0.49)
91.28
10 0.001
(12.60)
0.970
(24.29)
81.80 0.118
(10.21)
0.977
(22.08)
0.125
(0.36)
81.68 0.113
(13.33)
0.909
(24.66)
0.325
(6.39)
0.059
(1.18)
86.05 0.113
(13.29)
0.926
(22.05)
0.316
(6.10)
0.064
(1.27)
0.024
(0.83)
86.01

Page 26 of 38
Table 4 Ranking Portfolio over Bull Periods
This table shows that mutual fund performance over the bull market periods. The determination of bull periods follow http://www.nber.org/cycles.html.
See the definitions of variables in Table 3. The t-statistics are shown in parentheses and the italic and bold numbers are significant at the 5% and 1%
levels, respectively.
Panel A: Year 1999-2000
Port. CAPM 3-Moment Model 3-Factor Model 4-Factor Model
MKT Adj.
R2 MKT SKEW Adj.
R2 MKT SMB HML
Adj.
R2 MKT SMB HML PR1YR Adj.
R2
1 -0.455
(-11.00)
1.399
(7.83)
72.41 -0.297
(-4.23)
1.198
(6.83)
-8.904
(-2.65)
78.34 -0.458
(-10.66)
1.377
(4.98)
0.145
(0.72)
0.034
(0.11)
70.90 -0.442
(-9.71)
1.396
(5.04)
0.245
(1.10)
-0.018
(-0.06)
-0.187
(-1.03)
70.99
2 -0.213
(-9.02)
0.990
(9.69)
80.14 -0.149
(-3.45)
0.908
(8.38)
-3.607
(-1.74)
81.81 -0.215
(-8.68)
0.970
(6.09)
0.064
(0.55)
0.003
(0.02)
78.79 -0.203
(-7.88)
0.984
(6.28)
0.136
(1.08)
-0.034
(-0.20)
-0.135
(-1.31)
79.52
3 -0.135
(-8.66)
0.941
(13.96)
89.40 -0.107
(-3.59)
0.905
(12.18)
-1.611
(-1.13)
89.53 -0.137
(-8.31)
0.967
(9.15)
0.044
(0.57)
0.049
(0.43)
88.52 -0.128
(-7.56)
0.977
(9.49)
0.097
(1.18)
0.022
(0.19)
-0.010
(-1.47)
89.16
4 -0.077
(-7.35)
0.904
(19.97)
94.54 -0.077
(-3.78)
0.905
(17.61)
0.024
(0.02)
94.28 -0.078
(-7.26)
0.961
(13.83)
0.027
(0.54)
0.079
(1.05)
94.33 -0.072
(-6.57)
0.968
(14.47)
0.065
(1.22)
0.059
(0.80)
-0.072
(-1.63)
94.77
5 -0.030
(-3.85)
0.886
(26.13)
96.74 -0.047
(-3.17)
0.907
(24.52)
0.930
(1.32)
96.84 -0.032
(-4.28)
0.963
(19.95)
0.038
(1.10)
0.108
(2.08)
97.08 -0.028
(-3.66)
0.968
(20.59)
0.063
(1.66)
0.095
(1.86)
-0.46
(-1.48)
97.25
6 0.013
(1.72) 0.885
(27.13)
96.97 -0.013
(-0.99) 0.918
(27.78)
1.464
(2.32)
97.47 0.011
(1.51) 0.964
(21.33)
0.061
(1.86)
0.119
(2.45)
97.43 0.013
(1.74) 0.967
(21.28)
0.076
(2.08)
0.112
(2.25)
-0.028
(-0.94)
97.42
7 0.058
(5.67)
0.903
(20.60)
94.85 0.027
(1.46) 0.943
(20.66)
1.740
(1.99)
95.46 0.054
(5.86)
0.985
(16.60)
0.114
(2.65)
0.145
(2.26)
95.85 0.054
(5.42)
0.986
(16.16)
0.117
(2.38)
0.143
(2.15)
-0.005
(-0.12)
95.63
8 0.106
(6.93)
0.932
(14.06)
89.53 0.074
(2.55) 0.974
(13.48)
1.844
(1.33)
89.89 0.101
(7.65)
1.013
(11.91)
0.196
(3.18)
0.178
(1.94)
92.42 0.099
(6.93)
1.011
(11.60)
0.185
(2.64)
0.184
(1.93)
0.020
(0.36)
92.08
9 0.165
(7.23)
0.971
(9.86)
80.70 0.133
(3.03)
1.011
(9.21)
1.796
(0.85)
80.47 0.158
(8.42)
1.031
(8.56)
0.297
(3.40)
0.197
(1.52)
87.27 0.153
(7.60)
1.026
(8.37)
0.270
(2.74)
0.211
(1.58)
0.050
(0.62)
86.87
10 0.243
(7.37)
1.047
(7.37)
69.85 0.219
(3.42)
1.077
(6.71)
1.323
(0.43)
68.69 0.233
(9.07)
1.056
(6.38)
0.421
(3.51)
0.189
(1.06)
81.96 0.226
(8.20)
1.048
(6.25)
0.375
(2.78)
0.213
(1.16)
0.086
(0.78)
81.60

Page 27 of 38
Panel B: Year 2002-2007
Port. CAPM 3-Moment Model 3-Factor Model 4-Factor Model
MKT Adj.
R2 MKT SKEW Adj.
R2 MKT SMB HML
Adj.
R2 MKT SMB HML PR1YR Adj.
R2
1 -0.162
(-18.47)
1.239
(23.61)
88.68 -0.124
(-11.42)
1.160
(24.14)
-3.863
(-4.97)
91.55 -0.164
(-19.33)
1.194
(22.60)
0.249
(3.27)
0.018
(0.20)
89.99 -0.166
(-19.35)
1.236
(20.08)
0.225
(2.89)
-0.012
(-0.13)
0.067
(1.31)
90.09
2 -0.091
(-15.01)
1.107
(30.41)
92.86 -0.066
(-8.64)
1.054
(31.15)
-2.557
(-4.67)
94.50 -0.093
(-16.14)
1.077
(29.89)
0.183
(3.53)
0.042
(0.67)
93.89 -0.095
(-16.24)
1.107
(26.42)
0.166
(3.13)
0.020
(0.31)
0.049
(1.39)
93.98
3 -0.064
(-12.86)
1.066
(35.90)
94.78 -0.045
(-7.03)
1.027
(36.28)
-1.911
(-4.17)
95.77 -0.066
(-13.73)
1.045
(35.09)
0.135
(3.15)
0.044
(0.85)
95.41 -0.067
(-13.87)
1.071
(30.95)
0.120
(2.75)
0.025
(0.48)
0.042
(1.43)
95.48
4 -0.043
(-9.98)
1.038
(40.45)
95.84 -0.028
(-4.97)
1.008
(40.21)
-1.482
(-3.66)
96.46 -0.045
(-10.70)
1.023
(39.46)
0.107
(2.88)
0.048
(1.08)
96.29 -0.046
(-10.87)
1.046
(34.72)
0.095
(2.48)
0.032
(0.70)
0.036
(1.44)
96.35
5 -0.025
(-6.35)
1.023
(43.43)
96.37 -0.014
(-2.55) 0.999
(42.31)
-1.151
(-3.01)
96.75 -0.027
(-6.98)
1.010
(42.44)
0.097
(2.83)
0.048
(1.17)
96.76 -0.028
(-7.12)
1.028
(37.06)
0.087
(2.47)
0.035
(0.83)
0.029
(1.26)
96.79
6 -0.008
(-2.10) 1.011
(44.26)
96.50 0.008
(0.15) 0.993
(42.32)
-0.887
(-2.34)
96.71 -0.010
(-2.68)
0.998
(43.70)
0.098
(2.99)
0.053
(1.35)
96.94 -0.011
(-2.83)
1.013
(37.92)
0.090
(2.67)
0.043
(1.05)
0.024
(1.06)
96.95
7 0.009
(2.36) 1.002
(42.11)
96.15 0.016
(2.82)
0.988
(39.67)
-0.651
(-1.61)
96.23 0.007
(1.96) 0.987
(42.44)
0.116
(3.45)
0.060
(1.50)
96.79 0.007
(1.75) 1.001
(36.77)
0.108
(3.13)
0.050
(1.21)
0.023
(0.99)
96.79
8 0.028
(6.28)
0.999
(38.11)
95.34 0.032
(5.14)
0.989
(35.65)
-0.467
(-1.04)
95.34 0.025
(6.27)
0.979
(39.41)
0.144
(4.03)
0.070
(1.63)
96.34 0.024
(6.00)
0.993
(34.10)
0.136
(3.70)
0.060
(1.35)
0.022
(0.91)
96.33
9 0.049
(9.48)
0.993
(32.41)
93.66 0.051
(7.00)
0.987
(30.26)
-0.292
(-0.55)
93.60 0.046
(10.13)
0.966
(34.54)
0.191
(4.75)
0.081
(1.68)
95.39 0.045
(9.80)
0.979
(29.81)
0.184
(4.43)
0.072
(1.43)
0.021
(0.77)
95.36
10 0.075
(12.42)
0.992
(27.60)
91.46 0.075
(8.71)
0.991
(25.83)
-0.060
(-0.10)
91.34 0.071
(13.83)
0.957
(29.87)
0.242
(5.24)
0.089
(1.61)
94.09 0.071
(13.45)
0.968
(25.68)
0.235
(4.94)
0.081
(1.41)
0.018
(0.56)
94.03

Page 28 of 38
Table 5 Ranking Portfolio over Bear Periods
This table shows the mutual fund performance over the bear market period. The determination of bear periods follow http://www.nber.org/cycles.html. See
the definitions of variables in Table 3. The t-statistics are shown in parentheses and the italic and bold numbers are significant at the 5% and 1% levels,
respectively.
Panel A: Year 2001
Port. CAPM 3-Moment Model 3-Factor Model 4-Factor Model
MKT Adj.
R2 MKT SKEW Adj.
R2 MKT SMB HML
Adj.
R2 MKT SMB HML PR1YR Adj.
R2
1 -0.349
(-6.68)
1.605
(10.11)
90.19 -0.261
(-2.90)
1.566
(9.83)
-4.527
(-1.18)
90.55 -0.369
(-6.47)
1.368
(5.81)
0.303
(1.07)
-0.211
(-0.78)
90.35 -0.360
(-5.75)
1.468
(4.52)
0.361
(1.12)
-0.298
(-0.88)
0.124
(0.48)
89.32
2 -0.180
(-6.00)
1.299
(14.20)
94.80 -0.130
(-2.50) 1.277
(13.93)
-2.619
(-1.18)
95.00 -0.119
(-6.32)
1.170
(9.00)
0.245
(1.57)
-0.069
(-0.46)
95.32 -0.201
(-5.77)
1.137
(6.28)
0.226
(1.26)
-0.041
(-0.22)
-0.040
(-0.28)
94.71
3 -0.119
(-4.94)
1.190
(16.24)
95.98 -0.087
(-2.04) 1.175
(15.56)
-1.652
(-0.90)
95.91 -0.134
(-5.19)
1.101
(10.34)
0.192
(1.51)
-0.032
(-0.26)
96.21 -0.141
(-5.25)
1.012
(7.24)
0.140
(1.01)
0.045
(0.31)
-0.110
(-0.98)
96.19
4 -0.073
(-3.37)
1.116
(16.96)
96.31 -0.055
(-1.39) 1.108
(15.90)
-0.941
(-0.56)
96.03 -0.085
(-3.57)
1.057
(10.68)
0.159
(1.34)
-0.003
(-0.02)
96.27 -0.096
(-4.26)
0.931
(7.93)
0.085
(0.73)
0.106
(0.87)
-0.156
(-1.66)
96.94
5 -0.035
(-1.65) 1.049
(16.18)
95.95 -0.030
(-0.76) 1.047
(15.01)
-0.272
(-0.16)
95.52 -0.046
(-1.91) 1.014
(10.07)
0.136
(1.13)
0.023
(0.20)
95.64 -0.060
(-2.98)
0.853
(8.12)
0.042
(0.40)
0.162
(1.48)
-0.199
(-2.37)
97.24
6 -0.004
(-0.17) 1.007
(15.94)
95.84 -0.009
(-0.23) 1.009
(14.86)
0.272
(0.17)
95.39 -0.013
(-0.52) 0.976
(9.73)
0.112
(0.94)
0.015
(0.13)
95.31 -0.028
(-1.49) 0.802
(8.28)
0.010
(0.11)
0.165
(1.64) -0.215
(-2.78)
97.46
7 0.031
(1.39) 0.971
(14.22)
94.81 0.021
(0.50) 0.976
(13.33)
0.556
(0.31)
94.30 0.021
(0.80) 0.942
(8.71)
0.125
(0.96)
0.026
(0.21)
94.19 0.004
(0.21) 0.748
(7.46)
0.011
(0.11)
0.195
(1.86) -0.240
(-3.00)
97.09
8 0.070
(2.71)
0.947
(12.04)
92.90 0.051
(1.08) 0.956
(11.43)
0.986
(0.49)
92.32 0.058
(1.93) 0.916
(7.34)
0.142
(0.95)
0.032
(0.22)
92.02 0.039
(1.74) 0.692
(5.97)
0.010
(0.09)
0.226
(1.87) -0.276
(-2.99)
95.99
9 0.116
(3.79)
0.932
(10.00)
90.00 0.089
(1.59) 0.944
(9.59)
1.432
(0.60)
89.31 0.102
(2.86)
0.895
(6.05)
0.167
(0.94)
0.038
(0.22)
88.74 0.080
(2.90)
0.639
(4.46)
0.017
(0.12)
0.259
(1.74) -0.316
(-2.77)
93.86
10 0.176
(4.82)
0.930
(8.38)
86.29 0.138
(2.10) 0.947
(8.13)
1.956
(0.69)
85.54 0.160
(3.75)
0.878
(4.98)
0.195
(0.92)
0.030
(0.15)
84.51 0.136
(3.82)
0.596
(3.24)
0.030
(0.16)
0.274
(1.42)
-0.348
(-2.37)
90.17

Page 29 of 38
Panel B: Year 2008-2009
Port. CAPM 3-Moment Model 3-Factor Model 4-Factor Model
MKT Adj.
R2 MKT SKEW Adj.
R2 MKT SMB HML
Adj.
R2 MKT SMB HML PR1YR Adj.
R2
1 -0.269
(-8.73)
1.386
(15.62)
91.35 -0.162
(-6.95)
1.141
(18.62)
-2.465
(-6.92)
97.24 -0.283
(-9.38)
1.305
(12.79)
0.502
(1.97)
0.032
(0.18)
92.15 -0.259
(-8.54)
1.410
(13.09)
0.465
(1.95)
0.124
(0.71)
0.163
(2.05)
93.23
2 -0.117
(-8.45)
1.118
(27.98)
97.14 -0.094
(-5.40)
1.066
(23.21)
-0.528
(-1.98)
97.48 -0.125
(-9.83)
1.075
(24.96)
0.288
(2.67)
0.007
(0.10)
97.72 -0.108
(-10.82)
1.148
(32.31)
0.262
(3.34)
0.072
(1.24) 0.114
(4.36)
98.80
3 -0.080
(-6.40)
1.082
(30.02)
97.51 -0.060
(-3.79)
1.036
(24.90)
-0.464
(-1.92)
97.78 -0.088
(-7.82)
1.037
(27.33)
0.268
(2.82)
0.024
(0.35)
98.10 -0.074
(-7.90)
1.097
(33.01)
0.247
(3.36)
0.077
(1.43) 0.094
(3.84)
98.88
4 -0.052
(-4.50)
1.056
(31.68)
97.76 -0.034
(-2.31) 1.014
(26.24)
-0.417
(-1.86)
97.98 -0.059
(-5.75)
1.012
(29.03)
0.249
(2.85)
0.028
(0.45)
98.31 -0.048
(-5.20)
1.062
(32.43)
0.231
(3.19)
0.072
(1.35) 0.078
(3.22)
98.85
5 -0.028
(-2.53) 1.034
(32.85)
97.91 -0.012
(-0.87) 0.999
(26.92)
-0.353
(-1.64)
98.06 -0.034
(-3.51)
0.993
(29.97)
0.231
(2.78)
0.029
(0.48)
98.41 -0.025
(-2.68)
1.033
(30.85)
0.217
(2.93)
0.064
(1.17)
0.062
(2.52)
98.75
6 -0.005
(-0.47) 1.015
(32.92)
97.92 0.008
(0.55) 0.986
(26.65)
-0.293
(-1.37)
98.00 -0.012
(-1.24) 0.974
(30.18)
0.228
(2.82)
0.030
(0.53)
98.44 -0.005
(-0.51) 1.004
(28.86)
0.217
(2.83)
0.057
(1.00)
0.046
(1.81)
98.60
7 0.018
(1.62) 1.001
(32.07)
97.81 0.027
(1.89) 0.979
(25.66)
-0.224
(-1.01)
97.81 0.011
(1.11) 0.958
(29.72)
0.237
(2.93)
0.032
(0.56)
98.40 0.015
(1.46) 0.978
(26.79)
0.230
(2.85)
0.049
(0.82)
0.030
(1.11)
98.41
8 0.41
(3.66)
0.992
(30.39)
97.57 0.049
(3.20)
0.975
(24.16)
-0.172
(-0.73)
97.52 0.034
(3.46)
0.946
(28.47)
0.256
(3.08)
0.031
(0.51)
98.27 0.036
(3.27)
0.954
(24.67)
0.254
(2.97)
0.037
(0.58)
0.011
(0.38)
98.19
9 0.068
(5.66)
0.982
(28.44)
97.23 0.074
(4.55)
0.968
(22.56)
-0.144
(-0.58)
97.14 0.060
(5.83)
0.933
(26.94)
0.279
(3.22)
0.033
(0.53)
98.09 0.058
(5.12)
0.926
(22.98)
0.282
(3.16)
0.027
(0.41)
-0.011
(-0.36)
98.00
10 0.102
(7.99)
0.976
(26.49)
96.82 0.106
(6.09)
0.967
(21.02)
-0.097
(-0.36)
96.69 0.093
(8.80)
0.921
(25.74)
0.312
(3.48)
0.039
(0.60)
97.95 0.088
(7.74)
0.898
(22.27)
0.320
(3.59)
0.019
(0.29)
-0.034
(-1.16)
97.98
Page 30 of 38
Table 6 Ranking Large Capitalization Mutual Fund Portfolio with Different Objectives
This table presents large capitalization mutual fund performance classified by fund objectives. See the definitions of variables in Table 3. The t-statistics
are shown in parentheses and the italic and bold numbers are significant at the 5% and 1% levels, respectively.
Panel A: Large Capitalization Core Equity
Port. CAPM 3-Moment Model 3-Factor Model 4-Factor Model
MKT Adj.
R2 MKT SKEW Adj.
R2 MKT SMB HML
Adj.
R2 MKT SMB HML PR1YR Adj.
R2
1 -0.149
(-18.99)
1.107
(33.53)
89.55 -0.118
(-14.50)
1.016
(32.42)
-1.663
(-6.83)
92.27 -0.148
(-19.29)
1.144
(34.21)
-0.127
(-2.75)
0.058
(1.29)
90.35 -0.148
(-19.52)
1.178
(31.27)
-0.144
(-3.09)
0.068
(1.51)
0.049
(1.88)
90.53
2 -0.068
(-15.06)
0.962
(50.48)
95.11 -0.063
(-11.55)
0.945
(45.40)
-0.312
(-1.93)
95.21 -0.067
(-17.00)
1.000
(58.42)
-0.137
(-5.80)
0.049
(2.13)
96.45 -0.067
(-16.95)
1.003
(51.35)
-0.139
(-5.74)
0.050
(2.15)
0.005
(0.34)
96.42
3 -0.047
(-10.54)
0.948
(50.85)
95.18 -0.044
(-8.22)
0.940
(45.66)
-0.149
(-0.93)
95.17 0.045
(-12.12)
0.988
(60.93)
-0.146
(-6.52)
0.049
(2.24)
96.71 -0.045
(-12.07)
0.984
(53.19)
-0.144
(-6.29)
0.048
(2.16)
-0.006
(-0.47)
96.69
4 -0.032
(-7.30)
0.937
(50.19)
95.05 -0.031
(-5.79)
0.934
(45.15)
-0.070
(-0.44)
95.02 -0.031
(-8.35)
0.979
(61.19)
-0.151
(-6.87)
0.049
(2.28)
96.73 -0.031
(-8.32)
0.971
(53.34)
-0.148
(-6.56)
0.047
(2.16)
-0.011
(-0.87)
96.73
5 -0.021
(-4.73)
0.931
(49.85)
94.99 -0.021
(-3.93)
0.931
(45.02)
0.008
(0.05)
94.95 -0.019
(-5.20)
0.972
(60.36)
-0.150
(-6.77)
0.047
(2.18)
96.65 -0.019
(-5.18)
0.962
(52.59)
-0.145
(-6.43)
0.044
(2.03)
-0.015
(-1.14)
96.66
6 -0.011
(-2.37) 0.923
(49.41)
94.91 -0.012
(-2.22) 0.927
(44.83)
0.074
(0.46)
94.87 -0.009
(-2.34) 0.963
(59.22)
-0.149
(-6.63)
0.044
(2.02)
96.52 -0.009
(-2.31) 0.950
(51.60)
-0.142
(-6.25)
0.041
(1.85)
-0.018
(-1.42)
96.55
7 -0.000
(-0.11) 0.916
(49.27)
94.88 -0.003
(-0.53) 0.923
(44.91)
0.126
(0.79)
94.86 0.001
(0.33) 0.955
(58.17)
-0.144
(-6.34)
0.043
(1.95)
96.41 0.001
(0.37) 0.942
(50.69)
-0.137
(-5.96)
0.039
(1.77)
-0.020
(-1.52)
96.44
8 0.011
(2.45) 0.911
(49.92)
95.00 0.007
(1.41) 0.920
(45.75)
0.176
(1.12)
95.01 0.012
(3.23)
0.947
(57.24)
-0.132
(-5.79)
0.040
(1.79)
96.31 0.012
(3.27)
0.934
(49.85)
-0.126
(-5.43)
0.036
(1.62)
-0.018
(-1.36)
96.33
9 0.024
(5.62)
0.904
(49.34)
94.89 0.020
(3.79)
0.917
(45.66)
0.251
(1.61)
94.95 0.026
(6.59)
0.936
(54.59)
-0.120
(-5.09)
0.036
(1.55)
95.97 0.026
(6.63)
0.925
(47.51)
-0.115
(-4.76)
0.032
(1.40)
-0.017
(-1.22)
95.99
10 0.046
(9.81)
0.895
(45.91)
94.15 0.038
(6.96)
0.917
(43.31)
0.387
(2.35)
94.34 0.047
(10.56)
0.923
(47.97)
-0.098
(-3.69)
0.035
(1.34)
94.87 0.047
(10.58)
0.912
(41.70)
-0.092
(-3.42)
0.031
(1.20)
-0.016
(-1.03)
94.88

Page 31 of 38
Panel B: Large Capitalization Growth Equity
Port. CAPM 3-Moment Model 3-Factor Model 4-Factor Model
MKT Adj.
R2 MKT SKEW Adj.
R2 MKT SMB HML
Adj.
R2 MKT SMB HML PR1YR Adj.
R2
1 -0.199
(-12.28)
1.378
(20.30)
75.83 -0.173
(-9.01)
1.303
(17.71)
-1.390
(-2.43)
76.71 -0.187
(-12.82)
1.310
(20.64)
-0.090
(-1.03) -0.517
(-6.04)
80.99 -0.188
(-13.04)
1.383
(19.42)
-0.127
(-1.44) -0.495
(-5.83)
0.106
(2.14)
81.51
2 -0.096
(-11.80)
1.121
(32.77)
89.12 -0.095
(-9.60)
1.117
(29.47)
-0.080
(-0.27)
89.04 -0.088
(-13.53)
1.084
(38.46)
-0.099
(-2.54) -0.350
(-9.21)
93.36 -0.088
(-13.59)
1.103
(34.49)
-0.108
(-2.74)
-0.344
(-9.02)
0.028
(1.26)
93.39
3 -0.067
(-9.18)
1.091
(35.40)
90.53 -0.069
(-7.72)
1.095
(32.06)
0.061
(0.23)
90.46 -0.059
(-10.34)
1.059
(42.34)
-0.100
(-2.91)
-0.323
(-9.57)
94.39 -0.060
(-10.38)
1.075
(37.86)
-0.109
(-3.09)
-0.318
(-9.37)
0.024
(1.19)
94.41
4 -0.048
(-6.88)
1.074
(36.70)
91.13 -0.051
(-6.05)
1.083
(33.45)
0.162
(0.64)
91.09 -0.040
(-7.41)
1.044
(44.28)
-0.102
(-3.15)
-0.309
(-9.73)
94.82 -0.040
(-7.44)
1.059
(39.51)
-0.110
(-3.31)
-0.305
(-9.53)
0.021
(1.13)
94.83
5 -0.031
(-4.59)
1.059
(37.57)
91.50 -0.035
(-4.35)
1.072
(34.44)
0.235
(0.97)
91.50 -0.023
(-4.48)
1.029
(45.32)
-0.092
(-2.94)
-0.298
(-9.74)
95.04 -0.024
(-4.52)
1.045
(40.58)
-0.100
(-3.14)
-0.293
(-9.54)
0.024
(1.31)
95.07
6 -0.015
(-2.25) 1.048
(37.67)
91.54 -0.020
(-2.55) 1.064
(34.72)
0.291
(1.22)
91.58 -0.008
(-1.51) 1.017
(44.87)
-0.079
(-2.54) -0.289
(-9.47)
94.96 -0.008
(-1.55) 1.033
(40.23)
-0.088
(-2.76)
-0.285
(-9.28)
0.024
(1.35)
94.99
7 0.000
(0.03) 1.038
(37.19)
91.34 -0.006
(-0.78) 1.056
(34.44)
0.342
(1.44)
91.41 0.007
(1.29) 1.004
(43.47)
-0.065
(-2.04) -0.282
(-9.06)
94.66 0.007
(1.26) 1.022
(39.07)
-0.074
(-2.29) -0.277
(-8.86)
0.026
(1.43)
94.71
8 0.017
(2.42) 1.031
(35.63)
90.64 0.009
(1.11) 1.053
(33.17)
0.399
(1.62)
90.76 0.023
(4.13)
0.993
(40.92)
-0.047
(-1.40) -0.284
(-8.68)
94.07 0.023
(4.11)
1.013
(36.87)
-0.057
(-1.67) -0.278
(-8.48)
0.029
(1.51)
94.13
9 0.036
(4.92)
1.026
(33.22)
89.38 0.027
(3.09)
1.052
(31.17)
0.486
(1.85)
89.58 0.042
(6.96)
0.983
(37.16)
-0.030
(-0.82) -0.289
(-8.08)
92.98 0.042
(6.96)
1.005
(33.58)
-0.041
(-1.11) -0.282
(-7.89)
0.032
(1.54)
93.05
10 0.063
(7.71)
1.024
(30.01)
87.29 0.052
(5.34)
1.056
(28.38)
0.589
(2.04)
87.59 0.068
(9.89)
0.975
(32.37)
-0.003
(-0.08) -0.293
(-7.22)
91.09 0.068
(9.92)
1.002
(29.42)
-0.017
(-0.40) -0.285
(-7.02)
0.039
(1.63)
91.20
Panel C: Large Capitalization Value Equity
Port. CAPM 3-Moment Model 3-Factor Model 4-Factor Model
MKT Adj.
R2 MKT SKEW Adj.
R2 MKT SMB HML
Adj.
R2 MKT SMB HML PR1YR Adj.
R2
1 -0.137
(-11.52)
1.035
(20.66)
76.48 -0.101
(-7.61)
0.928
(18.26)
-1.971
(-4.99)
80.13 -0.142
(-16.35)
1.158
(30.65)
-0.225
(-4.33)
0.433
(8.50)
87.89 -0.142
(-16.28)
1.156
(26.82)
-0.225
(-4.22)
0.432
(8.40)
-0.002
(-0.05)
87.87
2 -0.067
(-7.96)
0.901
(25.47)
83.18 -0.056
(-5.59)
0.869
(22.50)
-0.579
(-1.93)
83.52 -0.070
(-13.66)
1.002
(45.08)
-0.206
(-6.74)
0.332
(11.06)
94.02 0.069
(-13.82)
0.975
(39.19)
-0.193
(-6.27)
0.324
(10.89)
-0.039
(-2.25)
94.20
3 -0.045
(-5.59)
0.879
(25.78)
83.52 -0.038
(-3.86)
0.857
(22.85)
-0.412
(-1.41)
83.64 -0.048
(-10.22)
0.979
(47.64)
0.198
(-6.99)
0.331
(11.95)
94.62 -0.048
(-10.39)
0.950
(41.58)
-0.184
(-6.50)
0.322
(11.81)
-0.042
(-2.61)
94.85
4 -0.030
(-3.79)
0.862
(26.17)
83.92 -0.024
(-2.56) 0.846
(23.28)
-0.295
(-1.05)
83.93 -0.033
(-7.37)
0.958
(49.56)
-0.186
(-6.98)
0.329
(12.62)
95.01 -0.032
(-7.50)
0.929
(43.41)
-0.171
(-6.48)
0.320
(12.53)
-0.042
(-2.82)
95.27
5 -0.016
(-2.13) 0.851
(26.62)
84.38 -0.012
(-1.29) 0.839
(23.74)
-0.230
(-0.84)
84.35 -0.020
(-4.54)
0.944
(50.44)
-0.169
(-6.57)
0.328
(12.99)
95.19 -0.019
(-4.60)
0.916
(44.22)
-0.155
(-6.06)
0.319
(12.91)
-0.041
(-2.87)
95.44
6 -0.004
(-0.56) 0.843
(26.84)
84.60 -0.001
(-0.07) 0.832
(23.98)
-0.191
(-0.71)
84.54 -0.008
(-1.82) 0.932
(50.60)
-0.158
(-6.22)
0.327
(13.15)
95.22 -0.007
(-1.80) 0.906
(44.29)
-0.145
(-5.72)
0.319
(13.05)
-0.039
(-2.70)
95.45
7 0.008
(1.03) 0.837
(26.88)
84.63 0.011
(1.17) 0.829
(24.05)
-0.154
(-0.57)
84.55 0.004
(0.95) 0.925
(49.76)
-0.151
(-5.89)
0.325
(12.96)
95.07 0.004
(1.04) 0.899
(43.54)
-0.137
(-5.38)
0.317
(12.86)
-0.039
(-2.74)
95.31
8 0.020
(2.72)
0.831
(26.63)
84.38 0.022
(2.48) 0.825
(23.87)
-0.114
(-0.42)
84.29 0.016
(3.71)
0.917
(47.80)
-0.140
(-5.28)
0.327
(12.65)
94.69 0.017
(3.87)
0.889
(41.78)
-0.126
(-4.77)
0.319
(12.54)
-0.041
(-2.74)
94.95
9 0.035
(4.72)
0.821
(26.13)
83.88 0.035
(3.91)
0.821
(23.58)
-0.004
(-0.02)
83.76 0.031
(6.73)
0.905
(44.68)
-0.128
(-4.58)
0.327
(11.98)
93.98 0.032
(7.02)
0.872
(39.09)
-0.111
(-4.04)
0.317
(11.90)
-0.047
(-3.04)
94.35
10 0.055
(7.36)
0.811
(25.83)
83.56 0.001
(5.81)
0.818
(23.54)
0.133
(0.49)
83.47 0.051
(10.08)
0.888
(40.47)
-0.107
(-3.52)
0.318
(10.74)
92.78 0.051
(10.51)
0.852
(35.33)
-0.088
(-2.95)
0.607
(10.66)
-0.054
(-3.21)
93.27

Page 32 of 38
Table 7 Ranking Mid Capitalization Mutual Fund Portfolio with Different Objectives
This table presents mid capitalization mutual fund performance classified by fund objectives. See the definitions of variables in Table 3. The t-statistics are
shown in parentheses and the italic and bold numbers are significant at the 5% and 1% levels, respectively.
Panel A: Mid Capitalization Core Equity
Port. CAPM 3-Moment Model 3-Factor Model 4-Factor Model
MKT Adj.
R2 MKT SKEW Adj.
R2 MKT SMB HML
Adj.
R2 MKT SMB HML PR1YR Adj.
R2
1 -0.208
(-12.38)
1.444
(20.51)
76.22 -0.135
(-8.06)
1.234
(19.12)
-3.866
(-7.71)
83.59 -0.222
(-14.24)
1.405
(20.70)
0.439
(4.70)
0.336
(3.67)
80.11 -0.223
(-14.69)
1.507
(20.05)
0.388
(4.18)
0.366
(4.08)
0.149
(2.84)
81.15
2 -0.078
(-8.87)
1.124
(30.31)
87.51 -0.058
(-5.70)
1.065
(27.16)
-1.080
(-3.55)
88.53 -0.087
(-12.41)
1.055
(34.54)
0.387
(9.19)
0.091
(2.20)
92.38 -0.087
(-12.74)
1.096
(32.27)
0.366
(8.71)
0.103
(2.54) 0.061
(2.58)
92.70
3 -0.044
(-5.42)
1.083
(32.13)
88.73 -0.027
(-2.89)
1.035
(28.76)
-0.882
(-3.15)
89.45 -0.052
(-8.70)
1.018
(38.83)
0.381
(10.54)
0.103
(2.92)
93.87 -0.053
(-9.02)
1.058
(36.52)
0.360
(10.06)
0.115
(3.33)
0.059
(2.92)
94.21
4 -0.020
(-2.56) 1.066
(32.38)
88.89 -0.005
(-0.57) 1.023
(28.94)
-0.792
(-2.89)
89.48 -0.029
(-5.20)
0.999
(40.88)
0.390
(11.57)
0.109
(3.31)
94.48 -0.030
(-5.45)
1.039
(38.66)
0.369
(11.12)
0.121
(3.77)
0.059
(3.14)
94.84
5 -0.000
(-0.04) 1.059
(-32.06)
88.69 0.013
(1.44) 1.019
(28.59)
-0.733
(-2.65)
89.18 -0.010
(-1.76) 0.991
(41.16)
0.398
(11.98)
0.117
(3.61)
94.58 0.010
(-1.91) 1.034
(39.27)
0.376
(11.56)
0.130
(4.14)
0.062
(3.40)
94.99
6 0.016
(2.02) 1.057
(31.63)
88.41 0.028
(2.99)
1.022
(28.15)
-0.653
(-2.32)
88.79 0.007
(1.17) 0.990
(40.10)
0.398
(11.70)
0.117
(3.52)
94.31 0.006
(1.13) 1.036
(38.50)
0.375
(11.29)
0.131
(4.08)
0.066
(3.54)
94.78
7 0.032
(3.88)
1.055
(30.17)
87.41 0.043
(4.37)
1.023
(26.80)
-0.593
(-2.00)
87.69 0.023
(3.80)
0.983
(37.44)
0.409
(11.30)
0.104
(2.95)
93.61 0.022
(3.89)
1.033
(36.16)
0.384
(10.89)
0.119
(3.50)
0.072
(3.62)
94.16
8 0.050
(5.60)
1.045
(27.61)
85.32 0.060
(5.57)
1.017
(24.49)
-0.515
(-1.60)
85.50 0.041
(6.11)
0.966
(33.00)
0.427
(10.58)
0.088
(2.23)
92.09 0.041
(6.26)
1.016
(31.62)
0.402
(10.12)
0.103
(2.68)
0.073
(3.24)
92.64
9 0.073
(7.46)
1.037
(25.41)
83.11 0.079
(6.75)
1.018
(22.60)
-0.351
(-1.00)
83.11 0.063
(8.36)
0.953
(28.84)
0.431
(9.46)
0.066
(1.47)
90.02 0.063
(8.51)
1.002
(27.36)
0.406
(8.98)
0.080
(1.83) 0.072
(2.80)
90.52
10 0.104
(9.24)
1.036
(21.81)
78.36 0.107
(7.82)
1.028
(19.55)
-0.135
(-0.33)
78.21 0.095
(10.42)
0.939
(23.59)
0.470
(8.55)
0.037
(0.69)
86.31 0.095
(10.58)
0.992
(22.36)
0.443
(8.07)
0.053
(1.00)
0.078
(2.51)
86.86

Page 33 of 38
Panel B: Mid Capitalization Growth Equity
Port. CAPM 3-Moment Model 3-Factor Model 4-Factor Model
MKT Adj.
R2 MKT SKEW Adj.
R2 MKT SMB HML
Adj.
R2 MKT SMB HML PR1YR Adj.
R2
1 -0.244
(-11.53)
1.623
(18.28)
71.77 -0.211
(-8.41)
1.526
(15.85)
-1.773
(-2.37)
72.74 -0.241
(-13.24)
1.448
(18.30)
0.391
(3.58)
-0.530
(-4.97)
79.83 -0.241
(-13.26)
1.492
(16.58)
0.368
(3.31)
-0.517
(-4.81)
0.064
(1.03)
79.83
2 -0.111
(-7.55)
1.354
(21.97)
78.63 -0.101
(-5.69)
1.324
(19.48)
-0.546
(-1.03)
78.64 -0.111
(-11.01)
1.182
(26.83)
0.470
(7.74)
-0.405
(-6.81)
90.16 -0.112
(-11.21)
1.233
(24.94)
0.445
(7.28)
-0.390
(-6.60)
0.074
(2.14)
90.42
3 -0.071
(-5.25)
1.307
(23.00)
80.12 -0.063
(-3.87)
1.284
(20.45)
-0.425
(-0.87)
80.08 -0.072
(-8.21)
1.141
(29.78)
0.468
(8.86)
-0.374
(-7.24)
91.86 -0.073
(-8.48)
1.198
(28.19)
0.440
(8.38)
-0.357
(-7.04)
0.083
(2.79)
92.27
4 -0.043
(-3.33)
1.284
(23.74)
81.12 -0.037
(-2.37) 1.267
(21.18)
-0.318
(-0.68)
81.04 -0.044
(-5.40)
1.124
(31.56)
0.456
(9.30)
-0.358
(-7.45)
92.63 -0.045
(-5.66)
1.183
(30.27)
0.426
(8.82)
-0.340
(-7.28)
0.087
(3.21)
93.13
5 -0.019
(-1.48) 1.269
(23.41)
80.67 -0.014
(-0.89) 1.253
(20.90)
-0.281
(-0.60)
80.58 -0.021
(-2.64)
1.105
(31.74)
0.483
(10.07)
-0.343
(-7.30)
92.83 -0.022
(-2.84)
1.169
(30.85)
0.451
(9.62)
-0.323
(-7.15)
0.094
(3.55)
93.42
6 0.003
(0.22) 1.255
(23.17)
80.35 0.007
(0.46) 1.243
(20.72)
-0.229
(-0.49)
80.23 0.000
(0.06) 1.091
(31.46)
0.492
(10.30)
-0.333
(-7.13)
92.76 -0.000
(-0.02) 1.158
(30.78)
0.459
(9.87)
-0.313
(-6.98)
0.097
(3.71)
93.41
7 0.024
(1.82) 1.246
(22.60)
79.55 0.027
(1.70) 1.237
(20.26)
-0.166
(-0.35)
79.41 0.021
(2.62)
1.080
(30.49)
0.506
(10.37)
-0.332
(-6.96)
92.42 0.021
(2.65)
1.146
(29.78)
0.472
(9.93)
-0.312
(-6.80)
0.097
(3.63)
93.08
8 0.047
(3.55)
1.229
(22.03)
78.71 0.049
(3.04)
1.225
(19.81)
-0.084
(-0.18)
78.55 0.044
(5.28)
1.062
(29.16)
0.517
(10.30)
-0.320
(-6.51)
91.84 0.043
(5.42)
1.128
(28.39)
0.484
(9.85)
-0.300
(-6.33)
0.096
(3.48)
92.49
9 0.075
(5.56)
1.213
(21.29)
77.53 0.076
(4.60)
1.212
(19.21)
-0.003
(-0.01)
77.36 0.072
(8.02)
1.048
(26.73)
0.516
(9.55)
-0.308
(-5.83)
90.43 0.072
(8.26)
1.117
(26.05)
0.481
(9.08)
-0.288
(-5.62)
0.101
(3.38)
91.15
10 0.113
(7.68)
1.202
(19.50)
74.33 0.110
(6.18)
1.211
(17.73)
0.156
(0.29)
74.15 0.109
(10.34)
1.036
(22.47)
0.520
(8.17)
-0.312
(-5.01)
87.08 0.109
(10.55)
1.106
(21.66)
0.484
(7.68)
-0.291
(-4.77)
0.102
(2.86)
87.76
Panel C: Mid Capitalization Value Equity
Port. CAPM 3-Moment Model 3-Factor Model 4-Factor Model
MKT Adj.
R2 MKT SKEW Adj.
R2 MKT SMB HML
Adj.
R2 MKT SMB HML PR1YR Adj.
R2
1 -0.237
(-7.45)
1.199
(8.96)
37.72 -0.144
(-4.04)
0.928
(6.77)
-4.979
(-4.68)
46.33 -0.264
(-9.18)
1.277
(10.18)
0.426
(2.46) 1.011
(5.98)
50.66 -0.264
(-9.13)
1.258
(8.78)
0.436
(2.46) 1.006
(5.88)
-0.028
(-0.29)
50.31
2 -0.078
(-7.75)
0.995
(23.44)
80.72 -0.050
(-4.38)
0.912
(20.84)
-1.519
(-4.47)
83.17 -0.091
(-13.05)
1.040
(34.09)
0.185
(4.39)
0.506
(12.30)
91.03 -0.091
(-13.00)
1.029
(29.60)
0.190
(4.43)
0.503
(12.10)
-0.16
(-0.67)
90.99
3 -0.046
(-4.85)
0.964
(24.42)
81.96 -0.022
(-2.03) 0.895
(21.67)
-1.272
(-3.96)
83.80 -0.058
(-9.58)
1.008
(-9.58)
0.184
(5.01)
0.494
(13.79)
92.65 -0.058
(-9.56)
0.992
(32.85)
0.192
(5.13)
0.490
(13.57)
-0.023
(-1.09)
92.66
4 -0.022
(-2.42) 0.939
(24.40)
81.94 -0.000
(-0.02) 0.875
(21.60)
-1.176
(-3.74)
83.58 -0.035
(-6.08)
0.982
(39.06)
0.485
(5.35)
0.491
(14.49)
93.07 -0.035
(-6.06)
0.963
(33.81)
0.195
(5.53)
0.486
(14.27)
-0.027
(-1.36)
93.11
5 -0.003
(-0.36) 0.919
(24.25)
81.75 0.016
(1.56) 0.862
(21.40)
-1.046
(-3.34)
83.07 -0.016
(-2.86)
0.962
(39.45)
0.184
(5.48)
0.498
(14.85)
93.21 -0.016
(-2.84)
0.940
(34.14)
0.195
(5.73)
0.482
(14.65)
-0.031
(-1.64)
93.30
6 0.015
(1.71) 0.902
(23.76)
81.14 0.033
(3.12)
0.851
(20.91)
-0.937
(-2.96)
82.21 0.002
(0.42) 0.941
(38.76)
0.204
(6.10)
0.489
(14.95)
93.07 0.003
(0.47) 0.916
(33.52)
0.217
(6.42)
0.482
(14.76)
-0.036
(-1.91)
93.21
7 0.034
(3.74)
0.895
(23.47)
80.76 0.050
(4.62)
0.849
(20.64)
-0.834
(-2.61)
81.59 0.021
(3.64)
0.930
(37.59)
0.214
(6.26)
0.485
(14.54)
92.70 0.021
(3.73)
0.903
(32.49)
0.228
(6.63)
0.477
(14.38)
-0.040
(-2.09)
92.89
8 0.052
(5.75)
0.895
(23.39)
80.65 0.065
(6.04)
0.857
(20.58)
-0.697
(-2.15)
81.18 0.039
(6.63)
0.926
(36.01)
0.228
(6.44)
0.474
(13.68)
92.15 0.039
(6.77)
0.897
(31.08)
0.243
(6.81)
0.465
(13.51)
-0.043
(-2.12)
92.36
9 0.074
(7.87)
0.894
(22.53)
79.46 0.085
(7.54)
0.862
(19.84)
-0.586
(-1.73)
79.77 0.061
(9.35)
0.918
(32.40)
0.250
(6.39)
0.464
(12.15)
90.57 0.061
(9.51)
0.887
(27.86)
0.265
(6.75)
0.455
(11.97)
-0.046
(-2.07)
90.80
10 0.107
(10.36)
0.903
(20.85)
76.80 0.114
(9.13)
0.884
(18.48)
-0.358
(-0.96)
76.79 0.09
(11.96)
0.919
(27.13)
0.280
(5.99)
0.455
(9.95)
87.24 0.094
(12.40)
0.866
(23.16)
0.307
(6.65)
0.439
(9.83)
-0.078
(-3.00)
87.99
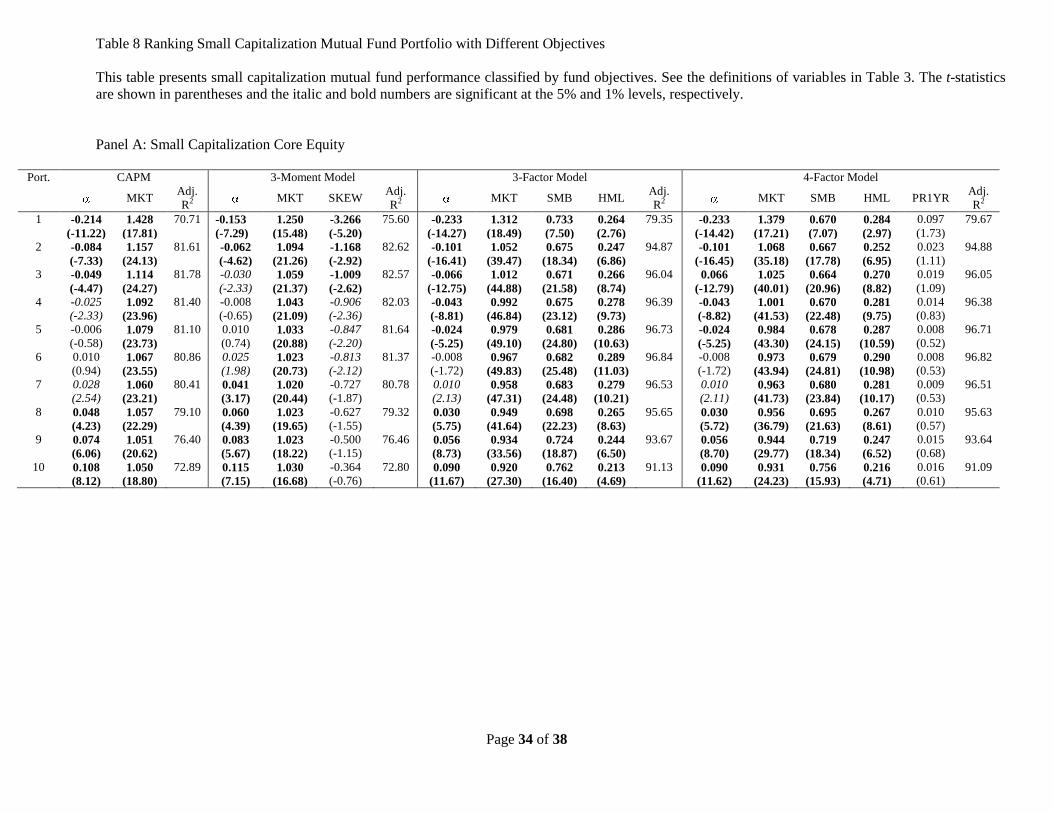
Page 34 of 38
Table 8 Ranking Small Capitalization Mutual Fund Portfolio with Different Objectives
This table presents small capitalization mutual fund performance classified by fund objectives. See the definitions of variables in Table 3. The t-statistics
are shown in parentheses and the italic and bold numbers are significant at the 5% and 1% levels, respectively.
Panel A: Small Capitalization Core Equity
Port. CAPM 3-Moment Model 3-Factor Model 4-Factor Model
MKT Adj.
R2 MKT SKEW Adj.
R2 MKT SMB HML
Adj.
R2 MKT SMB HML PR1YR Adj.
R2
1 -0.214
(-11.22)
1.428
(17.81)
70.71 -0.153
(-7.29)
1.250
(15.48)
-3.266
(-5.20)
75.60 -0.233
(-14.27)
1.312
(18.49)
0.733
(7.50)
0.264
(2.76)
79.35 -0.233
(-14.42)
1.379
(17.21)
0.670
(7.07)
0.284
(2.97)
0.097
(1.73)
79.67
2 -0.084
(-7.33)
1.157
(24.13)
81.61 -0.062
(-4.62)
1.094
(21.26)
-1.168
(-2.92)
82.62 -0.101
(-16.41)
1.052
(39.47)
0.675
(18.34)
0.247
(6.86)
94.87 -0.101
(-16.45)
1.068
(35.18)
0.667
(17.78)
0.252
(6.95)
0.023
(1.11)
94.88
3 -0.049
(-4.47)
1.114
(24.27)
81.78 -0.030
(-2.33) 1.059
(21.37)
-1.009
(-2.62)
82.57 -0.066
(-12.75)
1.012
(44.88)
0.671
(21.58)
0.266
(8.74)
96.04 0.066
(-12.79)
1.025
(40.01)
0.664
(20.96)
0.270
(8.82)
0.019
(1.09)
96.05
4 -0.025
(-2.33) 1.092
(23.96)
81.40 -0.008
(-0.65) 1.043
(21.09)
-0.906
(-2.36)
82.03 -0.043
(-8.81)
0.992
(46.84)
0.675
(23.12)
0.278
(9.73)
96.39 -0.043
(-8.82)
1.001
(41.53)
0.670
(22.48)
0.281
(9.75)
0.014
(0.83)
96.38
5 -0.006
(-0.58) 1.079
(23.73)
81.10 0.010
(0.74) 1.033
(20.88)
-0.847
(-2.20)
81.64 -0.024
(-5.25)
0.979
(49.10)
0.681
(24.80)
0.286
(10.63)
96.73 -0.024
(-5.25)
0.984
(43.30)
0.678
(24.15)
0.287
(10.59)
0.008
(0.52)
96.71
6 0.010
(0.94) 1.067
(23.55)
80.86 0.025
(1.98) 1.023
(20.73)
-0.813
(-2.12)
81.37 -0.008
(-1.72) 0.967
(49.83)
0.682
(25.48)
0.289
(11.03)
96.84 -0.008
(-1.72) 0.973
(43.94)
0.679
(24.81)
0.290
(10.98)
0.008
(0.53)
96.82
7 0.028
(2.54) 1.060
(23.21)
80.41 0.041
(3.17)
1.020
(20.44)
-0.727
(-1.87)
80.78 0.010
(2.13) 0.958
(47.31)
0.683
(24.48)
0.279
(10.21)
96.53 0.010
(2.11) 0.963
(41.73)
0.680
(23.84)
0.281
(10.17)
0.009
(0.53)
96.51
8 0.048
(4.23)
1.057
(22.29)
79.10 0.060
(4.39)
1.023
(19.65)
-0.627
(-1.55)
79.32 0.030
(5.75)
0.949
(41.64)
0.698
(22.23)
0.265
(8.63)
95.65 0.030
(5.72)
0.956
(36.79)
0.695
(21.63)
0.267
(8.61)
0.010
(0.57)
95.63
9 0.074
(6.06)
1.051
(20.62)
76.40 0.083
(5.67)
1.023
(18.22)
-0.500
(-1.15)
76.46 0.056
(8.73)
0.934
(33.56)
0.724
(18.87)
0.244
(6.50)
93.67 0.056
(8.70)
0.944
(29.77)
0.719
(18.34)
0.247
(6.52)
0.015
(0.68)
93.64
10 0.108
(8.12)
1.050
(18.80)
72.89 0.115
(7.15)
1.030
(16.68)
-0.364
(-0.76)
72.80 0.090
(11.67)
0.920
(27.30)
0.762
(16.40)
0.213
(4.69)
91.13 0.090
(11.62)
0.931
(24.23)
0.756
(15.93)
0.216
(4.71)
0.016
(0.61)
91.09

Page 35 of 38
Panel B: Small Capitalization Growth Equity
Port. CAPM 3-Moment Model 3-Factor Model 4-Factor Model
MKT Adj.
R2 MKT SKEW Adj.
R2 MKT SMB HML
Adj.
R2 MKT SMB HML PR1YR Adj.
R2
1 -0.240
(-10.25)
1.641
(16.70)
67.97 -0.202
(-7.30)
1.531
(14.39)
-2.028
(-2.45)
69.17 -0.245
(-13.32)
1.402
(17.48)
0.765
(6.92)
-0.423
(-3.91)
80.80 -0.246
(-13.52)
1.488
(16.51)
0.721
(6.48)
-0.397
(-3.69)
0.126
(2.00)
81.24
2 -0.111
(-7.30)
1.358
(21.25)
77.48 -0.099
(-5.38)
1.322
(18.77)
-0.673
(-1.23)
77.56 -0.120
(-14.21)
1.158
(31.43)
0.745
(14.67)
-0.224
(-4.52)
93.27 -0.121
(-14.59)
1.208
(29.49)
0.719
(14.20)
-0.209
(-4.27)
0.074
(2.61)
93.56
3 -0.073
(-5.02)
1.317
(21.68)
78.16 -0.062
(-3.56)
1.287
(19.20)
-0.563
(-1.08)
78.19 -0.082
(-11.29)
1.121
(35.26)
0.750
(17.12)
-0.192
(-4.48)
94.62 -0.083
(-11.72)
1.172
(33.45)
0.724
(16.73)
-0.177
(-4.23)
0.075
(3.05)
94.95
4 -0.045
(-3.15)
1.297
(21.67)
78.15 -0.036
(-2.11) 1.272
(19.24)
-0.460
(-0.90)
78.12 -0.055
(-8.10)
1.100
(37.38)
0.753
(18.56)
-0.192
(-4.84)
95.25 -0.055
(-8.57)
1.156
(36.18)
0.725
(18.35)
-0.175
(-4.59)
0.082
(3.67)
95.67
5 -0.021
(-1.50) 1.289
(21.73)
78.24 -0.014
(-0.81) 1.267
(19.33)
-0.395
(-0.78)
78.18 -0.031
(-4.70)
1.092
(38.20)
0.749
(18.99)
-0.194
(-5.03)
95.45 -0.031
(-5.04)
1.150
37.26)
0.719
(18.87)
-0.177
(-4.79)
0.084
(3.90)
95.90
6 0.001
(0.09) 1.284
(21.49)
77.87 0.008
(0.44) 1.266
(19.16)
-0.331
(-0.64)
77.77 -0.008
(-1.29) 1.086
(38.01)
0.756
(19.20)
-0.195
(-5.06)
95.45 -0.009
(-1.46) 1.145
(37.33)
0.726
(19.14)
-0.177
(-4.83)
0.087
(4.07)
95.94
7 0.025
(1.70) 1.280
(21.12)
77.26 0.029
(1.67) 1.266
(18.88)
-0.245
(-0.47)
77.13 0.015
(2.19) 1.079
(36.54)
0.759
(18.65)
-0.202
(-5.08)
95.14 0.014
(2.22) 1.141
(35.99)
0.728
(18.59)
-0.184
(-4.86)
0.090
(4.08)
95.67
8 0.049
(3.29)
1.268
(20.32)
75.88 0.052
(2.91)
1.257
(18.20)
-0.188
(-0.35)
75.71 0.039
(5.24)
1.065
(33.06)
0.773
(17.40)
-0.197
(-4.54)
94.21 0.038
(5.44)
1.130
(32.57)
0.740
(17.25)
-0.180
(-4.29)
0.096
(3.96)
94.80
9 0.077
(4.98)
1.255
(19.39)
74.11 0.079
(4.25)
1.248
(17.40)
-0.135
(-0.24)
73.92 0.066
(8.03)
1.051
(29.14)
0.784
(15.78)
-0.196
(-4.03)
92.77 0.066
(8.33)
1.120
(28.65)
0.749
(15.50)
-0.175
(-3.75)
0.101
(3.72)
93.43
10 0.114
(7.11)
1.241
(18.40)
72.04 0.113
(5.82)
1.244
(16.65)
0.057
(0.10)
71.83 0.104
(10.97)
1.036
(25.07)
0.778
(13.66)
-0.205
(-3.67)
90.55 0.103
(11.21)
1.099
(24.05)
0.747
(13.22)
-0.186
(-3.40)
0.092
(2.90)
91.07
Panel C: Small Capitalization Value Equity
Port. CAPM 3-Moment Model 3-Factor Model 4-Factor Model
MKT Adj.
R2 MKT SKEW Adj.
R2 MKT SMB HML
Adj.
R2 MKT SMB HML PR1YR Adj.
R2
1 -0.179
(-9.97)
1.210
(16.05)
66.21 -0.098
(-5.58)
0.975
(14.39)
-4.308
(-8.18)
77.58 -0.206
(-16.59)
1.203
(22.22)
0.652
(8.74)
0.802
(10.98)
84.30 -0.206
(-16.52)
1.207
(19.53)
0.650
(8.51)
0.803
(10.88)
0.006
(0.15)
84.18
2 -0.072
(-5.73)
0.988
(18.84)
72.99 -0.040
(-2.82)
0.897
(16.33)
-1.665
(-3.90)
75.65 -0.094
(-14.33)
0.984
(34.56)
0.526
(13.41)
0.653
(17.02)
92.84 -0.093
(-14.49)
0.950
(29.80)
0.543
(13.79)
0.643
(16.90)
-0.050
(-2.24)
93.06
3 -0.041
(-3.30)
0.955
(18.50)
72.27 -0.013
(-0.93) 0.875
(16.00)
-1.463
(-3.44)
74.40 -0.063
(-10.58)
0.953
(36.80)
0.524
(14.69)
0.664
(19.01)
93.72 -0.063
(-10.76)
0.917
(31.85)
0.543
(15.26)
0.653
(18.99)
-0.053
(-2.66)
94.00
4 -0.018
(-1.48) 0.934
(18.30)
71.82 0.006
(0.41) 0.865
(15.81)
-1.270
(-2.99)
73.44 -0.040
(-7.13)
0.933
(37.94)
0.524
(15.46)
0.664
(20.04)
94.12 -0.040
(-7.27)
0.894
(32.95)
0.543
(16.20)
0.653
(20.15)
-0.056
(-2.98)
94.46
5 0.000
(0.03) 0.920
(18.16)
71.50 0.021
(1.51) 0.859
(15.71)
-1.130
(-2.66)
72.77 -0.022
(-4.00)
0.919
(38.54)
0.523
(15.91)
0.664
(20.65)
94.33 -0.022
(-4.07)
0.878
(33.59)
0.543
(16.82)
0.651
(20.87)
-0.059
(-3.26)
94.73
6 0.018
(1.47) 0.912
(18.14)
71.46 0.037
(2.58)
0.856
(15.72)
-1.015
(-2.40)
72.47 -0.005
(-0.83) 0.908
(38.46)
0.524
(16.10)
0.655
(20.56)
94.33 -0.004
(-0.79) 0.865
(33.59)
0.546
(17.14)
0.542
(20.86)
-0.062
(-3.47)
94.78
7 0.036
(3.01)
0.906
(18.18)
71.54 0.053
(3.74)
0.856
(15.79)
-0.912
(-2.16)
72.33 0.014
(2.53) 0.890
(37.88)
0.526
(16.06)
0.642
(20.04)
94.18 0.014
(2.74)
0.855
(33.13)
0.548
(17.18)
0.629
(20.39)
-0.065
(-3.63)
94.69
8 0.054
(4.59)
0.904
(18.11)
71.39 0.070
(4.90)
0.860
(15.77)
-0.802
(-1.89)
71.95 0.033
(5.76)
0.895
(36.11)
0.530
(15.51)
0.630
(18.86)
93.66 0.033
(6.15)
0.846
(31.57)
0.554
(16.73)
0.615
(19.22)
-0.071
(-3.79)
94.26
9 0.075
(6.31)
0.898
(17.91)
70.93 0.088
(6.16)
0.860
(15.64)
-0.686
(-1.60)
71.27 0.054
(8.88)
0.884
(33.54)
0.536
(14.75)
0.613
(17.23)
92.76 0.054
(9.41)
0.833
(29.17)
0.562
(15.92)
0.598
(17.52)
-0.075
(-3.76)
93.44
10 0.104
(8.57)
0.899
(17.68)
70.40 0.113
(7.78)
0.871
(15.55)
-0.510
(-1.17)
70.48 0.082
(12.51)
0.877
(30.56)
0.553
(13.99)
0.587
(15.18)
91.51 0.083
(13.29)
0.819
(26.48)
0.583
(15.24)
0.570
(15.42)
-0.085
(-3.93)
92.37
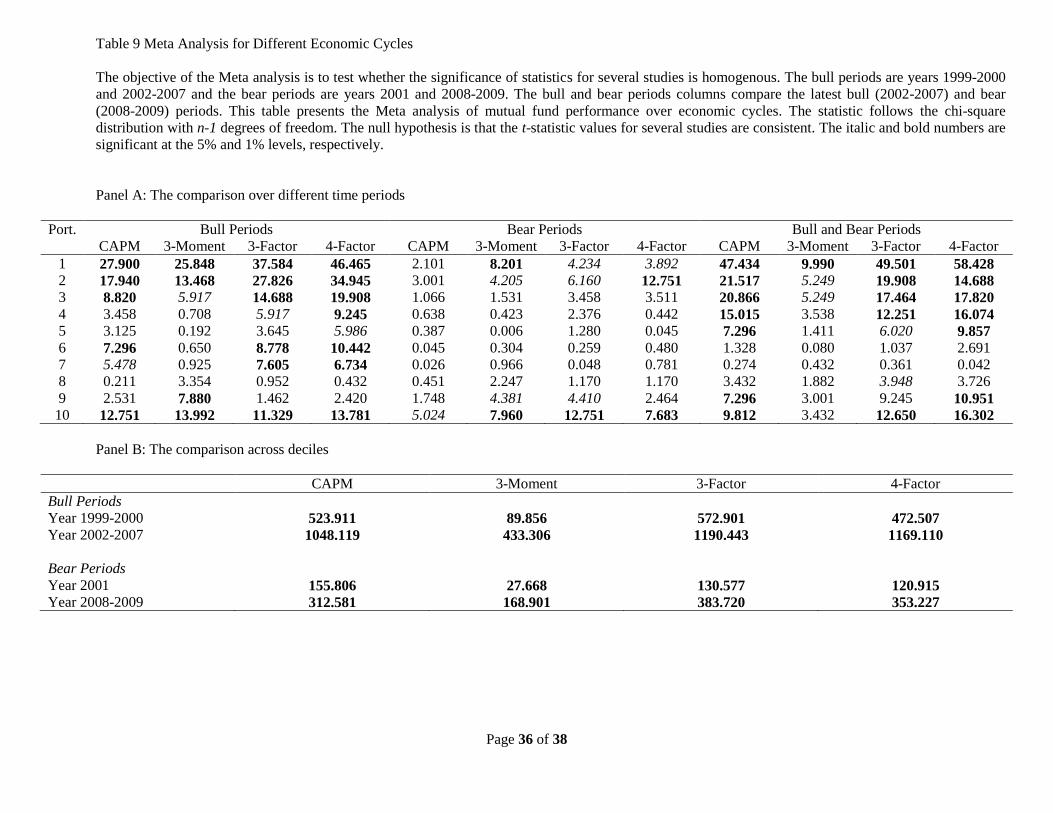
Page 36 of 38
Table 9 Meta Analysis for Different Economic Cycles
The objective of the Meta analysis is to test whether the significance of statistics for several studies is homogenous. The bull periods are years 1999-2000
and 2002-2007 and the bear periods are years 2001 and 2008-2009. The bull and bear periods columns compare the latest bull (2002-2007) and bear
(2008-2009) periods. This table presents the Meta analysis of mutual fund performance over economic cycles. The statistic follows the chi-square
distribution with n-1 degrees of freedom. The null hypothesis is that the t-statistic values for several studies are consistent. The italic and bold numbers are
significant at the 5% and 1% levels, respectively.
Panel A: The comparison over different time periods
Port. Bull Periods Bear Periods Bull and Bear Periods
CAPM 3-Moment 3-Factor 4-Factor CAPM 3-Moment 3-Factor 4-Factor CAPM 3-Moment 3-Factor 4-Factor
1 27.900 25.848 37.584 46.465 2.101 8.201 4.234 3.892 47.434 9.990 49.501 58.428
2 17.940 13.468 27.826 34.945 3.001 4.205 6.160 12.751 21.517 5.249 19.908 14.688
3 8.820 5.917 14.688 19.908 1.066 1.531 3.458 3.511 20.866 5.249 17.464 17.820
4 3.458 0.708 5.917 9.245 0.638 0.423 2.376 0.442 15.015 3.538 12.251 16.074
5 3.125 0.192 3.645 5.986 0.387 0.006 1.280 0.045 7.296 1.411 6.020 9.857
6 7.296 0.650 8.778 10.442 0.045 0.304 0.259 0.480 1.328 0.080 1.037 2.691
7 5.478 0.925 7.605 6.734 0.026 0.966 0.048 0.781 0.274 0.432 0.361 0.042
8 0.211 3.354 0.952 0.432 0.451 2.247 1.170 1.170 3.432 1.882 3.948 3.726
9 2.531 7.880 1.462 2.420 1.748 4.381 4.410 2.464 7.296 3.001 9.245 10.951
10 12.751 13.992 11.329 13.781 5.024 7.960 12.751 7.683 9.812 3.432 12.650 16.302
Panel B: The comparison across deciles
CAPM 3-Moment 3-Factor 4-Factor
Bull Periods
Year 1999-2000 523.911 89.856 572.901 472.507
Year 2002-2007 1048.119 433.306 1190.443 1169.110
Bear Periods
Year 2001 155.806 27.668 130.577 120.915
Year 2008-2009 312.581 168.901 383.720 353.227

Page 37 of 38
Table 10 Meta Analysis for Different Fund Objectives
This table presents the Meta analysis of mutual fund performance by fund objectives. The statistic follows the chi-square distribution with n-1 degrees of
freedom. The null hypothesis is that the t-statistic values for several studies are consistent. The italic and bold numbers are significant at the 5% and 1%
levels, respectively.
Panel A: Market Capitalization Across Objectives
Port. Large-Cap Medium-Cap Small-Cap
CAPM 3-Moment 3-Factor 4-Factor CAPM 3-Moment 3-Factor 4-Factor CAPM 3-Moment 3-Factor 4-Factor
1 33.801 26.524 20.988 20.995 13.891 11.793 14.362 16.672 0.861 1.961 5.659 4.740
2 25.261 18.468 7.738 7.046 1.012 1.153 2.177 1.871 1.675 3.457 3.060 2.437
3 13.080 11.386 2.264 1.893 0.171 1.695 0.964 0.583 1.543 3.463 2.448 2.062
4 7.348 7.560 0.615 0.483 0.480 3.022 0.426 0.192 1.395 3.202 1.422 1.385
5 4.277 5.503 0.319 0.259 1.143 3.815 0.678 0.577 1.186 2.793 0.785 0.792
6 2.049 3.627 0.352 0.300 1.852 4.498 0.641 0.666 0.969 2.437 0.396 0.460
7 0.773 2.252 0.474 0.430 2.650 5.239 0.819 0.910 0.881 2.287 0.093 0.226
8 0.055 1.037 0.406 0.374 3.022 5.207 0.927 0.929 0.901 2.137 0.177 0.256
9 0.447 0.392 0.070 0.088 3.038 4.630 0.955 0.875 0.999 1.968 0.412 0.602
10 3.512 1.389 0.238 0.263 3.623 4.369 1.667 2.245 1.118 2.002 1.189 2.428
Panel B: The Comparison Across Deciles
CAPM 3-Moment 3-Factor 4-Factor
Large-Cap
Core 743.721 410.615 885.711 892.907
Growth 435.523 241.723 619.167 626.069
Value 306.730 163.055 692.613 718.352
Medium-Cap
Core 459.282 260.245 678.720 714.704
Growth 326.015 193.429 585.927 608.146
Value 359.958 203.433 671.688 686.762
Small-Cap 331.617 190.660 897.955 900.352
Core
Growth 274.700 161.745 743.131 786.841
Value 289.640 154.024 878.423 929.419

Page 38 of 38
Panel C: Objectives Across Market Capitalizations
Port. Core Growth Value
CAPM 3-Moment 3-Factor 4-Factor CAPM 3-Moment 3-Factor 4-Factor CAPM 3-Moment 3-Factor 4-Factor
1 35.137 31.350 16.901 16.471 2.107 1.505 0.144 0.115 8.439 6.412 35.458 35.264
2 33.480 27.805 12.472 10.579 12.792 11.064 5.684 6.030 3.032 3.857 0.820 1.114
3 21.321 21.138 9.499 8.011 10.934 10.741 4.975 5.301 2.731 4.381 0.513 0.755
4 15.740 17.891 7.722 6.615 8.849 9.711 3.935 4.304 2.699 5.152 0.941 1.197
5 13.170 17.045 8.005 7.284 6.407 8.170 2.559 2.644 2.650 5.322 1.471 1.630
6 10.465 15.268 7.019 6.768 3.864 6.000 1.445 1.474 3.110 5.830 2.520 2.587
7 8.246 13.047 6.023 6.195 2.002 4.051 0.921 1.013 3.932 6.427 3.655 3.702
8 4.989 9.193 4.925 5.078 0.700 2.327 0.852 1.162 4.674 6.610 4.495 4.664
9 1.846 4.487 2.616 2.618 0.250 1.249 0.756 1.191 4.961 6.715 3.903 3.974
10 1.478 0.408 0.938 0.721 0.229 0.355 0.589 0.832 4.556 5.575 3.247 4.031