Mutual Fund Review November 19, 2009 | Mutual Fund Mutual Fund Review October 21, 2016

Welcome message from author
This document is posted to help you gain knowledge. Please leave a comment to let me know what you think about it! Share it to your friends and learn new things together.
Transcript

Mutual FundReview
October 20 2009 | Mutual Fund October 20 2009 | Mutual Fund October 20 2009 | Mutual Fund
November 19, 2009 | Mutual Fund Mutual Fund Review
October 21, 2016

ICICI Securities Ltd. | Retail MF Research
Note: Whenever, returns for the scheme are shown in the report, they are for the growth option of the scheme.
Mutual Fund Review
Equity Markets ....................................................................................... 2 Debt Markets.......................................................................................... 2 MF industry synopsis ............................................................................ 3 MF Category Analysis............................................................................ 5 Equity funds......................................................................................... 5 Equity diversified funds....................................................................... 6 Equity Infrastructure fund.................................................................... 7 Equity Banking Funds.......................................................................... 8 Equity FMCG........................................................................................ 8 Equity Pharma Funds .......................................................................... 9 Equity Technology Funds.................................................................... 9
Exchange Traded Funds (ETF) ....................................................... 10
Balanced funds ............................................................................... 11
Monthly Income Plans (MIP) .......................................................... 11
Arbitrage Funds .............................................................................. 12
Debt funds ...................................................................................... 13 Liquid Funds ...................................................................................... 14 Income funds..................................................................................... 15 Gilt Funds ........................................................................................ 16 Gold ETFs: Medium term outlook benign............Error! Bookmark not
defined. Model Portfolios .................................................................................. 19
Equity funds model portfolio.......................................................... 19 Debt funds model portfolio ............................................................ 20
Top Picks.............................................................................................. 21
October 21, 2016
ICICI Securities Ltd. | Retail MF Research
Page 2
Equity Markets Update
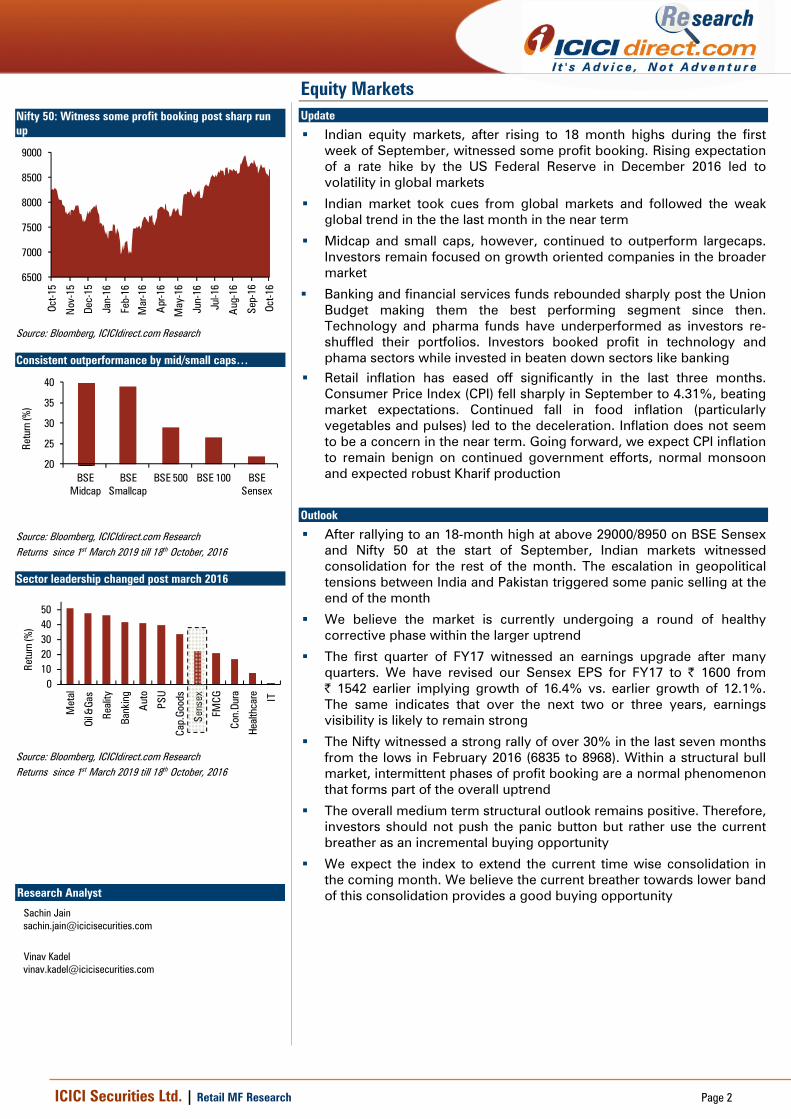
Indian equity markets, after rising to 18 month highs during the first week of September, witnessed some profit booking. Rising expectation of a rate hike by the US Federal Reserve in December 2016 led to volatility in global markets
Indian market took cues from global markets and followed the weak global trend in the the last month in the near term
Midcap and small caps, however, continued to outperform largecaps. Investors remain focused on growth oriented companies in the broader market
Banking and financial services funds rebounded sharply post the Union Budget making them the best performing segment since then. Technology and pharma funds have underperformed as investors re-shuffled their portfolios. Investors booked profit in technology and phama sectors while invested in beaten down sectors like banking
Retail inflation has eased off significantly in the last three months. Consumer Price Index (CPI) fell sharply in September to 4.31%, beating market expectations. Continued fall in food inflation (particularly vegetables and pulses) led to the deceleration. Inflation does not seem to be a concern in the near term. Going forward, we expect CPI inflation to remain benign on continued government efforts, normal monsoon and expected robust Kharif production
Outlook
After rallying to an 18-month high at above 29000/8950 on BSE Sensex and Nifty 50 at the start of September, Indian markets witnessed consolidation for the rest of the month. The escalation in geopolitical tensions between India and Pakistan triggered some panic selling at the end of the month
We believe the market is currently undergoing a round of healthy corrective phase within the larger uptrend
The first quarter of FY17 witnessed an earnings upgrade after many quarters. We have revised our Sensex EPS for FY17 to | 1600 from | 1542 earlier implying growth of 16.4% vs. earlier growth of 12.1%. The same indicates that over the next two or three years, earnings visibility is likely to remain strong
The Nifty witnessed a strong rally of over 30% in the last seven months from the lows in February 2016 (6835 to 8968). Within a structural bull market, intermittent phases of profit booking are a normal phenomenon that forms part of the overall uptrend
The overall medium term structural outlook remains positive. Therefore, investors should not push the panic button but rather use the current breather as an incremental buying opportunity
We expect the index to extend the current time wise consolidation in the coming month. We believe the current breather towards lower band of this consolidation provides a good buying opportunity
Nifty 50: Witness some profit booking post sharp run up
6500
7000
7500
8000
8500
9000
Oct-1
5
Nov
-15
Dec-
15
Jan-
16
Feb-
16
Mar
-16
Apr
-16
May
-16
Jun-
16
Jul-1
6
Aug
-16
Sep-
16
Oct-1
6
Source: Bloomberg, ICICIdirect.com Research
Consistent outperformance by mid/small caps…
20
25
30
35
40
BSE Midcap
BSE Smallcap
BSE 500 BSE 100 BSE Sensex
Retu
rn (%
)
Source: Bloomberg, ICICIdirect.com Research Returns since 1st March 2019 till 18th October, 2016
Sector leadership changed post march 2016
01020304050
Met
al
Oil &
Gas
Real
ity
Bank
ing
Aut
o
PSU
Cap.
Good
s
Sens
ex
FMCG
Con.
Dura
Heal
thca
re IT
Retu
rn (%
)
Source: Bloomberg, ICICIdirect.com Research Returns since 1st March 2019 till 18th October, 2016
Research Analyst
Sachin Jain [email protected]
Vinav Kadel [email protected]
ICICI Securities Ltd. | Retail MF Research
Page 3
Debt Markets Update
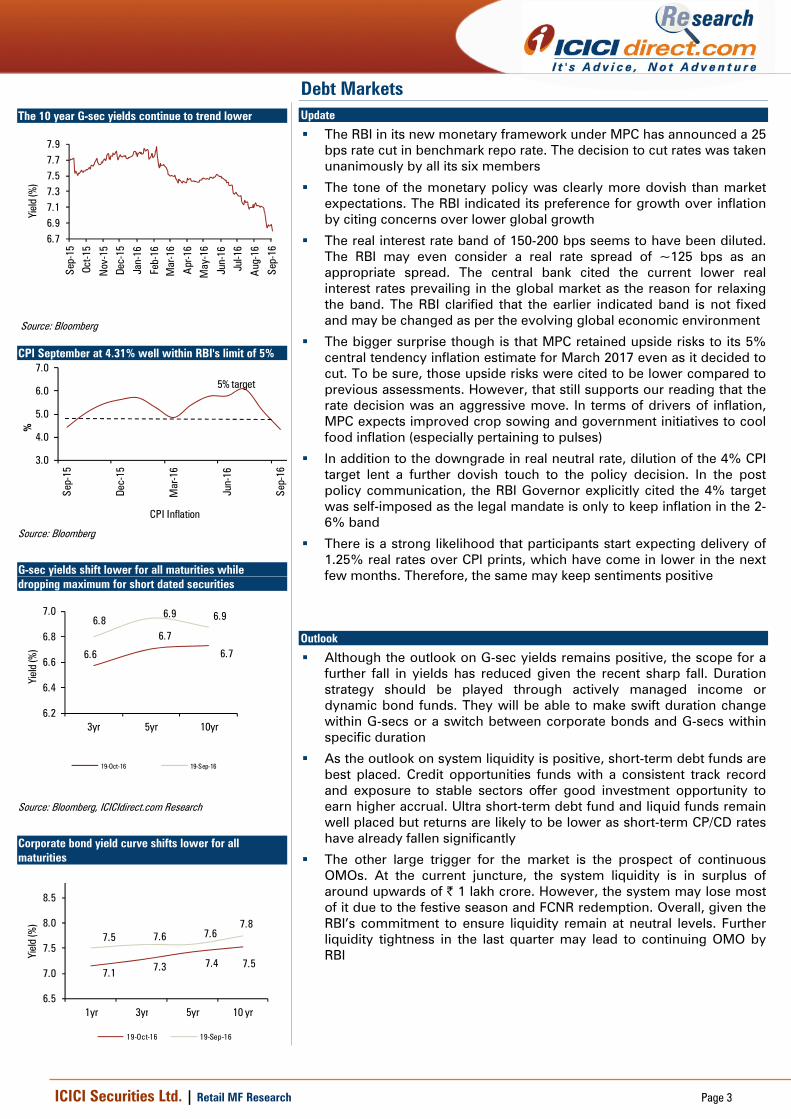
The RBI in its new monetary framework under MPC has announced a 25 bps rate cut in benchmark repo rate. The decision to cut rates was taken unanimously by all its six members
The tone of the monetary policy was clearly more dovish than market expectations. The RBI indicated its preference for growth over inflation by citing concerns over lower global growth
The real interest rate band of 150-200 bps seems to have been diluted. The RBI may even consider a real rate spread of ~125 bps as an appropriate spread. The central bank cited the current lower real interest rates prevailing in the global market as the reason for relaxing the band. The RBI clarified that the earlier indicated band is not fixed and may be changed as per the evolving global economic environment
The bigger surprise though is that MPC retained upside risks to its 5% central tendency inflation estimate for March 2017 even as it decided to cut. To be sure, those upside risks were cited to be lower compared to previous assessments. However, that still supports our reading that the rate decision was an aggressive move. In terms of drivers of inflation, MPC expects improved crop sowing and government initiatives to cool food inflation (especially pertaining to pulses)
In addition to the downgrade in real neutral rate, dilution of the 4% CPI target lent a further dovish touch to the policy decision. In the post policy communication, the RBI Governor explicitly cited the 4% target was self-imposed as the legal mandate is only to keep inflation in the 2-6% band
There is a strong likelihood that participants start expecting delivery of 1.25% real rates over CPI prints, which have come in lower in the next few months. Therefore, the same may keep sentiments positive
Outlook
Although the outlook on G-sec yields remains positive, the scope for a further fall in yields has reduced given the recent sharp fall. Duration strategy should be played through actively managed income or dynamic bond funds. They will be able to make swift duration change within G-secs or a switch between corporate bonds and G-secs within specific duration
As the outlook on system liquidity is positive, short-term debt funds are best placed. Credit opportunities funds with a consistent track record and exposure to stable sectors offer good investment opportunity to earn higher accrual. Ultra short-term debt fund and liquid funds remain well placed but returns are likely to be lower as short-term CP/CD rates have already fallen significantly
The other large trigger for the market is the prospect of continuous OMOs. At the current juncture, the system liquidity is in surplus of around upwards of | 1 lakh crore. However, the system may lose most of it due to the festive season and FCNR redemption. Overall, given the RBI’s commitment to ensure liquidity remain at neutral levels. Further liquidity tightness in the last quarter may lead to continuing OMO by RBI
The 10 year G-sec yields continue to trend lower
6.76.97.17.37.57.77.9
Sep-
15
Oct-1
5
Nov
-15
Dec-
15
Jan-
16
Feb-
16M
ar-1
6
Apr
-16
May
-16
Jun-
16
Jul-1
6
Aug
-16
Sep-
16
Yiel
d (%
)
Source: Bloomberg
CPI September at 4.31% well within RBI's limit of 5%
3.0
4.0
5.0
6.0
7.0
Sep-
15
Dec-
15
Mar
-16
Jun-
16
Sep-
16
%
CPI Inflation
5% target
Source: Bloomberg
G-sec yields shift lower for all maturities while dropping maximum for short dated securities
6.6
6.7
6.7
6.86.9 6.9
6.2
6.4
6.6
6.8
7.0
3yr 5yr 10yr
Yiel
d (%
)
19-Oct-16 19-Sep-16
Source: Bloomberg, ICICIdirect.com Research
Corporate bond yield curve shifts lower for all maturities
7.1 7.3 7.4 7.5
7.5 7.6 7.67.8
6.5
7.0
7.5
8.0
8.5
1yr 3yr 5yr 10 yr
Yiel
d (%
)
19-Oct-16 19-Sep-16
ICICI Securities Ltd. | Retail MF Research
Page 4
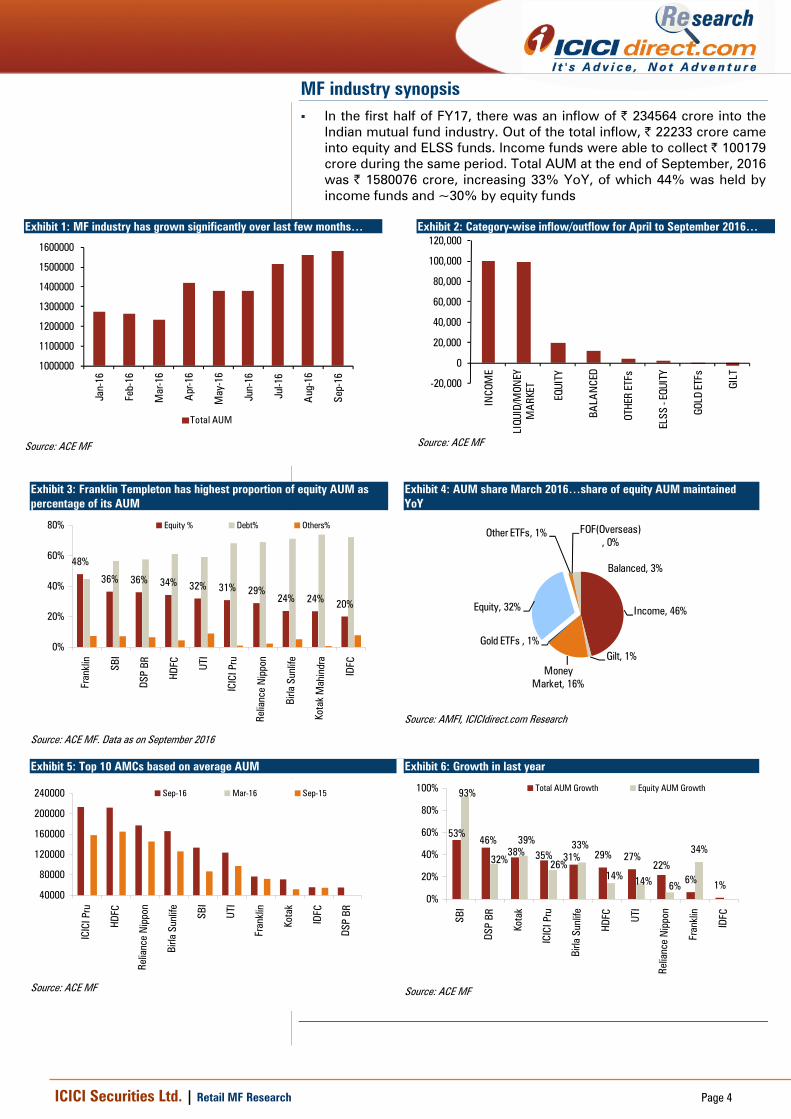
MF industry synopsis In the first half of FY17, there was an inflow of | 234564 crore into the
Indian mutual fund industry. Out of the total inflow, | 22233 crore came into equity and ELSS funds. Income funds were able to collect | 100179 crore during the same period. Total AUM at the end of September, 2016 was | 1580076 crore, increasing 33% YoY, of which 44% was held by income funds and ~30% by equity funds
Exhibit 1: MF industry has grown significantly over last few months…
1000000
1100000
1200000
1300000
1400000
1500000
1600000
Jan-
16
Feb-
16
Mar
-16
Apr
-16
May
-16
Jun-
16
Jul-1
6
Aug
-16
Sep-
16
Total AUM
Source: ACE MF
Exhibit 2: Category-wise inflow/outflow for April to September 2016…
-20,000
0
20,000
40,000
60,000
80,000
100,000
120,000
INCO
ME
LIQU
ID/M
ONEY
M
ARK
ET
EQUI
TY
BALA
NCE
D
OTHE
R ET
Fs
ELSS
-EQ
UITY
GOLD
ETF
s
GILT
Source: ACE MF
Exhibit 3: Franklin Templeton has highest proportion of equity AUM as percentage of its AUM
48%
36% 36% 34% 32% 31% 29%24% 24% 20%
0%
20%
40%
60%
80%
Fran
klin
SBI
DSP
BR
HDFC
UTI
ICIC
I Pru
Relia
nce
Nip
p on
Birla
Sun
life
Kot a
k M
a hin
dra
IDFC
Equity % Debt% Others%
Source: ACE MF. Data as on September 2016
Exhibit 4: AUM share March 2016…share of equity AUM maintained YoY
Income, 46%
Gilt, 1%Money
Market, 16%
Gold ETFs , 1%
Equity, 32%
Other ETFs, 1% FOF(Overseas), 0%
Balanced, 3%
Source: AMFI, ICICIdirect.com Research
Exhibit 5: Top 10 AMCs based on average AUM
40000
80000
120000
160000
200000
240000
ICIC
I Pru
HDFC
Relia
nce
Nip
pon
Birla
Sun
life
SBI
UTI
Fran
klin
Kota
k
IDF C
DSP
BR
Sep-16 Mar-16 Sep-15
Source: ACE MF
Exhibit 6: Growth in last year
29% 27%
6% 1%
34%38% 31%
53%46%
35%22%
14%14%
33%
93%
32%
39%
26%
6%0%
20%
40%
60%
80%
100%
SBI
DSP
BR
Kot a
k
ICIC
I Pru
Birla
Sun
life
HDFC UT
I
Relia
nce
Nip
pon
Fran
k lin
IDFC
Total AUM Growth Equity AUM Growth
Source: ACE MF
ICICI Securities Ltd. | Retail MF Research
Page 5
MF Category Analysis
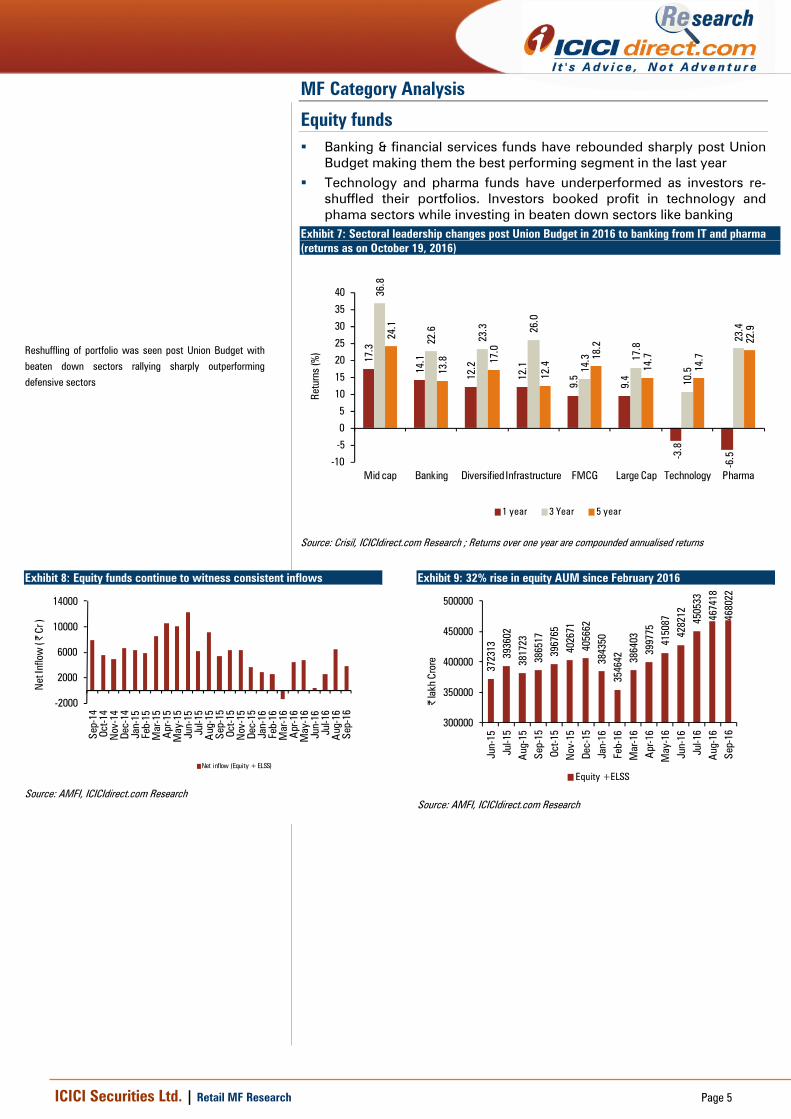
Equity funds Banking & financial services funds have rebounded sharply post Union
Budget making them the best performing segment in the last year Technology and pharma funds have underperformed as investors re-
shuffled their portfolios. Investors booked profit in technology and phama sectors while investing in beaten down sectors like banking
Exhibit 7: Sectoral leadership changes post Union Budget in 2016 to banking from IT and pharma (returns as on October 19, 2016)
17.3
14.1
12.2
12.1
9.5
9.4
-3.8
-6.5
36.8
22.6
23.3 26
.0
14.3 17
.8
10.5
23.4
24.1
13.8 17
.0
12.4
18.2
14.7
14.7
22.9
-10
-5
0
5
10
15
20
25
30
35
40
Mid cap Banking Diversified Infrastructure FMCG Large Cap Technology Pharma
Retu
rns
(%)
1 year 3 Year 5 year
Source: Crisil, ICICIdirect.com Research ; Returns over one year are compounded annualised returns
Exhibit 8: Equity funds continue to witness consistent inflows
-2000
2000
6000
10000
14000
Sep-
14Oc
t-14
Nov
-14
Dec-
14Ja
n-15
Feb-
15M
ar-1
5A
pr-1
5M
ay-1
5Ju
n-15
Jul-1
5A
ug-1
5Se
p-15
Oct-1
5N
ov-1
5De
c-15
Jan-
16Fe
b-16
Mar
-16
Apr
-16
May
-16
Jun-
16Ju
l-16
Aug
-16
Sep-
16
Net
Inflo
w (
| Cr
)
Net inflow (Equity + ELSS)
Source: AMFI, ICICIdirect.com Research
Exhibit 9: 32% rise in equity AUM since February 2016
3723
1339
3602
3817
2338
6517
3967
6540
2671
4056
6238
4350
3546
42 3864
0339
9775
4150
8742
8212 4505
3346
7418
4680
22300000
350000
400000
450000
500000
Jun-
15Ju
l-15
Aug
-15
Sep-
15Oc
t-15
Nov
-15
Dec-
15Ja
n-16
Feb-
16M
ar-1
6A
pr-1
6M
ay-1
6Ju
n-16
Jul-1
6A
ug-1
6Se
p-16
| la
kh C
rore
Equity +ELSS
Source: AMFI, ICICIdirect.com Research
Reshuffling of portfolio was seen post Union Budget with
beaten down sectors rallying sharply outperforming
defensive sectors
ICICI Securities Ltd. | Retail MF Research
Page 6
Equity diversified funds
Equity markets overall witnessed some profit booking since the start of September. Weak global markets amid concerns over a rate hike by the US Federal Reserve and rise in led to increased volatility
Mutual funds clearly outperformed the benchmark indices. All diversified funds delivered 12% (category average) return in the last year. Midcap funds continue to outperform and delivered around 17% during the same period. Nifty 50 was up 5% during the same period
After witnessing selling pressure since the start of 2016 and correcting around 12% in first two months before the Union Budget, Indian equity markets rebounded sharply post Budget and recouped almost all losses
Beaten down sectors like banking, real estate, capital goods and auto outperformed since Budget in the market recovery. The healthcare sector underperformed on the back of negative regulatory issues resulting into profit booking by many institutional investors
Global markets also seem to have stabilised after a rebound in commodity prices, particularly crude oil. The further economic stimulus measures announced by the European Central Bank (ECB) and improving US economic data provided the much needed sentiment boost for global investors. Importantly, emerging markets witnessed the return of foreign inflows with most emerging markets outperforming in March 2016 on rising expectation that the next hike in US interest rates could be somewhat delayed. The US dollar fell in value against all emerging market currencies indicating the risk on trade
We expect the markets to enter a consolidation phase, going forward, to work off the overbought conditions developed after the strong rally since March. We believe any dips to form a higher bottom in the coming month should be used as an incremental buying opportunity.
Recommended funds Large cap
Birla Sunlife Frontline Equity ICICI Prudential Focused Bluechip Equity SBI Bluechip
Diversified
Franklin India Prima Plus Fund Reliance Equity Opportunities ICICI Prudential Value Discovery Fund
Midcap
HDFC Mid-Cap Opportunities Fund Franklin India Smaller Companies Fund SBI Magnum Global Fund
(Refer to www.icicidirect.com for details of the fund)
View Short term: Positive Long-term: Positive
ICICI Securities Ltd. | Retail MF Research
Page 7
Equity Infrastructure fund The investment cycle, which has been under pressure for the last few
years, has started showing sign of green shoots as the government is focusing on infrastructure development (accounts for ~60% of planned investment vs. ~50% few years back). Furthermore, instances of stalled projects in the government vertical have come down sharply whereas the private sector is still seeing a slow recovery in stalled projects
We have also analysed the pattern of tendering in the last 18 months, which further validates that the government is reviving the investment cycle as the government accounts for ~99% of total tenders floated
In terms of segments, road, railways, water and power T&D led the recovery, which may continue, going ahead, into FY17E as well. Out of total tenders floated during FY16, the share of the above segments comprised ~64.9% of the overall tendering activity
Going ahead, while we believe there would be opportunities in infrastructure, we remain selectively positive on the sector
Preferred Picks
Franklin Build India Fund L&T Infrastructure Fund ICICI Prudential Infrastructure Fund
Refer www.icicidirect.com for
details of the fund
View Short-term: Positive Long-term: Positive
ICICI Securities Ltd. | Retail MF Research
Page 8
Equity Banking Funds Banking funds, after having underperformed in 2015 till February 2016
have bounced back post Budget, delivering returns of ~50% (category average) in that period. During the same period, Sensex was up 21%.
FY16 has been a tough year for banks with steep rise in impaired assets seen owing to asset quality review (AQR) done by the RBI, which led to significant addition to NPAs, SDR and 5/25 cases resulting from troubled corporate in infra, metals, textile and power. Q1FY17 saw some moderation in slippages on a sequential basis.
PSU banks saw 100% YoY surge in GNPA to | 565042 crore, leading to a decline in provision on a sequential basis at | 41571 crore. PSBs have reported losses in 2HFY16, after several losses, owing to higher slippages led by AQR. The trajectory continued in Q1FY17 with loss at | 473 crore, way below the level seen in previous quarters. With regard to asset quality ahead, credit cost is seen to remain elevated owing to anticipated slippages from the watch list coupled with ageing of existing stressed assets and MTM hit on SDR. However, some moderation in slippages compared to the surge seen in H2FY16 cannot be ruled out. Consequently, we remain cautious on PSU banks for the next two quarters
On the other hand, though private banks fared well compared to PSBs, they were unable to escape the consequence with reported GNPA increasing 67.6% YoY to | 58331 crore. Despite higher credit cost, private banks reported a profit of | 9952 crore in Q1FY17, up 2.6% YoY. Healthy topline growth enabled a better performance in private banks. Corporate exposure in pain sectors of large private banks will hurt them warranting higher provisions. However, better capital position will safeguard near term balance sheet as well as P/L concerns on RoE and RoA. We expect private banks to continue to outperform but sticking to quality large caps is recommended
We continue to maintain our underperform stance on the sector Preferred Picks
ICICI Prudential Banking & Financial Services Reliance Banking Fund UTI Thematic - Banking Sector Fund
Refer to www.icicidirect.com for
details of the fund
Equity FMCG FMCG funds have delivered good performance post the budget 2016,
generating ~24% returns (category average) outperforming the broader market which had returned ~21%
With India receiving “normal monsoon” resulting in wider area under cultivation and high reservoirs levels which is highly positive for agriculture sector and allied activities in rural market
With higher budgetary allocation of ~| 87700 crore towards overall rural development would aid rural volume growth though revival in urban discretionary demand remains slow. However, sales growth is likely to remain ~12% with stable realisation growth.
Operating margins for FMCG companies would remain at an elevated levels as increase in RM cost from its lows could be set off by lowering of marketing spend
Implementation of GST would benefit companies present in highly unorganised categories like biscuits, hair oils, branded foods
Preferred Picks
ICICI Prudential FMCG Fund SBI FMCG Fund
Refer www.icicidirect.com
for details of the fund
View Short-term: Negative Long-term: Neutral
View Short-term: Positive Long-term: Positive
ICICI Securities Ltd. | Retail MF Research
Page 9
Equity pharma funds Pharma funds remain underperformer so far in FY16, with category
average returns of ~7% in contrast with Sensex returns of ~21%
We expect pharma universe revenue, EBITDA and PAT to grow at a CAGR of 15.5%, 16.6% and 19.9% respectively, in FY16-18E
After outperforming the broader indices for five fiscals, the Nifty Pharma Index underperformed, thanks to scores of USFDA related cGMP issues which weighed on the sentiments. Paradoxically the fiscal witnessed highest number of USFDA product approvals in the last five years. We expect some spill over effect in the 1st half of FY17 as well.
We continue to maintain our positive view on the sector on the back of earning visibility, consistent operating cash flows, healthy operating margins, relatively low leverage and strong return ratios
Preferred Picks
Reliance Pharma Fund SBI Pharma Fund UTI-Pharma & Healthcare
Refer to www.icicidirect.com
for details of the fund
Equity Technology Funds
Post Budget 2016, IT funds have underperformed the Sensex delivering ~5% returns (category average) against ~21% returns by BSE Sensex
Most Tier-I IT companies reported average 1.8% QoQ dollar revenue growth in Q4FY16 (marginally below our 2.2% growth estimates) vs. 0.5% in Q3FY16 and 1.2% decline in Q4FY15. Constant currency revenues grew 2.2% as dollar growth was negatively impacted (~40-50 bps) by cross currency headwinds. Overall results for the latest quarter were mainly in line with market expectation. Inorganic investments were key margin headwinds partially offset by currency tailwinds and operational efficiency. CY16E IT budget commentary was consistent while FY17E earnings commentary was stable led by healthy deal signings and traction in digital technologies
Operationally, discretionary spending remains healthy in the US while Europe rebounded and led quarterly growth. Insurance, telecom and oil & gas verticals are structurally challenged and growth continues to be uneven
The average rupee has depreciated 6.4% during FY16 and could aid margins leading to earnings upgrade in FY17E. Upsides could be in line with earnings upgrades given blended valuations are at ~16x FY17E earnings. However, sharp sell-offs should be used to accumulate given long-term growth prospects
Preferred Picks
ICICI Prudential Technology Fund DSPBR Technology fund
Refer to www.icicidirect.com for
details of the fund
View Short-term: Neutral Long-term: Neutral
View Short-term: Positive Long-term: Positive
ICICI Securities Ltd. | Retail MF Research
Page 10
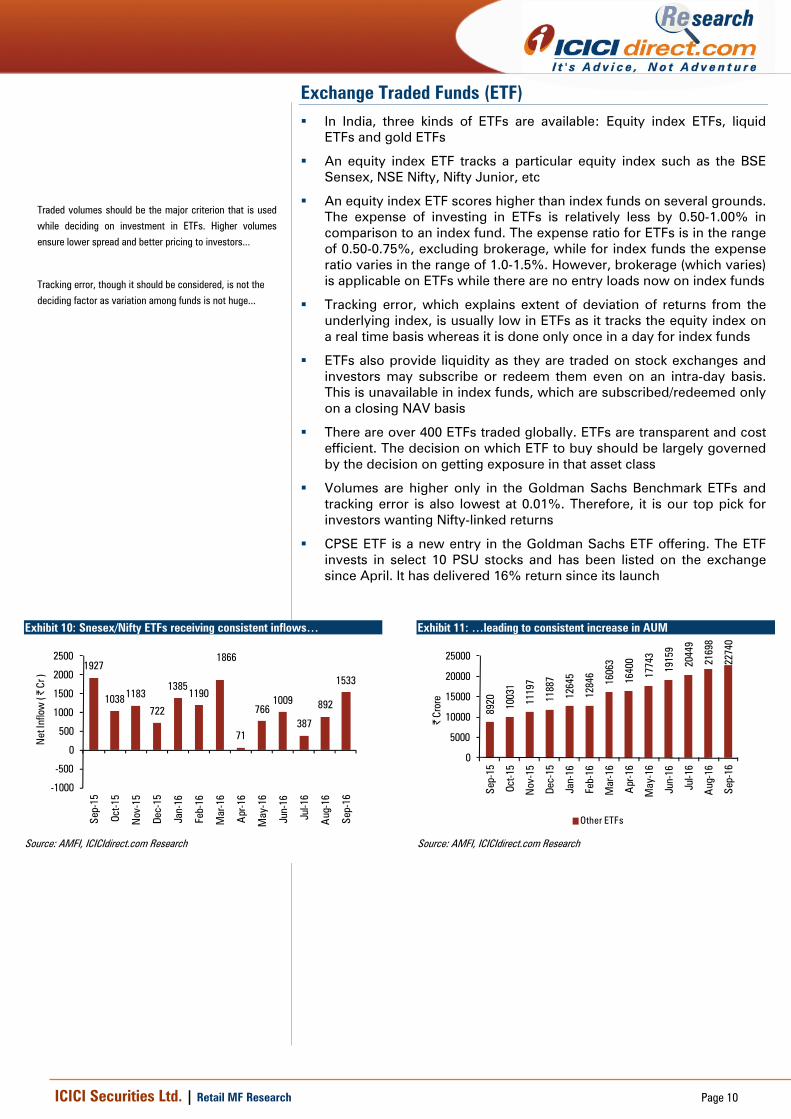
Exchange Traded Funds (ETF) In India, three kinds of ETFs are available: Equity index ETFs, liquid
ETFs and gold ETFs
An equity index ETF tracks a particular equity index such as the BSE Sensex, NSE Nifty, Nifty Junior, etc
An equity index ETF scores higher than index funds on several grounds. The expense of investing in ETFs is relatively less by 0.50-1.00% in comparison to an index fund. The expense ratio for ETFs is in the range of 0.50-0.75%, excluding brokerage, while for index funds the expense ratio varies in the range of 1.0-1.5%. However, brokerage (which varies) is applicable on ETFs while there are no entry loads now on index funds
Tracking error, which explains extent of deviation of returns from the underlying index, is usually low in ETFs as it tracks the equity index on a real time basis whereas it is done only once in a day for index funds
ETFs also provide liquidity as they are traded on stock exchanges and investors may subscribe or redeem them even on an intra-day basis. This is unavailable in index funds, which are subscribed/redeemed only on a closing NAV basis
There are over 400 ETFs traded globally. ETFs are transparent and cost efficient. The decision on which ETF to buy should be largely governed by the decision on getting exposure in that asset class
Volumes are higher only in the Goldman Sachs Benchmark ETFs and tracking error is also lowest at 0.01%. Therefore, it is our top pick for investors wanting Nifty-linked returns
CPSE ETF is a new entry in the Goldman Sachs ETF offering. The ETF invests in select 10 PSU stocks and has been listed on the exchange since April. It has delivered 16% return since its launch
Exhibit 10: Snesex/Nifty ETFs receiving consistent inflows…
1927
10381183
722
13851190
1866
71
7661009
387
892
1533
-1000
-500
0
500
1000
1500
2000
2500
Sep-
15
Oct-1
5
Nov
-15
Dec-
15
Jan-
16
Feb-
16
Mar
-16
Apr
-16
May
-16
Jun-
16
Jul-1
6
Aug
-16
Sep-
16
Net
Inflo
w (
| Cr
)
Source: AMFI, ICICIdirect.com Research
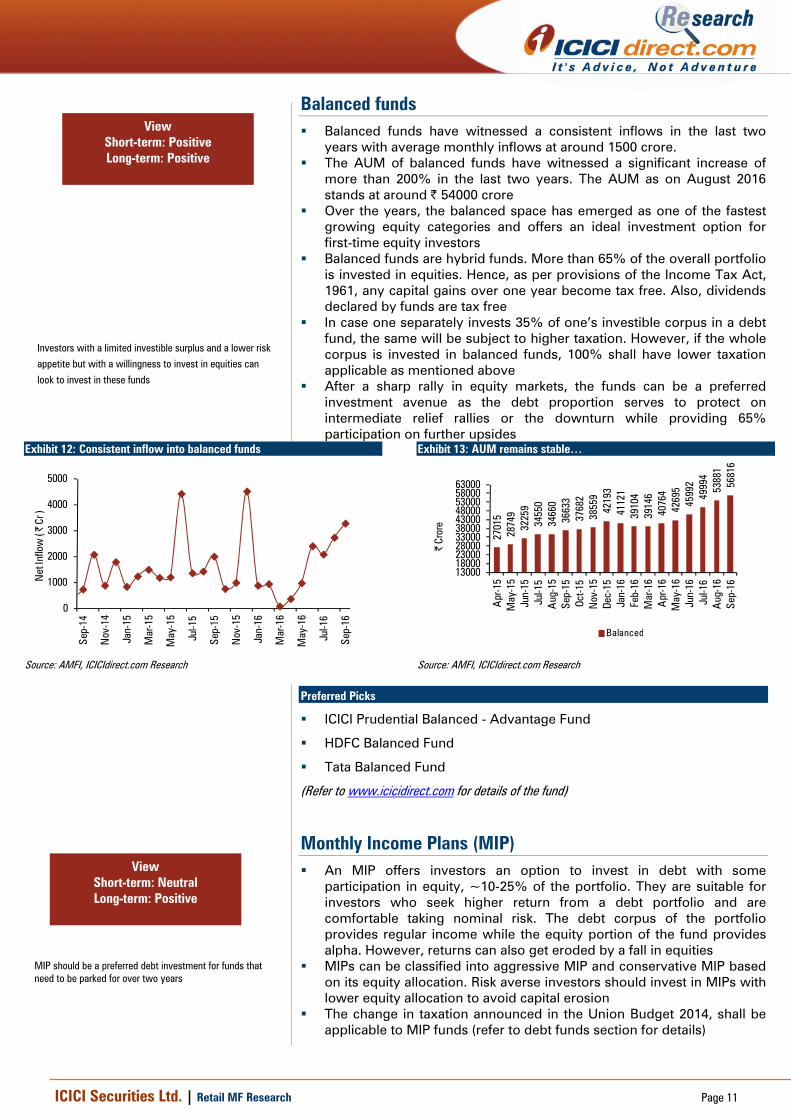
Exhibit 11: …leading to consistent increase in AUM
8920 1003
1
1119
7
1188
7
1264
5
1284
6
1606
3
1640
0
1774
3
1915
9
2044
9
2169
8
2274
0
0
5000
10000
15000
20000
25000
Sep-
15
Oct-1
5
Nov
-15
Dec-
15
Jan-
16
Feb-
16
Mar
-16
Apr
-16
May
-16
Jun-
16
Jul-1
6
Aug
-16
Sep-
16
| Cr
ore
Other ETFs
Source: AMFI, ICICIdirect.com Research
Traded volumes should be the major criterion that is used
while deciding on investment in ETFs. Higher volumes
ensure lower spread and better pricing to investors...
Tracking error, though it should be considered, is not the
deciding factor as variation among funds is not huge...
ICICI Securities Ltd. | Retail MF Research
Page 11
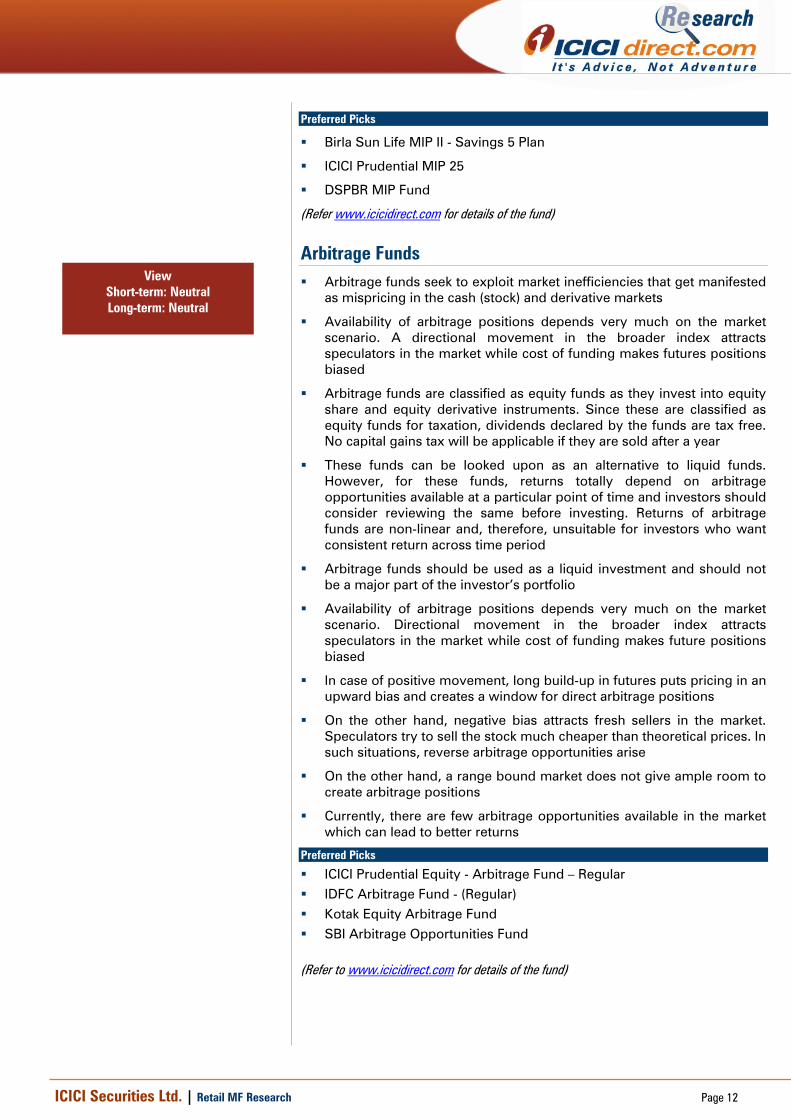
Balanced funds Balanced funds have witnessed a consistent inflows in the last two
years with average monthly inflows at around 1500 crore. The AUM of balanced funds have witnessed a significant increase of
more than 200% in the last two years. The AUM as on August 2016 stands at around | 54000 crore
Over the years, the balanced space has emerged as one of the fastest growing equity categories and offers an ideal investment option for first-time equity investors
Balanced funds are hybrid funds. More than 65% of the overall portfolio is invested in equities. Hence, as per provisions of the Income Tax Act, 1961, any capital gains over one year become tax free. Also, dividends declared by funds are tax free
In case one separately invests 35% of one’s investible corpus in a debt fund, the same will be subject to higher taxation. However, if the whole corpus is invested in balanced funds, 100% shall have lower taxation applicable as mentioned above
After a sharp rally in equity markets, the funds can be a preferred investment avenue as the debt proportion serves to protect on intermediate relief rallies or the downturn while providing 65% participation on further upsides
Exhibit 12: Consistent inflow into balanced funds
0
1000
2000
3000
4000
5000
Sep-
14
Nov
-14
Jan-
15
Mar
-15
May
-15
Jul-1
5
Sep-
15
Nov
-15
Jan-
16
Mar
-16
May
-16
Jul-1
6
Sep-
16
Net
Inflo
w (
| Cr
)
Source: AMFI, ICICIdirect.com Research
Exhibit 13: AUM remains stable…
2701
528
749
3225
934
550
3466
036
633
3768
238
559
4219
341
121
3910
439
146
4076
442
695
4599
249
994
5388
156
816
1300018000230002800033000380004300048000530005800063000
Apr
-15
May
-15
Jun-
15Ju
l-15
Aug
-15
Sep-
15Oc
t-15
Nov
-15
Dec-
15Ja
n-16
Feb-
16M
ar-1
6A
pr-1
6M
ay-1
6Ju
n-16
Jul-1
6A
ug-1
6Se
p-16
| Cr
ore
Balanced
Source: AMFI, ICICIdirect.com Research
Preferred Picks
ICICI Prudential Balanced - Advantage Fund
HDFC Balanced Fund
Tata Balanced Fund
(Refer to www.icicidirect.com for details of the fund)
Monthly Income Plans (MIP) An MIP offers investors an option to invest in debt with some
participation in equity, ~10-25% of the portfolio. They are suitable for investors who seek higher return from a debt portfolio and are comfortable taking nominal risk. The debt corpus of the portfolio provides regular income while the equity portion of the fund provides alpha. However, returns can also get eroded by a fall in equities
MIPs can be classified into aggressive MIP and conservative MIP based on its equity allocation. Risk averse investors should invest in MIPs with lower equity allocation to avoid capital erosion
The change in taxation announced in the Union Budget 2014, shall be applicable to MIP funds (refer to debt funds section for details)
Investors with a limited investible surplus and a lower risk
appetite but with a willingness to invest in equities can
look to invest in these funds
View Short-term: Positive Long-term: Positive
View Short-term: Neutral Long-term: Positive
MIP should be a preferred debt investment for funds that need to be parked for over two years
ICICI Securities Ltd. | Retail MF Research
Page 12
Preferred Picks
Birla Sun Life MIP II - Savings 5 Plan
ICICI Prudential MIP 25
DSPBR MIP Fund
(Refer www.icicidirect.com for details of the fund)
Arbitrage Funds Arbitrage funds seek to exploit market inefficiencies that get manifested
as mispricing in the cash (stock) and derivative markets
Availability of arbitrage positions depends very much on the market scenario. A directional movement in the broader index attracts speculators in the market while cost of funding makes futures positions biased
Arbitrage funds are classified as equity funds as they invest into equity share and equity derivative instruments. Since these are classified as equity funds for taxation, dividends declared by the funds are tax free. No capital gains tax will be applicable if they are sold after a year
These funds can be looked upon as an alternative to liquid funds. However, for these funds, returns totally depend on arbitrage opportunities available at a particular point of time and investors should consider reviewing the same before investing. Returns of arbitrage funds are non-linear and, therefore, unsuitable for investors who want consistent return across time period
Arbitrage funds should be used as a liquid investment and should not be a major part of the investor’s portfolio
Availability of arbitrage positions depends very much on the market scenario. Directional movement in the broader index attracts speculators in the market while cost of funding makes future positions biased
In case of positive movement, long build-up in futures puts pricing in an upward bias and creates a window for direct arbitrage positions
On the other hand, negative bias attracts fresh sellers in the market. Speculators try to sell the stock much cheaper than theoretical prices. In such situations, reverse arbitrage opportunities arise
On the other hand, a range bound market does not give ample room to create arbitrage positions
Currently, there are few arbitrage opportunities available in the market which can lead to better returns
Preferred Picks
ICICI Prudential Equity - Arbitrage Fund – Regular IDFC Arbitrage Fund - (Regular) Kotak Equity Arbitrage Fund SBI Arbitrage Opportunities Fund
(Refer to www.icicidirect.com for details of the fund)
View Short-term: Neutral Long-term: Neutral
ICICI Securities Ltd. | Retail MF Research
Page 13
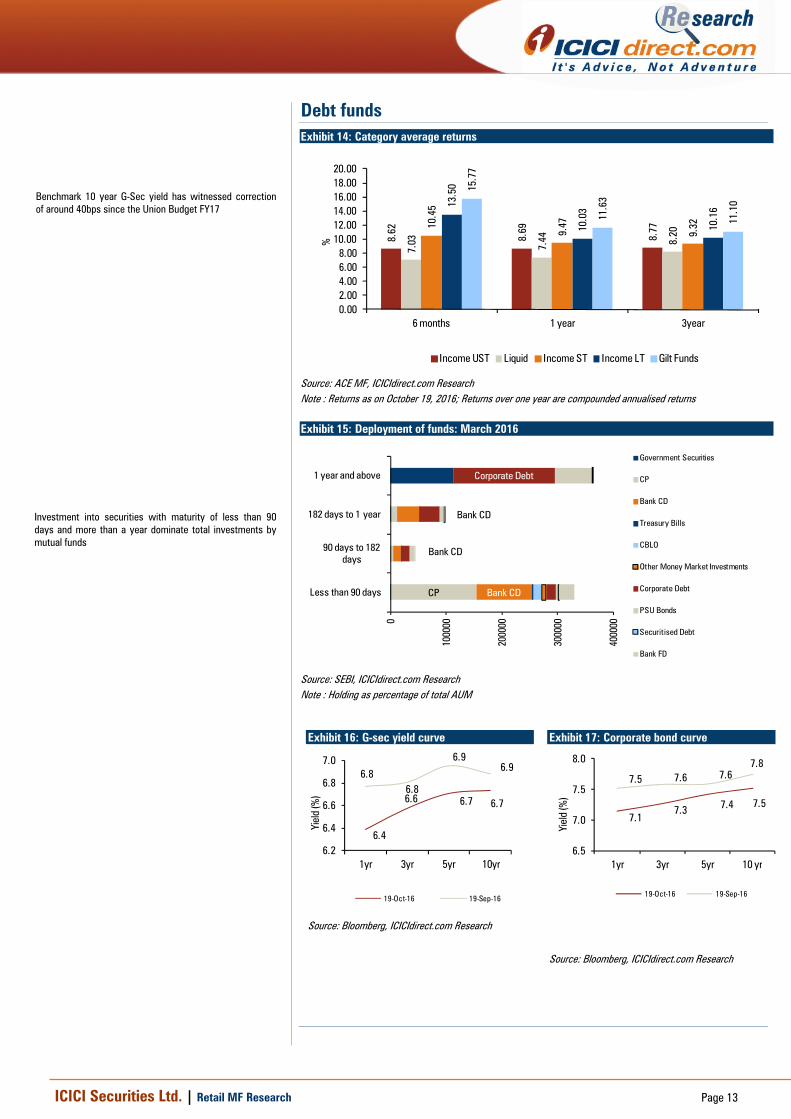
Debt funds Exhibit 14: Category average returns
8.62
8.69
8.77
7.03 7.44 8.
20
10.4
5
9.47
9.32
13.5
0
10.0
3
10.1
6
15.7
7
11.6
3
11.1
0
0.002.004.006.008.00
10.0012.0014.0016.0018.0020.00
6 months 1 year 3year%
Income UST Liquid Income ST Income LT Gilt Funds
Source: ACE MF, ICICIdirect.com Research Note : Returns as on October 19, 2016; Returns over one year are compounded annualised returns
Exhibit 15: Deployment of funds: March 2016
CP Bank CD
Bank CD
Bank CD
Corporate Debt
0
1000
00
2000
00
3000
00
4000
00
Less than 90 days
90 days to 182 days
182 days to 1 year
1 year and above
Government Securities
CP
Bank CD
Treasury Bills
CBLO
Other Money Market Investments
Corporate Debt
PSU Bonds
Securitised Debt
Bank FD
Source: SEBI, ICICIdirect.com Research Note : Holding as percentage of total AUM
Exhibit 16: G-sec yield curve
6.4
6.6 6.7 6.7
6.86.8
6.96.9
6.2
6.4
6.6
6.8
7.0
1yr 3yr 5yr 10yr
Yiel
d (%
)
19-Oct-16 19-Sep-16
Source: Bloomberg, ICICIdirect.com Research
Exhibit 17: Corporate bond curve
7.17.3 7.4 7.5
7.5 7.6 7.67.8
6.5
7.0
7.5
8.0
1yr 3yr 5yr 10 yr
Yiel
d (%
)
19-Oct-16 19-Sep-16
Source: Bloomberg, ICICIdirect.com Research
Benchmark 10 year G-Sec yield has witnessed correction of around 40bps since the Union Budget FY17
Investment into securities with maturity of less than 90 days and more than a year dominate total investments by mutual funds
ICICI Securities Ltd. | Retail MF Research
Page 14
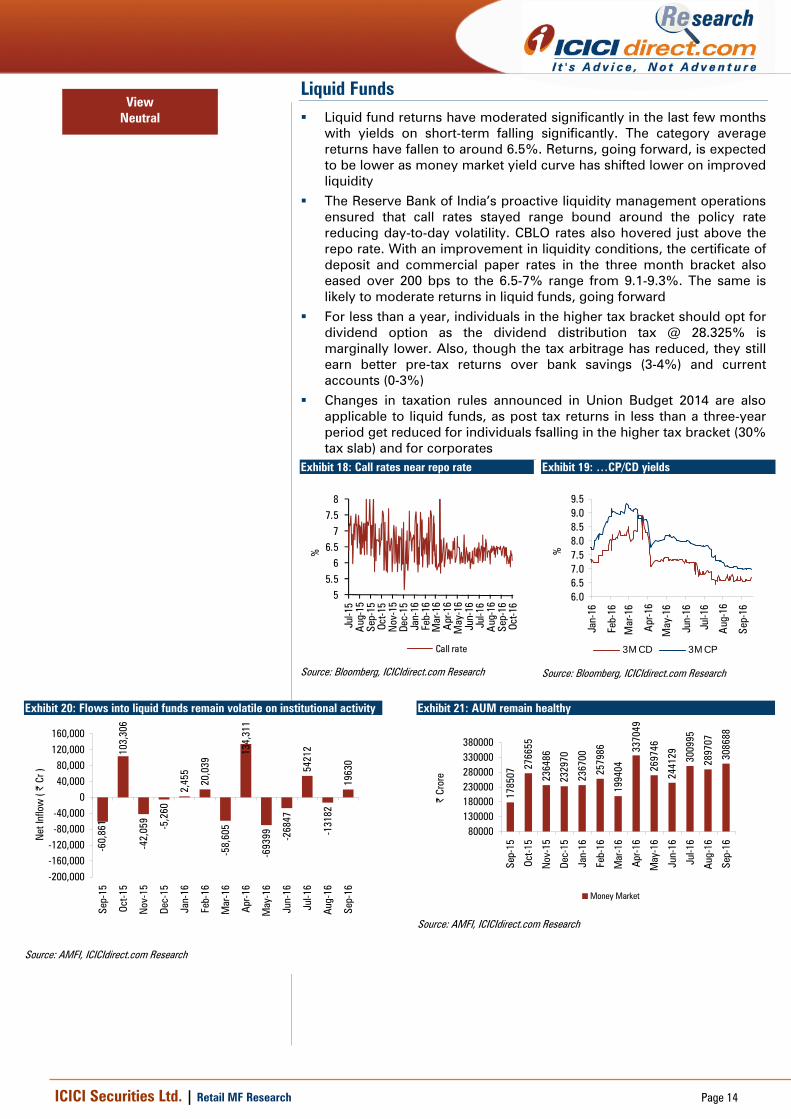
Liquid Funds Liquid fund returns have moderated significantly in the last few months
with yields on short-term falling significantly. The category average returns have fallen to around 6.5%. Returns, going forward, is expected to be lower as money market yield curve has shifted lower on improved liquidity
The Reserve Bank of India’s proactive liquidity management operations ensured that call rates stayed range bound around the policy rate reducing day-to-day volatility. CBLO rates also hovered just above the repo rate. With an improvement in liquidity conditions, the certificate of deposit and commercial paper rates in the three month bracket also eased over 200 bps to the 6.5-7% range from 9.1-9.3%. The same is likely to moderate returns in liquid funds, going forward
For less than a year, individuals in the higher tax bracket should opt for dividend option as the dividend distribution tax @ 28.325% is marginally lower. Also, though the tax arbitrage has reduced, they still earn better pre-tax returns over bank savings (3-4%) and current accounts (0-3%)
Changes in taxation rules announced in Union Budget 2014 are also applicable to liquid funds, as post tax returns in less than a three-year period get reduced for individuals fsalling in the higher tax bracket (30% tax slab) and for corporates
Exhibit 18: Call rates near repo rate
55.5
66.5
77.5
8
Jul-1
5A
ug-1
5Se
p-15
Oct-1
5N
ov-1
5De
c-15
Jan-
16Fe
b-16
Mar
-16
Apr
-16
May
-16
Jun-
16Ju
l-16
Aug
-16
Sep-
16Oc
t-16
%
Call rate
Source: Bloomberg, ICICIdirect.com Research
Exhibit 19: …CP/CD yields
6.06.57.07.58.08.59.09.5
Jan-
16
Feb-
16
Mar
-16
Apr
-16
May
-16
Jun-
16
Jul-1
6
Aug
-16
Sep-
16
%
3M CD 3M CP
Source: Bloomberg, ICICIdirect.com Research
Exhibit 20: Flows into liquid funds remain volatile on institutional activity
103,
306
-5,2
60
2,45
5
20,0
39
-58,
605
134,
311
-693
99 -268
47
5421
2
-131
82
1963
0
-60,
861
-42,
059
-200,000-160,000-120,000-80,000-40,000
040,00080,000
120,000160,000
Sep-
15
Oct-1
5
Nov
-15
Dec-
15
Jan-
16
Feb-
16
Mar
-16
Apr-1
6
May
-16
Jun-
16
Jul-1
6
Aug-
16
Sep-
16
Net
Inflo
w (
| Cr
)
Source: AMFI, ICICIdirect.com Research
Exhibit 21: AUM remain healthy
1785
07
2766
55
2364
86
2329
70
2367
00
2579
86
1994
04
3370
49
2697
46
2441
29 3009
95
2897
07
3086
88
80000130000180000230000280000330000380000
Sep-
15
Oct-1
5
Nov
-15
Dec-
15
Jan-
16
Feb-
16
Mar
-16
Apr-1
6
May
-16
Jun-
16
Jul-1
6
Aug-
16
Sep-
16
| Cr
ore
Money Market
Source: AMFI, ICICIdirect.com Research
View Neutral
ICICI Securities Ltd. | Retail MF Research
Page 15
Preferred Picks
HDFC Cash Management Fund - Savings Plan SBI Magnum InstaCash Reliance Liquid Fund - Treasury Plan
(Refer to www.icicidirect.com for details of the fund)
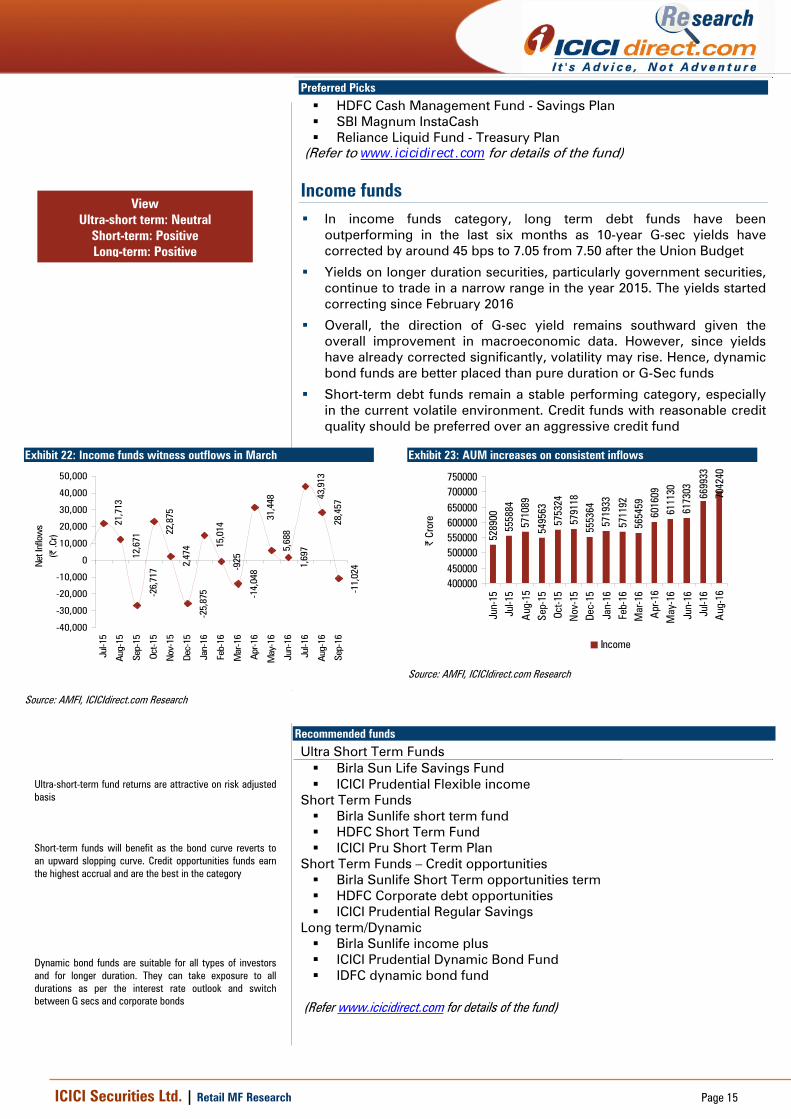
Income funds In income funds category, long term debt funds have been
outperforming in the last six months as 10-year G-sec yields have corrected by around 45 bps to 7.05 from 7.50 after the Union Budget
Yields on longer duration securities, particularly government securities, continue to trade in a narrow range in the year 2015. The yields started correcting since February 2016
Overall, the direction of G-sec yield remains southward given the overall improvement in macroeconomic data. However, since yields have already corrected significantly, volatility may rise. Hence, dynamic bond funds are better placed than pure duration or G-Sec funds
Short-term debt funds remain a stable performing category, especially in the current volatile environment. Credit funds with reasonable credit quality should be preferred over an aggressive credit fund
Exhibit 22: Income funds witness outflows in March
22,8
75
2,47
4
-25,
875
15,0
14
-925
-14,
048
31,4
48
1,69
7
43,9
13
28,4
57
-11,
024
5,68
8
-26,
717
12,6
71
21,7
13
-40,000
-30,000
-20,000
-10,000
0
10,000
20,000
30,000
40,000
50,000
Jul-1
5
Aug-
15
Sep-
15
Oct-1
5
Nov
-15
Dec-
15
Jan-
16
Feb-
16
Mar
-16
Apr
-16
May
-16
Jun-
16
Jul-1
6
Aug-
16
Sep-
16
Net
Inflo
ws
(| .C
r)
Source: AMFI, ICICIdirect.com Research
Exhibit 23: AUM increases on consistent inflows
5289
0055
5884
5710
89
5495
6357
5324
5553
6457
1933
5711
9256
5459
6016
0961
1130
6173
03 6699
3370
4240
5791
18400000450000500000550000600000650000700000750000
Jun-
15Ju
l-15
Aug
-15
Sep-
15Oc
t-15
Nov
-15
Dec-
15
Jan-
16Fe
b-16
Mar
-16
Apr
-16
May
-16
Jun-
16Ju
l-16
Aug
-16
| Cr
ore
Income
Source: AMFI, ICICIdirect.com Research
Recommended funds
Ultra Short Term Funds Birla Sun Life Savings Fund ICICI Prudential Flexible income
Short Term Funds Birla Sunlife short term fund HDFC Short Term Fund ICICI Pru Short Term Plan
Short Term Funds – Credit opportunities Birla Sunlife Short Term opportunities term HDFC Corporate debt opportunities ICICI Prudential Regular Savings
Long term/Dynamic Birla Sunlife income plus ICICI Prudential Dynamic Bond Fund IDFC dynamic bond fund
(Refer www.icicidirect.com for details of the fund)
View Ultra-short term: Neutral
Short-term: Positive Long-term: Positive
Ultra-short-term fund returns are attractive on risk adjusted basis Short-term funds will benefit as the bond curve reverts to an upward slopping curve. Credit opportunities funds earn the highest accrual and are the best in the category Dynamic bond funds are suitable for all types of investors and for longer duration. They can take exposure to all durations as per the interest rate outlook and switch between G secs and corporate bonds
ICICI Securities Ltd. | Retail MF Research
Page 16
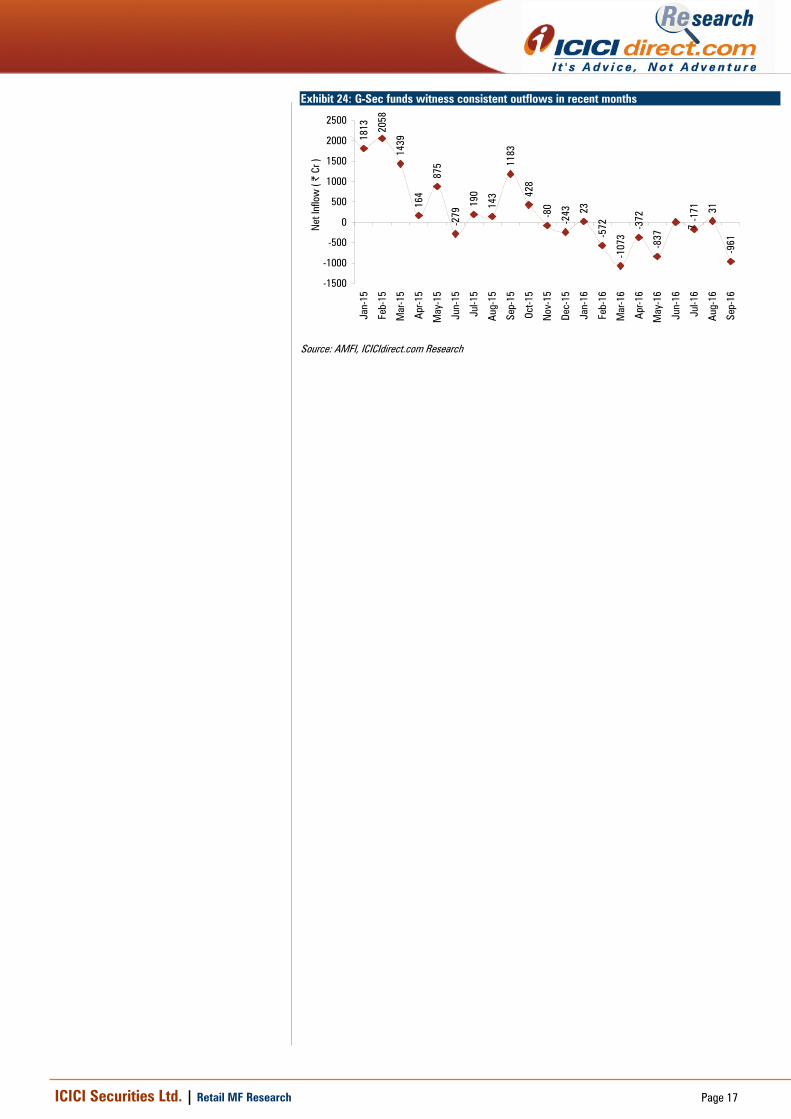
Gilt Funds Gilt funds delivered a return of 11.5% in the last one year as on October
19, 2016 as fall in G-Sec yield over the last six months have helped G-Sec funds to outperform. Lower inflation, better monsoon and higher amount of OMOs by RBI helped bring down yields. Benchmark 10 year G-Sec yield has witnessed a further correction before consolidating in a narrow range
The liquidity situation was tight at the start of the year 2016 but eased off significantly post March 2016
Inflation is not a policy concern currently with the RBI Governor saying inflation remains on a projected trajectory. Overall, assuming normal monsoon and current levels of oil and exchange rates, the RBI expects CPI to be 'inertial' and be around 5% by the end of FY17. However, it emphasises that implementation of the Seventh Pay Commission has not been factored in these projections whereas risks remaining broadly in the balance from monsoon and geopolitical events
The RBI has increased the FPI limit in government bonds to 5% of total outstanding government securities in a staggered manner by March 2018. Currently, FPI holding is 3.8%. The change in FPI limits has further opened up room for | 1,20,000 crore in central government securities by March 2018. All these augur well for debt funds, especially duration funds
The central government has signed a memorandum with the RBI setting out a clear inflation objective to bring the inflation rate to the mid-point of the band of 4 +/- 2%. CPI, as per our assessment, should average close to 5% for FY16 (on assumption of normal monsoons and a stable currency). The government’s commitment towards controlling price shocks and steps taken to improve the supply chain are commendable. Also, global prices have corrected sharply and are supportive ranging from crude, metal to food prices. Hence, inflation should likely stay on the intended path. This creates room for the RBI to cut rates by another 100-150 bps in the long term to earn a real return of ~1.5-2%
On the supply front, the Budget has pegged the market borrowing for FY16 at | 6 lakh crore on a gross basis and | 4.56 lakh crore on a net basis (out of this, | 2.34 lakh crore through dated securities and | 15000 through gold bonds have been scheduled for H2FY16). In Union Budget 2016-17, a fiscal deficit target of 3.5% was set for FY16-17 with net market borrowing of | 425000 crore and gross borrowing of | 6 lakh crore. The market was expecting a gross borrowing of around | 6.3 lakh to | 6.5 lakh crore
Although the outlook on G-Sec yields remains positive, the duration strategy should be played through actively managed income or dynamic bond funds. They will be able to make swift duration change within G-secs or switch between corporate bonds and G-secs within a specific duration
Recommended funds
Birla Sun Life Gilt Plus - PF Plan - Regular ICICI Prudential LT Gilt Fund - PF Option - Regular
(Refer to www.icicidirect.com for details of the fund)
View Short-term: Neutral Long-term: Neutral
ICICI Securities Ltd. | Retail MF Research
Page 17
Exhibit 24: G-Sec funds witness consistent outflows in recent months
1813 20
58
1439
164
875
-279
190
143
1183
428
-80
-243 23
-572
-107
3
-372
-837
-171 31
-961
7
-1500
-1000
-500
0
500
1000
1500
2000
2500
Jan-
15
Feb-
15
Mar
-15
Apr
-15
May
-15
Jun-
15
Jul-1
5
Aug
-15
Sep-
15
Oct-1
5
Nov
-15
Dec-
15
Jan-
16
Feb-
16
Mar
-16
Apr
-16
May
-16
Jun-
16
Jul-1
6
Aug
-16
Sep-
16
Net
Inflo
w (
| Cr
)
Source: AMFI, ICICIdirect.com Research
ICICI Securities Ltd. | Retail MF Research
Page 18
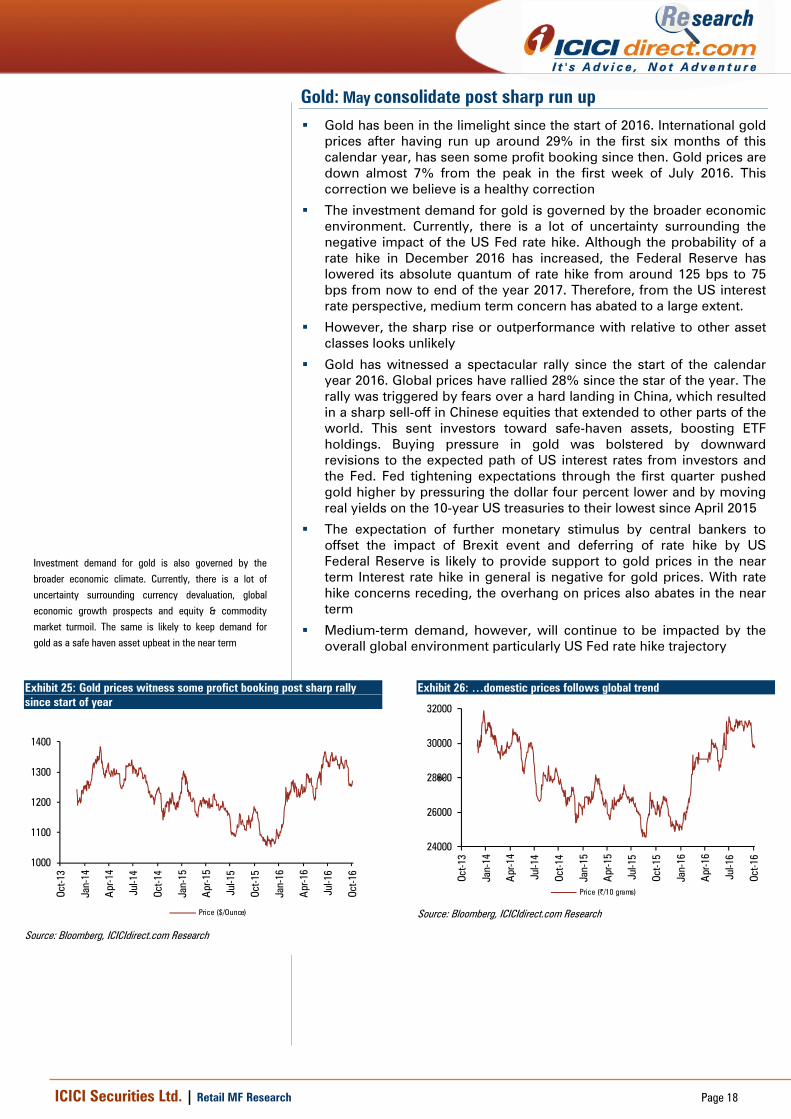
Gold: May consolidate post sharp run up Gold has been in the limelight since the start of 2016. International gold
prices after having run up around 29% in the first six months of this calendar year, has seen some profit booking since then. Gold prices are down almost 7% from the peak in the first week of July 2016. This correction we believe is a healthy correction
The investment demand for gold is governed by the broader economic environment. Currently, there is a lot of uncertainty surrounding the negative impact of the US Fed rate hike. Although the probability of a rate hike in December 2016 has increased, the Federal Reserve has lowered its absolute quantum of rate hike from around 125 bps to 75 bps from now to end of the year 2017. Therefore, from the US interest rate perspective, medium term concern has abated to a large extent.
However, the sharp rise or outperformance with relative to other asset classes looks unlikely
Gold has witnessed a spectacular rally since the start of the calendar year 2016. Global prices have rallied 28% since the star of the year. The rally was triggered by fears over a hard landing in China, which resulted in a sharp sell-off in Chinese equities that extended to other parts of the world. This sent investors toward safe-haven assets, boosting ETF holdings. Buying pressure in gold was bolstered by downward revisions to the expected path of US interest rates from investors and the Fed. Fed tightening expectations through the first quarter pushed gold higher by pressuring the dollar four percent lower and by moving real yields on the 10-year US treasuries to their lowest since April 2015
The expectation of further monetary stimulus by central bankers to offset the impact of Brexit event and deferring of rate hike by US Federal Reserve is likely to provide support to gold prices in the near term Interest rate hike in general is negative for gold prices. With rate hike concerns receding, the overhang on prices also abates in the near term
Medium-term demand, however, will continue to be impacted by the overall global environment particularly US Fed rate hike trajectory
Exhibit 25: Gold prices witness some profict booking post sharp rally since start of year
1000
1100
1200
1300
1400
Oct-1
3
Jan-
14
Apr
-14
Jul-1
4
Oct-1
4
Jan-
15
Apr
-15
Jul-1
5
Oct-1
5
Jan-
16
Apr
-16
Jul-1
6
Oct-1
6
Price ($/Ounce)
Source: Bloomberg, ICICIdirect.com Research
Exhibit 26: …domestic prices follows global trend
24000
26000
28000
30000
32000
Oct-1
3
Jan-
14
Apr
-14
Jul-1
4
Oct-1
4
Jan-
15
Apr
-15
Jul-1
5
Oct-1
5
Jan-
16
Apr
-16
Jul-1
6
Oct-1
6
|
Price (|/10 grams)
Source: Bloomberg, ICICIdirect.com Research
Investment demand for gold is also governed by the
broader economic climate. Currently, there is a lot of
uncertainty surrounding currency devaluation, global
economic growth prospects and equity & commodity
market turmoil. The same is likely to keep demand for
gold as a safe haven asset upbeat in the near term

ICICI Securities Ltd. | Retail MF Research
Page 19
Model Portfolios
Equity funds model portfolio Investors who are wary of investing directly into equities can still get returns almost as good as equity markets through the mutual fund route. We have designed three mutual fund model portfolios, namely, conservative, moderate and aggressive mutual fund portfolios. These portfolios have been designed keeping in mind various key parameters like investment horizon, investment objective, scheme ratings, and fund management. We have changed the mutual funds portfolio in July, to include midcap funds as we believe an improvement in the growth scenario may generate better alpha in midcap stocks over large cap stocks Exhibit 27: Equity model portfolio Particulars Aggressive Moderate ConservativeReview Interval Monthly Monthly QuarterlyRisk Return High Risk- High Return Medium Risk -
Medium ReturnLow Risk - Low
ReturnFunds Allocation % AllocationFranklin India Prima Plus - - 20Birla Sunlife Frontline Equity 20 20 20ICICI Prudential Dynamic Plan - - 20SBI Bluechip Fund 20 20 20ICICI Prudential Value Discovery 20 20 20HDFC Midcap Opportunities 20 20 -Franklin India Smaller Companies 20 20 -Total 100 100 100
Source: ICICIdirect.com Research
Exhibit 28: Model portfolio performance: One year performance (as on August 31, 2016)
19.71%16.81%
13.51%
10.17%
0.00%
5.00%
10.00%
15.00%
20.00%
25.00%
Aggressive Moderate Conservative BSE 100
%
Aggressive Moderate Conservative BSE 100
Source: Crisil Fund Analyser, ICICIdirect.com Research
ICICI Securities Ltd. | Retail MF Research
Page 20
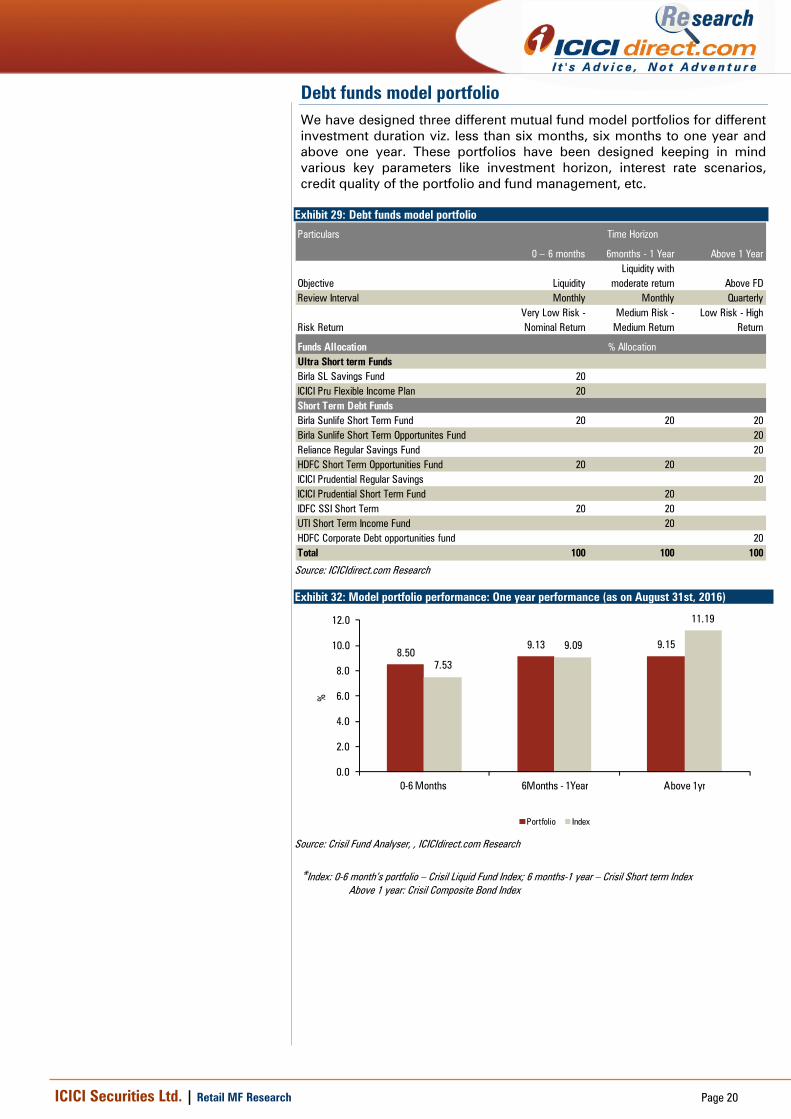
Debt funds model portfolio We have designed three different mutual fund model portfolios for different investment duration viz. less than six months, six months to one year and above one year. These portfolios have been designed keeping in mind various key parameters like investment horizon, interest rate scenarios, credit quality of the portfolio and fund management, etc.
Exhibit 29: Debt funds model portfolio
Particulars
0 – 6 months 6months - 1 Year Above 1 Year
Objective LiquidityLiquidity with
moderate return Above FDReview Interval Monthly Monthly Quarterly
Risk ReturnVery Low Risk - Nominal Return
Medium Risk - Medium Return
Low Risk - High Return
Funds AllocationUltra Short term FundsBirla SL Savings Fund 20ICICI Pru Flexible Income Plan 20Short Term Debt FundsBirla Sunlife Short Term Fund 20 20 20Birla Sunlife Short Term Opportunites Fund 20Reliance Regular Savings Fund 20HDFC Short Term Opportunities Fund 20 20ICICI Prudential Regular Savings 20ICICI Prudential Short Term Fund 20IDFC SSI Short Term 20 20UTI Short Term Income Fund 20HDFC Corporate Debt opportunities fund 20Total 100 100 100
Time Horizon
% Allocation
Source: ICICIdirect.com Research
Exhibit 32: Model portfolio performance: One year performance (as on August 31st, 2016)
8.509.13 9.15
7.53
9.09
11.19
0.0
2.0
4.0
6.0
8.0
10.0
12.0
0-6 Months 6Months - 1Year Above 1yr
%
Portfolio Index
Source: Crisil Fund Analyser, , ICICIdirect.com Research
*Index: 0-6 month’s portfolio – Crisil Liquid Fund Index; 6 months-1 year – Crisil Short term Index Above 1 year: Crisil Composite Bond Index
ICICI Securities Ltd. | Retail MF Research
Page 21
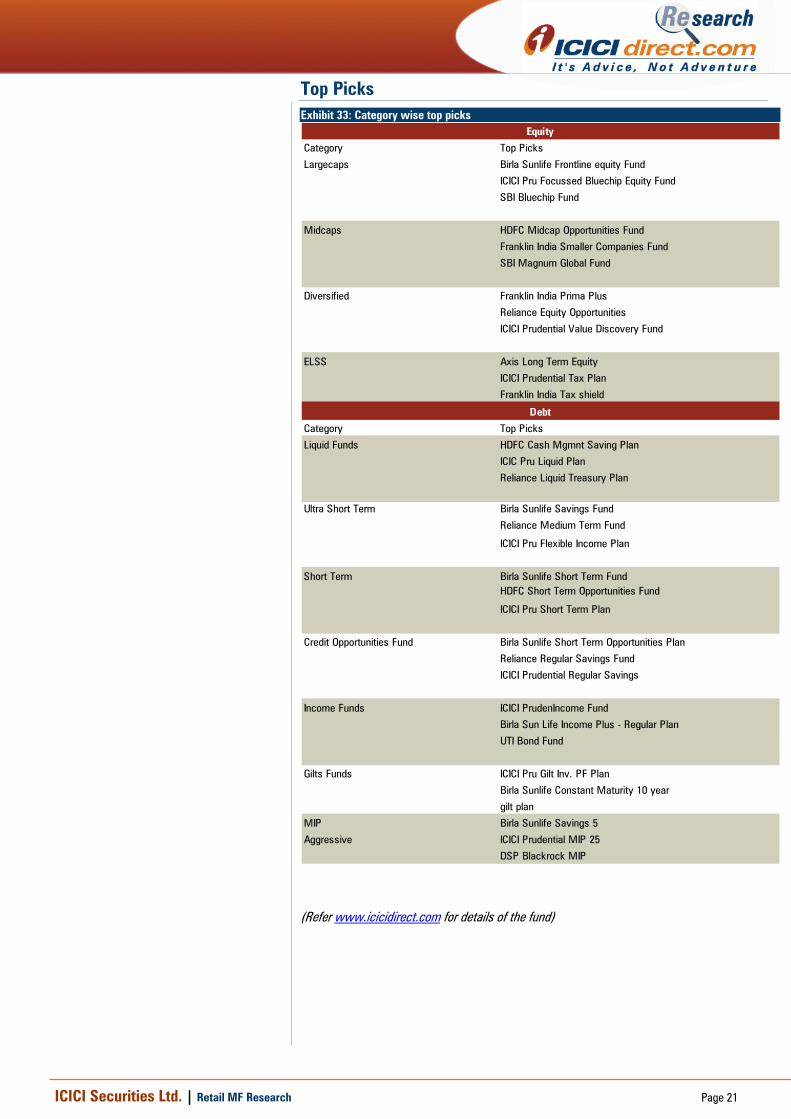
Top Picks Exhibit 33: Category wise top picks
Category Top Picks
Largecaps Birla Sunlife Frontline equity Fund
ICICI Pru Focussed Bluechip Equity Fund
SBI Bluechip Fund
Midcaps HDFC Midcap Opportunities Fund
Franklin India Smaller Companies Fund
SBI Magnum Global Fund
Diversified Franklin India Prima Plus
Reliance Equity Opportunities
ICICI Prudential Value Discovery Fund
ELSS Axis Long Term Equity
ICICI Prudential Tax Plan
Franklin India Tax shield
Category Top Picks
Liquid Funds HDFC Cash Mgmnt Saving Plan
ICIC Pru Liquid Plan
Reliance Liquid Treasury Plan
Ultra Short Term Birla Sunlife Savings Fund
Reliance Medium Term Fund
ICICI Pru Flexible Income Plan
Short Term Birla Sunlife Short Term FundHDFC Short Term Opportunities Fund
ICICI Pru Short Term Plan
Credit Opportunities Fund Birla Sunlife Short Term Opportunities Plan
Reliance Regular Savings Fund
ICICI Prudential Regular Savings
Income Funds ICICI PrudenIncome Fund
Birla Sun Life Income Plus - Regular Plan
UTI Bond Fund
Gilts Funds ICICI Pru Gilt Inv. PF Plan
Birla Sunlife Constant Maturity 10 year
gilt plan
MIP Birla Sunlife Savings 5
Aggressive ICICI Prudential MIP 25
DSP Blackrock MIP
Equity
Debt
(Refer www.icicidirect.com for details of the fund)
ICICI Securities Ltd. | Retail MF Research
Page 22
Pankaj Pandey Head – Research [email protected]
ICICIdirect.com Research Desk, ICICI Securities Limited, 1st Floor, Akruti Trade Centre, Road No. 7, MIDC, Andheri (East) Mumbai – 400 093
[email protected] Disclaimer ANALYST CERTIFICATION I Sachin Jain, CA, Research Analyst and Vinav Kadel, MBA, Research Analyst, author and the names subscribed to this report, hereby certify that all of the views expressed in this research report accurately reflect our views about the subject issuer(s) or Funds. We also certify that no part of our compensation was, is, or will be directly or indirectly related to the specific recommendation(s) or view(s) in this report. Terms & conditions and other disclosures: ICICI Securities Limited (ICICI Securities) AMFI Regn. No.: ARN-0845. Registered office of I-Sec is at ICICI Securities Ltd. - ICICI Centre, H. T. Parekh Marg, Churchgate, Mumbai – 400020. India ICICI Securities Limited is a Sebi registered Research Analyst having registration no. INH000000990. ICICI Securities is a full-service, integrated investment banking and is, inter alia, engaged in the business of stock broking and distribution of financial products. ICICI Securities is a wholly-owned subsidiary of ICICI Bank which is India’s largest private sector bank and has its various subsidiaries engaged in businesses of housing finance, asset management, life insurance, general insurance, venture capital fund management, distribution of financial products etc. (“associates”), the details in respect of which are available on www.icicibank.com. ICICI Securities is one of the leading distributors of Mutual Funds and participate in distribution of Mutual Fund Schemes of almost all AMCs in India. The selection of the Mutual Funds for the purpose of including in the indicative portfolio does not in any way constitute any recommendation by ICICI Securities Limited (hereinafter referred to as ICICI Securities) with respect to the prospects or performance of these Mutual Funds. The investor has the discretion to buy all or any of the Mutual Fund units forming part of any of the indicative portfolios on icicidirect.com. Before placing an order to buy the funds forming part of the indicative portfolio, the investor has the discretion to deselect any of the units, which he does not wish to buy. Nothing in the indicative portfolio constitutes investment, legal, accounting and tax advice or a representation that any investment or strategy is suitable or appropriate to the investor's specific circumstances. The details included in the indicative portfolio are based on information obtained from public sources and sources believed to be reliable, but no independent verification has been made nor is its accuracy or completeness guaranteed. The funds included in the indicative portfolio may not be suitable for all investors, who must make their own investment decisions, based on their own investment objectives, financial positions and needs. This may not be taken in substitution for the exercise of independent judgement by any investor. The investor should independently evaluate the investment risks. ICICI Securities and affiliates accept no liabilities for any loss or damage of any kind arising out of the use of this indicative portfolio. Past performance is not necessarily a guide to future performance. Actual results may differ materially from those set forth in projections. ICICI Securities may be holding all or any of the units included in the indicative portfolio from time to time as part of our treasury management. ICICI Securities Limited is not providing the service of Portfolio Management Services (Discretionary or Non Discretionary) to its clients. Mutual fund investments are subject to market risks, read all scheme related documents carefully. Kindly note that such research recommended funds in indicative portfolio are not based on individual risk profile of each customer unless a customer has opted for a paid Investment Advisory Service offered by I-Sec. Investors should consult their financial advisers if in doubt about whether the product is suitable for them. The information contained herein is strictly confidential and meant solely for the selected recipient and may not be altered in any way, transmitted to, copied or distributed, in part or in whole, to any other person or to the media or reproduced in any form, without prior written consent of ICICI Securities Limited. The contents of this mail are solely for informational purpose and may not be used or considered as an offer document or solicitation of offer to buy or sell or subscribe for securities or other financial instruments or any other product. While due care has been taken in preparing this mail, I-Sec and affiliates accept no liabilities for any loss or damage of any kind arising out of any inaccurate, delayed or incomplete information nor for any actions taken in reliance thereon. This mail/report is not directed or intended for distribution to, or use by, any person or entity who is a citizen or resident of or located in any locality, state, country or other jurisdiction, where such distribution, publication, availability or use would be contrary to law, regulation or which would subject I-Sec and affiliates to any registration or licensing requirement within such jurisdiction. ICICI Securities and/or its associates receive compensation/ commission for distribution of Mutual Funds from various Asset Management Companies (AMCs). ICICI Securities host the details of the commission rates earned by ICICI Securities from Mutual Fund houses on our website www.icicidirect.com. Hence, ICICI Securities or its associates may have received compensation from AMCs whose funds are mentioned in the report during the period preceding twelve months from the date of this report for distribution of Mutual Funds or for providing marketing advertising support to these AMCs. ICICI Securities also provides stock broking services to institutional clients including AMCs. Hence, ICICI Securities may have received brokerage for security transactions done by any of the above AMCs during the period preceding twelve months from the date of this report
Related Documents