Vol. 463: 3 9 -5 7 , 2012doi: 10.3354/meps09836
MARINE ECOLOGY PROGRESS SERIES Mar Ecol Prog Ser Published August 30
OPENACCESS
Primary production and nitrate uptake within the seasonal thermocline of a stratified shelf sea
Anna E. Hickman1,2 *, C. Mark Moore2, Jonathan Sharpies3, Michael I. Lucas4, Gavin H. Tilstone5, Vladimir Krivtsov6, Patrick M. Holligan2
'Departm ent of B io log ica l Sciences, U niversity of Essex, W ivenhoe Park, C olchester, C 0 4 3SQ, UK 2O cean and Earth Sciences, University of Southam pton, N ational O ceanography Centre, Southam pton, E uropean Way,
Southam pton, S 0 1 4 3ZH, UK3School of Environm ental Sciences, U niversity of L iverpool, and N ational O ceanography Centre, 4 B row nlow Street,
L iverpool, L69 3GP, UK 'D epartm ent of Z oology, U niversity of Cape Town, R ondebosch 7701, South Africa
5Plym outh M arine Laboratory, Prospect Place, Plym outh, PLI 3DH, UK 6School of the Built Environm ent, Herriot-W att University, Edinburgh, EH14 4AS, UK
ABSTRACT: Photosynthesis versus irradiance relationships were used to estimate primary production (PP) at a num ber of locations across the seasonally stratified Celtic Sea during summer in 2003 and 2005. A subsurface chlorophyll maximum (SCM) was ubiquitously located at the base of the seasonal thermocline on the nitracline. Average PP for the stratified waters was 170 to 390 mg C m-2 d_1, of which 40 to 50% occurred within the thermocline, the range reflecting cloudy or sunny conditions. Phytoplankton photosynthesis was light-limited at the SCM, resulting in PP in the thermocline being more sensitive to surface irradiance conditions than that in the surface mixed layer. During the stratified period, production fuelled by nitrate from below the thermocline was estimated to be -10 to 19 g C m-2, around half that determ ined for the spring bloom. Comparison of carbon (14C) fixation and nitrate (15N 0 3~) uptake versus irradiance experiments revealed that the proportion of 15N 0 3~ uptake compared to 14C fixed was higher at the SCM than in the upper part of the thermocline where nitrate was depleted. The proportion also decreased with increasing irradiance. Estimates of 15N 0 3~ and 14C uptake, dissolved oxygen production and the potential vertical diffusive nitrate flux from below suggested that 'excess' nitrate is assimilated relative to photosynthetic carbon fixation in the thermocline, particularly under cloudy conditions.
KEY WORDS: Phytoplankton • Photosynthesis • Primary production • Carbon fixation • Nitrate uptake • Irradiance • Continental shelf • Celtic Sea
---------------------------------- Resale or republication not permitted without written consent of the publisher---------------------------------
INTRODUCTION
Despite covering <10% of the surface area of the oceans, shelf seas are considered to be highly productive regions contributing 15 to 30% of total oceanic primary production (PP; Muller-Karger et al. 2005). Since shelf seas are important regions for the global carbon cycle and support significant fisheries, there is a need to understand the biological and physical processes governing shelf sea PP. Here we focused on the
Celtic Sea, a region of the NW European shelf with relatively weak tides that becomes stratified during the summer months (Pingree et al. 1978, Sharpies & Holligan 2006) and which is representative of other shelf seas with similar physical characteristics such as the northern North Sea (Rodhe et al. 2006), the shelf regions of the Bay of Biscay (Lavin et al. 2006) and around New Zealand (Sharpies et al. 2001a).
In the Celtic Sea, stratification develops in spring (April), triggering a phytoplankton bloom that de
* Email: a.hickm an@ noc.soton.ac.uk © Inter-R esearch 2012 • w w w .int-res.com

40 M ar Ecol Prog Ser 463: 39-57 , 2012
pletes the surface mixed layer (SML) of nitrate (Pin- gree et al. 1976, Fasham et al. 1983). Throughout the summer months, the degree of seasonal stratification is determ ined by competition betw een buoyancy input from solar heating and mixing caused by tidally generated turbulence at the seabed and wind at the surface (Simpson & Hunter 1974). Summer surface waters are relatively warm and nutrient depleted, with low concentrations of chlorophyll a (chi a; Pingree et al. 1976, Joint & Groom 2000). Low pigm ent standing stocks resulting from lack of nitrate in the SML hence permit light penetration to the thermocline, the depth of which is determ ined by physical processes. Consequently, a subsurface chlorophyll maximum (SCM) occurs within the seasonal thermocline as a result of phytoplankton growth at the nitracline and an increase in cellular chi a by low-light acclimated cells (Holligan et al. 1984a,b, Moore et al. 2006, Hickman et al. 2009). Phytoplankton found within the SCM include larger- celled forms, such as dinoflagellates, coccolitho- phores and small diatoms (Holligan et al. 1984a, Sharpies et al. 2001b, Hickman et al. 2009) compared to the picoplankton that characterize the SML (Joint et al. 1986). Vertical changes in taxonomic composition are thought to reflect species selection across gradients in light and nutrient availability (Hickman et al. 2009). Beneath the thermocline and SCM, tidal turbulence maintains a bottom mixed layer (BML) of relatively cold water containing high concentrations of nutrients.
Maximum observed SCM chi a concentrations in the Celtic Sea range from >50 mg m-3 close to tidal mixing fronts (Pingree et al. 1976, Sharpies et al. 2001b) to values of ~1 mg m-3 across the open shelf (Hickman et al. 2009). Away from the narrow frontal regions where PP can be around 5 times higher (Holligan et al. 1984b, Joint & Groom 2000), PP in the seasonally stratified region of the Celtic Sea is estim ated to be -100 g C m-2 yr_1 between April and Septem ber (Joint & Groom 2000) with daily rates of 100 to 600 mg C m-2 d_1 in the summer months (Joint & Pomroy 1983, Holligan et al. 1984b, Joint et al. 1986, M aranon et al. 2005). Given the lack of nitrate observed in the SML, the thermocline is likely to be the only significant site of nitrate-fuelled production ('new production', sensu Dugdale & Goering 1967) in the stratified shelf waters during summer (Holligan et al. 1984b), with the BML acting as the source of nitrate (Sharpies et al. 2001b).
Quantifying PP in the seasonal thermocline and determ ining the proportion that is fuelled by 'new ' nitrate from the BML is crucial for understanding
shelf sea biogeochemistry and, ultimately, global carbon sequestration via mechanisms such as the 'Continental Shelf Pump' (Tsunogai et al. 1999). The m agnitude of new production in the seasonal thermocline also has important consequences for fisheries (Dickey-Collas et al. 1996, Heath & Beare2008) and potentially top predators whose distributions have been shown to correlate with the summer SCM (Scott et al. 2010). Consequently, understanding how physical forcing controls PP is necessary for predicting the ecosystem and biogeochemical responses to climate-driven variations in surface irradiance or water column stratification (Sharpies et al. 2006). Further, the processes controlling primary and new production in the Celtic Sea are likely to be relevant to other stratified systems with SCMs, including the oligotrophic gyres (Painter et al. 2007).
Here we investigated the factors controlling primary and new production within the characteristic nutrient-stratified regime exhibited across the Celtic Sea during summer. Specifically we aimed to: (1) quantify PP at a num ber of locations in the Celtic Sea and determine how much of this production occurs within the thermocline, (2) identify the main factors controlling variability in the magnitude of PP, and (3) determine the proportion of PP in the thermocline that is fuelled by nitrate. The results are considered in terms of dynamic physical and biological processes acting within the thermocline. To our knowledge, this is the first attem pt to m easure PP in the thermocline across a broad region of the seasonally stratified Celtic Sea, capturing a range of physical conditions such as tidal mixing, bottom topography and incident irradiance.
MATERIALS AND METHODS
Hydrography and water sampling
Data were collected at a num ber of stations in the Celtic Sea (Fig. 1) during RRS 'James Clark Ross' cruise JR98 (24 July to 14 August 2003) and RRS 'Charles Darwin' cruise CD173 (15 July to 6 August2005). Hereafter these 2 cruises will be referred to as CS2003 and CS2005, respectively. A Seabird 911 CTD and rosette system was fitted with a Chelsea Instruments Aquatracka MKIII chlorophyll fluoro- m eter and 24 x 201 Niskin bottles. During CS2003, an undulating towed instrument (Seasoar) containing a CTD and fluorometer was also deployed, and was calibrated via CTD casts (see below). Nitrate concen

H ickm an et al.: Shelf sea prim ary production 41
52°N
48°N
10°W 6°W 10°W 6°W
Temperature (°C) Chi a (mg m"3)Fig. 1. Celtic Sea, show ing sam pling locations, (a) Surface tem peratu re m easured by AVHRR as a composite for 9 to 15 June 2005. The dotted line shows the Seasoar transect carried out during CS2003 travelling southw est to northeast, (b) Chlorophyll a (chi a) m easured via SeaWIFS as a composite for 9 to 15 June 2005. Station positions during CS2003 (triangles) and CS2005 (circles) are shown, w ith larger symbols indicating locations w here prim ary production (PP) estim ates w ere m ade. W hite lines
in (a) and (b) indicate the 200 and 1000 m dep th contours
tration was m easured on board by a standard colorimetric technique (Brewer & Riley 1965) using a Skalar AAII-type autoanalyser. The limit of nitrate detection was -0.1 pM.
Biological measurements
Chi a was m easured fluorometrically on-board, following methods of Welschmeyer (1994) from water samples filtered through Whatman GF/F filters. Fluorometrically derived chi a values were further scaled to those obtained from high-performance liquid chromatography (Hickman et al. 2009) and used to calibrate the CTD fluorometers. M easurements of phytoplankton light absorption were based on the filter pad technique (Bricaud & Stramski 1990, Tassan & Ferrari 1995) as described by Moore et al. (2006) and Hickman et al. (2009) for CS2003 and CS2005, respectively. Total particulate organic carbon (POC) and particulate organic nitrogen (PON) were obtained from water samples filtered onto ash- dried GF/F filters, stored at -80°C and subsequently analysed in the laboratory using a Thermo Finnegan Flash EA1112 elemental analyser (Poulton et al.2006).
Irradiance and primary production
PP was estimated by combining m easurem ents of the irradiance dependence of photosynthesis at each station and of spectrally resolved in situ photosyn- thetically available radiation (PAR) using methods similar to those of Tilstone et al. (2003) and Morel et al. (1996). PAR, m easured as E(z) (pE n r 2 s-1), which is the integral of irradiance E(X,z) between 400 and 700 nm, was modeled empirically at each depth (z) through the water column and for any given broadband PAR incident at the sea surface, Eincident, using knowledge of (1) the transmittance of PAR through the sea surface, t (dimensionless), (2) the PAR-nor- malised light spectrum just below the surface, E(X, 0) (pE n r 2 s-1), and (3) the light attenuation at each wavelength, Kd(X,z), following
E (Xf0) = ¿ ’incident *T*¿(X,0) (1)
E(X,z) = E(z -1) • e-Kd^'z)-dz (2)
where E(X, 0) is the spectral irradiance just below the surface and dz = 1 m. Values for t, E(k, 0) and Kd(X,z) were derived from downwelling irradiance m easurements m ade with a SATLANTIC in situ optics profiler at 7 wavelengths during CS2003 and 6 wavelengths

42 M ar Ecol Prog Ser 463: 39-57 , 2012
during CS2005 (Moore et al. 2006, Hickman et al.2009). Linear interpolation betw een m easured w avelengths provided spectra at 1 nm resolution. A factor of 1.2 converted downwelling to scalar irradiance (Kirk 1994). E(X, 0) and Kd(X,z) were derived from surface intercepts and gradients of the log-transformed irradiance profiles respectively for CS2003 and following Hickman et al. (2009) for CS2005. An average value of x for each cruise was calculated from the ratio of PAR above the surface as recorded by the ship's meteorological package during the optics profiler deployment and PAR below the surface (Tilstone et al. 1999).
Standard short (2 to 4 h) 14C-uptake photosynthesis versus irradiance (P versus E) experiments were used to measure both absolute and chi a normalised PP and hence derive the chi a specific maximum light-saturated photosynthesis rate, P*m (mg C mg-1 chi a h_1) and the maximum light utilisation coefficient, (Xjnsitu (mg C mg-1 chi a h_1 [pE m-2 s-1]-1) (Jassby & Platt 1976). Samples were collected at 2 depths during CS2003 (1 in the SML and 1 at the SCM) and 4 depths during CS2005 (2 in the SML, 1 in the upper thermocline and 1 in the lower thermocline at the SCM). Samples were collected before dawn and incubated in 73 ml polycarbonate bottles in pho- tosynthetrons at constant tem perature corresponding to either the SML or SCM. Values of 0CinSitu and the light saturation parameter, E kinsitu (pE m-2 s_1) (given by P*m/oLnsitu) were spectrally corrected to the in situ irradiance at the sample depth according to the phytoplankton light absorption, a*(X,z) (following Moore et al. 2006, who also provided a detailed analysis of phytoplankton photophysiology for cruise CS2003).
PP (given by P[z]) was then calculated at 1 m depth resolution from
P(z) = ChiCTD (z) -P*m(z) • tanh ( M î Ë l p ) (3)' ^ m\Z) '
based on Jassby & Platt (1976), where P*m(z), a(z)insitu and a*(X,z) required for the spectral correction were obtained via linear interpolation of m easured param eter values betw een sample depths. For CS2003, param eter values obtained in the SML were assumed representative of that layer whilst those within the thermocline were obtained from a linear interpolation between SML values at the top of the therm ocline and those at the SCM. ChlCTD(z) was provided by calibrated CTD fluorescence profiles. Eqs. (1), (2) & (3) thus allowed PP to be estimated from station- specific physiological data and empirically modeled spectral irradiance for any chosen incident surface PAR.
Hourly PP profiles were calculated for the following daylight scenarios: (1) the recorded incident PAR during the day of sampling, (2) a representative sunny day (peak daytime irradiance 1880 pE n r 2 s_1) and (3) a representative cloudy day (peak daytime irradiance 520 pE n r 2 s_1). A full range of peak daytime irradiances spanning these values was observed during both cruises, with cloudy and sunny conditions sometimes occurring on consecutive days. We thus consider that the chosen range of surface incident irradiances represent realistic limits for PP on any given day.
Daily PP estimates were obtained by integrating hourly profiles over the photoperiod and through depth for both the SML and thermocline. The upper boundary of the thermocline was defined as the depth at which water density reached 0.05 kg m-3 above surface density. The lower boundary was calculated as the depth where density was 0.02 kg m-2 below that of the bottom density. For the minority of casts where the SML and BML were poorly defined by density, the thermocline boundaries were identified from the density profiles by eye, taking into consideration information from neighboring CTD casts (Hickman et al. 2009). The thermocline was further categorised into an upper region where nitrate concentrations were <0.1 pM (below the limit of instrum ent detection), and a lower region where concentrations were >0.1 pM (i.e. the nitracline). Given the very low mean light environment of the BML, PP below the thermocline was considered to be negligible.
We briefly consider the implications of some of the assumptions m ade in the calculation of PP. Although no consistent pattern in the diel variability of P versus E param eters could be determ ined for either the SML or SCM (Moore et al. 2006), we estimate that neglecting diel variability may have potentially led to a -12% underestim ation of daily PP. In contrast, from available data we calculated that the contribution of light absorption by non-photosynthetic carotenoids could have resulted in a potential overestimation of PP by -10% (in agreem ent with Bouman et al. 2000). Our daily PP estimates neglected diurnal changes in chi a profiles but for stations with available data, this only accounted for an average variability in daily PP of -5% excluding the weakly stratified site CS3, and -15% when CS3 was included. We further acknowledge that our PP estimates based on short (2 h) incubations will lie betw een net and gross photosynthesis (Williams 1993, Robinson et al. 2009, Halsey et al.2010) and do not account for dissolved organic carbon release (Maranon et al. 2005).

H ickm an et al.: Shelf sea prim ary production 43
Nitrate uptake
At Stns CS3br OB and B2ar nitrate uptake and carbon fixation versus irradiance experiments were carried out using 15N 0 3~ and 13C stable isotope tracer techniques (Dugdale & Goering 1967). 15N 0 3~ was added to seawater samples at <10% of ambient nitrate concentration. Incubations were term inated by filtration through pre-ashed GF/F filters (Glibert & Capone 1993). As will be shown later, photosynthe- sis-irradiance curves for 13C and 14C were highly comparable, demonstrating compatibility between the separate experiments despite larger (1 1) sample bottles and longer (3 to 5 h) incubations for the stable isotope tracer experiments. We acknowledge that 15N 0 3~ uptake may have been overestimated for experiments where the ambient nitrate concentrations were below the limit of detection. To estimate daily 15N 0 3~ uptake, it was assumed that nitrate uptake continued in the dark (Cochlan et al. 1991) at a rate given by the intercept of the uptake versus irradiance curve.
Dissolved oxygen concentration
In situ dissolved oxygen concentration (mg I“1) was m easured during CS2005 using a Seabird dissolved oxygen sensor mounted on the CTD frame and calibrated by water samples analysed using the Winkler technique. Oxygen saturation (%) was calculated following Weiss (1970), and apparent oxygen utilisation (AOU) was calculated as the difference between the dissolved oxygen concentration and that of the theoretical saturation limit. Negative AOU values thus reflect super-saturation and positive values reflect under-saturation.
RESULTS
Hydrography
The structure of the seasonal pycnocline across the Celtic Sea (Fig. 2a; Sharpies et al. 2001b) was determined by variability in tem perature rather than salinity. Significant vertical gradients of salinity (e.g. a difference of -0.5 PSS-78 betw een the SML and BML) were observed only in the weakly stratified region close to the St. George's Channel tidal mixing front (Stn CS3). Hereafter, the terms thermocline and tem perature are used interchangeably with pycnocline and density to describe the structure of the water column.
The water depth ranged from approximately 100 m at CS1 and CS3 to 150 m at B2 and JB1 (Table 1). The thermocline was 28 ± 11 m broad (mean ± SD, n = 151) and typically had an upper boundary with the SML at 15 ± 7 m (n = 151; Table 1). The thermocline shoaled towards the St. George's Channel front and was broader around the shelf edge (Fig. 2a). Chi a concentrations were low in the stratified surface waters (Figs. 1 & 2a,c, Table 1), and an SCM was always present within the thermocline (Fig. 2a).
The standing stock of chi a integrated to a depth of 70 m ranged from 20 to 40 mg m-2 across the stratified shelf, lower than the values at the St. George's Channel front and the shelf edge (Fig. 2a,c). Part of the variability in integrated chi a could be attributed to increases over topographic banks, such as those at 180 to 200 km and 230 to 240 km along the Seasoar transect (Fig. 2a,c). The variability in integrated chi a was generally not reflected in surface concentrations (Fig. 2c).
About 75 % of water-column-integrated chi a was located within the thermocline (76 ± 12 %). The mean chi a concentration at the SCM was 1.09 ± 0.97 mg m-3 (n = 98) with a m edian concentration of 0.84 mg m-3, reflecting high values at a small num ber of stations (range 0.23 to 8.36 mg m-3). As was the case for the thermocline, the depth of the SCM varied across the shelf (Fig. 2a) and with time. For example, the tem perature and chi a structure at B2 varied during the day and between visits at different stages of the spring-neap tidal cycle (Fig. 2d,e). The m ean SCM depth across all stations was 30 ± 8 m (n = 96, Fig. 2a, Table 1).
The vertical distribution of chi a within the water column was variable relative to depth (Fig. 2a, see also Fig. 6) but showed a consistent pattern in re lation to density (Figs. 2b & 3). In general, the profile for chi a was asymmetric with respect to the density gradient, with the SCM located near the base of the pycnocline at an average density value of -1026.6 ± 0.3 kg m-3 (n = 95). This pattern of vertical distribution was persistent at each station over time, and was similar between stations (Figs. 2b & 3).
Nitrate concentrations ranged from -7 ± 1.0 pM in the BML (n = 94) to below the limit of instrument detection (-0.1 pM) in the upper thermocline and SML (Fig. 3). The nitracline and thermocline were thus de-coupled, the vertical extent of the nitrate gradient being less than that of the thermocline. The SCM was typically located in the lower thermocline at a nitrate concentration of 1 to 2 pM (Fig. 3). The SCM and nitracline were occasionally observed higher up in the density gradient, for example at
44 M ar Ecol Prog Ser 463: 39-57 , 2012
n 1 r400 500
80C 2 -i
COI
x:O
300 400 5000 100 200Distance (km)
C LCl)Q
-50-
-100208
Day of Year208.5 212.5
Day of Year213
0.5 1 1.5Chi a (mg rrr3)
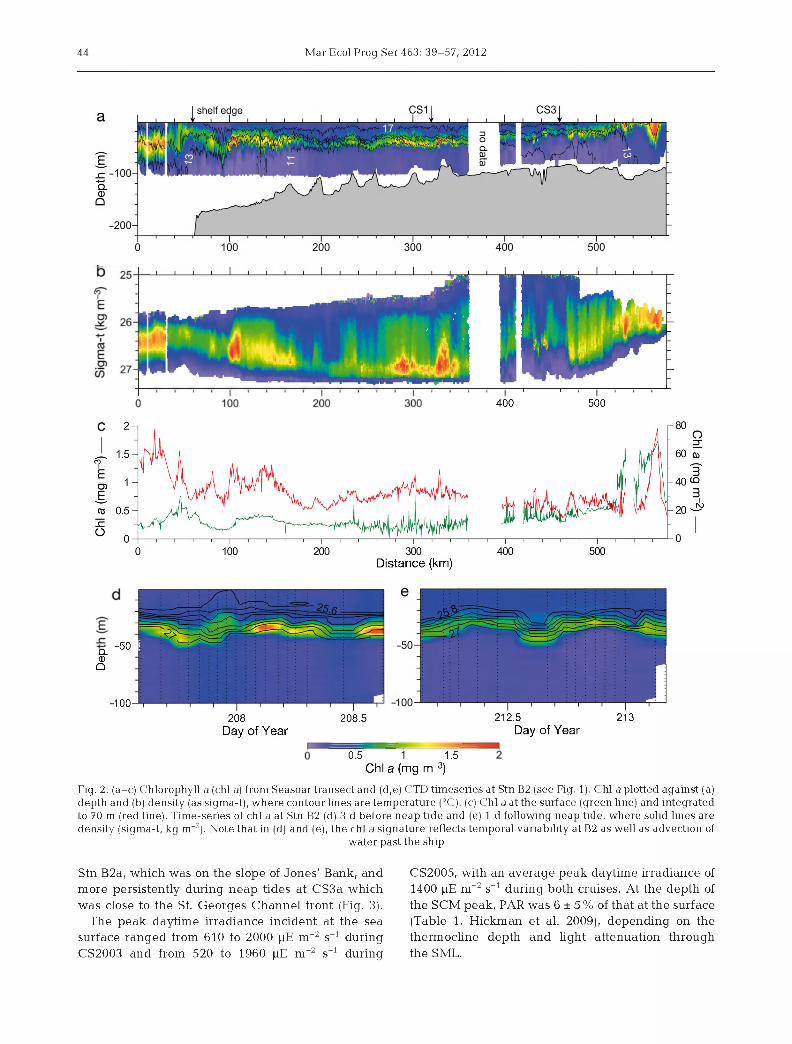
Fig. 2. (a-c) Chlorophyll a (chi a) from S easoartransect and (d,e) CTD tim eseries at Stn B2 (see Fig. 1). Chi ap lo tted against (a) dep th and (b) density (as sigma-t), w here contour lines are tem pera tu re (°C). (c) C hi a at th e surface (green line) and in tegrated to 70 m (red line). Tim e-series of chi a at Stn B2 (d) 3 d before neap tide and (e) 1 d following neap tide, w here solid lines are density (sigma-t, kg m“3). Note tha t in (d) and (e), the chi a signature reflects tem poral variability at B2 as well as advection of
w ater past the ship
Stn B2a, which was on the slope of Jones' Bank, and more persistently during neap tides at CS3a which was close to the St. Georges Channel front (Fig. 3).
The peak daytime irradiance incident at the sea surface ranged from 610 to 2000 pE m-2 s_1 during CS2003 and from 520 to 1960 pE m-2 s_1 during
CS2005, with an average peak daytime irradiance of 1400 pE m-2 s“1 during both cruises. At the depth of the SCM peak, PAR was 6 ± 5 % of that at the surface (Table 1, Hickman et al. 2009), depending on the thermocline depth and light attenuation through the SML.

H ickm an et al.: Shelf sea prim ary production 45
Table 1. Properties and variability of w ater colum n structure and chlorophyll a (chi a) characteristics at stations w here prim ary production (PP) w as estim ated (see Fig. 1). Locations w ere typically sam pled throughout a 25 h period (except U2, PI and JB1, w hich w ere only sam pled before dawn). Layer-integrated chi a w as obtained from the (calibrated) CTD fluorescence profiles. SML: surface m ixed layer, Therm: therm ocline, SCM: subsurface chlorophyll maximum, 'a ' and 'b ' identify different visits to the sam e location. Values are m eans ± SD. W ater depths vary w ith the tide and bathym etry in the vicinity of the sam pling station
Station n W ater depth (m)
Layer th ickness (m)
SML Therm
L ayer-integrated chi a (mg m-2)
SML Therm
Irradiance at SCM p eak (%)
B2a 18 122 ± 10 16 ± 3 30 ± 6 5 ± 2 20 ± 5 5 ± 2B2b 16 153 ± 10 21 ± 5 21 ± 4 9 ± 2 14 ± 3 5 ± 2JB la 1 150 18 31 5 35 5JB lb 1 158 23 15 10 11 9OB 15 118 ± 13 18 ± 5 22 ± 3 7 ± 2 14 ± 2 5 ± 2PI 3 132 ± 2 19 ± 4 36 ± 3 7 ± 2 22 ± 4 5 ± 3U2 1 119 22 7 5 6 13CS1 16 97 ± 1 23 ±3 23 ± 6 5 ± 1 12 ± 4 3 ± 0CS3a 21 98 ± 1 8 ± 3 25 ± 5 4 ± 2 18 ± 3 9 ± 6CS3b 21 98 ± 1 5 ± 2 39 ± 13 2 ± 1 18 ± 9 8 ± 4All shelf 151 122 ± 31a 15 ± 7 28 ± 11 6 ± 3 17 ± 7 6 ± 5an = 142 for w ater depth data
Phytoplankton photophysiology and production
M easurements of the phytoplankton physiological param eters are summarised in Figs. 4 & 5. Values of .Ekinsitu decreased with depth, with 71% of the variability explained by P*m compared to only 11% by Kinsitu (n = 55; Fig. 4). For the SML, E kinsitu was similar to the m ean irradiance experienced during the p revious day. In contrast, for the thermocline, E kinsitu was consistently higher than the mean irradiance (Fig. 5a), instead being similar to the maximum irradiance experienced the previous day (Fig. 5b). It follows that during most of the day, photosynthetic rates for phytoplankton in the SML were close to the maximum (P*m), whilst in the thermocline, rates were sub-optimal and corresponded to the light-limited slope (oijnsitu) region of the P versus E curve.
PP was estimated at a number of stations across the open shelf (Fig. 1) that were representative of the range of conditions (water depth, the spring-neap tidal cycle, recent wind mixing and other factors) affecting the depth and form of the pycnocline. Profiles of PP resembled the chi a structure (Fig. 6), with additional influences from the in situ irradiance and the photophysiological state of the phytoplankton community. A distinct subsurface maximum in PP occurred only when surface irradiance and/or chi a concentration at the SCM were relatively high (Fig. 6).
When estimated for the irradiance conditions experienced on the day of sampling, water column in tegrated PP for the stratified shelf ranged from 140 to 460 mg C m-2 d_1. Highest values were found at JB la, close to Jones' Bank, and the lowest values at
o Nitrate (gM)
25B2a
26
27
0 105
B2b
Q?0
0 105— 25 co OB
O) 27
0 21
CS1
0 21
25CS3a
26
27
0 21
CS3b
0 21
— Chi a (mg m 3)Fig. 3. V ertical profiles of chlorophyll a (chi a) from calib ra ted CTD fluorescence profiles (solid lines), and nitrate concentrations (circles) w ithin the therm ocline plotted against density (sigma-t), during 24 h occupations of selected stations, 'a ' and 'b ' identify different visits to the
sam e location

insi
tu46 M ar Ecol Prog Ser 463: 39-57 , 2012
OC in s i tu 0.05 0.1 10
S^insitu 100 200 300
- 2 -
-4-
o- __________________i__________________ i_______
• * (A • • •o- •1ir
• • •• • • • *
• • • • • •• • • • • • • • •• -2- • -2- •. . . . .
• * 7/• •
>:• 1• -4- • - 4 . •
• •
i
• •
■ i
• •
------------1------------ 1------------Fig. 4. Photophysiological param eters obtained from 14C -uptake photosynthesis versus irradiance (P vs. E) experim ents (n = 55). P*m (mg C m g-1 chi a h_1), the chlorophyll a (chi a) specific m axim um ligh t-saturated photosynthesis rate, and a insitu (mg C m g-1 chi a h_1 [pE m -2 s-1]-1), the m axim um light utilisation coefficient, reflect the m axim um and initial slope of the chi a norm alised P vs. E curve, respectively. The light saturation param eter, E iinsitu (pE m-2 s_1) is calculated from P*m/ a insitu. absita and Eiinsitu are spectrally corrected to the in situ irradiance at the sam ple dep th (following m ethods of M oore et al. 2006). OD is optical depth , obtained from the sam ple dep th (m) x iTd(PAR) w here iTd(PAR) is the vertical a ttenuation coefficient for
photosynthetically available radiation
B2a on the edge of Jones' Bank and at CS1. Water- column-integrated PP was significantly correlated to m ean daily irradiance on the day of sampling (r2 = 0.71, p = 0.002, n = 10), but not to any other variable, including the surface (2 m) chi a concentration (Fig. 7a).
W hen standardised for irradiance, the average water-colum n-integrated daily PP for the stratified shelf was 174 (range 113 to 248) and 386 (range 252 to 490) mg C m-2 d_1 for cloudy and sunny conditions, respectively (Table 2). The contrast in incident daily irradiance betw een cloudy and sunny conditions thus accounted for a greater range in PP than was observed betw een locations (Fig. 7b). Further, w hen standardised for irradiance, the relationship betw een PP estimates and surface chi a was stronger than when PP was estimated for irradiance
levels on the day of sampling (Fig. 7a,b), but the relationships rem ained insignificant (p > 0.05). Even when standardised for irradiance, no significant correlations could be found betw een estimated total water-colum n-integrated PP and factors such as physiological (P versus E) parameters, stage of spring-neap tidal cycle, relative irradiance depth of the SCM or even layer-integrated PP for the SML or thermocline. There was no obvious regional pattern to PP estimates, for example with relation to topography.
When the SML and thermocline layers were considered separately, a significant correlation between layer-integrated PP and layer-integrated chi a was found for both the SML and thermocline (Fig. 7c,d). SML-integrated PP was significantly correlated to SML thickness during both cloudy and sunny condi-
102-
¡4J
10 1 '
a / b /
M / fa( 9 . 102. ( 9 /Ó © ®
O Oo c ¿ ^ /
A/ . m 1. /
10 ° 102 104 10°
Mean growth irradiance102
Peak irradiance104
Fig. 5. Light saturation param eter (-Ekinsitu, RE m-2 s“1) plotted against (a) m ean grow th irradiance and (b) peak irradiance (pE m-2 s_1). O pen and grey circles are sam ples collected in the surface m ixed layer (SML) and subsurface chlorophyll m axim um (SCM), respectively. G rey triangles denote sam ples collected in the upper therm o- cline during CS2005. M ean grow th irradiance w as estim ated as the m ean irradiance experienced during the previous 24 h period (for sam ples collected in the SML, the m ean grow th irradiance w as tha t averaged through the SML). Peak irradiance w as the m axim um irradiance recorded on the previous day (for sam ples in the SML, the peak irradiance w as assum ed to be that just below the surface). The dashed lines are 1:1

H ickm an et al.: Shelf sea prim ary production 47
0
' 2 0
Sigma-t (kg rrr3)25 26 27 28 25 26 27 28 25 26 27 28 25 26 27 28 25 26 27 28 25 26 27 28 25 26 27 28
C LCDO 40
60
Sigma-t- - Chia
OBJB1aB2a3 0 1 2 32
U2 CS1 CS3a2 3 0 1 2 3
0
^ 2 0
C LCDa 40
60
Chi a (mg rrr3)
PP (mg C m-3 d-1)0 20 40 0 20 40 0 20 40 0 20 40 0 20 40 0 20 40 0 20 40
— !— p p■ i ’ - O2
B2a i U2 CS1 CS3a80 100 120 80 100 120 80 100 120 80 100 120 80 100 120 80 100 120 80 100 120
O2 (% sat.)
Fig. 6. Top panels: vertical profiles of chlorophyll a (chi a) and density (sigma-t) for selected stations. Bottom panels: vertical profiles of prim ary production (PP) estim ated for the irradiance recorded on the day of sam pling (solid lines) and dissolved oxygen saturation (dotted lines) for selected stations. Shaded region indicates the range in PP w hen estim ated for cloudy and sunny conditions. H orizontal grey lines indicate the top and bottom boundaries of the therm ocline (see 'M aterials and m ethods'). D issolved oxygen profiles w ere only available during cruise CS2005. 'a ' indicates the first visit to the location
tions, but only when neglecting data from the near frontal CS3 station where the top of the thermocline was poorly defined (cloudy: r2 = 0.56, p = 0.03, n = 8; sunny: r2 = 0.59, p = 0.03, n = 8). For cloudy conditions, SML-integrated PP was correlated to P*m x chi a at 2 m (r2 = 0.78, p = 0.004, n = 8) when data from CS3 were excluded (Fig. 7e). Thermocline- integrated PP was significantly correlated to therm ocline thickness during sunny but not cloudy conditions (r2 = 0.46, p = 0.03, n = 10). For cloudy conditions, therm ocline-integrated PP was significantly correlated to the product of 0CiI1Situ x chi a at the SCM (r2 = 0.70, p = 0.003, n = 10; Fig. 7f).
The thermocline contributed between 24 and 65 % to water-column-integrated PP with values for individual stations about 10% higher under sunny compared to cloudy conditions (Table 2, Fig. 8). On average for all stations, the thermocline contributed 40 to 50% to water-column-integrated PP, the range reflecting incident daily irradiance. For both cloudy and sunny conditions, the contribution of the therm o
cline to total water column PP was significantly correlated to therm ocline-integrated chi a (r2 = 0.35, p = 0.07 and r2 = 0.54, p = 0.02 both n = 10, for cloudy and sunny conditions, respectively).
Nitrate uptake and oxygen production
The dependence of 15N 0 3~ uptake on irradiance was m easured for water samples from the SCM at Stns CS3b and OB and from the upper thermocline at OB and B2a. All experiments revealed a light-dependent response for 15N 0 3~ uptake that differed from that for photosynthetic 14C and 13C fixation, as illustrated by results for Stn CS3b (Fig. 9a). When interpolated over 24 h for the representative cloudy and sunny conditions, daily nitrate uptake rates at the SCM ranged from 77 to 97 pmol N m-3 d_1 at site OB and 99 to 130 pmol N m-3 d_1 at CS3b. Estimated rates were lower in the upper thermocline (11 to 14 pmol N m-3 d_1 at OB and 19 to 28 pmol N m-3 d_1

48 M ar Ecol Prog Ser 463: 39-57, 2012
600,CLCL
400Oo
200
cd—0.1 0.2 0.3 0.4
Chi a 2 m0.5
600CLCL
E 400ooCDCO 200
b
0.1
y = 739x + 141 ! = 0.25, p = 0.138
y = 7454 x + 21 = 0.31, p = 0.094
0.2 0.3 0.4Chi a 2 m
0.5
200
150
-J 100
50r2 = 0.59p = 0.010
0 5 10 15SML integrated chi a
350
CL 3 ° °
I 250
% 200 oE 150v_a>" 100
r2 = 0.54 p = 0.01550
0 10 20 30 40
200
150
_i 100
50r2 = 0.78 p = 0.004
0 1 2 3
120
CLCL
® 80ooEfe 40
r2 = 0.69 p = 0.003
Thermocline Integrated chi a x chi a 2 m0.05 0.1
«¡ns itu x chi a DCM
Fig. 7. Vertically in teg ra ted prim ary production (PP) values against other param eters: (a) w ate r colum n-integrated daily PP (mg C m-2 d_1) estim ated for the irradiance conditions on the day of sam pling against chlorophyll a (chi a; m g m -3) at 2 m,(b) w ater-colum n-integrated PP estim ated for cloudy (solid symbols) and sunny (open symbols) conditions against chi a at 2 m,(c) PP in teg ra ted through the surface m ixed layer (SML) against in teg ra ted chi a w ithin the SML, (d) PP in teg ra ted through the therm ocline against in teg ra ted chi a w ithin the therm ocline, (e) PP in teg ra ted th rough the SML against the product of chi a concentration at 2 m and the m axim um photosynthetic ra te P*m (mg C m g-1 chi a h -1), and (f) PP in teg ra ted through the therm ocline against the product of chi a concentration at the subsurface chlorophyll m axim um (SCM) peak and cxinsitur the m axim um light utilisation coefficient (mg C m g-1 chi a h -1 [|rE m -2 s-1]-1). In all panels, solid circles indicate PP as estim ated for the cloudy day and open symbols for the rep resen tative sunny day. In (f), the triangles identify CS3 w here the therm ocline boundaries w ere poorly defined, and these data w ere not used in the regression analysis. Statistics show n are results of
m odel II regression
at B2a) where irradiance was higher, and chi a and ambient nitrate concentrations were lower.
Higher irradiances led to m arked increases in the estim ated 14C:15N 0 3“ uptake ratios (Fig. 9b). Daily 14C:15N 0 3~ uptake ratios were significantly lower for the SCM (N 03 >0.1 pM) than for the upper therm ocline (N 03 <0. 1 pM). Specifically, estim ated daily m ean 14C:15N 0 3“ uptake ratios were 1.3 to 3.6 and 2.1 to 5.4 moLmol for the SCM at Stns OB and CS3b, respectively, com pared to 31.8 to 64.1 and 8.0 to 11.0 moLmol in the upper thermocline at Stns OB and B2a, with upper and lower values in each case corresponding to assumed cloudy and sunny conditions. Thus a 4-fold increase in daily irradiance caused a 3-fold increase in the 14C:15N 0 3“ uptake ratio at the SCM and a 2-fold increase in the upper thermocline, with an 8-fold difference in the m ean ratio betw een the lower and upper thermocline. Despite the wide variations in the 14C:15N 0 3“ uptake
ratio, the m ean total POC:PON was 6.3 ± 1.1 (mol: mol, n = 4), close to the canonical Redfield C:N value of 6.6 (Redfield 1934). Cruise m ean particulate POC: PON was 7.5 ± 0.6, 6.9 ± 0.5 and 6.5 ± 0.4 (moLmol) for the surface (~2 m), upper thermocline and SCM, respectively (CS2005 only, n = 7 for each depth); POC:PON at the surface and SCM were significantly different (with 95 % confidence) according to 1-way analysis of variance.
Subsurface maxima in dissolved oxygen saturation were present in the upper part of the thermocline (Fig. 6) as observed for other regions of the NW European shelf seas (Richardson et al. 2000). Oxygen saturation levels were 104 ±1.0 % (n = 79) in the SML and 88 ± 0.8% (n = 79) in the BML, with subsurface maxima values up to 109 ± 4.3 % (n = 79). The degree of maximum oxygen super-saturation was weakly correlated with chi a concentration at the SCM (r2 = 0.53, n = 79), with relationships betw een these 2 para-

H ickm an et al.: Shelf sea prim ary production 49
Table 2. R anges in the w ater colum n (W C)-integrated prim ary production (PP) values for the surface m ixed layer (SML) and the therm ocline for cloudy and sunny irradiance conditions, 'a ' and 'b ' identify different
visits to the sam e location
StationD D ( m r r T-K-.-2 J - l Tide
SMLr r (ÏÏ1CJ U . UL a
Therm ocline Total WC
B2a 62 - 105 87 - 147 149 - 252 N eap - 3 dB2b 181 -3 0 9 67 - 181 248 -4 9 0 N eap + 1 dJB la 8 8 - 173 101 -3 0 3 189 -4 7 6 Spring - 3 dJB lb 139 - 222 95 - 189 234 -4 1 1 N eap - 1 dOB 1 1 0 - 2 1 1 42 - 138 152 -3 4 9 N eap + 3 dPI U l - 212 6 8 - 2 2 0 179 -4 3 2 N eapU2 132 - 249 42 - 122 174 - 371 Spring - 3 dCS1 71 - 148 42 - 149 113 - 297 SpringCS3a 80 - 157 6 6 - 2 2 2 146 -3 7 9 N eapCS3b 90 - 191 64 - 216 154 -4 0 7 N eap + 3 d
All shelf 106 - 198 67 - 189 174 -3 8 6
■ Cloudy □ Sunny
B2a B2b JB1a JB1b OB P1 U2 CS1 CS3a CS3bFig. 8. Percen tage contribution of prim ary production (PP) in th e therm ocline to the to tal w ater colum n (WC) production for all available locations
meters being stronger when data from individual stations were considered separately.
For the lower thermocline where nitrate concentrations were above the limit of instrument detection (>0.1 pM), concentrations of nitrate co-varied with AOU (Fig. 10). Outliers to this trend occurred at Stns U2 and PI, which exhibited narrower (U2) and broader (PI) thermoclines than elsewhere on the shelf (Figs. 6 & 10). At PI, outliers were due to anomalously low values of nitrate at the base of the thermocline on more than 1 CTD cast. At U2, very low AOU (around -65 pM) was associated with high chi a concentrations (up to 8.4 mg m-3) at the SCM. The slope of the regression between AOU and nitrate concentration was on average 8.3 (Fig. 10): since nitrate concentration and oxygen saturation in the BML were relatively consistent across the shelf, variations in the slope probably reflected peak oxygen concentration values which co-varied with chi a maxima.
DISCUSSION
Distribution of chi a
During the mid-summers of 2003 and 2005, the vertical distribution of chi a in the Celtic Sea was characterized by a subsur-
o
Fig. 9. Plots of 14C photosynthesis, 13C photosynthesis and 15N O y up take against irradiance for the subsurface chlorophyll m axim um (SCM) at Stn CS3b. (a) Eq. (3) is fitted to the data w here the in tercep t of the curve on the y-axis has been subtracted for the 13C and 14C curves, but not for 15N O y (see 'M aterials and m ethods'). The carbon and nitrate axes differ by the Redfield C:N ratio of 6.625, such tha t the up take conforms to Redfield stoichiom etry w here the curves intersect, (b) Ratio of 14C and 13C photosynthesis to 15N 0 3~ up take w ith irradiance via com parison of the fitted curves in (a). D ata have b een spectrally corrected so th a t irradiance corresponds to tha t in situ and th e vertical grey dashed lines rep resen t the m axim um in situ irradiance for
the represen tative cloudy and sunny day
100 200 300Irradiance (pE m_2s_1)
0 100 200 300Irradiance (pE rrr2s~1)
40 _cnz
30 -S S7CCD
2 0 S 'I10

50 M ar Ecol Prog Ser 463: 39-57 , 2012
^ 20
-20
A A-40
-60
0 5 10Nitrate (|jM)
Fig. 10. Dissolved oxygen (as apparen t oxygen utilisation, AOU) against n itrate concentration for all available stations. Statistics show n are the result of a linear m odel II regression (p « 0.001), although close inspection suggests tha t a nonlinear regression could also be applied. O utliers to th e correlation occurred at U2 (triangles) and PI (solid circles), w hich exhibited particularly narrow (U2) and b road (PI) therm o- clines (see 'Results' for explanation of outlying values). The
outliers are included in the regression statistics
face maximum (Fig. 2) located towards the base of the thermocline and on the nitracline (Figs. 2 & 3), reflecting the characteristic structure of seasonally stratified waters on the NW European shelf with a nutrient-depleted SML (Pingree et al. 1978, Richardson et al. 2000). When considered in terms of density, the vertical distributions of chi a and nitrate showed a similar pattern between locations and over time (Fig. 3). Levels of chi a in the SML away from frontal regions and coastal waters were in the range 0.2 to 0.5 mg m-3 and consistent with both previous observations (Pingree et al. 1976) and satellite estimates (Joint & Groom 2000). Higher values occur locally (for example, to the northwest of station PI, see Fig. lb) with occasional summer blooms, probably attributable to the widespread dinoflagellate Karenia mikimotoi (Holligan et al. 1984a), seen on satellite images (e.g. Fig. 3d,e in Joint & Groom 2000).
Maximum observed concentrations of chi a in the thermocline were in the range of 1 to 2 mg m-3 (Fig. 2a,b), with values >2 mg m-3 at some stations close to tidal fronts. How typical these values are for the Celtic Sea is difficult to assess, as few m easurements have been made previously and satellite sensors cannot detect the SCM. Estimates of water- column-integrated chi a from the Seasoar section (Fig. 2c) indicate that higher values (> 60 mg m-2) correspond to regions where concentrations at the SCM
were also relatively high (>1.5 mg m-3). There are several possible causes of variations in chi a concentrations within the thermocline, including: (1) differences in the degree of acclimation of the phytoplankton to low light (reflecting, in turn, the effects of clouds and water transparency on irradiance at the level of the SCM; Table 2), (2) differences in phytoplankton taxonomy (Hickman et al. 2009), (3) differences in nutrient supply from, or loss of phytoplankton standing stock to, the BML due to changes in mixing over seabed topography or with spring-neap tides (Sharpies et al. 2001b, Rippeth et al. 2005, Tweddle 2007), and (4) the effects of trophic interactions such as changes in grazing pressure or nutrient recycling (Taylor et al. 1986).
Comparison of the chi a data from the 2003 and 2005 PP stations (Table 1), to the distribution of chi a along the 2003 Seasoar section betw een the shelf edge and the tidal front (Fig. 2a-c) indicates that these stations are representative of the stratified region of the Celtic Sea in mid-summer.
Observed rates of primary production
Estimated rates of PP for the seasonally stratified region of the Celtic Sea were 174 to 386 mg C m-2 d_1, the range representing estimates for cloudy and sunny conditions (Table 2). These estimated rates are comparable with independent measurem ents performed on the 2003 cruise (Maranon et al. 2005) and, when variations in surface irradiance are taken into account, with earlier field observations in m idsummer (Joint & Pomroy 1983, Holligan et al. 1984b, Joint et al. 1986). Around half of the total water- column production occurred within the thermocline (Table 2, Fig. 8) with the thermocline contribution to total production increasing by 10% under sunny compared to cloudy conditions (Fig. 8). The assumed 4-fold contrast in daily incident irradiance between the cloudy and sunny conditions resulted in a 2-fold change in integrated production within the SML and a 3-fold change within the thermocline.
During summer, the vertical gradient in nutrient availability is a key determ inant of the distribution of phytoplankton and subsequently PP (Pingree et al. 1978, Holligan et al. 1984b). However, within this stratified regime, the most important factor governing observed day-to-day variability in PP was incident irradiance, particularly within the thermocline. The sensitivity of photosynthetic rates in the therm ocline to irradiance results from acclimation of the phytoplankton to low light (MacIntyre et al. 2002,

H ickm an et al.: Shelf sea prim ary production 51
Moore et al. 2006) not being sufficient to achieve P*m under in situ conditions (Fig. 5). Increased cellular chi a with depth was accompanied by expected changes in photosynthetic param eters (Fig. 4), so that photosynthetic rates within the thermocline were light-limited (Fig. 5) and showed a wider range b etween cloudy and sunny days than those within the SML. Differences in PP betw een stations were less than the differences betw een cloudy and sunny conditions for each station (Table 2, Fig. 7b). Thus, for the seasonally stratified Celtic Sea as a whole, day- to-day variability in sea surface irradiance is likely to affect PP at least as much as the observed variability in phytoplankton biomass (or physiology), which may result from, for example, spring-neap variability in nutrient supply (Sharpies et al. 2001b, Rippeth et al. 2005).
The correlation betw een integrated PP and chi a was significant only when the SML and thermocline were considered separately, as might be expected from known differences betw een these 2 layers with respect to taxonomy (Hickman et al. 2009) and photophysiological properties (Fig. 4). Layer-integrated rates of PP were more strongly dependent on P*m for surface water and a insitu for the thermocline. However, the observed variability in these 2 physiological param eters for depths at which they are important determ inants of rates of production (Fig. 4) could not be correlated with particular environm ental properties.
Based on the data presented in Table 2, the spatially-averaged water column PP during a summer stratified period of 120 d in the Celtic Sea is estim ated to be 21 to 46 g C m-2 yr“1 (assuming constant photophysiology), with the range representing the difference betw een persistently cloudy or sunny w eather conditions. Correspondingly, estimated PP within the seasonal thermocline is 8 to 23 g C m-2 yr-1, depending on irradiance. The total PP values are comparable to previous estimates for the summer
months (-50 g C m -2) based on monthly observations at a single mid-shelf station (Joint et al. 1986) or on satellite m easurem ents (Joint & Groom 2000) both of which are likely to be biased towards conditions of high surface irradiance. Inspection of the productivity profiles (Fig. 6) indicates that about half of the thermocline production can be attributed to the nitracline (lower thermocline).
Estimation of new production
The typical distribution of water properties across the seasonal thermocline in the Celtic Sea is illustrated schematically in Fig. 11. The SCM is situated in the lower thermocline on the upper nitracline, whilst, by contrast, the oxygen maximum is in the upper thermocline and at a depth where the nitrate concentration has reached its minimum value. This pattern is consistent with previous observations for summer stratified waters in the western English Channel and Celtic Sea (Holligan et al. 1984a,b) and in the North Sea (Richardson & Bo Pedersen 1998, Richardson et al. 2000). The data from the Celtic Sea demonstrate a correspondence betw een increasing nitrate and decreasing oxygen with depth across the chi a maximum (see Fig. 10). The presence of an oxygen saturation maximum indicates net production of oxygen within the thermocline with the potential for loss both to the BML (where oxygen is consumed by heterotrophs in water and sediments) and to the SML (where the oxygen level reflects the balance b etween biological processes and exchange with the atmosphere). Thus the distributions of both nitrate and oxygen provide information about rates of new production within the seasonal thermocline.
Previous estimates for new production in seasonally stratified waters on the NW European shelf have been based on indirect m easures of vertical mixing derived from m ean vertical fluxes of heat and salt
SMLMixingUT
BMLMixing
Fig. 11. Schem atic view of chlorophyll a (chi a, g reen line), nitrate concentrations (red line) and dissolved oxygen saturation (thick b lack line) th rough the thermocline. Horizontal solid lines and shaded region d efine the upper and low er boundaries of the therm ocline. The horizontal dotted lines indicate the limit of m ixing across the therm ocline boundaries, defining a 'surface m ixed layer (SML) m ixing' and 'bottom m ixed layer (BML) m ixing' region bounding a relatively stable 'm id '-region that is less affected by m ixing processes. The vertical dashed line indicates the sa tu ration level of dissolved oxygen in the SML. UT and LT refer to the upper and low er therm ocline regions in Table 3, as defined by the location of the nitracline

52 M ar Ecol Prog Ser 463: 39-57 , 2012
(Pingree & Pennycuick 1975, Holligan et al. 1984b), turbulence measurem ents (Sharpies et al. 2001b), oxygen budgets (Richardson et al. 2000) and estimates of the f-ratio from m easurem ents of 15N 0 3“ and 15NH4+ uptake (Weston et al. 2005) for the therm ocline. Here we consider an oxygen budget and estimates of nitrate uptake in the context of turbulence measurem ents (e.g. Rippeth et al. 2005) undertaken during the 2003 and 2005 cruises (Table 3).
M easurements of the nitrate gradient and of dia- pycnal mixing at the base of the thermocline give an upw ard flux of nitrate from the BML of 2 mmol N m“2 d“1 at Stn U2 (Sharpies et al. 2001b), and this value is considered to be a reasonable estimate for the wider Celtic Sea region (Tweddle 2007). The vertical nitrate profile indicates that this flux of 'new ' nitrate from the BML is fully utilised within the thermocline (Table 3). Since it depends on the vertical eddy diffu- sivity, the precise magnitude of the nitrate flux will vary with time, for example, in response to changes in tidal mixing, wind mixing or internal wave activity (Rippeth et al. 2005, Tweddle 2007, Palmer et al. 2008).
An oxygen 'surplus' in the thermocline was calculated by integrating oxygen saturation in excess of a linear gradient betw een saturation levels in the BML and SML. The oxygen surplus was, on average, 0.58 ± 1 mol 0 2 m“2 (n = 79). Assuming the dominance of
vertical mixing in these systems (Simpson & Hunter 1974, Palmer et al. 2008), a characteristic timescale for thermocline ventilation (f) can be estimated as t = L2/2KZ (Denman & G argett 1983), where L (m) is the mixing length scale and Kz (m2 s“1) is the vertical eddy diffusivity. Taking a typical value for therm ocline thickness, L = 25 m (Table 1), and vertical eddy diffusivity at the nitracline, Kz = 5 x IO“5 m2 s“1 (Sharpies et al. 2001b, Hickman et al. 2009) then the ventilation timescale is of the order of 70 d. Assuming steady state and Redfield stoichiometry, the oxygen surplus would thus be equivalent to a new production rate of 1 mmol N m“2 d“1 (Table 3). Given the assumptions in the calculation of the ventilation timescale (Denman & Gargett 1983), this value for new production is considered to be an order of m agnitude estimate.
Direct 15N 0 3“ uptake rates (Fig. 9) ranged from 77 to 130 pmol N m“3 d“1 for the SCM and 11 to 28 pmol N m“3 d“1 in the upper thermocline, with the lower values in the range corresponding to cloudy conditions. Observed rates of 15N 0 3“ uptake were equivalent to 0.9 to 1.2 mmol N m“2 d“1 for the lower thermocline (nitracline) and a value 10% of this magnitude for the upper thermocline, calculated from the m easured 15N 0 3“ uptake versus irradiance responses scaled by chi a and PAR through the thermocline (Table 3).
Given the different approaches and methodological caveats, the 3 independent indicators of the amount of production fuelled by nitrate from the BML for the Celtic Sea during summer lie within the range of estimates for total production for the therm ocline as a whole (Tables 2 & 3). To first order, it thus appears that all the estim ated PP within the thermocline could be fuelled by 'new ' nitrate from the BML. However, around half of the PP occurred in the upper thermocline where nitrate was depleted (Figs. 3 & 6) and production fuelled by regenerated (reduced) nitrogen species is likely to be significant (Le Corre et al. 1993, Weston et al. 2005). Thus, it appears that an 'excess' of nitrate is being assimilated on the nitracline relative to rates of photosynthetic carbon fixation (particularly under low light) and to C:N ratios for particulate organic m atter within this layer, even if there is no recycling of nitrogen. A similar excess in nitrate uptake can
Table 3. Sum m ary of therm ocline nitrate, oxygen and photosynthetic carbon fluxes (for details see 'Results'). C onversion of oxygen and carbon fluxes to units of n itrogen is based on Redfield stoichiometry. W here applicable, ranges indicate estim ates for cloudy and sunny conditions. Rates of 14C fixation are derived from Table 2, w here tha t in the low er therm ocline (LT), defined as the region w here n itrate concentrations w ere above the limit of detection (>0.1 pM, i.e. th e nitracline), accounts for 49 and 53 % of therm ocline prim ary production for cloudy and sunny conditions, respectively, and the rem ainder is attribu ted to the u pper therm ocline (UT). Rates of 15N O y up take in tegrated th rough the LT and UT are based on the light response of 15N O y up take m easu red in the UT and SCM, respectively, and account for gradients in chlorophyll a (chi a) and photosynthetically available radiation (PAR). A value for n itrogen flux derived from 14C fixation tha t exceeds tha t from 15N 0 3~ up take experim ents im plies utilisation of regenera ted forms of nitrogen. Conversely, values for n itrogen flux derived from 14C fixation tha t are low er th an values from 15N O y uptake imply an excess of nitrogen relative to carbon fixation, such
as occurs for the nitracline during cloudy conditions
Flux Fluxvalue
Equivalent N flux (mmol N
n r 2 d-1)
N 0 3 flux into therm ocline 2 mm ol N n r 2 d~4 2N et 0 2 production 8.6 mm ol 0 2 n r 2 d~4 115N O y uptake UT 0.10 - 0.12 mm ol N n r 2 d~1 0 .1 0 -0 .1 2
LT 0.9 - 1.2 mm ol N n r 2 d~4 0 .9 - 1.214C fixation UT 34 - 89 m g C n r 2 d~4 0 .4 -1 .1
LT 33 - 100 m g C m-2 d -1 0 1 CO

H ickm an et al.: Shelf sea prim ary production 53
be inferred from the earlier results of Holligan et al. (1984b) for Stn E5 in the southern Celtic Sea; the estim ated flux of nitrate into the seasonal thermocline (up to 2.2 mmol N m-2 d_1) was equivalent to new production accounting for more than half the total water column production (-30 mmol C m-2 d_1 under average surface irradiance), which again is a high proportion for a well stratified water column.
Three main conclusions can be drawn from the results summarised in Table 3.
(1) Given the inherent uncertainties in the observational and experimental procedures, estimates of 15N 0 3~ uptake, turbulent nitrate fluxes at the nitracline and net oxygen production give broadly consistent results. It would thus be difficult to justify attaching significance to any remaining differences between these estimates.
(2) In the upper thermocline, the m easured rates of 15N 0 3~ uptake account for about 30% of the nitrogen requirem ent of phytoplankton as indicated by 14C fixation (i.e. f-ratio = 0.3), a value that is consistent with other observations for surface, nitrate-depleted waters of shelf seas (Harrison 1990, Bjornsen et al. 1993, Weston et al. 2005).
(3) By contrast, in the SCM, 15N 0 3~ uptake is equal to or potentially exceeds the nitrogen requirem ent of phytoplankton carbon fixation even if it is assumed that no regenerated forms of nitrogen are being assimilated, which is highly unlikely (Le Corre et al. 1993, Weston et al. 2005). Much of the 'excess' 15N 0 3~ taken up can be accounted for by dark uptake (Fig. 9), as observed by Weston et al. (2005).
Confidence in our 15N 0 3~ uptake data for the SCM is provided by the parallel 13C and 14C fixation rates (Fig. 9), and by similarity to previous observations of 'excess' nitrate removal within the SCM of both shelf sea (Bjornsen et al. 1993) and oceanic environments (Painter et al. 2007). In addition, as mentioned above, the estimated 15N 0 3~ uptake at the nitracline is equal to or less than the nitrate flux estimated from turbulence measurem ents (Sharpies et al. 2001b).
We acknowledge the potential for significant error in estimates of biological rates within discrete layers associated with strong gradients in environmental param eters such as light and nitrate. For example, the C:N uptake ratio for SCM phytoplankton is dependent on light intensity (Fig. 9) and a doubling of the estimated m ean light level would bring the 14C:15N 0 3~ uptake ratio for the Celtic Sea SCM close to the Redfield ratio, again assuming that no regenerated forms of nitrogen are being utilised. A discrepancy of this magnitude appears unlikely, although vertical movement of the thermocline (Fig. 2d,e) can
potentially account for some changes in irradiance for phytoplankton in the SCM. Similarly, data p resented by Painter et al. (2007) over a broad layer betw een the 1.0 and 0.1% irradiance levels along a meridional section across the Atlantic Ocean suggest that anomalously low C:N uptake ratios cannot be explained by a systematic error in light m easurements. Other possible sources of error, including differences in the timescales for turnover of carbon and nitrogen, extrapolation of short-term (hours) m easured rates of uptake to daily rates and underestim ation of carbon fixation when chi a levels are low, were also discussed by Le Bouteiller (1993).
Despite such uncertainties, the presented data still suggest that more nitrate is being removed within the nitracline than can be accounted for by photo- synthetically-fixed carbon. Moreover, this discrepancy is greatest under low light (cloudy conditions). The apparent excess in nitrate utilisation is unlikely to be fully explained by conversion of nitrate to dissolved organic nitrogen (DON) (Bronk & Ward 2005), as has been suggested for the nitracline in oceanic waters (Painter et al. 2007), as some parallel dissolved organic carbon (DOC) release must also occur. Indeed, within the studied system, DOC excretion is around 20% of PP (Maranon et al. 2005).
One likely explanation for the relatively high up take rates of nitrate in the Celtic Sea thermocline is utilisation by heterotrophic bacteria (Allen et al. 2001, 2002, Zubkov et al. 2001, Wawrik et al. 2012). Heterotrophic bacteria are likely to have a higher requirem ent for dissolved inorganic nitrogen when utilising carbon-rich (relative to their composition) particulate or dissolved organic m atter (Kirchman 2000), with the nutrient-poor summer surface layer and upper thermocline a highly likely source of such material, as indicated by the observed higher POC:PON observed in the SML compared to SCM. A summer nitracline receiving sinking particulate matter, or a diffusive flux of dissolved organic m atter, from these overlying waters is thus likely to provide a favourable environment for such organisms. Any nitrate derived nitrogen assimilated by bacteria would likely be readily incorporated into the rest of the planktonic food chain via ingestion by het- erotrophs or mixotrophic eukaryotic phytoplankton (Raven 1997, Mitra & Flynn 2010, Ward et al. 2011, Hartmann et al. 2012). Considerable evidence now exists for the quantitative importance of mixotrophy within marine nutrient- and light-limited environments (see Mitra & Flynn 2010, Ward et al. 2011), but how this process affects rates of PP (by acting as an alternative source of nutrients through bactivory)

54 M ar Ecol Prog Ser 463: 39-57 , 2012
or relates to the estimation of new production (by providing an alternative route for nitrate assimilation) is not well understood. Furthermore, direct n itrate assimilation by SCM phytoplankton increases with irradiance (Fig. 10) so that, under sunny conditions, mixotrophy is likely to become less important in m eeting the nitrogen requirem ents of photosynthetic organisms.
The dynamics of carbon fixation and nutrient uptake (as well as nutrient regeneration) within ther- moclines characterized by strong gradients in both light and nutrients and by varying irradiance due to clouds (Banse 1987) are bound to be complex. At the community level, it is perhaps unsurprising that uptake of excess nitrate under low light might be balanced by excess carbon under high light (Fig. 9), and/or by excretion of nitrogenous compounds. Within the layered system represented by the highlight, low-nitrate upper and low-light, high-nitrate lower thermocline (Fig. 11), downward transfer of high C:N organic material or upward transfer of low C:N material can be speculated to contribute to this balance.
Wider ecological implications
The main focus of this paper was to determ ine the importance of the seasonal thermocline for PP and to estimate the proportion of PP in summer that can be considered to be fuelled by 'new ' nitrogen. In the Celtic Sea, around half of the summer PP occurs within the thermocline (Table 2, Fig. 8), and of this fraction, about half can be attributed to the lower thermocline (Fig. 6, Table 3), where nitrate is available for phytoplankton growth. Thus new production potentially contributes up to 25% of water column PP. Representative values of 80 to 160 mg C m-2 d_1 for new production (Table 3) are equivalent to a total of -10 to 19 g C m-2 for a summer period of 120 d. The equivalent new production in the spring bloom, assuming that the initial nitrate concentration is 8 pM, that the average depth of the nitrate- depleted surface layer is 25 m and that the C:N for phytoplankton is 6.625 (Redfield ratio), is 18.5 g C m-2. On this basis, summer new production in the Celtic Sea is of a similar magnitude to (and most likely around half) that associated with the spring bloom.
By comparison, a thermocline oxygen budget based on replenishm ent over a spring-neap tidal cycle within a frontal region just north of the Dogger Bank in the North Sea (Richardson et al. 2000) resulted in a
value for summer new production of 160 to 320 mg C m-2 d_1, again comparable to the spring bloom. A later study in the same area by Weston et al. (2005) reported that on average 58% (equivalent to 424 mg C m-2 d_1) of the water column PP (14C) occurred within the chi a maximum layer, with the f-ratio (derived from 15N 0 3- /15N 0 3-+15NH4+ from 15N uptake experiments) varying betw een 0.11 and 0.48. These relatively low f-ratios suggest that regenerated sources of nitrogen were relatively important compared to nitrate. Physical conditions and associated assumptions need to be considered when comparing these Celtic and North Sea estimates. In particular, for the frontal region of the North Sea, nutrient fluxes and thermocline ventilation were attributed to tidal pumping of bottom water during frontal migration over the neap-spring tidal cycle.
Variations in environmental forcing will modify the balance of processes within the thermocline, causing changes to the precise locations of primary and new production (Taylor et al. 1986), and the chi a, nitrate and dissolved oxygen profiles (Figs. 6 & 11). The feedbacks betw een biological (e.g. acclimation, growth, predation) and physical (e.g. mixing, nitrate flux) processes within the thermocline are complicated and act on different timescales. For example, enhanced nitrate supplied during periods of increased turbulent mixing around spring tides (Sharpies et al. 2001b, Rippeth et al. 2005) may not be immediately assimilated by phytoplankton, particularly if coincident with cloudy weather (Banse 1987) and/or stripping of standing stock of phytoplankton and other microbes to the BML (Sharpies et al. 2001b,2007). This situation could increase chi a and nitrate concentrations higher up in the density gradient, such as observed at Stns B2a and CS3a (Fig. 3). The amount of nitrate uptake relative to carbon fixation may thus, for example, be greatest during cloudy spells that follow spring tides compared to sunny periods following neaps. However, despite the range of tidal and irradiance conditions experienced during this study, processes within the thermocline were always sufficient to fully utilise the nitrate supplied from the BML so that none could be observed reaching the SML (Banse 1987). Further, the slope of the regression between nitrate and AOU of 8.3 (Fig. 10) indicates that, on average, these elements were cycled in close to Redfield proportions.
In contrast to the direct sensitivity of summertime carbon fixation to surface irradiance, the irradiance control on new production is less clear. The m agnitude of new production is determ ined by the nitrate flux from the BML, which in turn depends on the ver-

H ickm an et al.: Shelf sea prim ary production 55
tical eddy diffusivity and, thus, physical mixing conditions. In addition, the nitrate flux also depends on the nitrate gradient (Sharpies et al. 2001b) and may subsequently be affected by irradiance as a result of light-driven changes in photosynthetic rates (and nitrate uptake) at the nitracline. However, the effect of changes in the nitrate gradient on the flux is likely to be small compared to variations in mixing.
CONCLUSIONS
We have shown that the average PP for the seasonally stratified Celtic Sea was 170 to 390 mg C m-2 d-1, of which 40 to 50% occurred within the thermocline. Of the equivalent seasonal production, 10 to 19 g C m-2 was fuelled by new nitrate from the BML, which represents 25 % of summer PP and is around half that expected for the spring bloom. The main control on day-to-day variability in the m agnitude of summer PP was incident surface irradiance. Although variability in nutrient fluxes from the BML into the seasonal thermocline is likely to influence PP, the form of this response is far from clear. Not only do physical processes (e.g. mixing by tides, internal waves, wind) and biological processes (phytoplankton growth and loss) interact over various scales within a stratified system, but important biological feedbacks on the distributions of environmental properties such as vertical gradients in nutrients and light remain poorly parameterized. Reliable prediction of ecosystem re sponses to external forcing will depend on new m easurements and numerical models (e.g. Taylor et al. 1986, Allen et al. 2004) taking careful account of thermocline structure as illustrated in Fig. 11 and addressing key biological processes, such as the potential effects of vertically migrating organisms, heterotrophic nitrate uptake, mixotrophy and grazing within the SCM, on the transformation and re distribution of nutrients in the water column.
A cknow ledgem en ts. We th an k Y.N. Kim and M. Q urban for nutrient data collection and D. Purdie for oxygen m easu rem ents at sea, as w ell as S. Painter, A. Poulton and R. H ead for the ir help w ith analyses in the laboratory. We also thank the officers and crew of the RRS 'Jam es C lark Ross' (JR98) and RRS 'C harles D arw in' (CD173) for the ir support at sea. Satellite im ages w ere provided by the NERC E arth O bservation D ata Acquisition and A nalysis Service (NEODAAS) at Plym outh M arine Laboratory (UK). T hanks also to the anonym ous review ers w hose com m ents im proved on an earlier version of this m anuscript. This w ork w as supported by the N atural E nvironm ent R esearch Council (NERC) UK, through grant num bers NER/A/S/2001/00449, NE/H015930/2 and a NERC studentship to A.E.H.
LITERATURE CITED
Allen AE, Booth MG, Frischer ME, Verity PG, Zehr JP, Zani S (2001) Diversity and detection of n itrate assim ilation genes in m arine bacteria. A ppl Environ Microbiol 67:5343-5348
Allen AE, H ow ard-Jones MH, Booth MG, Frischer ME, Verity PG, Bronk DA, Sanderson MP (2002) Im portance of heterotrophic bacteria l assim ilation of am m onium and n itrate in the B arents Sea during sum mer. J M ar Syst 38:93-108
► Allen JI, Siddorn JR, Blackford JC, G ilbert FJ (2004) T urbulence as a control on the m icrobial loop in a tem perate seasonally stratified m arine system s model. J Sea Res 52:1-20
> . Banse K (1987) Clouds, deep chlorophyll m axim a and the nutrient supply to the m ixed layer of stratified w ater bodies. J P lankton Res 9:1031-1036
Bjornsen PK, Kaas H, Kaas H, N ielsen TG, O lsen M, Richardson K (1993) Dynamics of a subsurface phytoplankton m axim um in the Skagerrak. M ar Ecol Prog Ser 95:279-294
> . Boum an HA, Platt T, S athyendranath S, Irwin BD, W ernand MR, Kraay GW (2000) Bio-optical p roperties of the su b tropical N orth A tlantic. II. Relevance to m odels of prim ary production. M ar Ecol Prog Ser 200:19-34
B rew er PG, Riley JP (1965) The autom atic determ ination of nitrate in sea w ater. D eep-Sea Res I 12:765-772
> . B ricaud A, Stram ski D (1990) Spectral absorption coefficients of living phytoplankton and nonalgal biogenous m atter: a com parison betw een the Peru upw elling area and the Sargasso Sea. Limnol O ceanogr 35:562-582
Bronk DA, W ard BB (2005) Inorganic and organic nitrogen cycling in the Southern California Bight. D eep-Sea Res I 52:2285-2300
C ochlan WP, H arrison PJ, D enm an KL (1991) Diel periodicity of n itrogen up take by m arine phytoplankton in n itrate-rich environm ents. Limnol O ceanogr 36: 1689-1700
> . D enm an KL, G argett AE (1983) Time and space scales of vertical m ixing and advection of phytoplankton in the upper ocean. Limnol O ceanogr 28:801-815
D ickey-Collas M, G ow en RJ, Fox C J (1996) D istribution of larval and juven ile fish in the W estern Irish Sea: re la tionship to phytoplankton, Zooplankton biom ass and recu rren t physical fea tures. M ar F reshw Res 47:169-181
> . D ugdale RC, G oering J J (1967) U ptake of new and reg en e rated forms of n itrogen in prim ary productivity. Limnol O ceanogr 12:196-206
Fasham MJR, H olligan PM, Pugh PR (1983) The spatial and tem poral developm ent of the spring phytoplankton bloom in the Celtic Sea, A pril 1979. Prog O ceanogr 12:87-145
G libert PM, C apone DG (1993) M ineralization and assim ilation in aquatic, sedim ent and w etland systems. In: Knowles R, B lackburn TH (eds) N itrogen isotope tech niques. A cadem ic Press, San Diego, CA, p 243-272
H alsey KH, M illigan AJ, B ehrenfeld M J (2010) Physiological optim ization underlies grow th ra te-independen t chlorophyll-specific gross and net prim ary production. Photo- synth Res 103:125-137
> . H arrison WG (1990) N itrogen utilization in chlorophyll and prim ary productivity m axim um layers: an analysis based on the f-ratio. M ar Ecol Prog Ser 60:85-90

56 M ar Ecol Prog Ser 463: 39-57 , 2012
H artm ann M, Grob C, Tarran GA, M artin AP, Burkill PH, Scanlan DJ, Zubkov MV (2012) M ixotrophic basis of A tlantic oligotrophic ecosystems. Proc N atl A cad Sei USA 109:5756-5760
> . H eath MR, B eare DJ (2008) N ew prim ary production in northw est E uropean shelf seas, 1960-2003. M ar Ecol Prog Ser 363:183-203
H ickm an AE, H olligan PM, M oore CM, Sharpies J, Krivtsov V, Palm er MR (2009) D istribution and chrom atic ad ap ta tion of phytoplankton w ithin a shelf sea therm ocline. Limnol O ceanogr 54:525-536
H olligan PM, H arris RP, N ew ell RC, H arbour DS and others (1984a) Vertical distribution and partitioning of organic carbon in mixed, frontal and stratified w aters of the E nglish C hannel. M ar Ecol Prog Ser 14:111-127
H olligan PM, Williams PJ, Purdie D, H arris RP (1984b) Photosynthesis, respiration and n itrogen supply of plankton populations in stratified, frontal and tidally m ixed shelf w aters. M ar Ecol Prog Ser 17:201-213
Jassby AD, Platt T (1976) M athem atical form ulation of the relationship betw een photosynthesis and light for phytoplankton. Limnol O ceanogr 21:540-547
> . Joint IR, Groom SB (2000) Estimation of phytoplankton production from space: current status and future potential of satellite rem ote sensing. J Exp M ar Biol Ecol 250:233-255
> . Joint IR, Pomroy A J (1983) Production of p icoplankton and sm all nanoplankton in the Celtic Sea. M ar Biol 77:19-27
> . Joint IR, O w ens NJP, Pomroy A J (1986) Seasonal production of photosynthetic p icoplankton and nanoplankton in the Celtic Sea. M ar Ecol Prog Ser 28:251-258
K irchm an DL (2000) U ptake and regeneration of inorganic nutrients by m arine hetero trophic bacteria. In: Kirchm an DL (ed) M icrobial ecology of th e oceans. John Wiley, H oboken NJ, p 261-288
Kirk JTO (1994) Light and photosynthesis in aquatic ecosystems. C am bridge U niversity Press, C am bridge
Lavin A, V aldes L, Sanchez F, A baunza P and others (2006) The Bay of Biscay: the encountering of the ocean and shelf. In: Robinson AR, Brink K (eds) The sea. Vol 14B: th e global coastal ocean: interdisciplinary regional s tud ies and synthesis. H arvard University Press, Cam bridge, MA, p 1003-1031
Le Bouteiller A (1993) C om parison of in-bottle m easu rem ents using 15N and 14C. ICES J M ar Sei 197:121-131
> . Le Corre P, L 'H elguen S, W afar M (1993) N itrogen source for up take by G yrodinium cf. aureolum in a tida l front. Limnol O ceanogr 38:446-451
M acIntyre HL, K ana TM, A nning T, G eider RJ (2002) Photoacclim ation of photosynthesis irradiance response curves and photosynthetic pigm ents in m icroalgae and cyanobacteria. J Phycol 38:17-38
> . M aranon E, C erm eño P, Perez V (2005) C ontinuity in the photosynthetic production of dissolved organic carbon from eutrophic to oligotrophic w aters. M ar Ecol Prog Ser 299:7-17
M itra A, Flynn KJ (2010) M odelling m ixotrophy in harm ful algal blooms: m ore or less th e sum of the parts? J M ar Syst 83:158-169
M oore CM, Suggett DJ, H ickm an AE, Kim YN and others(2006) Phytoplankton photoacclim ation and photoadaptation in response to environm ental g radients in a shelf sea. Limnol O ceanogr 51:936-949
M orel A, A ntoine D, Babin M, D andonneau Y (1996) M easu red and m odeled prim ary production in th e northeast A tlantic (EUMELI JG OFS program): the im pact of n a t
ural variations in photosynthetic param eters on m odel predictive skill. D eep-Sea Res I 43:1273-1304
> . M uller-K arger FE, V arela R, Thunell R, Luerssen R, H u C, Walsh J J (2005) The im portance of continental m argins in the global carbon cycle. G eophys Res Lett 32:L01602 doi:10.1029/2004GL021346
Painter SC, Sanders R, Poulton AJ, W oodw ard EMS, Lucas MI, C ham berlain K (2007) N itrate up take at photic zone depths is not im portant for export in the subtropical ocean. G lobal Biogeochem Cycles 2LGB4005 doi:1029/ 2006GB002807
> Palm er MR, R ippeth TP, Sim pson JH (2008) An investigation of in ternal m ixing in a seasonally stratified shelf sea. J G eophys Res 113:C12005 doi:10.1029/2007JC004531
^ Pingree RD, Pennycuick L (1975) Transfer of heat, fresh w ater and nutrients th rough the seasonal therm ocline. J M ar Biol Assoc UK 55:261-274
Pingree RD, H olligan PM, M ardell GT, H ead RN (1976) The influence of physical stability on spring, sum m er and autum n phytoplankton blooms in the Celtic Sea. J M ar Biol Assoc UK 56:845-873
Pingree RD, H olligan PM, M ardell GT (1978) The effects of vertical stability on phytoplankton distributions in the sum m er on the northw est E uropean Shelf. D eep-Sea Res 25:1011-1028
Poulton AJ, Sanders R, H olligan PM, Stinchcom be MC, A dey TR, Brown L, C ham berlain K (2006) Phytoplankton m ineralization in th e tropical and subtropical A tlantic Ocean. G lobal Biogeochem Cycles 20:1-10
> . Raven JA (1997) Phagotrophy in phototrophs. Limnol O ceanogr 42:198-203
Redfield AC (1934) O n the proportions of organic derivatives in sea w ater and the ir relation to the composition of plankton. In: D aniel JR (ed) Jam es Johnson m em orial volume. Liverpool University Press, Liverpool, p 179-192
R ichardson K, Bo Pedersen F (1998) Estim ation of new p ro duction in the N orth Sea: consequences for tem poral and spatial variability of phytoplankton. ICES J M ar Sei 55:574-580
> . R ichardson K, Visser AW, Bo Pederson F (2000) Subsurface phytoplankton blooms fuel pelagic production in the N orth Sea. J P lankton Res 22:1663-1671
> . R ippeth TR, Palm er MR, Sim pson JH , F isher NR, Sharpies J(2005) Therm ocline m ixing in sum m er stratified contin en ta l shelf seas. G eophys Res Lett 32:L05602 doi:10. 1029/2004GL022104
^ Robinson C, Tilstone GH, Rees AP, Smyth TJ and others (2009) C om parison of in vitro and in situ p lankton p ro duction determ inations. A quat M icrob Ecol 54:13-34
Rodhe J, Tett P, Wulff F (2006) The Baltic and N orth Seas: a regional review of som e im portant physical-chem ical- biological interaction processes. In: Robinson AR, Brink K (eds) The sea. Vol 14B: the global coastal ocean: in terdisciplinary regional studies and synthesis. H arvard University Press, C am bridge, MA, p 1033-1075
Scott BE, Sharpies J, Ross ON, W ang J, Pierce GJ, Cam- phuysen CJ (2010) Sub-surface hotspots in shallow seas: fine-scale lim ited locations of top predato r foraging h ab ita t indicated by tidal m ixing and sub-surface chlorophyll. M ar Ecol Prog Ser 408:207-226
Sharpies J, Holligan P (2006) Interdisciplinary studies in the Celtic Seas. In: Robinson AR, Brink K (eds) The sea. Vol 14B: the global coastal ocean: interdisciplinary regional studies and synthesis. H arvard University Press, C am bridge, MA, p 1003-1031

H ickm an et al.: Shelf sea prim ary production 57
Sharpies J, M oore CM, R ippeth TR, Holligan PM, H ydes DJ, Fisher NR, Sim pson JH (2001a) In ternal tide dissipation, mixing, and vertical n itrate flux at the shelf edge of NE N ew Zealand. J G eophys Res 106:14069-14081
Sharpies J, M oore C, A braham ER (2001b) Phytoplankton distribution and survival in th e therm ocline. Limnol O ceanogr 46:486-496
Sharpies J, Ross ON, Scott BE, G reenstreet SPR, Fraser H(2006) In ter-annual variability in the tim ing of stratification and the spring bloom in the N orth-w estern N orth Sea. Cont Shelf Res 26:733-751
Sharpies J, Tweddle JF, G reen JAM , Palm er MR and others(2007) S p ring -neap m odulation of in ternal tide mixing and vertical n itrate flux at a shelf edge in sum mer. Limnol O ceanogr 52:1735-1747
> . Sim pson JH , H unter JR (1974) Fronts in the Irish Sea. N ature 250:404-406
> . Tassan S, F errari GM (1995) A n alternative approach to absorption m easurem ents of aquatic particles re ta ined on filters. Limnol O ceanogr 40:1358-1368
Taylor AH, H arris JRW, A iken J (1986) The interaction of physical and biological processes in a m odel of the vertical distribution of phytoplankton u nder stratification. Elsevier O ceanogr Ser 42:313-330
Tilstone GH, Figueiras FG, Ferm in EG, A rbones B (1999) Significance of nanophytoplankton photosynthesis and prim ary production in a coastal upw elling system (Ria de Vigo, NW Spain). M ar Ecol Prog Ser 183:13-27
Tilstone GH, Figueiras FG, Lorenzo LM, A rbones B (2003) Phytoplankton composition, photosynthesis and prim ary production during different hydrographic conditions at
Editorial responsibility: Graham Savidge,Portaferry, UK
the N orthw est Iberian upw elling system. M ar Ecol Prog Ser 252:89-104
> . Tsunogai S, W atanabe S, Sato T (1999) Is there a 'continental shelf pum p ' for the absorption of atm ospheric C 0 2? Tellus Ser B C hem Phys M eteorol 51:701-712
Tw eddle JF (2007) N utrient fluxes into the seasonal therm ocline of the Celtic Sea. PhD thesis, U niversity of Southam pton
W ard BA, D utkiewicz S, Barton AD, Follows M J (2011) Biophysical aspects of resource acquisition and com petition in algal mixotrophs. Am N at 178:98-112
W awrik B, Boling WB, Van N ostrand JD, Xie J, Zhou J, Bronk DA (2012) Assimilatory n itrate utilization by b acteria on the W est Florida Shelf as determ ined by stable isotope probing and functional m icroarray analysis. FEMS M icrobiol Ecol 79:400-411
> . Weiss RF (1970) The solubility of nitrogen, oxygen and argon in w ater and seaw ater. D eep-Sea Res O ceanogr A bstr 17:721-735
> . W elschm eyer NA (1994) Fluorom etric analysis of chlorophyll a in the presence of chlorophyll b and pheopig- ments. Limnol O ceanogr 39:1985-1992
W eston K, F ernand L, Mills DK, D elahunty R, Brown J (2005) Primary production in the deep chlorophyll m axim um of the central N orth Sea. J P lankton Res 27:909-922
Williams PJB (1993) On the definition of p lankton production term s. ICES J M ar Sei 197:9-19
Zubkov MV, Fuchs BM, Burkill PH, A m ann R (2001) Com parison of cellular biom ass and specific activities of dom inant bacterioplankton groups in stratified w aters of the Celtic Sea. A ppl Environ M icrobiol 67:5210-5218
Subm itted: N ovem ber 21, 2011; A ccepted: M ay 22, 2012 Proofs received from author(s): A u g u s t 15, 2012