A Study of Latent Heat of Vaporization
in Aqueous Nanofluids
by
Soochan Lee
A Dissertation Presented in Partial Fulfillment
of the Requirements for the Degree
Doctor of Philosophy
Approved June 2015 by the
Graduate Supervisory Committee:
Patrick E. Phelan, Co-Chair
Carole-Jean Wu, Co-Chair
Robert Wang
Liping Wang
Robert A. Taylor
Ravi Prasher
ARIZONA STATE UNIVERSITY
August 2015

i
ABSTRACT
Nanoparticle suspensions, popularly termed “nanofluids,” have been extensively
investigated for their thermal and radiative properties. Such work has generated great
controversy, although it is arguably accepted today that the presence of nanoparticles rarely
leads to useful enhancements in either thermal conductivity or convective heat transfer. On
the other hand, there are still examples of unanticipated enhancements to some properties,
such as the reported specific heat of molten salt-based nanofluids and the critical heat flux.
Another largely overlooked example is the apparent effect of nanoparticles on the effective
latent heat of vaporization (hfg) of aqueous nanofluids. A previous study focused on
molecular dynamics (MD) modeling supplemented with limited experimental data to
suggest that hfg increases with increasing nanoparticle concentration.
Here, this research extends that exploratory work in an effort to determine if hfg of
aqueous nanofluids can be manipulated, i.e., increased or decreased, by the addition of
graphite or silver nanoparticles. Our results to date indicate that hfg can be substantially
impacted, by up to ± 30% depending on the type of nanoparticle. Moreover, this
dissertation reports further experiments with changing surface area based on volume
fraction (0.005% to 2%) and various nanoparticle sizes to investigate the mechanisms for
hfg modification in aqueous graphite and silver nanofluids. This research also investigates
thermophysical properties, i.e., density and surface tension in aqueous nanofluids to
support the experimental results of hfg based on the Clausius - Clapeyron equation. This
theoretical investigation agrees well with the experimental results. Furthermore, this
research investigates the hfg change of aqueous nanofluids with nanoscale studies in terms
of melting of silver nanoparticles and hydrophobic interactions of graphite nanofluid. As a

ii
result, the entropy change due to those mechanisms could be a main cause of the changes
of hfg in silver and graphite nanofluids.
Finally, applying the latent heat results of graphite and silver nanofluids to an actual
solar thermal system to identify enhanced performance with a Rankine cycle is suggested
to show that the tunable latent heat of vaporization in nanofluilds could be beneficial for
real-world solar thermal applications with improved efficiency.
iii
ACKNOWLEDGMENTS
First of all, I would like to thank my wife, Hyewon Shin, and my boy, Matthew H.
Lee, for supporting me to pursue the PhD. Without their help and love, I could not finish
my degree. Second, special thanks to co-chair, Dr. Patrick E. Phelan for giving me an
opportunity to start solar thermal research at Arizona State University and offering me
valuable comments and ideas to develop my work during my PhD. I would also like to
express my gratitude to co-chair, Dr. Carole-Jean Wu for spending valuable time to provide
feedback and giving me the constant guidance and support, which have been helpful to
improve my research. I would also like to acknowledge the rest of my committee members
Dr. Robert Wang, Dr. Liping Wang, Dr. Robert A. Taylor, and Dr. Ravi Prasher for sharing
their ideas and advising me throughout this process. Based on all committee members’
comments, this work could be possible. I would also like to thank my lab mates, Andrey,
Carlos, Nick, Turki, and Sami for giving me their constant support and help to improve my
PhD work. Finally, I would like to thank my family, professors, and friends in Korea for
giving me their constant support during my PhD and this dissertation has been possible due
to so many people, who I may not be able to list here.

iv
TABLE OF CONTENTS
Page
LIST OF TABLES ............................................................................................................. vi
LIST OF FIGURES .......................................................................................................... vii
NOMENCLATURE ......................................................................................................... xii
CHAPTER
1. INTRODUCTION ...........................................................................................................1
1.1 Nanofluids ............................................................................................................2
1.2 Latent Heat of Vaporization in Pure Water .........................................................2
1.3 Historical Attempts to Manipulate the Latent Heat .............................................3
1.4 Volumetric Solar Thermal Collector ...................................................................9
1.5 Motivation ..........................................................................................................11
1.6 Research Goals...................................................................................................15
2. EXPERIMENTAL INVESTIGATION OF THE LATENT HEAT OF
VAPORIZATION IN AQUEOUS NANOFLUIDS ..........................................................17
2.1 Experimental Setup and Procedure ....................................................................17
2.2 Experimental Method.........................................................................................23
2.3 Experimental Results and Discussion ................................................................28
2.4 Summary ............................................................................................................43
3. MEASUREMENT OF THERMOPHYSICAL PROPERTIES FOR LATENT HEAT OF
VAPORIZATION IN AQUEOUS SILVER AND GRAPHITE NANOFLUIDS ............44

v
CHAPTER Page
3.1 Clausius-Clapeyron Equation for hfg ..................................................................44
3.2 Theoretical Results and Discussion ...................................................................50
4. NANOSCALE STUDIES FOR LATENT HEAT OF VAPORIZATION IN AQUEOUS
NANOFLUIDS ..................................................................................................................53
4.1 Low Temperature Melting of Silver Nanoparticles in Subcooled and Saturated
Pure Water .................................................................................................................54
4.1.1 Surface Melting of Silver Nanoparticles in Water ........................................56
4.1.2 Hamaker Constant for Surface Melting-Based Aqueous Nanofluid .............59
4.1.3 Experimental Approach and Discussion .......................................................67
4.1.4 Summary .......................................................................................................77
4.2 Hydrophobic Interactions of Graphite Nanoparticles in Saturated Water .........78
5. SOLAR THERMAL APPLICATION ...........................................................................81
5.1 Vapor Power Systems - Rankine Cycle .............................................................81
5.2 Nanofluid-Based Solar Thermal Collector ........................................................82
5.3 Nanofluid-Based Solar Thermal Storage ...........................................................87
6. CONCLUSIONS AND SUGGESTIONS FOR FUTURE WORK ...............................89
REFERENCES ..................................................................................................................91
APPENDIX
A Reflectance and Thermal Loss Calculations ……………….….……………………….……..97
B Uncertainty Calculation for the Experimantal Results………………...………...………...101

vi
LIST OF TABLES
Table Page
1. Review of Latent Heat of Nanofluids [20] ........................................................5
2. Values of Latent Heat of Vaporization in Aqueous Nanofluids ........................9
3. The Values of All Three Terms on the RHS of Eq. (27), for the Laser
Experiment Shown in Fig. 8 (a), Where tF = 20 min and 0.1% Volume Fraction
Nanofluid. ........................................................................................................26
4. The Values of All Three Terms on the RHS of Eq. (2), for the Hot Wire
Experiment with a Heat Gun Shown in Fig. 8 (b), Where tF = 20 min and 0.1%
Volume Fraction of Nanofluids. ......................................................................27
5. The Values of All Three Terms on the RHS of Eq. (2), for the Hot Wire
Experiment with a Well-Insulated Sample Shown in Fig. 8 (c), Where tF = 5
min and 0.1% Volume Fraction of Nanofluids (Zero Background Vapor Mass
Generation) ......................................................................................................28
6. The Results of hfg in Fluids Using a Laser .......................................................29
7. The Results of hfg in Fluids Using a Hot Wire ................................................30
8. The Results of hfg in Fluids without a Heat Gun ..............................................32
9. The Measured (Averaged) and Extrapolated Surface Tension Results of
Fluids................................................................................................................50
10. The Theoretical Results of hfg in Nanofluids and Pure Water with Surfactant,
Based on Eq. (13) .............................................................................................51

vii
11. Parameters for the Calculation of the Temperature-Dependent Dielectric
Permittivity of Solid and Liquid Silver (Melting Temperature is Calculated
Based on the Eq. in Fig. 16. .............................................................................65
12. Calculated Hamaker Constant Values A132 zJ (zepto Joule, 10-21) at the
Melting Temperature of Various-Sized Silver Nanoparticles in Subcooled
(25°C) Water. ...................................................................................................66
Table Page

viii
LIST OF FIGURES
Figure Page
1. The Enhancement of hfg of Water as a Function of the Volume Fraction and the
Platinum Nanoparticle Size based on Molecular Dynamics (MD) Simulations
[7] .......................................................................................................................4
2. Thermal Resistance Network of a Conventional Solar Thermal Plant and a
Nanofluid-Based Volumetric Solar Thermal Plant [15]. .................................10
3. Schematic of Solar Steam Generation based on Nanoparticles [17] ...............12
4. Vapor Generation around Graphite Nanoparticles in Water with a Laser
Irradiance of 770 W/cm2. Dashed Circles Indicate Separated High
Concentrations of Graphite Nanoparticles [16]. ..............................................13
5. Suggested Volumetric Solar Thermal System Using Nanofluids ....................14
6. Experimental Setup for Measuring the Latent Heat of Vaporization in
Nanofluids with (a) Laser-Based Heating, (b) Hot Wire-Based Heating ........18
7. Experimental Setup – Taken Using a Digital Camera .....................................19
8. Schematic Diagram for (a) Laser and a Heat Gun, (b) A Hot Wire and a Heat
Gun, (c) a Hot Wire and Well-Insulated Sample, (D) Boiling Experiments
Procedure .........................................................................................................21
9. Visual Images Exposed to Laser Beam (a) Prepared Nanofluids with Pure Water
(b) Bubbles in Test Cells during the Experiments ...........................................22
10. (A) Schematic Diagram of the Experimental Set-up for Measuring the Latent
Heat of Vaporization in Nanofluids using a Hot Wire with Electrical Source.

ix
(B) Schematic Representation of Well-Insulated Boiling Test Cell to Reduce
Heat Loss by Convection and Radiation. .........................................................31
11. Vapor Mass Generation based on Laser and a Heat Gun Experiment as a
Function of Time for Pure Water with and without Surfactant (SDS), 0.1% by
Volume, 20-nm Silver Nanofluid with 1% Surfactant, and 0.1% by Volume,
30-nm Graphite Nanofluid with 1% Surfactant ...............................................33
12. (a) Measured Latent Heat of Vaporization in Graphite Nanofluids and (b) in
Silver Nanofluids (the Trends are Changed after 1% Volume Fraction),
Including Calculated Latent Heat of Vaporization in Graphite and Silver
Nanofluid Using Eq. (1) based on Changes in the Volume Fraction [14]. ......36
13. Absolute Values of the Increased hfg for Graphite and Aluminum Oxide
Nanofluids [7] and the Decreased hfg of Silver Nanofluids relative to that for
Pure Water with Surfactant (2132 kJ kg-1) (%) [7] in terms of Surface Area
Changes, Compared with Ameen’s Results for Aluminum Oxide Nanoparticles
[7]. That is, the Relative Change in hfg Increases with Increasing Surface Area.
The Trends Change at the Circled Points near 2% Volume Fraction for Silver
and Graphite Nanofluids because of Agglomeration. ......................................38
14. Average Size Change of 2% Volume Fraction, 30-nm (a) Graphite Nanofluid
before Heating (48 ± 2nm, upper) and (178 ± 2nm, lower) after Heating, and
(b) 2% Volume Fraction, 20-nm Silver Nanofluids (27nm ± 2nm, upper) before
Heating and after Heating (90nm ± 2nm, lower) .............................................42
Figure Page

x
15. The Surface Tension Changes in Nanofluids with 1% Surfactant as a Function
of the Temperature (a) the Measured Surface Tension from 30°C to 60°C, and
(b) the Values between 70°C and 100°C were Extrapolated based on the Results
from 30°C to 60°C due to the Temperature Limitations of the Tensiometer. .49
16. Fluid Level Changes due to the Evaporation Rate Difference for Graphite
Nanofluid with SDS, Silver Nanofluid with SDS, and Pure Water (a) Front
Sides, and (b) Back Sides (from the left: Graphite Nanofluid, Silver Nanfluid,
and Water) ........................................................................................................55
17. Size-Dependent Melting Temperature (°C) Change based on the Gibbs-
Thomson Equation [30] [31], where T is the Temperature of the
Nanoparticle, Tbulk the Melting Temperature of Bulk Ag, θ Surface Energy,
M Atomic Mass, ∆HmMelting Enthalpy, ρ Density, and R the Diameter of the
Nanoparticles [31]. ...........................................................................................57
18. Three Hypotheses for the Melting of Nanoparticles Suspended in a Solution:
(a) Homogeneous Melting (HM) (b) Liquid Nucleation and Growth (LNG) (c)
Liquid Skin Melting (LSM) .............................................................................58
19. Modeled Geometry of Surface Melting of Silver Nanoparticles in Water
[39] ...................................................................................................................61
20. (a) Schematic Diagram of the Set-Up for Boiling Experiment of Silver
Nanofluid with Laser (b) Schematic Representation of Test Cell with Thermal
and Optical processes .......................................................................................68
Figure Page

xi
21. TEM Images of 0.1% by Volume, 20-nm Ag Particles (a) before Heating (b)
after Laser Heating in Subcooled Fluid, and (c) after Laser Heating in Saturated
Fluid .................................................................................................................71
22. Histograms of Particle Size Distributions Measured from the TEM Images in
Figure 5 of (a) Particle Size Distribution before Heating (Mean = 42.9nm) (b)
Particle Size Distribution after Laser Heating in Subcooled Fluid (Mean =
41.4nm), and (c) Particle Size Distribution after Laser Heating in Saturated
Fluid (Mean =32.5nm) .....................................................................................73
23. Volume-Weighted Ag Nanoparticles (Initially 20 nm) Size Distribution
Measured with Dynamic Light Scattering (DLS, Nicomp 380/ZLS) of 0.1% by
Volume Nanofluid (a) before Heating (b) after Laser Heating in Subcooled
Fluid, and (c) after Laser Heating in Saturated Fluid ......................................75
24. Clathrate Structure by Presence of the Graphite Nanoparticles in Pure
Water ................................................................................................................79
25. Typical Rankine Cycle .....................................................................................82
26. Components of a Nanofluid-Based Solar Thermal System .............................83
27. Preparation of Silver Nanofluids in a Cycle ....................................................84
28. Schematic of Solar Thermal Storage in a House
(http://solar.colorado.edu/design/hvac.html) ...................................................87
Figure Page

xii
NOMENCLATURE
Q Heat input [kW]
T Temperature [K]
t Time [s]
m Mass [kg]
M Molecular mass [mol]
[P] Parachor
hfg Latent heat of vaporization [kJ kg-1]
c Specific heat [kJ kg-1K-1]
e Electron constant [1.602 x 10⁻¹⁹ C]
H Latent heat of fusion [kJ kg-1]
J Joule
N Number of electrons in the band
u Molecular weight of the metal [mol]
w Lifshitz constant [eV]
R Reflectance

xiii
Greek symbols
ρ Density [kg m-3]
φ Volume fraction [%]
σ Surface tension [N/m]
σ Electrical conductivity [S m-1]
Ԑ Dielectric constant [F m-1]
iω Imaginary frequency [s-1]
ω Frequency [s-1]
τ Collision time for electrons [s]
Τ Transmittance
η Electron density (the probability of an electron being present at a specific location)
v Specific volume [m3 kg-1]
η Efficiency of cycle
𝛉 Surface energy [N/m]
Subscripts
in Input
out Output

xiv
sat Saturation
nf Nanofluid
p Pressure
P Particle
w Water
f Fluid
g Gas
F Fermi
e Effective
fg Fluid Gas
loss Losses
vapor Vapor generation
val Valence band

1
CHAPTER 1. INTRODUCTION
Nanofluids are suspensions of nanoparticles (1-100 nm in size) in common fluids
such as water, thermal oils, and other fluids. In the last few decades, adding nanoparticles
to fluids has often been attempted to enhance thermal properties, especially thermal
conductivity, specific heat, and convection heat transfer [1] [2] [3] [4] [5] [6] [7] [8] [9].
Motivated by these results, a number of researchers have focused on employing
nanoparticles to improve the working fluid’s performance in various applications [8] [9].
On the other hand, relatively few studies have been reported about changes in hfg caused
by the addition of nanoparticles, although hfg (e.g. the energy needed to create vapor) is an
important property for thermal applications [7].
Recently, hfg in nanofluids has been investigated to enhance the efficiency of many
applications [7] [10] [11] [12] [13] [14]. These results show that the hfg of water is possibly
manipulated by adding nanoparticles, as suggested by some experiments in which vapor is
generated around nanoparticles by volumetric heat sources, i.e., sunlight and laser
irradiation [15] [16] [17]. Although the reported ‘anomalous enhancements of
thermophysical properties’ have largely gone unrealized, nanofluids have shown some
promise for solar thermal applications [8] [9], which would be enhanced with a ‘tunable’
hfg.

2
1.1 Nanofluids
Nanofluids are nanoscale colloidal suspensions containing relatively low nanomaterial
concentrations [1] [2] [3] [4] [5] [6] [7] [8] [9]. Nanofluids have been considered as
advanced heat transfer fluids for two decades since the suspension stability of nanoparticles
is much better than micron-sized particles. Due to this advantage, it is hypothesized that
clogging and settling of nanoparticles in the base fluid could be reduced, resulting in
enhanced thermal and physical properties [2] [8] [9] [18]. Nanofluids’ properties could be
further enhanced by controlling the nanomaterial, size, shape, surfactants, and base fluid
[2] [8]. Among thermophysical properties, the enhanced thermal conductivity of nanofluids
is widely recognized as an important thermal property, which can significantly affect
system efficiency [2] [4] [5]. The low thermal conductivity (i.e. 0.1-0.6 W m-1K-1) of
conventional fluids is improved by the high thermal conductivity (10-430 W m-1K-1) of
solid particles. Therefore, the addition of a small volume fraction of nanoparticles in a base
fluid has been the subject of considerable research [8]. In addition, other thermophysical
properties, i.e., density, specific heat, thermal expansion coefficient, viscosity, and thermal
conductivity have also been studied to increase the system efficiency [2] [4] [12]. However,
there are still several issues (i.e. long-term stability and reproduction of experimental
results) to be solved.
1.2 Latent Heat of Vaporization in Pure Water
The random movements of liquid molecules packed closely together cause
molecules to collide with each other [19]. These movements become very intense as

3
temperature increases. Therefore, the bonds between liquid molecules are broken and the
liquids become gases. This is called the boiling point of fluids. The boiling point is highly
related to the strength of the bonds [19]. The boiling point of pure water is relatively high
due to the strong attractions afforded by the hydrogen bonds compared with the other types
of bonds. Also, the latent heat of vaporization in water is high due to the strong hydrogen
bonds. Usually, a large quantity of thermal energy is needed for vaporization. This amount
of thermal energy is called hfg, which is used in breaking the hydrogen bonds to leave from
the water surface to the air. Thus, hfg is highly related to the strength and number of bonds
[19].
1.3 Historical Attempts to Manipulate the Latent Heat
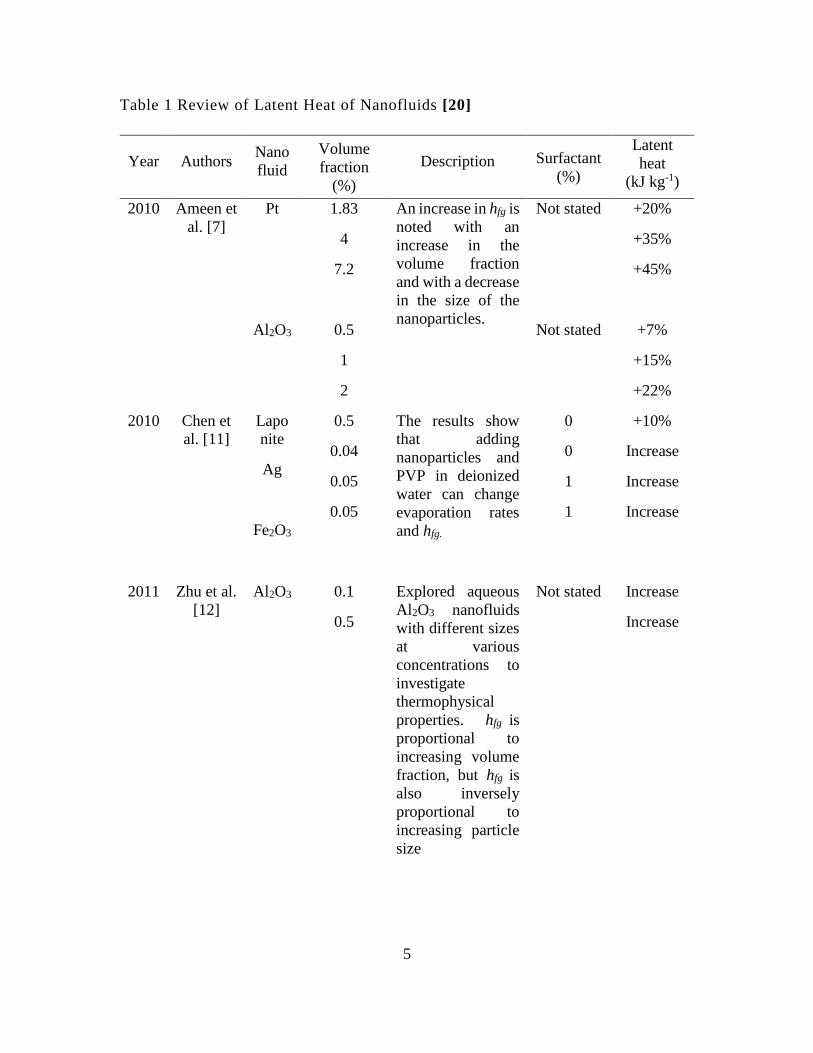
As shown in Table 1, Ameen et al. [7] presented an hfg increase for Pt nanofluids
compared to that of pure water as a function of the volume fraction (%) and the nanoparticle
size. Their research was based on a molecular dynamics (MD) simulation supplemented
with limited experimental data for alumina nanofluids. An increase in hfg was noted in
aqueous nanofluids with an increase in the volume fraction and with a decrease in the
nanoparticle size as shown in Fig. 1. From these results, Ameen et al. [7] concluded that
the influence of the nanoparticle volume fraction was the dominant influential parameter
as compared to nanoparticle material and size. In addition, they discussed that the increase
in hfg in nanofluids could possibly be caused by extra bonds between water molecules and
nanoparticles. That is, in order to break the extra bonds, extra energy is required during
phase change, which leads to the hfg increase.

4
In addition, Chen et al. [11] indicated that the surfactant Polyvinylpyrrolidone (PVP)
could enhance the evaporation rate of deionized water droplets due to the reduction of the
surface tension of water. Since much of the nanofluids literature employs surfactants, a
reduction in hfg of up to 10% can be attributed to the presence of surfactants [10] [11].
Figure 1. The Enhancement of hfg of Water as a Function of the Volume
Fraction and the Platinum Nanoparticle Size based on Molecular Dynamics
(MD) Simulations [7]
5
Table 1 Review of Latent Heat of Nanofluids [20]
Year Authors Nano
fluid
Volume
fraction
(%)
Description Surfactant
(%)
Latent
heat
(kJ kg-1)
2010
Ameen et
al. [7]
Pt
Al2O3
1.83
4
7.2
0.5
1
2
An increase in hfg is
noted with an
increase in the
volume fraction
and with a decrease
in the size of the
nanoparticles.
Not stated
Not stated
+20%
+35%
+45%
+7%
+15%
+22%
2010 Chen et
al. [11]
Lapo
nite
Ag
Fe2O3
0.5
0.04
0.05
0.05
The results show
that adding
nanoparticles and
PVP in deionized
water can change
evaporation rates
and hfg.
0
0
1
1
+10%
Increase
Increase
Increase
2011
Zhu et al.
[12]
Al2O3
0.1
0.5
Explored aqueous
Al2O3 nanofluids
with different sizes
at various
concentrations to
investigate
thermophysical
properties. hfg is
proportional to
increasing volume
fraction, but hfg is
also inversely
proportional to
increasing particle
size
Not stated Increase
Increase

6
2013
Harikrish
nan et al.,
[13]
TiO2
0.1
0.2
0.3
Dispersed
nanoparticles in
palmitic acid
enhanced the heat
transfer
characteristics of
palmitic acid
including the latent
heat.
Not stated +6.18%
+12.37%
+20.11%
2014
Mehrega
n et al.
[14] - -
Presented a new
theoretical
equation for hfg in
nanofluids
- -
2014 Lee et al.
[10]
Ag
Grap
hite
0.1
0.1
0.1
0.1
hfg of water* can be
increased or
decreased by
aqueous graphite
and silver
nanofluids with
volumetric heat
source (i.e. laser or
sunlight)
0
1
0
1
-23%
-34%
+36%
+32%
* Latent heat of vaporization in water: 2257 kJ/kg
This is similar to other studies that have examined the effect of surfactants on surface
tension and corresponding impacts on boiling heat transfer [21]. In addition, Chen et al.
reported there was only a slight change in hfg for a silver (Ag) nanofluid without PVP,
however, hfg increased as the particle concentration increased and the evaporation rate
decreased. On the other hand, hfg for a Ag nanofluid with PVP increased with increasing
particle concentration due to additional interactions between nanoparticles and water
molecules, i.e., the evaporation rate decreased with increasing particle concentration. In
general, Chen et al. [11] found that adding nanoparticles such as Laponite, Ag, and Fe2O3
in deionized water could change the evaporation rates and hfg as shown in Table 1. Also,

7
Zhu et al. [12] presented measured thermophysical properties, such as the viscosity, surface
tension, thermal conductivity, saturation vapor pressure, and hfg of aqueous alumina
nanofluids with different size nanoparticles at volumetric concentrations of 0.1% to 0.5%.
In their paper, the influences of the particle size, particle volume concentration and
temperature on the thermophysical properties were investigated. For example, hfg was
proportional to increasing volume fraction, but hfg was also inversely proportional to
increasing particle size. Harikrishnan et al. [13] reported that dispersed TiO2 nanoparticles
in palmitic acid could be employed for enhanced heat transfer characteristics of palmitic
acid, including the latent heat. Therefore, based on their good thermal stability and thermal
reliability, newly prepared TiO2 nanofluids could be considered as additives to make
efficient phase-change materials (PCMs) for solar water heating systems. Recently,
Mehregan et al. [14] proposed a new theoretical equation, an expression for hfg for
nanofluids:
(ρhfg)nf = (1 − φ)ρhfg + (Tbf Tb,s⁄ ∗ φ ρshfg,s) (1)
where Tbf is the boiling point of the base fluid, the subscripts nf represents nanofluid and s
nanoparticles, and no subscript designates the base fluid. Mehregan et al. proposed that hfg
is a function of both the base fluid and the nanoparticles. That is, hfg of nanofluid is treated
as a solid-fluid mixture rather than as a homogeneous fluid. Thus, hfg can be derived by
considering the density, the boiling temperatures of the base fluid and nanoparticles, and
hfg of both the base fluid and of the nanoparticles. Mehregan et al. [14] numerically

8
investigated the evaporation behavior of nanofuel droplets using a general transport
equation, and compared the numerical results with available experimental data of nanofluid
evaporation characteristics to propose the above correlation to approximate hfg in nanofluid.
It indicated that hfg is highly dependent on the type of the nanoparticles. This was the first
work to propose a formula for hfg in nanofluids as a function of density, volume fraction,
and boiling temperatures of the nanoparticles and of the base fluid. Mehregan et al.,
however, mentioned that further investigation is still required to improve this relation
because it is the first attempt to propose a formula to approximate a nanofluids’ hfg. Finally,
Lee et al. [10] recently presented experimental data for hfg for 0.1% by volume, 30-nm
graphite and 20-nm silver nanofluids with and without 1% surfactant. The hfg results were
inspired by other studies [15] [16] [17], which showed that vapor generation around
nanoparticles in water by volumetric heat sources i.e., concentrated sunlight or a focused
laser beam, could be realized in subcooled and saturated water. Based on those results, Lee
et al. conducted experiments with a laser heat source to investigate hfg in aqueous graphite
and silver nanofluids. The results indicated that hfg for graphite nanofluids can be increased,
and hfg for silver nanofluids can be decreased by ±30%-36%, relative to hfg for pure water.
According to Table 2, all previous hfg studies in aqueous nanofluids always showed an
increase in hfg, compared to that for pure water (2257 kJ kg-1) due to the addition of
nanoparticles. Lee et al., however, reported a decrease in hfg for silver nanofluids. This
indicates that the materials involved are critical in controlling hfg. If these materials and
results can be scaled up, such nanofluids can potentially be employed for solar steam
generators or directly irradiated latent heat storage systems with tunable hfg as a function
of nanoparticle material.

9
Table 2 Values of Latent Heat of Vaporization in Aqueous Nanofluids
Year Authors Nanofluid Volume fraction (%) Latent heat of
Vaporization
(kJ kg-1)
2010
Ameen et al. [7]
Pt
Al2O3
1.83
4
7.2
0.5
1
2
2708
3046
3272
2414
2595
2753
2010
Chen et al. [11]
Laponite
0.5
2482
2014
Lee et al. [10]
Ag
Graphite
0.1
0.1
1633
3529
* Latent heat of vaporization in water: 2257 kJ/kg
1.4 Volumetric Solar Thermal Collector
A conventional solar thermal collector, a device for capturing solar radiation with
a flat plate or evacuated tube, harvests heat energy by absorbing sunlight on the collector
surface.

10
However, nanofluid-based volumetric solar thermal collectors, which contain very
small amounts of nanoparticles (<1% by volume) in pure water, have received interest
because they harness solar radiant energy more efficiently by capturing the sun’s energy
with improved optical and thermal properties as compared to conventional solar thermal
collectors [3] [9] [15] [16] [22]. The efficiency of a solar thermal system is related to the
Figure 2. Thermal Resistance Network of a Conventional Solar Thermal Plant
and a Nanofluid-Based Volumetric Solar Thermal Plant [15].

11
number of energy conversion steps. Compared to a conventional solar thermal collector, a
nanofluid-based volumetric solar collector can increase the efficiency by reducing the
energy conversion steps as shown in Fig. 2. As will be shown later in this chapter, the
ability to increase or descrease hfg could enable more useful application of volumetric solar
collectors.
1.5 Motivation
Recent work on light-induced vapor generation of aqueous nanofluids reveals that a
large portion of the input light is not transferred to the surrounding water, due to the low
thermal conductivity of water vapor surrounding the nanoparticles as shown in Fig. 3. This
is believed to act as a thermal barrier between the nanoparticles and the nearby liquid water.
This indicates that under light-induced heating, nanoparticles act as heat sources which are
not in equilibrium with their surroundings [17].
Therefore, if thermal losses are insignificant from the test samples, the total energy
from the light would be absorbed into the nanoparticles and vapor is generated around
nanoparticles as shown in Fig. 4 instead of transferring to the liquid water [16] [17].

12
Figure 3. Schematic of Solar Steam Generation based on Nanoparticles [17]

13
Figure 4. Vapor Generation around Graphite Nanoparticles in Water with a Laser
Irradiance of 770 W/cm2. Dashed Circles Indicate Separated High Concentrations of
Graphite Nanoparticles [16].

14
From this, the local temperature of nanoparticles could increase much higher than the
temperature of the nearby liquid water. It may therefore be possible to affect the thermal
properties of nanofluids or the melting behavior of nanoparticles in water, including. the
latent heat of vaporization (hfg). Among other applications such as steam generation, hfg is
an important property in determining how effectively a liquid can regulate the internal
temperature of a living organism.
Also, a stable system can be achieved since the system operates with both constant
temperature and constant pressure. Therefore, if hfg in water is increased by adding a small
amount of nanoparticles, a large amount of energy could be stored via latent heat storage
because water has both a high hfg and a high heat capacity.
Figure 5. Suggested Volumetric Solar Thermal System Using Nanofluids

15
In addition, if hfg in water is decreased, more steam could be generated from the same heat
input to a volumetric solar thermal collector as shown in Fig. 5. If hfg is increasd by adding
nanoparticles, some energy is used for the interactions between nanoparticles and water
molecules and these interactions could be higher than the broken hydrogen bonds due to
placing nanoparticles inside pure water. That is, less heat output could be achieved than
the value of pure water. Also, if hfg decreased by adding nanoparticles, the interactions
between nanoparticles and water molecules could be prevented by van der Walls
interaction change due to melting, thus the broken hydrogen bonds could not be
compensated. Therefore, more heat output (vapor) could be possible. The details will be
discussed in Chapter 5.
1.6 Research Goals
The goals of the research are to investigate the variation of hfg in silver and graphite
aqueous nanofluids, with both volumetric and surface heat sources. The main purpose of
this research is to determine if hfg in aqueous nanofluids can be increased or decreased,
compared to the hfg of pure water. A secondary goal is to show how manipulating hfg in
this way can be applicable to solar thermal energy harvesting or energy storage. To make
it clear, the challenges of this research are the following:
Is there any difference when surface heating and volumetric heating is used for hfg
in nanofluids?
Is there sufficient confidence in the accuracy of the experimental hfg measurements?

16
Does the type of nanofluid affect the variation of hfg?
Is the variation of hfg in nanofluids possible to be employed for real-world
applications such as latent heat storage systems and solar thermal collectors?
The above questions are addressed in the following chapters in this dissertation.
The next chapter will present the experimental results of hfg in aqueous nanofluids. This
will include the experimental methods, procedure, and results. Chapter 3 presents
theoretical approaches to support the experimental results. Chapter 4 suggests possible
nanoscale mechanisms to predict how hfg can be altered. Finally, Chapters 5, 6, and 7
discuss applications in solar thermal energy, the conclusions and suggestions for future
work.

17
CHAPTER 2. EXPERIMENTAL INVESTIGATION OF THE LATENT
HEAT OF VAPORIZATION IN AQUEOUS NANOFLUIDS
Recently, Ameen et al. [7] proposed the enhancement of hfg in platinum and
aluminum oxide nanofluids by MD simulations and limited experiments where the
nanofluids were heated through conventional surface heaters. However, there are limits to
investigating hfg with surface heating since it is evident that volumetric vapor generation
occurs around nanoparticles in aqueous nanofluids [16] [17]. Volumetric heating sources,
such as a laser, sunlight, or an electrically heated hot wire which delivers the thermal
energy by directly contacting nanoparticles, appears to more fully utilize the dispersed
nature of nanoparticles inside a test cell compared to surface heat sources. In particular, it
has been shown that the vapor can be locally created around nanoparticles, without heating
the entire bulk of the fluid [16] [17]. To obtain a better fundamental understanding of this
phenomenon, an experimental quantification of hfg is required for the volumetric vapor
generation in aqueous silver and graphite nanofluids because these nanoparticles showed
better results than other nanoparticles in previous work [16].
2.1 Experimental Setup and Procedure
The hfg of fluids is determined by measuring vapor generation and the heat input
supplied during the time of observation. Figures 6(a) and (b) describe the experimental set-
up used in this study for measuring vapor generation with a laser and an electrically heated
Ni-Cr resistance wire.

18
Figure 6. Experimental Setup for Measuring the Latent Heat of Vaporization in
Nanofluids with (a) Laser-Based Heating, (b) Hot Wire-Based Heating

19
This experimental set-up represents a refined, transient version of a previous experimental
study [15]; photographs of the system are shown in Fig. 7.
In this set-up, a thin-walled 2mm x 2mm square, quartz cuvette is filled with one of the
following samples: graphite nanofluid (0.1% by volume, 30nm in size), silver nanofluid
(0.1% by volume, 20nm in size), and pure water with surfactants, which are necessary to
stabilize the nanoparticles in water. Nanofluids could be prepared by the “one-step” method
or the “two-step” method. The one-step method consists of synthesizing nanoparticles in
the base fluid by means of a chemical method. The two-step method is that nanoparticles
Figure 7. Experimental Setup – Taken Using a Digital Camera

20
are prepared in the form of powders first, then suspended in the base fluid [10] [15]. In this
dissertation, the two-step method was employed to prepare aqueous silver and graphite
nanofluids. The cuvette containing the nanofluid sample was mounted on a sensitive mass
balance (Mettler Toledo, AB265S, 0.01mg accuracy) to measure the mass of the remaining
liquid of the test samples with a continuous laser (532nm in wavelength, 130mW in power
output) which is focused through a 40-mm focal length positive lens as shown in Fig. 7,
and a K-type thermocouple (Omega, 1.574 mm in diameter) was immersed in the nanofluid
to record the temperature of the test samples. In addition, bubble formation was observed
visually with a Retiga (EXi Fast) 1.4 megapixel charge-coupled device (CCD) camera to
determine the boiling in the test samples. Figure 8 illustrates three different experimental
setups to determine hfg in our samples and the experimental procedure. The boundaries of
the cuvette are either kept at a constant temperature (of just below 100°C) using a heat gun,
or are insulated with rubber pipe type insulation (Industrial Thermo Polymers Lim, 38mm
thickness). This variety of conditions (volumetric laser heating, and hot-wire heating with
and without external heating) was employed in order to confirm the experimental results
were not artifacts of the method used. That is, these tests seek to determine if the presence
and type of nanoparticles lead to the same changes in the observed hfg for all cases. Optical
losses during the laser-heated experiments were estimated to be 3%, while thermal losses
from the well-insulated sample were estimated to be 1%. The detailed uncertainty
estimates are provided in Appendix A.

21
(a) (b) (c)
(d)
Time Action
0 s Turn on heat gun
60 s Turn on primary heat source
1200 s Turn off primary heat source and heat gun
Figure 8. Schematic Diagram for (a) Laser and a Heat Gun, (b) A Hot Wire and
a Heat Gun, (c) a Hot Wire and Well-Insulated Sample, (D) Boiling Experiments
Procedure

22
(a)
(b)
Figure 9. Visual Images Exposed to Laser Beam (a) Prepared Nanofluids with
Pure Water (b) Bubbles in Test Cells during the Experiments

23
For the laser-based experiments, all the test cells were black-backed to ensure all light was
absorbed. Therefore, the scattering of light in the test sample was ignored as it was
absorbed either in the fluid or on the backing regardless of the fluid. Note: the assumption
that no light leaves the cuvette was confirmed with measurements using a laser power
thermopile sensor (Coherent, PM30V1Q). A cap with a small opening was utilized which
allows for the insertion of thermocouples to measure the temperature of the nanofluids and
sustains a test fluid at saturation pressure while conducting the experiment. During the tests,
all samples (shown in Fig. 9(a)) were sufficiently heated to create vapor as is demonstrated
in the characteristic visual image of Fig. 9(b). The entire setup was then recorded
throughout the experiments with a visual camera to observe vapor bubbles in fluids to
check volumetric boiling, while conducting the experiments and based on The bubble
formation details as described in previous work [15].
2.2 Experimental Method
To measure the vapor mass, the fluid mass was measured before and after the
experiments. A total observation time of 20 minutes was used, which ensured a measurable
mass change without lowering the liquid column below the heated region. In order to
consider the boiling effect, input from the heat gun only was also run to investigate the
evaporation effect of our setup to determine repeatability and estimate the test uncertainty
(~15%) [10] [15]. The uncertainty of the experimental data was calculated based on a level
of confidence of 95%. The detailed uncertainty estimates are provided in Appendix B. The
hfg results indicated that the changes in hfg were a profound function of the type of

24
nanoparticle, regardless of whether a surfactant was present or not. The values for hfg were
determined from the experimental measurements by [10]:
hfg =∫ Qin
tF
0dt − ∫ Qloss
tF
0dt
∫ mvaportF
0dt
(2)
where mvapor is the mass flow rate of vapor generation (kg/s), t the time (sec), Qin the rate
of heat input (kW), which was measured by the power thermopile sensor (Coherent,
PM30V1Q), and Qloss the thermal losses (kW), which were calculated based on the
temperature of the nanofluid and the cuvette boundary:
∫ Qloss
tF
0
dt = hA(Tnf − Tair)
(3)
where h is the convective heat transfer coefficient, A the surface area of the cuvette, Tnf the
temperature of the nanofluid, and Tair the temperature of the air. The convective heat
transfer coefficient was obtained after calculation of the Reynolds (1184) and Nusselt
(20.32) numbers [23]:

25
Re =
vairL
ν
Nu =hL
k= 0.664Re0.5Pr
13
(4)
where vair is the air velocity (7.8 m/s) [15], L the characteristic linear dimension (0.0035
m), ν the kinematic viscosity (23.06 x 10⁻⁶ m2 s-1), k the thermal conductivity (0.0314 W
m-1 K-1), and Pr the Prandtl number (0.703) [23]. Solution of Eq. (9) led to an estimated
cnvective heat transfer coefficient of h = 182 W m-2 K-1. Therefore, the thermal losses
(1.45 J) using Eq. (8) for the experiments shown in Figs. 8 (a) and 8 (b) can be calculated
for the 20-minute observation time. The negligible thermal loss for the experiment shown
in Fig. 8 (c) was obtained by considering only heat conduction. The details for the
uncertainty calculations are provided in Appendices A and B.
Based on Eq. (2), mvapor=∫ mvaportF
0dt can be identified as an important factor in
determining hfg (as compared with the other controlled variables, i.e., heat input and
thermal losses), particularly since the latent heat results were similar for the three
experimental set ups as shown in Tables 3-5. Since the evaporation of the fluid also occurs
due to the presence of the heat gun, in order to only consider the boiling effect from the
laser or hot wire, the results from both the laser (hot wire) and the heat gun were normalized
by the amount of evaporation resulting from the heat gun only, i.e., the background vapor
mass generation. That is, the heat gun experiments with no light input were also run to find
the amount of evaporation resulting from the saturation temperature boundary condition
[10].

26
Table 3 The Values of All Three Terms on the RHS of Eq. (27), for the Laser
Experiment Shown in Fig. 8 (a), Where tF = 20 min and 0.1% Volume Fraction
Nanofluid.
Qin
(J)
Qloss
(J)
Vapor mass
generation
w/ 1% SDS
(mg)
Background
vapor mass
generation
w/ 1% SDS
(mg)
Vapor mass
generation
w/o SDS
(mg)
Background
vapor mass
generation
w/o SDS (mg)
Pure
water 146 1.45 68 7 18 1 63 7 15 1
Graphite
nanofluid 137 1.45 41 3 24 2 38 3 20 2
Silver
nanofluid 120 1.45 79 10 22 2 72 9 19 2
These background/control test results are given in Tables 3-4, and the net vapor mass
generation (the difference between the total vapor mass generation and the background
vapor mass generation) was used in Eq. (2). Since the heat gun was not used for the well-
insulated sample in Fig. 8(c), no background vapor mass generation is given in Table 5 for
that case. In addition, for the hot wire-based experiments using an insulated test cell, a
different heating power (680mW) was applied to reach the boiling point in 1 min without
a heat gun, and the observation time was 5 min.

27
Table 4 The Values of All Three Terms on the RHS of Eq. (2), for the Hot Wire
Experiment with a Heat Gun Shown in Fig. 8 (b), Where tF = 20 min and 0.1%
Volume Fraction of Nanofluids.
Qin
(J)
Qloss
(J)
Vapor mass
generation
w/ 1% SDS
(mg)
Background
vapor mass
generation
w/ 1% SDS
(mg)
Vapor mass
generation
w/o SDS
(mg)
Background
vapor mass
generation
w/o SDS (mg)
Pure
water 148 1.45 73 7 18 1 67 7 15 1
Graphite
nanofluid 148 1.45 46 3 24 2 43 3 20 2
Silver
nanofluid 148 1.45 87 10 22 2 81 9 19 2
Therefore, the vapor mass generation in Table 5 was different from the others in Tables 3
and 4, but the resulting values of hfg were similar. Therefore, interactions between the
nanoparticles and water molecules apparently differ, depending on the nanoparticle
material. Also, as shown in Tables 3-5, the presence of a surfactant (SDS) in the fluids
causes a reduction of 6-10% in hfg for the nanofluids. However, the results for the net vapor
mass generation (mvapor ) show that even though mvapor for pure water with a surfactant is
greater than that for pure water without a surfactant, mvapor is still lower than that for silver
nanofluid.
28
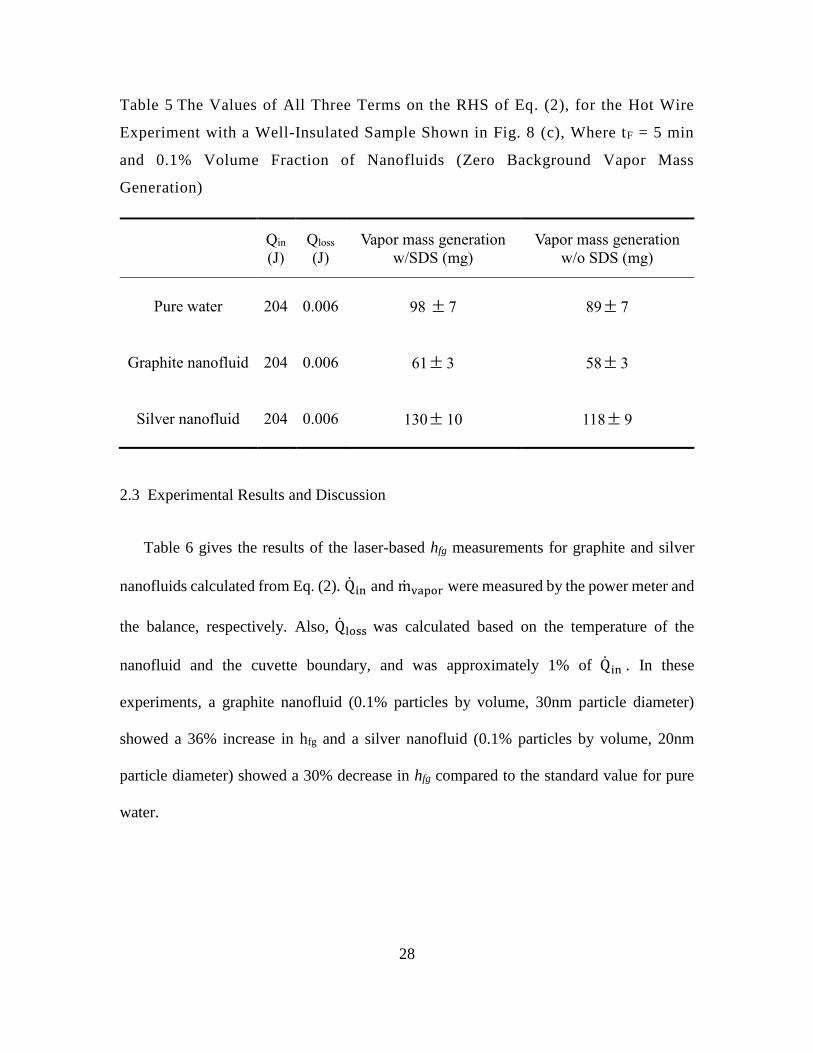
Table 5 The Values of All Three Terms on the RHS of Eq. (2), for the Hot Wire
Experiment with a Well-Insulated Sample Shown in Fig. 8 (c), Where tF = 5 min
and 0.1% Volume Fraction of Nanofluids (Zero Background Vapor Mass
Generation)
Qin
(J)
Qloss
(J)
Vapor mass generation
w/SDS (mg)
Vapor mass generation
w/o SDS (mg)
Pure water 204 0.006 98 7 89 7
Graphite nanofluid 204 0.006 61 3 58 3
Silver nanofluid 204 0.006 130 10 118 9
2.3 Experimental Results and Discussion
Table 6 gives the results of the laser-based hfg measurements for graphite and silver
nanofluids calculated from Eq. (2). Qin and mvapor were measured by the power meter and
the balance, respectively. Also, Qloss was calculated based on the temperature of the
nanofluid and the cuvette boundary, and was approximately 1% of Qin . In these
experiments, a graphite nanofluid (0.1% particles by volume, 30nm particle diameter)
showed a 36% increase in hfg and a silver nanofluid (0.1% particles by volume, 20nm
particle diameter) showed a 30% decrease in hfg compared to the standard value for pure
water.
29
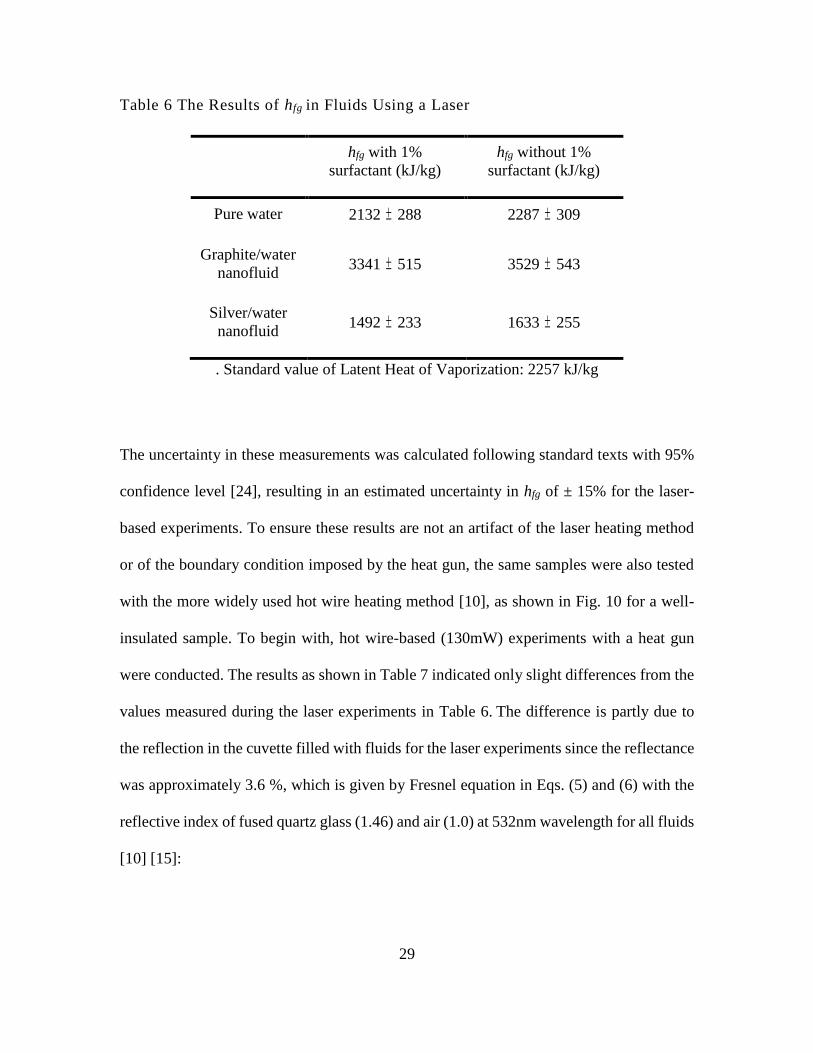
Table 6 The Results of hfg in Fluids Using a Laser
hfg with 1%
surfactant (kJ/kg)
hfg without 1%
surfactant (kJ/kg)
Pure water 2132 288 2287 309
Graphite/water
nanofluid 3341 515 3529 543
Silver/water
nanofluid 1492 233 1633 255
. Standard value of Latent Heat of Vaporization: 2257 kJ/kg
The uncertainty in these measurements was calculated following standard texts with 95%
confidence level [24], resulting in an estimated uncertainty in hfg of ± 15% for the laser-
based experiments. To ensure these results are not an artifact of the laser heating method
or of the boundary condition imposed by the heat gun, the same samples were also tested
with the more widely used hot wire heating method [10], as shown in Fig. 10 for a well-
insulated sample. To begin with, hot wire-based (130mW) experiments with a heat gun
were conducted. The results as shown in Table 7 indicated only slight differences from the
values measured during the laser experiments in Table 6. The difference is partly due to
the reflection in the cuvette filled with fluids for the laser experiments since the reflectance
was approximately 3.6 %, which is given by Fresnel equation in Eqs. (5) and (6) with the
reflective index of fused quartz glass (1.46) and air (1.0) at 532nm wavelength for all fluids
[10] [15]:

30
Rglass =(nglass − nair)2
(nglass + nair)2
(5)
where R is the reflectance, and n the refractive index. The subscripts glass and air represent
the test cell material and air, respectively.
Table 7 The Results of hfg in Fluids Using a Hot Wire
hfg with 1% surfactant
(kJ/kg)
hfg without 1%
surfactant (kJ/kg)
Pure water 2022 243 2177 226
Graphite/water
nanofluid 3204 368 3392 390
Silver/water
nanofluid 1679 201 1820 218
Note that no heat gun is used in the arrangement of Fig. 10. Table 9 shows that the hot
wire-based experiments using an insulated test cell confirmed the results from both laser
heating (Table 7) and hot-wire heating (Table 8). In these experiments, in order to reach
the boiling point in 1 minute without a heat gun, a different heating power (680mW) based
on the energy balance in Eq. (2) was applied, but the time to reach boiling conditions was
different from the previous experiments. Therefore, the vapor mass generated from the

31
nanofluid only after reaching the boiling point was recorded. As a result, additional vapor
generation from evaporation was not included in the results, but the hfg values obtained
without the use of a heat gun are within ± 6 % of the other results.
Rtotal = Rglass +Τglass
2 Rnf
1 − RnfRglass
(6)
where Τ (1.0) is the transmittance, and Rnf (0.0005) the nanofluid reflectance. The
subscripts glass and nf represent the test cell material and nanofluid, respectively.
Figure 10. (A) Schematic Diagram of the Experimental Set-up for Measuring
the Latent Heat of Vaporization in Nanofluids using a Hot Wire with Electrical
Source. (B) Schematic Representation of Well-Insulated Boiling Test Cell to
Reduce Heat Loss by Convection and Radiation.

32
Hence, hot wire-based experiments using an insulated test cell confirmed the original
results from laser heating.
Table 8 The Results of hfg in Fluids without a Heat Gun
hfg with 1% surfactant
(kJ/kg)
hfg without 1%
surfactant (kJ/kg)
Pure water 2090 190 2299 209
Graphite/water
nanofluid 3358 316 3498 329
Silver/water
nanofluid 1568 149 1728 164
Moreover, hfg of nanofluids with and without 1% surfactant (commonly used for
stabilizing nanoparticles) was obtained to investigate the effect of the surfactant [10]. As
shown in Fig. 11, vapor mass generation of aqueous nanofluids and pure water with and
without SDS were different while conducting the experiments. These experiments were
repeated five times to reduce the error of the tests, and averaged to determine the
repeatability [24].

33
Based on the results in Fig. 11, the variations in hfg for graphite and silver nanofluids are
largely caused by the presence and type of nanoparticles rather than the surfactant. The hfg
in fluids with 1% surfactant shows marginally lower values than the samples without 1%
surfactant. This is a well-described phenomenon, and is due to the fact that a surfactant in
fluid alters the surface tension [25]. In general, bubbles generated during boiling find it
difficult to escape the interface between the fluid/air boundary due to surface tension in
fluid. However, the surfactant reduces the surface tension by disturbing the interaction
energy at the interface, thus allowing bubbles to leave [26]. Based on the results in Table
Figure 11. Vapor Mass Generation based on Laser and a Heat Gun Experiment
as a Function of Time for Pure Water with and without Surfactant (SDS), 0.1%
by Volume, 20-nm Silver Nanofluid with 1% Surfactant, and 0.1% by Volume,
30-nm Graphite Nanofluid with 1% Surfactant

34
6-8, it is hypothesized that the type of nanoparticle has a crucial impact on vapor generation
during boiling. Analogous to surfactant, when nanoparticles are placed in water, hydrogen
bonds are broken to make room for the nanoparticles [19].
Subsequently, new hydrogen bonds around nanoparticles are formed due to the
layering of water molecules [10] [19]. Therefore, the new hydrogen bonds and the
additional interactions between nanoparticles and water molecules could be replaced for
those broken hydrogen bonds. That is, those interactions could cause an increase in hfg.
Recently, M. Mehregan et al. proposed a formula for nanofluids’ hfg, given earlier as Eq.
(1). [27] Also, C. Gerardi et al. [27] presented the effective volume fraction φ′,
φ′ = φ[1 + hSAρP]
(7)
where φ is the volume fraction, h the thickness of the ordered layer, SA the Brunauer-
Emmett-Teller (BET) surface area, and ρP the density of the nanoparticles [14]. Based on
Eq. (6) with the effective volume fraction change based on existing parameters [10] [27],
hfg of 0.1% by volume aqueous graphite (hydrophobic) nanofluid could be increased up to
~2%. However, this ignores various mechanisms, including the density change of water
and nanoparticles, the localized (volumetric) high fluid temperatures surrounding the
nanoparticles caused by laser absorption (the hydrophobic interaction highly depends on
temperature), and size-dependent boiling point changes. Therefore, a considerable increase
of hfg could be realized if such additional mechanisms are included. Furthermore, again
based on Eq. (6), the hfg of 0.1% by volume aqueous silver nanofluid could be decreased

35
up to ~1%. In addition, based on a Hamaker constant calculation, the surface melting of
silver nanoparticles in water prevents interactions between water molecules and silver
nanoparticles [10]. Therefore, the broken hydrogen bonds could not be replaced by those
interactions when surface melting of silver nanoparticles occurs. Therefore, a decrease in
hfg in silver nanofluid could also be realized.
The results in Tables 6-8 motivated an extension of the original experiments [10]:
investigate the effects of nanoparticle volume fraction and size on hfg. To obtain a better
fundamental understanding of this phenomenon, this section reports an experimental
quantification of hfg for volumetric vapor generation in aqueous nanofluids in order to
investigate the mechanism of the decreased and increased hfg in the nanofluids using laser-
based experiments. As shown in Figs. 12(a) and 12(b), volume fractions ranging from
0.005% to 2% of aqueous nanofluids were prepared with 30-nm±2nm and 100-nm±2nm
graphite nanoparticles, and 20-nm±2nm, 50-nm±2nm, and 100-nm±2nm silver
nanoparticles.
These nominal diameters were measured by Dynamic Light Scattering (DLS, Nicomp
380ZLS). For the graphite nanofluids shown in Fig. 12 (a), hfg gradually increases with
increasing concentration, up to 1% volume fraction, and then decreases thereafter due to
highly unstable and agglomerated nanoparticles.

36
(a)
(b)
Figure 12 (a) Measured Latent Heat of Vaporization in Graphite Nanofluids and
(b) in Silver Nanofluids (the Trends are Changed after 1% Volume Fraction),
Including Calculated Latent Heat of Vaporization in Graphite and Silver
Nanofluid Using Eq. (1) based on Changes in the Volume Fraction [14].
Eq. (1)
Eq.(1)

37
Based on these limited data, the size of the nanoparticles has a small effect on hfg, with
smaller-sized nanoparticles apparently causing a slightly greater change in hfg relative to
that for pure water. Similarly for silver nanofluids (Fig. 12(b)), hfg decreases with
increasing volume fraction up to 1%, with smaller nanoparticles causing a greater change
in hfg. The change in behavior at 1% volume fraction is discussed further below with respect
to the total surface area of the nanoparticles.
The calculated hfg in aqueous graphite and silver nanofluids using Eq. (1) with
volume fraction changes is in Figs. 12(a) and 3(b). From Eq. (1) with water density (0.9584
g cm-3), silver density (10.49 g cm-3), graphite density (2.23 g cm-3), water boiling
temperature (373.15 K), silver boiling temperature (2435 K), graphite boiling temperature
(5800 K), pure water hfg (2257 kJ kg-1), pure silver hfg (2356 kJ kg-1), and pure graphite hfg
(29650 kJ kg-1), the hfg of silver nanofluid and graphite nanofluid can be obtained.
That is, hfg of aqueous graphite nanofluid increased and hfg of silver nanofluid
decreased as the volume fraction increases. The results indicate similar qualitative trends
as the experimental results in Figs. 12 (a) and 12 (b). However, these theoretical results are
limited, since they neglect other properties (i.e. surface tension and viscosity) and physical
phenomena (agglomeration and effective volume fraction change). A model which
incorporates these would be able to predict hfg more accurately, and will be discussed in
Chapter 3.
With the exception of volume fractions greater than 1%, the results in Fig. 12 show
that size and volume fraction are both important, which leads to the hypothesis that surface
area is a key parameter for the observed changes in hfg. Accordingly, the change in hfg
relative to that for pure water (with surfactant) is plotted as a function of total nanoparticle

38
surface area in Fig. 13. In Fig. 13, hfg of graphite nanofluids increases as the surface area
of nanoparticles increases, and hfg of silver nanofluids decreases as the surface area of
nanoparticles increases, except for the points representing a volume fraction of 2%. That
is, Fig. 13 indicates the same trend for both graphite and silver nanofluids, increasing the
absolute value of the hfg difference with increasing surface area up to that corresponding to
a 1% volume fraction.
Figure 13. Absolute Values of the Increased hfg for Graphite and Aluminum
Oxide Nanofluids [7] and the Decreased hfg of Silver Nanofluids relative to that
for Pure Water with Surfactant (2132 kJ kg-1) (%) [7] in terms of Surface Area
Changes, Compared with Ameen’s Results for Aluminum Oxide Nanoparticles
[7]. That is, the Relative Change in hfg Increases with Increasing Surface Area.
The Trends Change at the Circled Points near 2% Volume Fraction for Silver
and Graphite Nanofluids because of Agglomeration.
0
20
40
60
80
1E-09 0.0001 10 1000000
Rela
tive C
han
ge i
n L
ate
nt
Heat
(ab
solu
te v
alu
e),
in
%.
Surface area (cm2 g-1)
Graphite (30, 100nm) nanofluid
Silver (20, 40, 100nm) nanofluid
Aluminum oxide (0.58, 0.64, 0.65, 0.68nm) nanofluid [7]

39
This suggests that these phenomena (increased and decreased hfg) are possibly
caused by the number of interactions between nanoparticles and water molecules.
Increased hfg in graphite nanofluid can potentially be explained by additional interactions
between graphite nanoparticles and water molecules. However, decreased hfg in the silver
nanofluid could be related to the surface melting of silver nanoparticles in water because it
prevents interactions between water molecules and silver nanoparticles, as is indicated by
a Hamaker constant calculation shown later in Chapter 4 [28]. As a result, the broken
hydrogen bonds could not be replaced due to the surface melting, and a decrease in hfg
could also be realized.
However, as shown in Figs. 12(a) and 12(b), 2% volume fractions of graphite and
silver nanofluids indicate that the hfg of the nanofluids suddenly approach the standard hfg
of pure water even though the surface area of the nanofluids increases as is shown in Fig.
13. This is explained by the fact that agglomeration substantially increased at volume
fractions around 2%. Particle size (indicating the extent of agglomeration) was observed
before and after heating by a Dynamic Light Scattering instrument (DLS, Nicomp 380
ZLS). As shown in Figs. 14 (a) and 14 (b), graphite nanoparticles were highly agglomerated
during the heating process, from 48nm ± 2nm to 178 ± 2nm, and the silver nanoparticles
in water also changed their size from 27nm ± 2nm to 90nm ± 2nm after heating.
According to this measurement, the surface area of silver and graphite nanoparticles
is reduced due to the agglomeration. Therefore, the trend in hfg for graphite and silver
nanofluids changes direction and returns to the standard hfg of water beyond 1% volume
fraction. Motivated by this experimental evidence, all the results was plotted together in
Fig. 13 to determine if surface area was the key parameter. As the surface area of the

40
nanoparticles increases, the latent heat change also increases. In other words, the variation
of hfg in silver and graphite nanofluids depends on the surface area, when the agglomeration
rate is not significant. Although surface area appears to be the most important parameter,
there are several underlying phnenomena that can change the surface area which could be
explored.
As mentioned in this chapter, nanoscale effects such as possible surface melting of
silver nanoparticles that hinders the interactions between water molecules and silver
nanoparticles and hydrophobic interactions of graphite nanoparticles in pure water that
intensify the interactions between water molecules and graphite nanoparticles could also
be of importance [10] [19] [28] [29] [30] [31] [32]. These nanoscale phenomena could
answer the question why small amounts of nanoparticles can substantially vary the latent
heat of vaporization in water. These will be presented in Chapter 4.

41
(a)

42
(b)
Figure 14 Average Size Change of 2% Volume Fraction, 30-nm (a) Graphite Nanofluid
before Heating (48 ± 2nm, upper) and (178 ± 2nm, lower) after Heating, and (b) 2%
Volume Fraction, 20-nm Silver Nanofluids (27nm ± 2nm, upper) before Heating and
after Heating (90nm ± 2nm, lower)

43
2.4 Summary
In this dissertation, recent literature has proposed that the hfg in nanofluids is
increased due to the additional (volumetric) interactions between nanoparticles and water
molecules. The new results reported here indicate that hfg in graphite nanofluid can be
substantially increased, while hfg in silver nanofluid can be substantially decreased. In
addition, hfg with the changing surface area in terms of the volume fractions and the size of
the nanoparticles is investigated. As a result, the increased and decreased hfg in graphite
and silver nanofluids are highly related to the surface area and can be controlled by the
surface area due to the interactions between nanoparticles and water molecules. If
agglomeration can be avoided, then greater than 40% changes in hfg are possible. However,
it is not clear that this holds above the small volumes tested at the lab scale, i.e., it is not
yet clear if the hfg results can be applied to real-world applications such as solar steam
generators and latent thermal storage systems. Moreover, further study about nanoscale
phenomena is provided in Chapter 4 to investigate details of the decreased and increased
hfg, and attempt to explain these observations.

44
CHAPTER 3. MEASUREMENT OF THERMOPHYSICAL
PROPERTIES FOR LATENT HEAT OF VAPORIZATION IN
AQUEOUS SILVER AND GRAPHITE NANOFLUIDS
Experimental results of hfg in Chapter 2 indicate that by adding nanoparticles, it is
possible to significantly change hfg [10]. In addition, as discussed in Chapter 1, Ameen et
al. [7] reported the enhancement of hfg in Pt nanofluid using molecular dynamics (MD)
simulation. However, based on their approaches, the considerable variation in hfg of silver
and graphite nanofluids up to ± 30% could not be explained by the MD simulation.
Therefore, theoretical analysis for hfg is required to support the experimental results. In this
section, a conceptual analysis of hfg for aqueous nanofluids based on the modified Clausius-
Clapeyron equation is employed with the measured thermophysical properties, i.e., density
and surface tension. This approach can be used for developing improved understanding
about how hfg in silver and graphite nanofluids is altered.
3.1 Clausius-Clapeyron Equation for hfg
To explain the variation of hfg theoretically, the Calusius - Clapeyron equation is
required. To begin with, the Clausius-Clapeyron equation is derived from the Maxwell
equation, which can be expressed by [33]:

45
(∂S
∂v)
T= (
∂P
∂T)
v
(8)
where S is the entropy, v the specific volume, T the temperature, and P the pressure. During
a phase change from liquid to vapor, the pressure can be considered as a constant, the
saturation pressure [33]. Since the pressure is dependent on the temperature and
independent of the specific volume, the partial derivative (∂P
∂T) is treated as a total
derivative (dP
dT) and based on a P-T diagram, the specific volume can be considered as a
constant. Thus, for an isothermal liquid-vapor phase change process, an integration yields:
∫ dS
g
f
= ∫ (∂P
∂T)
v
g
f
dv
Sg − Sf = (dP
dT)
sat(vg − vf)
(9)
where g is saturated vapor, f saturated liquid, and sat the saturation condition. In order to
derive hfg with the Maxwell equation , the enthalpy relation is also required, and it is given
as:
hfg = TSfg (10)

46
At the phase change at constant temperature and pressure, the two phases are in equilibrium,
and the Gibbs free energy equals to zero. Therefore, the Gibbs free energy equation, Gfg =
hfg − TSfg, is modified as Eq. (10) [19]. Based on Eqs (9) and (10), the Clausius-Clapeyron
equation for hfg is derived and can be represented as:
hfg = Tvfg (
dP
dT)
sat
(11)
In Eq. (11), the specific volume, vfg , can be substituted by the density,
(ρf−ρg)/(ρfρg). In addition, the surface tension is given by [34] :
σ
14 =
[P](ρf−ρg)
M
(12)
where M is molar mass, [P] the parachor, σ the surface tension, and ρ the density.
The surface tension can replace (ρf−ρg) based on Eq. (12). Therefore, finally, substituting
vfg with (ρf−ρg)/(ρfρg) with Eq. (11) and modifying Eq. (11) with Eq. (12) provides a
method to determine hfg by measuring surface tension and density:
hfg =TMσ
14
[P]ρfρg(
dP
dT)
sat
(13)

47
The parachor can be derived from an empirical constant depending on the value of the
surface tension, density, and molecular mass before heating – i.e., at room temperature
[note: ρg is neglected because it is too small, compared to ρf]
[P] =σ
14M
ρf
(14)
The parachor is independent on temperature, thus it can be considered as a constant
for hfg calculation. Based on the experimental measurements, the boiling temperature and
the saturated pressure are identical for the fluids, therefore, the standard values of pure
water are used to derive hfg in nanofluids using Eq. (13). The molecular mass is calculated
based on the volume fraction of pure water, nanoparticles, and a surfactant [35]. Also, the
density of fluids is measured by a simple method, which is dividing mass by volume using
a graduated cylinder and a sensitive balance (Mettler Toledo, AB265S, 0.01mg accuracy)
while conducting the experiments at room temperature. The density of nanofluid can be
calculated by the volume fraction and the density of nanoparticles, and the density of the
base fluid [4] [36]. However, the non uniform heat distribution in the test sample due to the
locally heated nanoparticles by the volumetric heat source is difficult to be considered in
the calculation because the present model of density cannot be well matched with the
experimental results as temperature increases [36]. Therefore, in this dissertation, the
density of nanofluids is determined by experiments. Since the density of the fluids is highly
related to the strength of interactions, i.e., water-water interactions, water-nanoparticle
interations, the measured density of each fluid in Table 10 indicates the different values.

48
That is, it is possible to conclude that the interations in aqueous nanofluids could be
changed while conducting the experiments.
In addition, based on Eq. (13), the surface tension is also an important factor to
determine hfg in fluids, since temperature, molecular mass, parachor constant, gas density
and pressure were considered as constant while boiling. Therefore, the surface tension of
aqueous silver, graphite nanofluids, and pure water was measured by a tensiometer (Kruss
K100), and the values are shown in Fig. 15. The uncertainty of these measurements was
calculated by five trials and the averaged surface tension results. The results were validated
by comparing the standard value with experimental results of pure water without SDS. The
extrapolated surface tension of pure water without SDS based on the measurements is
59.68 mN m-1. It is close to the standard value (58.8 mN m-1) at 100 °C of pure water
without SDS. Therefore, the results in Table 9 from the fluids can be trusted. However, in
Fig. 16, the surface tension values for pure water without SDS are not included because
the values of pure water without SDS are much greater than other fluids. Therefore, it is
difficult to compare the results of all fluids.

49
(a)
(b)
Figure 15. The Surface Tension Changes in Nanofluids with 1% Surfactant as a
Function of the Temperature (a) the Measured Surface Tension from 30°C to
60°C, and (b) the Values between 70°C and 100°C were Extrapolated based on
the Results from 30°C to 60°C due to the Temperature Limitations of the
Tensiometer.

50
Table 9 The Measured (Averaged) and Extrapolated Surface Tension Results of
Fluids
Pure
water
(w/o
SDS)
Pure
water
(w/ SDS)
Graphite
nanofluid
(w/ SDS)
Heated
Graphite
nanofluid
(w/ SDS)
Ag
nanofluid
(w/ SDS)
Heated
Ag
nanofluid
(w/SDS)
30 °C 65.61 31.71 32.23 31.87 35.91 30.69
40 °C 64.74 31.57 32.14 31.79 35.79 30.58
50 °C 63.91 31.42 32.04 31.65 35.69 30.49
60 °C 63.07 31.27 31.92 31.52 35.58 30.37
70 °C* 62.22 31.12 31.82 31.40 35.47 30.26
80 °C* 61.38 30.98 31.71 31.29 35.36 30.16
90 °C* 60.53 30.83 31.61 31.17 35.25 30.05
100 °C* 59.68 30.68 31.51 31.05 35.14 29.94
* Indicate the extrapolated results based on the measured values from 30°C to 60°C.
3.2 Theoretical Results and Discussion
As a result, the theoretical results with the measured parameters in Table 10 indicate
the same trends as the experimental results for hfg in nanofluids. Table 10 shows the
calculated hfg values in nanofluids using Eq. (13) along with the measured surface tension,

51
densities, and corresponding parachor while conducting the experiments. The calculated
molar mass is also added in Table 10.
Table 10 The Theoretical Results of hfg in Nanofluids and Pure Water with
Surfactant, Based on Eq. (13)
Pure water
(w/ SDS)
Silver/water
nanofluid
(w/ SDS)
Graphite/water
nanofluid
(w/ SDS)
Surface tension (σ)
[mN/m] 30.68 29.94 31.05
Molecular mass (M)
[g/mol] 20.90 21.01 20.92
Density of liquid (𝜌f)
[g/cm3] 0.9713 ± 0.09 1.1086 ± 0.12 0.8901 ± 0.08
Density of vapor (𝜌g)
[g/cm3] 0.000598 0.000598 0.000598
Parachor ([P]) 50.31 50.92 50.42
Latent heat of
vaporization (hfg)
[kJ/kg]
2279 1972 2467
Measured latent heat
of vaporization (hfg)
[kJ/kg]
2132 1492 3341
Since the standard Parachor value for pure water is 51 [35], the measured Parachor
value (52.7) for pure water without SDS using Eq. (14) is reliable. Based on the results in
Table 10, there exists a 25% difference in hfg between the theoretical and the experimental
results. Therefore, nanoscale interactions between nanoparticles and water molecules

52
should be investigated. Therefore, Chapter 4 discusses nanoscale studies about the presence
of melted silver nanoparticles in water by volumetric heating and hydrophobic interactions
by graphite nanoparticles.

53
CHAPTER 4. NANOSCALE STUDIES FOR LATENT HEAT OF
VAPORIZATION IN AQUEOUS NANOFLUIDS
From Chapter 3, the surface tension and the density of nanofluids are different than
the comparable properties of pure water. Therefore, it is possible that placing the
nanoparticles in water could affect other thermophysical properties as well. That is, from
the enthalpy relation in Eq. (10), the entropy change, which is related to the surface tension
and the density is an important factor for increased or decreased hfg because the boiling
temperature and vapor entropy are the same for an aqueous nanofluid as for pure water.
For example, the variation of hfg in pure water can be calculated by Eq. (10). For pure water,
hfg (2257 kJ kg-1) can be obtained by the boiling temperature (373.15 K), the entropy of the
saturated vapor (7.3549 KJ kg-1 K-1) and the entropy of the saturated liquid (1.3669 KJ kg-
1 K-1) [33]. Since the boiling point in aqueous nanofluids (confirmed by thermocouple
measurements) and the entropy of the saturated vapor are not changed compared to pure
water, hfg in aqueous nanofluids could be determined by the entropy of the saturated liquid.
Therefore, the entropy change of the liquid nanoparticle suspension due to the nanoscale
interactions should be investigated to confirm the hfg variations. The following sections
therefore discuss the entropy change of aqueous nanofluids based on repulsion between
water molecules and nanoparticles caused by melting of silver nanoparticles using a
Hamaker constant calculation, and hydrophobic interactions of graphite nanoparticles,
since these could be primary reasons for increased or decreased entropy compared to the
value for pure water.

54
4.1 Low Temperature Melting of Silver Nanoparticles in Subcooled and Saturated Pure
Water
Only a few papers conclude that hfg in nanofluids is increased due to the additional
interactions between nanoparticles and water molecules [7] [11] [12]. However, in Chapter
2 of this dissertation results are presented that hfg in aqueous silver nanofluid could be
decreased when heated by a volumetric heat source, i.e., a 130-mW laser. To investigate
the reason, first a series of evaporation experiments with silver nanofluid, graphite
nanofluid, and pure water was conducted. The remaining fluid level for all fluids was
recorded every day and the fluid level after 30 days in a fume hood with the exact same
conditions, i.e., temperature, humidity, and pressure, showed the different results as
presented in Fig. 16. These results indicate that the evaporation rate of graphite and silver
nanofluids is much slower than that for pure water because surface forces of the nanofluids
are higher than that of pure water. That is, at room temperature, adding nanoparticles in
water can always increase interaction forces.
Also, low power input (80mW, less than the laser power output (130mW))
experiments in silver nanofluid using a power supply and hot wire in Fig. 8 were conducted
to investigate whether a relatively low temperature (130 C) immersed hot wire could
affect the decreased hfg in aqueous silver nanofluid. This experiment led to a measured hfg
in aqueous silver nanofluid of 2536 kJ kg-1, i.e., greater than that for pure water (2267 kJ
kg-1) [10]. In other words, reducing the temperature of the heat source reversed the change
in hfg.

55
(a)
(b)
Figure 16. Fluid Level Changes due to the Evaporation Rate Difference for
Graphite Nanofluid with SDS, Silver Nanofluid with SDS, and Pure Water (a)
Front Sides, and (b) Back Sides (from the left: Graphite Nanofluid, Silver
Nanfluid, and Water)
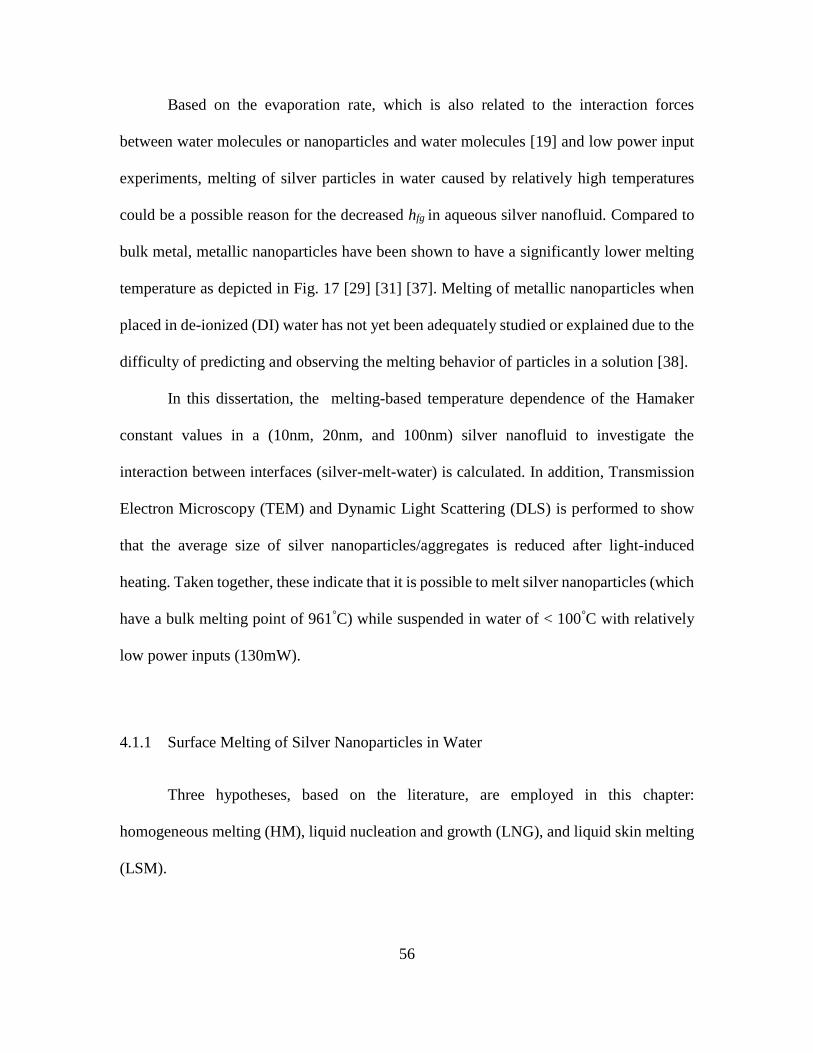
56
Based on the evaporation rate, which is also related to the interaction forces
between water molecules or nanoparticles and water molecules [19] and low power input
experiments, melting of silver particles in water caused by relatively high temperatures
could be a possible reason for the decreased hfg in aqueous silver nanofluid. Compared to
bulk metal, metallic nanoparticles have been shown to have a significantly lower melting
temperature as depicted in Fig. 17 [29] [31] [37]. Melting of metallic nanoparticles when
placed in de-ionized (DI) water has not yet been adequately studied or explained due to the
difficulty of predicting and observing the melting behavior of particles in a solution [38].
In this dissertation, the melting-based temperature dependence of the Hamaker
constant values in a (10nm, 20nm, and 100nm) silver nanofluid to investigate the
interaction between interfaces (silver-melt-water) is calculated. In addition, Transmission
Electron Microscopy (TEM) and Dynamic Light Scattering (DLS) is performed to show
that the average size of silver nanoparticles/aggregates is reduced after light-induced
heating. Taken together, these indicate that it is possible to melt silver nanoparticles (which
have a bulk melting point of 961°C) while suspended in water of < 100°C with relatively
low power inputs (130mW).
4.1.1 Surface Melting of Silver Nanoparticles in Water
Three hypotheses, based on the literature, are employed in this chapter:
homogeneous melting (HM), liquid nucleation and growth (LNG), and liquid skin melting
(LSM).

57
Figure 17. Size-Dependent Melting Temperature (°C) Change based on the
Gibbs-Thomson Equation [30] [31], where T is the Temperature of the
Nanoparticle, Tbulk the Melting Temperature of Bulk Ag, θ Surface Energy, M
Atomic Mass, ∆Hm Melting Enthalpy, ρ Density, and R the Diameter of the
Nanoparticles [31].

58
(a)
(b)
(c)
Figure 18. Three Hypotheses for the Melting of Nanoparticles Suspended in a
Solution: (a) Homogeneous Melting (HM) (b) Liquid Nucleation and Growth
(LNG) (c) Liquid Skin Melting (LSM)

59
HM is that the entire solid is in equilibrium with the entire melted particles without surface
melting, LNG is the process that a liquid layer nucleates and grows with temperature, and
LSM considers the formation of a liquid layer over the solid core at a low temperature that
remains unchanged until the solid particle transforms completely to liquid at the melting
temperature [37]. All three have been suggested for the melting of nanoparticles [37] and
are described in Fig. 18. To support these hypotheses, researchers have conducted in-situ
experiments using a conduction-based heat input with TEM over a certain time period in
order to identify the melting of metallic nanoparticles [29] [31] [32] [37]. The results
indicate that there is decreased diameter of 8nm-sized silver nanoparticles after 740s as
temperature is increased up to 627 ⁰C [32]. Therefore, liquid skin melting (LSM), which is
surface melting of nanoparticles, could occur during the heating. In other words, surface
melting of metallic nanoparticles in a fluid could possibly be realized during high
temperature heating since thermophoresis would tend to move particles out of the heated
region of the sample before the entire nanoparticle melts.
4.1.2 Hamaker Constant for Surface Melting-Based Aqueous Nanofluid
In order to experimentally investigate the melting of silver nanoparticles by light
(volumetric) absorption, near-field phenomena have to be considered, such as the
interactions between silver nanoparticles and the water molecules. Therefore, to investigate
dispersion forces, which are Van der Waals (VdW) interaction forces between interfaces,
a size-dependent Hamaker constant can be determined [39] [40]. The Hamaker constant is
useful since it accurately quantifies the interactions of particles. The Hamaker constant is

60
defined for a Van der Waals two-body potential [39] [40]. A large value of the Hamaker
contant means strong Van der Waals two-body forces compared to a smaller value [19].
Positive Hamaker constant describes that two bodies is attractive, whereas negative
Hamaker constant can be repulsive between two particles [19]. The size-dependent
Hamaker constant of silver nanoparticles in water or vacuum can be found based on the
Lifshitz theory, which calculate the forces in terms of dielectric constants of materials and
refractive incices [39]. Also, during melting, three phases will be present (solid-melt-vapor),
which can be calculated for metals and semiconductors [41]. Even though melting of silver
nanofluids has been studied, a temperature-dependent Hamaker constant which considers
the influence of the melting in ambient pressure, subcooled, and saturated water-based
silver nanofluids has not yet been determined [17] [42]. Thus, it is proposed herein that a
non-retarded Hamaker constant (‘non-retarded’ is explained below) can be used to predict
melting for silver nanofluids with respect to near-field surface melting of silver
nanoparticles in water. The fundamental phenomena of this process are described in Fig.
19 (a), where 𝜀1 represents a silver nanoparticle with a range of sizes (diameters of 10nm,
20nm, and 100nm), 𝜀2 is water, and 𝜀3 is melted (liquid) silver. Dispersion forces between
various-sized silver nanoparticles and water can be approximated as two parallel plates
separated by the thickness of the melted silver layer, as shown in Fig. 19 (b) [39]. The Van
der Walls force is effective only up to several hundred angstroms. This is called the non-
retarded regime, and when the interaction is far apart, the force decays faster than 1/r6 (r is
the distance between two bodies). This is called the retarded regime [19] [43]. Thus, in

61
this dissertation, the non-retarded Hamaker constant A132 is calculated and can be described
by [19] [39] [43]:
A132 =3
4πℏw132
(15)
where ℏ is the Planck constant, and w132 the Lifshitz constant defined as [19] [32] [43]:
w132 = ∫ (ε1(iω) − ε3(iω)
ε1(iω) + ε3(iω)) (ε2(iω) − ε3(iω)
ε2(iω) + ε3(iω))
∞
0
dω
(16)
(a) (b)
Figure 19. Modeled Geometry of Surface Melting of Silver Nanoparticles in Water [39]

62
where 𝜀𝑛 (i𝜔) is the permittivity of the nth medium as a function of the imaginary frequency
i𝜔 [39] [41]. The Lifshitz constant is the theory relating the Hamaker constant to dielectric
constants of the materials [19]. The imaginary frequency i𝜔 is given by:
𝜀𝑛(i𝜔) = 1 +2
𝜋∫ (
𝑥 𝐼𝑚𝜀𝑛(𝑥)
𝑥2 + 𝜔2) 𝑑𝑥
∞
0
(17)
For example, a charge in the medium interacts with a surface of the other medium (an
image charge). Therefore, the imaginary frequency should be considered in the permittivity
calculation to calculate the interaction forces [19]. In order to obtain the size dependence
of the Hamaker constant [39], the size-dependent dielectric permittivity is required. The
size-dependent dielectric permittivity can be obtained from the size-modified Drude
permittivity [19] [32] [41]. Therefore, the size-modified dielectric permittivity of silver
nanoparticles is defined as [39] [44]
ε(ω, R) = 𝜀𝑏𝑢𝑙𝑘,𝐴𝑔(𝜔) + 𝜔𝑃
2 (1
𝜔2 + 𝛾∞2 −
1
𝜔2 + 𝛾(𝑅)2)
+ 𝑖𝜔𝑃
2
𝜔(
𝛾(𝑅)
𝜔2 + 𝛾(𝑅)2−
𝛾∞
𝜔2 + 𝛾∞2 )
(18)
where R is the radius of a silver nanoparticle, 𝜔𝑃 the plasma frequency, 𝛾 the electron
scattering rate, and 𝛾(𝑅) the modified scattering rate of metal. This is given as [39] [44]:

63
𝛾(𝑅) = 𝛾 + A 𝑣𝐹
𝑅
(19)
where A is a dimensionless constant of the order of 1, which is convenient to write the
scattering rate of metal [43] and 𝑣𝐹 is the Fermi velocity [39] [44]. Frequency-dependent
optical property data for subcooled water (25°C) is available up to 9.4 x 10¹⁵ Hz
(wavelengths of 200nm - 200µm), which includes the visible range of light [39] [45] [46].
However, such data for saturated water (100°C) are limited to a small region of
wavelengths (0.2µm - 2µm), thus a reliable Hamaker constant for saturated water could
not be obtained [47]. Therefore, in this dissertation, only subcooled water is considered in
the calculation of the temperature-dependent Hamaker constant of aqueous silver nanofluid.
Moreover, experiments to measure the optical properties at high temperature for solid and
liquid silver have rarely been conducted [47]. Therefore, a temperature-dependent Drude
model is used to determine the dielectric permittivity - i.e. 𝜀𝑏𝑢𝑙𝑘,𝐴𝑔(𝜔) in Eq. (22) of solid
nanoparticles and molten silver [48] [49] [50]:
ε𝑏𝑢𝑙𝑘,𝐴𝑔(ω) = ε1(ω) − 𝑖ε2(ω) (20)
ε1(ω) = 1 −
𝜎0𝜏
𝜀0
1
[1 + (ω𝜏)2]
(21)

64
ε2(ω) =
𝜎0
𝜀0ω
1
[1 + (ω𝜏)2]
(22)
where 𝜎0 is the electrical conductivity, 𝜀0 the vacuum permittivity, and 𝜏 the collision
time for electrons [48] [49] [50]:
τ =𝜎0𝑚𝑒
𝑛𝑒𝑒2
(23)
where 𝜎0 is the electrical conductivity, 𝑚𝑒 the effective electron mass, 𝑛𝑒 the electron
density, and 𝑒 the electron constant. The electron density is defined as [48] [49] [50]:
𝑛𝑒 = 𝑁𝑣𝑎𝑙
𝜌
𝑢
(24)
where 𝑁𝑣𝑎𝑙 is the number of electrons in the valence band, 𝜌 the mass density of the silver,
and u the molecular weight of the silver. The parameters for Eqs. (15)-(24) are taken from
the literature, and are given in Table 11 [39] [48] [49] [50] [51].

65
Table 11 Parameters for the Calculation of the Temperature-Dependent Dielectric
Permittivity of Solid and Liquid Silver (Melting Temperature is Calculated Based
on the Eq. in Fig. 16.
Parameter
Description
Value
𝝎𝑷
Plasma frequency
5.08 x 10¹⁵ s-1
𝜸
Electron scattering rate
0.01𝜔𝑃
𝒗𝑭
Fermi velocity
1.39 x 10⁶ ms-1
𝝈𝟎
Electrical
conductivity of silver
2.04 x 10⁷ Sm-1 at melting point of 10nm
diameter size (~527 °C)
1.56 x 10⁷ Sm-1 at melting point of 20nm
diameter size (~727 °C)
1.24 x 10⁷ Sm-1 at melting point of 100nm
diameter size (~927 °C)
2.04 x 10⁷ Sm-1 at 961⁰C (Liquid)
𝝆
Density of silver
9,864 kg-m-3 at melting point of 10nm
diameter size (~527 °C)
9,613 kg-m-3 at melting point of 20nm
diameter size (~727 °C)
9,363 kg-m-3 at melting point of 100nm
diameter size (~927 °C)
9,320 kg-m-3 at 961 °C (Liquid)
In Eqs. (20)-(22), the density and electrical conductivity are functions of temperature [48]
[49] [50] [51]. Therefore, those are used for calculating a temperature-dependent dielectric
permittivity. The co-authors have examined laser spot temperature in small volumes, which
indicates very high local temperatures (over 330 ⁰C) are possible [15]. However, there is
no way to directly measure the melting temperature of silver nanoparticles in water at
present. Thus, the melting point is calculated using the equation in Fig. 16.

66
The dielectric permittivity of liquid silver can be derived from those parameters as
shown in Table 11 at the temperature of 961⁰C [48] [49] [50] [51]. The melting temperature
of a silver nanoparticle, however, is a function of particle size due to the increased surface
area [29] [30] [31]. Thus, to calculate the dielectric permittivity of solid silver, the values
of electrical conductivity and density with reduced melting temperature are used. Based on
Eqs. (15)-(24), and the parameters in Table 11, the non-retarded Hamaker constant of
water-based silver nanofluid was found by numerically integrating Eq. (16) using the
trapezoidal rule in Matlab and is shown in Table 12.
Table 12 Calculated Hamaker Constant Values A132 zJ (zepto Joule, 10 -21) at the
Melting Temperature of Various-Sized Silver Nanoparticles in Subcooled (25°C)
Water.
System 10nm 20nm 100nm
Ag-melt-H2O -1.62 -1.05 -0.36
The values of the Hamaker constants in Table 12 indicate the interaction between
two interfaces (Ag:melted Ag and melted Ag:water). The negative values indicate
repulsion between the interfaces [41]. Table 12 indicates the repulsive force changes in
different-sized particles. That is, 10nm-sized particles have stronger repulsive force than
20nm and 100nm-sized nanoparticles. Therefore, if melting would occur around silver

67
nanoparticles, in this regime, it is possible that a partially or fully melted particle would
have a tendency to break apart and form smaller particles [52]. In other words, this would
be observable in the form of a size reduction in the particles after heating. Other factors
such as unstable particles settling out upon heating or deagglomeration could also lead to
particle size reduction. However, if several experiments consistently show a similar particle
size reduction after heating, the melting could be a dominant factor. Thus, particle sizes
before and after heating experiments were measured to determine if melting is possible in
saturated and subcooled aqueous silver nanofluids.
4.1.3 Experimental Approach and Discussion
In order to identify the reduction (if any) of the average particle size after heating,
an experimental apparatus was set up with the configuration shown in Fig. 20 [10] [28].
For the nanofluid preparation, the two-step method was employed [10] [15]. At present
only 20nm-sized silver nanopowder could be obtained. Thus, 20nm-sized silver
nanoparticles, which were purchased from Navecentrix, Inc., were dispersed in deionized
(DI) water using a sonicator (model UP200S from Hielscher, GmbH) for the experiments.
In addition, 1% by volume sodium dodecyl sulfate (SDS) was added for stabilizing the
silver nanoparticles in the DI water [15].

68
(a)
(b)
Figure 20. (a) Schematic Diagram of the Set-Up for Boiling Experiment of
Silver Nanofluid with Laser (b) Schematic Representation of Test Cell with
Thermal and Optical processes

69
The test cell was a transparent quartz-based square cuvette of size 2mm x 2mm x 35mm as
shown in Fig 20 (b). The heat was input by a continuous, 130mW, 532nm laser, and a
secondary heat input was provided with an air heat gun to maintain constant surrounding
temperatures near the boiling temperature (e.g. 100 ⁰C) of water. This approach for
minimizing heat loss was chosen (over thermal insulation) to maintain optical access to the
sample. A 150-mm focal length spherical lens was used to concentrate the input laser light
to achieve high irradiance [15]. Bubbles in the test cell were observed with a Retiga
charged coupled device (CCD) camera during the experiments. Once the DI water-based
silver nanofluid reached the boiling temperature, which took 1 min using a heat gun, the
laser was turned on to illuminate the silver nanofluid for a duration of 20 min. In addition,
the laser-based experiment without the air heat gun was also conducted to identify the
melting of silver nanoparticles in subcooled fluid temperature. Additional details are
provided in [10]. Based on the melting hypothesis with the calculation of the Hamaker
constant, which indicates repulsion between the interfaces, a decreased size of particles
after the laser heating may imply the melting of silver nanoparticles in water [19]. In order
to investigate changes in particle size and morphology, Transmission Electron Microscopy
(TEM) and Dynamic Light Scattering (DLS) were employed. Figures. 21 (a) - (c) show the
TEM images of unheated/heated silver nanoparticles.
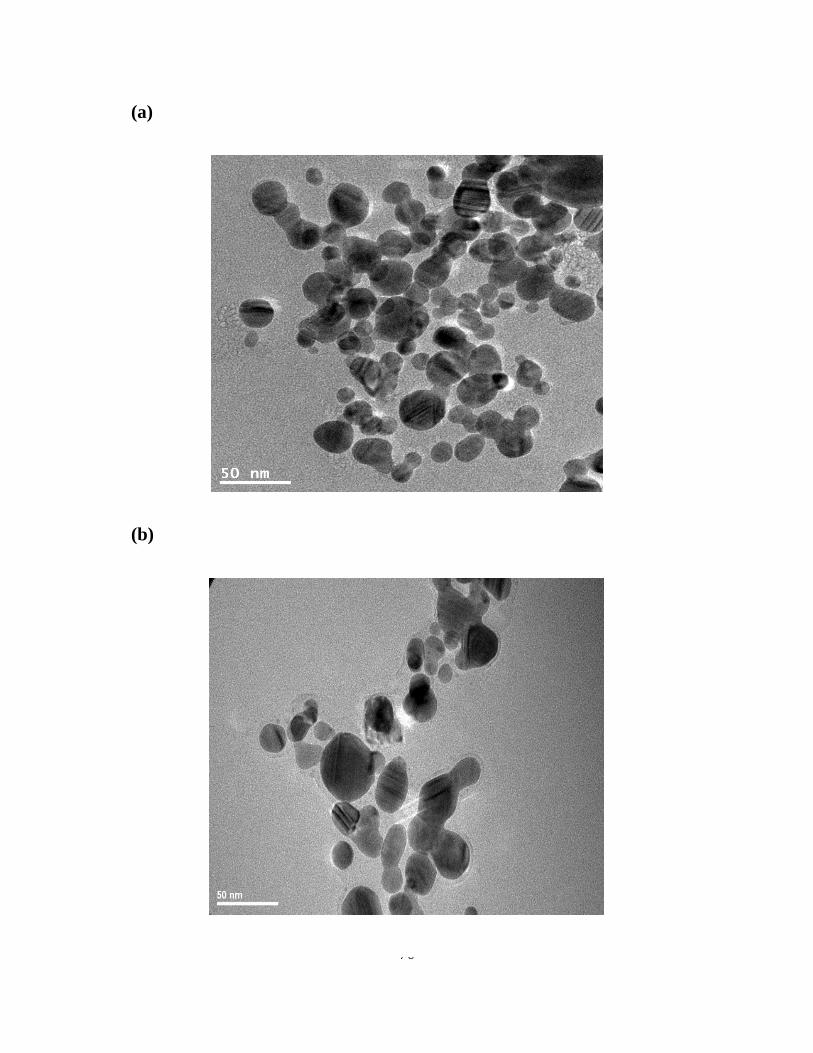
70
(a)
(b)
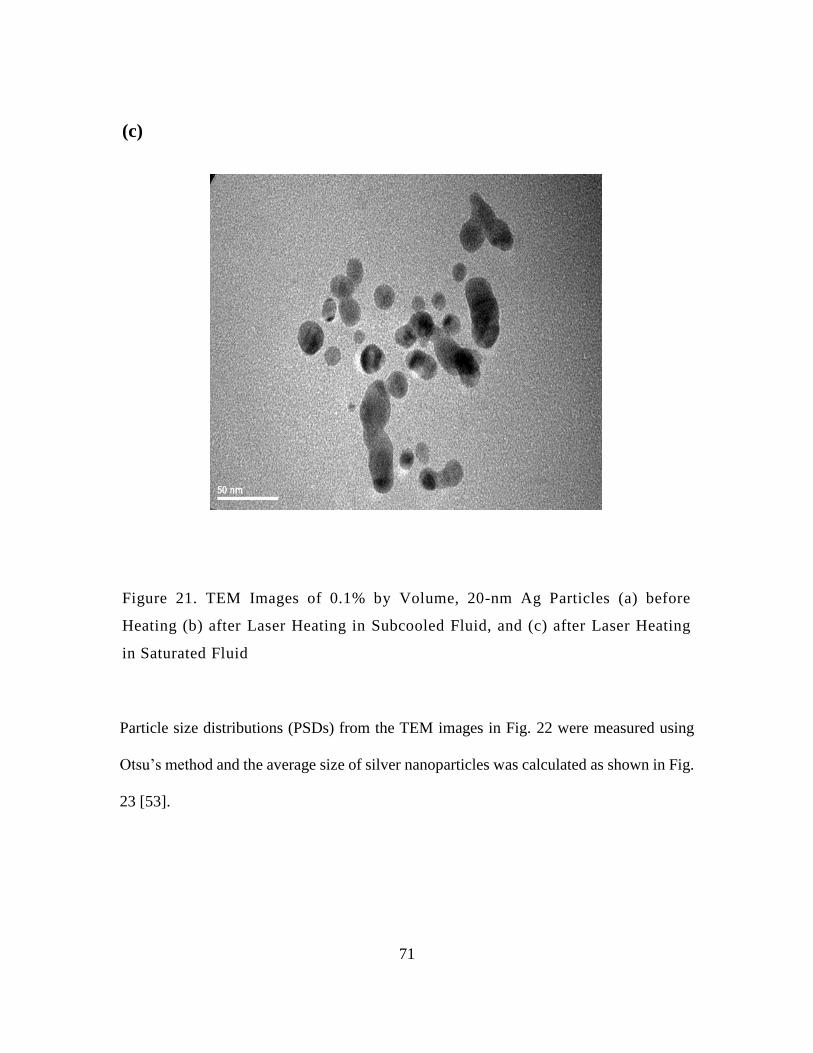
71
Particle size distributions (PSDs) from the TEM images in Fig. 22 were measured using
Otsu’s method and the average size of silver nanoparticles was calculated as shown in Fig.
23 [53].
(c)
Figure 21. TEM Images of 0.1% by Volume, 20-nm Ag Particles (a) before
Heating (b) after Laser Heating in Subcooled Fluid, and (c) after Laser Heating
in Saturated Fluid

72
(a)
(b)
0 50 100 150 200 2500
5
10
15
20
25
30
35
40
45
50
Particle diameter (nm)
Counts
0 100 200 300 400 500 6000
50
100
150
200
250
300
350
Particle diameter (nm)
Counts

73
These results show that the average particle size decreases after laser-based heating,
especially for particles suspended in saturated DI water. Thus, surface melting of the
particles could be realized in ambient pressure, saturated, and even subcooled water.
(c)
Figure 22. Histograms of Particle Size Distributions Measured from the TEM
Images in Figure 5 of (a) Particle Size Distribution before Heating (Mean =
42.9nm) (b) Particle Size Distribution after Laser Heating in Subcooled Fluid
(Mean = 41.4nm), and (c) Particle Size Distribution after Laser Heating in
Saturated Fluid (Mean =32.5nm)
0 50 100 150 200 2500
5
10
15
20
25
30
35
40
45
Particle diameter (nm)
Counts

74
(a)
(b)

75
The silver nanofluid samples were also repeatedly measured with DLS, and the results
averaged using a volume-weighted distribution method [54]. DLS can maintain the
accuracy of measurement to ±3% and was calibrated by its manufacturer. The uncertainty
of the experimental data was calculated at the 95% confidence level. Figures 23 (b) and (c)
indicate a decrease in particle size in silver nanofluid compared to Fig. 23 (a). The average
sizes from the TEM measurements in Fig. 21 are different from those by the DLS
(c)
Figure 23. Volume-Weighted Ag Nanoparticles (Initially 20 nm) Size
Distribution Measured with Dynamic Light Scattering (DLS, Nicomp
380/ZLS) of 0.1% by Volume Nanofluid (a) before Heating (b) after Laser
Heating in Subcooled Fluid, and (c) after Laser Heating in Saturated Fluid
76
measurements in Fig. 23, perhaps because the number of silver nanoparticles in the
measurements is very different. Both sets of results, however, imply that melting of silver
nanoparticles could occur during highly concentrated laser heating. As shown in Fig. 22
(b) and Fig. 23 (b) for subcooled fluid, the results indicate only a marginal decrease in the
average particle size compared to the unheated samples in Fig. 22 (a) and Fig. 23 (a),
respectively, and less than the corresponding results from saturated fluid in Fig. 22 (c) and
23 (c). A possible explanation for this result is that the rate of heat transfer from silver
nanoparticles in subcooled water (70 °C due to the thermal losses) could be much higher
than the rate of heat transfer from silver nanoparticles in saturated water (100 °C) [6]. Thus,
even though there appears to be melting of silver nanoparticles in subcooled water, the rate
of melting could be much lower. Therefore, this effect could contribute to the small
observed decrease of average particle size in subcooled fluid compared to that in saturated
fluid.
The object of this chapter is to investigate possible melting of silver nanoparticles
in water. As such, the Hamaker constant is theoretically analyzed and experiments using
silver nanofluid are conducted with TEM and DLS. For this research, surfactant is applied
as a stabilizer for the silver nanoparticles in water, however, it could also affect the optical
and thermal properties of the nanofluid [10] [19] [43], and therefore could be one of the
factors affecting the melting of silver nanoparticles in water. In addition, the morphology
of silver nanoparticles could also affect melting, since surface area can be increased by the
shape of nanoparticles. Thus, further study is required to investigate the details of the
melting of silver nanofluid. Usually, the entropy of the water increases when the hydrogen
bonds are broken [19]. From the Hamaker results, the repulsion could occur between

77
nanoparticles as well as between water molecules and nanoparticles. Therefore, water
molecules and nanoparticles could freely move, compared to pure water. That is, the
entropy of silver nanofluid increases with surface melting of silver nanoparticles. As a
result, this entropy change of silver nanofluid could be a crucial reason for decrease in hfg.
Furthermore, silver nanoparticles have a negative effect on human health and the
environment since silver nanoparticles appear to be toxic [55], making improved
understanding of their melting processes and subsequent size changes an important topic
for further research.
4.1.4 Summary
In this dissertation, the Hamaker constant of melted and solid silver nanoparticles
in water, which indicates negative values (repulsion) of the interfaces is calculated. That
is, if melting is possible in silver nanofluid, the repulsion force may cause the melted part
to separate from the remaining solid particle, and therefore a particle size reduction is
confirmed. Laser-heated boiling experiments on aqueous silver nanofluids were also
conducted and smaller particles after heating were observed based on TEM and DLS. Thus,
it is possible that melting of silver nanoparticles in water is occurring. Based on the melting
of aqueous silver nanofluids, the interactions between nanoparticles-
nanoparticles/nanoparticles-water molecules can be reduced due to the repulsion between
silver nanoparticles and water molecules [28]. That is, the repulsion leads to an increase in
the entropy of aqueous silver nanofluid. With further experiments, this is relevant to
applications where it has been proposed to heat metallic nanoparticles for solar thermal
applications and hyperthermia nanomedicine treatments [6] [56] [57] [58].

78
4.2 Hydrophobic Interactions of Graphite Nanoparticles in Saturated Water
Hydrophobic interactions occur between hydrophobes and water molecules [19].
The main reason for hydrophobic interactions is that water molecules reduces their
rotational and translational freedom, which is related to low entropy when water molecules
are close to hydrophobes . The low entropy of the water in the interfacial region is caused
by the strong directional forces between water molecules [19]. These hydrophobic
interactions with low entropy have an impact on hfg [19] [28]. Since graphite is a
hydrophobic material, the theoretical investigation of the interactions between graphite
nanoparticles and water molecules in aqueous graphite nanofluid could be helpful to
determine the hydrophobic interactions of aqueous graphite nanofluids. In general, when
hydrophobes (graphite nanoparticles) are placed in water, hydrogen bonds between water
molecules are broken to make room for them without a chemical reaction [19]. Then, the
water molecules’ structure is distorted by the presence of the graphite nanoparticles. As a
result, this makes a new hydrogen bond, which is an ice-like cage (clahrate) structure
around agglomerated hydrophobes, as shown in Fig. 24 [19] [59] [60] [61]. This structure
makes the system more stable, thus the entropy of the fluid could be decreased [19] [62].

79
Figure 24. Clathrate Structure by Presence of the Graphite Nanoparticles in Pure
Water
That is, based on Eq. (14), hfg can be increased because the entropy of the liquid is
decreased due to the hydrophobic interactions between the graphite nanoparticles and water
molecules. The decreased liquid entropy leads to an increase of the total entropy, i.e., Sfg
(=Sg-Sf) if the entropy of the vapor is the same as that of pure water. The hydrophobic
interactions are relatively stronger than van der Waals interactions or hydrogen bonds [19].
Also, adding hydrophobes in water makes both hydrophobic bonds and existing hydrogen
bonds stronger [63] [64]. Therefore, it could be a cause of the high (~30%) hfg increase at
0.1 % by volume aqueous graphite nanofluid, compared to the value of pure water as
suggested in Chapter 2.
In addition, the strength of hydrophobic interactions depends on temperature, the
number of carbons on the hydrophones, and the shape of the hydrophobes [19] [59]. The
strength of the hydrophobic interactions greatly increases as temperature increases due to

80
the enhancement of the reactions between hydrophobes. Also, the large number of carbon
atoms could make the hydrophobic interactions even stronger. Lastly, the shape has
something to do with the contact area between the hydrophobes and water molecules.
From the experiments, the laser spot temperature for laser-heated sample was
relatively high, ~300 °C [15]. Therefore, the temperature of the graphite nanoparticles
could increase up to that point since heat transfer from the nanoparticles to the liquid could
be limited due to the vapor layer around nanoparticles [16] [17]. Thus, a structural change
of the water molecules (stable hydrogen bonds) could actively occur, and it could make
not only the hydrogen bonds stronger, but also the entropy change of aqueous graphite
nanofluid reduced, which leads to an increase in the total entropy (Sfg). As a result, hfg in
aqueous nanofluid could be significantly increased even with a small amount (0.1% volume
fraction) of graphite nanoparticles in water. Contrary to the repulsion between
nanoparticles in silver nanofluid, agglomeration between nanoparticles in graphite
nanofluid is likely to occur. Due to this reason, the structure of hydrogen bond changes in
graphite nanofluid leads to the reduction of liquid entropy. In sum, hfg in silver nanofluid
and graphite nanofluid decreased and increased, respectively, due to the different entropy
changes in the liquid nanoparticle suspensions.

81
CHAPTER 5. SOLAR THERMAL APPLICATION
In this section, applying the modified hfg results of graphite and silver nanofluids
in a solar thermal system is proposed to investigate the performance of the system. The hfg
results in Chapter 2 indicate that hfg can be increased or decreased by adding graphite or
silver nanoparticles in water. The decreased hfg in aqueous silver nanofluids could be
beneficial for real-world solar thermal collectors because more vapor from silver nanofluid
can be obtained, compared to that of pure water. Therefore, a silver nanofluid-based solar
thermal collector could lead to improve system thermal efficiency. This section discusses
the applicability of efficient aqueous silver nanofluid-based solar thermal collectors with
the increased hfg . In addition, the increased hfg in graphite nanofluid could be used for
enhancing thermal storage capability because the graphite nanofluid can be used to store
more thermal energy than pure water. Therefore, solar thermal storage based on graphite
nanofluid is also discussed in this section,
5.1 Vapor Power Systems - Rankine Cycle
Since only water-based nanofluids are considered in this dissertation, steam Rankine
thermal cycles are appropriate to investigate the applicability of silver nanofluid as a
working fluid in solar thermal system. The Rankine cycle is the fundamental operating
cycle for plants that include fluid evaporation and condensation processes [33], as shown
in Fig. 25. Since the Rankine cycle consists of internally reversible processes, the working
fluid is considered to pass through the internally reversible proceses, i.e. insentropic

82
expansion through the turbine, insentropic compression in the pump, and heat transfer at
boiler and condenser at constant pressure.
5.2 Nanofluid-Based Solar Thermal Collector
Most electrical generating vapor power plants employ water as the working fluid
because it is stable and easy to use. [33] Therefore, aqueous nanofluids with small volume
fractions could be employed to increase the overall efficiency of the plants. As shown in
Fig. 26, the overall Rankine cycle-based plants consist of four major subsystems, i.e., boiler,
Figure 25. Typical Rankine Cycle

83
turbine, condenser, and pump [33]. The volumetric aqueous silver nanofluid-based solar
thermal collector acts as both a collector and a boiler. It is used for generating vapor by
capturing sunlight, and then the vapor exits to the turbine to generate electricity. Then, the
vapor passes through the condenser, where it condenses to saturated liquid water (pure,
with no nanoparticles). Finally, the saturated pure liquid water goes back to the collector,
is mixed with the remaining highly concentrated nanofluid, and repeats the cycle [33].
Figure 26. Components of a Nanofluid-Based Solar Thermal System

84
Figure 27. Preparation of Silver Nanofluids in a Cycle
In Fig. 26, state point 1 is pure saturated water vapor, state point 2 is a two-phase mix of
pure liquid water and vapor, state point 3 is pure saturated liquid water, and state point 4 is
pure compressed liquid water. The values of heat transfer and work can be obtained by
applying the first law of thermodynamics to each process. Figure 27 indicates how to
prepare silver nanofluid in a cycle. Nanoparticles are assumed to remain in the collector,
where they are mixed with pressurized water from the pump. Then, the well-mixed silver
nanofluid returns to the collector to generate vapor. Compared to the heat input, the mixing
energy is relatively small. Therefore, it is ignored in this section. In this Rankine cycle, the
work of the turbine (Wt) assuming isentropic expansion can be calculated by:

85
Wt = m (h1 − h2)
(25)
where m is the mass flow rate, and h the enthalpy. In the condenser, the rate of heat transfer
(Qout) from the vapor to cooling water can be evaluated:
Qout = m (h2 − h3)
(26)
At the pump, the liquid is pumped from the condenser to the high pressure boiler and the
work of the pump is given by:
WP = m (h4 − h3)
(27)
The working fluid completes the cycle from the compressed liquid exiting the pump to the
volumetric solar thermal collector. The rate of heat transfer to the volumetric solar thermal
collector is:
Qin = m (h1 − h4)
(28)

86
The thermal efficiency of the cycle (η) is defined as:
η = 1 −
Qout
m⁄
Qin
m⁄
= 1 −(h2 − h3)
(h1 − h4)
(29)
In Fig. 27, nanoparticles are assumed to stay in the solar thermal collector during a cycle.
Therefore, nanoparticles in the water could only affect state 1 (h1), assuming that the
pressure and corresponding saturation temperature at state 1 changes as a result of
increased or decreased mass flow rate. When hfg decreases using silver nanofluid, relatively
more vapor can be generated in the collector. This could lead to increased pressure of state
1, relative to the pure water case, and the increased pressure leads to an increase in
temperature. As a result, the enthalpy of the saturated vapor can be increased. Based on
Eq. (29), theoretically, when h1increases, the thermal efficiency also increases. That is, the
thermal efficiency could theoretically increase based on silver nanofluid relative to that for
pure water, assuming an increase in saturation pressure leaving the collector. Based on Eq.
(30), when the turbine work varies in terms of h1, the heat transfer input also varies with
h1.
W cycle = W t − W P = Q in − Q out
(30)
Therefore, this cycle is not violating the first law of thermodynamics because energy and
mass are conserved during a cycle.

87
5.3 Nanofluid-Based Solar Thermal Storage
In residential buildings, water-based heat storage systems connected to the solar
thermal collector are used as shown in Fig. 28 [33].
Figure 28. Schematic of Solar Thermal Storage in a House
(http://solar.colorado.edu/design/hvac.html )
In order to store more energy, a phase change material (PCM) such as water is employed
because latent heat is much higher than the specific heat. Therefore, water can release
considerable energy when it is needed. Since hfg of aqueous graphite nanofluid can be
significantly increased by sunlight compared to that of pure water, relatively more energy
can be stored in a storage tank. From this result, the efficiency of the system can be
increased, or the same amount of energy can be stored more compactly. In sum, the

88
applicability of aqueous nanofluids instead of pure water is investigated. These studies are
mostly based on a qualitative explanation. Therefore, in order to validate the results,
nanofluids-based experiments with the actual system should be conducted as a future work.

89
CHAPTER 6. CONCLUSIONS AND SUGGESTIONS FOR FUTURE
WORK
In the last few decades, many researchers have focused on nanotechnology as a
means of enhancing the performance of various applications in electronics, photonics, and
solar energy. Therefore, nanofluids, suspensions of submicron-sized (<100nm)
nanoparticles in fluids, have been extensively investigated because of their potentially
enhanced thermal properties, i.e., thermal conductivity, convective heat transfer, and latent
heat. Recently, vapor generation around nanoparticles in water from volumetric energy
sources (e.g. concentrated sunlight and laser light) has been presented, and it opens the
possibility to manipulate hfg in nanofluids. Therefore, we conducted experiments to verify
that hfg in aqueous nanofluids can be varied, depending on the type of nanoparticle. These
results indicated that hfg of water can be increased or decreased by low-volume-fraction
aqueous graphite and silver nanofluids, respectively. It means that the variation of hfg in
aqueous nanofluids can potentially be applied to direct absorption solar thermal collectors
and latent heat-based thermal storage, since the results can enhance not only the light-to-
thermal energy conversion, but also stored energy density. Also, further experiments with
changing surface area based on volume fraction (0.005% to 2%) and various nanoparticle
sizes to investigate the mechanisms for hfg modification in aqueous graphite and silver
nanofluids are reported. To support the experimental results, a theoretical approach based
on measured thermophysical properties is presented. In addition, nanoscale studies to
explain the entropy changes of the liquids are presented. In this dissertation, hydrophobic
interactions in graphite nanofluid are introduced to explain the increase of hfg in aqueous
90
graphite nanofluid. However, advanced simulation methods, i.e., MD simulations, are not
discussed in this dissertion. A quantitative estimate of the hydrophobic interactions
between graphite nanoparticles and water molecules would likely require an MD
simulation [65]. That is, based on an MD simulation, the entropy change in the fluid and
thermophysical properties, i.e., density and surface tension, could be obtained theoretically.
Therefore, this work could be done to improve understanding of the increase of hfg in
aqueous graphite nanofluid as future work [66] Also, in Chapter 5, the applicability of
aqueous nanofluids to volmetric solar thermal collectors and solar thermal storage,
exploiting the changes in hfg, is investigated.
Therefore, in the future, it is required to design and conduct experiments in a real
Rankine cycle to investigate the efficiency of the suggested silver nanofluid-based solar
thermal collector, as well as graphite nanofluid-based solar thermal storage.

91
REFERENCES
[1] M. Mehrali, E. Sadeghinezhad, S. T. Latibari, S. N. Kazi, M. Mehrali, M. N. Zubir
and H. S. Metselaar, "Investigation of Thermal Conductivity and Rheological
Properties of Nanofluids Containing Graphene Nanolatelets," Nanoscale Research
Letters, vol. 9, no. 15, 2014.
[2] Z. Haddad, C. Abid, H. F. Oztop and A. Mataoui, "A Review on How the Researchers
Prepare their Nanofluids," Int. J. Therm. Sci, vol. 76, pp. 168-189, 2014.
[3] R. A. Taylor and P. E. Phelan, "Pool boiling of nanofluids: Comprehensive review
of existing data and limited new data," Int. J of Heat and Mass Transfer, vol. 52, pp.
5339-5347, 2009.
[4] S. Thomas and C. B. Sobhan, "A review of experimental investigations on thermal
phenomena in nanofluids," Nanoscale Res. Lett., vol. 6, p. 377, 2011.
[5] R. Prasher, P. Bhattacharya and P. E. Phelan, "Thermal Conductivity of Nanoscale
Colloidal Solutions (Nanofluids)," Phys. Rev. Lett., vol. 94, no. 025901, 2005.
[6] S. Krishnamurthy, P. Bhattacharya and P. E. Phelan, "Enhanced Mass Transport in
Nanofluids," Nano Lett., vol. 6, pp. 419-423, 2005.
[7] M. M. Ameen, K. Prabhul, G. Sivakumar, P. P. Abraham, U. B. Jayadeep and C. B.
Sobhan, "Molecular Dynamics Modeling of Latent Heat Enhancement in
Nanofluids," Int. J. Thermophys, vol. 31, pp. 1131-1144, 2010.
[8] R. Taylor , S. Coulombe, T. Otanicar, P. Phelan, A. Gunawan, W. Lv, G.
Rosengarten, R. Prasher and H. J. Tyagi, "Small Particles, Big Impacts: A Review of
the Diverse Applications of Nanofluids," J. Appl. Phys., vol. 113, no. 011301, 2013.
[9] P. Phelan, T. Otanicar, R. Taylor and H. Tyagi, "Trends and Opportunities in Direct-
Absorption Solar Thermal Collectors," J. Therm. Sci. Eng. Appl., vol. 5, no. 021003,
2013.
[10] S. Lee, P. E. Phelan, L. Dai, R. Prasher, A. Gunawan and R. A. Taylor, "Experimental
Investigation of the Latent Heat of Vaporization in Aqueous Nanofluids," Appl. Phys.
Lett., vol. 104, pp. 1-4, 2014.
[11] R. Chen, T. X. Phuoc and D. Martello, "Effects of Nanoparticles on Nanofluid
Droplet Evaporation," Int. J. of Heat and Mass Trans., vol. 53, pp. 3677-3682, 2010.

92
[12] B. J. Zhu, W. L. Zhao, J. K. Li, Y. X. Guan and D. D. Li, "Thermophysoical
Properties of Al2O3-Water Nanofluids," Mat. Sci. Forum, vol. 688, pp. 266-271,
2011.
[13] S. Harikrishnan and S. Kalaiselvam, "Experimental Investigation of Solidification
and Melting Characteristics of Nanofluid as PCM for Solar Water Heating Systems,"
Int. J. of Emer. Tech. and Adv. Engi., vol. 3, pp. 628-635, 2013.
[14] M. Mehregan and M. Moghiman, "Propose a Correlation to Approximate Nanofluids'
Enthalpy of Vaporization - A Numerical Study," Int. J. of Mat. Mech. and Manu.,
vol. 2, pp. 73-76, 2014.
[15] R. A. Taylor, P. E. Phelan, R. J. Adrian, A. Gunawan and T. P. Otanicar,
"Characterization of Light-Induced, Volumetric Steam Generation in Nanofluids,"
Int. J. Therm. Sci., vol. 56, pp. 1-11, 2012.
[16] R. A. Taylor, P. E. Phelan, T. Otanicar, R. J. Adrian and R. S. Prasher, "Vapor
generation in a nanoparticle liquid suspension using a focused, continuous laser,"
Appl. Phys. Lett., vol. 98, p. 161907, 2009.
[17] O. Neumann, A. S. Urban, J. Day, S. Lal, P. Nordlander and N. Halas, "Solar Vapor
Generation Enabled by Nanoparticles," ACS Nano, vol. 7, pp. 42-49, 2013.
[18] J. Barber, D. Brutin and L. Tadrist, "A Review on Boiling Heat Transfer
Enhancement with Nanofluids," Nanoscale Research Letters, vol. 6, pp. 1-13, 2011.
[19] J. N. Israelachvili, Intermolecular and Surface Forces 3rd ed, Academic Press, 2011.
[20] L. Soochan, R. A. Taylor, L. Dai, R. Prasher and P. E. Phelan, "The Effective Latent
Heat of Aqueous Nanofluids," Materials Research Express, p. 065004, 2015.
[21] V. P. Carey, Liquid-Vapor Phase-Change Phenomena, New York: Taylor & Francis,
2008.
[22] R. A. Taylor, P. E. Phelan, P. T. Otanicar, R. Adrian and R. Prasher, "Nanofluid
Optical Property Characterization: Towards Efficient Direct Absorption Solar
Collector," Nanoscale Research Letters, vol. 6, pp. 1-11, 2011.
[23] T. A. Cengel and A. J. Ghajar, Heat and Mass Transfer, New York, USA: McGraw-
Hill, 2011.
[24] S. Figliola and D. E. Beasley, Theory and Design for Mechanical.
[25] J. Garai, "Physical model for vaporization," Fluid Phase Equilibria, vol. 283, pp. 89-
92, 2009.

93
[26] V. P. Carey, Liquid Vapor Phase Change Phenomena: An Introduction to the
Thermophysics of Vaporization and Condensation Processes in Heat Transfer
Equipment, CRC Press, 2007.
[27] C. Gerardi, D. Cory, J. Buongiorno, L. Hu and T. McKrell, "Nuclear Magnetic
Resonance-Based Study of Ordered Layering on the Surface of Alumina
Nanoparticles in Water," Appl. Phys. Lett., vol. 95, no. 253104, 2009.
[28] S. Lee, P. E. Phelan, R. A. Taylor, R. Prasher and L. Dai, "Low-Temperature Melting
of Silver Nanoparticles in Subcooled and Saturated Water," in ASME IMECE-36963,
Montreal, Canada, 2014.
[29] T. Yonezawa, S. Arai, H. Takeuchi, T. Kamino and K. Kuroda, "Preparation of naked
silver nanoparticles in a TEM column and direct in situ observation of their structural
changes at high temperature," Chem. Phys. Lett., vol. 537, pp. 65-68, 2012.
[30] Y. Qin, M. Hu, H. Li, Z. Zhang and Q. Zou, "Preparation and Field Emission
Properties of Carbon Nanotubes Cold Cathode using Melting Ag Nano-Particles as
Binder," Applied Suface Science, vol. 253, pp. 4021-4024, 2007.
[31] J. Sun and S. L. Simon, "The Melting Behavior of Aluminum Nanoparticles,"
Thermochimica Acta., vol. 463, pp. 32-40, 2007.
[32] C. L. Chen, J. Lee, K. Arakawa and H. Mori, "In Situ Observations of Crystalline-
To-Liquid and Crystalline-To-Gas Transitions of Substrate-Supported Ag
Nanoparticles," Appl. Phys. Lett., vol. 96, pp. 2531041-2531043, 2010.
[33] Y. Cengel and M. Boles, Thermodynamics: An Engineering Approach, New york,
USA: McGraw-Hill, 2010.
[34] D. S. Viswanath and N. R. Kuloor, "On Latent Heat of Vaporization, Surface
Tension, and Temperature," J of Chem. and Engi. Data, vol. 11, pp. 69-72, 1966.
[35] K. S. Birdi, Surface and Colloid Chemistry, Boca Raton, FL, USA: CRC Press, 2009.
[36] Z. Said, M. Sajid H, A. Kamyar and R. Saidur, "Experimental Investigation on the
Stability and Density of TiO2, Al2O3, SiO2 and TiSiO4," Earth and Environmental
Science, vol. 16, no. 012002, 2013.
[37] K. K. Nanda, "Size-dependent Melting of Nanoparticles: Hundred Years of
Thermodynamic Model," J. Phys., vol. 72, pp. 617-628, 2009.
[38] J. Drelich, "Nanoparticles in a Liquid: New State of Liquid?," J Nanomater. Mol.
Nanotechnol., vol. 2, pp. 1-2, 2013.

94
[39] A. O. Pinchuk, "Size-Dependent Hamaker Constant for Silver Nanoparticles," J.
Phys. Chem. C, vol. 116, pp. 20099-20102, 2013.
[40] R. H. French, R. M. Cannon, L. K. DeNoyer and Y.-M. Chiang, "Full Spectral
Calculation of Non-Retarded Hamaker Constants for Ceramic Systems from
Interband Transition Strengths," Solid State Ionics, vol. 75, pp. 13-33, 1995.
[41] X. J. Chen, A. C. Levi and E. Tosatti, "Hamaker Constant Calculations and Surface
Melting of Metals," Surface Science, vol. 251, pp. 641-644, 1991.
[42] Z. Fang, Y.-R. Neumann, O. Polman, A. Garcia de Abajo, P. Nordlander and N. J.
Halas, "Evolution of Light-induced Vapor Generation at a Liquid-immersed Metallic
Nanoparticle," Nano Lett., vol. 13, pp. 1736-1742, 2013.
[43] C. F. Boheren and D. R. Huffman, Absorption and Scattering of Light by Small
Particles, New York: Wiley, 1998.
[44] P. T. Otanicar, P. E. Phelan, S. R. Prasher, G. Rosengarten and R. A. Taylor,
"Nanofluid-based Direct Absorption Solar Collector," J Renewable Sustainable
Energy, vol. 2, pp. 03310201-03310213, 2010.
[45] G. M. Hale and M. R. Query, "Optical Constants of Water in the 200nm to 200um
Wavelength Resion," Appl. Opt., vol. 12, pp. 555-558, 1973.
[46] E. D. Palik, Handbook of Optical Constants of Solids, Orlando, FL, USA: Academic
Press, 1985.
[47] P. Schiebener, J. Straub and J. M. Levelt Sengers, "Refractive Index of Water and
Steam as Funtion of Wavelength, Temperature, and Density," J Phys. Chem. Ref.
Data, vol. 19, pp. 677-717, 1990.
[48] M. Schmid, S. Zehnder, P. Schwaller, B. Neuenschwander, J. Zurcher and U.
Hunziker, "Measuring the Complex Refactive Index of Metals in the Solid and Liquid
State and its Influence on the Laser Machining," in Proc. of SPIE, 2013.
[49] M. Bruckner, J. H. Schafer, C. Schiffer and J. Uhlenbusch, "Measurement of the
Optical Constants of Solid and Molten Gold and Tin at v=10.6 um," J Appl. Phys.,
vol. 70, pp. 1642-1647, 1991.
[50] M. Bruckner, J. H. Schafer and J. Uhlenbusch, "Ellipsometric Measurement of the
Optical Contants of Solid and Molten Aluminum and Copper at v-10.6 um," J Appl.
Phys., vol. 66, pp. 1326-1332, 1989.
[51] R. A. Matula, "Electrical Resistivity of Copper, Gold, Palladium, and Silver," J Phys.
Chem. Ref. Data, vol. 4, pp. 1257-1297, 1979.

95
[52] E. A. Olson, N. Y. Efremov, M. Zhang, Z. Zhang and L. H. Allen, "Size-dependent
Melting of Bi Nanoparticles," J Appl. Phys., vol. 97, no. 034304, 2005.
[53] L. C. Gontard, D. Ozkaya and R. E. Dunin-Borkowsk, "A Simple Algorithm for
Measuring Particle Size Distributions on an Uneven Background from TEM images,"
Ultramicroscopy, vol. 111, pp. 101-106, 2011.
[54] W. Y. Lai, S. Vinod, P. E. Phelan and R. Prasher, "Convective Heat Transfer for
Water-Based Alumina Nanofluids in a Single 1.02-mm Tube," J Heat Transfer, vol.
131, pp. 112401-112409, 2009.
[55] P. S. Bharadwaj, "Silver or Silver Nanoparticle A Safety or A Risk," J Environ. Res.
Develp., vol. 7, pp. 452-456, 2012.
[56] M. Elimelech, J. Gregory, X. Jia and R. Williams, Particle Deposition and
Aggregation: Measurement, Modeling and Simulation, Butterworth-Heinemann,
UK, 1998.
[57] L. Novotny and B. Hecht, Principle of Nano Optics, New York, USA: Cambridge
University Press, 2006.
[58] C. Tang, Y.-M. Sung and L. Junho, "Nonlinear Size-dependent Melting of the Silica-
encapsulated Silver Nanoparticles," J Appl. Phys. Lett., vol. 100, pp. 2019031-
2019033, 2012.
[59] E. E. Meyer, K. J. Rosenberg and J. Israelachvili, "Recent Progress in Understanding
Hydrophobic Interactions," PNAS, pp. 15739-15746, 2006.
[60] Y. I. Tarasevich, "State and Structure of Water in Vicinity of Hydrophobic Surfaces,"
Colloid Journal, pp. 248-258, 2011.
[61] E. G. Strekalova, M. G. Mazza, H. E. Stanley and G. Franzese, "Hydrophobic
Nanoconfinement Suppresses Fluctuations in Supercooled Water," J of Phys.
Condens. Matter , p. 064111, 2012.
[62] L. F. Scatena, M. G. Brown and G. L. Richmond, "Water at Hydrophobic Surfaces:
Weak Hydrogen Bonding and Strong Orientation Effects," Science, pp. 908-912,
2001.
[63] M. P. Williamson and D. H. Williams, "Hydrophobic Interactions Affect Hydrogen
bond strengths in Complexes between Peptides and Vancomycin or Ristocetin," J
Biochem., pp. 345-348, 1984.
[64] L. Li, D. Bedrov and G. D. Smith, "Water-Induced Interactions between Carbon
Nanoparticles," J Phys. Chem. B, pp. 10509-10513, 2006.

96
[65] T. M. Raschke, J. Tsai and M. Levitt, "Quantification of the Hydrophobic Interaction
by Simulations of the Aggregation of Small Hydrophobic Solutes in Water," PNAS,
pp. 5965-5969, 2001.
[66] D. A. Doshi, E. B. Watkins, J. N. Israelachvili and J. Majewski, "Reduced Water
Density at Hydrophobic Surfaces: Effect of Dissolved Gases," PNAS, pp. 9458-9462,
2005.

97
APPENDIX A
REFLECTANCE AND THERMAL LOSS CALCULATIONS

98
The optical loss (reflection) from the front of the cuvette with nanofluids is shown in Fig.
A1.
Figure A1. Refelction Calculation of Nanofluid in Quartz-Based Test Cuvette
Due to R1 = R1’(internal reflection), R can be derived as:
R = R1 +T1
2R2
1 − R2R1
v
v v
v
Laser
Reflection
n1 n2 (reflective index)
Laser
(532nm)
Nanofluid n and k from [44]
Quartz
(k1=0,
n0=1.46)
R1
T1 T1, T2
T2
(T1)2R2
T1, R2
T2 T1, R2, R1
’
T2
Air (k0=0, n0=1)
)
T2
v
v v
v v
v
v
v v v
v v
v
v
v
v
v
v
v
v
v
v

99
where
Ri =(nj − ni)
2+ (kj − ki)
2
(nj + ni)2
+ (kj − ki)2 Ti =
(1 − RiRi′)𝑒−4π𝑘𝑖𝐿𝑖/𝜆
1 − RiRi′𝑒−8π𝑘𝑖𝐿𝑖/𝜆
where L is the length of the ith element, and λ the wavelength of incident light (μm). Based
on Otanicar et al. [44], graphite and silver nanofluids’ optical properties can be obtained.
Also, T1 and R1 are 1.0 and 0.035, respectively. Those values can be used for obtaining the
reflection of graphite and silver nanofluids (0.0365). Therefore, the reflectance of the
nanfluids is approximately 3.65%. Since the reflection of pure water is 0.0366 (3.66%), the
reflectance of aqueous nanofluids does not change significantly.
The thermal loss of the insulated sample with rubber pipe type insulation, as shown
in Fig. A2, can be calculated by conduction heat transfer, using the thermal conductivity
(0.13 W m-1 K-1) and thickness (38mm) [23].
Figure A2. Well-Insulated Test Sample to Decrease Thermal Losses

100
Q = kAdT
dx
where Q is the heat transfer rate, k the thermal conductivity, A the area, and dT/dx the
temperature gradient in x direction. Using this equation with those values, the result
indicates that the thermal loss from the test sample is approximately 1%.

101
APPENDIX B
UNCERTAINTY CALCULATION FOR THE EXPERIMENTAL RESULS

102
The uncertainty of a measurement indicates its quality of experiments. It is
important to distinguish between error and uncertainty. The error is the difference between
the measured value and the true value, but the uncertainty is a quantification of the doubt
about the measurement results [24]. The uncertainty comes from the measuring instrument,
the stability of the item, the measurement process, operator skill, and the experimental
environment [24]. Therefore, in order to reduce the uncertainty of the measurements, the
calibration of the instrument should be done before conducting the experiments.
To simplify the calculations of the propagating uncertainty for hfg experiments, the
relative uncertainty should be employed. In order to find hfg, the heat input (Qin) is divided
by the vapor mass generation (mvapor). Therefore, the propagating uncertainty in hfg can
be found from the fractional uncertainties in the heat input (Qin with uncertainty u(Qin) )
and vapor mass generation ( mvapor with uncertainty u( mvapor )), Then, the relative
uncertainty u(hfg)/ hfg is described as:
u(hfg)
hfg= √(
u(Qin)
Qin)
2
+ (u(mvapor)
mvapor)
2
where u is the standard uncertainty. It is calculated from u =𝑠
√𝑛 (s is the standard deviation,
and n the number of measurements).
For pure water, graphite nanofluids, and silver nanofluids experiments, based on
instrument calibrations, the propagating uncertainty is calculated by the values of the heat
input, the heat input uncertainty, the vapor mass generation, and the vapor mass generation
uncertainty. As a result with five trials, for the laser-based experiments the relative

103
uncertainties are 13.5% for pure water, 15.6% for graphite nanofluid, and 15.4% for silver
nanofluid. For comparison, the uncertainties of the laser-based experiments were
calculated in [10] to be about 15% based on a level of confidence of 95%.


![NANOFLUIDS IN HEAT PIPES - coolingzone · NANOFLUIDS IN HEAT PIPES Figure 1. A Heat Pipe and its Thermal Resistance Network [1] Heat pipes are simple heat transfer devices that are](https://static.cupdf.com/doc/110x72/5e1709ba99d6092e366c9a76/nanofluids-in-heat-pipes-nanofluids-in-heat-pipes-figure-1-a-heat-pipe-and-its.jpg)