A peer-reviewed version of this preprint was published in PeerJ on 9July 2015.
View the peer-reviewed version (peerj.com/articles/1033), which is thepreferred citable publication unless you specifically need to cite this preprint.
Winterbach HEK, Winterbach CW, Boast LK, Klein R, Somers MJ. (2015)Relative availability of natural prey versus livestock predicts landscapesuitability for cheetahs Acinonyx jubatus in Botswana. PeerJ 3:e1033https://doi.org/10.7717/peerj.1033

Relative availability of natural prey versus livestock predictslandscape suitability for cheetahs Acinonyx jubatus inBotswanaHanlie EK Winterbach, Christiaan W Winterbach, Lorraine Boast, Rebecca Klein, Michael MJ Somers
Prey availability and human-carnivore conflict are strong determinants that govern thespatial distribution and abundance of large carnivore species and determine the suitabilityof areas for their conservation. For wide-ranging large carnivores such as cheetahs(Acinonyx jubatus) suitable conservation areas beyond protected area boundaries arecrucial to effectively conserve them both inside and outside protected areas. Althoughcheetahs prefer preying on wild prey, they also cause conflict with people by predating onespecially small livestock. We investigated whether the distribution of cheetahs’ preferredprey and small livestock biomass can be used to explore the current potential suitability ofagricultural areas in Botswana for the long-term persistence of its cheetah population. Wefound it gave a good point of departure for identifying priority areas for land management,the threat to connectivity between cheetah populations and areas where the reduction andmitigation of human-cheetah conflict is critical. Our analysis showed the existence of awide prey base for cheetahs across large parts of Botswana’s agricultural areas whichprovide additional large areas with high conservation potential. Twenty percent wild preybiomass proved to be possibly the critical point to distinguish between high and lowpredicted levels of human-cheetah conflict. We identified focal areas in the agriculturalzones where restoring wild prey numbers in concurrence with effective human-cheetahconflict mitigation efforts are the most immediate conservation strategies needed tomaintain Botswana’s still large and contiguous cheetah population.
PeerJ PrePrints | http://dx.doi.org/10.7287/peerj.preprints.823v1 | CC-BY 4.0 Open Access | rec: 10 Feb 2015, publ: 10 Feb 2015
PrePrin
ts
Hanlie E. K. Winterbach Tau Consultants (Pty) Ltd, Maun, Botswana and Centre for Wildlife
Management, University of Pretoria, Pretoria, South Africa.
Christiaan W. Winterbach, Tau Consultants (Pty) Ltd, Maun, Botswana and Centre for Wildlife
Management, University of Pretoria, Pretoria, South Africa.
Lorraine Boast, Cheetah Conservation Botswana, Private Bag 0457, Gaborone, Botswana.
R. Klein, Cheetah Conservation Botswana, Private Bag 0457, Gaborone, Botswana.
Michael J. Somers Centre for Wildlife Management, University of Pretoria, Pretoria, South Africa and
Centre for Invasion Biology, University of Pretoria, Pretoria, South Africa,
Corresponding author: Hanlie E. K Winterbach, Private Bag 83, Maun, tel: +26772782522,
PeerJ PrePrints | http://dx.doi.org/10.7287/peerj.preprints.823v1 | CC-BY 4.0 Open Access | rec: 10 Feb 2015, publ: 10 Feb 2015
PrePrin
ts

2 The strong linear relationships that exist between the density of African large carnivores and the
3 biomass of their natural prey (Hayward, O'Brien, & Kerley, 2007) point to prey availability as the
4 primary natural determinant that governs the spatial distribution and abundance of large carnivore
5 species and determines the suitability of an area for their conservation (Broekhuis et al., 2013; Fuller &
6 Sievert, 2001; Gittleman & Harvey, 1982; Hayward, O'Brien, & Kerley, 2007). For competitively
7 inferior species, such as cheetahs and African wild dogs (Lycaon pictus), interspecific competition,
8 especially from lions (Panthera leo) and spotted hyaenas (Crocuta crocuta), can also exerts a strong
9 influence on their movements, behaviour and density (Durant, 2000; Van der Meer et al., 2013). This
10 occurs predominantly inside protected areas where densities of lions and spotted hyaenas tend to be
11 high (Creel, Spong & Creel, 2001). In human-dominated landscapes human activities and their conflict
12 with predators are often as strong a determinant factor as prey availability in the occurrence and
13 survival of large carnivores (Gusset et al., 2009; Marker et al., 2003; Schuette, Creel & Christianson,
14 2013; Woodroffe & Ginsberg, 1998) With few protected areas large enough to contain the wide-
15 ranging behaviour of large carnivores, the management of suitable conservation areas beyond protected
16 area boundaries are necessary to effectively conserve large carnivore species both inside and outside
17 protected areas (Woodroffe & Ginsberg, 1998). This requires the assessment of both the distribution
18 and abundance of suitable prey and the potential levels of human-carnivore conflict, often on a large
19 geographic scale.
20 The cheetah is Africa’s most endangered felid (Marker et al., 2007) and is listed as Vulnerable with
21 a declining population trend by the IUCN Red List of Threatened Species (Durant et al., 2008). They
22 are one of the most wide-ranging terrestrial carnivores and need extensive areas to sustain viable
23 populations (IUCN/SCC, 2007). Cheetahs feed on a diverse wild prey base ranging from animals as
24 small as scrub hares (Lepus saxatilis) to as large as zebras (Equus quagga), but generally select the
25 most abundant locally available prey up to 135 kg with a strong preference for those with a body mass
PeerJ PrePrints | http://dx.doi.org/10.7287/peerj.preprints.823v1 | CC-BY 4.0 Open Access | rec: 10 Feb 2015, publ: 10 Feb 2015
PrePrin
ts

26 between 14 kg – 40 kg (Clements et al., 2014). At least 75% of the cheetah’s resident range in southern
27 Africa falls outside protected areas (IUCN/SSC, 2007). In southern Africa this falls mostly on
28 farmlands where competition with other large carnivores is low and a sufficient small to medium-sized
29 wild prey base still occurs (Lindsey & Davies-Mostert, 2009; Klein, 2007; Marker & Dickman, 2004).
30 Consequently, conservation efforts in human-dominated landscapes are critical for this species long-
31 term survival. Although cheetahs prefer preying on wild prey (Marker et al., 2003), they also cause
32 conflict with people by predating on livestock which generally involves small stock (sheep and goats)
33 and occasionally calves and foals (Marker et al., 2003; Ogada et al., 2003; Selebatso, Moe & Swenson,
34 2008; Woodroffe et al., 2007).
35 Botswana is important for the regional and global long-term survival of cheetahs. It has a large and
36 still contiguous cheetah population and hosts the second largest national population with ± 1 786
37 animals (Klein, 2007) after Namibia with ± 3 138 – 5 775 animals (Hanssen & Stander, 2004; Marker
38 et al., 2007). It also forms the major connecting range for the southern African cheetah population
39 which is largest known free-ranging resident cheetah population comprising ± 6 500 animals
40 (IUCN/SCC, 2007). Around half of the Botswana cheetah population occurs outside conservation
41 areas on rangeland (Winterbach & Winterbach, 2003). In 2009, a Draft National Conservation Action
42 Plan for Cheetahs and African Wild Dogs in Botswana was prepared by the Department of Wildlife
43 and National Parks (DWNP). One of the primary targets set out in the national plan is obtaining
44 quantitative knowledge regarding the main threats to securing a viable cheetah population across its
45 range in Botswana. However, scientific information on cheetah distribution and density on a country-
46 wide scale is nearly impossible to obtain, but the urgent conservation status of threatened species such
47 as cheetahs can ill-afford to wait for detailed scientific information before policy decisions are made.
48 Therefore, an objective, clear system of evaluation, based on the best available and reliably correlated
49 information, is needed that can be used as a basis to support policy setting (Theobald et al., 2000).
PeerJ PrePrints | http://dx.doi.org/10.7287/peerj.preprints.823v1 | CC-BY 4.0 Open Access | rec: 10 Feb 2015, publ: 10 Feb 2015
PrePrin
ts

50 We used the distribution of cheetahs’ preferred prey and small stock biomass as the most essential
51 components to explore the current potential suitability of agricultural areas for the long-term
52 persistence of cheetahs in Botswana. The percentage prey biomass of small stock and prey biomass
53 combined was used as the primary indicator of probable levels of human-cheetah conflict. Our analyses
54 demonstrated that wild prey combined with livestock can provide a country-wide overview of the
55 suitability of the Botswana landscape for cheetahs without the use of complex modelling. It allows for
56 prudent conclusions as a point of departure for identifying specifically priority areas for land
57 management, the threat to connectivity between cheetah populations and areas where the reduction and
58 mitigation of human-cheetah conflict is critical.
59
60 Study Area
61
62 The Republic of Botswana is ca 582 000 km2 in size and is landlocked with Namibia, South Africa,
63 Zimbabwe, and Zambia as its neighbours. Roughly 50% of its 2 million people (3.5 people / km²) live
64 in rural villages and small settlements (Central Statistics Office, 2014).
65 The mean altitude above sea level is 1 000 m (515 – 1 491 m a.s.l.). The climate is arid to semi-arid
66 with highly variable rainfall and periodical severe droughts. Mean annual rainfall varies from 650 mm
67 in the north-east to 250 mm in the south-west. Average maximum daily temperatures range from 22º C
68 in July to 33º C in January and average minimum temperatures from 5º C to 19º C respectively
69 (Department of Surveys and Mapping, 2001). Only two perennial rivers occur; the Okavango River
70 which fans out into the Okavango Delta and the Kwando/ Linyanti/Chobe river system which forms the
71 boundary with Namibia and Zambia. The Makgadikgadi Pans is a seasonal wetland with natural
72 perennial water holes in the Boteti River providing critical dry season water sources for wildlife in
73 Makgadikgadi National Park (MNP). Across the rest of the country, scattered pans and ancient
PeerJ PrePrints | http://dx.doi.org/10.7287/peerj.preprints.823v1 | CC-BY 4.0 Open Access | rec: 10 Feb 2015, publ: 10 Feb 2015
PrePrin
ts

74 riverbeds periodically hold water during the wet season. Considerable seasonal variations in the density
75 and distribution of ungulate species occur and the blocking of migration routes by veterinary fences has
76 led to ungulate die-offs during drought years (Bergström & Skarpe, 1999; Verlinden, 1998). Seasonal
77 migrations of Burchell’s zebra and blue wildebeest (Connochaetes taurinus) still occur inside MNP
78 (Brooks, 2005), and zebra migrate between MNP and the Okavango Delta (Bartlam-Brooks, Bonyongo
79 & Harris, 2011).
80 Approximately 38% of the land use in Botswana is designated for wildlife utilization; 17% as
81 protected areas (national parks and game reserves) and 21% as Wildlife Management Areas (WMAs)
82 (Figure 1). WMAs are primarily designed for wildlife conservation, utilisation, and management
83 (Hachileka, 2003), however, unlike protected areas; people are permitted to reside within WMAs and
84 to own and graze livestock there. Protected areas and WMAs do not have ‘predator-proof’ fences, with
85 the exception of the western and southern boundary of MNP which provides only a partial barrier due
86 to its poor upkeep.
87 Five percent of the country is residential areas and 57% consists of rangeland (of which roughly
88 70% is tribal / communal grazing land), 25% is state land, 5% freehold land leased for large-scale
89 commercial ranching (Department of Surveys and Mapping, 2001). In the Draft National Predator
90 Strategy (Winterbach & Winterbach, 2003), the country was sub-divided into two main predator
91 management zones; Conservation Zones comprising of national parks, forest reserves, sanctuaries and
92 WMAs, and the Agricultural Zones consisting of rangelands, residential and mining areas (Figure 1).
93 Livestock (mainly cattle) rearing is the primary economic activity over large parts of Botswana and
94 constitutes 70 - 80% of the agricultural GDP (Botswana Ministry of Agriculture 2011). In the 2012
95 household survey, the livestock population in Botswana was estimated as 2.6 million cattle, 1.8 million
96 goats and 300,000 sheep, most of which were located on the more fertile eastern side of the country
97 (Botswana Ministry of Agriculture 2011). Approximately 92% of this livestock are in the traditional
PeerJ PrePrints | http://dx.doi.org/10.7287/peerj.preprints.823v1 | CC-BY 4.0 Open Access | rec: 10 Feb 2015, publ: 10 Feb 2015
PrePrin
ts

98 cattle post system on communal grazing land (Botswana Ministry of Agriculture 2011). Botswana’s
99 key environmental issues include water scarcity and pollution, rangeland degradation and
100 desertification, loss of biodiversity, deforestation, and an increased frequency of periodic droughts
101 (Wingqvist & Dahlberg, 2008).
102 In Botswana, cheetahs are a protected species. Before 2000, cheetahs could be hunted or captured
103 under and in accordance with the terms and conditions of a Director’s permit (Wildlife Conservation
104 and National Parks Act (Act No. 28 of 1992)). However, since 2000, a statutory instrument disallowed
105 the killing of cheetahs for any reason (Botswana Government Gazette, 2000), and in 2005, a US$ 113
106 fine or term in prison was added (Botswana Government Gazette, 2005), although the latter is rarely
107 enforced. Botswana has an unutilized CITES quota of five cheetah per annum (Klein, 2007).
108
109 Methods
110
111 The first parameter we used to determine landscape suitability was the biomass of wild prey species
112 which occur in Botswana that are preferred prey or in the preferred weight range (body mass 14 kg –
113 40 kg ) for cheetahs (Clements et al., 2014) (Table 1), hereafter termed ʽwild preyʼ. We included Red
114 lechwe (Kobus leche) as one of the preferred prey of cheetah in the seasonal floodplains of the
115 Okavango Delta (pers. comm.). We did not include calves of the larger wild prey since population
116 numbers were collected during the dry season when calves were not prevalent. The second parameter
117 we used was the biomass of goats and sheep (herein referred to as ʽsmall stockʼ) as the main livestock
118 whose depredation is a significant predictor of human-cheetah conflict levels (Supplementary material
119 Appendix 1). The third parameter was the percentage that wild prey biomass contributed to the total
120 biomass of wild prey and small stock combined to indicate probable levels of conflict (herein referred
121 to as ʽpercentage wild preyʼ.
PeerJ PrePrints | http://dx.doi.org/10.7287/peerj.preprints.823v1 | CC-BY 4.0 Open Access | rec: 10 Feb 2015, publ: 10 Feb 2015
PrePrin
ts

122 We calculated wild prey and small stock biomass in Large Stock Units (LSU = body weight 0.75)
123 per 12ʼ grid cells from the combined data of six country-wide annual dry season aerial surveys
124 conducted by DWNP between 2001 and 2005 and in 2007. Aerial surveys during the drought years
125 before 2001 and very wet years after 2007 were excluded. Cheetah biomass strongly correlates with
126 lean season prey biomass (Fuller & Sievert, 2001) and we felt the six aerial surveys used in this study
127 best represented the general distribution of prey and small stock biomass on a country-wide scale.
128 Although aerial surveys tend to undercount small mammal species, such as steenbok (Raphicerus
129 campestris) and duiker (Sylvicapra grimmia), it is the only feasible method for wildlife monitoring on
130 a country-wide scale. We assumed that using a combined data set from six aerial surveys was sufficient
131 to determine the general distribution of wild prey and small stock biomass across Botswana.
132 We utilized the broad landscape suitability stratification for large carnivores in Botswana from
133 (Winterbach et al., 2014) and refined it in the agricultural zones based on the distribution of wild prey
134 biomass, small stock biomass and the percentage wild prey biomass to identify homogeneous strata. To
135 determine if there is a critical percentage wild prey that can be used to differentiate between high and
136 low probable levels of conflict, we used data on livestock attacks by cheetahs between 1995 and 2006
137 consisting of problem animal conflict reports and farms questionnaire surveys (N = 188) conducted
138 during 2004 and 2005. We calculated the number of aerial survey grids with livestock attacks in
139 different categories of percentage wild prey biomass in the Kgalagadi, Ghanzi Agricultural Zones and
140 the western strata of the Central Agricultural Zone. From this we calculated the frequency of livestock
141 attacks per grid cell for each category (Supplementary material Appendix 2) and used a chi-square test
142 to test whether the observed frequency of conflict reports has the same frequency as the grids per
143 category of percentage wild prey. Observations were classified into categories independently and all
144 categories had expected frequencies > 5%. We used Bonferroni intervals (Byers, Steinhorst &
PeerJ PrePrints | http://dx.doi.org/10.7287/peerj.preprints.823v1 | CC-BY 4.0 Open Access | rec: 10 Feb 2015, publ: 10 Feb 2015
PrePrin
ts
145 Krausman, et al. 1984) to test for categories with observed frequencies that differed significantly from
146 the expected.
147 To test our classification of suitable and unsuitable areas for cheetahs we investigated the reported
148 presence, transience and absence of cheetahs using questionnaire surveys (N = 89) conducted during
149 2012 and 2013 that targeted primarily game ranchers and commercial livestock farmers in the game
150 ranching regions of the Central, Ghanzi, Ngamiland and North East regional districts. Farmers were
151 asked to record the status of cheetahs on their property as present (visual sightings or tracks seen at
152 least quarterly), transient (visual sightings or tracks seen less frequently than quarterly) or absent
153 (never seen cheetahs or its tracks). We used a chi-square test with Bonferroni simultaneous confidence
154 intervals (Byers, Steinhorst & Krausman, et al. 1984) to test the hypothesis that farmers reported
155 cheetahs as present, transient or absent in similar proportions on grid cells with different percentage
156 wild prey categories. We used the Natural Breaks (Jenks) function in ArcMap 9.3.1 that best grouped
157 similar values and maximize the differences between groups to identify categories of landscape
158 suitability for the long-term persistence of cheetahs. We identified five categories of suitability, based
159 on the proportion of grid cells in each sub-stratum that had ≤ 20% wild prey.
160
161 Results
162
163 The distribution of cheetah wild prey biomass and the percentages of wild prey biomass in the different
164 categories are shown in Figure 2 and Figure 3, respectively. Although cheetah wild prey occurred
165 widely in the agricultural zones, it contributed only 0 – 5% of the total biomass (wild prey plus small
166 stock) available to cheetahs in the eastern parts of both the Central Agricultural Zone and the
167 Kgalagadi Agricultural Zone 1.
PeerJ PrePrints | http://dx.doi.org/10.7287/peerj.preprints.823v1 | CC-BY 4.0 Open Access | rec: 10 Feb 2015, publ: 10 Feb 2015
PrePrin
ts

168 The percentage wild prey biomass in the Kgalagadi and Ghanzi Agricultural Zones and the western
169 strata of the Central Agricultural Zone combined was ≤ 20% in 235 of the 403 grids (58.3%) and >
170 80% in 136 grids (33.7%) with the remaining 32 grids (8%) between > 20% and ≤ 80%. The number of
171 conflict reports recorded per grid for the percentage wild prey biomass intervals ranged from 0.23 to
172 0.81 reports per grid cell with a mean of 0.49 and standard error of 0.25 (N = 8) (Table 2). The number
173 of conflict reports was consistently below the mean when the percentage wild prey biomass exceeded
174 20% (Figure 3).
175 We subsequently selected 0%, > 0 to ≤ 20%, > 20 to ≤ 80%, and > 80 to ≤ 100% as the main
176 categories of percentage wild prey biomass. The observed frequency of conflict reports in grids from
177 the separate categories differed significantly from the expected (χ² = 52.42, df = 1, P < 0.001). Conflict
178 reports were more frequently than expected (P = 0.05) in grids with 0% wild prey biomass, and
179 significantly lower than expected in areas with > 20% wild prey biomass (α = 0.05, Z = 2.4977) (Table
180 3). We therefore took grids with ≤ 20% wild prey biomass as representing areas with high predicted
181 levels of conflict, and > 20% wild prey biomass as areas with low predicted levels of conflict.
182 We rated the five categories of landscape suitability identified in ArcMap as very high (0 – 6.7%
183 grid cells with ≤ 20% wild prey), high (6.8 – 25%), medium (25.1 – 50), low (50.1 – 75%) or
184 unsuitable (75.1 – 100%) and provide a country-wide landscape suitability map for the long-term
185 persistence of cheetahs in Botswana (Figure 4) (Supplementary material Appendix 3). The
186 conservation zones were the most suitable for the long-term persistence of cheetahs, while the
187 agricultural zones consisted of a mosaic of medium suitability to unsuitable. The classification of some
188 strata as unsuitable for cheetahs was supported by the questionnaire data where the proportion of
189 farmers that reported cheetahs present or absent differed significantly between suitable and unsuitable
190 cheetah areas (χ² = 129.11, df = 3, P < 0.001). A hundred per cent of farmers reported cheetahs absent
PeerJ PrePrints | http://dx.doi.org/10.7287/peerj.preprints.823v1 | CC-BY 4.0 Open Access | rec: 10 Feb 2015, publ: 10 Feb 2015
PrePrin
ts
191 in the unsuitable areas (n = 10) significantly more than would be expected by chance and only 13.9 %
192 of farmers reported cheetahs absent within the suitable areas (N = 79) (α = 0.05, Z= 2.4977) (Table 4).
193
194 Discussion
195
196 Our results show that the distribution of cheetah wild prey and small stock biomass can provide a good
197 information basis to evaluate the landscape suitability for cheetahs on a country-wide scale and
198 indicate priority areas for conservation actions. In Botswana, 20% wild prey biomass showed to be a
199 potentially critical point to distinguish between high and low predicted levels of human-cheetah
200 conflict. The distribution of the categories of percentage wild prey biomass (Figure 3) clearly
201 highlights areas where locally-adapted conflict mitigation strategies are a priority, for example along
202 the western and eastern boundaries of the Okavango Delta. In addition, the landscape suitability map
203 (Figure 4) shows strata where currently the long-term persistence of cheetahs is highly unlikely, such
204 as in the eastern part of the Central Agricultural Zone, and where connectivity within the cheetah
205 population is threatened, such as between the Northern and Southern Conservation Zones.
206 The distribution of cheetah wild prey biomass provides a wide prey base across large parts of the
207 agricultural areas in Botswana. In fact, the greater resource availability in Botswana may be causal to
208 the considerably higher density, smaller home range sizes and generally larger body size of cheetahs in
209 Botswana compared to Namibia (Boast et al., 2013). The significant reduction in conflict reports in
210 areas with > 20% wild prey biomass confirms adopting an integrated livestock-wildlife management
211 approach in the communal rangelands of Botswana as an effective conflict mitigation strategy to
212 maintain key areas in the agricultural zones for cheetah conservation.
213 Almost 50% of Botswana’s cheetah population occurs in agricultural areas (Klein, 2007). Support
214 from both livestock and game farmers for cheetah conservation outside protected areas is low in
PeerJ PrePrints | http://dx.doi.org/10.7287/peerj.preprints.823v1 | CC-BY 4.0 Open Access | rec: 10 Feb 2015, publ: 10 Feb 2015
PrePrin
ts
215 Botswana (Selebatso, Moe & Swenson, 2008) and retaliatory killing of cheetahs is considered to be
216 widespread (Klein, 2007). Livestock farmers view cheetahs as the fourth most problematic predator,
217 following leopards (Panthera pardus), jackals (Canis mesomelas) and wild dogs, while sixty percent
218 (60%) of private game farmers rate them as the second top stock predators (Selebatso, Moe &
219 Swenson, 2008). As in Namibia (Marker et al., 2003), cheetahs in Botswana prey predominantly on
220 local native game (Cheetah Conservation Botswana unpubl data). This preference for wild prey has
221 also been shown for other large carnivores even in areas where livestock is predominant (Hemson,
222 2003; Ogara et al., 2010; Woodroffe et al., 2005), and maintaining wild prey populations within
223 livestock areas is viewed as a feasible way to decrease livestock depredation (de Azevedo & Murray,
224 2007; Mizutani, 1999).
225 Steenbok and duiker are two of the generally most common prey for cheetahs in Botswana (Klein,
226 2007). The high density of steenbok and duiker (range 0.261 - 4.319 animals / 100 km²) calculated
227 from the six aerial surveys in the Ghanzi Community Stratum (stratum 7.2) suggests that livestock do
228 not necessarily displace small ungulates to the extent that large ungulates are displaced (Riginos et al.,
229 2012). However, conflict with people seems to have a stronger influence on cheetah numbers than wild
230 prey biomass when livestock numbers are high. In the Ghanzi Farms Stratum (stratum 7.1) there was a
231 sample point where cheetah density was too low to calculate despite having more wild prey than
232 neighbouring areas with 0.7 cheetahs / 100 km² (Boast & Houser, 2012; Kent, 2010). This shows the
233 potential negative impact of human conflict on the cheetah population even where there is a good wild
234 prey base but it formed a small percentage to the total biomass due to the high small stock biomass.
235 The Okavango Delta is nearly surrounded by two agricultural strata (strata 6.2 and 6.4 in Figure 4)
236 that are currently unsuitable for the long-term persistence of cheetahs. Wild prey biomass is low and
237 PAC reports show conflict levels between farmers and cheetahs are high. Together with the low
238 suitability of agricultural stratum 6.3, the free movement of cheetahs from the Northern Conservation
PeerJ PrePrints | http://dx.doi.org/10.7287/peerj.preprints.823v1 | CC-BY 4.0 Open Access | rec: 10 Feb 2015, publ: 10 Feb 2015
PrePrin
ts

239 Zone towards the Central Kalahari Game Reserve (CKGR) is impeded and we therefore assumed that
240 cheetahs found in these strata are most likely transients. A second linkage between the Northern and
241 Southern Conservation Zones extends from MNP to the south-west across the most northern part of the
242 Central Agricultural Zone. PAC reports indicate cheetah presence in this corridor (Figure 4). Concerted
243 efforts in conflict mitigation to ensure functional corridors are essential to maintain connectivity
244 between the smaller northern cheetah population and that of the south, especially in the light that
245 (Dalton et al., 2013) found that the northern cheetah population showed some degree of genetic
246 isolation. However, the small sample size (N = 4) of cheetahs from the north and its isolation by
247 distance from the rest of the samples may have contributed to their findings. Our study emphasises the
248 urgent need for intensive genetic studies to accurately determine gene flow across the country.
249 In the Southern Conservation Zone, the WMAs in the Western Kgalagadi Conservation Corridor
250 (WKCC) connect the CKGR to the Kgalagadi Transfrontier Park (KTP), Botswana’s two largest
251 nationally protected areas (Conservation International Botswana, 2010). The Schwelle, which lies
252 south within the WKCC, provides crucial wet season forage to ungulates and is one of the most
253 important wildlife areas in Botswana, preserving the Kalahari Ecosystem (Anonymous, 2008). The
254 Schwelle also holds almost half of the cheetahs in the Southern Conservation Zone (Klein, 2007). The
255 increasing demand for livestock grazing areas and already extensive use of parts of the WKCC for
256 cattle production is a concern in maintaining this corridor for large predators and wildlife in general.
257 For example, the proposed changing of the land use from wildlife to cattle in the eastern section of the
258 WKCC (Anonymous, 2008) has the potential to enlarge the unsuitable areas for cheetahs across the
259 Kgalagadi Agricultural Zones 1 and 2, and PAC reports show human-cheetah conflict is already
260 widespread here. The implementation of effective conflict mitigation strategies will be essential to
261 prevent the formation of a wide barrier to the free movement of cheetahs both between the CKGR and
262 KTP, and further south connecting with the South African cheetah population.
PeerJ PrePrints | http://dx.doi.org/10.7287/peerj.preprints.823v1 | CC-BY 4.0 Open Access | rec: 10 Feb 2015, publ: 10 Feb 2015
PrePrin
ts

263 The Dry North (stratum 3.1) provides a linkage with Hwange National Park in Zimbabwe. The
264 importance of this linkage lies in that it enlarges the northern Botswana cheetah population. The aerial
265 surveys showed wild prey biomass in the central part of the stratum overall to be low, to zero in some
266 grid cells. However, large parts of this area are dominated by Miombo and mopane (Colophospermum
267 mopane) woodland and close-tree Acacia savannah (Department of Surveys and Mapping, 2001). The
268 low wild prey biomass is probably a function of the limitation of aerial surveys to detect small, cryptic
269 species in these dense habitats (Jachmann, 2002). A high density of small wild prey, especially duiker
270 and steenbok, was recorded in the western part of this area during a ground survey done in 2011
271 (Winterbach, unpubl. data). Limiting the uncontrolled development of artificial water points in this
272 stratum is an important conservation strategy for cheetahs as the wide-spread availability of water may
273 increase large ungulate numbers leading to a corresponding increase in lions and spotted hyaenas that
274 are dominant competitors of cheetahs (Creel, Spong & Creel, 2001; Durant, 2000; Mills & Gorman,
275 1997).
276 Namibia and Botswana protect approximately 77% of the southern African cheetah population
277 (IUCN/SCC, 2007). The most important linkage between the Namibian and Botswana population lies
278 in the Ghanzi Agricultural Zone, where landscape suitability for cheetahs ranges between medium on
279 the commercial farms (stratum 7.1) to low on the community farms (stratum 7.2). The proposed re-
280 alignment of the western boundary of the WKCC to enlarge the communal grazing area for the cattle
281 industry (Anonymous, 2008) will not only further threaten the functionality of the WKCC for wildlife,
282 but also potentially threaten the connectivity with the Namibian cheetah population.
283 Conservation of free-ranging cheetah populations is multi-faceted and needs to be addressed from
284 an ecological, biological and socio-economic management perspective. Despite the threats, Botswana
285 has a large and still contiguous cheetah population with wide-spread natural movements allowing
286 substantial gene flow (Dalton et al., 2013). However, its contiguous nature is threatened and may cease
PeerJ PrePrints | http://dx.doi.org/10.7287/peerj.preprints.823v1 | CC-BY 4.0 Open Access | rec: 10 Feb 2015, publ: 10 Feb 2015
PrePrin
ts

287 if corridors are not maintained. Cheetahs have vast tracts of intact habitat in the conservation areas for
288 persistence, and the wide-spread availability of wild prey across the agricultural zones provides
289 additional large areas with high conservation potential. On a micro-scale, some studies found habitat
290 structure, such as dense woodland and open savannah, have an even stronger effect on the areas the
291 different social groups of cheetahs prefer to utilize than absolute wild prey density (Bissett & Bernard,
292 2007; Muntifering et al., 2006). Spatial data indicating land degradation were not available to include
293 in the landscape suitability map. However, the wide-spread rangeland degradation and desertification
294 in the agricultural areas of Botswana (Moleele et al., 2002) reduces the availability of suitable wild
295 prey, as well as sufficient grass cover for cheetahs for stalking, concealment from other predators, and
296 movement between areas (Broomhall, Mills & du Toit, 2003; Marker, 2003; Mills, Broomhall & du
297 Toit, 2004; Purchase & du Toit, 2000). This study showed that restoring wild prey numbers in focal
298 areas in concurrence with effective human-cheetah conflict mitigation efforts are the most immediate
299 conservation strategies needed to ensure the long-term survival of cheetahs in Botswana. With this is
300 the restoration of degraded rangeland which will not only recover habitat for cheetahs and their wild
301 prey but also benefit farmers by increasing the carrying capacity for livestock, which in itself may
302 increase their tolerance for cheetahs on their land (Marker, 2003).
303
304 Acknowledgements
305
306 Thanks to Laurie Marker, J. W. McNutt, E. Fabiano and R. Kotze for valuable comments on the
307 manuscript. This manuscript was made possible by the Department of Wildlife and National Parks,
308 Ministry of Environment, Wildlife and Tourism, Gaborone, Botswana.
309
310 References
PeerJ PrePrints | http://dx.doi.org/10.7287/peerj.preprints.823v1 | CC-BY 4.0 Open Access | rec: 10 Feb 2015, publ: 10 Feb 2015
PrePrin
ts

311 Anonymous. 2008. Review of the national land use map. Final Report. LANDflow Solutions (Pty)
312 Ltd, Gaborone.
313 Conservation International Botswana. 2010. Consultancy to identify important habitats for key
314 wildlife in the Western Kgalagadi Conservation Corridor (WKCC). Conservation International
315 Botswana, Gaborone.
316 Bartlam-Brooks HLA, Bonyongo MC, Harris S. 2011. Will reconnecting ecosystems allow long-
317 distance mammal migrations to resume? A case study of a zebra Equus burchelli migration in
318 Botswana. Oryx 45:210-216.
319 Bergström R, Skarpe C. (1999). The abundance of large wild herbivores in a semi-arid savanna in
320 relation to seasons, pans and livestock. African Journal of Ecology 37:12-26.
321 Bissett C, Bernard TF. 2007. Habitat selection and feeding ecology of the cheetah (Acinonyx jubatus)
322 in thicket vegetation: is the cheetah a savanna specialist? Journal of Zoology 271:310-317.
323 Boast LK, Houser A. 2012. Density of large predators on commercial farmland in Ghanzi, Botswana.
324 South African Journal of Wildlife Research 42(2):138-143..
325 Boast LK, Houser AM, Good K, Gusset M. 2013. Regional variation in body size of the cheetah
326 (Acinonyx jubatus). Journal of Mammalogy 94(6):1293-1297.
327 Botswana Government Gazette. 2000. Statutory Instrument No. 69 of 2000 Restricting the Killing of
328 Lions and Cheetahs by both Public and Wildlife Staff. Government of Botswana, Gaborone.
329 Botswana Government Gazette. 2005. Statutory Instrument No 27 of 2005 killing of cheetahs
330 suspension order. Ministry of Wildlife , Environment and Tourism. Government of Botswana,
331 Gaborone.
332 Botswana Ministry of Agriculture. 2011. Livestock sector. Available at
333 http://www.moa.gov.bw./downloads_agricultural_marketing_strategy.pdf.
PeerJ PrePrints | http://dx.doi.org/10.7287/peerj.preprints.823v1 | CC-BY 4.0 Open Access | rec: 10 Feb 2015, publ: 10 Feb 2015
PrePrin
ts
334 Broekhuis F, Cozzi G, Valeix M, McNutt JW, Macdonald DW. 2013. Risk avoidance in sympatric
335 large carnivores: reactive or predictive? Journal of Animal Ecology 82:1098-1105.
336 Brooks CJ. 2005. The foraging behaviour of Burchell's zebra (Equus burchelli antiquorum). D. Phil.
337 Thesis, University of Bristol.
338 Broomhall LS, Mills MGL, du Toit JT. 2003. Home range and habitat use by cheetahs (Acinonyx
339 jubatus) in the Kruger National Park. Journal of Zoology 261:119-128.
340 Byers R, Steinhorst RK, Krausman PR. 1984. Clarification of a technique for analysis of utilization-
341 availability data. Journal of Wildlife Management 48:1050-1053.
342 Central Statistics Office. 2014. Population and housing census 2011 analytical report. Available at
343 http://www.cso.gov.bw/images/analytical_report.pdf.
344 Clements HS, Tambling CJ, Hayward MW, Kerley GIH. (2014). An objective approach to
345 determining the weight ranges of prey preferred by and accessible to the five large African carnivores.
346 PLOS ONE 9(7): e101054. Available at http://www.plosone.org.
347 Creel S, Spong G, Creel NM. 2001. Interspecific competition and the population biology of
348 extinction-prone carnivores. In: Gittleman JL, Funk SM, Macdonald DW, Wayne RK eds. Carnivore
349 Conservation. Cambridge University Press, 35-60.
350 Dalton DL, Charruau P, Boast L, Kotzé A. 2013. Social and genetic population structure of free-
351 ranging cheetah in Botswana: implications for conservation. European Journal of Wildlife Research
352 59:281-285.
353 de Azevedo FCC Murray DI. 2007. Evaluation of potential factors predisposing livestock to
354 predation by jaguars. Journal of Wildlife Management 71:2379-2386.
355 Department of Surveys and Mapping. 2001. Botswana National Atlas. Government of Botswana.
356 Available at http://www.atlas.gov.bw
PeerJ PrePrints | http://dx.doi.org/10.7287/peerj.preprints.823v1 | CC-BY 4.0 Open Access | rec: 10 Feb 2015, publ: 10 Feb 2015
PrePrin
ts

357 Durant S, Marker L, Purchase N, Belbachir F, Hunter L, Packer C, Breitenmoser-Würsten C,
358 Sogbohossou E, Bauer H. 2008. Acinonyx jubatus. Available at http://www.iucnredlist.org .
359 Durant SM. 2000. Living with the enemy: avoidance of hyenas and lions by cheetahs in the Serengeti.
360 Behavioral Ecology 11:624-632.
361 Fuller TK, Sievert PR. 2001. Carnivore demography and the consequences of changes in prey
362 availability. In: Gittleman JL, Funk SM, Macdonald DW, Wayne RK eds. Carnivore Conservation.
363 Cambridge University Press, 163-178.
364 Gittleman JL Harvey P H. 1982. Carnivore home range size, metabolic needs and ecology.
365 Behavioural Ecology and Sociobiology 10:57-63.
366 Gusset M, Swarner MJ, Mponwane L, Keletile K, McNutt JW. 2009. Human-wildlife conflict in
367 northern Botswana: livestock predation by endangered African wild dog Lycaon pictus and other
368 carnivores. Oryx 43:67-72.
369 Hachileka E. 2003. Sustainability of wildlife utilization in the Chobe District, Botswana. South
370 African Geographic Journal 85:50-57.
371 Hanssen L, Stander P. 2004. Namibia Large Carnivore Atlas. Available at
372 http://www.desertlion.info/reports/atlas_July2004.pdf.
373 Hayward MW, O'Brien J, Kerley GIH. 2007. Carrying capacity of large African predators:
374 predictions and tests. Biological Conservation 139:219-229.
375 Hemson G. 2003. The ecology and conservation of lions: human-wildlife conflict in semi-arid
376 Botswana. D. Phil. Thesis, University of Oxford.
377 Jachmann H. 2002. Comparison of aerial counts with ground counts for large African herbivores.
378 Journal of Applied Ecology 39:841-852.
379 Kent VT. 2010. The status and conservation potential of carnivores in semi-arid rangelands, Botswana.
380 D. Phil. Thesis, Durham University.
PeerJ PrePrints | http://dx.doi.org/10.7287/peerj.preprints.823v1 | CC-BY 4.0 Open Access | rec: 10 Feb 2015, publ: 10 Feb 2015
PrePrin
ts

381 Klein R. 2007. Status report for cheetah in Botswana. In: Breitenmoser C, Breitenmoser U, Durant S
382 eds. Status and conservation needs of cheetahs in southern Africa. IUCN/Cat Specialist Group, 14-21.
383 Lindsey PA, Davies-Mostert HT. 2009. South African action plan for the conservation of cheetahs
384 and African wild dogs. Report from a national conservation action planning workshop. IUCN Cat
385 Specialist Group, 17-19.
386 Marker L. 2003. Aspects of cheetah (Acinonyx jubatus) biology, ecology and conservation strategies
387 on Namibian farmlands. D. Phil. Thesis, University of Oxford.
388 Marker L. Dickman A. (2004). Human aspects of cheetah conservation: lessons learned from the
389 Namibian farmlands. Human Dimensions of Wildlife 9:297-305.
390 Marker L, Dickman A, Wilkinson C, Schumann B, Fabiano E. 2007. The Namibian cheetah: status
391 report. In: Breitenmoser C, Breitenmoser U, Durant S eds. Status and conservation needs of cheetahs in
392 southern Africa. IUCN Cat Specialist Group, 4-13.
393 Marker LL, Muntifering JR, Dickman AJ, Mills MGL, Macdonald DW. 2003. Quantifying prey
394 preferences of free-ranging Namibian cheetahs. South African Journal of Wildlife Research 33:43-53.
395 Mills MGL, Broomhall LS, du Toit JT. 2004. Cheetah Acinonyx jubatus feeding ecology in the
396 Kruger National Park and a comparison across African savanna habitats: is the cheetah only a
397 successful hunter on open grassland plains? Wildlife Biology 10:177-186.
398 Mills MGL, Gorman ML. 1997. Factors affecting the density and distribution of wild dogs in the
399 Kruger National Park. Conservation Biology 11:1397-1406.
400 Mizutani F. 1999. Impact of leopards on a working ranch in Laikipia, Kenya. African Journal of
401 Ecology 37:211-225.
402 Moleele NM, Ringrose S, Matheson W, Vanderpost C. 2002. More woody plants? The status of
403 bush encroachment in Botswana's grazing areas. Journal of Environmental Management 64:3-11.
PeerJ PrePrints | http://dx.doi.org/10.7287/peerj.preprints.823v1 | CC-BY 4.0 Open Access | rec: 10 Feb 2015, publ: 10 Feb 2015
PrePrin
ts
404 Muntifering JR, Dickman AJ, Perlow LM, Hruska T, Ryan PG, Marker LL, Jeo RM. 2006.
405 Managing the matrix for large carnivores: a novel approach and perspective from cheetah (Acinonyx
406 jubatus) habitat suitability modelling. Animal Conservation 9:103-112.
407 Ogada MO, Woodroffe R, Oguge NO, Frank LG. 2003. Limiting depredation by African
408 carnivores: the role of livestock husbandry. Conservation Biology 17:1521-1530.
409 Ogara WO, Gitahi NJ, Andanje SA, Oguge N, Nduati DW, Mainga AO. 2010. Determination of
410 carnivores prey base by scat analysis in Samburu community group ranches in Kenya. African Journal
411 of Environmental Science and Technology 4:540-546.
412 Purchase GK, du Toit JT. 2000. The use of space and prey by cheetahs in Matusadona National Park,
413 Zimbabwe. South African Journal of Wildlife Research 30:139-144.
414 Riginos C, Porensky LM, Veblen KE, Odadi WO, Sensenig R, Kimuyu D, Keesing F, Wilkerson
415 ML, Young TP. 2012. Lessons on the relationship between livestock husbandry and biodiversity from
416 the Kenya Long-term Exclosure Experiment (KLEE). Pastoralism 22:1-22.
417 Schuette P, Creel C, Christianson D. 2013. Coexistence of African lions, livestock, and people in a
418 landscape with variable human land use and seasonal movements. Biological Conservation 157:148-
419 154.
420 Selebatso M, Moe SR, Swenson JE. 2008. Do farmers support cheetah Acinonyx jubatus conservation
421 in Botswana despite livestock depredation? Oryx 42:430-436.
422 Theobald DM, Hobbs NT, Bearly T, Zack JA, Shenk T, Riebsame WE. 2000. Incorporating
423 biological information in local land-use decision making: designing a system for conservation
424 planning. Landscape Ecology 15:35-45.
425 Van der Meer E, Mpofu J, Rasmussen GSA, Fritz H. 2013. Characteristics of African wild dog
426 natal dens selected under different interspecific predation pressures. Mammalian Biology 78:336-343.
PeerJ PrePrints | http://dx.doi.org/10.7287/peerj.preprints.823v1 | CC-BY 4.0 Open Access | rec: 10 Feb 2015, publ: 10 Feb 2015
PrePrin
ts

427 Verlinden A. 1998. Seasonal movement patterns of some ungulates in the Kalahari ecosystem of
428 Botswana between 1990 and 1995. African Journal of Ecology 36:117-128.
429 Wingqvist GÖ, Dahlberg E 2008. Botswana Environmental and Climate Change Analysis. University
430 of Gothenburg, Stockholm.
431 Winterbach CW Winterbach HEK. 2003. Draft predator management strategy. Department of
432 Wildlife and National Parks, Gaborone, Botswana.
433 Winterbach HEK, Winterbach CW, Somers MJ. 2014. Landscape suitability in Botswana for the
434 conservation of its six large African carnivores. PLOS ONE 9(6):e100202 . Available at
435 http://www.plosone.org .
436 Woodroffe R, Frank LG, Lindsey PA, ole Ranah MK, Romañach S. (2007). Livestock husbandry
437 as a tool for carnivore conservation in Africa's community rangelands: a case-control study.
438 Biodiversity Conservation 16:1245-1260.
439 Woodroffe R, Ginsberg JR. 1998. Edge effects and the extinction of populations inside protected
440 areas. Science 280:2126-2128.
441 Woodroffe R, Lindsey P, Romañach S, Stein A, ole Ranah SMK. 2005. Livestock predation by
442 endangered African wild dogs (Lycaon pictus) in northern Kenya. Biological Conservation 124:225-
443 234.
444
PeerJ PrePrints | http://dx.doi.org/10.7287/peerj.preprints.823v1 | CC-BY 4.0 Open Access | rec: 10 Feb 2015, publ: 10 Feb 2015
PrePrin
ts

Figure 1. Land use categories present in Botswana.
PeerJ PrePrints | http://dx.doi.org/10.7287/peerj.preprints.823v1 | CC-BY 4.0 Open Access | rec: 10 Feb 2015, publ: 10 Feb 2015
PrePrin
ts

Figure 2. The distribution of cheetah prey biomass (LSU) across Botswana.
PeerJ PrePrints | http://dx.doi.org/10.7287/peerj.preprints.823v1 | CC-BY 4.0 Open Access | rec: 10 Feb 2015, publ: 10 Feb 2015
PrePrin
ts

Figure 3. The distribution of the percentage cheetah prey biomass (LSU) of small stock and prey
biomass combined across Botswana.
PeerJ PrePrints | http://dx.doi.org/10.7287/peerj.preprints.823v1 | CC-BY 4.0 Open Access | rec: 10 Feb 2015, publ: 10 Feb 2015
PrePrin
ts
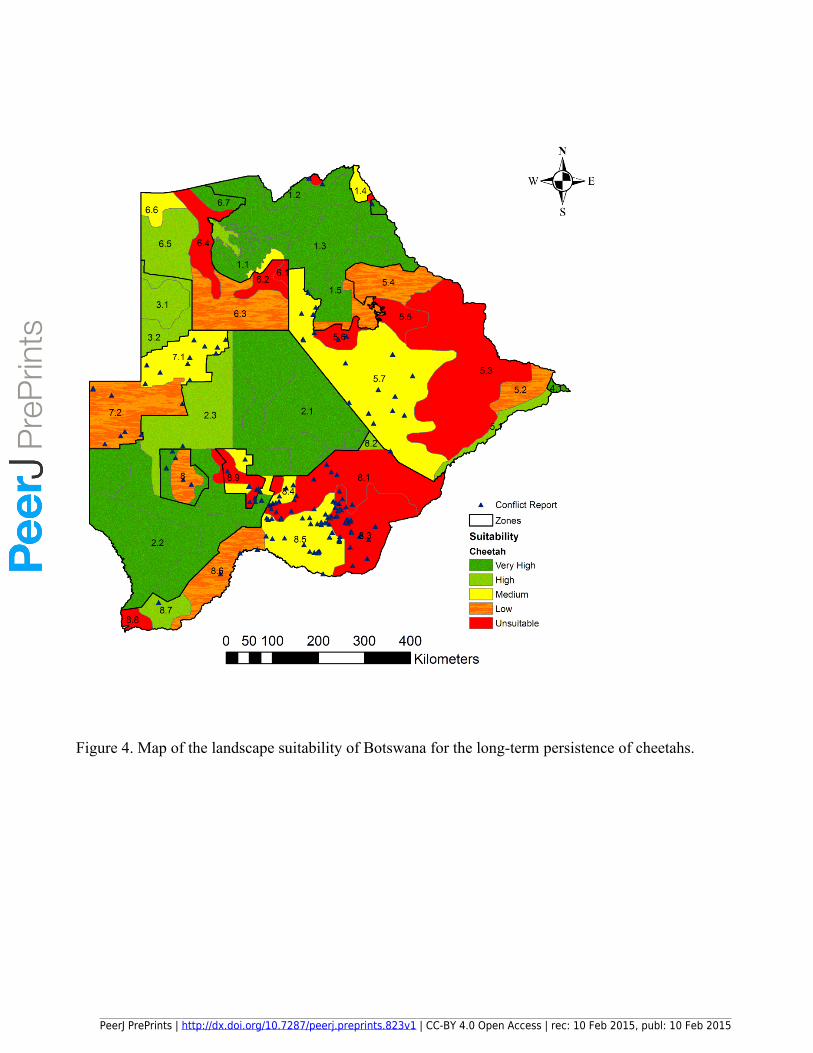
Figure 4. Map of the landscape suitability of Botswana for the long-term persistence of cheetahs.
PeerJ PrePrints | http://dx.doi.org/10.7287/peerj.preprints.823v1 | CC-BY 4.0 Open Access | rec: 10 Feb 2015, publ: 10 Feb 2015
PrePrin
ts

Table 1. Wild prey species occurring in Botswana and identified as within the preferred weight range
of cheetah’s prey (body mass 14 – 135 kg, Clements et al, 2014).
Species Scientific name Weight (kg) LSU conversion
Red lechwe Kobus leche 72 0.25298
Ostrich Struthio camelus 68 0.24237
Warthog Phacochoerus africanus 45 0.17783
Impala Aepyceros melampus 45 0.17783
Reedbuck Redunca arundinum 40 0.16279
Springbok Antidorcas marsupialis 26 0.11785
Duiker Sylvicapra grimmia 15 0.07801
Steenbok Raphicerus campestris 10 0.05756
PeerJ PrePrints | http://dx.doi.org/10.7287/peerj.preprints.823v1 | CC-BY 4.0 Open Access | rec: 10 Feb 2015, publ: 10 Feb 2015
PrePrin
ts

Table 2. The frequency distributions of 12’ grids in the Kgalagadi and Ghanzi Agricultural Zones and
the western strata of the Central Agricultural Zone in Botswana, and livestock attacks by cheetahs in
these areas from 1995 to 2006 categorised by the percentage that cheetah’s wild prey biomass
contributed to the total biomass of wild prey and small stock combined.
Percentage wild
prey
Number of grids Number of
livestock attacks
Attacks per grid
0 43 34 0.79
>0 to ≤ 1 48 39 0.81
>1 to ≤ 2 33 9 0.27
>2 to ≤ 5 48 27 0.56
>5 to ≤ 10 40 9 0.23
>10 to ≤ 20 23 15 0.65
>20 to ≤ 80 32 8 0.25
>80 to ≤ 100 136 47 0.35
TOTAL 403 188
PeerJ PrePrints | http://dx.doi.org/10.7287/peerj.preprints.823v1 | CC-BY 4.0 Open Access | rec: 10 Feb 2015, publ: 10 Feb 2015
PrePrin
ts

Table 3. Simultaneous confidence intervals for cheetah livestock attacks (N = 188) recorded (observed
values) with the number of grid cells (N = 403) in the categories of the percentage that cheetah’s wild
prey biomass contributed to the total biomass of wild prey and small stock combined in the Kgalagadi
and Ghanzi Agricultural Zones and the western strata of the Central Agricultural Zone in Botswana (k
= 4, α = 0.05, Z= 2.4977).
Percentage
wild prey
Expected
Proportion
Pio
Observed
Proportion
Pi
Bonferonni intervals
for Pi
Use index
Pi/ Pio
Significant
0 0.106700 0.180851 0.1107 ≤ Pi ≤ 0.2510 1.69 +
>0 to ≤ 20 0.476427 0.526596 0.4357 ≤ Pi ≤ 0.6175 1.11 0
>20 to ≤ 80 0.079404 0.042553 0.0058 ≤ Pi ≤ 0.0793 0.54 -
>80 to ≤ 100 0.337469 0.250000 0.1711 ≤ Pi ≤ 0.3289 0.74 -
PeerJ PrePrints | http://dx.doi.org/10.7287/peerj.preprints.823v1 | CC-BY 4.0 Open Access | rec: 10 Feb 2015, publ: 10 Feb 2015
PrePrin
ts

445 Table 4. Simultaneous confidence intervals for the presence, transience and absence of cheetahs based
446 on 89 questionnaire completed by farmers in areas deemed suitable and unsuitable for cheetahs in
447 Botswana (k = 4, α = 0.05, Z= 2.4977).
Observation
Type
Expected
Proportion
Pio
Observed
Proportion
Pi
Bonferonni
intervals for Pi
Use
index Pi/
Pio Significant
Absent in
unsuitable
area 0.026462 0.112360
0.0287 ≤ Pi ≤
0.1960 4.25 *+
Present in
unsuitable
area 0.085687 0.000000
0.0000 ≤ Pi ≤
0.0000 0.00 *-
Absent in
suitable
area 0.209493 0.123596
0.0365 ≤ Pi ≤
0.2107 0.59 0
Present in
suitable
area 0.678358 0.764045
0.6516 ≤ Pi ≤
0.8765 1.13 0
448
449450451452453
PeerJ PrePrints | http://dx.doi.org/10.7287/peerj.preprints.823v1 | CC-BY 4.0 Open Access | rec: 10 Feb 2015, publ: 10 Feb 2015
PrePrin
ts