Monitoring and updating MoM values
Updating MoM values • When to make changes
• Factor updates
• Discussion
CUSUM charts • Practical session
Confidence intervals • Practical session

CUSUM Charts

Practical session: Constructing CUSUM charts
• Quick demonstration in XL
• Some illustrative examples with no random variation to illustrate the methodology
• Discussion of features of the CUSUM charts
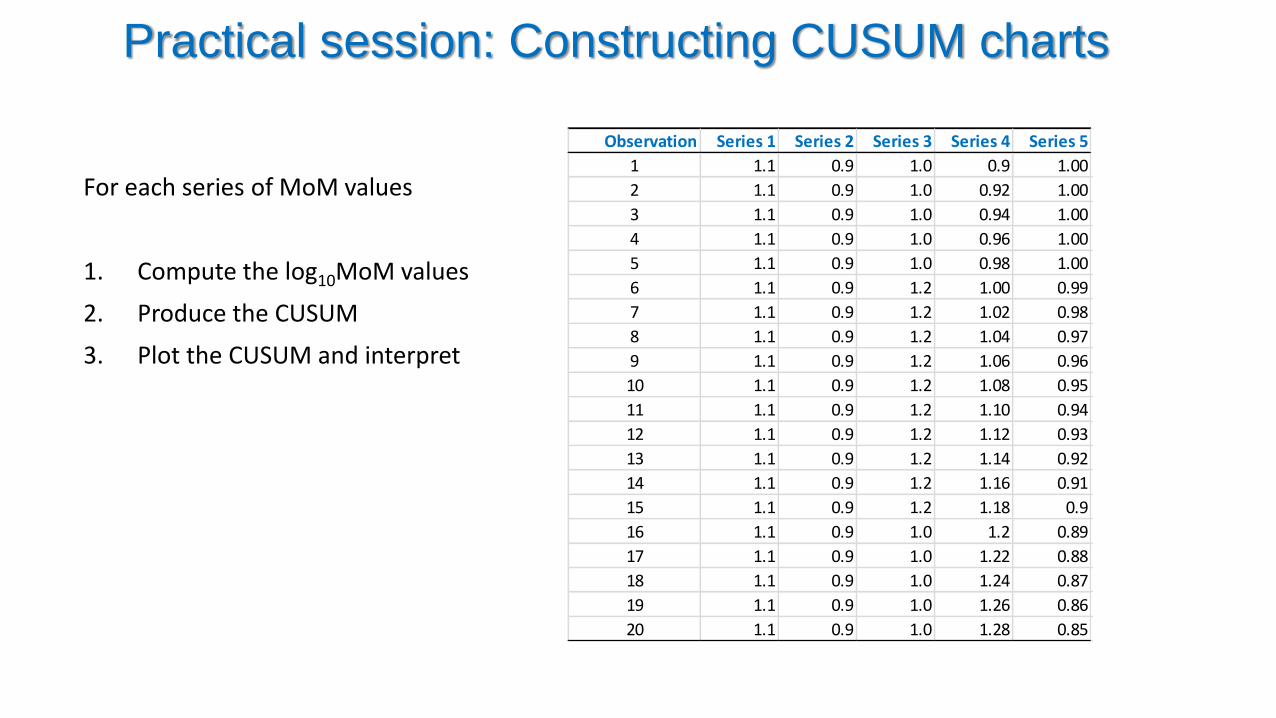
Practical session: Constructing CUSUM charts
For each series of MoM values
1. Compute the log10MoM values
2. Produce the CUSUM
3. Plot the CUSUM and interpret
Observation Series 1 Series 2 Series 3 Series 4 Series 5
1 1.1 0.9 1.0 0.9 1.00
2 1.1 0.9 1.0 0.92 1.00
3 1.1 0.9 1.0 0.94 1.00
4 1.1 0.9 1.0 0.96 1.00
5 1.1 0.9 1.0 0.98 1.00
6 1.1 0.9 1.2 1.00 0.99
7 1.1 0.9 1.2 1.02 0.98
8 1.1 0.9 1.2 1.04 0.97
9 1.1 0.9 1.2 1.06 0.96
10 1.1 0.9 1.2 1.08 0.95
11 1.1 0.9 1.2 1.10 0.94
12 1.1 0.9 1.2 1.12 0.93
13 1.1 0.9 1.2 1.14 0.92
14 1.1 0.9 1.2 1.16 0.91
15 1.1 0.9 1.2 1.18 0.9
16 1.1 0.9 1.0 1.2 0.89
17 1.1 0.9 1.0 1.22 0.88
18 1.1 0.9 1.0 1.24 0.87
19 1.1 0.9 1.0 1.26 0.86
20 1.1 0.9 1.0 1.28 0.85

0 5000 10000 15000 20000 25000
-600
-400
-200
0
Sample
log
10 M
oM
Jan
Feb Mar
Apr
May
Jun
Jul
Aug
1 MoM
0.9 MoM
1.1 MoM
0.95 MoM
1.05 MoM
Log MoM CUSUM: Perfect
The horizontal trajectory reflects the situation where there is no bias in MoM values.

0 1000 2000 3000 4000 5000 6000 7000
-150
-100
-50
0
50
100
Sample
log
10 M
oM
Dec
JanFeb M
arApr
May
Jun
Jul
Aug
1 MoM
0.9 MoM
1.1 MoM
0.95 MoM
1.05 MoM
Log MoM CUSUM with bias
Positive bias apparent from May.

Interpretation of CUSUM charts
• CUSUM charts are a powerful way of monitoring MoM values over time
• Interpretation of CUSUM charts can be far from straightforward
• There is always a danger of over interpretation
• Confidence intervals can be used to account for the uncertainty in estimation of median MoM values

Confidence Intervals for Median MoM values

Confidence Intervals
Given a series of n MoM values, the process of obtaining a confidence interval is as follows
1. First ensure that no updates to medians have taken place in the series
2. Second check that the CUSUM scatters about a straight line
3. Compute the log10 MoM values
4. Compute the mean (i.e. average) and standard deviation
5. Compute the standard error (SE = standard deviation/sqrt(n))
6. The lower and upper limits are given by mean ± 1.96×SE

Practical session: Constructing Confidence Intervals
• Quick demonstration in XL
• Hands on
Confidence intervals for MoM values - practical.xls

Updating MoM values

Dealing with changes
• Detecting changes
• When to make changes
• What changes to make
12
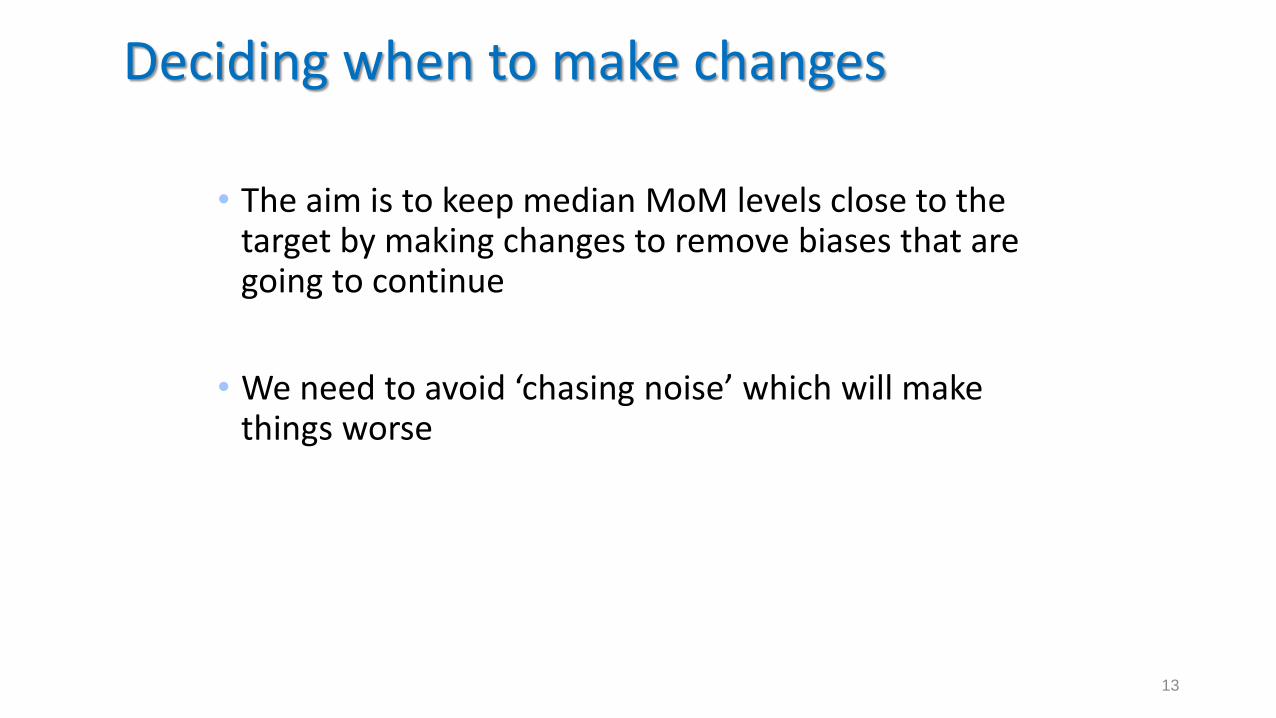
• The aim is to keep median MoM levels close to the target by making changes to remove biases that are going to continue
• We need to avoid ‘chasing noise’ which will make things worse
13
Deciding when to make changes

Given an apparent shift in
a temporal plot, try to
identify the cause. Decide
whether that cause is likely
to persist. If so, consider
making a change.
Information on a ‘special
cause’ such as a lot
change would provide
further evidence that the
change is likely to persist.
Deciding when to make changes
log(M
oM
)
14
Lot change

Factor Updates
• If the median MoM is running at a value different from 1 and this situation is going to persist into the future, then make a factor update.
• The methodology is dependent on the software.

ViewPoint
Changes to ViewPoint involve completing a form specifying the median MoM.

ViewPoint
Changes to ViewPoint involve completing a form specifying the median MoM.

LifeCycle
• If a log10 polynomial regression is used for gestational age, the intercept parameter A in the regression is updated by adding log10(Median MoM).
• New A = Current A + log10(Median MoM)
• For example if the median MoM is running consistently at 0.95 log10(0.95) = -0.022276 is added to A.
• New A = Current A - 0.022276
Testing
• It is important to test all updates.
• If the current median MoM is 0.95 and a factor update is applied, then the effect should be to divide by 0.95 so that, for example, a MoM that was 0.95 before the change should become 0.95/0.95 = 1.
• A simple way of testing is to look take samples before the change and verify that after the change the factor has been applied correctly.

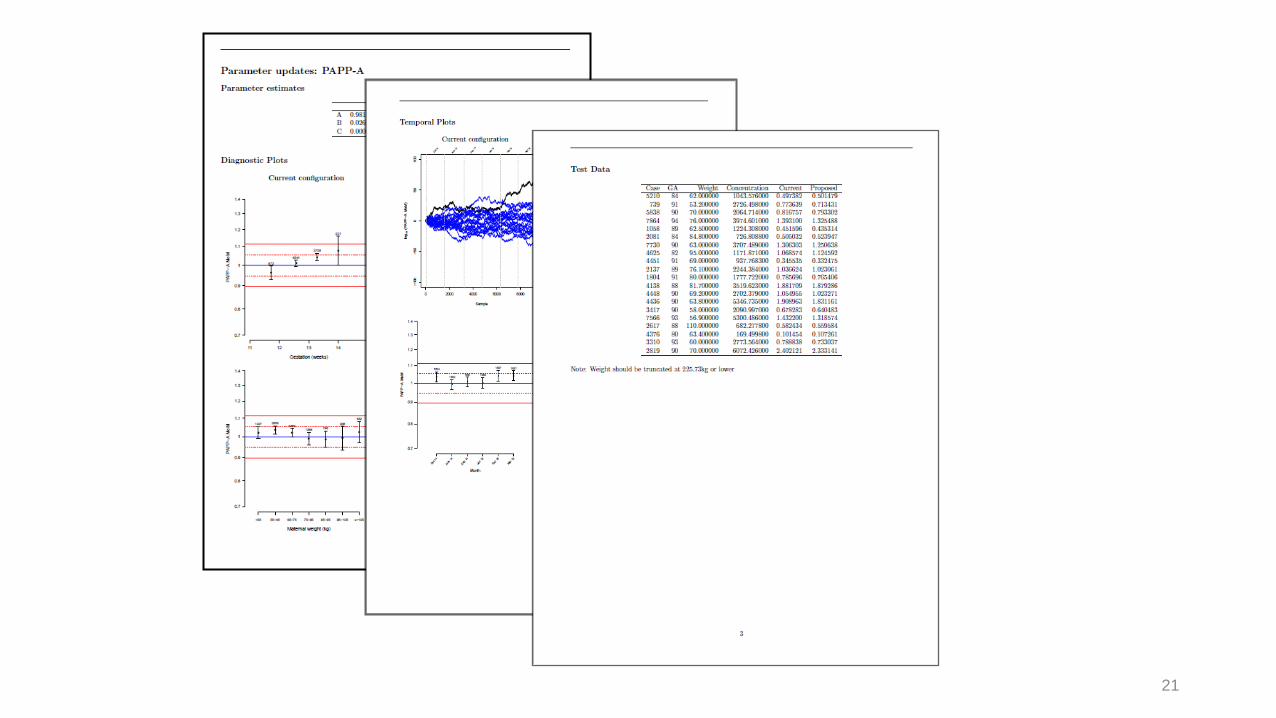
Updating the full equations
• Anything other than a factor updates requires specialist input
• This requires • new coefficients
• test data
• Diagnostics based on the data provided
20
21

Discussion
• What processes do you have in your laboratory for applying factor updates?
• How do you document these updates?
• Does the software supplier provide any advice on updating and testing the software configuration?
• Are there any suggestions for improvement?

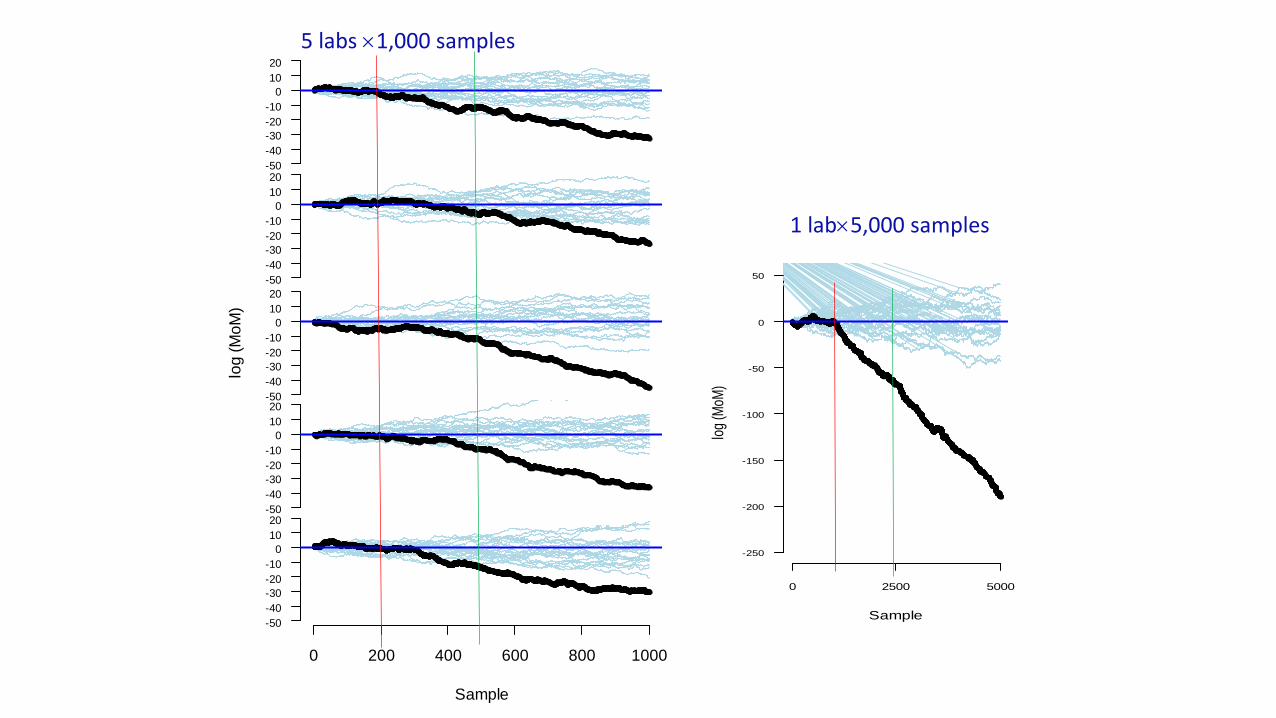
Laboratory throughput

Rationale
• Need for sufficient precision to estimate performance (standardised SPR)
• To enable monitoring of laboratory medians and early detection of change points
• For proficiency/expertise
log
(M
oM
)
-50
-40
-30
-20
-10
0
10
20
log
(M
oM
)
-50
-40
-30
-20
-10
0
10
20
log
(M
oM
)
-50
-40
-30
-20
-10
0
10
20
log
(M
oM
)
-50
-40
-30
-20
-10
0
10
20
Sample
log
(M
oM
)
-50
-40
-30
-20
-10
0
10
20
0 200 400 600 800 1000
Sample
log
(MoM
)
-250
-200
-150
-100
-50
0
50
0 2500 5000
5 labs 1,000 samples
1 lab5,000 samples