Monitoring and updating MoM values Updating MoM values • When to make changes • Factor updates • Discussion CUSUM charts • Practical session Confidence intervals • Practical session

3. Monitoring and updating multiple of medians (MoM) values within the laboratory
Jan 09, 2017
Welcome message from author
This document is posted to help you gain knowledge. Please leave a comment to let me know what you think about it! Share it to your friends and learn new things together.
Transcript

Monitoring and updating MoM values
Updating MoM values • When to make changes
• Factor updates
• Discussion
CUSUM charts • Practical session
Confidence intervals • Practical session

CUSUM Charts

Practical session: Constructing CUSUM charts
• Quick demonstration in XL
• Some illustrative examples with no random variation to illustrate the methodology
• Discussion of features of the CUSUM charts
Practical session: Constructing CUSUM charts
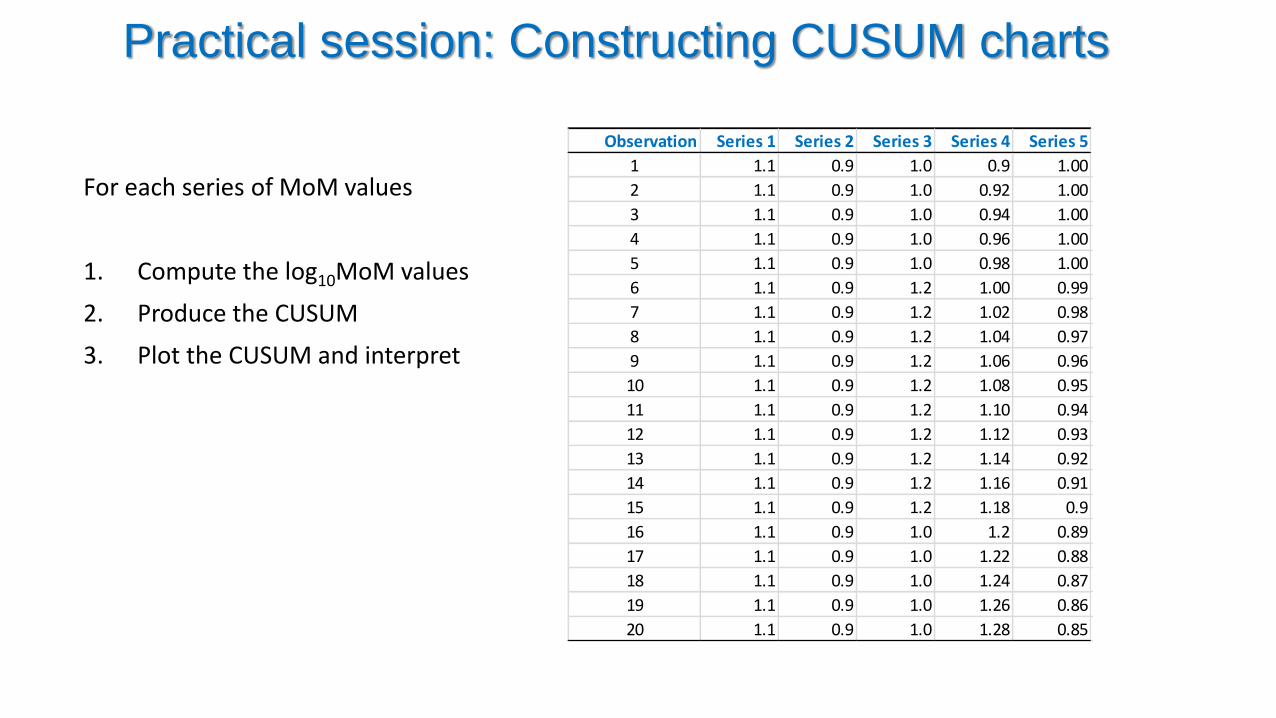
For each series of MoM values
1. Compute the log10MoM values
2. Produce the CUSUM
3. Plot the CUSUM and interpret
Observation Series 1 Series 2 Series 3 Series 4 Series 5
1 1.1 0.9 1.0 0.9 1.00
2 1.1 0.9 1.0 0.92 1.00
3 1.1 0.9 1.0 0.94 1.00
4 1.1 0.9 1.0 0.96 1.00
5 1.1 0.9 1.0 0.98 1.00
6 1.1 0.9 1.2 1.00 0.99
7 1.1 0.9 1.2 1.02 0.98
8 1.1 0.9 1.2 1.04 0.97
9 1.1 0.9 1.2 1.06 0.96
10 1.1 0.9 1.2 1.08 0.95
11 1.1 0.9 1.2 1.10 0.94
12 1.1 0.9 1.2 1.12 0.93
13 1.1 0.9 1.2 1.14 0.92
14 1.1 0.9 1.2 1.16 0.91
15 1.1 0.9 1.2 1.18 0.9
16 1.1 0.9 1.0 1.2 0.89
17 1.1 0.9 1.0 1.22 0.88
18 1.1 0.9 1.0 1.24 0.87
19 1.1 0.9 1.0 1.26 0.86
20 1.1 0.9 1.0 1.28 0.85

0 5000 10000 15000 20000 25000
-600
-400
-200
0
Sample
log
10 M
oM
Jan
Feb Mar
Apr
May
Jun
Jul
Aug
1 MoM
0.9 MoM
1.1 MoM
0.95 MoM
1.05 MoM
Log MoM CUSUM: Perfect
The horizontal trajectory reflects the situation where there is no bias in MoM values.

0 1000 2000 3000 4000 5000 6000 7000
-150
-100
-50
0
50
100
Sample
log
10 M
oM
Dec
JanFeb M
arApr
May
Jun
Jul
Aug
1 MoM
0.9 MoM
1.1 MoM
0.95 MoM
1.05 MoM
Log MoM CUSUM with bias
Positive bias apparent from May.

Interpretation of CUSUM charts
• CUSUM charts are a powerful way of monitoring MoM values over time
• Interpretation of CUSUM charts can be far from straightforward
• There is always a danger of over interpretation
• Confidence intervals can be used to account for the uncertainty in estimation of median MoM values

Confidence Intervals for Median MoM values

Confidence Intervals
Given a series of n MoM values, the process of obtaining a confidence interval is as follows
1. First ensure that no updates to medians have taken place in the series
2. Second check that the CUSUM scatters about a straight line
3. Compute the log10 MoM values
4. Compute the mean (i.e. average) and standard deviation
5. Compute the standard error (SE = standard deviation/sqrt(n))
6. The lower and upper limits are given by mean ± 1.96×SE

Practical session: Constructing Confidence Intervals
• Quick demonstration in XL
• Hands on
Confidence intervals for MoM values - practical.xls

Updating MoM values

Dealing with changes
• Detecting changes
• When to make changes
• What changes to make
12
• The aim is to keep median MoM levels close to the target by making changes to remove biases that are going to continue
• We need to avoid ‘chasing noise’ which will make things worse
13
Deciding when to make changes

Given an apparent shift in
a temporal plot, try to
identify the cause. Decide
whether that cause is likely
to persist. If so, consider
making a change.
Information on a ‘special
cause’ such as a lot
change would provide
further evidence that the
change is likely to persist.
Deciding when to make changes
log(M
oM
)
14
Lot change

Factor Updates
• If the median MoM is running at a value different from 1 and this situation is going to persist into the future, then make a factor update.
• The methodology is dependent on the software.
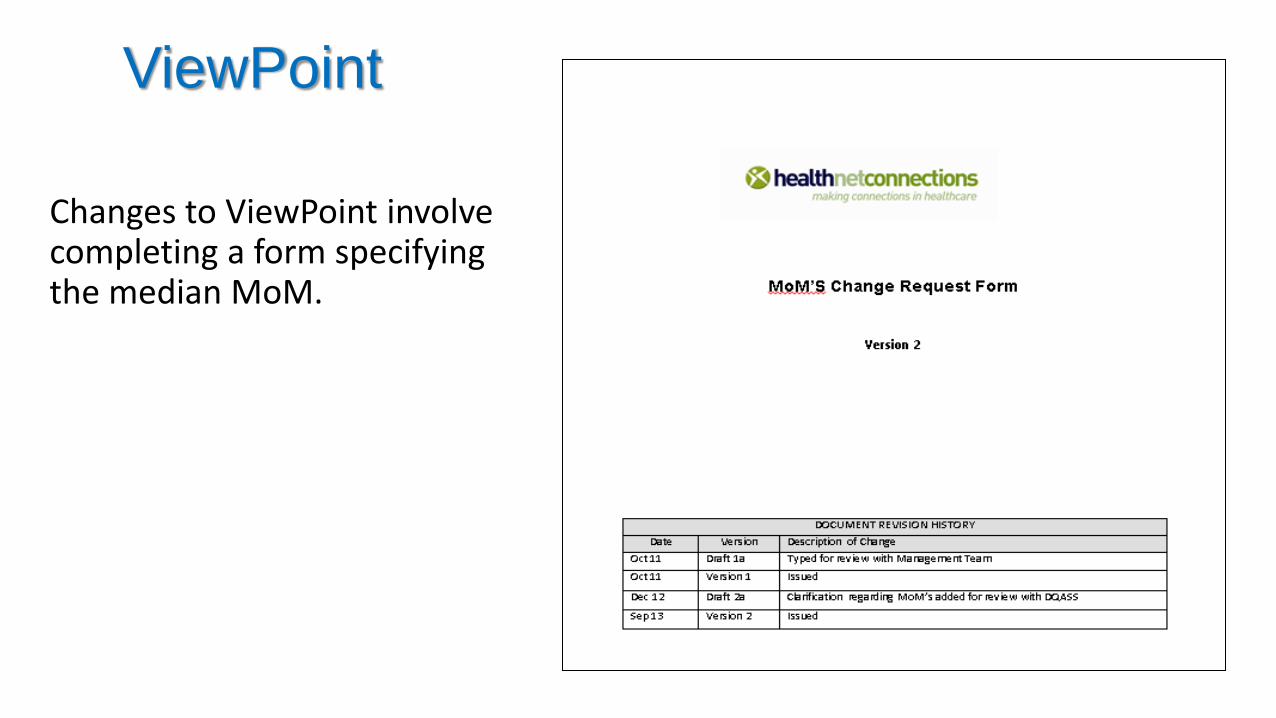
ViewPoint
Changes to ViewPoint involve completing a form specifying the median MoM.

ViewPoint
Changes to ViewPoint involve completing a form specifying the median MoM.

LifeCycle
• If a log10 polynomial regression is used for gestational age, the intercept parameter A in the regression is updated by adding log10(Median MoM).
• New A = Current A + log10(Median MoM)
• For example if the median MoM is running consistently at 0.95 log10(0.95) = -0.022276 is added to A.
• New A = Current A - 0.022276
Testing
• It is important to test all updates.
• If the current median MoM is 0.95 and a factor update is applied, then the effect should be to divide by 0.95 so that, for example, a MoM that was 0.95 before the change should become 0.95/0.95 = 1.
• A simple way of testing is to look take samples before the change and verify that after the change the factor has been applied correctly.

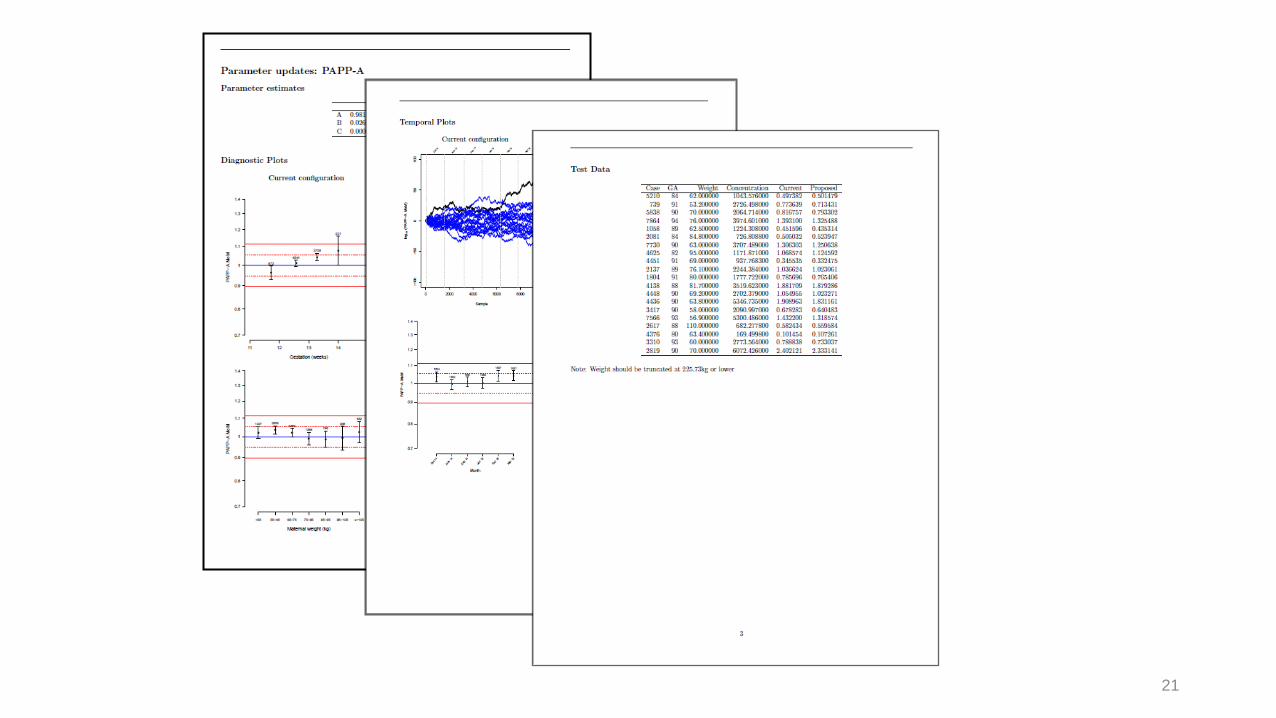
Updating the full equations
• Anything other than a factor updates requires specialist input
• This requires • new coefficients
• test data
• Diagnostics based on the data provided
20
21

Discussion
• What processes do you have in your laboratory for applying factor updates?
• How do you document these updates?
• Does the software supplier provide any advice on updating and testing the software configuration?
• Are there any suggestions for improvement?

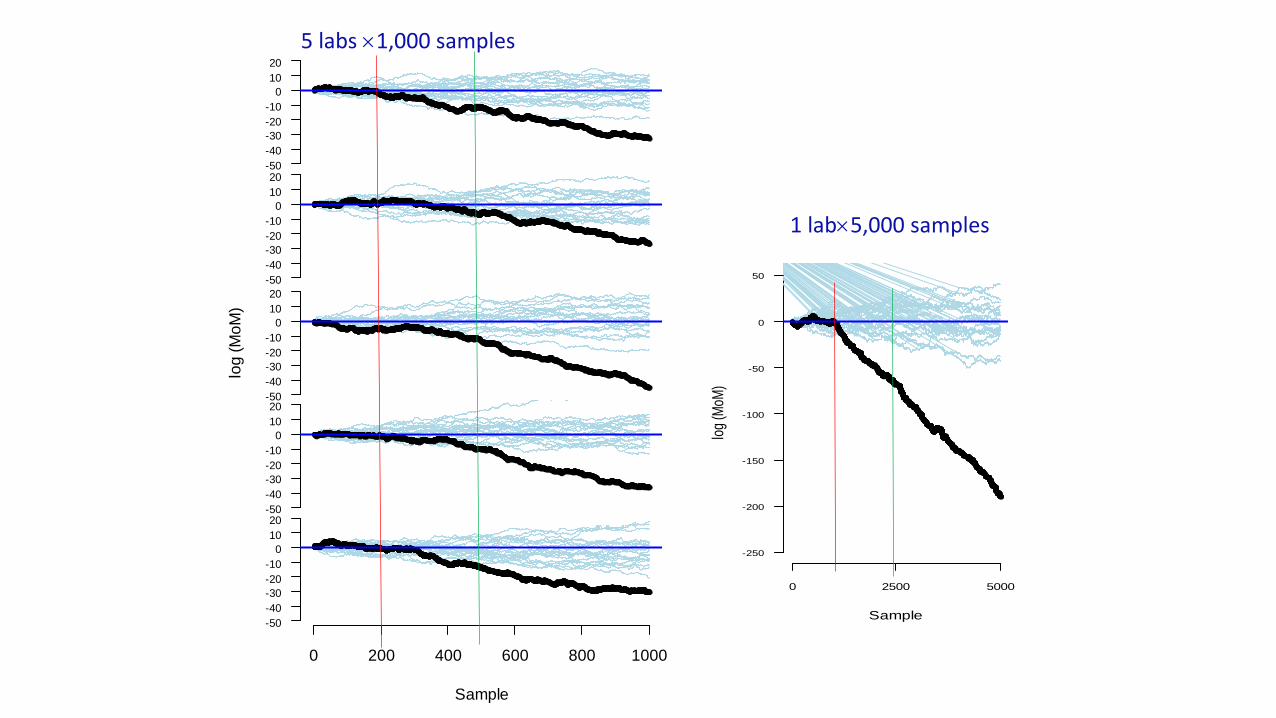
Laboratory throughput

Rationale
• Need for sufficient precision to estimate performance (standardised SPR)
• To enable monitoring of laboratory medians and early detection of change points
• For proficiency/expertise
log
(M
oM
)
-50
-40
-30
-20
-10
0
10
20
log
(M
oM
)
-50
-40
-30
-20
-10
0
10
20
log
(M
oM
)
-50
-40
-30
-20
-10
0
10
20
log
(M
oM
)
-50
-40
-30
-20
-10
0
10
20
Sample
log
(M
oM
)
-50
-40
-30
-20
-10
0
10
20
0 200 400 600 800 1000
Sample
log
(MoM
)
-250
-200
-150
-100
-50
0
50
0 2500 5000
5 labs 1,000 samples
1 lab5,000 samples
Related Documents