Februaryt 2016 | HomeAid OC,
2016 Economic and Housing Outlook
Presented by: Kevin C. Gillen Ph.D., Chief Economist

2March 2016 | OC HomeAid
Agenda
I. Economic Trends in US and CA
II. Housing Market Trends in US and CA
III. Putting It All Together: Summary and
Where We Go From Here

ECONOMIC TRENDS IN US AND CA
4March 2016 | OC HomeAidSource: Moody’s
Post-Recession: GDP Growth is Positive, but Slow:
-
500,000
1,000,000
1,500,000
2,000,000
2,500,000
3,000,000
25,000
2,025,000
4,025,000
6,025,000
8,025,000
10,025,000
12,025,000
14,025,000
16,025,000
18,025,000
1990
Q1
1990
Q4
1991
Q3
1992
Q2
1993
Q1
1993
Q4
1994
Q3
1995
Q2
1996
Q1
1996
Q4
1997
Q3
1998
Q2
1999
Q1
1999
Q4
2000
Q3
2001
Q2
2002
Q1
2002
Q4
2003
Q3
2004
Q2
2005
Q1
2005
Q4
2006
Q3
2007
Q2
2008
Q1
200
8Q
4
2009
Q3
2010
Q2
2011
Q1
2011
Q4
2012
Q3
2013
Q2
2014
Q1
2014
Q4
2015
Q3
2016
Q2
2017
Q1
2017
Q4
2018
Q3
2019
Q2
2020
Q1
2020
Q4
CA
LIFO
RN
IA,L
OS
AN
GEL
ES ,O
RA
NG
E A
ND
SAN
DIE
GO
GD
P
(M
IL. C
H. 2
00
9
USD
)
US
GD
P (
MIL
. CH
. 20
09
USD
)
GDP Growth and Forecast in US v. California v. Los Angeles v. Orange v. San Diego: 1990-2020
US California Los Angeles Orange San Diego
Forecast
Pre-Great Recession Avg. Annual Growth: ~3.25%
5March 2016 | OC HomeAidSource: Moody’s
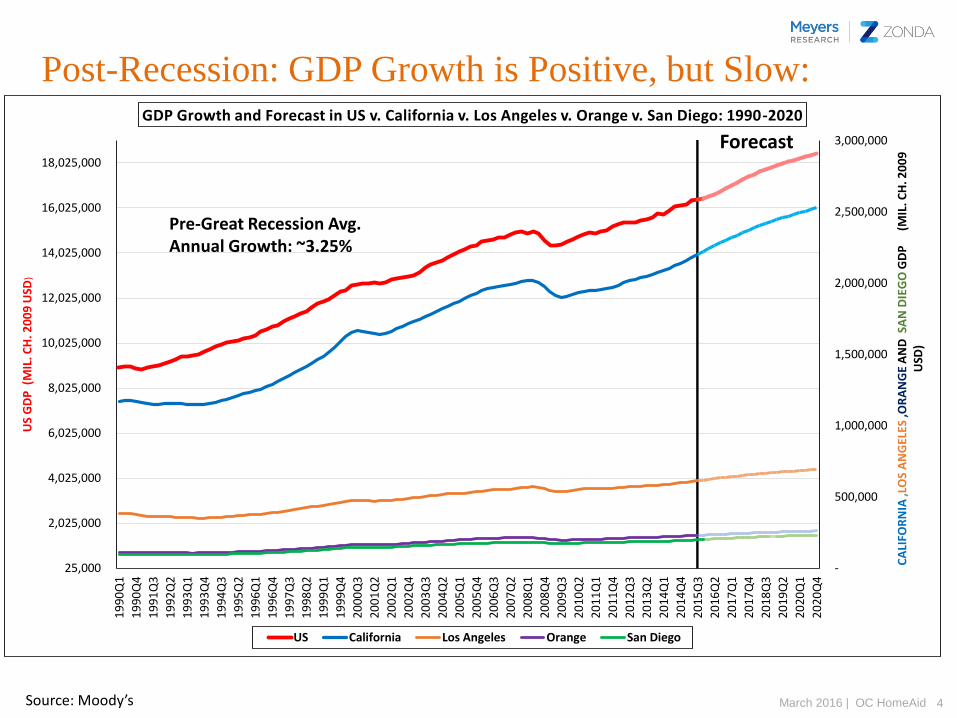
CA Unemployment Exceeds US Average:
0%
2%
4%
6%
8%
10%
12%
14%
Jan
-90
No
v-90
Sep
-91
Jul-
92
May
-93
Mar
-94
Jan
-95
No
v-95
Sep
-96
Jul-
97
May
-98
Mar
-99
Jan
-00
No
v-00
Sep
-01
Jul-
02
May
-03
Mar
-04
Jan
-05
No
v-05
Sep
-06
Jul-
07
May
-08
Mar
-09
Jan
-10
No
v-10
Sep
-11
Jul-
12
May
-13
Mar
-14
Jan
-15
No
v-15
Sep
-16
Jul-
17
May
-18
Mar
-19
Jan
-20
No
v-20
Unemployment Rate and Forecast: 1990-2020-US v. California v. Los Angeles v. Orange v.San Diego
California US Los Angeles Orange San Diego
Forecast
6March 2016 | OC HomeAidSource: BLS, Moody’s
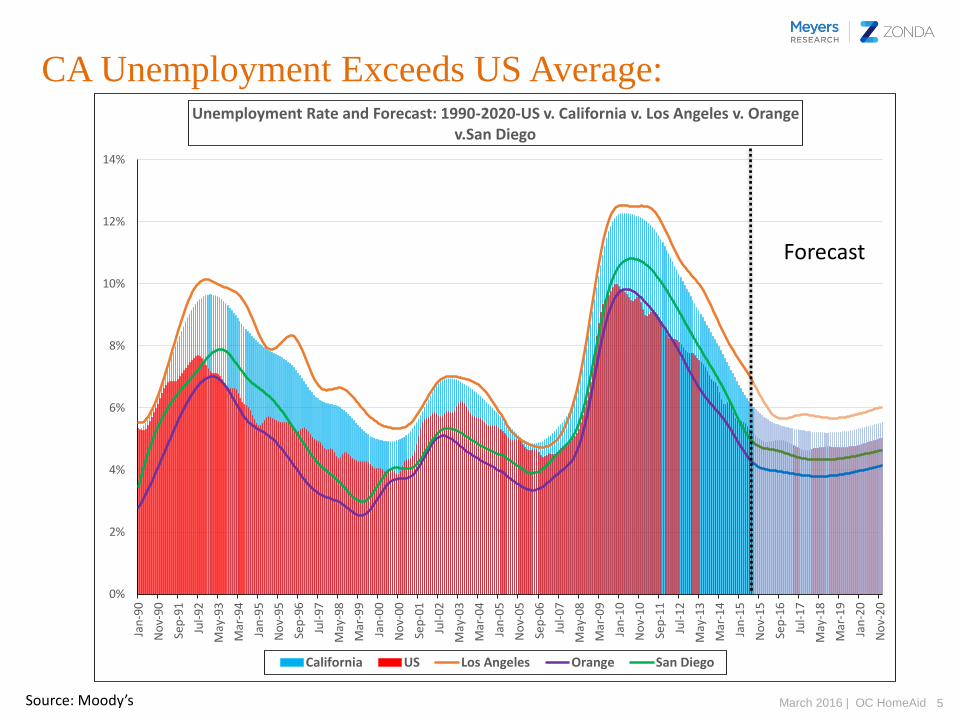
CA Got Hit Especially Hard by the Great Recession:
-0.1
-0.08
-0.06
-0.04
-0.02
0
0.02
0.04
0.06
0.08
Jan
-90
No
v-9
0
Sep
-91
Jul-
92
May
-93
Mar
-94
Jan
-95
No
v-9
5
Sep
-96
Jul-
97
May
-98
Mar
-99
Jan
-00
No
v-0
0
Sep
-01
Jul-
02
May
-03
Mar
-04
Jan
-05
No
v-0
5
Sep
-06
Jul-
07
May
-08
Mar
-09
Jan
-10
No
v-1
0
Sep
-11
Jul-
12
May
-13
Mar
-14
Jan
-15
No
v-1
5
Sep
-16
Jul-
17
May
-18
Mar
-19
Jan
-20
No
v-2
0
Job Growth (Annualized %) Rate and Forecast: 1990-2020: US v. California v. Los Angeles v. Orange v.San Diego
US California Los Angeles Orange San Diego
US Forecast California Forecast Los Angles Forecast Orange Forecast San Diego Forecast
Forecast
7March 2016 | OC HomeAid
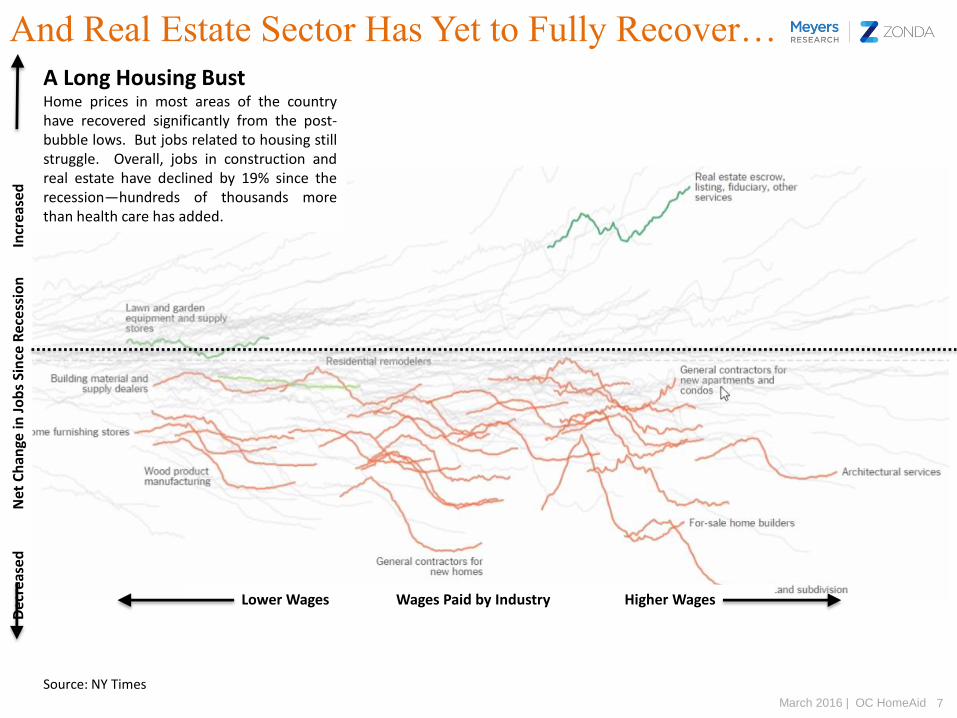
And Real Estate Sector Has Yet to Fully Recover…
Source: NY Times
Dec
reas
ed
Net
Ch
ange
in J
ob
s Si
nce
Rec
ess
ion
In
crea
sed
Lower Wages Wages Paid by Industry Higher Wages
A Long Housing BustHome prices in most areas of the countryhave recovered significantly from the post-bubble lows. But jobs related to housing stillstruggle. Overall, jobs in construction andreal estate have declined by 19% since therecession—hundreds of thousands morethan health care has added.
8March 2016 | OC HomeAidSource: Zonda
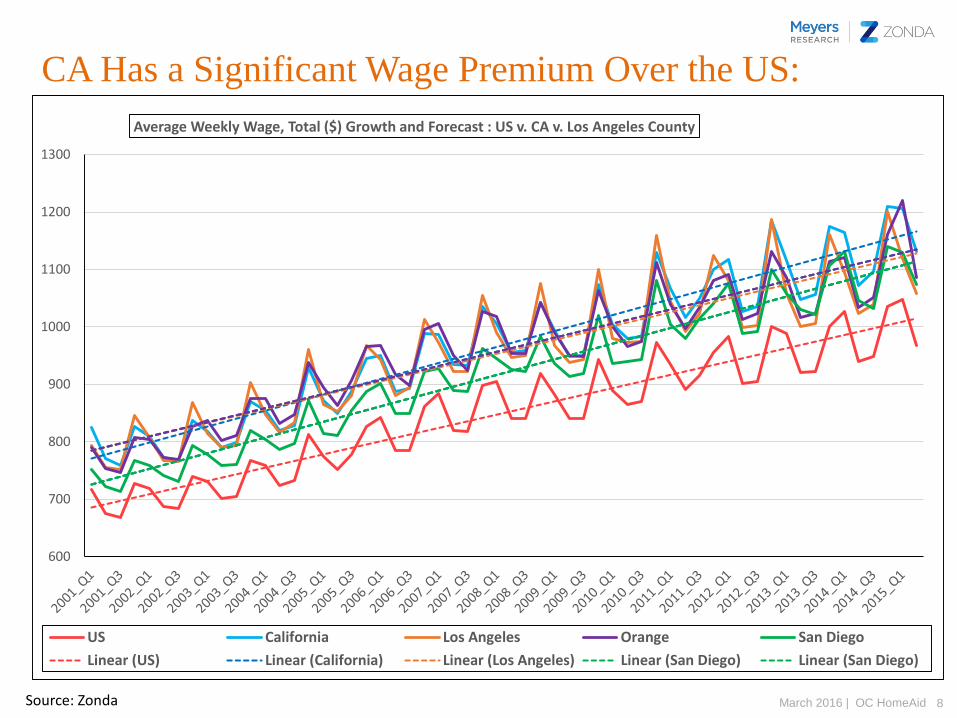
CA Has a Significant Wage Premium Over the US:
600
700
800
900
1000
1100
1200
1300
Average Weekly Wage, Total ($) Growth and Forecast : US v. CA v. Los Angeles County
US California Los Angeles Orange San Diego
Linear (US) Linear (California) Linear (Los Angeles) Linear (San Diego) Linear (San Diego)
9March 2016 | OC HomeAidSource: BEA and Moody’s
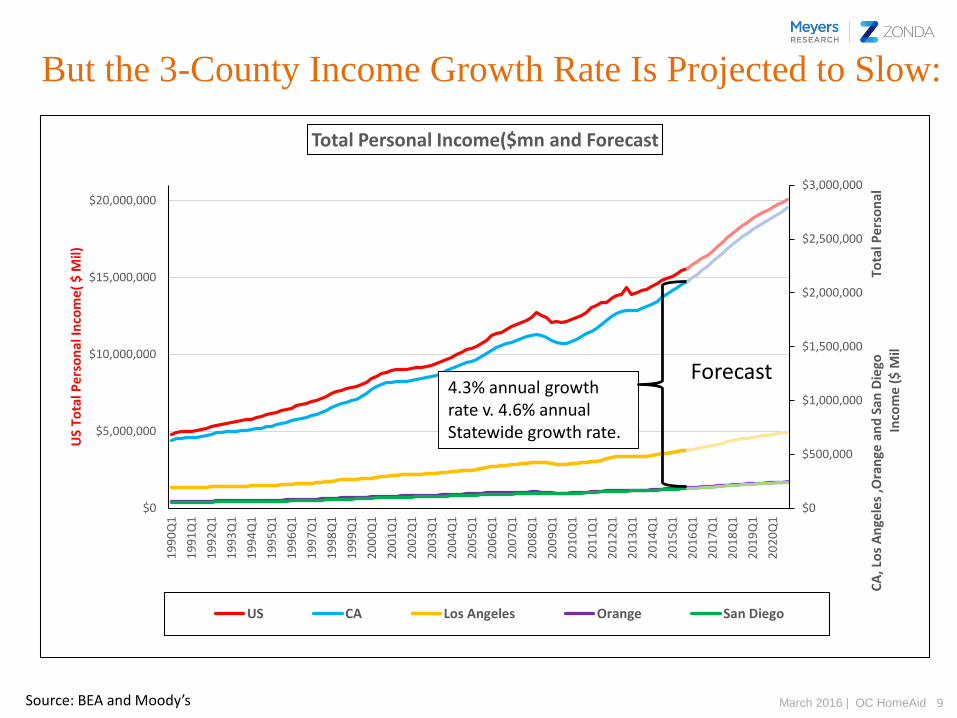
But the 3-County Income Growth Rate Is Projected to Slow:
$0
$500,000
$1,000,000
$1,500,000
$2,000,000
$2,500,000
$3,000,000
$0
$5,000,000
$10,000,000
$15,000,000
$20,000,000
19
90
Q1
19
91
Q1
19
92
Q1
19
93
Q1
19
94
Q1
19
95
Q1
19
96
Q1
19
97
Q1
19
98
Q1
19
99
Q1
20
00
Q1
20
01
Q1
20
02
Q1
20
03
Q1
20
04
Q1
20
05
Q1
20
06
Q1
20
07
Q1
20
08
Q1
20
09
Q1
20
10
Q1
20
11
Q1
20
12
Q1
20
13
Q1
20
14
Q1
20
15
Q1
20
16
Q1
20
17
Q1
20
18
Q1
20
19
Q1
20
20
Q1
CA
, Lo
s A
nge
les
,Ora
nge
an
d S
an D
iego
T
ota
l Pe
rso
nal
In
com
e (
$ M
il
US
Tota
l Pe
rso
nal
Inco
me
( $
Mil)
Total Personal Income($mn and Forecast
US CA Los Angeles Orange San Diego
4.3% annual growth rate v. 4.6% annual Statewide growth rate.
Forecast
10March 2016 | OC HomeAidSource: Freddie Mac, St. Louis Fed
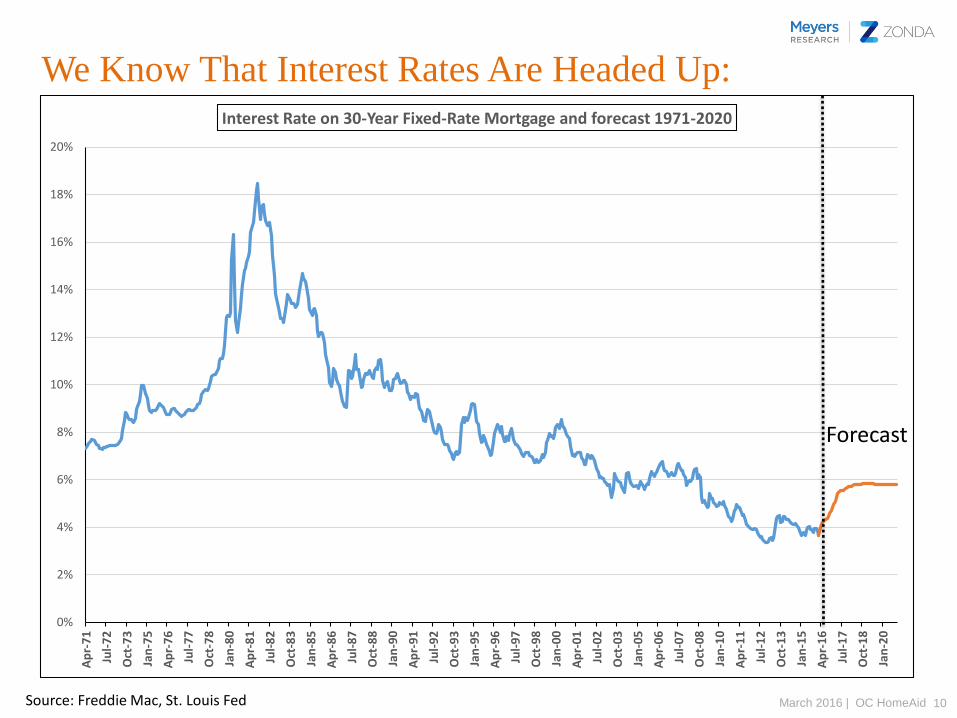
We Know That Interest Rates Are Headed Up:
0%
2%
4%
6%
8%
10%
12%
14%
16%
18%
20%
Ap
r-7
1
Jul-
72
Oct
-73
Jan
-75
Ap
r-7
6
Jul-
77
Oct
-78
Jan
-80
Ap
r-8
1
Jul-
82
Oct
-83
Jan
-85
Ap
r-8
6
Jul-
87
Oct
-88
Jan
-90
Ap
r-9
1
Jul-
92
Oct
-93
Jan
-95
Ap
r-9
6
Jul-
97
Oct
-98
Jan
-00
Ap
r-0
1
Jul-
02
Oct
-03
Jan
-05
Ap
r-0
6
Jul-
07
Oct
-08
Jan
-10
Ap
r-1
1
Jul-
12
Oct
-13
Jan
-15
Ap
r-1
6
Jul-
17
Oct
-18
Jan
-20
Interest Rate on 30-Year Fixed-Rate Mortgage and forecast 1971-2020
Forecast
11March 2016 | OC HomeAidSource: Zonda
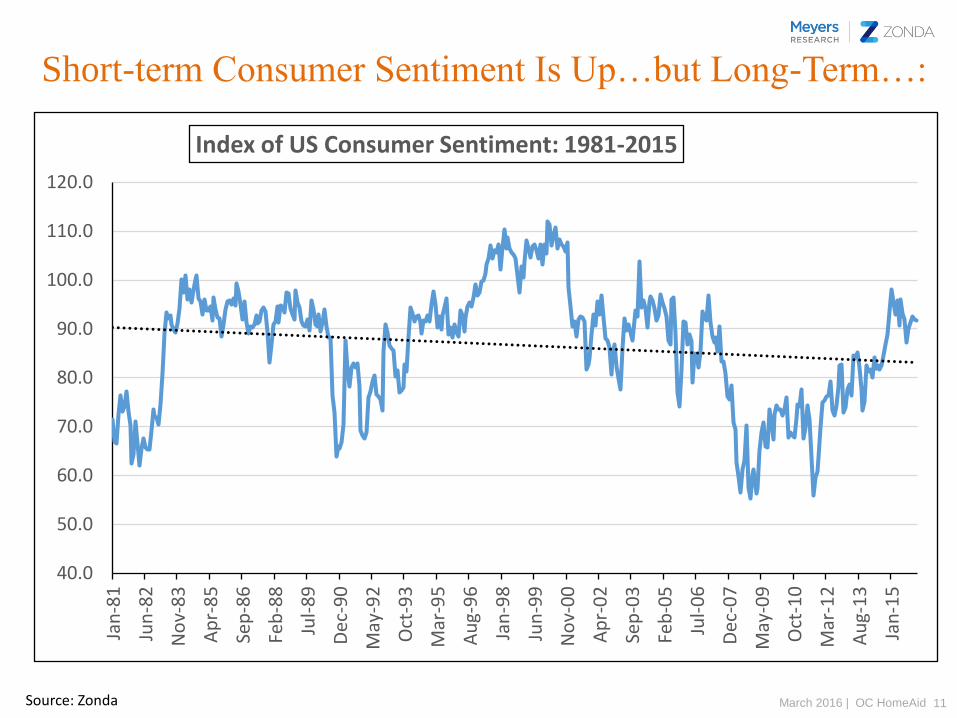
Short-term Consumer Sentiment Is Up…but Long-Term…:
40.0
50.0
60.0
70.0
80.0
90.0
100.0
110.0
120.0
Jan
-81
Jun
-82
No
v-83
Ap
r-8
5
Sep
-86
Feb
-88
Jul-
89
Dec
-90
May
-92
Oct
-93
Mar
-95
Au
g-9
6
Jan
-98
Jun
-99
No
v-00
Ap
r-0
2
Sep
-03
Feb
-05
Jul-
06
Dec
-07
May
-09
Oct
-10
Mar
-12
Au
g-1
3
Jan
-15
Index of US Consumer Sentiment: 1981-2015

HOUSING MARKET TRENDS IN US AND CA
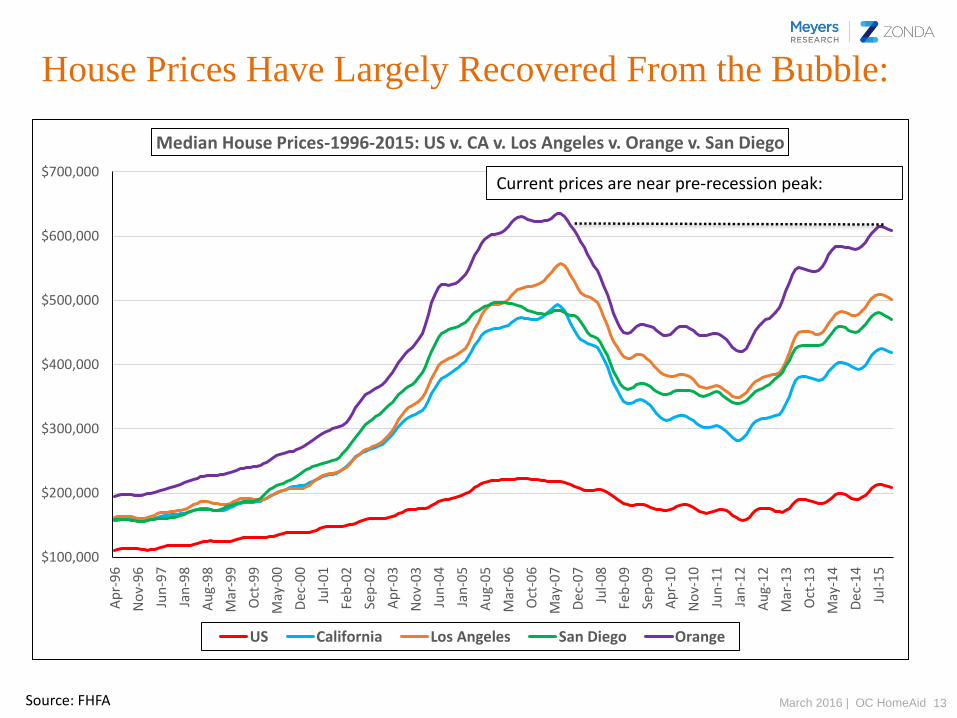
13March 2016 | OC HomeAidSource: FHFA
House Prices Have Largely Recovered From the Bubble:
$100,000
$200,000
$300,000
$400,000
$500,000
$600,000
$700,000
Ap
r-9
6
No
v-96
Jun
-97
Jan
-98
Au
g-9
8
Mar
-99
Oct
-99
May
-00
Dec
-00
Jul-
01
Feb
-02
Sep
-02
Ap
r-0
3
No
v-03
Jun
-04
Jan
-05
Au
g-0
5
Mar
-06
Oct
-06
May
-07
Dec
-07
Jul-
08
Feb
-09
Sep
-09
Ap
r-1
0
No
v-10
Jun
-11
Jan
-12
Au
g-1
2
Mar
-13
Oct
-13
May
-14
Dec
-14
Jul-
15
Median House Prices-1996-2015: US v. CA v. Los Angeles v. Orange v. San Diego
US California Los Angeles San Diego Orange
Current prices are near pre-recession peak:
14March 2016 | OC HomeAidSource: Zonda
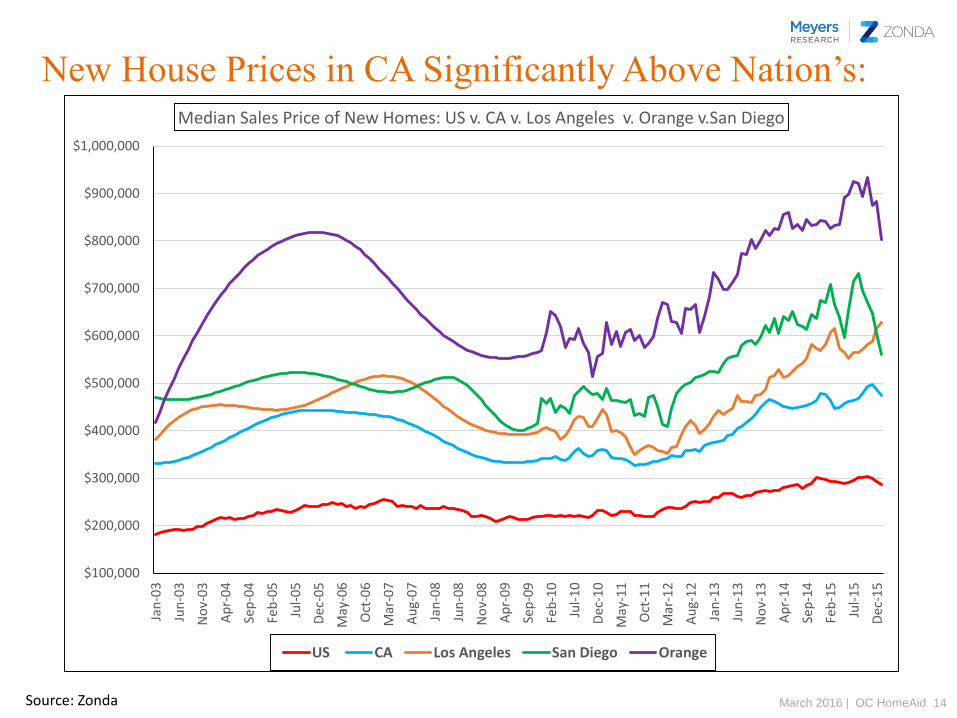
New House Prices in CA Significantly Above Nation’s:
$100,000
$200,000
$300,000
$400,000
$500,000
$600,000
$700,000
$800,000
$900,000
$1,000,000Ja
n-0
3
Jun
-03
No
v-03
Ap
r-0
4
Sep
-04
Feb
-05
Jul-
05
Dec
-05
May
-06
Oct
-06
Mar
-07
Au
g-0
7
Jan
-08
Jun
-08
No
v-08
Ap
r-0
9
Sep
-09
Feb
-10
Jul-
10
Dec
-10
May
-11
Oct
-11
Mar
-12
Au
g-1
2
Jan
-13
Jun
-13
No
v-13
Ap
r-1
4
Sep
-14
Feb
-15
Jul-
15
Dec
-15
Median Sales Price of New Homes: US v. CA v. Los Angeles v. Orange v.San Diego
US CA Los Angeles San Diego Orange
15March 2016 | OC HomeAidSource: Zonda
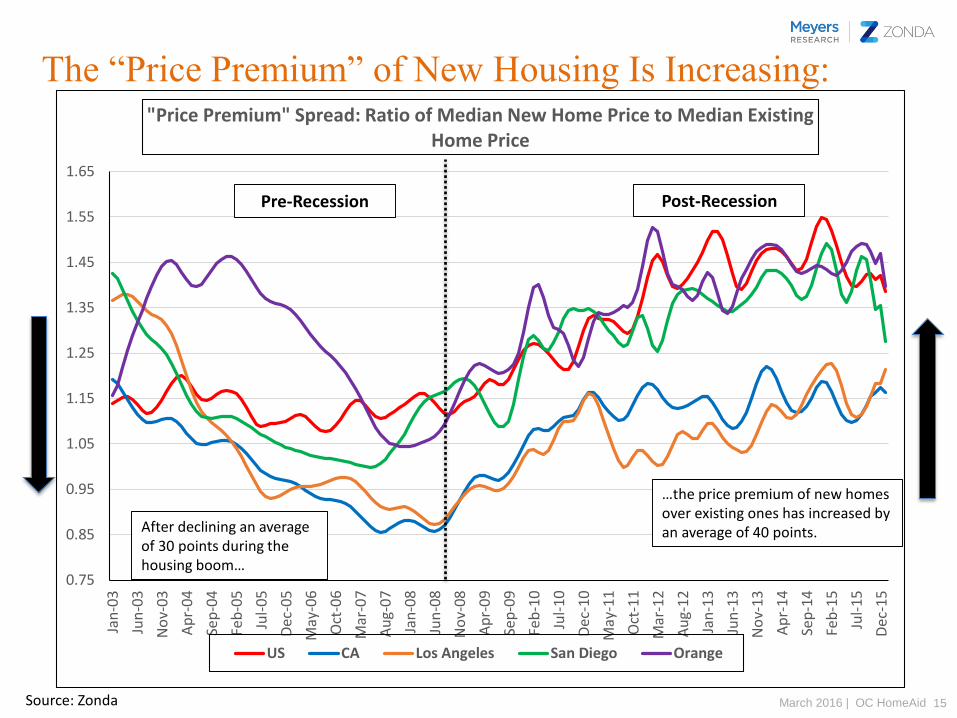
The “Price Premium” of New Housing Is Increasing:
0.75
0.85
0.95
1.05
1.15
1.25
1.35
1.45
1.55
1.65
Jan
-03
Jun
-03
No
v-03
Ap
r-0
4
Sep
-04
Feb
-05
Jul-
05
Dec
-05
May
-06
Oct
-06
Mar
-07
Au
g-0
7
Jan
-08
Jun
-08
No
v-08
Ap
r-0
9
Sep
-09
Feb
-10
Jul-
10
Dec
-10
May
-11
Oct
-11
Mar
-12
Au
g-1
2
Jan
-13
Jun
-13
No
v-13
Ap
r-1
4
Sep
-14
Feb
-15
Jul-
15
Dec
-15
"Price Premium" Spread: Ratio of Median New Home Price to Median Existing Home Price
US CA Los Angeles San Diego Orange
Pre-Recession Post-Recession
After declining an average of 30 points during the housing boom…
…the price premium of new homes over existing ones has increased by an average of 40 points.
16March 2016 | OC HomeAidSource: Zonda
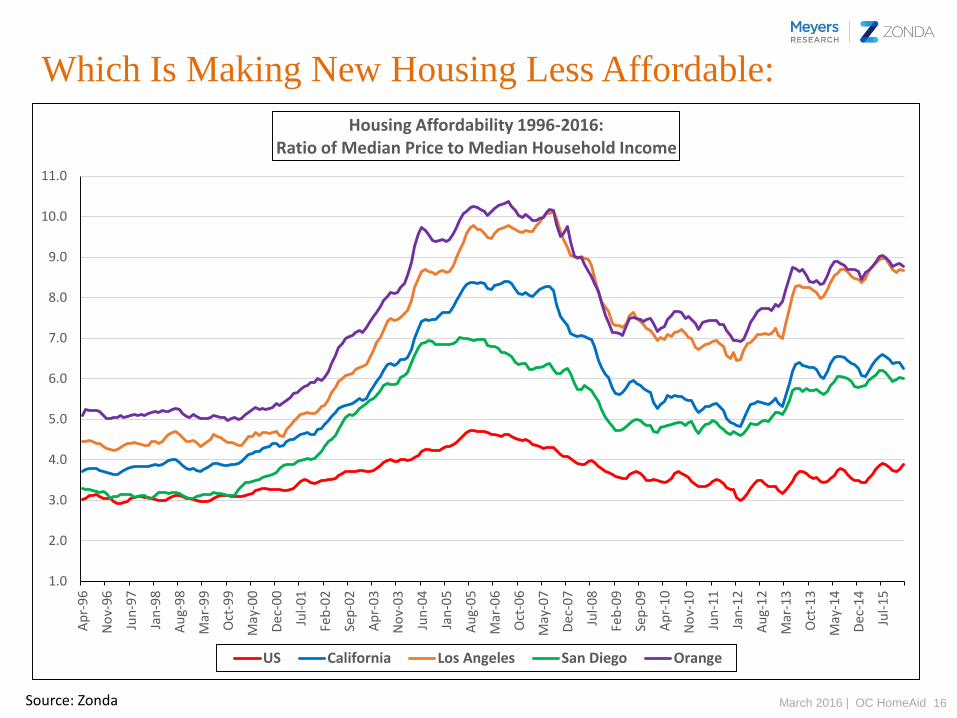
Which Is Making New Housing Less Affordable:
1.0
2.0
3.0
4.0
5.0
6.0
7.0
8.0
9.0
10.0
11.0
Ap
r-9
6
No
v-96
Jun
-97
Jan
-98
Au
g-9
8
Mar
-99
Oct
-99
May
-00
Dec
-00
Jul-
01
Feb
-02
Sep
-02
Ap
r-0
3
No
v-03
Jun
-04
Jan
-05
Au
g-0
5
Mar
-06
Oct
-06
May
-07
Dec
-07
Jul-
08
Feb
-09
Sep
-09
Ap
r-1
0
No
v-10
Jun
-11
Jan
-12
Au
g-1
2
Mar
-13
Oct
-13
May
-14
Dec
-14
Jul-
15
Housing Affordability 1996-2016:Ratio of Median Price to Median Household Income
US California Los Angeles San Diego Orange
17March 2016 | OC HomeAidSource: US Census
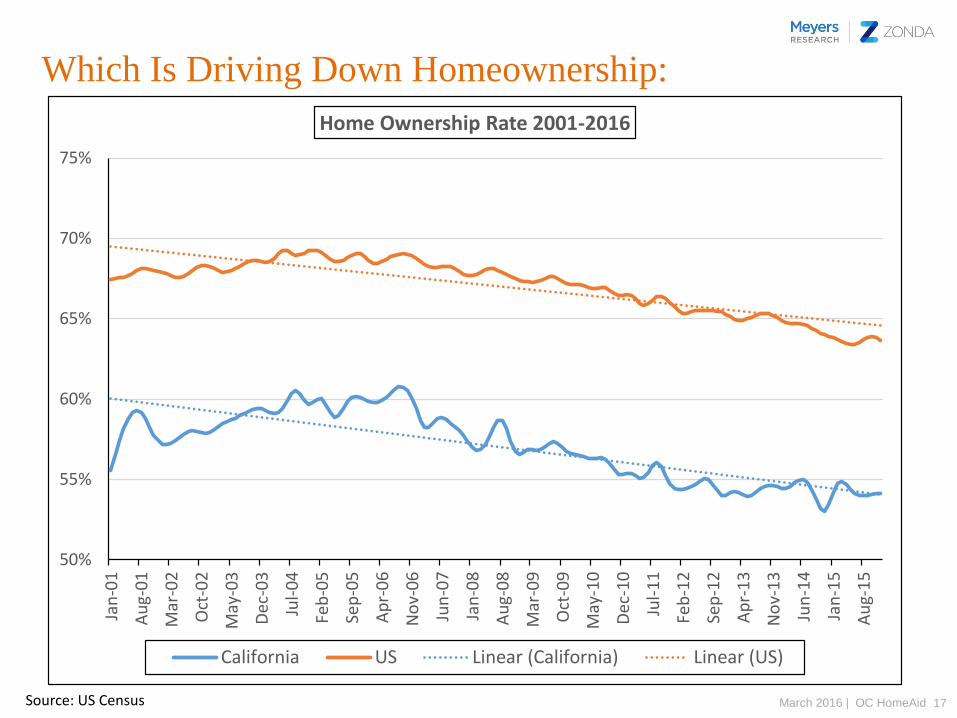
Which Is Driving Down Homeownership:
50%
55%
60%
65%
70%
75%
Jan
-01
Au
g-0
1
Mar
-02
Oct
-02
May
-03
Dec
-03
Jul-
04
Feb
-05
Sep
-05
Ap
r-0
6
No
v-06
Jun
-07
Jan
-08
Au
g-0
8
Mar
-09
Oct
-09
May
-10
Dec
-10
Jul-
11
Feb
-12
Sep
-12
Ap
r-1
3
No
v-13
Jun
-14
Jan
-15
Au
g-1
5
Home Ownership Rate 2001-2016
California US Linear (California) Linear (US)
18March 2016 | OC HomeAidSource: Zonda
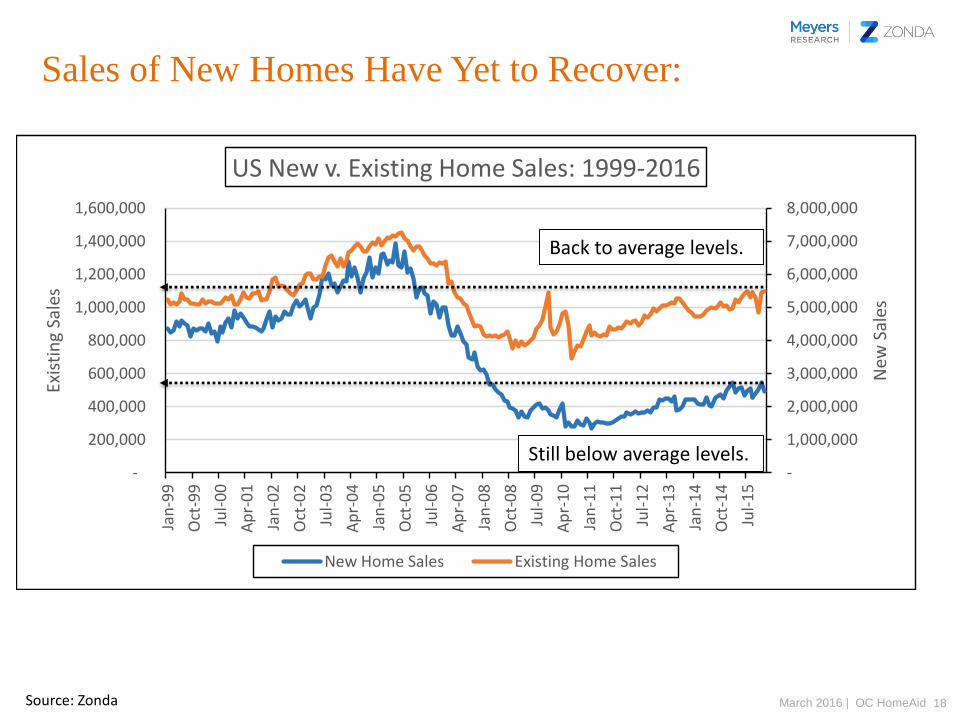
Sales of New Homes Have Yet to Recover:
-
1,000,000
2,000,000
3,000,000
4,000,000
5,000,000
6,000,000
7,000,000
8,000,000
-
200,000
400,000
600,000
800,000
1,000,000
1,200,000
1,400,000
1,600,000
Jan
-99
Oct
-99
Jul-
00
Ap
r-0
1
Jan
-02
Oct
-02
Jul-
03
Ap
r-0
4
Jan
-05
Oct
-05
Jul-
06
Ap
r-0
7
Jan
-08
Oct
-08
Jul-
09
Ap
r-1
0
Jan
-11
Oct
-11
Jul-
12
Ap
r-1
3
Jan
-14
Oct
-14
Jul-
15
New
Sal
es
Exis
tin
g Sa
les
US New v. Existing Home Sales: 1999-2016
New Home Sales Existing Home Sales
Back to average levels.
Still below average levels.
19March 2016 | OC HomeAidSource: Census, NAR, NAHB
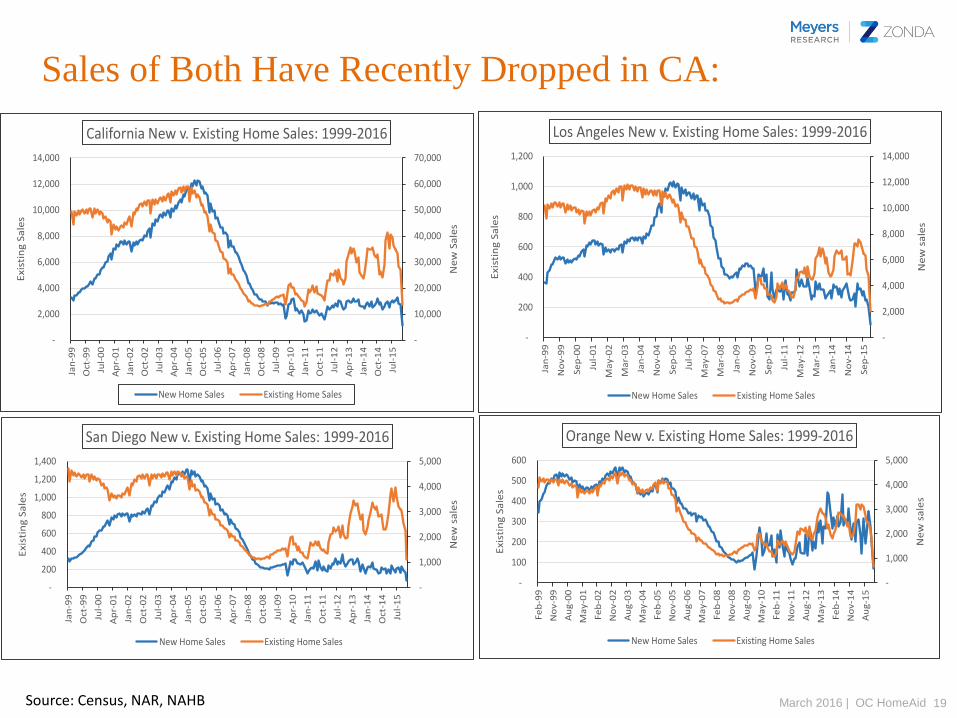
Sales of Both Have Recently Dropped in CA:
-
10,000
20,000
30,000
40,000
50,000
60,000
70,000
-
2,000
4,000
6,000
8,000
10,000
12,000
14,000
Jan
-99
Oct
-99
Jul-
00
Ap
r-0
1
Jan
-02
Oct
-02
Jul-
03
Ap
r-0
4
Jan
-05
Oct
-05
Jul-
06
Ap
r-0
7
Jan
-08
Oct
-08
Jul-
09
Ap
r-1
0
Jan
-11
Oct
-11
Jul-
12
Ap
r-1
3
Jan
-14
Oct
-14
Jul-
15
Ne
w S
ale
s
Exi
stin
g S
ale
s
California New v. Existing Home Sales: 1999-2016
New Home Sales Existing Home Sales
-
2,000
4,000
6,000
8,000
10,000
12,000
14,000
-
200
400
600
800
1,000
1,200
Jan
-99
No
v-9
9
Se
p-0
0
Jul-
01
Ma
y-0
2
Ma
r-0
3
Jan
-04
No
v-0
4
Se
p-0
5
Jul-
06
Ma
y-0
7
Ma
r-0
8
Jan
-09
No
v-0
9
Sep
-10
Jul-
11
Ma
y-1
2
Ma
r-1
3
Jan
-14
No
v-1
4
Se
p-1
5
Ne
w s
ale
s
Exi
stin
g S
ale
s
Los Angeles New v. Existing Home Sales: 1999-2016
New Home Sales Existing Home Sales
-
1,000
2,000
3,000
4,000
5,000
-
200
400
600
800
1,000
1,200
1,400
Jan
-99
Oct
-99
Jul-
00
Ap
r-0
1
Jan
-02
Oct
-02
Jul-
03
Ap
r-0
4
Jan
-05
Oct
-05
Jul-
06
Ap
r-0
7
Jan
-08
Oct
-08
Jul-
09
Ap
r-1
0
Jan
-11
Oct
-11
Jul-
12
Ap
r-1
3
Jan
-14
Oct
-14
Jul-
15
Ne
w s
ale
s
Exi
stin
g S
ale
s
San Diego New v. Existing Home Sales: 1999-2016
New Home Sales Existing Home Sales
-
1,000
2,000
3,000
4,000
5,000
-
100
200
300
400
500
600
Fe
b-9
9
No
v-9
9
Au
g-0
0
Ma
y-0
1
Fe
b-0
2
No
v-0
2
Au
g-0
3
Ma
y-0
4
Fe
b-0
5
No
v-0
5
Au
g-0
6
Ma
y-0
7
Fe
b-0
8
No
v-0
8
Au
g-0
9
Ma
y-1
0
Fe
b-1
1
No
v-1
1
Au
g-1
2
Ma
y-1
3
Fe
b-1
4
No
v-1
4
Au
g-1
5
Ne
w s
ale
s
Exi
stin
g S
ale
s
Orange New v. Existing Home Sales: 1999-2016
New Home Sales Existing Home Sales
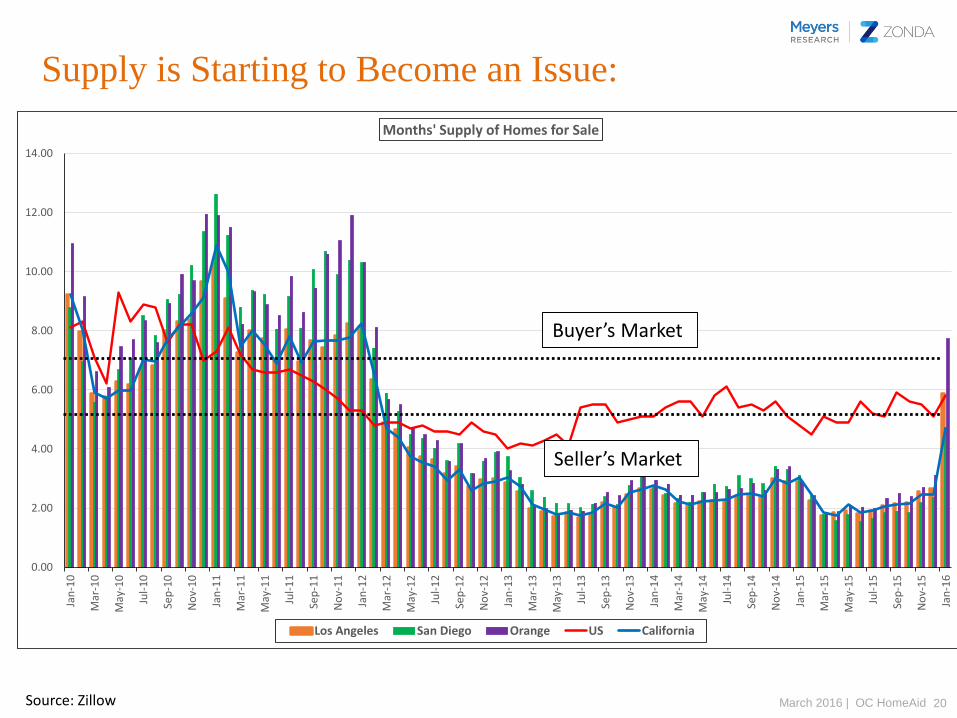
20March 2016 | OC HomeAidSource: Zillow
Supply is Starting to Become an Issue:
0.00
2.00
4.00
6.00
8.00
10.00
12.00
14.00
Jan
-10
Mar
-10
May
-10
Jul-
10
Sep
-10
No
v-10
Jan
-11
Mar
-11
May
-11
Jul-
11
Sep
-11
No
v-11
Jan
-12
Mar
-12
May
-12
Jul-
12
Sep
-12
No
v-12
Jan
-13
Mar
-13
May
-13
Jul-
13
Sep
-13
No
v-13
Jan
-14
Mar
-14
May
-14
Jul-
14
Sep
-14
No
v-14
Jan
-15
Mar
-15
May
-15
Jul-
15
Sep
-15
No
v-15
Jan
-16
Months' Supply of Homes for Sale
Los Angeles San Diego Orange US California
Buyer’s Market
Seller’s Market
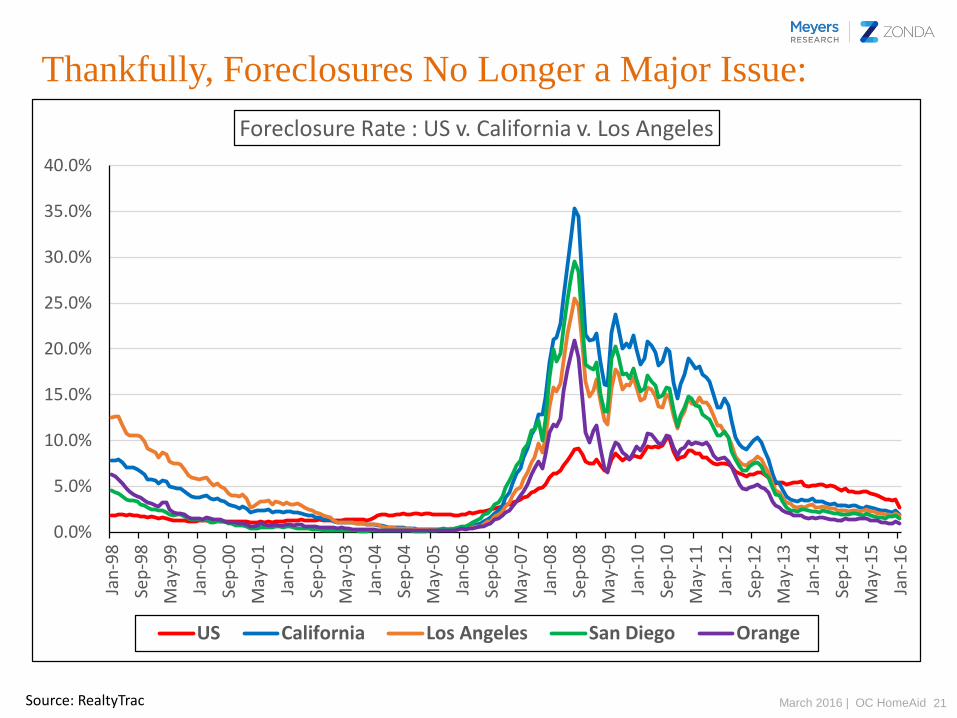
21March 2016 | OC HomeAidSource: RealtyTrac
Thankfully, Foreclosures No Longer a Major Issue:
0.0%
5.0%
10.0%
15.0%
20.0%
25.0%
30.0%
35.0%
40.0%
Jan
-98
Sep
-98
May
-99
Jan
-00
Sep
-00
May
-01
Jan
-02
Sep
-02
May
-03
Jan
-04
Sep
-04
May
-05
Jan
-06
Sep
-06
May
-07
Jan
-08
Sep
-08
May
-09
Jan
-10
Sep
-10
May
-11
Jan
-12
Sep
-12
May
-13
Jan
-14
Sep
-14
May
-15
Jan
-16
Foreclosure Rate : US v. California v. Los Angeles
US California Los Angeles San Diego Orange
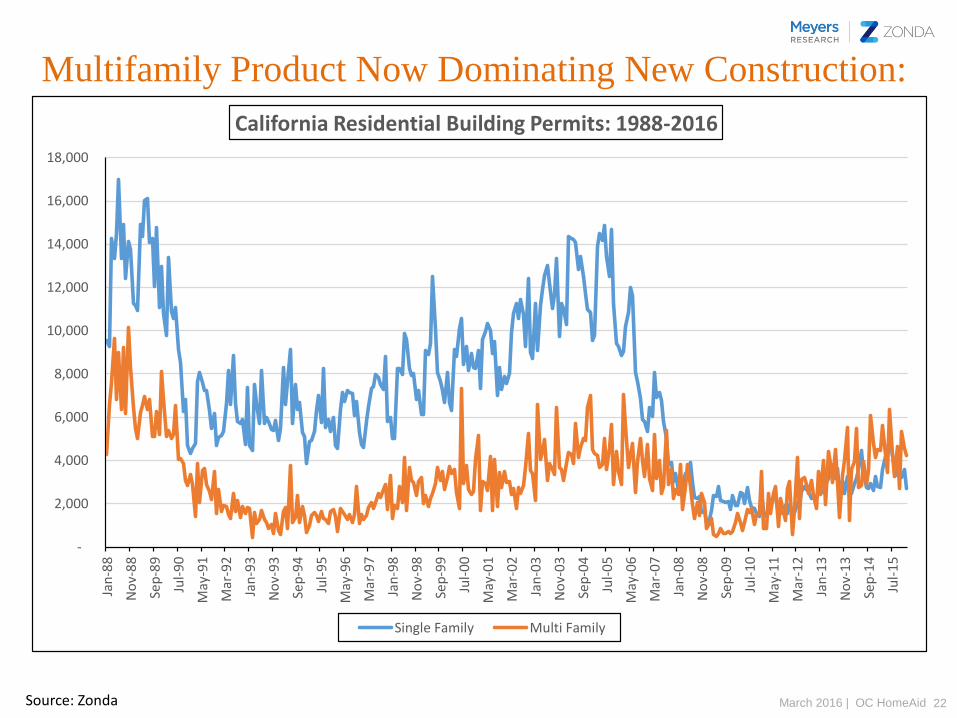
22March 2016 | OC HomeAidSource: Zonda
Multifamily Product Now Dominating New Construction:
-
2,000
4,000
6,000
8,000
10,000
12,000
14,000
16,000
18,000
Jan
-88
No
v-8
8
Sep
-89
Jul-
90
May
-91
Mar
-92
Jan
-93
No
v-9
3
Sep
-94
Jul-
95
May
-96
Mar
-97
Jan
-98
No
v-9
8
Sep
-99
Jul-
00
May
-01
Mar
-02
Jan
-03
No
v-0
3
Sep
-04
Jul-
05
May
-06
Mar
-07
Jan
-08
No
v-0
8
Sep
-09
Jul-
10
May
-11
Mar
-12
Jan
-13
No
v-1
3
Sep
-14
Jul-
15
California Residential Building Permits: 1988-2016
Single Family Multi Family
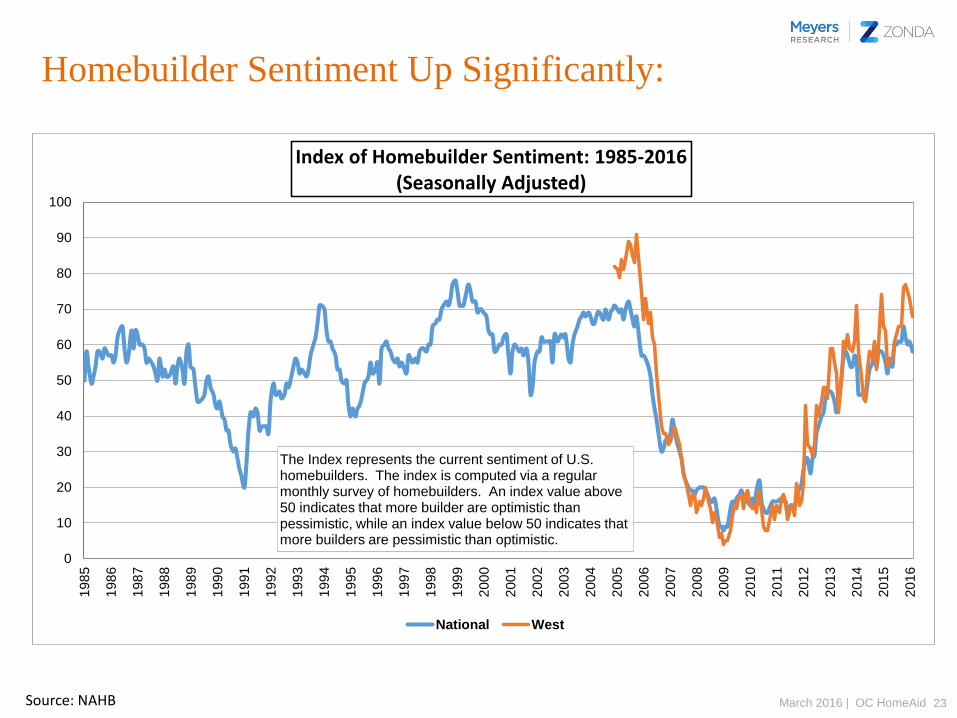
23March 2016 | OC HomeAidSource: NAHB
Homebuilder Sentiment Up Significantly:
0
10
20
30
40
50
60
70
80
90
100
198
5
198
6
198
7
198
8
198
9
199
0
199
1
199
2
199
3
199
4
199
5
199
6
199
7
199
8
199
9
200
0
200
1
200
2
200
3
200
4
200
5
200
6
200
7
200
8
200
9
201
0
201
1
201
2
201
3
201
4
201
5
201
6
Index of Homebuilder Sentiment: 1985-2016(Seasonally Adjusted)
National West
The Index represents the current sentiment of U.S.homebuilders. The index is computed via a regular monthly survey of homebuilders. An index value above 50 indicates that more builder are optimistic than pessimistic, while an index value below 50 indicates that more builders are pessimistic than optimistic.

WHERE DO WE GO FROM HERE?
25March 2016 | OC HomeAid
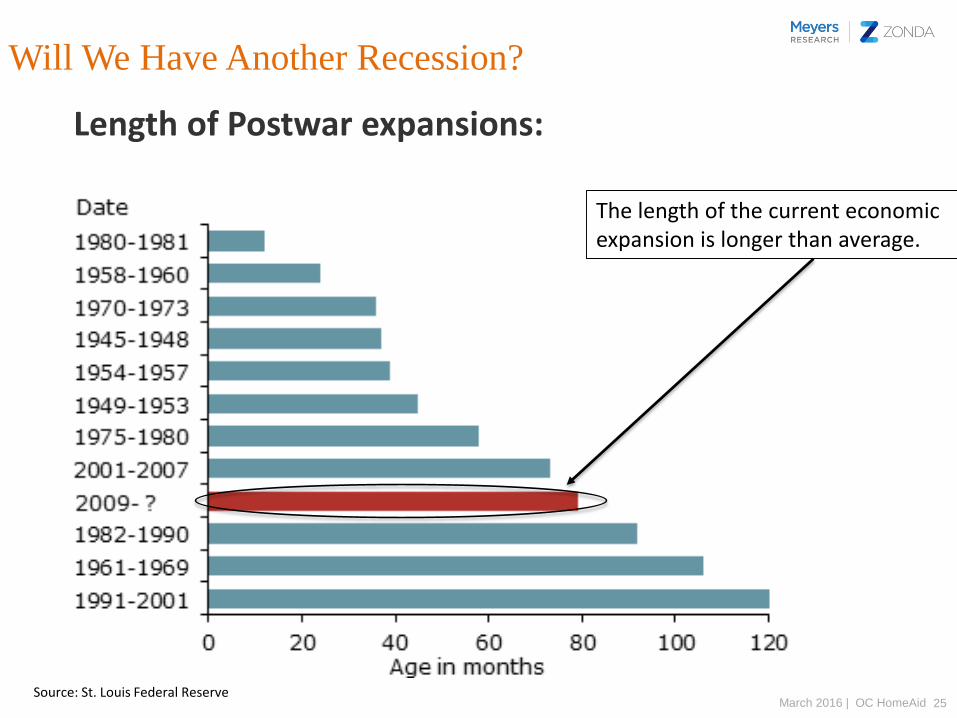
Will We Have Another Recession?
Source: St. Louis Federal Reserve
Length of Postwar expansions:
The length of the current economic expansion is longer than average.
26March 2016 | OC HomeAid
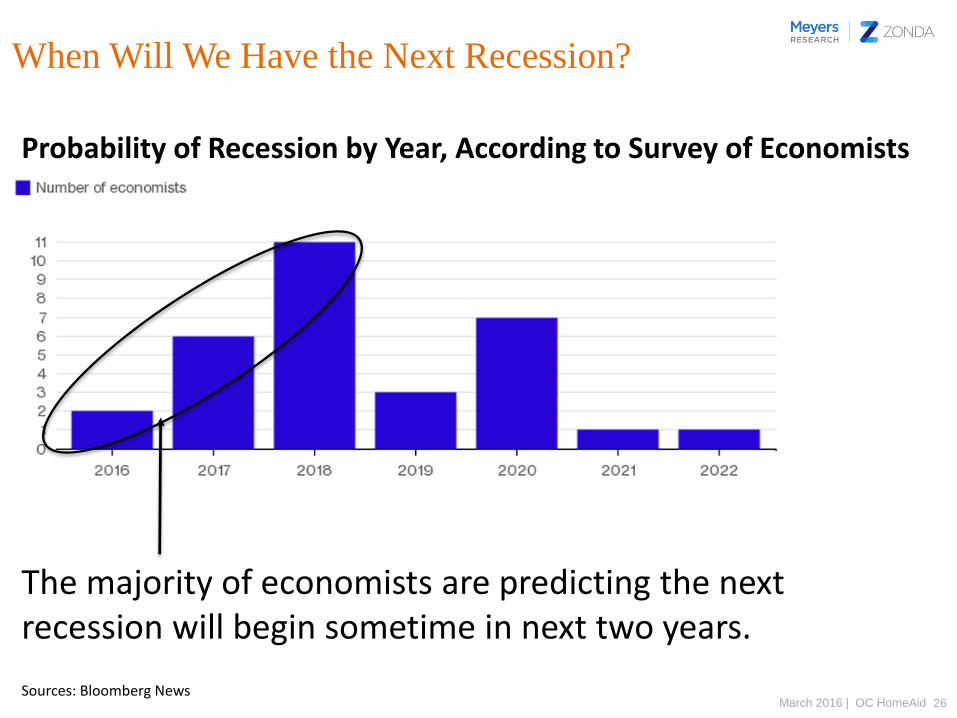
When Will We Have the Next Recession?
The majority of economists are predicting the next recession will begin sometime in next two years.
Probability of Recession by Year, According to Survey of Economists
Sources: Bloomberg News
27March 2016 | OC HomeAidSource: Zonda
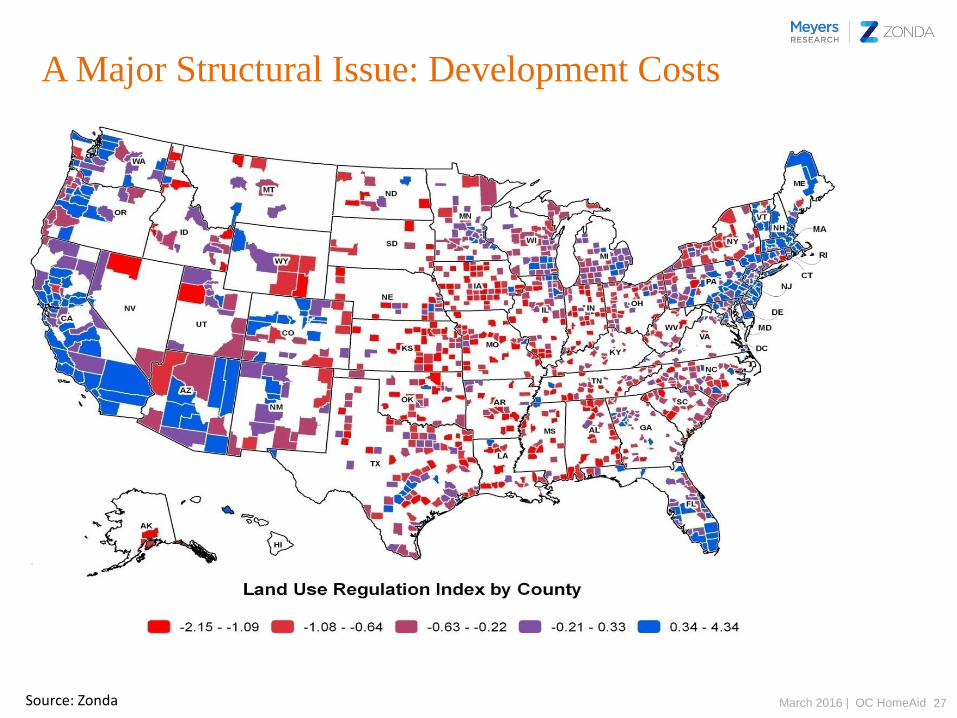
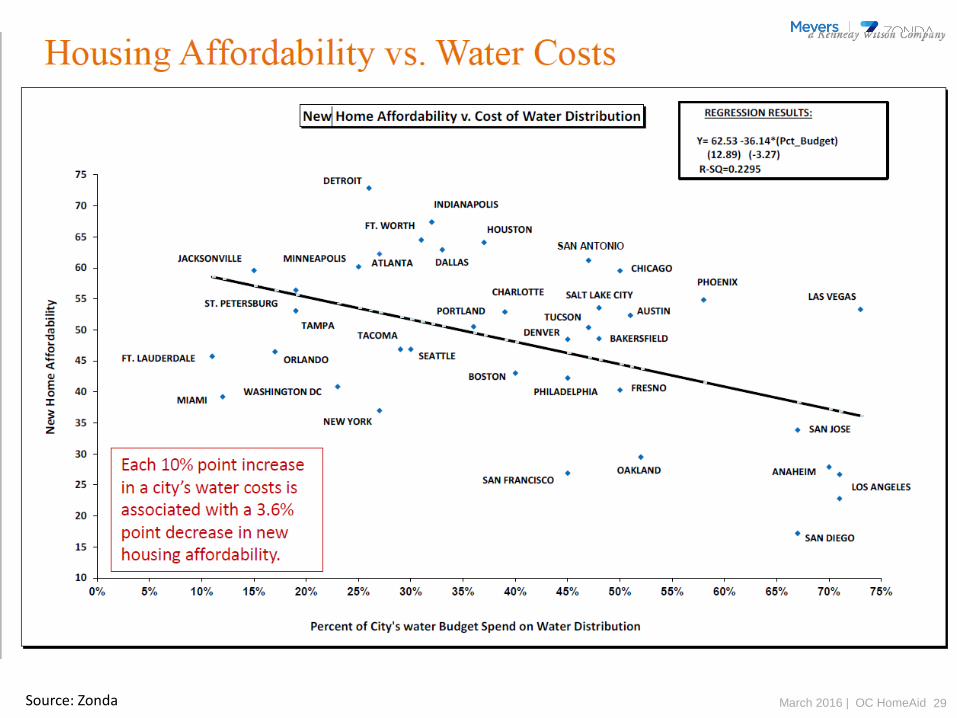
A Major Structural Issue: Development Costs
28March 2016 | OC HomeAidSource: Zonda
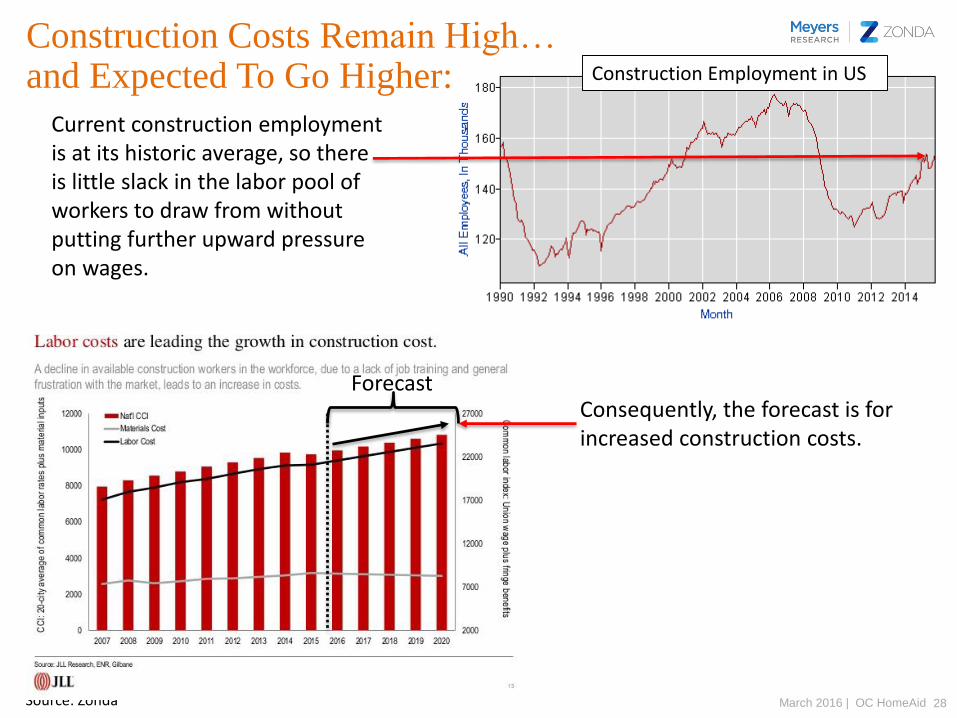
Construction Costs Remain High…and Expected To Go Higher:
Source: US BLS
Construction Employment in US
Current construction employment is at its historic average, so there is little slack in the labor pool of workers to draw from without putting further upward pressure on wages.
ForecastConsequently, the forecast is for increased construction costs.
29March 2016 | OC HomeAidSource: Zonda
A Major Structural Issue: Development Costs
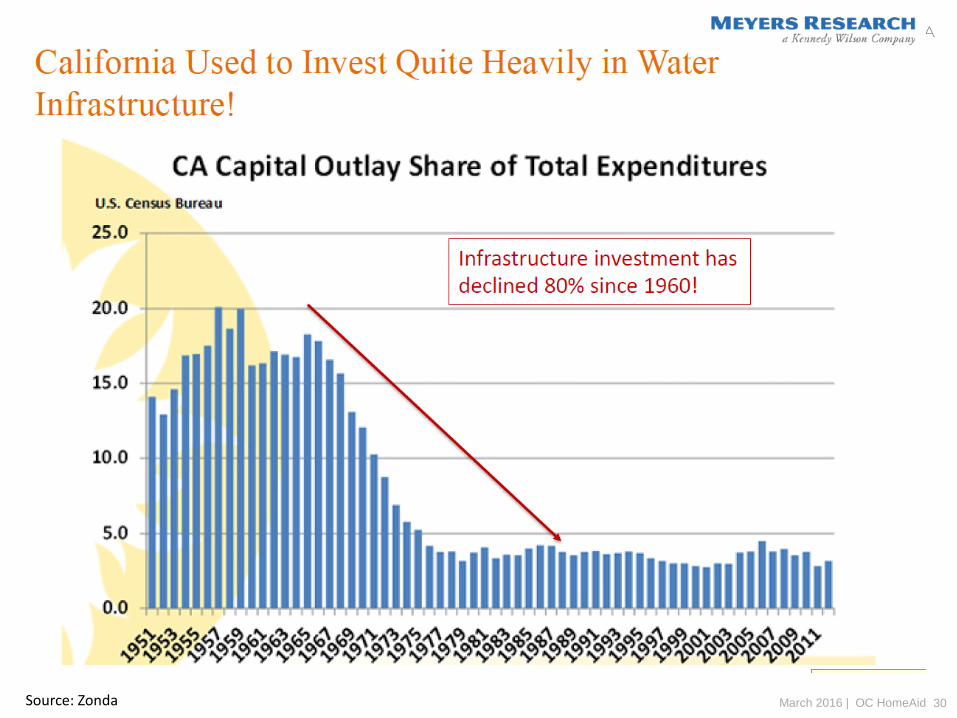
30March 2016 | OC HomeAidSource: Zonda
A Major Structural Issue: Development Costs
31March 2016 | OC HomeAidSource: Zonda
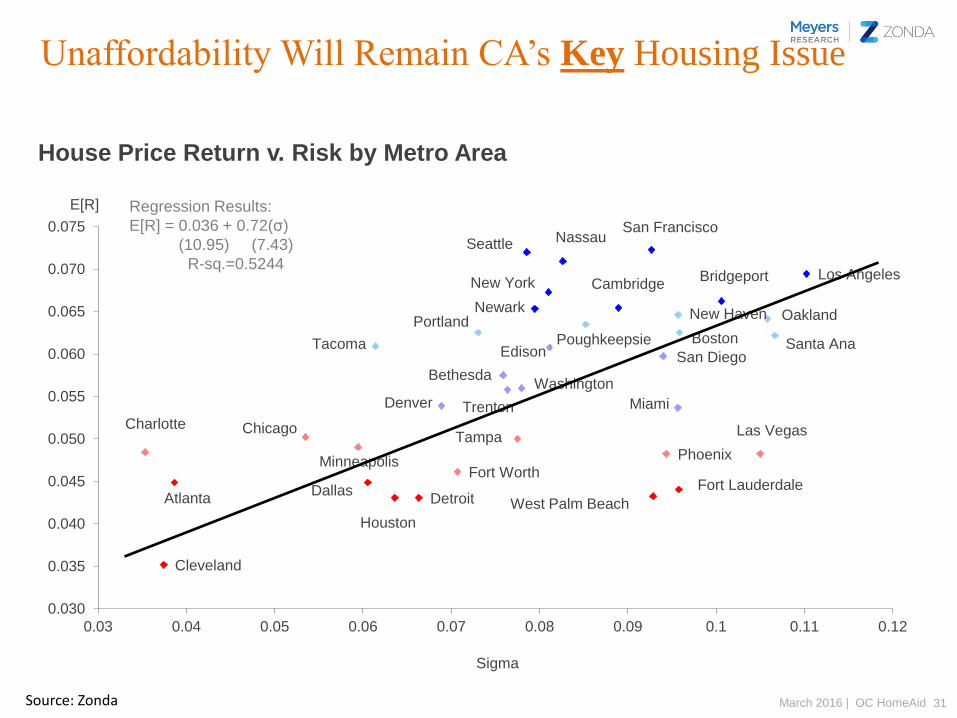
Unaffordability Will Remain CA’s Key Housing Issue
Cleveland
Denver Trenton
WashingtonBethesda
San DiegoEdisonTacoma Santa Ana
PortlandBostonPoughkeepsie
OaklandNew Haven
CambridgeBridgeportNew York
Los Angeles
NassauSeattleSan Francisco
Houston
Detroit West Palm Beach
Fort LauderdaleAtlanta
Dallas
Fort Worth
Phoenix
Las VegasCharlotte
Minneapolis
TampaChicago
Miami
Newark
0.030
0.035
0.040
0.045
0.050
0.055
0.060
0.065
0.070
0.075
0.03 0.04 0.05 0.06 0.07 0.08 0.09 0.1 0.11 0.12
E[R]
Sigma
House Price Return v. Risk by Metro Area
Regression Results:
E[R] = 0.036 + 0.72(σ)
(10.95) (7.43)
R-sq.=0.5244
32March 2016 | OC HomeAidSource: Zonda
Unaffordability: Why You Should Care
• Short-Term: Leads to higher municipal service costs, and
eventually higher property taxes.
-Municipal workers (police, fire, sanitation, school
teachers) can’t afford to live in the municipality that
employs them.
• Long-Term: Leads to a contracting spiral of decline
-As the municipality becomes less affordable, home sales
drop, followed by population and employment declines, tax
base contracts, quality of public services erodes…leading
to further population and employment losses…and further
tax base contraction.
-Very difficult to reverse this spiral (ask Detroit).
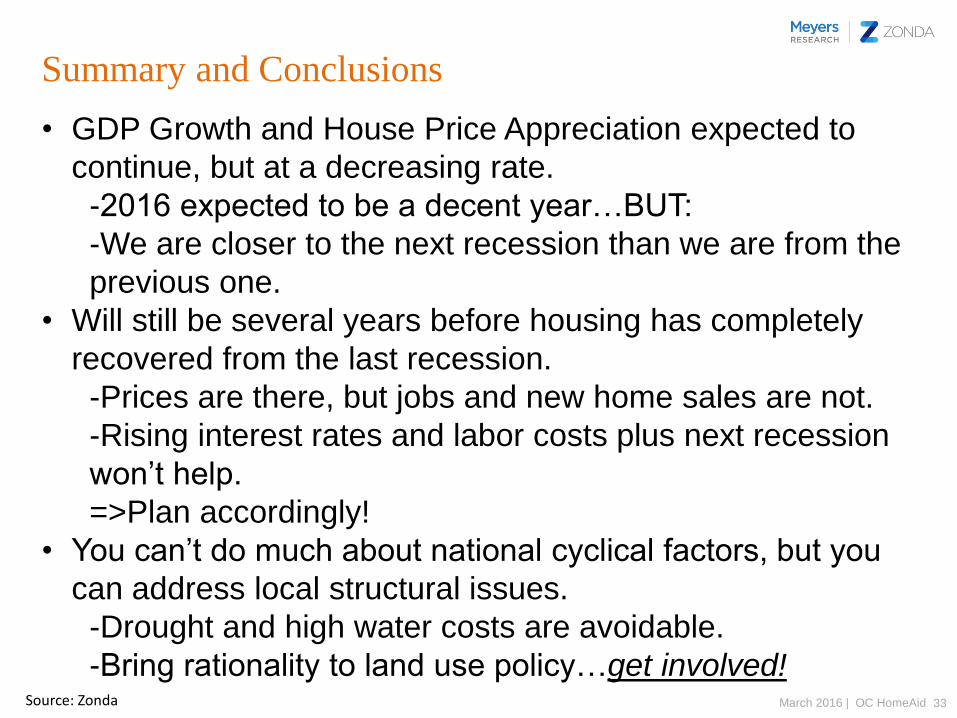
33March 2016 | OC HomeAidSource: Zonda
Summary and Conclusions
• GDP Growth and House Price Appreciation expected to
continue, but at a decreasing rate.
-2016 expected to be a decent year…BUT:
-We are closer to the next recession than we are from the
previous one.
• Will still be several years before housing has completely
recovered from the last recession.
-Prices are there, but jobs and new home sales are not.
-Rising interest rates and labor costs plus next recession
won’t help.
=>Plan accordingly!
• You can’t do much about national cyclical factors, but you
can address local structural issues.
-Drought and high water costs are avoidable.
-Bring rationality to land use policy…get involved!

34March 2016 | OC HomeAidSource: Zonda
Thank You!
For further information, please contact:
Kevin Gillen, Ph.D.Chief Economist, Meyers Research LLC
215.880.6630