Housing Market and Economic Outlook Lawrence Yun, Ph.D. Chief Economist NATIONAL ASSOCIATION OF REALTORS ® Presentation at OAR Legislative and Economic Summit Oklahoma City, OK February 6, 2013

Welcome message from author
This document is posted to help you gain knowledge. Please leave a comment to let me know what you think about it! Share it to your friends and learn new things together.
Transcript

Housing Market and
Economic OutlookLawrence Yun, Ph.D.Chief Economist
NATIONAL ASSOCIATION OF REALTORS®
Presentation at OAR Legislative and Economic Summit
Oklahoma City, OK
February 6, 2013
Forecast #1: Inflation will be Notably Higher by 2015
• No Threatening Inflation Signs for 2013
• But Inflation rises to 4% to 6% in 2015
• Well above Fed’s preferred rate of 2%
• But not in double‐digits as in 1970s
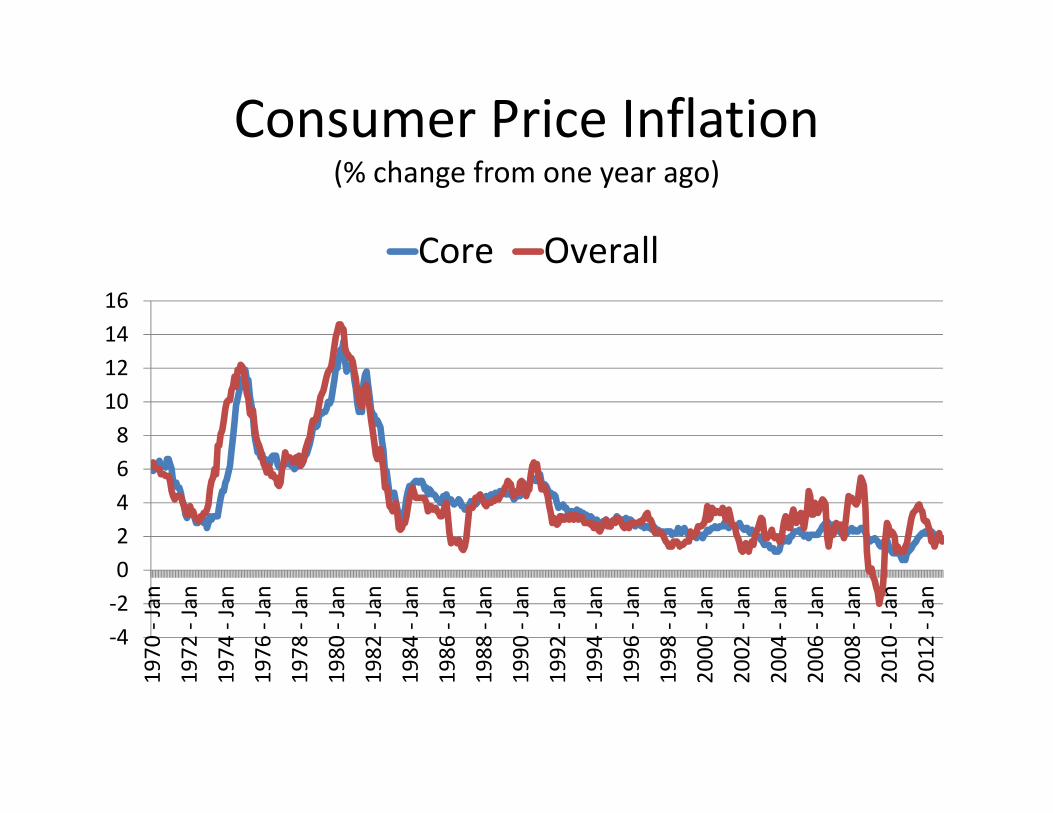
Consumer Price Inflation(% change from one year ago)
‐4‐20246810121416
1970
‐ Jan
1972
‐ Jan
1974
‐ Jan
1976
‐ Jan
1978
‐ Jan
1980
‐ Jan
1982
‐ Jan
1984
‐ Jan
1986
‐ Jan
1988
‐ Jan
1990
‐ Jan
1992
‐ Jan
1994
‐ Jan
1996
‐ Jan
1998
‐ Jan
2000
‐ Jan
2002
‐ Jan
2004
‐ Jan
2006
‐ Jan
2008
‐ Jan
2010
‐ Jan
2012
‐ Jan
Core Overall
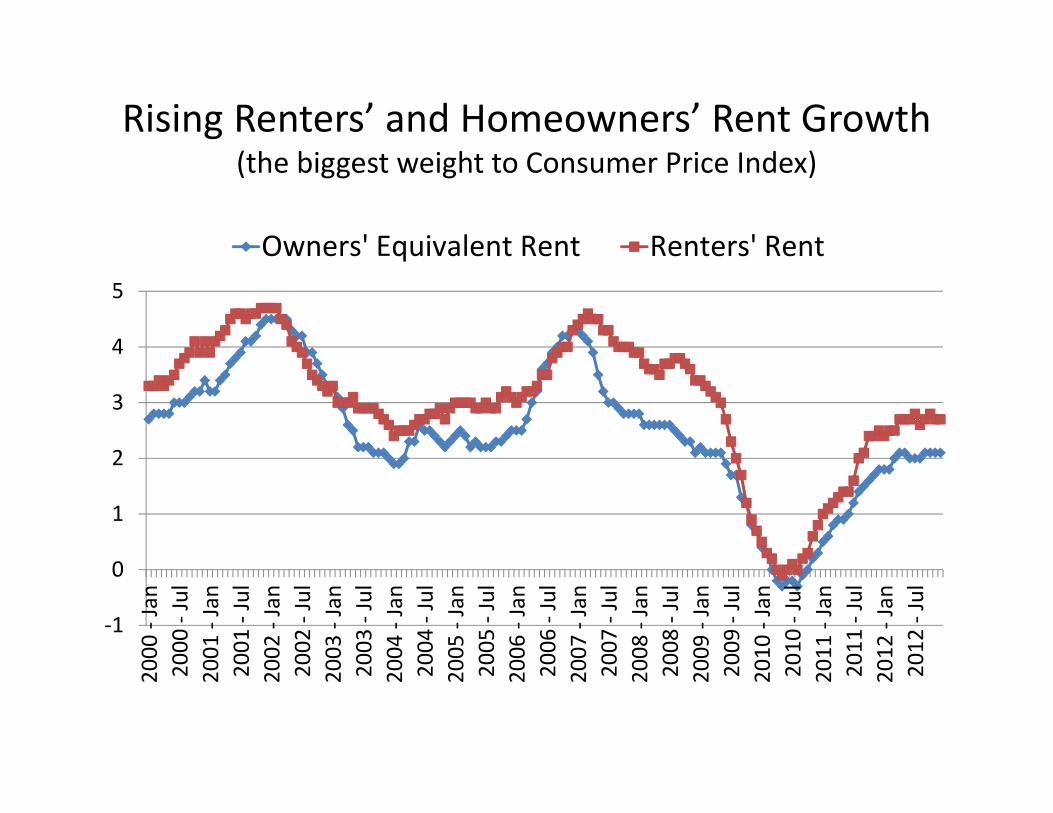
Rising Renters’ and Homeowners’ Rent Growth (the biggest weight to Consumer Price Index)
‐1
0
1
2
3
4
5
2000
‐ Jan
2000
‐ Jul
2001
‐ Jan
2001
‐ Jul
2002
‐ Jan
2002
‐ Jul
2003
‐ Jan
2003
‐ Jul
2004
‐ Jan
2004
‐ Jul
2005
‐ Jan
2005
‐ Jul
2006
‐ Jan
2006
‐ Jul
2007
‐ Jan
2007
‐ Jul
2008
‐ Jan
2008
‐ Jul
2009
‐ Jan
2009
‐ Jul
2010
‐ Jan
2010
‐ Jul
2011
‐ Jan
2011
‐ Jul
2012
‐ Jan
2012
‐ Jul
Owners' Equivalent Rent Renters' Rent
0%
10%
20%
30%
40%
50%
60%
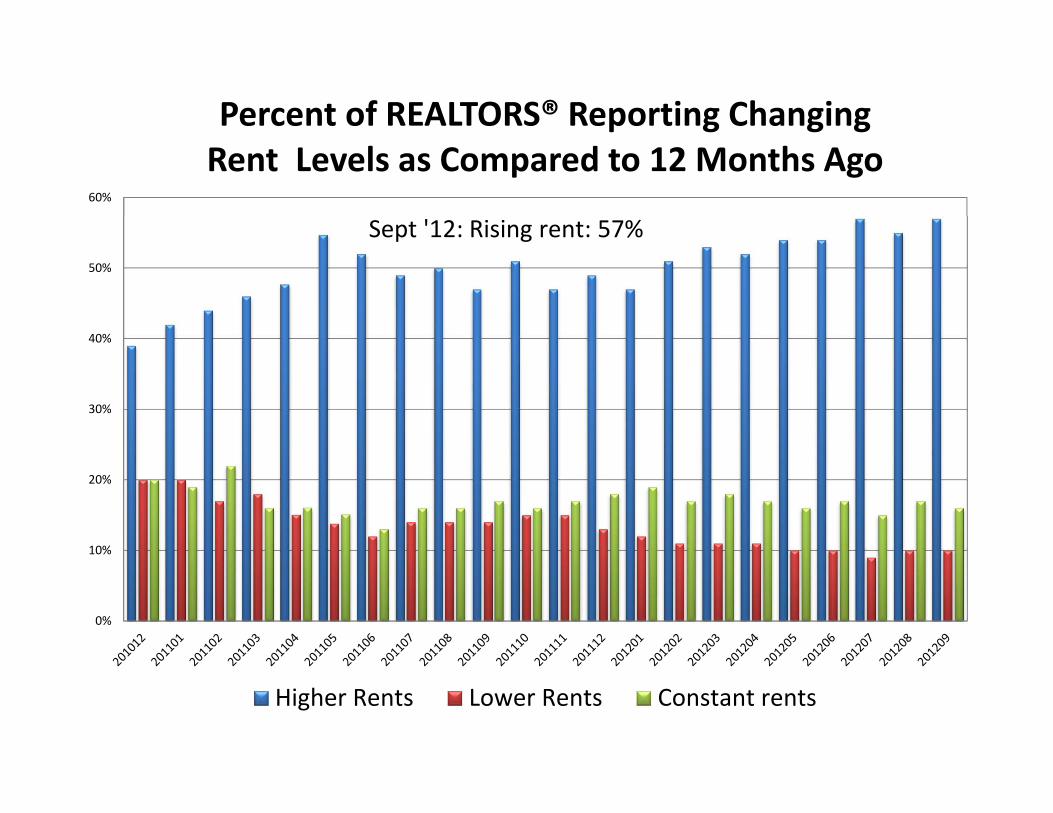
Percent of REALTORS® Reporting Changing Rent Levels as Compared to 12 Months Ago
Higher Rents Lower Rents Constant rents
Sept '12: Rising rent: 57%
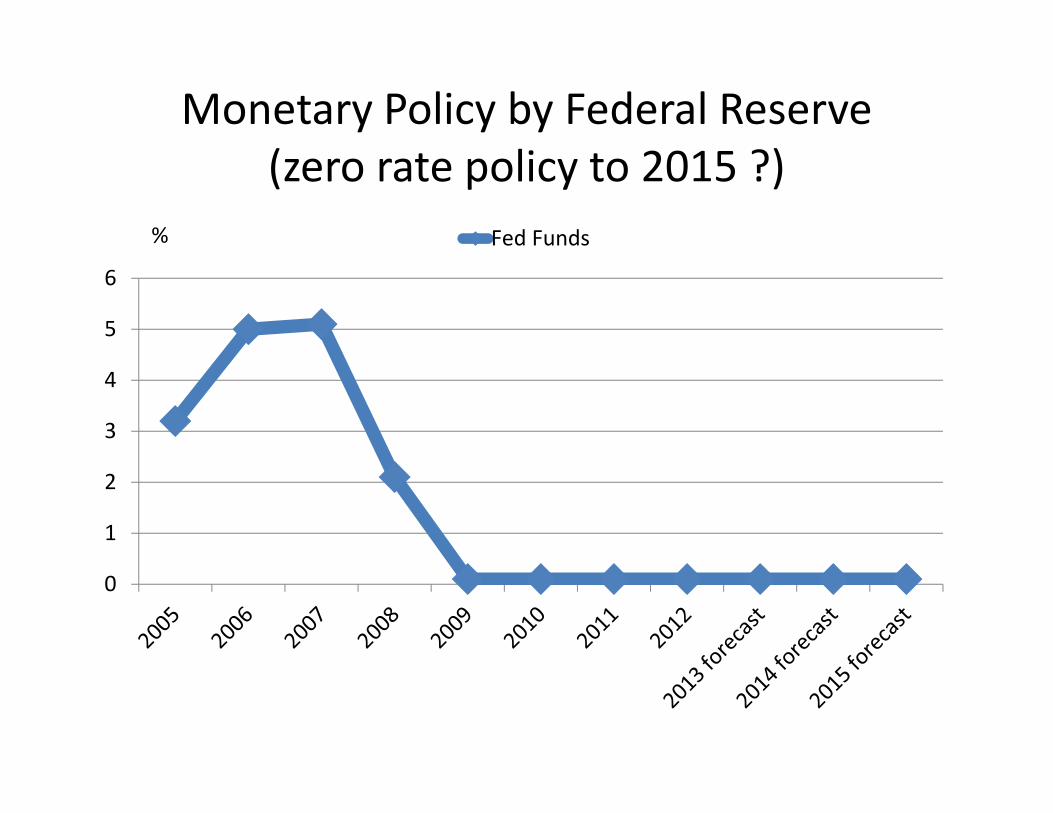
Monetary Policy by Federal Reserve (zero rate policy to 2015 ?)
0
1
2
3
4
5
6
Fed Funds%
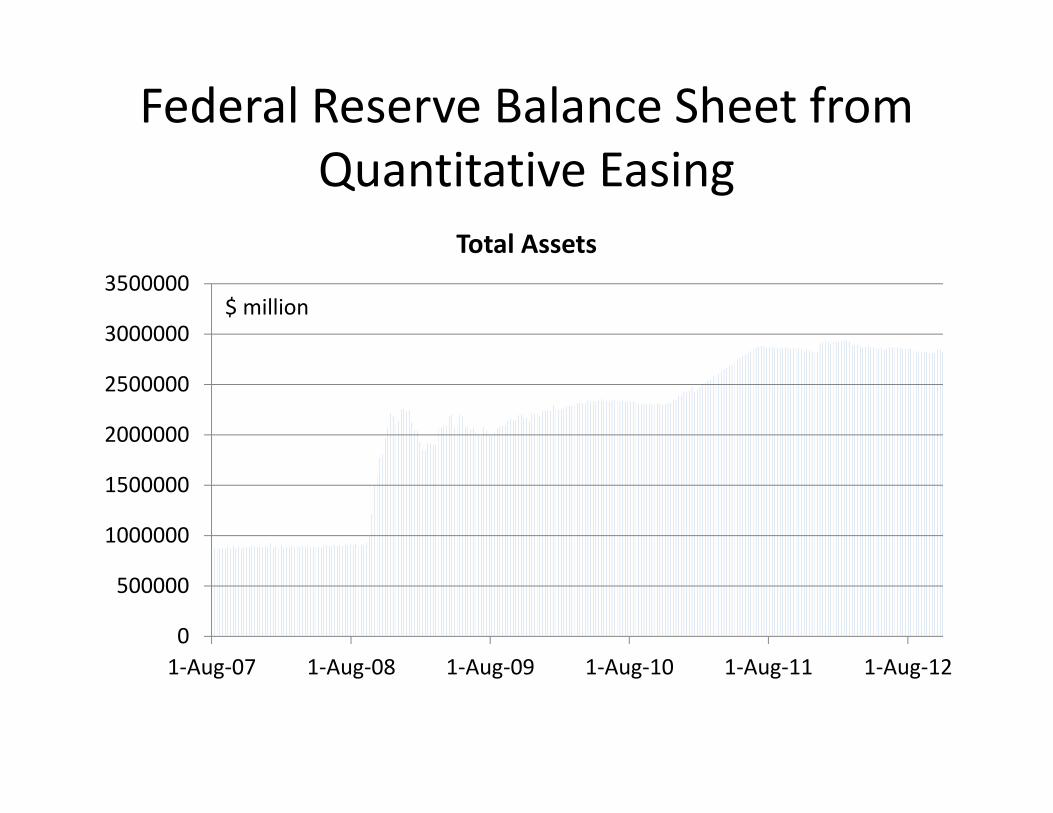
Federal Reserve Balance Sheet from Quantitative Easing
0
500000
1000000
1500000
2000000
2500000
3000000
3500000
1‐Aug‐07 1‐Aug‐08 1‐Aug‐09 1‐Aug‐10 1‐Aug‐11 1‐Aug‐12
Total Assets
$ million

Federal Government Tax Revenue and Spending
05000001000000150000020000002500000300000035000004000000
1970
‐ Jan
1972
‐ Jan
1974
‐ Jan
1976
‐ Jan
1978
‐ Jan
1980
‐ Jan
1982
‐ Jan
1984
‐ Jan
1986
‐ Jan
1988
‐ Jan
1990
‐ Jan
1992
‐ Jan
1994
‐ Jan
1996
‐ Jan
1998
‐ Jan
2000
‐ Jan
2002
‐ Jan
2004
‐ Jan
2006
‐ Jan
2008
‐ Jan
2010
‐ Jan
2012
‐ Jan
Revenue Spending
12‐month tally in $ million
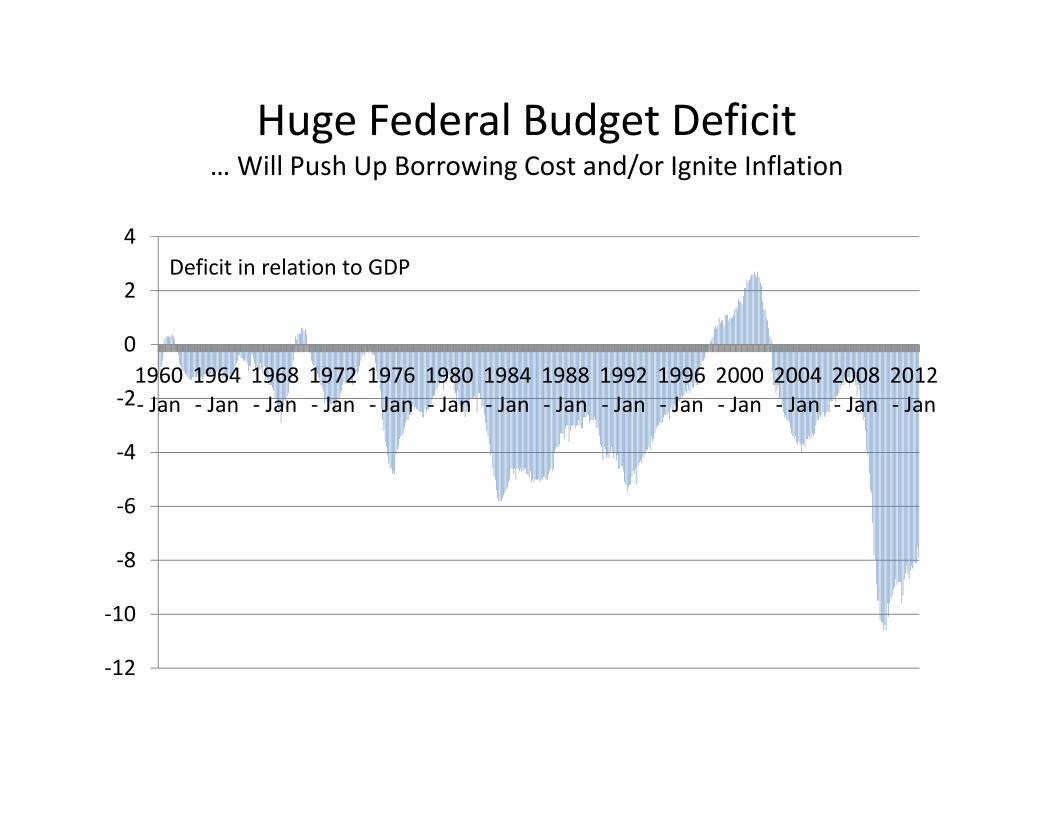
Huge Federal Budget Deficit … Will Push Up Borrowing Cost and/or Ignite Inflation
‐12
‐10
‐8
‐6
‐4
‐2
0
2
4
1960‐ Jan
1964‐ Jan
1968‐ Jan
1972‐ Jan
1976‐ Jan
1980‐ Jan
1984‐ Jan
1988‐ Jan
1992‐ Jan
1996‐ Jan
2000‐ Jan
2004‐ Jan
2008‐ Jan
2012‐ Jan
Deficit in relation to GDP
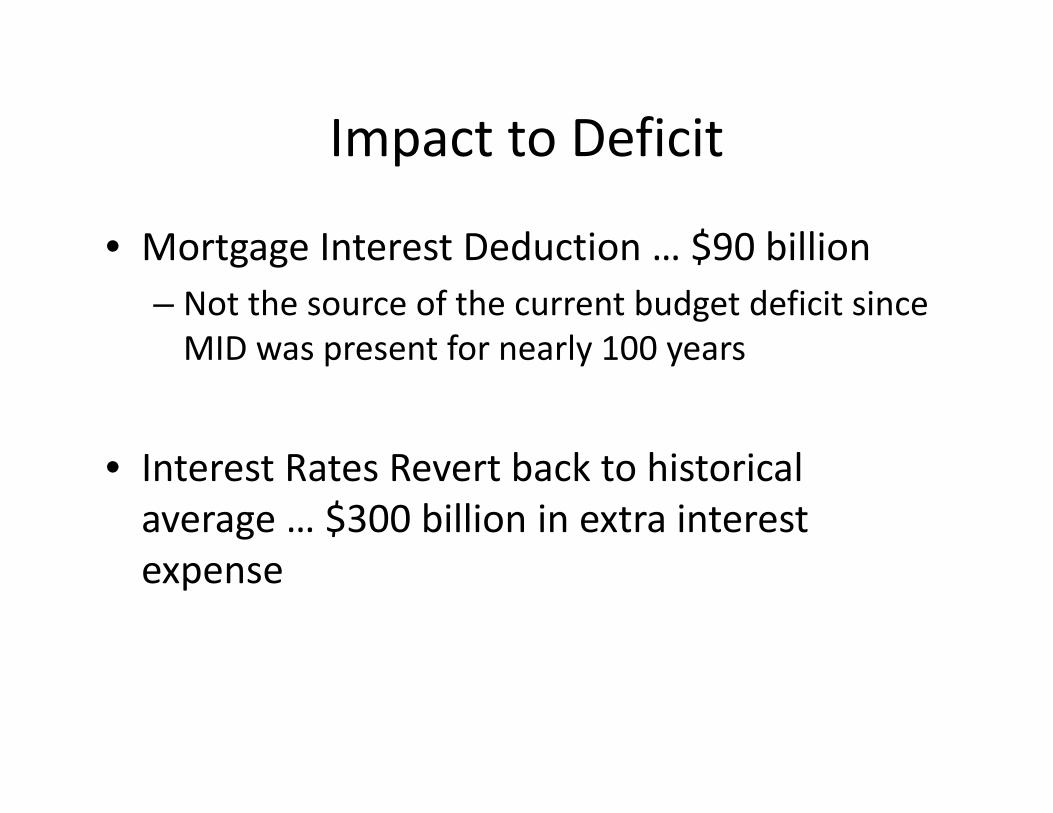
Impact to Deficit
• Mortgage Interest Deduction … $90 billion– Not the source of the current budget deficit since MID was present for nearly 100 years
• Interest Rates Revert back to historical average … $300 billion in extra interest expense
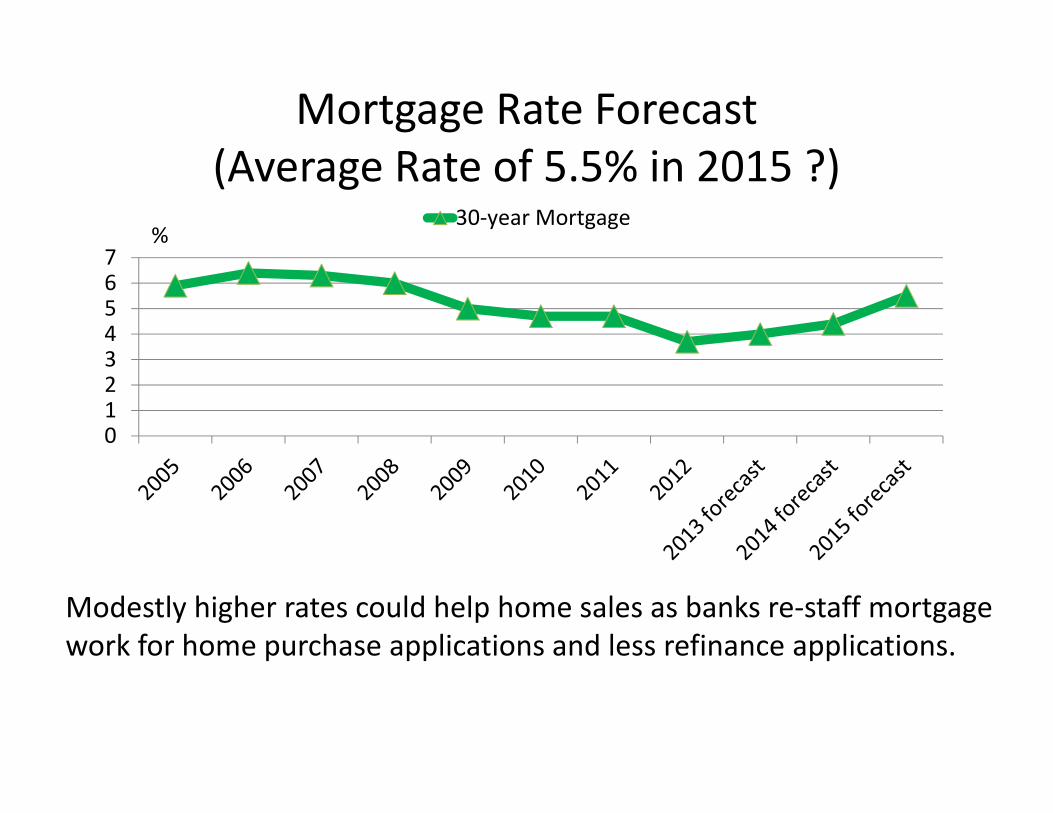
Mortgage Rate Forecast(Average Rate of 5.5% in 2015 ?)
01234567
30‐year Mortgage%
Modestly higher rates could help home sales as banks re‐staff mortgage work for home purchase applications and less refinance applications.
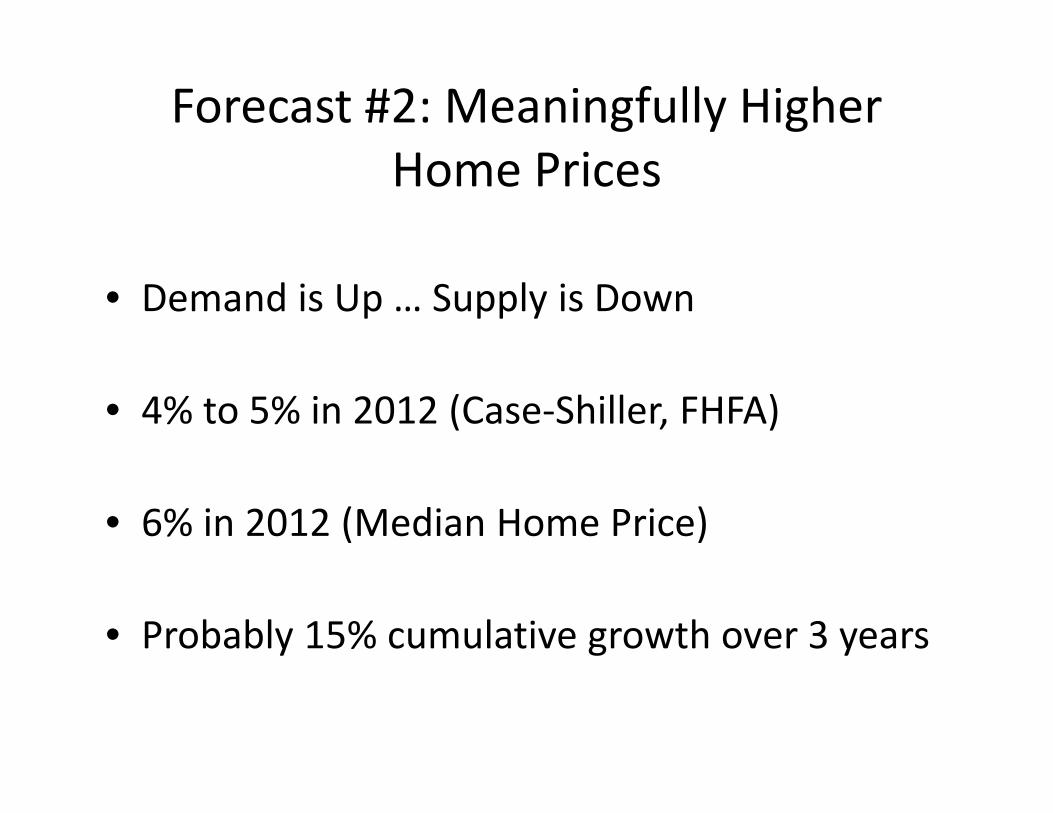
Forecast #2: Meaningfully Higher Home Prices
• Demand is Up … Supply is Down
• 4% to 5% in 2012 (Case‐Shiller, FHFA)
• 6% in 2012 (Median Home Price)
• Probably 15% cumulative growth over 3 years
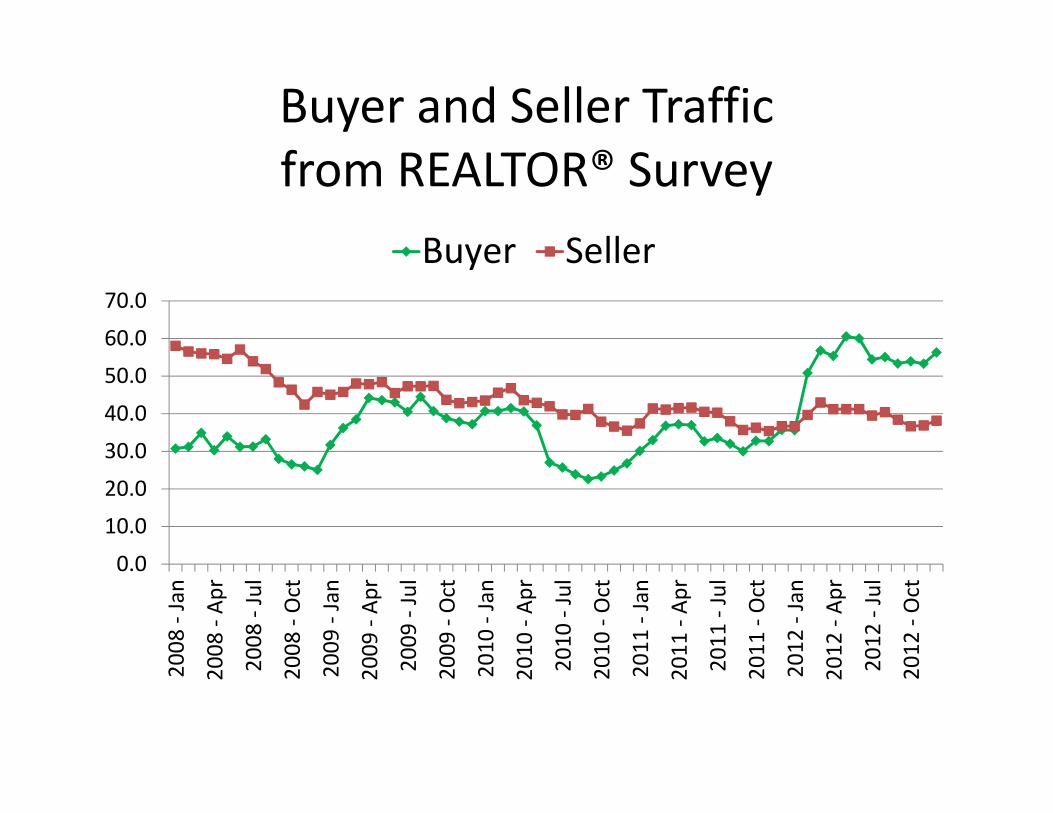
Buyer and Seller Traffic from REALTOR® Survey
0.0
10.0
20.0
30.0
40.0
50.0
60.0
70.0
2008
‐ Jan
2008
‐ Ap
r
2008
‐ Jul
2008
‐ Oct
2009
‐ Jan
2009
‐ Ap
r
2009
‐ Jul
2009
‐ Oct
2010
‐ Jan
2010
‐ Ap
r
2010
‐ Jul
2010
‐ Oct
2011
‐ Jan
2011
‐ Ap
r
2011
‐ Jul
2011
‐ Oct
2012
‐ Jan
2012
‐ Ap
r
2012
‐ Jul
2012
‐ Oct
Buyer Seller
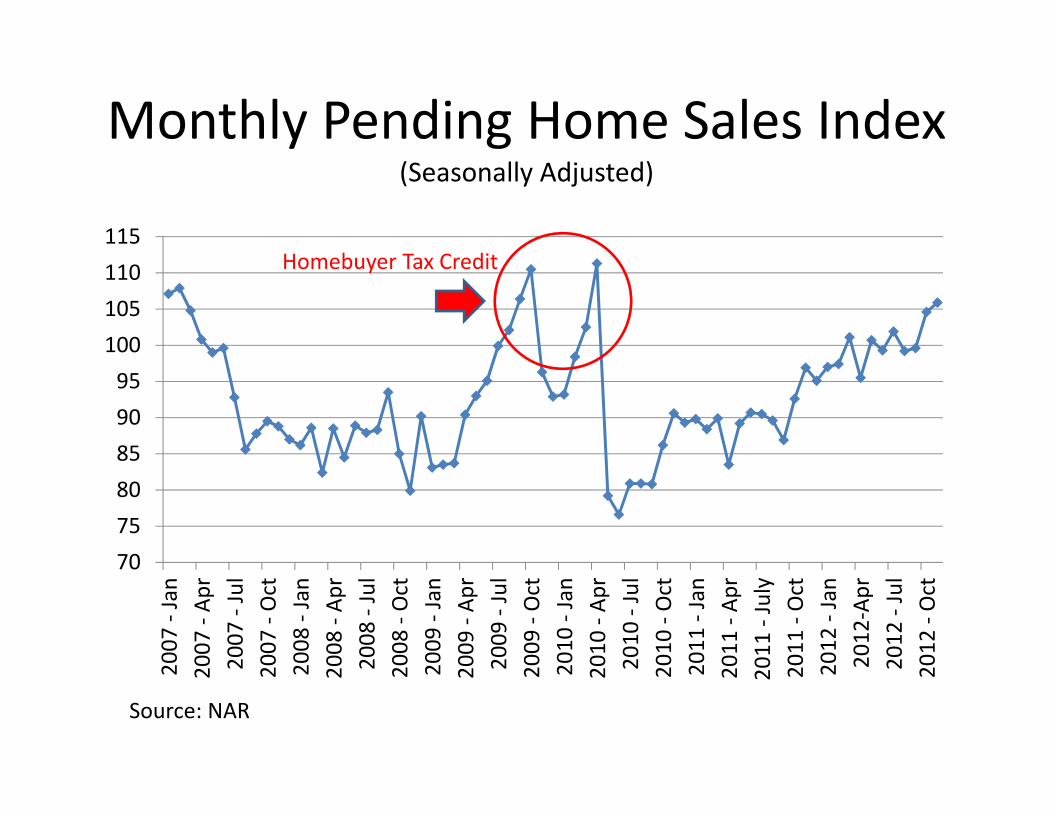
Monthly Pending Home Sales Index(Seasonally Adjusted)
707580859095100105110115
2007
‐ Jan
2007
‐ Ap
r2007
‐ Jul
2007
‐ Oct
2008
‐ Jan
2008
‐ Ap
r2008
‐ Jul
2008
‐ Oct
2009
‐ Jan
2009
‐ Ap
r2009
‐ Jul
2009
‐ Oct
2010
‐ Jan
2010
‐ Ap
r2010
‐ Jul
2010
‐ Oct
2011
‐ Jan
2011
‐ Ap
r2011
‐ July
2011
‐ Oct
2012
‐ Jan
2012
‐Apr
2012
‐ Jul
2012
‐ Oct
Homebuyer Tax Credit
Source: NAR
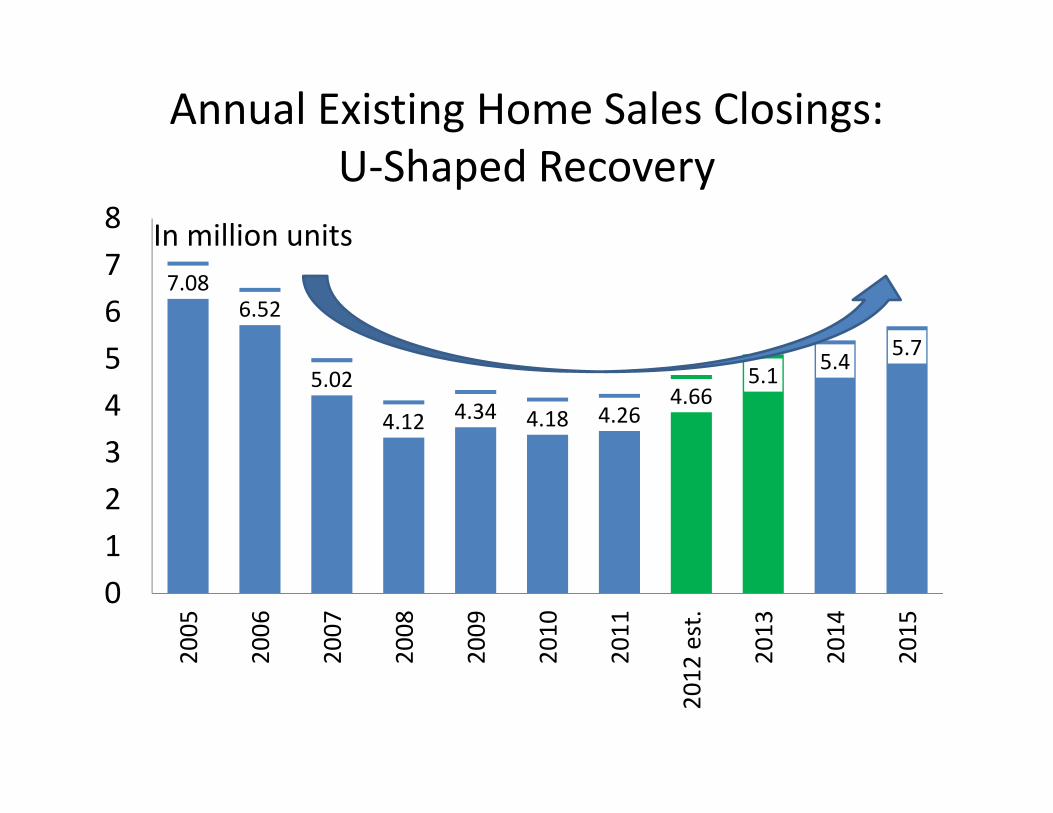
Annual Existing Home Sales Closings:U‐Shaped Recovery
7.086.52
5.02
4.12 4.34 4.18 4.264.66
5.1 5.4 5.7
012345678
2005
2006
2007
2008
2009
2010
2011
2012
est.
2013
2014
2015
In million units
Oklahoma Housing Statistics• Sales up about 10% in 2012 Q3
– July up 14%– August up 17%– September down 4%
• Median Prices up 5% from one year ago
• Dollar Volume … up about 15%
• Inventories down 15% from 1 year ago
Please check with local MLS for precise information
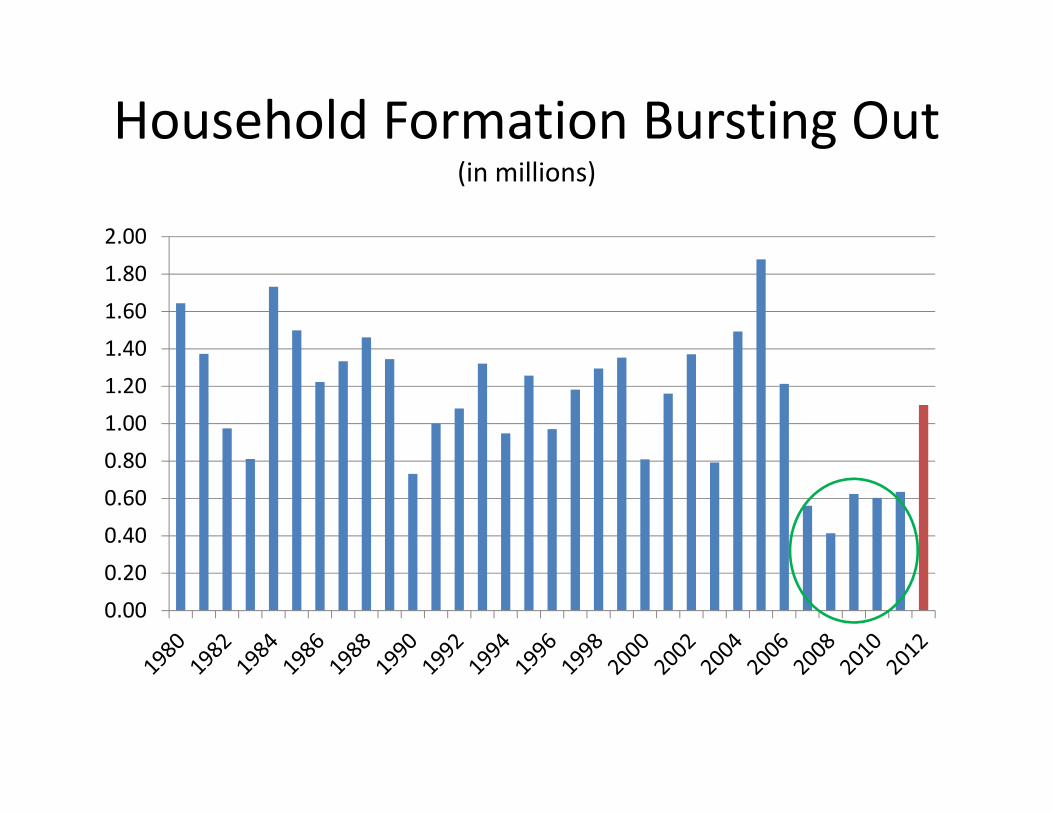
Household Formation Bursting Out(in millions)
0.00
0.200.40
0.600.80
1.001.20
1.401.60
1.802.00
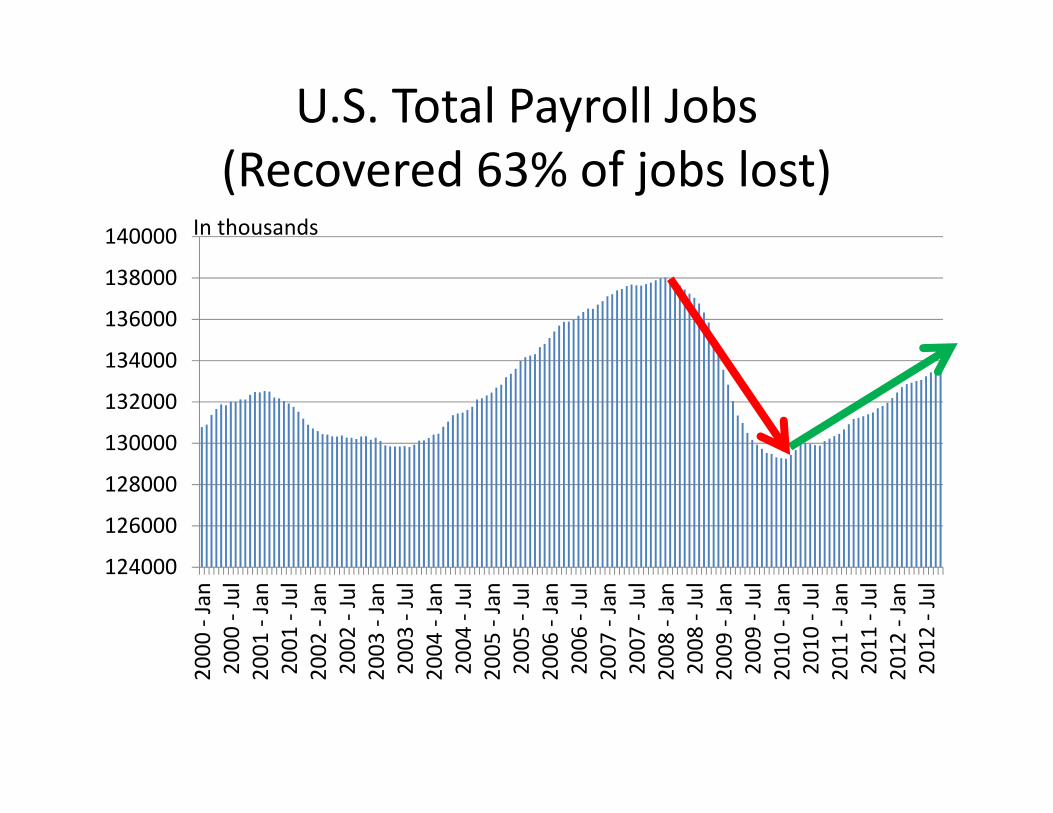
U.S. Total Payroll Jobs(Recovered 63% of jobs lost)
124000
126000
128000
130000
132000
134000
136000
138000
1400002000
‐ Jan
2000
‐ Jul
2001
‐ Jan
2001
‐ Jul
2002
‐ Jan
2002
‐ Jul
2003
‐ Jan
2003
‐ Jul
2004
‐ Jan
2004
‐ Jul
2005
‐ Jan
2005
‐ Jul
2006
‐ Jan
2006
‐ Jul
2007
‐ Jan
2007
‐ Jul
2008
‐ Jan
2008
‐ Jul
2009
‐ Jan
2009
‐ Jul
2010
‐ Jan
2010
‐ Jul
2011
‐ Jan
2011
‐ Jul
2012
‐ Jan
2012
‐ Jul
In thousands
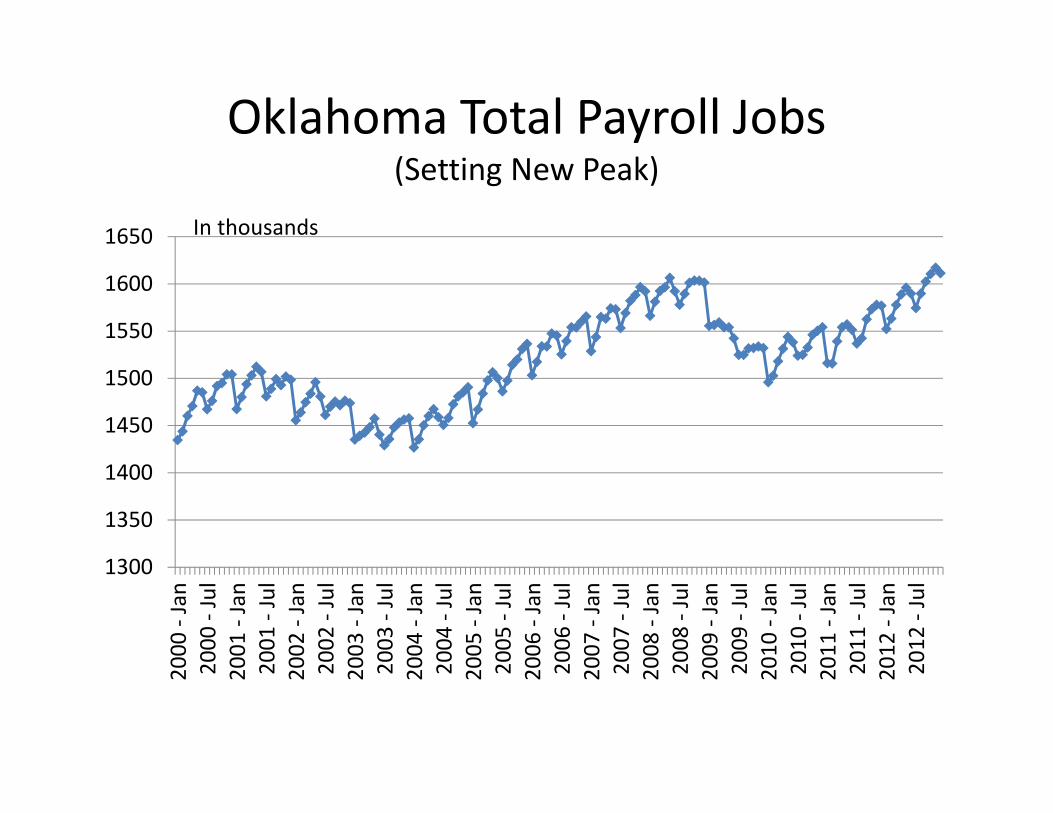
Oklahoma Total Payroll Jobs(Setting New Peak)
1300
1350
1400
1450
1500
1550
1600
1650
2000
‐ Jan
2000
‐ Jul
2001
‐ Jan
2001
‐ Jul
2002
‐ Jan
2002
‐ Jul
2003
‐ Jan
2003
‐ Jul
2004
‐ Jan
2004
‐ Jul
2005
‐ Jan
2005
‐ Jul
2006
‐ Jan
2006
‐ Jul
2007
‐ Jan
2007
‐ Jul
2008
‐ Jan
2008
‐ Jul
2009
‐ Jan
2009
‐ Jul
2010
‐ Jan
2010
‐ Jul
2011
‐ Jan
2011
‐ Jul
2012
‐ Jan
2012
‐ Jul
In thousands
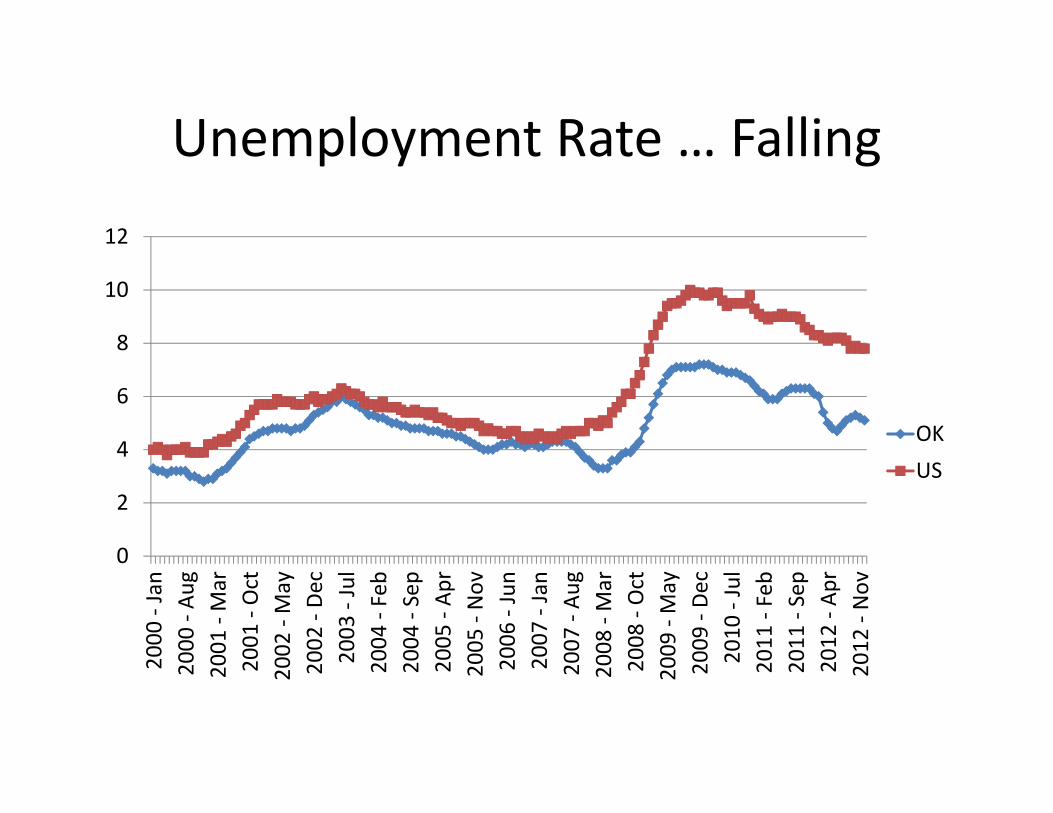
Unemployment Rate … Falling
0
2
4
6
8
10
12
2000
‐ Jan
2000
‐ Au
g2001
‐ Mar
2001
‐ Oct
2002
‐ May
2002
‐ De
c2003
‐ Jul
2004
‐ Feb
2004
‐ Sep
2005
‐ Ap
r2005
‐ Nov
2006
‐ Jun
2007
‐ Jan
2007
‐ Au
g2008
‐ Mar
2008
‐ Oct
2009
‐ May
2009
‐ De
c2010
‐ Jul
2011
‐ Feb
2011
‐ Sep
2012
‐ Ap
r2012
‐ Nov
OKUS
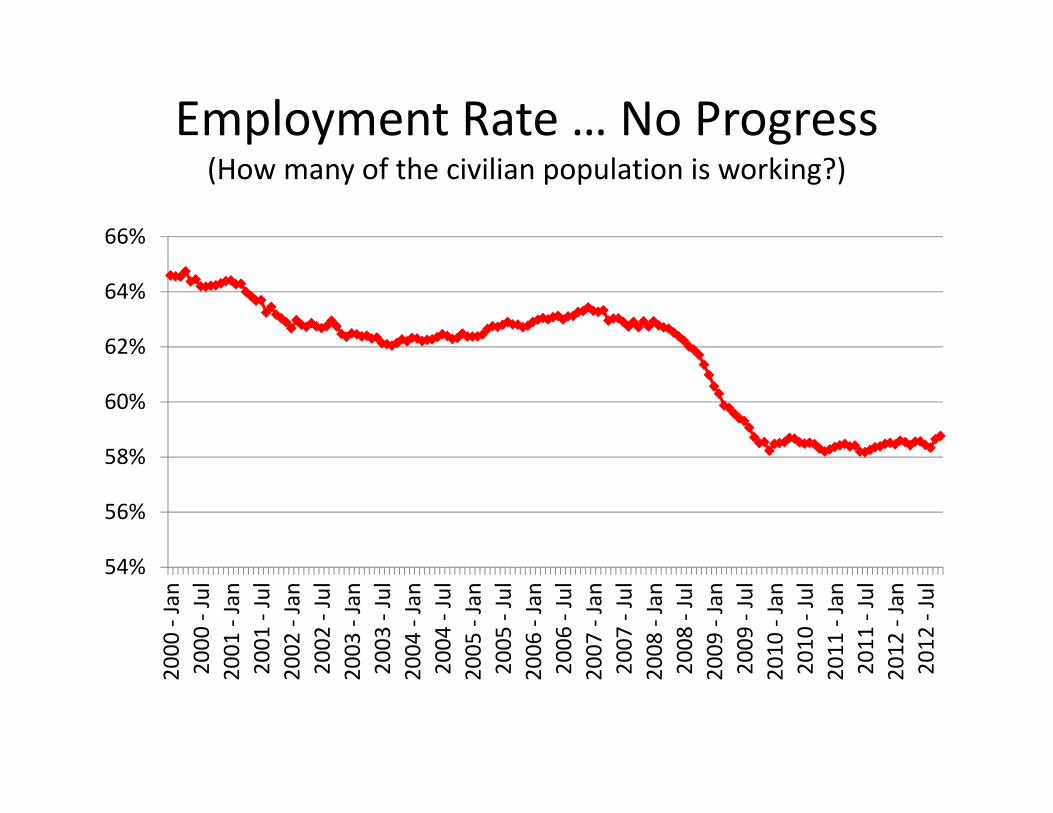
Employment Rate … No Progress(How many of the civilian population is working?)
54%
56%
58%
60%
62%
64%
66%
2000
‐ Jan
2000
‐ Jul
2001
‐ Jan
2001
‐ Jul
2002
‐ Jan
2002
‐ Jul
2003
‐ Jan
2003
‐ Jul
2004
‐ Jan
2004
‐ Jul
2005
‐ Jan
2005
‐ Jul
2006
‐ Jan
2006
‐ Jul
2007
‐ Jan
2007
‐ Jul
2008
‐ Jan
2008
‐ Jul
2009
‐ Jan
2009
‐ Jul
2010
‐ Jan
2010
‐ Jul
2011
‐ Jan
2011
‐ Jul
2012
‐ Jan
2012
‐ Jul
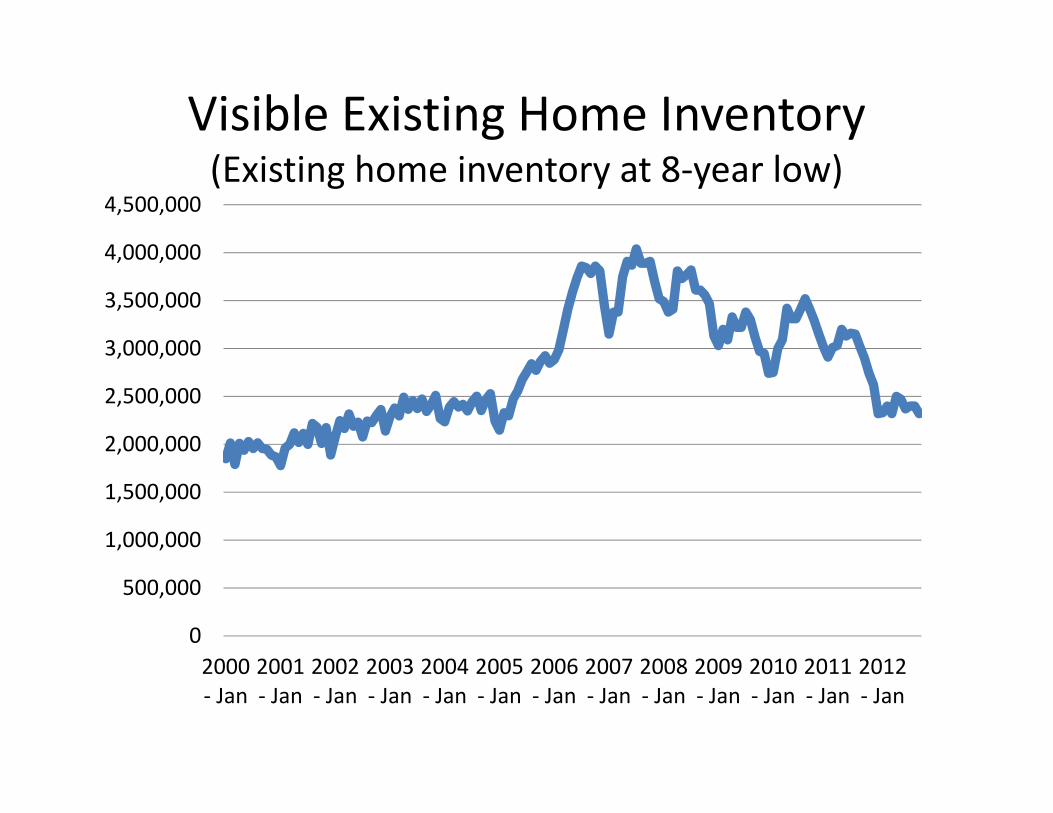
Visible Existing Home Inventory(Existing home inventory at 8‐year low)
0
500,000
1,000,000
1,500,000
2,000,000
2,500,000
3,000,000
3,500,000
4,000,000
4,500,000
2000‐ Jan
2001‐ Jan
2002‐ Jan
2003‐ Jan
2004‐ Jan
2005‐ Jan
2006‐ Jan
2007‐ Jan
2008‐ Jan
2009‐ Jan
2010‐ Jan
2011‐ Jan
2012‐ Jan
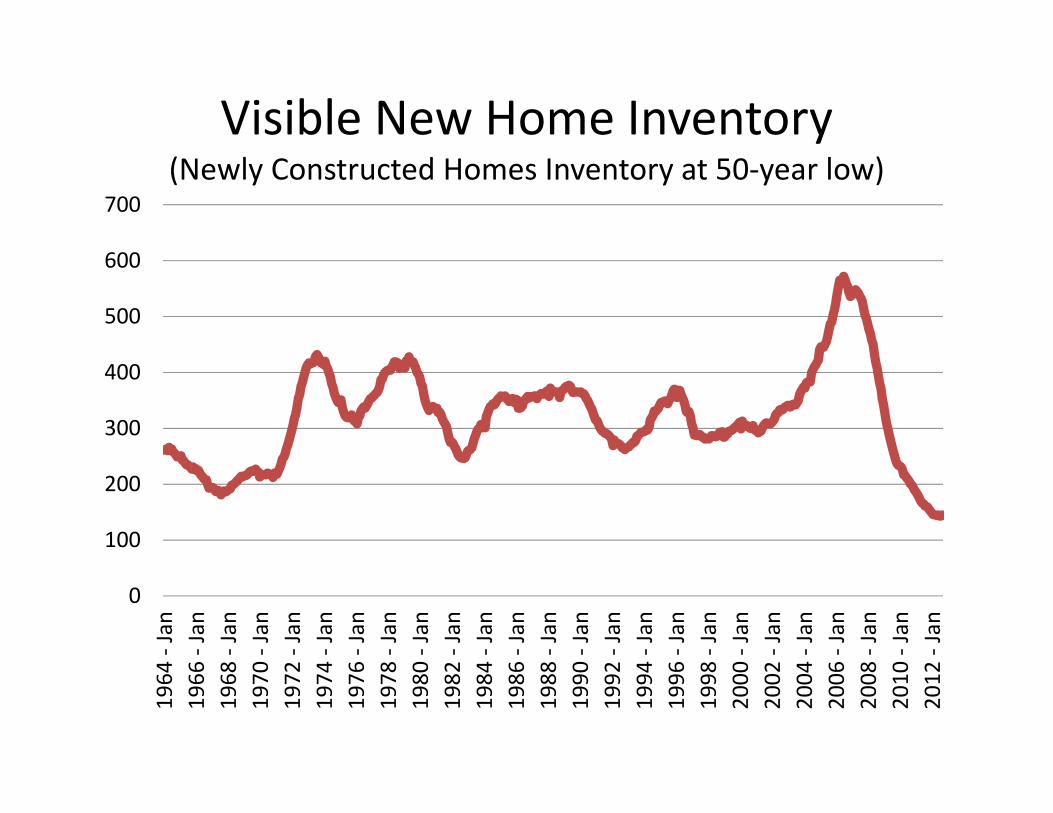
Visible New Home Inventory(Newly Constructed Homes Inventory at 50‐year low)
0
100
200
300
400
500
600
700
1964
‐ Jan
1966
‐ Jan
1968
‐ Jan
1970
‐ Jan
1972
‐ Jan
1974
‐ Jan
1976
‐ Jan
1978
‐ Jan
1980
‐ Jan
1982
‐ Jan
1984
‐ Jan
1986
‐ Jan
1988
‐ Jan
1990
‐ Jan
1992
‐ Jan
1994
‐ Jan
1996
‐ Jan
1998
‐ Jan
2000
‐ Jan
2002
‐ Jan
2004
‐ Jan
2006
‐ Jan
2008
‐ Jan
2010
‐ Jan
2012
‐ Jan
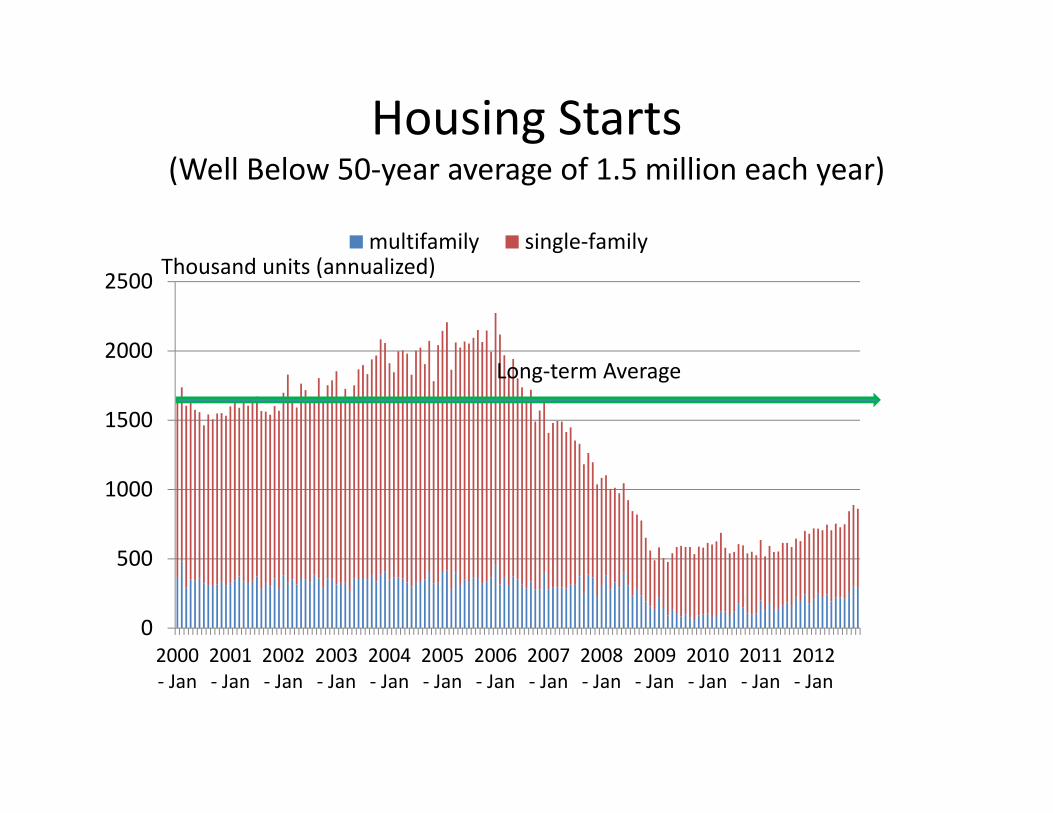
Housing Starts(Well Below 50‐year average of 1.5 million each year)
0
500
1000
1500
2000
2500
2000‐ Jan
2001‐ Jan
2002‐ Jan
2003‐ Jan
2004‐ Jan
2005‐ Jan
2006‐ Jan
2007‐ Jan
2008‐ Jan
2009‐ Jan
2010‐ Jan
2011‐ Jan
2012‐ Jan
multifamily single‐familyThousand units (annualized)
Long‐term Average
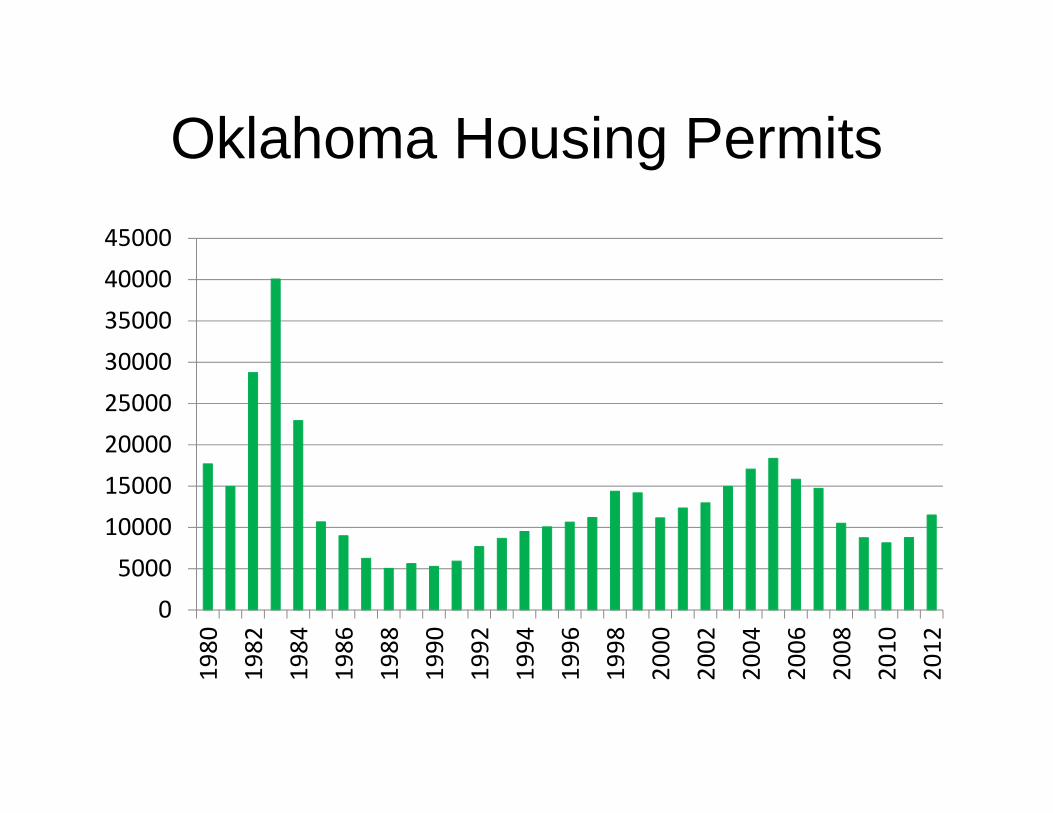
Oklahoma Housing Permits
05000
1000015000200002500030000350004000045000
1980
1982
1984
1986
1988
1990
1992
1994
1996
1998
2000
2002
2004
2006
2008
2010
2012
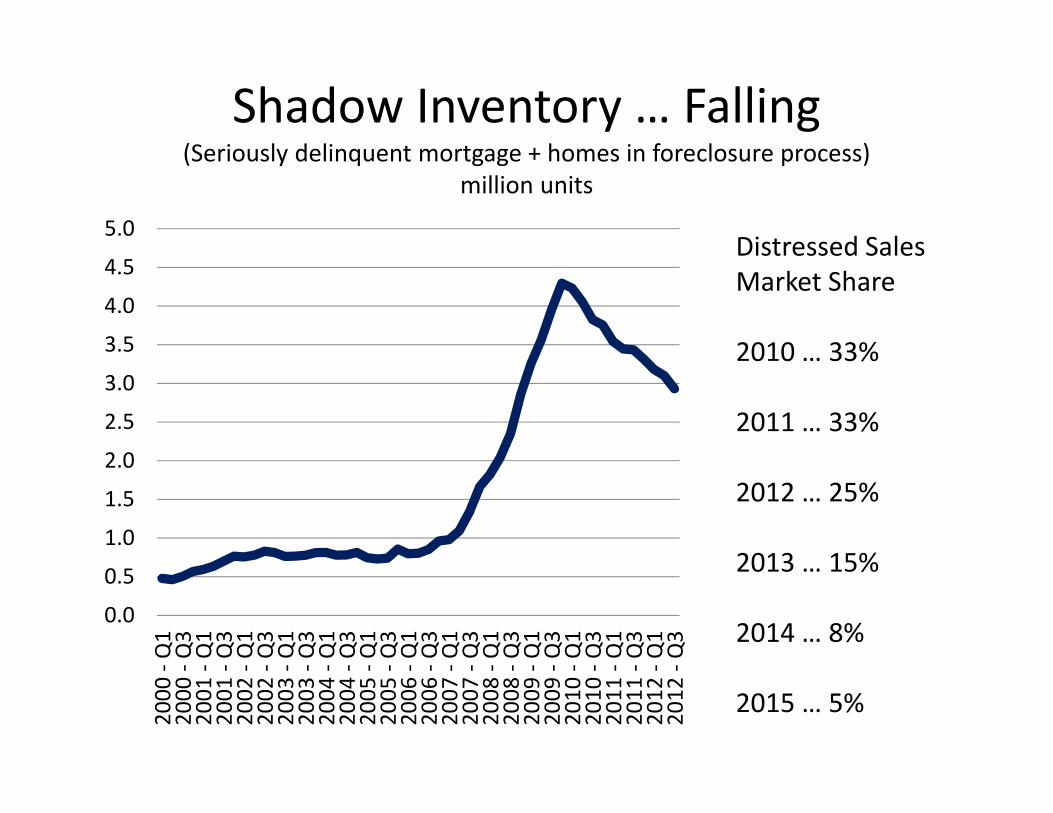
Shadow Inventory … Falling(Seriously delinquent mortgage + homes in foreclosure process)
million units
0.0
0.5
1.0
1.5
2.0
2.5
3.0
3.5
4.0
4.5
5.0
2000
‐ Q1
2000
‐ Q3
2001
‐ Q1
2001
‐ Q3
2002
‐ Q1
2002
‐ Q3
2003
‐ Q1
2003
‐ Q3
2004
‐ Q1
2004
‐ Q3
2005
‐ Q1
2005
‐ Q3
2006
‐ Q1
2006
‐ Q3
2007
‐ Q1
2007
‐ Q3
2008
‐ Q1
2008
‐ Q3
2009
‐ Q1
2009
‐ Q3
2010
‐ Q1
2010
‐ Q3
2011
‐ Q1
2011
‐ Q3
2012
‐ Q1
2012
‐ Q3
Distressed Sales Market Share
2010 … 33%
2011 … 33%
2012 … 25%
2013 … 15%
2014 … 8%
2015 … 5%
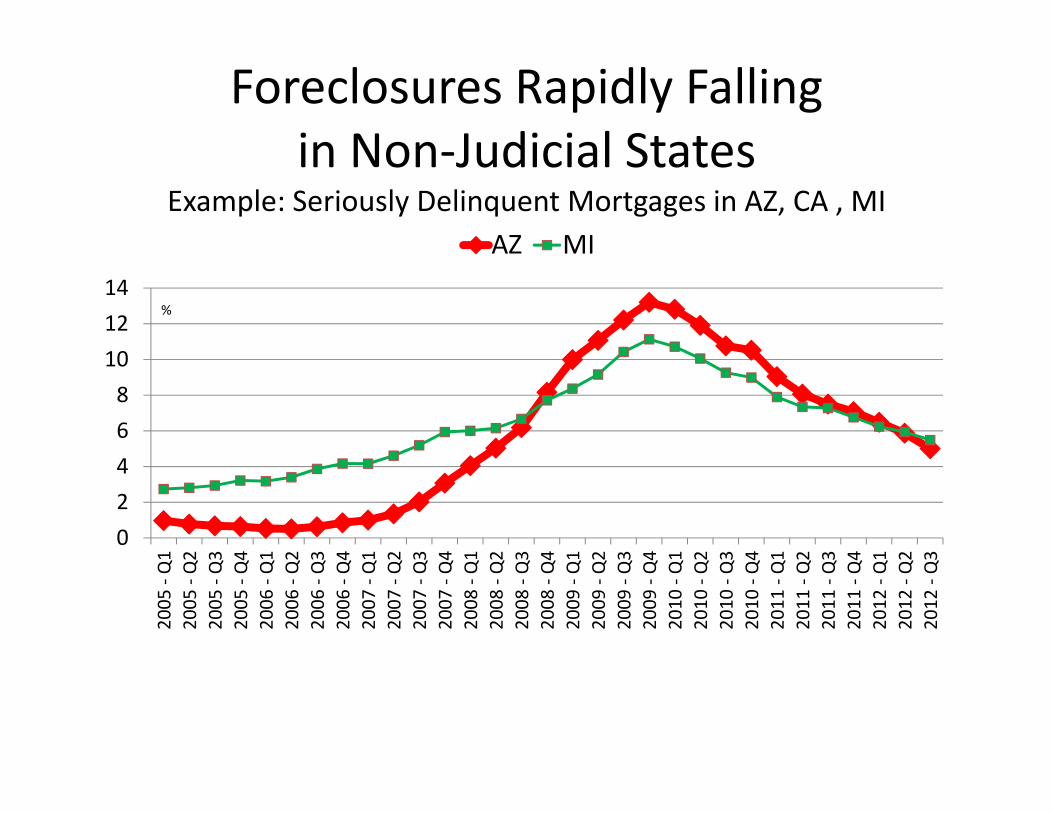
Foreclosures Rapidly Falling in Non‐Judicial States
Example: Seriously Delinquent Mortgages in AZ, CA , MI
02468101214
2005
‐ Q1
2005
‐ Q2
2005
‐ Q3
2005
‐ Q4
2006
‐ Q1
2006
‐ Q2
2006
‐ Q3
2006
‐ Q4
2007
‐ Q1
2007
‐ Q2
2007
‐ Q3
2007
‐ Q4
2008
‐ Q1
2008
‐ Q2
2008
‐ Q3
2008
‐ Q4
2009
‐ Q1
2009
‐ Q2
2009
‐ Q3
2009
‐ Q4
2010
‐ Q1
2010
‐ Q2
2010
‐ Q3
2010
‐ Q4
2011
‐ Q1
2011
‐ Q2
2011
‐ Q3
2011
‐ Q4
2012
‐ Q1
2012
‐ Q2
2012
‐ Q3
AZ MI
%
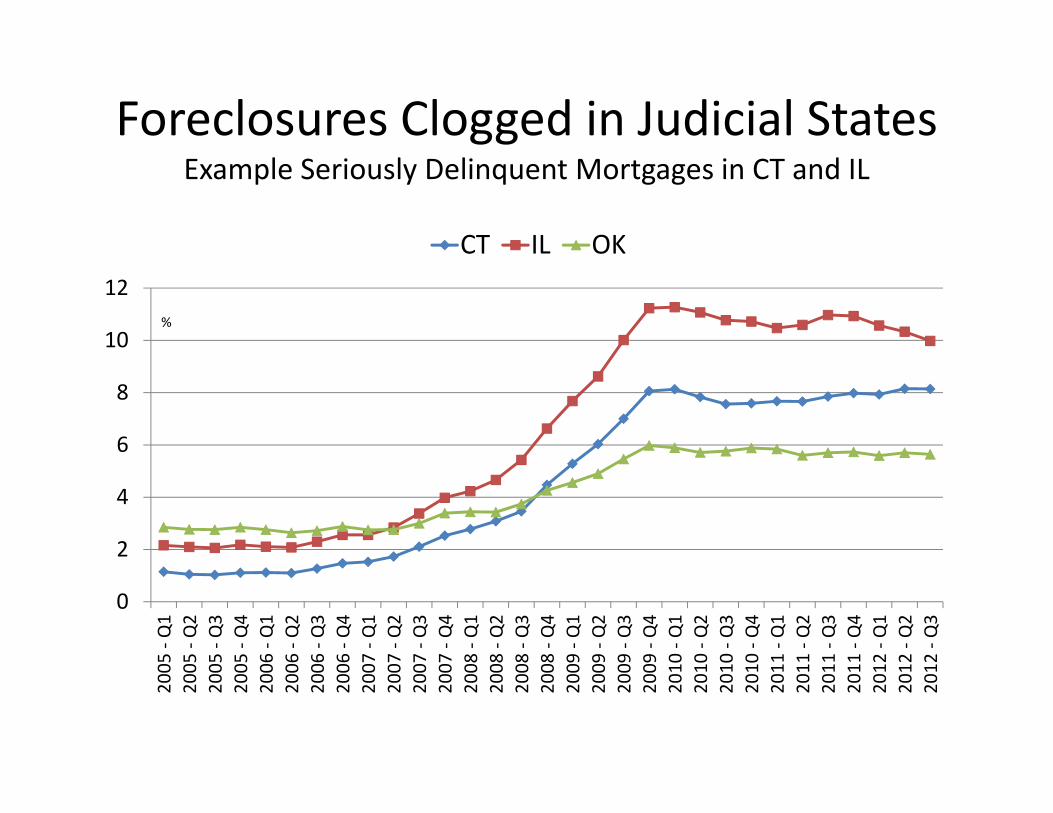
Foreclosures Clogged in Judicial States Example Seriously Delinquent Mortgages in CT and IL
0
2
4
6
8
10
12
2005
‐ Q1
2005
‐ Q2
2005
‐ Q3
2005
‐ Q4
2006
‐ Q1
2006
‐ Q2
2006
‐ Q3
2006
‐ Q4
2007
‐ Q1
2007
‐ Q2
2007
‐ Q3
2007
‐ Q4
2008
‐ Q1
2008
‐ Q2
2008
‐ Q3
2008
‐ Q4
2009
‐ Q1
2009
‐ Q2
2009
‐ Q3
2009
‐ Q4
2010
‐ Q1
2010
‐ Q2
2010
‐ Q3
2010
‐ Q4
2011
‐ Q1
2011
‐ Q2
2011
‐ Q3
2011
‐ Q4
2012
‐ Q1
2012
‐ Q2
2012
‐ Q3
CT IL OK
%
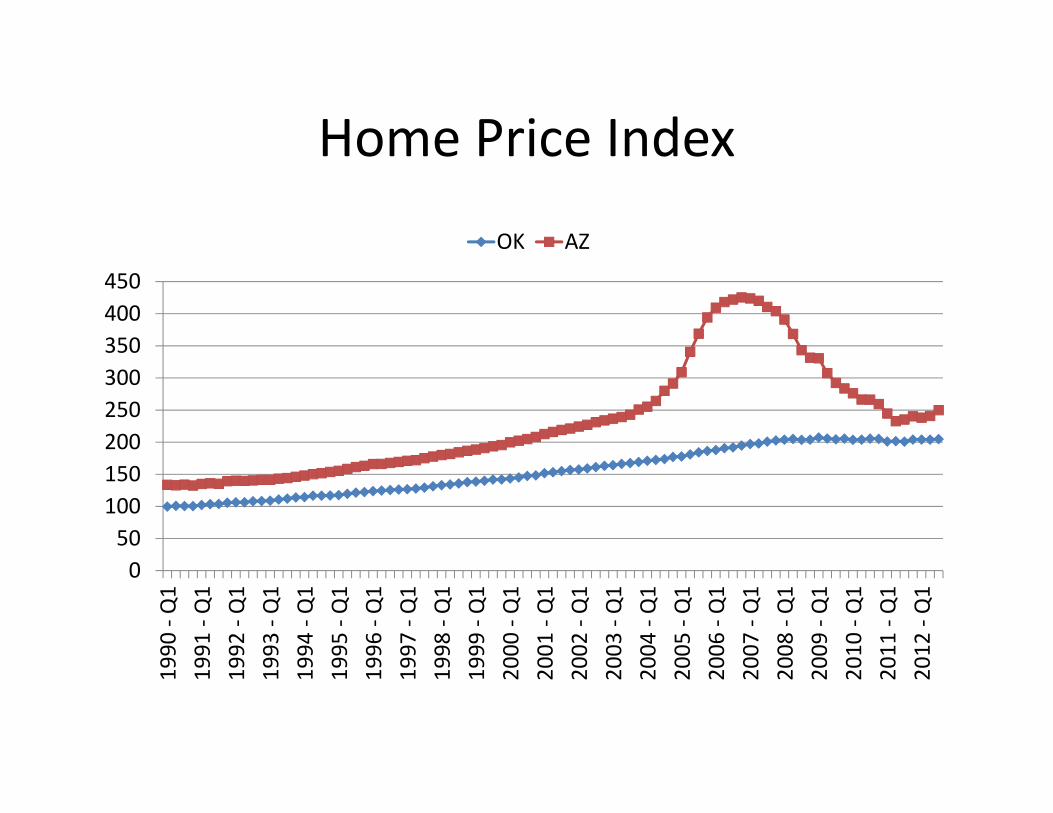
Home Price Index
050100150200250300350400450
1990
‐ Q1
1991
‐ Q1
1992
‐ Q1
1993
‐ Q1
1994
‐ Q1
1995
‐ Q1
1996
‐ Q1
1997
‐ Q1
1998
‐ Q1
1999
‐ Q1
2000
‐ Q1
2001
‐ Q1
2002
‐ Q1
2003
‐ Q1
2004
‐ Q1
2005
‐ Q1
2006
‐ Q1
2007
‐ Q1
2008
‐ Q1
2009
‐ Q1
2010
‐ Q1
2011
‐ Q1
2012
‐ Q1
OK AZ
Forecast #3: More Unequal Wealth Distribution
• Renters do not accumulate wealth• Renter population rising• Homeowners build wealth after buying at low prices
• Stagnant homeowner population• Tight Credit hinders ‘good’ renters from becoming homeowners
• Investors becoming increasing share of property owners
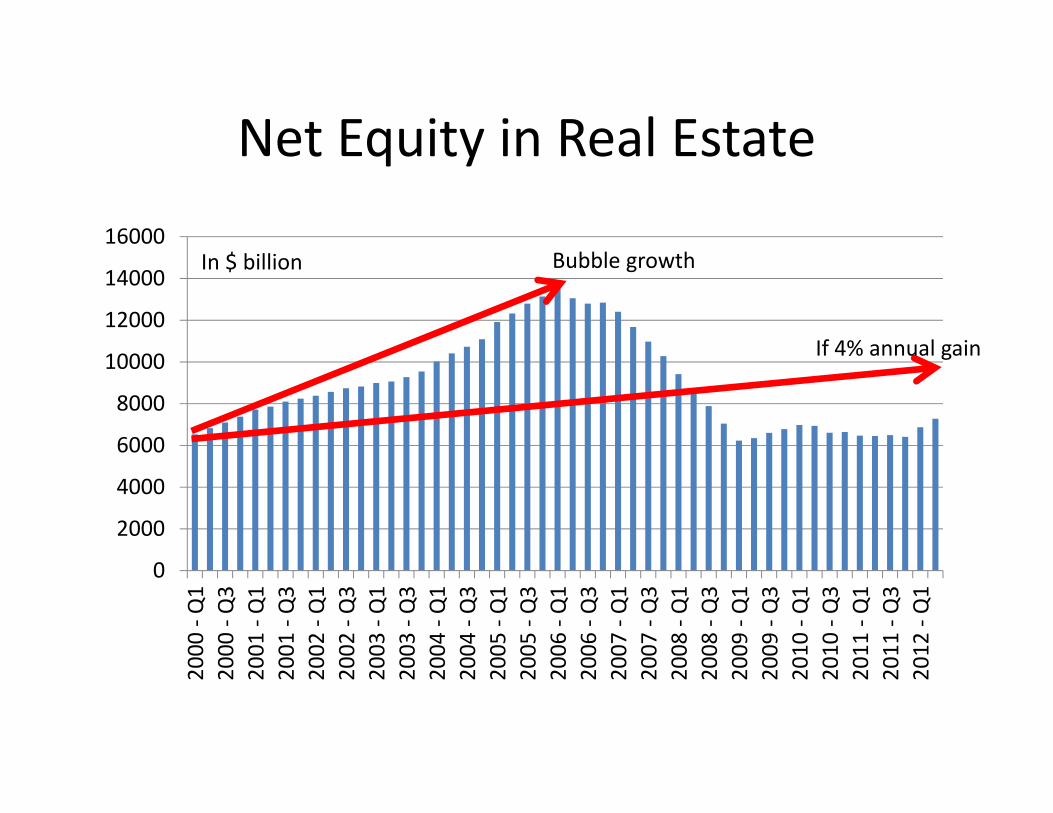
Net Equity in Real Estate
0
2000
4000
6000
8000
10000
12000
14000
16000
2000
‐ Q1
2000
‐ Q3
2001
‐ Q1
2001
‐ Q3
2002
‐ Q1
2002
‐ Q3
2003
‐ Q1
2003
‐ Q3
2004
‐ Q1
2004
‐ Q3
2005
‐ Q1
2005
‐ Q3
2006
‐ Q1
2006
‐ Q3
2007
‐ Q1
2007
‐ Q3
2008
‐ Q1
2008
‐ Q3
2009
‐ Q1
2009
‐ Q3
2010
‐ Q1
2010
‐ Q3
2011
‐ Q1
2011
‐ Q3
2012
‐ Q1
In $ billion
If 4% annual gain
Bubble growth
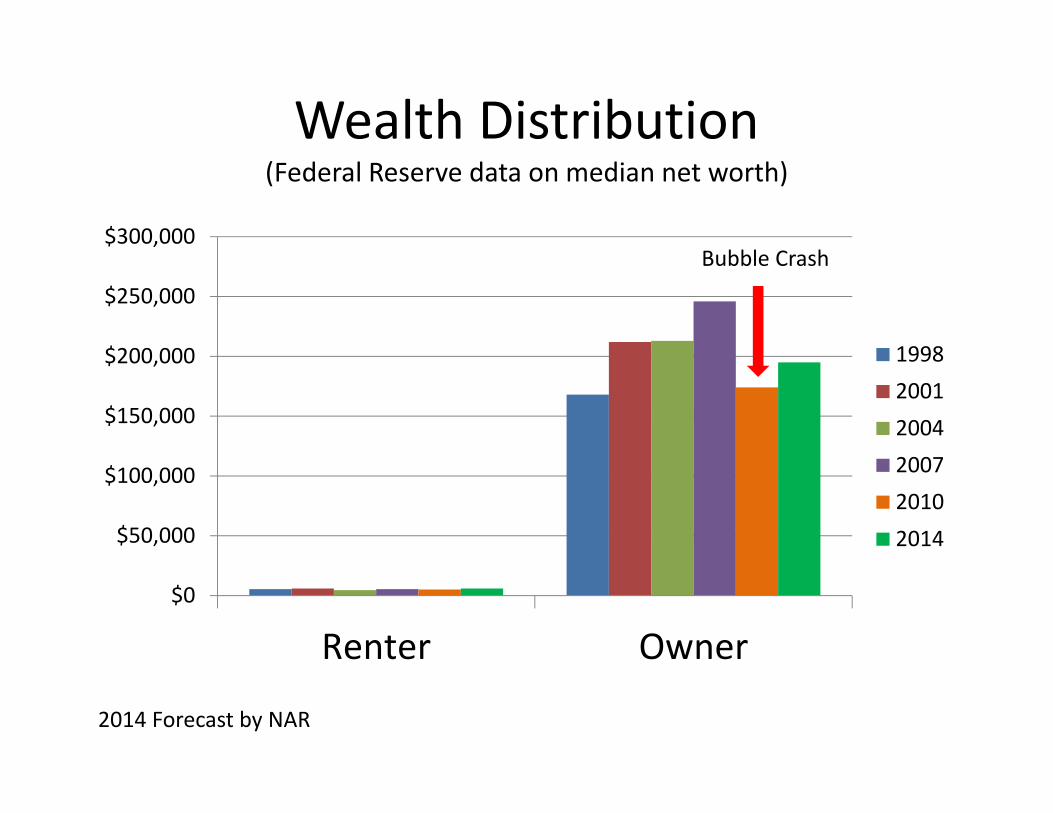
Wealth Distribution (Federal Reserve data on median net worth)
$0
$50,000
$100,000
$150,000
$200,000
$250,000
$300,000
Renter Owner
199820012004200720102014
2014 Forecast by NAR
Bubble Crash
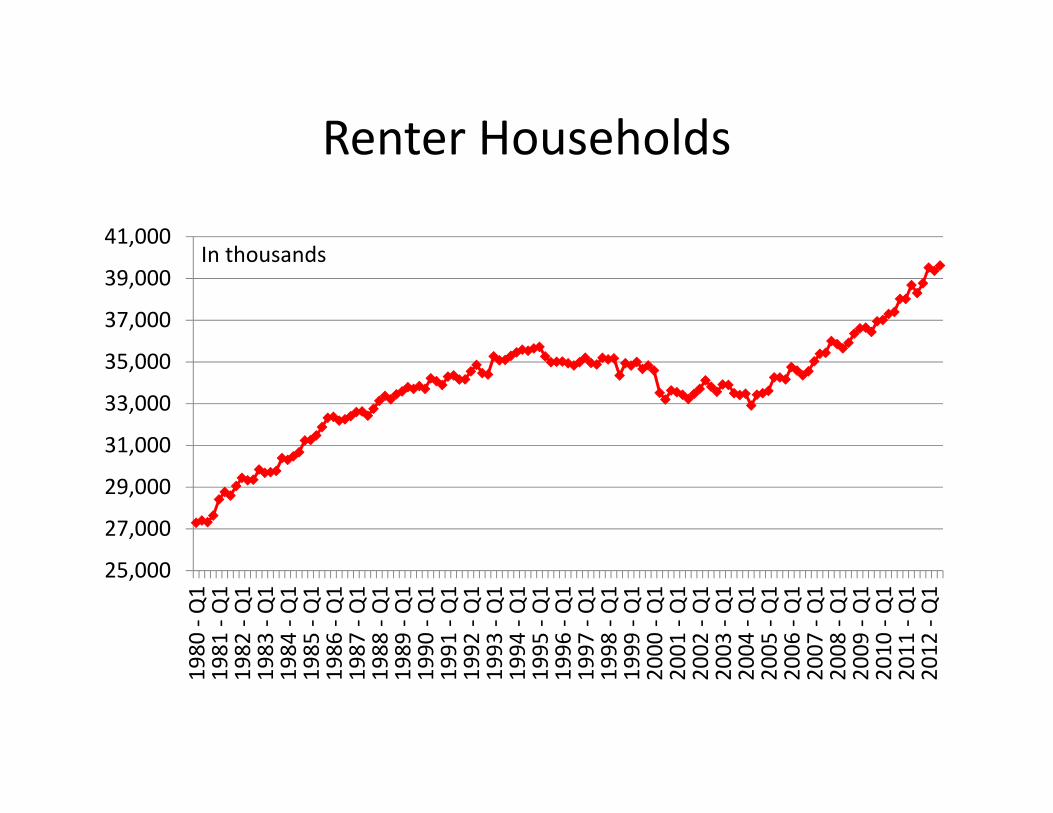
Renter Households
25,000
27,000
29,000
31,000
33,000
35,000
37,000
39,000
41,000
1980
‐ Q1
1981
‐ Q1
1982
‐ Q1
1983
‐ Q1
1984
‐ Q1
1985
‐ Q1
1986
‐ Q1
1987
‐ Q1
1988
‐ Q1
1989
‐ Q1
1990
‐ Q1
1991
‐ Q1
1992
‐ Q1
1993
‐ Q1
1994
‐ Q1
1995
‐ Q1
1996
‐ Q1
1997
‐ Q1
1998
‐ Q1
1999
‐ Q1
2000
‐ Q1
2001
‐ Q1
2002
‐ Q1
2003
‐ Q1
2004
‐ Q1
2005
‐ Q1
2006
‐ Q1
2007
‐ Q1
2008
‐ Q1
2009
‐ Q1
2010
‐ Q1
2011
‐ Q1
2012
‐ Q1
In thousands
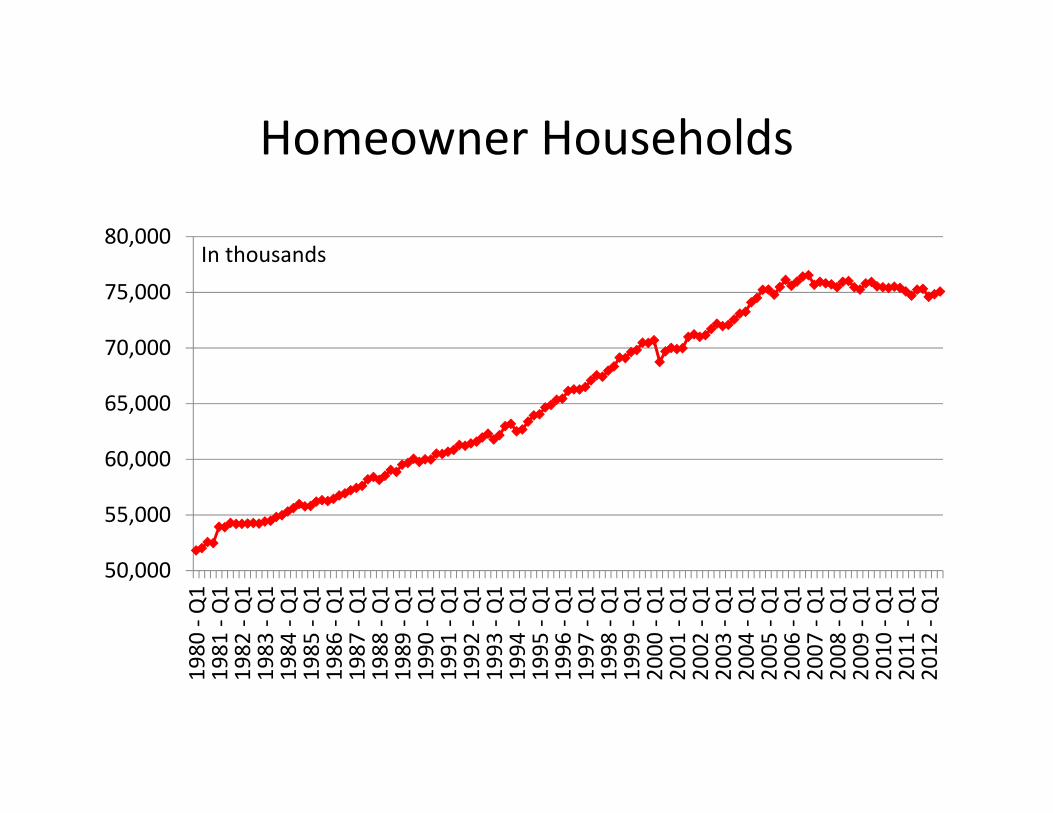
Homeowner Households
50,000
55,000
60,000
65,000
70,000
75,000
80,000
1980
‐ Q1
1981
‐ Q1
1982
‐ Q1
1983
‐ Q1
1984
‐ Q1
1985
‐ Q1
1986
‐ Q1
1987
‐ Q1
1988
‐ Q1
1989
‐ Q1
1990
‐ Q1
1991
‐ Q1
1992
‐ Q1
1993
‐ Q1
1994
‐ Q1
1995
‐ Q1
1996
‐ Q1
1997
‐ Q1
1998
‐ Q1
1999
‐ Q1
2000
‐ Q1
2001
‐ Q1
2002
‐ Q1
2003
‐ Q1
2004
‐ Q1
2005
‐ Q1
2006
‐ Q1
2007
‐ Q1
2008
‐ Q1
2009
‐ Q1
2010
‐ Q1
2011
‐ Q1
2012
‐ Q1
In thousands
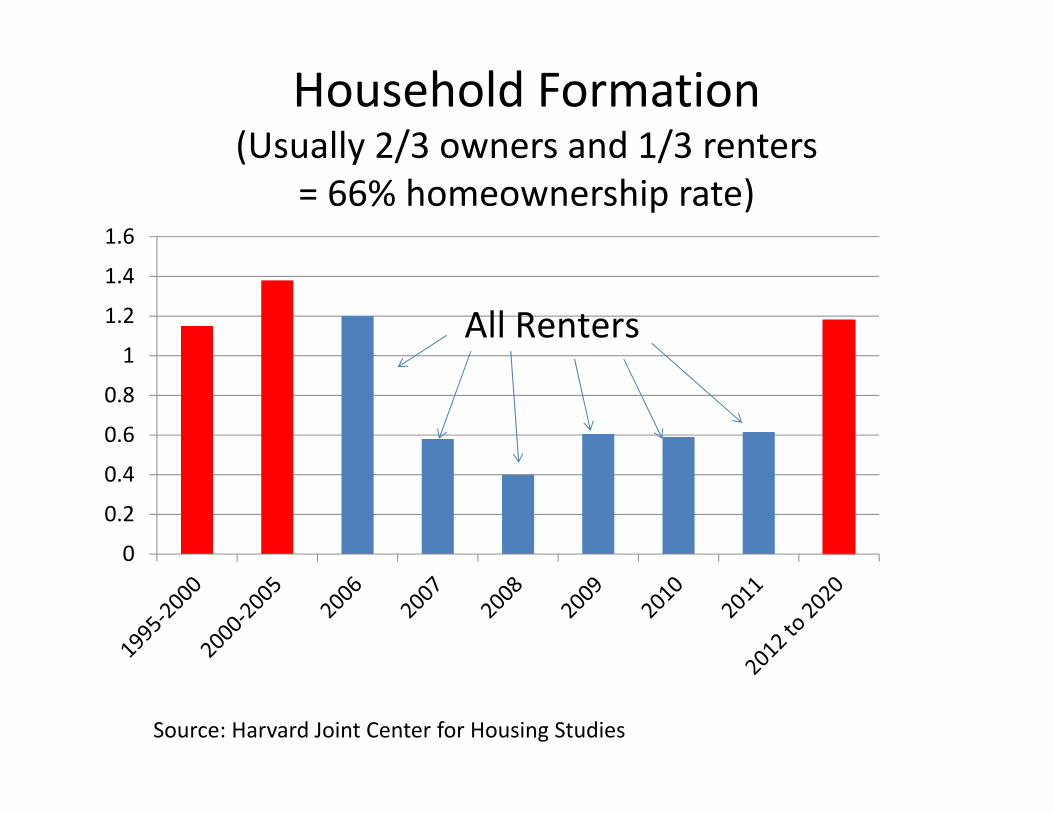
Household Formation(Usually 2/3 owners and 1/3 renters
= 66% homeownership rate)
0
0.2
0.4
0.6
0.8
1
1.2
1.4
1.6
All Renters
Source: Harvard Joint Center for Housing Studies

Economic Backdrop
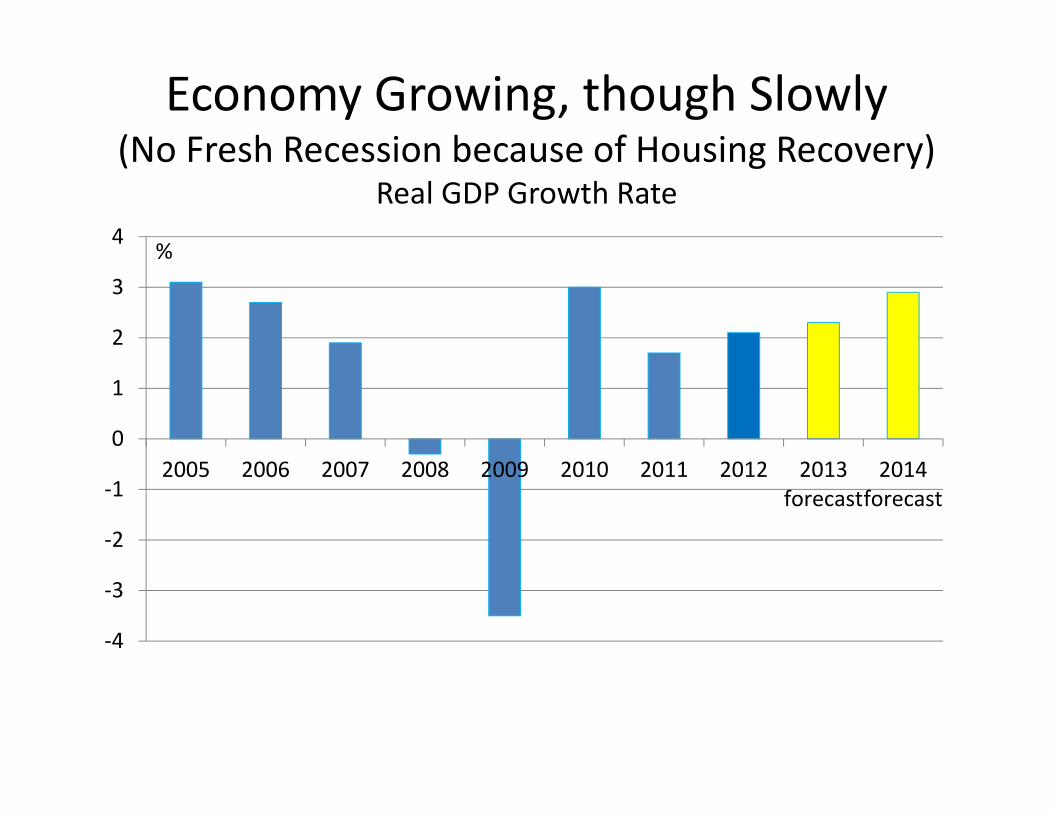
Economy Growing, though Slowly(No Fresh Recession because of Housing Recovery)
Real GDP Growth Rate
‐4
‐3
‐2
‐1
0
1
2
3
4
2005 2006 2007 2008 2009 2010 2011 2012 2013forecast
2014forecast
%
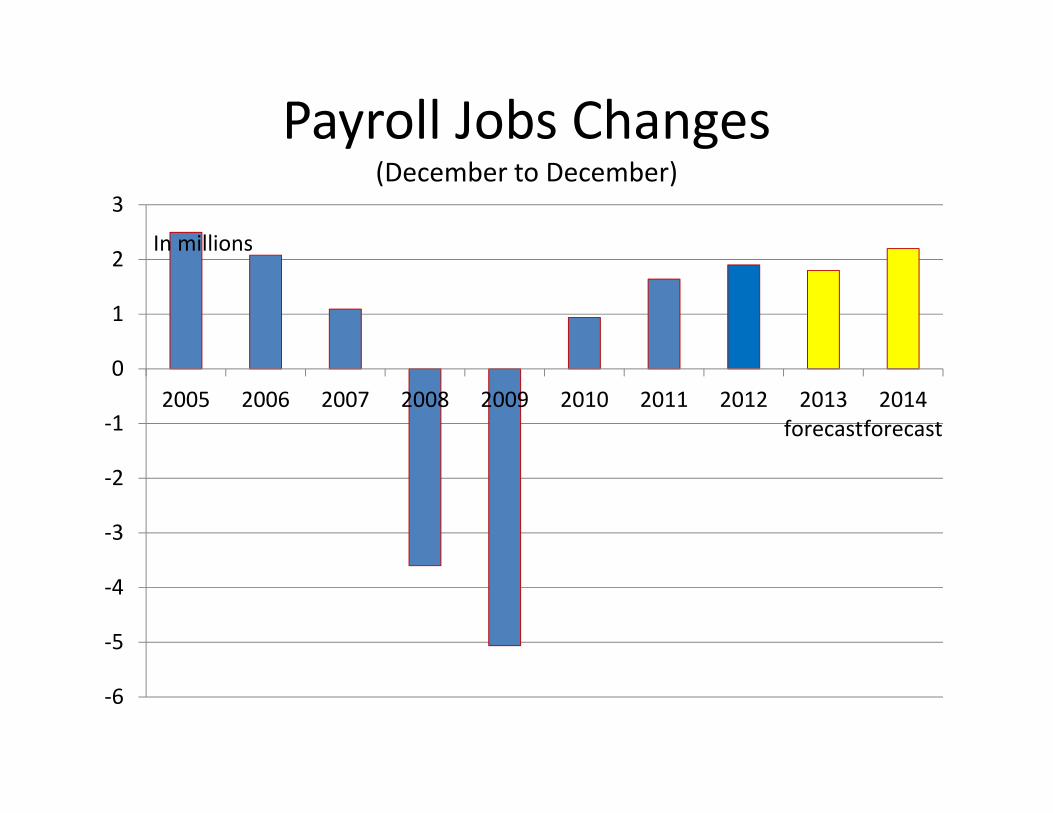
Payroll Jobs Changes(December to December)
‐6
‐5
‐4
‐3
‐2
‐1
0
1
2
3
2005 2006 2007 2008 2009 2010 2011 2012 2013forecast
2014forecast
In millions
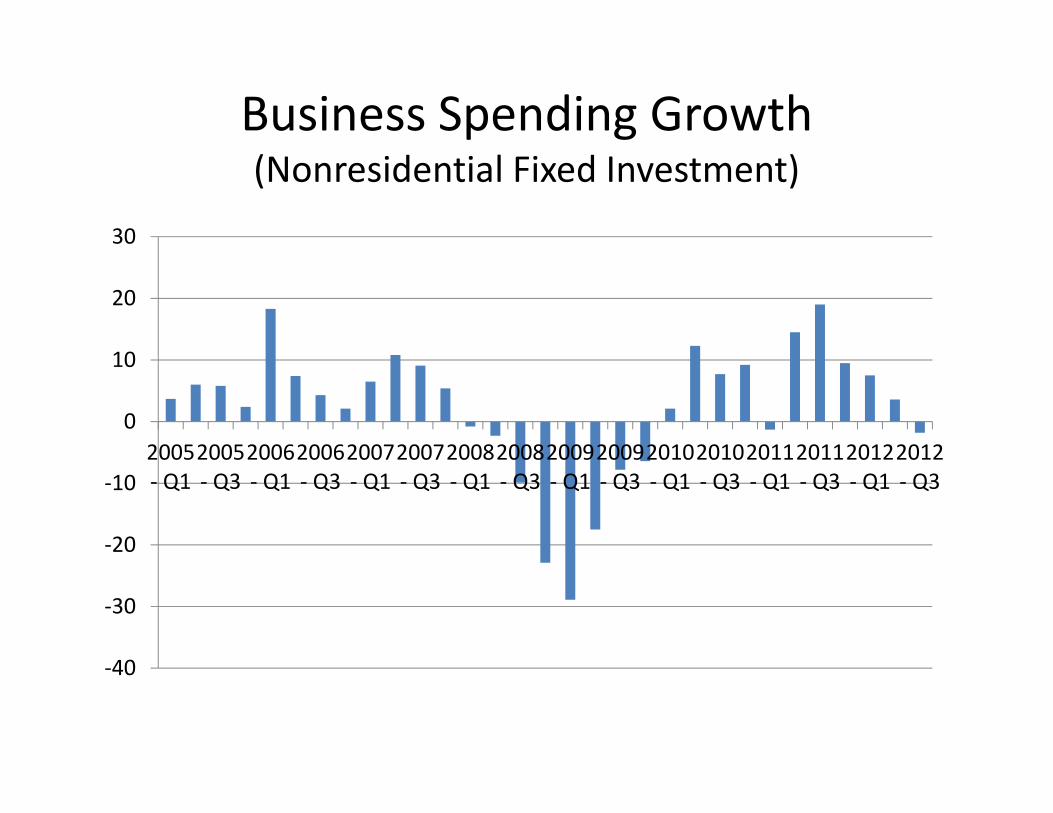
Business Spending Growth(Nonresidential Fixed Investment)
‐40
‐30
‐20
‐10
0
10
20
30
2005‐ Q1
2005‐ Q3
2006‐ Q1
2006‐ Q3
2007‐ Q1
2007‐ Q3
2008‐ Q1
2008‐ Q3
2009‐ Q1
2009‐ Q3
2010‐ Q1
2010‐ Q3
2011‐ Q1
2011‐ Q3
2012‐ Q1
2012‐ Q3
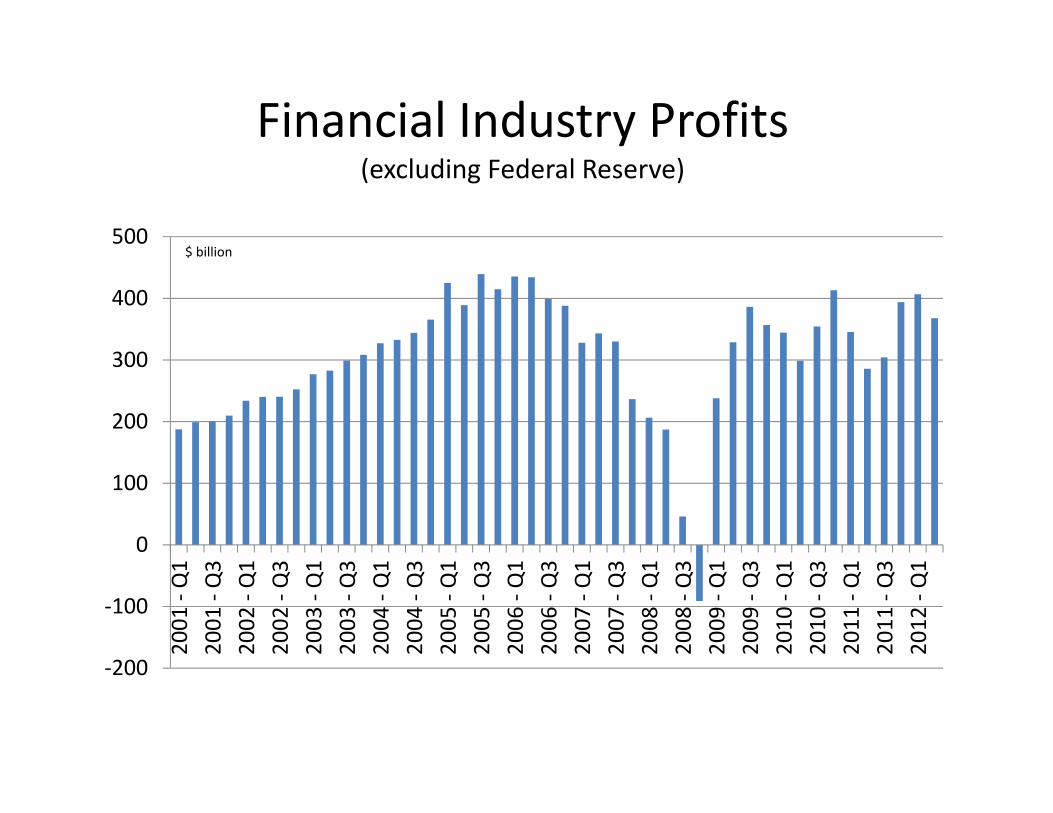
Financial Industry Profits(excluding Federal Reserve)
‐200
‐100
0
100
200
300
400
500
2001
‐ Q1
2001
‐ Q3
2002
‐ Q1
2002
‐ Q3
2003
‐ Q1
2003
‐ Q3
2004
‐ Q1
2004
‐ Q3
2005
‐ Q1
2005
‐ Q3
2006
‐ Q1
2006
‐ Q3
2007
‐ Q1
2007
‐ Q3
2008
‐ Q1
2008
‐ Q3
2009
‐ Q1
2009
‐ Q3
2010
‐ Q1
2010
‐ Q3
2011
‐ Q1
2011
‐ Q3
2012
‐ Q1
$ billion
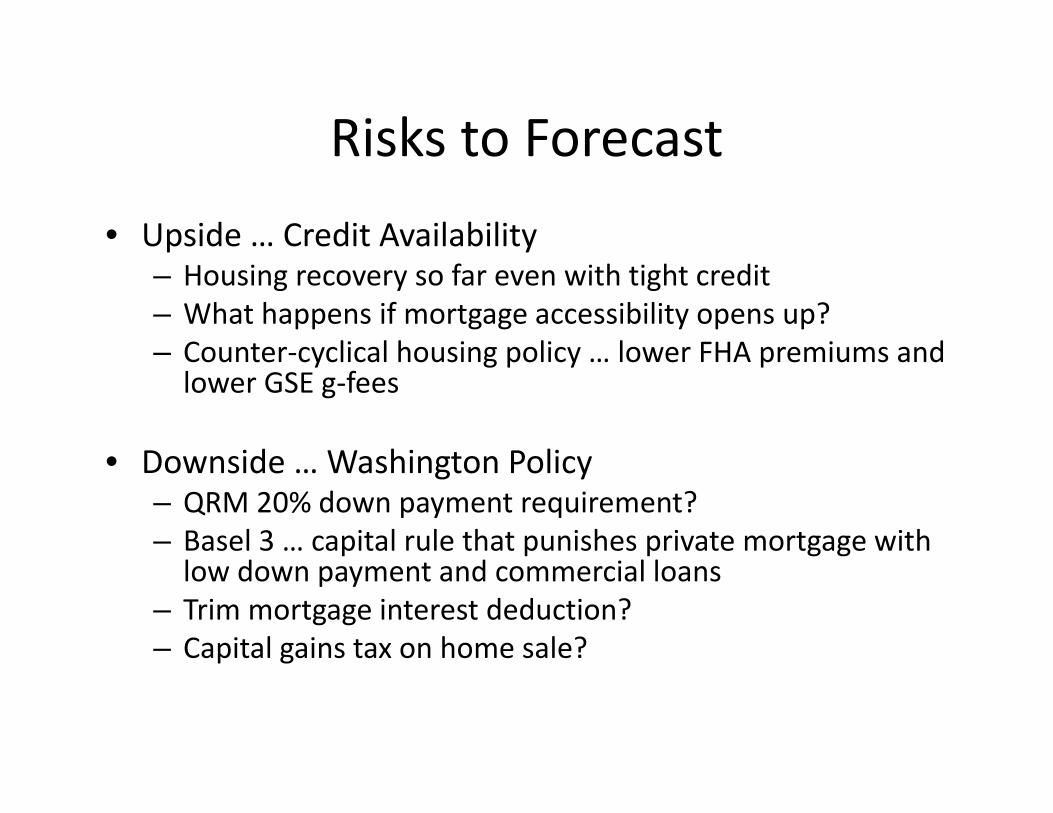
Risks to Forecast• Upside … Credit Availability
– Housing recovery so far even with tight credit– What happens if mortgage accessibility opens up?– Counter‐cyclical housing policy … lower FHA premiums and lower GSE g‐fees
• Downside … Washington Policy– QRM 20% down payment requirement?– Basel 3 … capital rule that punishes private mortgage with low down payment and commercial loans
– Trim mortgage interest deduction?– Capital gains tax on home sale?
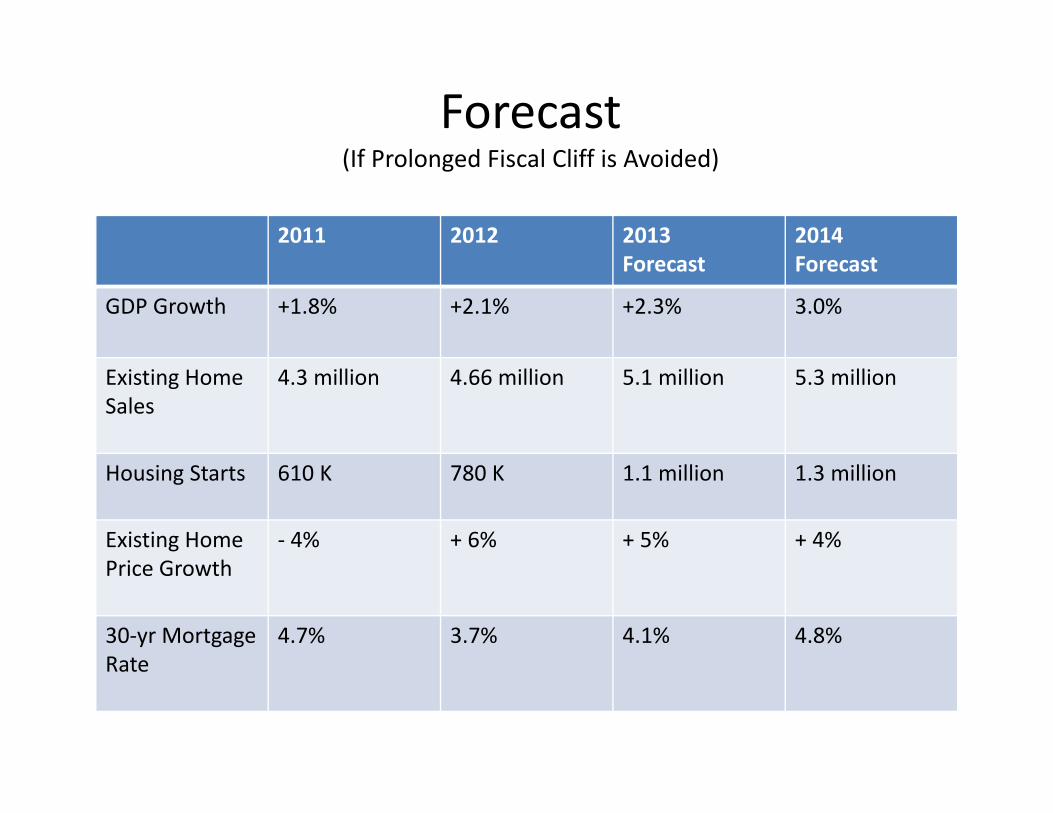
Forecast(If Prolonged Fiscal Cliff is Avoided)
2011 2012 2013Forecast
2014Forecast
GDP Growth +1.8% +2.1% +2.3% 3.0%
Existing Home Sales
4.3 million 4.66 million 5.1 million 5.3 million
Housing Starts 610 K 780 K 1.1 million 1.3 million
Existing Home Price Growth
‐ 4% + 6% + 5% + 4%
30‐yr MortgageRate
4.7% 3.7% 4.1% 4.8%
Oklahoma Forecast
• Steady Growth
• Jobs more important determinant than mortgage rates
• 15% cumulative price increase in 3 years.

For Daily Update and Analysis
• Twitter @NAR_Research
• Do not offend your homebuyers by offering …
Related Documents