1
SKF Half-year results 2015Alrik Danielson, President and CEO
15 July 2015
© SKF Group 15 July 2015
2
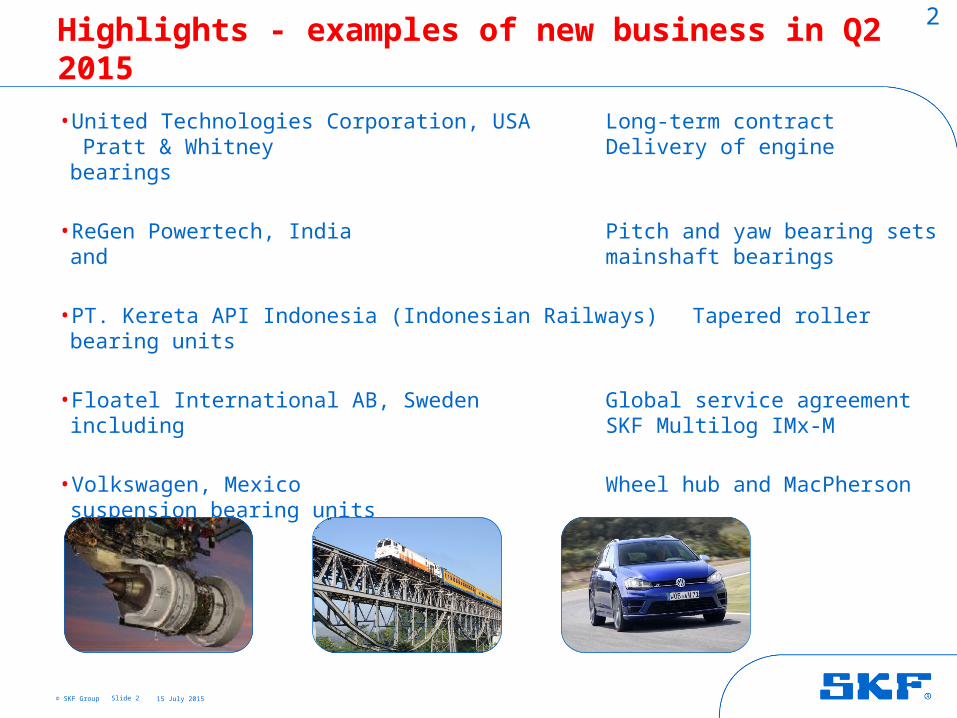
Highlights - examples of new business in Q2 2015
• United Technologies Corporation, USA Long-term contract Pratt & Whitney Delivery of engine bearings
• ReGen Powertech, India Pitch and yaw bearing sets and mainshaft bearings
• PT. Kereta API Indonesia (Indonesian Railways) Tapered roller bearing units
• Floatel International AB, Sweden Global service agreement including SKF Multilog IMx-M
• Volkswagen, Mexico Wheel hub and MacPherson suspension bearing units
Slide 2

© SKF Group 15 July 2015
3
Highlights
Slide 3
• Completed the divestment of:- Erin Engineering and Research Inc. to Jensen Hughes, a US-based engineering consultancy.- Two filtration businesses, Purafil and Kaydon Custom Filtration, to Filtration Group Corporation, an affiliate of Madison Industries.
• New products:- a smaller version of a shaft alignment tool that it launched earlier in the year, designed to make shaft alignment easy and intuitive.
- an upgraded version of the third generation hub bearing unit, designed to reduce preload, friction and CO2 emissions.

© SKF Group 15 July 2015
4
Highlights – customer awards received
Slide 4
• Awards from SKF distributors:-‘Supplier of the Year’ Motion Industries in Canada and in the
Southeast and Midwest regions of the USA-‘Supplier of the Year in Transmission Imes Dexis, Benelux and Technics 2014’
• ‘Best Supplier Award Year 2014’ Shanghai Hanbell Precise Machinery Co.,
China
• ‘Best Supplier Award’ Shanghai Automobile Gear Works, China
• ‘Best Plant award’ The PSA Group, for SKF’s factories in St Cyr, France and Tudela, Spain.

© SKF Group 15 July 2015
5
Automotive Market profit improvement programme
Clear aim of improving productivity and competitiveness
Three main focus areas:1. Products – Review of product portfolio; emphasis on application-focused
offerings with the specific performance required for the application2. Competitiveness – Improve our overall competitiveness; focus on costs,
manufacturing footprint and process technology3. Vehicle Service Market – Further adapt aftermarket and OEM offerings,
as the design-life of products delivered to OEM customers continues to increase; adapt our aftermarket offering to new reality, ensuring a competitive offer and value proposition for second and third vehicle owners
Actions to run as part of normal business; possible restructuring costs to be communicated as and if they occur
Intention to develop business as part of SKF
Slide 5
© SKF Group 15 July 2015
6
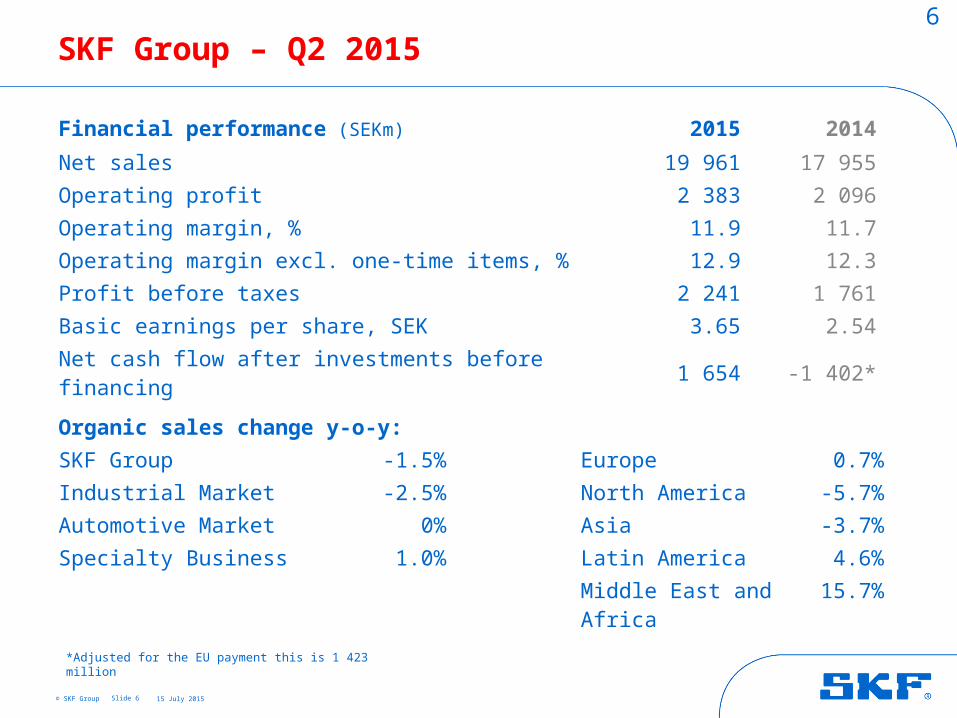
SKF Group – Q2 2015
Slide 6
Financial performance (SEKm) 2015 2014
Net sales 19 961 17 955Operating profit 2 383 2 096Operating margin, % 11.9 11.7Operating margin excl. one-time items, % 12.9 12.3Profit before taxes 2 241 1 761Basic earnings per share, SEK 3.65 2.54Net cash flow after investments before financing 1 654 -1 402*
Organic sales change y-o-y:
SKF Group -1.5% Europe 0.7%
Industrial Market -2.5% North America -5.7%Automotive Market 0% Asia -3.7%
Specialty Business 1.0% Latin America 4.6%Middle East and Africa 15.7%
*Adjusted for the EU payment this is 1 423 million

© SKF Group 15 July 2015
7
SKF Group – Half year 2015
Slide 7
Financial performance (SEKm) 2015 2014
Net sales 39 415 34 689Operating profit 4 104 4 120Operating margin, % 10.4 11.9Operating margin excl. one-time items, % 12.6 11.9Profit before taxes 3 833 3 548Basic earnings per share, SEK 6.11 5.26Net cash flow after investments before financing 2 642 -1 465*
Organic sales change y-o-y:
SKF Group -0.2% Europe 0.8%
Industrial Market -0.6% North America -4.1%Automotive Market 0.3% Asia 0.6%
Specialty Business 0.8% Latin America 1.5%Middle East and Africa 15.0%
*Previously published cash flow information is restated and adjusted for the EU payment this is 1 360 million

© SKF Group 15 July 2015
8
Organic sales growth in local currency
Slide 8
-10
-8
-6
-4
-2
0
2
4
6
8
% changey-o-y
2013 2014 2015

© SKF Group 15 July 2015
9
Organic sales growth in local currency
Slide 9
2013 2014 YTD 2015-4
-2
0
2
4
6
% y-o-y
Structure in 2013: 2.5%Structure in 2014: 3.7%Structure in 2015: -0.1%
-0.2%
3.9%
-0.7%

© SKF Group 15 July 2015
10Sales development by geographyOrganic growth in local currency Q2 2015 vs Q2 2014
Slide 10
Europe0.7%
Asia/Pacific-3.7%
Middle East& Africa15.7%
LatinAmerica
4.6%
NorthAmerica-5.7%
© SKF Group 15 July 2015
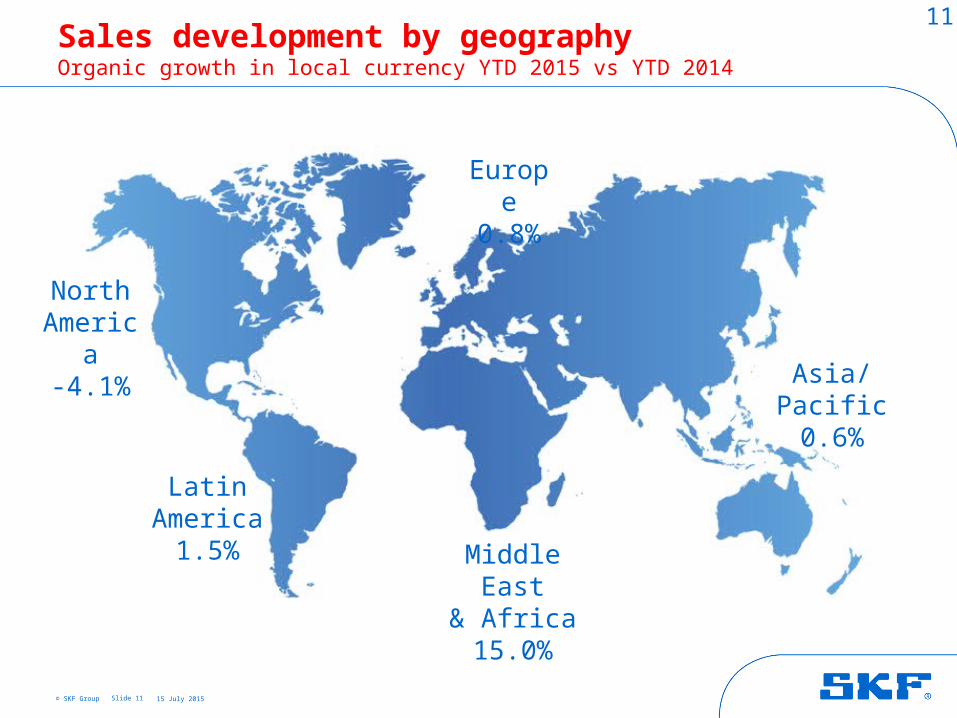
11Sales development by geographyOrganic growth in local currency YTD 2015 vs YTD 2014
Slide 11
Europe0.8%
Asia/Pacific0.6%
Middle East& Africa15.0%
LatinAmerica
1.5%
NorthAmerica-4.1%

© SKF Group 15 July 2015
12
Components in net sales
Slide 12
2013 2014 2015
Percent y-o-y Q1 Q2 Q3 Q4 Q1 Q2 Q3 Q4 Q1 Q2
Organic -8.0 -2.2 2.0 6.9 5.8 4.6 3.2 2.8 1.4 -1.5
Structure 1.5 2.6 1.1 4.8 4.7 3.8 5.4 0.9 0 -0.2
Sales in local currency -6.5 0.4 3.1 11.7 10.5 8.4 8.6 3.7 1.4 -1.7
Currency -4.0 -5.0 -2.2 -2.1 -0.1 1.1 5.3 8.9 14.9 12.9
Net sales -10.5 -4.6 0.9 9.6 10.4 9.5 13.9 12.6 16.3 11.2

© SKF Group 15 July 2015
13
Operating profit as reported
Slide 13
-2,000
-1,500
-1,000
-500
0
500
1,000
1,500
2,000
2,500SEKm
2013 2014 2015

© SKF Group 15 July 2015
14
Operating profit excluding one-time items
Slide 14
0
500
1000
1500
2000
2500
3000SEKm
2013 2014 2015

© SKF Group 15 July 2015
15
Operating margin
Slide 15
2013 2014 YTD 20150
2
4
6
8
10
12
14
16
%
5.8
11.9*
One-time items
* Excluding one-time items
10.4
12.6*11.7*
11.0

© SKF Group 15 July 2015
16
Slide 16
Q1 Q2 Q3 Q4 Q1 Q2 Q3 Q4 Q1 Q2-3
0
3
6
9
12
15
18
Specialty Business*
Automotive Market
%
2013 2014 2015
Operating margin per business area, as reported
Industrial Market
* Q4 2013, impacted by cost related to Kaydon acquisition

© SKF Group 15 July 2015
17
Slide 17
Q1 Q2 Q3 Q4 Q1 Q2 Q3 Q4 Q1 Q2-3
0
3
6
9
12
15
18
Specialty Business
Automotive Market
%
2013 2014 2015
Operating margin per business area, excl. one-time items
Industrial Market
© SKF Group 15 July 2015
18
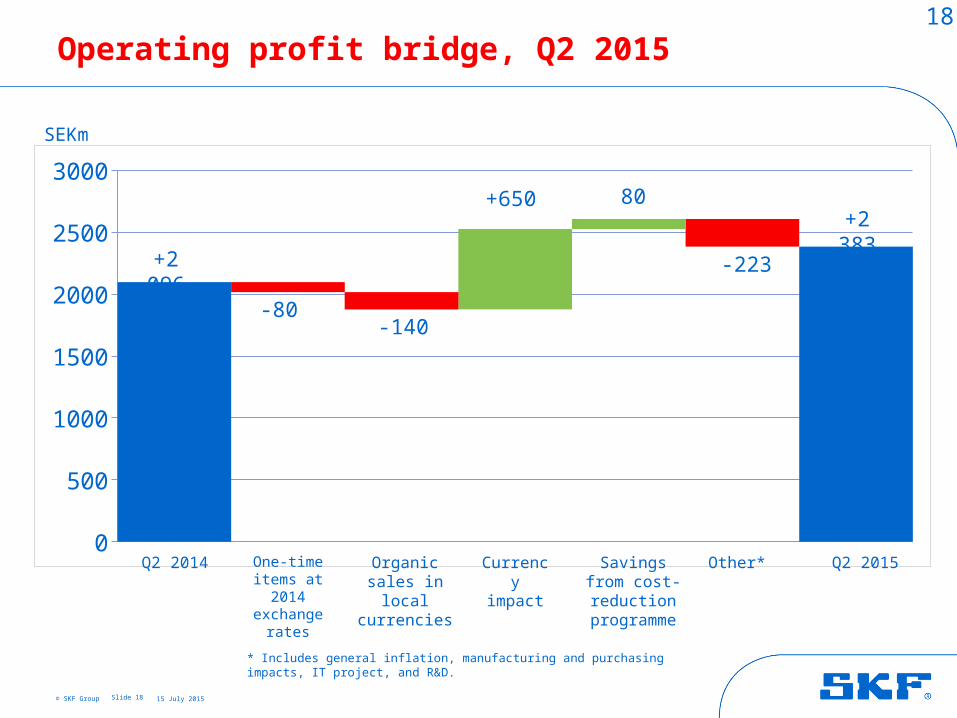
Operating profit bridge, Q2 2015
Slide 18
0
500
1000
1500
2000
2500
3000
-1 547
-80
+2 383
-140
+650
-223
SEKm
Q2 2014 Q2 2015One-time items at 2014
exchange rates
Currency impact
Other* Organic sales in local currencies
* Includes general inflation, manufacturing and purchasing impacts, IT project, and R&D.
+2 096
80
Savings from cost-reduction
programme

© SKF Group 15 July 2015
19
Operating profit bridge, YTD 2015
Slide 19
0
500
1000
1500
2000
2500
3000
3500
4000
4500
5000
-1 547
-780
+4 104
-20
+1 100
-396
SEKm
YTD 2014 YTD 2015One-time items at 2014
exchange rates
Currency impact
Other* Organic sales in local currencies
* Includes general inflation, manufacturing and purchasing impacts, IT project, and R&D.
+2 096
80
Savings from cost-reduction
programme

© SKF Group 15 July 2015
20
Employee productivity and efficiency
• Expected productivity and efficiency gains from new organisation on-track:- merging the two industrial businesses- general staff optimization and productivity improvements
• Agreements have been reached covering 60% of the concerned individuals.
Q1 2015 Q2 2015 Target
Cost, SEKm 535 224 1 400
People affected 575 270 1 500
Cost savings - 80 -
Annual cost savings, SEKm 460* 170* 1 200
Slide 20
* On a full-year basis, as of Jan 2016

© SKF Group 15 July 2015
21
Net working capital as % of annual sales
Slide 21
Q1 Q2 Q3 Q4 Q1 Q2 Q3 Q4 Q1 Q225
26
27
28
29
30
31
32
33
34
35
%
2013 2014 2015
Target: 27%
© SKF Group 15 July 2015
22
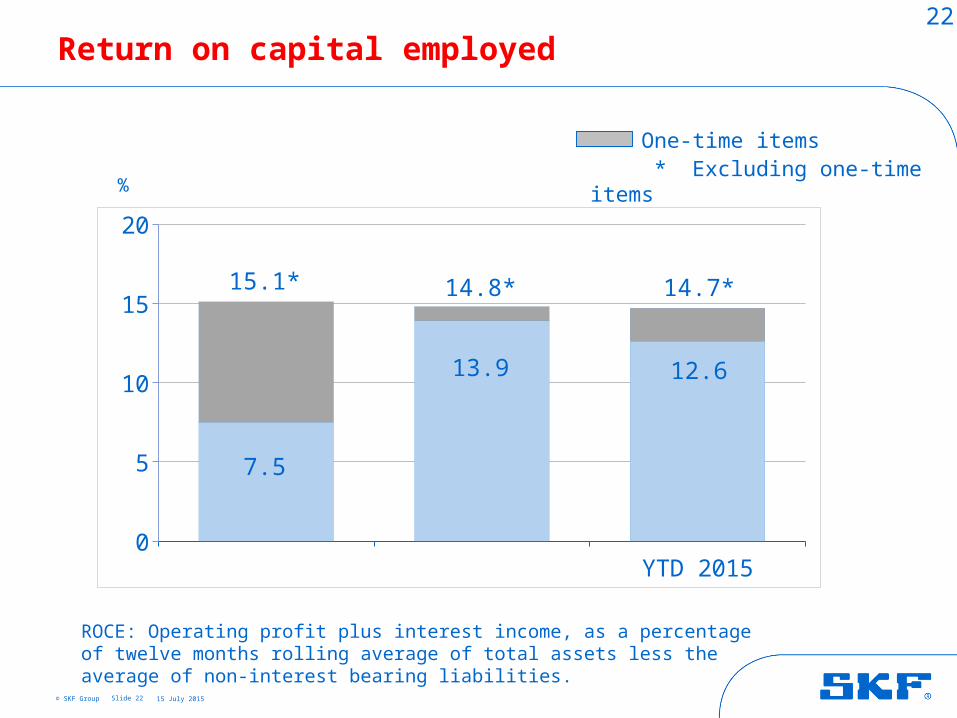
Return on capital employed
Slide 22
2013 2014 YTD 20150
5
10
15
20
%
12.6
7.5
15.1*
One-time items * Excluding one-time items
ROCE: Operating profit plus interest income, as a percentage of twelve months rolling average of total assets less the average of non-interest bearing liabilities.
14.7*14.8*
13.9

© SKF Group 15 July 2015
23
-7,000
-6,000
-5,000
-4,000
-3,000
-2,000
-1,000
0
1,000
2,000
3,000
Cash flow, after investments before financing*
Slide 23
SEKm
2013 2014 2015
Excl. acq. and div.: 1) Q1 2013 SEK -69 million2) Q3 2013 SEK 871 million3) Q4 2013 SEK 1 122 million
Excl. EU payment 4) Q2 2014 SEK 1 423 million
3)
4)
2)
1)
* 2013 and 2014 are restated

© SKF Group 15 July 2015
24
Net debt
Slide 24
-35,000
-30,000
-25,000
-20,000
-15,000
-10,000
-5,000
0SEKm
2013 2014 2015
AB SKF, dividend paid (SEKm):2013 Q2 2 5302014 Q2 2 5302015 Q2 2 567
Cash out from majoracquisitions (SEKm):
2013 Q1 8232013 Q4 7 900
Net debt: Loans and net provisions for post-employment benefits less short-term financial assets excluding derivatives.
EU payment (SEKm):
2014 Q2 2 825
Cash from divestments (SEKm):
2015 Q2 1 000
© SKF Group 15 July 2015
25
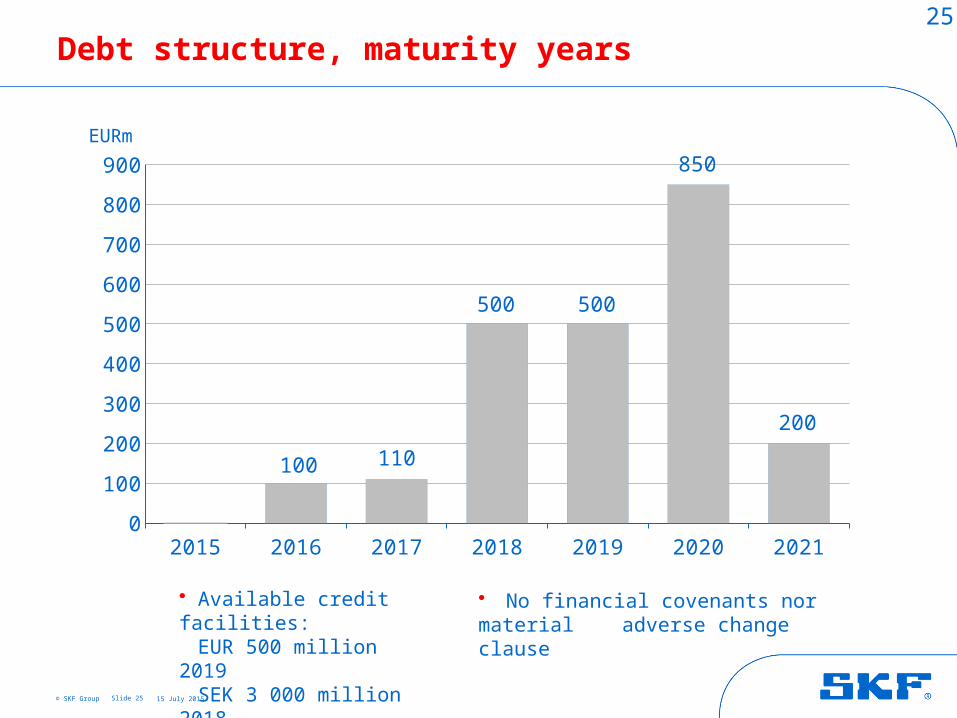
Debt structure, maturity years
Slide 25
2015 2016 2017 2018 2019 2020 20210
100
200
300
400
500
600
700
800
900
EURm
• Available credit facilities:EUR 500 million 2019SEK 3 000 million 2018
EUR 150 million 2017
• No financial covenants nor material adverse change clause
200
100 110
500 500
850
© SKF Group 15 July 2015
26
July 2015: SKF demand outlook Q3 2015
Slide 26
Demand compared to the third quarter 2014The demand for SKF’s products and services is expected to be relatively unchanged for the Group, Europe and Asia. For North America it is expected to be lower and for Latin America higher. For all business areas it is expected to be relatively unchanged.
Demand compared to the second quarter 2015The demand for SKF’s products and services is expected to be slightly lower for the Group. For Europe it is expected to be lower and for all other regions it is expected to be relatively unchanged. For the business areas, Industrial Market and Specialty Business it is expected to be relatively unchanged and for Automotive Market it is expected to be lower.

© SKF Group 15 July 2015
27
Guidance for 2015*
Slide 27
Q3 2015:
• Financial net: around -230 million
• Currency impact on operating profit vs 2014 Q3: 450 million, based on exchange rates June 30.
2015:
• Tax level: below 30% for 2015
• Additions to PPE: around 1 700 million for 2015
* Guidance is approximate and based on current assumptions and exchange rates.

© SKF Group 15 July 2015
28
Cautionary statement
Slide 28
This presentation contains forward-looking statements that are based on the current expectations of the management of SKF.
Although management believes that the expectations reflected in such forward-looking statements are reasonable, no assurance can be given that such expectations will prove to have been correct. Accordingly, results could differ materially from those implied in the forward-looking statements as a result of, among other factors, changes in economic, market and competitive conditions, changes in the regulatory environment and other government actions, fluctuations in exchange rates and other factors mentioned in SKF's latest annual report (available on www.skf.com) under the Administration Report; “Important factors influencing the financial results", "Financial risks" and "Sensitivity analysis”.