


1 1April 2006

2
Recognized leader in each major asset class
$847 billion in assets under management*
– $403 billion in fixed income
– $283 billion in equity
– $86 billion in asset allocation
– $74 billion in real estate and alternatives
Client segments include: Defined Benefit Defined Contribution Non-ERISA qualified Endowments and foundations Cash and reserves Private wealth Sub-advisory Sovereigns and supranationals Insurance companies
Equity: A JPMorgan core competency for more than 50 years
*Represents assets under management as of December 31, 2005

3
Asset & Wealth Management
Retail27%
Private Client Services
18%Private Bank
30%
2005 Revenue by Business Segment
$1.1T of assets under supervision
$847B of AUM
$377B of mutual fund assets
12,127 employees
1Key Statistics1(12/31/05)
2005 ProformaOperating Results ($mm)
2005
Revenue 5,664
Pre--tax Margin 33% ROE 51%
Institutional25%
1Annual comparison
4
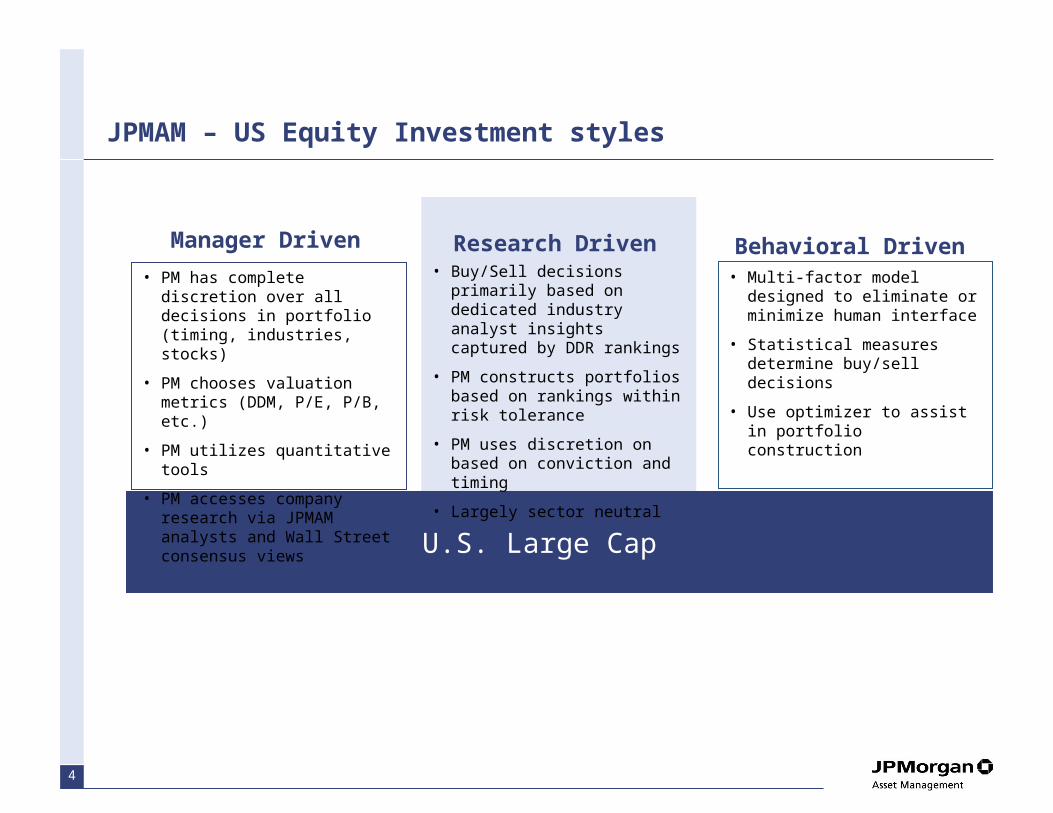
JPMAM – US Equity Investment styles
• Multi-factor model designed to eliminate or minimize human interface
• Statistical measures determine buy/sell decisions
• Use optimizer to assist in portfolio construction
Behavioral Driven• Buy/Sell decisions primarily
based on dedicated industry analyst insights captured by DDR rankings
• PM constructs portfolios based on rankings within risk tolerance
• PM uses discretion on based on conviction and timing
• Largely sector neutral
• PM has complete discretion over all decisions in portfolio (timing, industries, stocks)
• PM chooses valuation metrics (DDM, P/E, P/B, etc.)
• PM utilizes quantitative tools
• PM accesses company research via JPMAM analysts and Wall Street consensus views
Research DrivenManager Driven
U.S. Large Cap
5
Investment Philosophy and Process
6
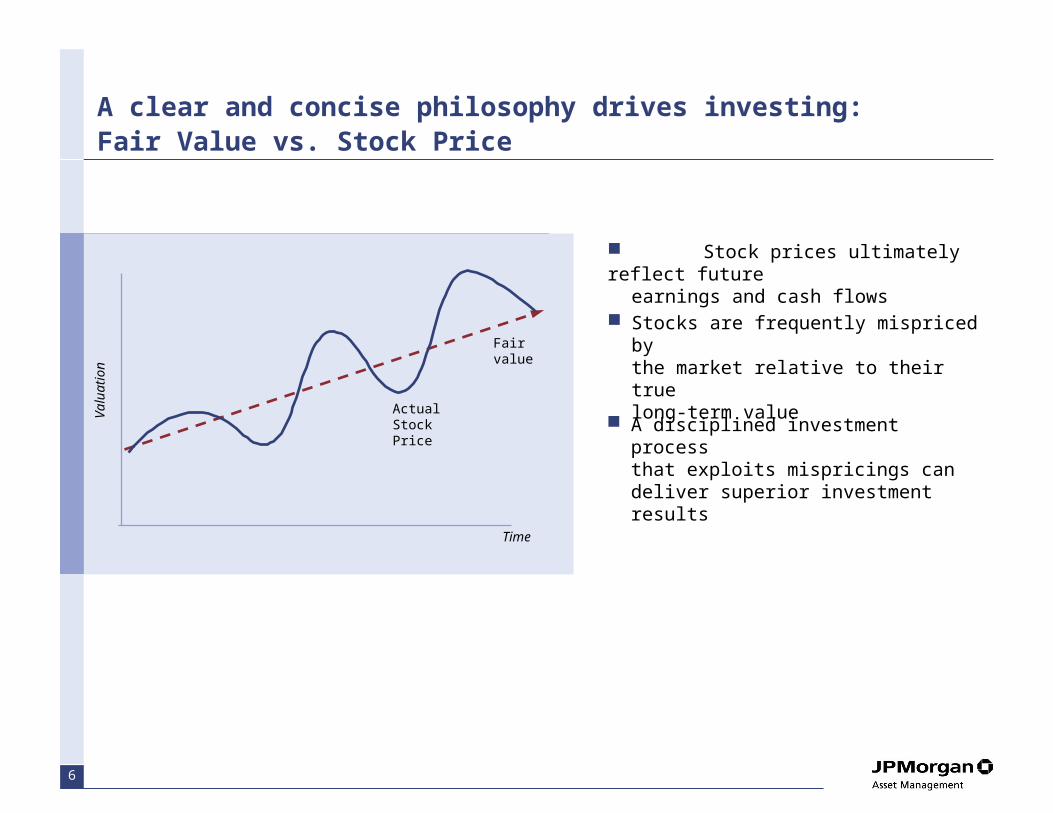
A clear and concise philosophy drives investing: Fair Value vs. Stock Price
Fair value
Actual Stock Price
Val
uatio
n
Time
Stock prices ultimately reflect future earnings and cash flows
Stocks are frequently mispriced by the market relative to their true long-term value
A disciplined investment processthat exploits mispricings can deliver superior investment results

7
Disciplined Disciplined PortfolioPortfolio
ConstructionConstruction
Information Information AdvantageAdvantage
SystematicSystematicValuationValuation
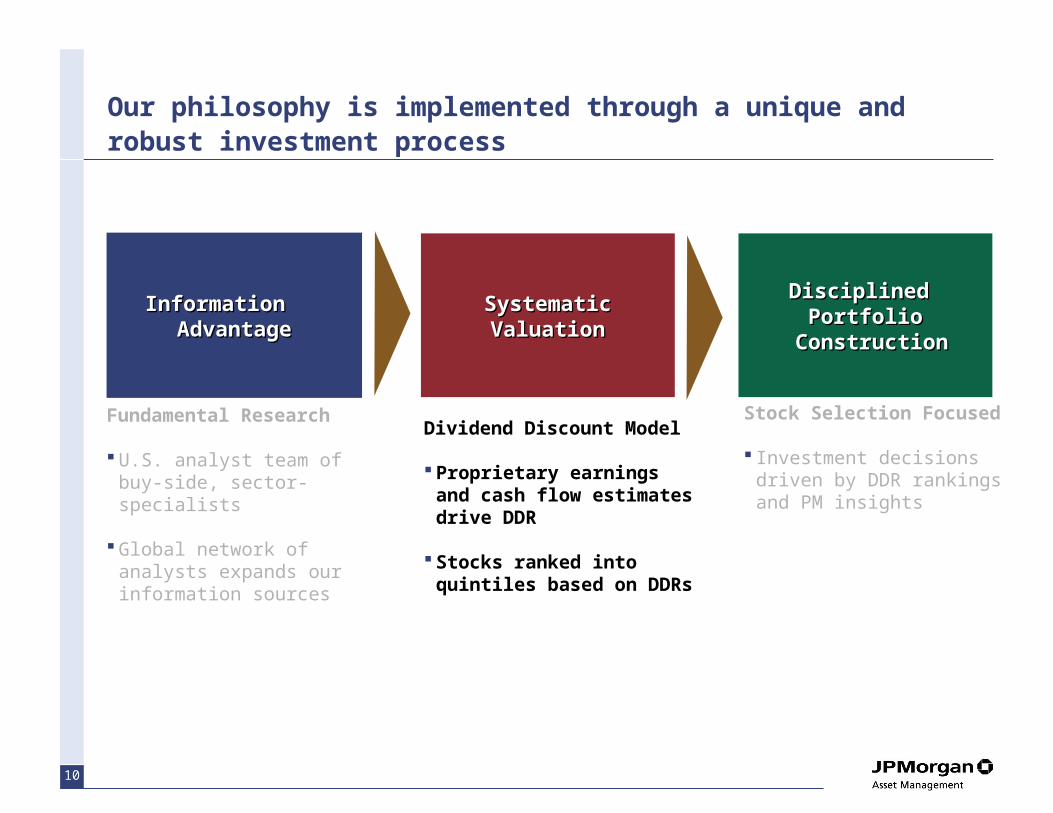
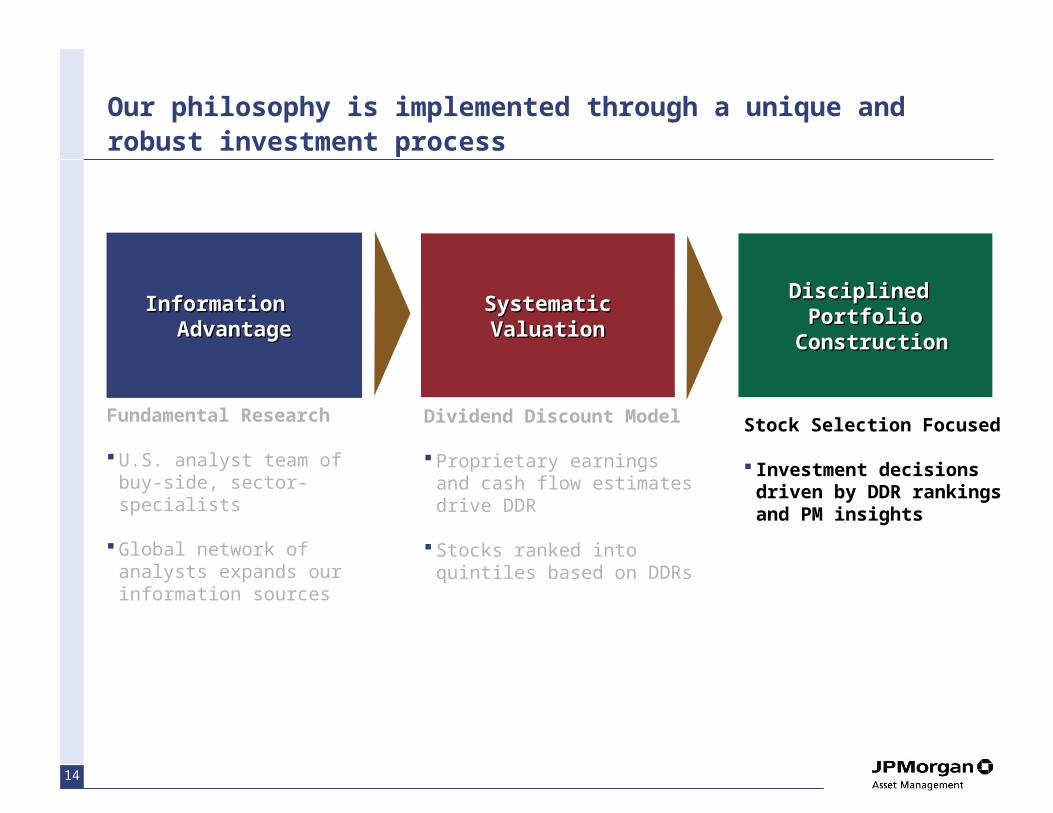
Our philosophy is implemented through a unique and robust investment process
Fundamental Research
U.S. analyst team of buy-side, sector-specialists
Global network of analysts expands our information sources
Dividend Discount Model
Proprietary earnings and cash flow estimates drive DDR
Stocks ranked into quintiles based on DDRs
Stock Selection Focused
Investment decisions driven by DDR rankings and PM insights

8
The AmericasNew York – 48 analystsBuenos Aires – 1 analystColumbus – 7 analysts
EuropeLondon – 33 analystsMoscow – 2 analysts
Asia PacificBangkok – 9 analystsHong Kong – 17 analystsMelbourne – 8 analystsSeoul – 1 analystShanghai – 4 analysts Singapore – 6 analystsTaipei – 18 analysts Tokyo – 29 analysts
*As of 12/31/05. Includes dedicated analysts and combined portfolio managers/analysts
Our global presence creates an information advantage for our clients
Global reach – 183 equity research analysts based out of 13 cities work directly with local businesses and local economies, offering a global understanding and investment insight few firms can match*.
JPMorgan equity research:
Has an annual global research expenditure of approximately $100 M
Has dedicated large, mid and small cap research teams
Dedicates their time to “on the ground” research and one-on-one company visits – totaling over 5000 company visits each year
Teams specializing in quantitative research located in Columbus and New York.

9
U.S. Large Cap Equity Research: a team of 22 skilled investors with an average of 14 years of experience
Helge Skibeli, MDDirector of Research19 yrs. of experience16 yrs. with the firm
Dr. Scott Braunstein, MDPharma/Med-Tech 15 yrs. of experience4 yrs. with the firm
Allison Adler, VPHealth Svcs/ Bio-Tech12 yrs. of experience4 yrs. with the firm
Scott Blasdell, MDREITs12 yrs. of experience7 yrs. with the firm
Kay Herr, VP REITs12 yrs. of experience7 yrs. with the firm
Robert Bowman, MDTechnology13 yrs. of experience13 yrs. with the firm
Luke Szymczak, VPNetwork Tech/Telecom19 yrs. of experience6 yrs. with the firm
Nitin Bhambhani, VPSoftware and Services12 yrs. of experience10 yrs. with the firm
Jacqueline Flake, MDCapital Markets15 yrs. of experience9 yrs. with the firm
Urmas Wompa, MDFinance23 yrs. of experience20 yrs. with the firm
Nishesh Kumar, VPEnergy9 yrs. of experience8 yrs. with the firm
Steven Lee, VPAutos and Transport13 yrs. of experience2 yrs. with the firm
Terry Shu, MDInsurance/Utilities31 yrs. of experience31 yrs. with the firm
David Pasquale, VPConsumer Cyclicals9 yrs. of experience<1 yr. with the firm
Lisa S. Sadioglu, VPConsumer Cyclicals6 yrs. of experience6 yrs. with the firm
James Brown, MDBasic Materials22 yrs. of experience19 yrs. with the firm
Christopher Carlucci, VPIndustrial Cyclicals12 yrs. of experience12 yrs. with the firm
Cyclicals
Finance, Utilities and PropertyConsumer
Technology
Media
Kathleen Stack, MDConsumer Stable28 yrs. of experience25 yrs. with the firm
Bruce Williams, VPRetail11 yrs. of experience11 yrs. with the firm
Anne-Marie Fink, VPMedia11 yrs. of experience11 yrs. with the firm
Note: MD = Managing Director; VP = Vice President, Assc = AssociateAs of February 28, 2006
Healthcare
Edward Yoon, Assc.Eye Care/Life Sciences4 yrs. of experience4 yrs. with the firm
Jason Ko, Assc.Specialty Finance4 yrs. of experience4 yrs. with the firm
Gregory Fowlkes, VPRetail12 yrs. of experience<1 yr. with the firm
10
Disciplined Disciplined PortfolioPortfolio
ConstructionConstruction
Information Information AdvantageAdvantage
SystematicSystematicValuationValuation
Our philosophy is implemented through a unique and robust investment process
Fundamental Research
U.S. analyst team of buy-side, sector-specialists
Global network of analysts expands our information sources
Dividend Discount Model
Proprietary earnings and cash flow estimates drive DDR
Stocks ranked into quintiles based on DDRs
Stock Selection Focused
Investment decisions driven by DDR rankings and PM insights

11
Systematic Valuation
Long term earnings power
Actual Forecasted
Actual near term earnings
Today
Ear
ning
s
Time
• Stock prices should reflect expectations of future earnings and cash flows
• “Normalized,” sustainable earnings reflect true investment value
12
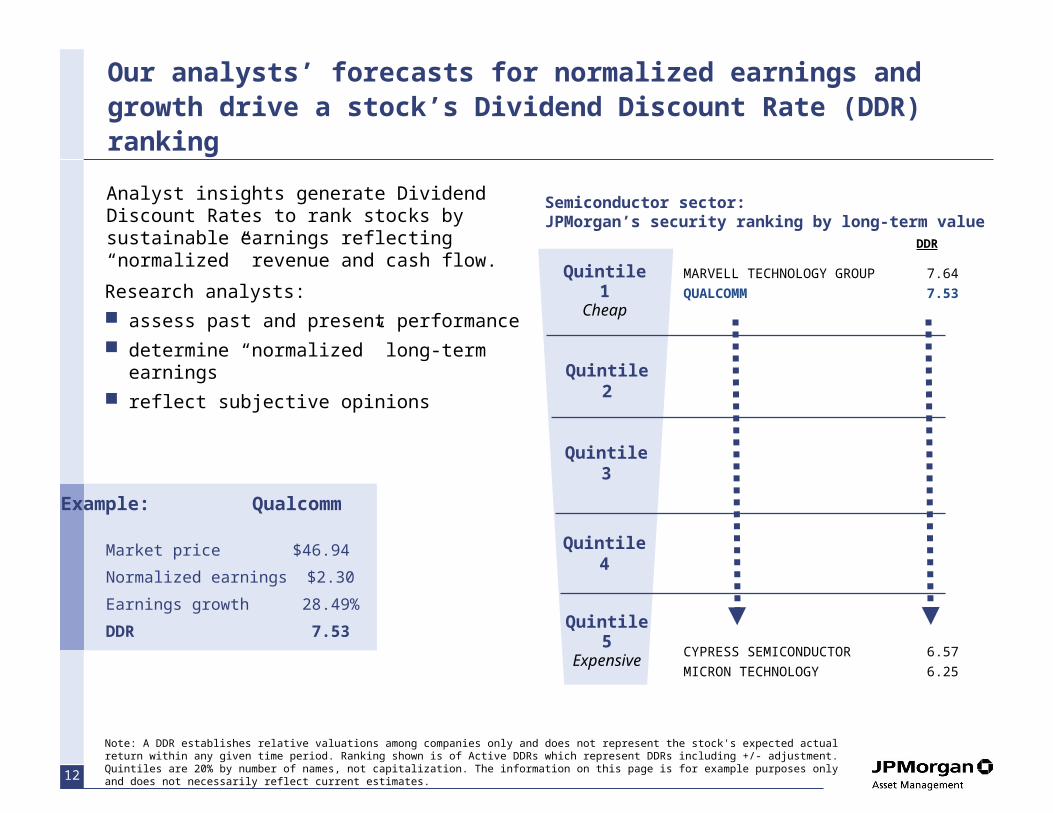
Note: A DDR establishes relative valuations among companies only and does not represent the stock's expected actual return within any given time period. Ranking shown is of Active DDRs which represent DDRs including +/- adjustment. Quintiles are 20% by number of names, not capitalization. The information on this page is for example purposes only and does not necessarily reflect current estimates.
Our analysts’ forecasts for normalized earnings and growth drive a stock’s Dividend Discount Rate (DDR) ranking
Research analysts:
assess past and present performance
determine “normalized” long-term earnings
reflect subjective opinions
Analyst insights generate Dividend Discount Rates to rank stocks by sustainable earnings reflecting “normalized” revenue and cash flow.
Example: Qualcomm
Market price $46.94
Normalized earnings $2.30
Earnings growth 28.49%
DDR 7.53
MARVELL TECHNOLOGY GROUP 7.64
QUALCOMM 7.53
CYPRESS SEMICONDUCTOR 6.57
MICRON TECHNOLOGY 6.25
Semiconductor sector: JPMorgan’s security ranking by long-term value
Quintile 2
Quintile 3
Quintile 4
Quintile 5Expensive
Quintile 1Cheap
DDR
13
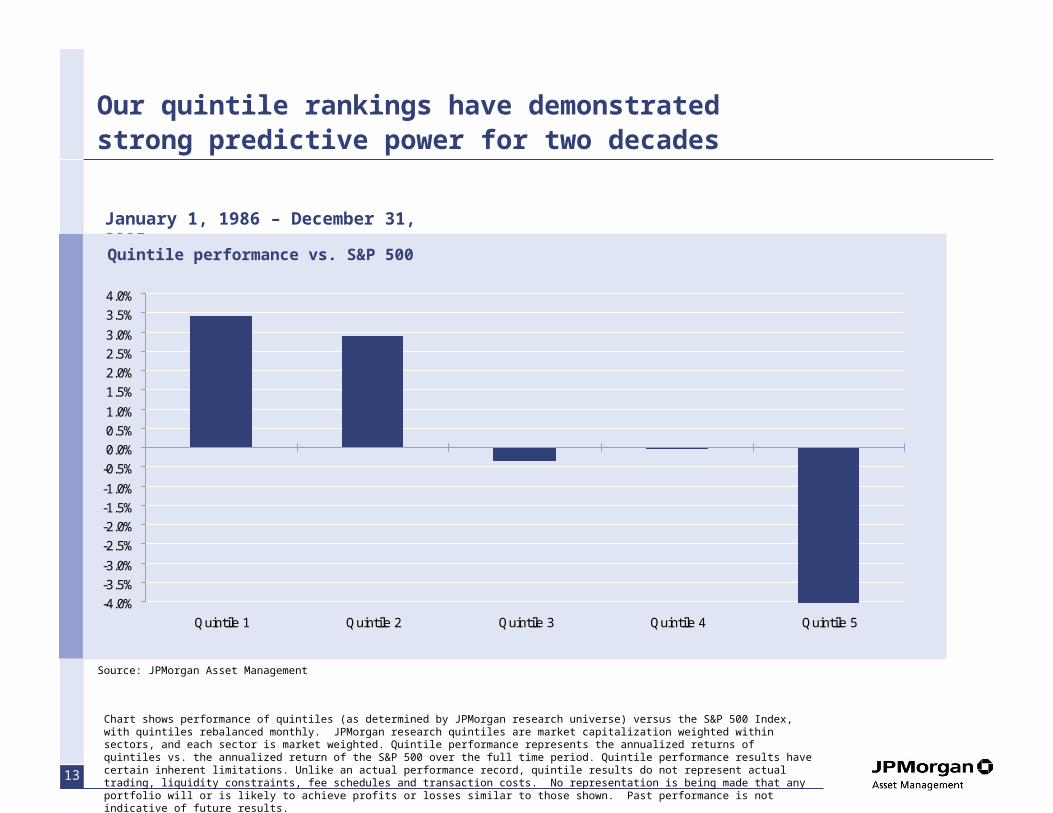
Our quintile rankings have demonstrated strong predictive power for two decades
January 1, 1986 – December 31, 2005
Quintile performance vs. S&P 500
-4.0%
-3.5%
-3.0%
-2.5%
-2.0%
-1.5%
-1.0%
-0.5%
0.0%
0.5%
1.0%
1.5%
2.0%
2.5%
3.0%
3.5%
4.0%
Quintile 1 Quintile 2 Quintile 3 Quintile 4 Quintile 5
Source: JPMorgan Asset Management
Chart shows performance of quintiles (as determined by JPMorgan research universe) versus the S&P 500 Index, with quintiles rebalanced monthly. JPMorgan research quintiles are market capitalization weighted within sectors, and each sector is market weighted. Quintile performance represents the annualized returns of quintiles vs. the annualized return of the S&P 500 over the full time period. Quintile performance results have certain inherent limitations. Unlike an actual performance record, quintile results do not represent actual trading, liquidity constraints, fee schedules and transaction costs. No representation is being made that any portfolio will or is likely to achieve profits or losses similar to those shown. Past performance is not indicative of future results.
14
Disciplined Disciplined PortfolioPortfolio
ConstructionConstruction
Information Information AdvantageAdvantage
SystematicSystematicValuationValuation
Our philosophy is implemented through a unique and robust investment process
Fundamental Research
U.S. analyst team of buy-side, sector-specialists
Global network of analysts expands our information sources
Dividend Discount Model
Proprietary earnings and cash flow estimates drive DDR
Stocks ranked into quintiles based on DDRs
Stock Selection Focused
Investment decisions driven by DDR rankings and PM insights

15
Target excess return
Targeted excess return and tracking error
0
1
2
3
4
0 1 2 3 4 5
ResearchEnhanced
Index
Research Market Neutral
Target incremental risk - tracking error
Structured strategies
Active strategies
Large Cap Core Plus, Value Plus
Large Cap Core, Value, Growth
JPMorgan’s Large Cap Research Driven U.S. Equity Strategies
Note: Targets are relative to the strategies’ respective benchmarks and are gross of fees. Expected returns are estimates based upon proprietary research. There is no guarantee that target returns will be achieved.

16Note: 36-month moving windows, computed monthly.*Large Cap Core inception: January 1, 1986.
Russell Generic Corners
Our focus on stock selection results in tight style consistency
Large Cap Core*
Manager Style January 2000 – December 2005
Zephyr StyleADVISOR
rgrowth
r2value r2growth
2Large
Value
-2 -1 0 1 2
Growth
Small -2
-1
1
0
rvalue
17
0.0%
1.0%
2.0%
3.0%
4.0%
5.0%
De
c-0
1
Ma
r-0
2
Jun
-02
Se
p-0
2
De
c-0
2
Ma
r-0
3
Jun
-03
Se
p-0
3
De
c-0
3
Ma
r-0
4
Jun
-04
Se
p-0
4
De
c-0
4
Ma
r-0
5
Jun
-05
Se
p-0
5
De
c-0
5
0.0%
1.0%
2.0%
3.0%
4.0%
5.0%
De
c-0
1
Ma
r-0
2
Jun
-02
Se
p-0
2
De
c-0
2
Ma
r-0
3
Jun
-03
Se
p-0
3
De
c-0
3
Ma
r-0
4
Jun
-04
Se
p-0
4
De
c-0
4
Ma
r-0
5
Jun
-05
Se
p-0
5
De
c-0
5
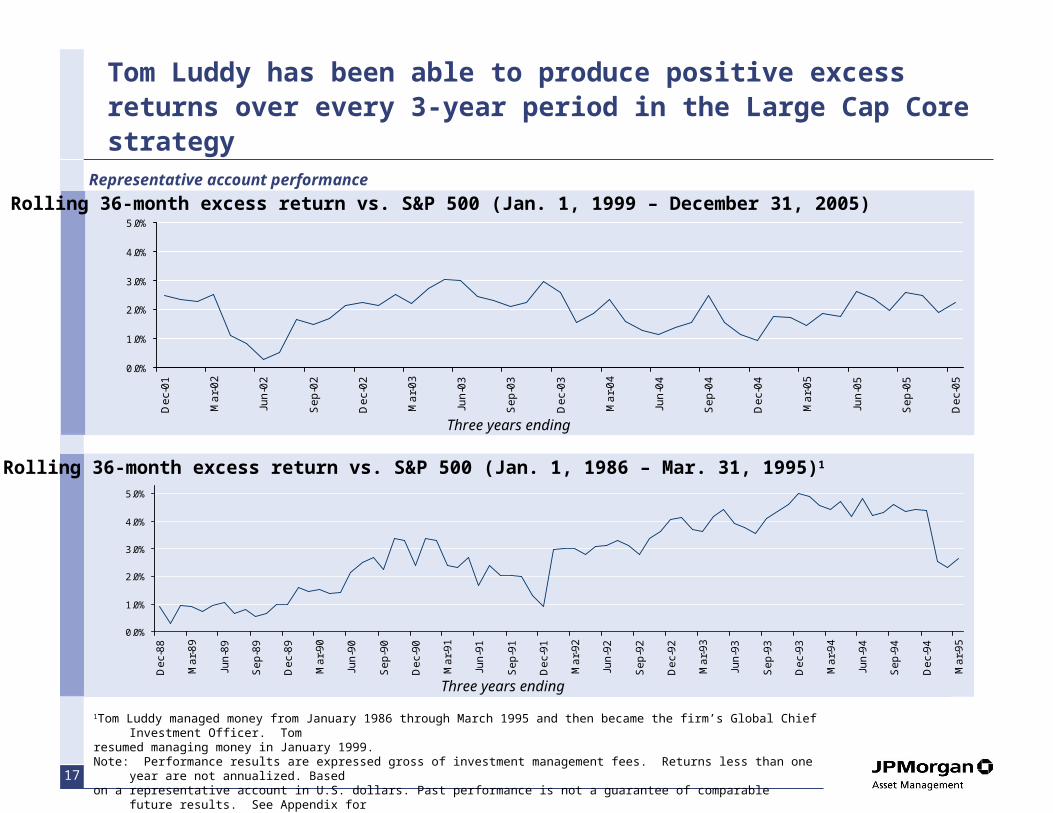
Tom Luddy has been able to produce positive excess returns over every 3-year period in the Large Cap Core strategy
1Tom Luddy managed money from January 1986 through March 1995 and then became the firm’s Global Chief Investment Officer. Tom
resumed managing money in January 1999.Note: Performance results are expressed gross of investment management fees. Returns less than one year are not annualized.
Basedon a representative account in U.S. dollars. Past performance is not a guarantee of comparable future results. See Appendix foradditional information.
Representative account performance
Rolling 36-month excess return vs. S&P 500 (Jan. 1, 1999 – December 31, 2005)
0.0%
1.0%
2.0%
3.0%
4.0%
5.0%
De
c-8
8
Ma
r-8
9
Jun
-89
Se
p-8
9
De
c-8
9
Ma
r-9
0
Jun
-90
Se
p-9
0
De
c-9
0
Ma
r-9
1
Jun
-91
Se
p-9
1
De
c-9
1
Ma
r-9
2
Jun
-92
Se
p-9
2
De
c-9
2
Ma
r-9
3
Jun
-93
Se
p-9
3
De
c-9
3
Ma
r-9
4
Jun
-94
Se
p-9
4
De
c-9
4
Ma
r-9
5
0.0%
1.0%
2.0%
3.0%
4.0%
5.0%
De
c-8
8
Ma
r-8
9
Jun
-89
Se
p-8
9
De
c-8
9
Ma
r-9
0
Jun
-90
Se
p-9
0
De
c-9
0
Ma
r-9
1
Jun
-91
Se
p-9
1
De
c-9
1
Ma
r-9
2
Jun
-92
Se
p-9
2
De
c-9
2
Ma
r-9
3
Jun
-93
Se
p-9
3
De
c-9
3
Ma
r-9
4
Jun
-94
Se
p-9
4
De
c-9
4
Ma
r-9
5
Rolling 36-month excess return vs. S&P 500 (Jan. 1, 1986 – Mar. 31, 1995)1
Three years ending
Three years ending
18
0.0%
1.0%
2.0%
3.0%
4.0%
5.0%
De
c-0
3
Ma
r-0
4
Jun
-04
Se
p-0
4
De
c-0
4
Ma
r-0
5
Jun
-05
Se
p-0
5
De
c-0
5
0.0%
1.0%
2.0%
3.0%
4.0%
5.0%
De
c-0
3
Ma
r-0
4
Jun
-04
Se
p-0
4
De
c-0
4
Ma
r-0
5
Jun
-05
Se
p-0
5
De
c-0
5
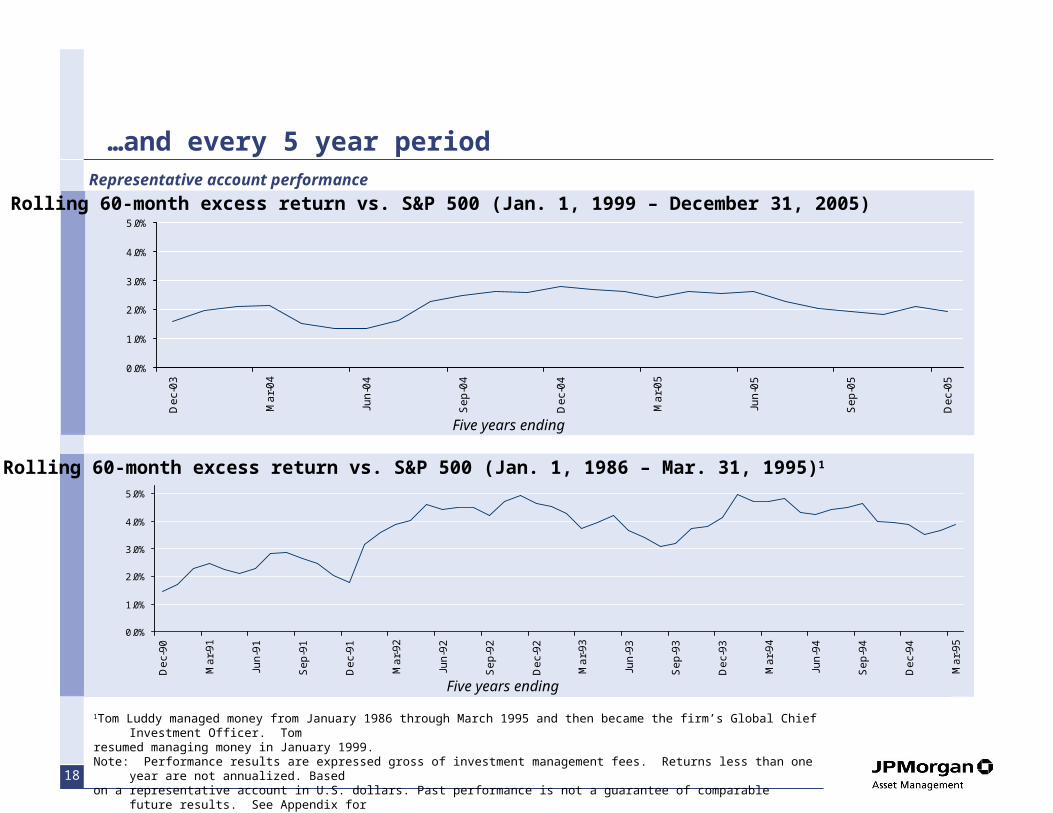
…and every 5 year period
1Tom Luddy managed money from January 1986 through March 1995 and then became the firm’s Global Chief Investment Officer. Tom
resumed managing money in January 1999.Note: Performance results are expressed gross of investment management fees. Returns less than one year are not annualized.
Basedon a representative account in U.S. dollars. Past performance is not a guarantee of comparable future results. See Appendix foradditional information.
Representative account performance
Rolling 60-month excess return vs. S&P 500 (Jan. 1, 1999 – December 31, 2005)
0.0%
1.0%
2.0%
3.0%
4.0%
5.0%
De
c-9
0
Ma
r-9
1
Jun
-91
Se
p-9
1
De
c-9
1
Ma
r-9
2
Jun
-92
Se
p-9
2
De
c-9
2
Ma
r-9
3
Jun
-93
Se
p-9
3
De
c-9
3
Ma
r-9
4
Jun
-94
Se
p-9
4
De
c-9
4
Ma
r-9
5
0.0%
1.0%
2.0%
3.0%
4.0%
5.0%
De
c-9
0
Ma
r-9
1
Jun
-91
Se
p-9
1
De
c-9
1
Ma
r-9
2
Jun
-92
Se
p-9
2
De
c-9
2
Ma
r-9
3
Jun
-93
Se
p-9
3
De
c-9
3
Ma
r-9
4
Jun
-94
Se
p-9
4
De
c-9
4
Ma
r-9
5
Rolling 60-month excess return vs. S&P 500 (Jan. 1, 1986 – Mar. 31, 1995)1
Five years ending
Five years ending
19
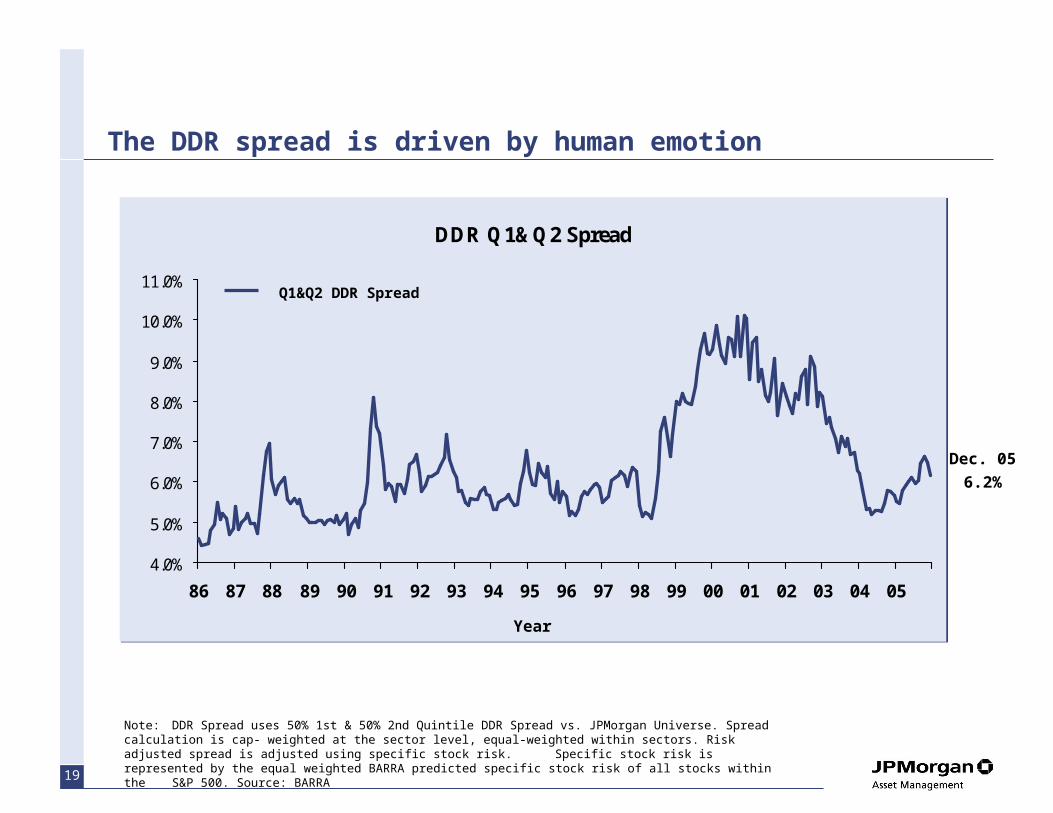
The DDR spread is driven by human emotion
DDR Q1&Q2 Spread
4.0%
5.0%
6.0%
7.0%
8.0%
9.0%
10.0%
11.0%
86 87 88 89 90 91 92 93 94 95 96 97 98 99 00 01 02 03 04 05
DDR Q1&Q2 Spread
4.0%
5.0%
6.0%
7.0%
8.0%
9.0%
10.0%
11.0%
86 87 88 89 90 91 92 93 94 95 96 97 98 99 00 01 02 03 04 05
Q1&Q2 DDR Spread
Note: DDR Spread uses 50% 1st & 50% 2nd Quintile DDR Spread vs. JPMorgan Universe. Spread calculation is cap-weighted at the sector level, equal-weighted within sectors. Risk adjusted spread is adjusted using specific stock risk. Specific stock risk is represented by the equal weighted BARRA predicted specific stock risk of all stocks within the S&P 500. Source: BARRA
Year
Dec. 05
6.2%
20
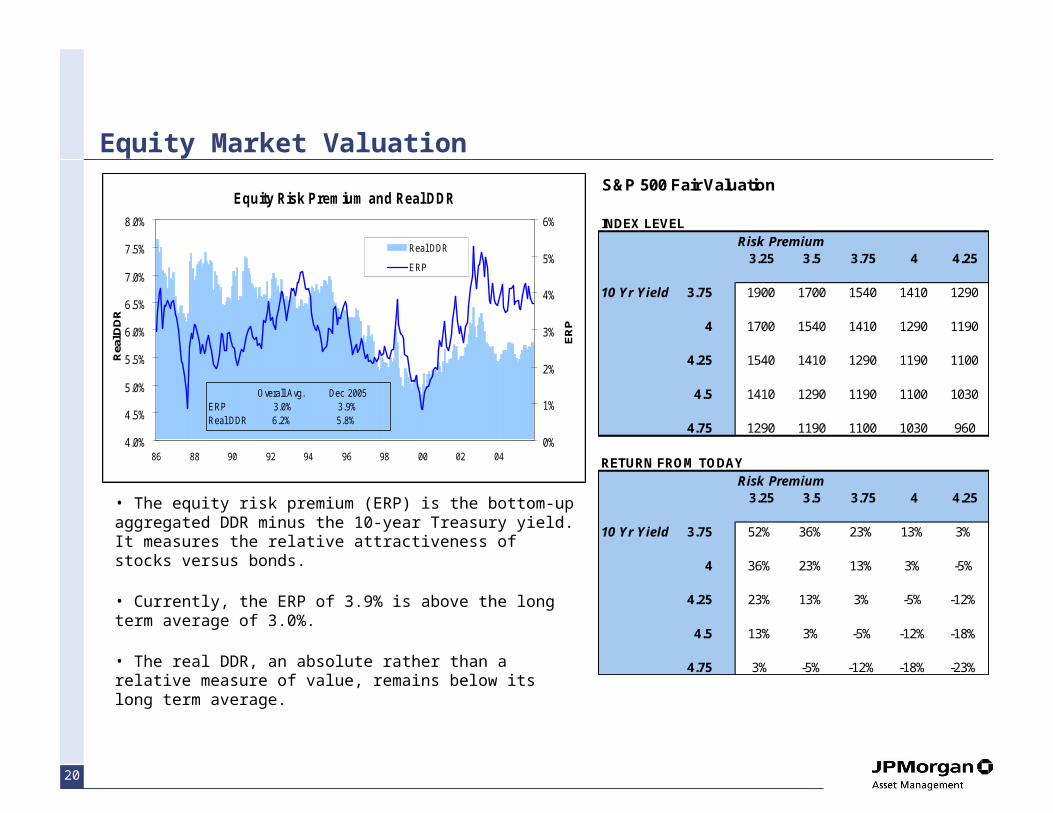
Equity Market Valuation
• The equity risk premium (ERP) is the bottom-up aggregated DDR minus the 10-year Treasury yield. It measures the relative attractiveness of stocks versus bonds.
• Currently, the ERP of 3.9% is above the long term average of 3.0%.
• The real DDR, an absolute rather than a relative measure of value, remains below its long term average.
Equity Risk Premium and Real DDR
4.0%
4.5%
5.0%
5.5%
6.0%
6.5%
7.0%
7.5%
8.0%
86 88 90 92 94 96 98 00 02 04
Rea
l DD
R
0%
1%
2%
3%
4%
5%
6%
ER
P
Real DDR
ERP
Overall Avg. Dec 2005ERP 3.0% 3.9%Real DDR 6.2% 5.8%
S&P 500 Fair Valuation
INDEX LEVELRisk Premium
3.25 3.5 3.75 4 4.25
10 Yr Yield 3.75 1900 1700 1540 1410 1290
4 1700 1540 1410 1290 1190
4.25 1540 1410 1290 1190 1100
4.5 1410 1290 1190 1100 1030
4.75 1290 1190 1100 1030 960
RETURN FROM TODAYRisk Premium
3.25 3.5 3.75 4 4.25
10 Yr Yield 3.75 52% 36% 23% 13% 3%
4 36% 23% 13% 3% -5%
4.25 23% 13% 3% -5% -12%
4.5 13% 3% -5% -12% -18%
4.75 3% -5% -12% -18% -23%

21
Large Cap Core Plus

22
With portfolio concentration, a large part of the increase in tracking error comes from potentially inadvertent bets
0%
1%
2%
3%
4%
5%
6%
7%
8%
9%
10%
350 325 300 275 250 225 200 175 150 125 100 75 50 25
Number of stocks in portfolio
Ann
ualiz
ed t
rack
ing
erro
r
Assumptions: Used current weights of stocks in the S&P 500. Index weight each of the “n” names in the portfolio, then overweight each of those names by the same amount to complete the portfolio. 2,000 trials of 36 one-month periods. For stock-specific risk only example, 25% annualized standard deviation for all stocks. For hypothetical including common factor risk, volatility added to produce a maximum of 10% TE, and a similar logarithmic increase.For demonstration purposes only.
Stock specific component
Co
mm
on
Fa
cto
r
Total tracking error

23
Our quintile rankings have demonstrated strong predictive power for two decades
January 1, 1986 – December 31, 2005
Quintile performance vs. S&P 500
-4.0%
-3.5%
-3.0%
-2.5%
-2.0%
-1.5%
-1.0%
-0.5%
0.0%
0.5%
1.0%
1.5%
2.0%
2.5%
3.0%
3.5%
4.0%
Quintile 1 Quintile 2 Quintile 3 Quintile 4 Quintile 5
Source: JPMorgan Asset Management
Chart shows performance of quintiles (as determined by JPMorgan research universe) versus the S&P 500 Index, with quintiles rebalanced monthly. JPMorgan research quintiles are market capitalization weighted within sectors, and each sector is market weighted. Quintile performance represents the annualized returns of quintiles vs. the annualized return of the S&P 500 over the full time period. Quintile performance results have certain inherent limitations. Unlike an actual performance record, quintile results do not represent actual trading, liquidity constraints, fee schedules and transaction costs. No representation is being made that any portfolio will or is likely to achieve profits or losses similar to those shown. Past performance is not indicative of future results.

24
But long-only investing discards almost half of the manager’s insights, and can additionally result in inefficient use of capital
Long-only investing fails to exploit most of the manager’s insights into potential underperformers
0.0%
0.5%
1.0%
1.5%
2.0%
2.5%
3.0%
3.5%
4.0%
S&P 500
The 16th largest S&P 500 stock is 1% of the index
0 100 200 300 400 500
Nth largest stock
Inde
x W
eig
ht

25
By expanding the opportunity set to capture insights in unattractive stocks we can generate higher alpha
January 1, 1986 – December 31, 2005
Quintile performance vs. S&P 500
Source: JPMorgan Asset Management
Chart shows performance of quintiles (as determined by JPMorgan research universe) versus the S&P 500 Index, with quintiles rebalanced monthly. JPMorgan research quintiles are market capitalization weighted within sectors, and each sector is market weighted. Quintile performance represents the annualized returns of quintiles vs. the annualized return of the S&P 500 Index over the full time period. Quintile performance results have certain inherent limitations. Unlike an actual performance record, quintile results do not represent actual trading, liquidity constraints, fee schedules and transaction costs. No representation is being made that any portfolio will or is likely to achieve profits or losses similar to those shown. Past performance is not indicative of future results.
-6%
-4%
-2%
0%
2%
4%
6%
Quintile 1 Quintile 2 Quintile 3 Quintile 4 Quintile 5
plus

26
Obvious application: Using insights into overvalued stocks, a manager can add performance through shorting
$10
$20
$30
$40
$50
$60
Jan
-03
Ap
r-0
3
Jul-
03
Oct
-03
Jan
-04
Ap
r-0
4
Jul-
04
Oct
-04
Jan
-05
Ap
r-0
5
Jul-
05
$10
$20
$30
$40
$50
$60
Jan
-03
Ap
r-0
3
Jul-
03
Oct
-03
Jan
-04
Ap
r-0
4
Jul-
04
Oct
-04
Jan
-05
Ap
r-0
5
Jul-
05
Example: Georgia Gulf(0.00% of the S&P 500)
…to exploit an alpha source
Short
Sources: Bloomberg, JPMorgan Asset Management
27
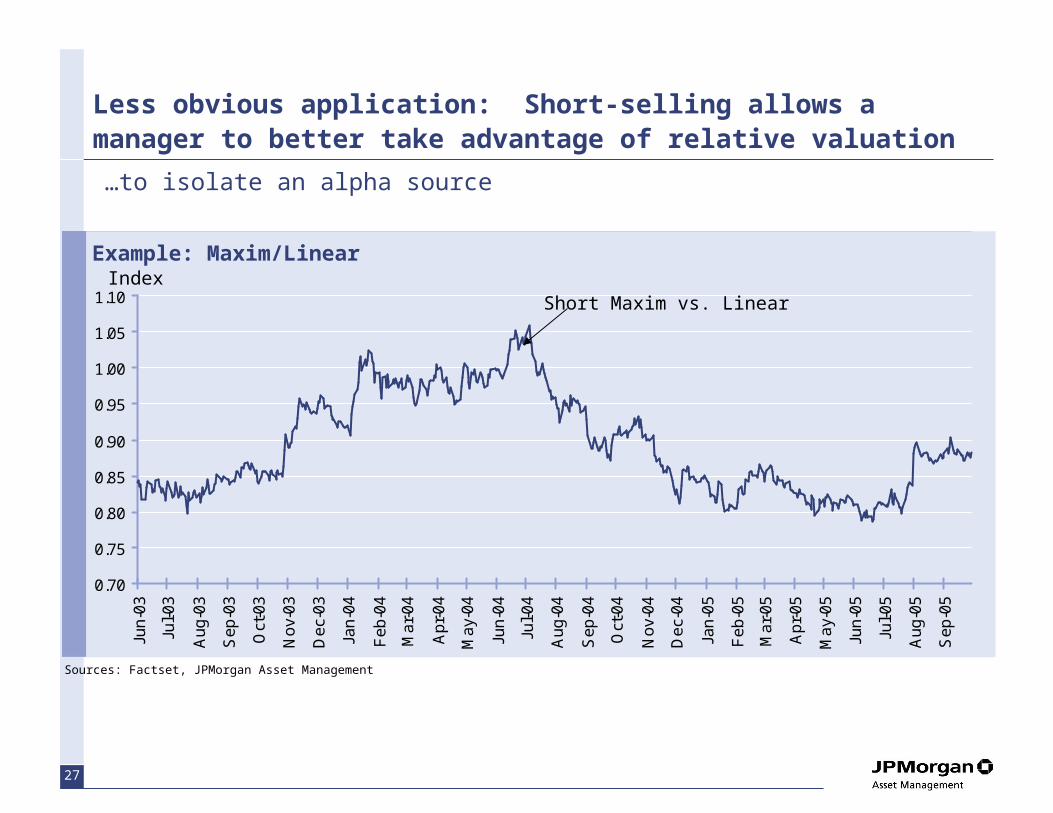
Less obvious application: Short-selling allows a manager to better take advantage of relative valuation
0.70
0.75
0.80
0.85
0.90
0.95
1.00
1.05
1.10
Jun
-03
Jul-
03
Au
g-0
3
Se
p-0
3
Oct
-03
No
v-0
3
De
c-0
3
Jan
-04
Fe
b-0
4
Ma
r-0
4
Ap
r-0
4
Ma
y-0
4
Jun
-04
Jul-
04
Au
g-0
4
Se
p-0
4
Oct
-04
No
v-0
4
De
c-0
4
Jan
-05
Fe
b-0
5
Ma
r-0
5
Ap
r-0
5
Ma
y-0
5
Jun
-05
Jul-
05
Au
g-0
5
Se
p-0
5
0.70
0.75
0.80
0.85
0.90
0.95
1.00
1.05
1.10
Jun
-03
Jul-
03
Au
g-0
3
Se
p-0
3
Oct
-03
No
v-0
3
De
c-0
3
Jan
-04
Fe
b-0
4
Ma
r-0
4
Ap
r-0
4
Ma
y-0
4
Jun
-04
Jul-
04
Au
g-0
4
Se
p-0
4
Oct
-04
No
v-0
4
De
c-0
4
Jan
-05
Fe
b-0
5
Ma
r-0
5
Ap
r-0
5
Ma
y-0
5
Jun
-05
Jul-
05
Au
g-0
5
Se
p-0
5
Example: Maxim/Linear
…to isolate an alpha source
IndexShort Maxim vs. Linear
Sources: Factset, JPMorgan Asset Management

28
3.3%
JCI Short OEMs
3.3%
JCI Short OEMs
3.3%
JCI
3.3%
JCI
0.5%
Autos weight
0.5%
Autos weight
…and hedge against uncertain macro-economic trends
S&P 500
Source: JPMorgan Asset Management. There is no guarantee that the use of long and short positions will succeed in limiting the fund’s exposure to domestic stock market movements, capitalization, sector swings or other risk factors. Investment in a portfolio involved in long and short selling may have higher portfolio turnover rates. This will likely result in additional tax consequences. Short selling involves certain risks, including additional costs associated with covering short positions and a possibility of unlimited loss on certain short sale positions.
Example: Johnson Controls Inc. (auto parts manufacturer)
“Best ideas” portfolioPortfolio with relaxed short constraint
-2.8%
29
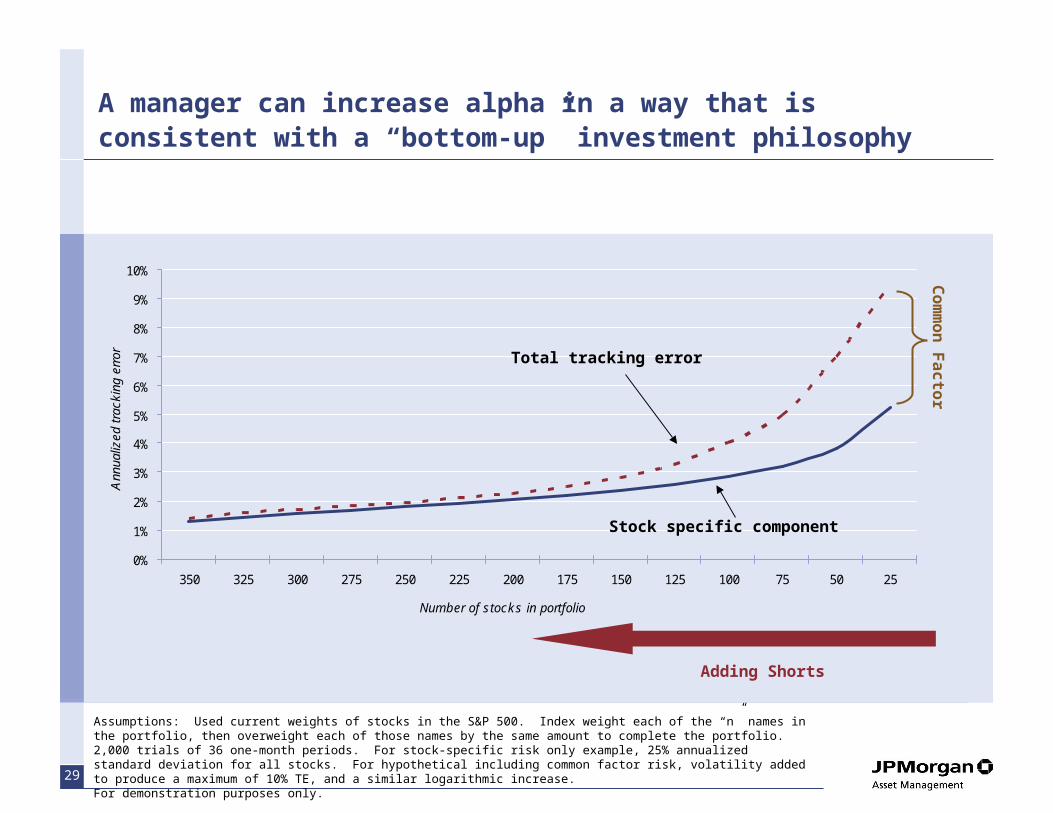
A manager can increase alpha in a way that is consistent with a “bottom-up” investment philosophy
0%
1%
2%
3%
4%
5%
6%
7%
8%
9%
10%
350 325 300 275 250 225 200 175 150 125 100 75 50 25
Number of stocks in portfolio
Ann
ualiz
ed t
rack
ing
erro
r
Assumptions: Used current weights of stocks in the S&P 500. Index weight each of the “n” names in the portfolio, then overweight each of those names by the same amount to complete the portfolio. 2,000 trials of 36 one-month periods. For stock-specific risk only example, 25% annualized standard deviation for all stocks. For hypothetical including common factor risk, volatility added to produce a maximum of 10% TE, and a similar logarithmic increase.For demonstration purposes only.
Stock specific component
Co
mm
on
Fa
cto
r
Total tracking error
Adding Shorts
30
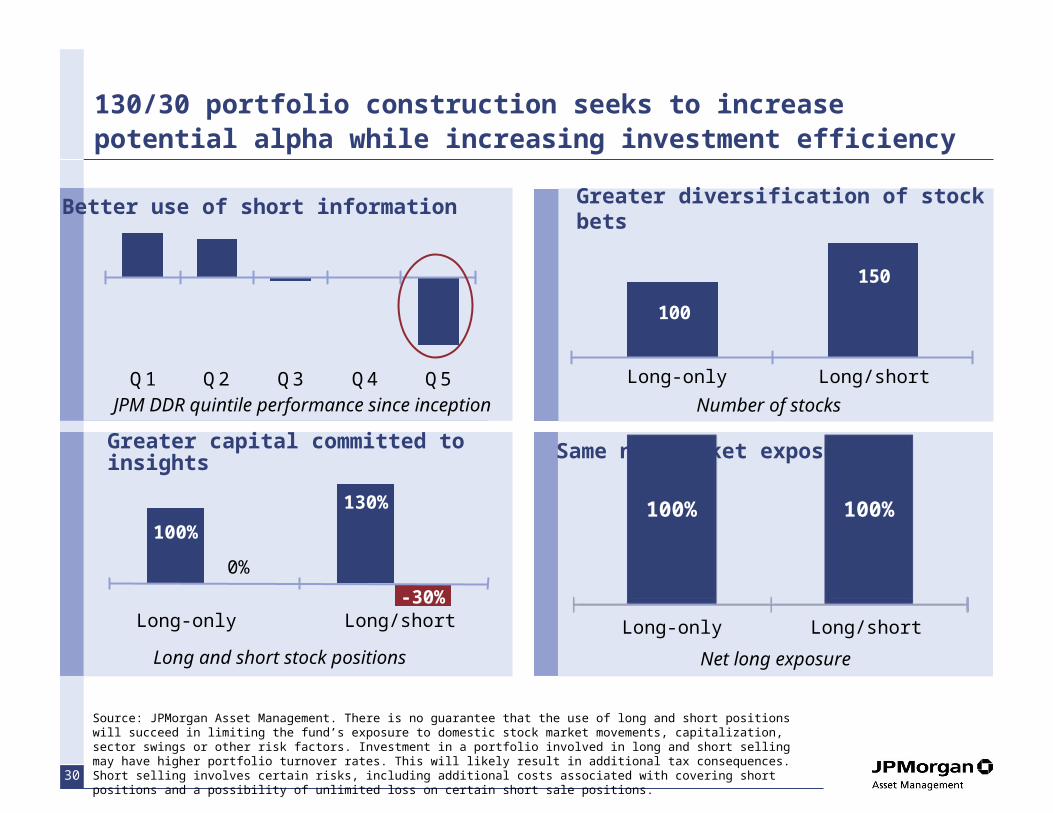
130/30 portfolio construction seeks to increase potential alpha while increasing investment efficiency
Source: JPMorgan Asset Management. There is no guarantee that the use of long and short positions will succeed in limiting the fund’s exposure to domestic stock market movements, capitalization, sector swings or other risk factors. Investment in a portfolio involved in long and short selling may have higher portfolio turnover rates. This will likely result in additional tax consequences. Short selling involves certain risks, including additional costs associated with covering short positions and a possibility of unlimited loss on certain short sale positions.
100
150
JPM DDR quintile performance since inception
Q1 Q2 Q3 Q4 Q5
Net long exposure
100% 100%
Greater capital committed to insights Same net market exposure
Greater diversification of stock betsBetter use of short information
Number of stocks
Long and short stock positions
130%
100%
-30%
0%
Long-only Long/short Long-only Long/short
Long-only Long/short
31
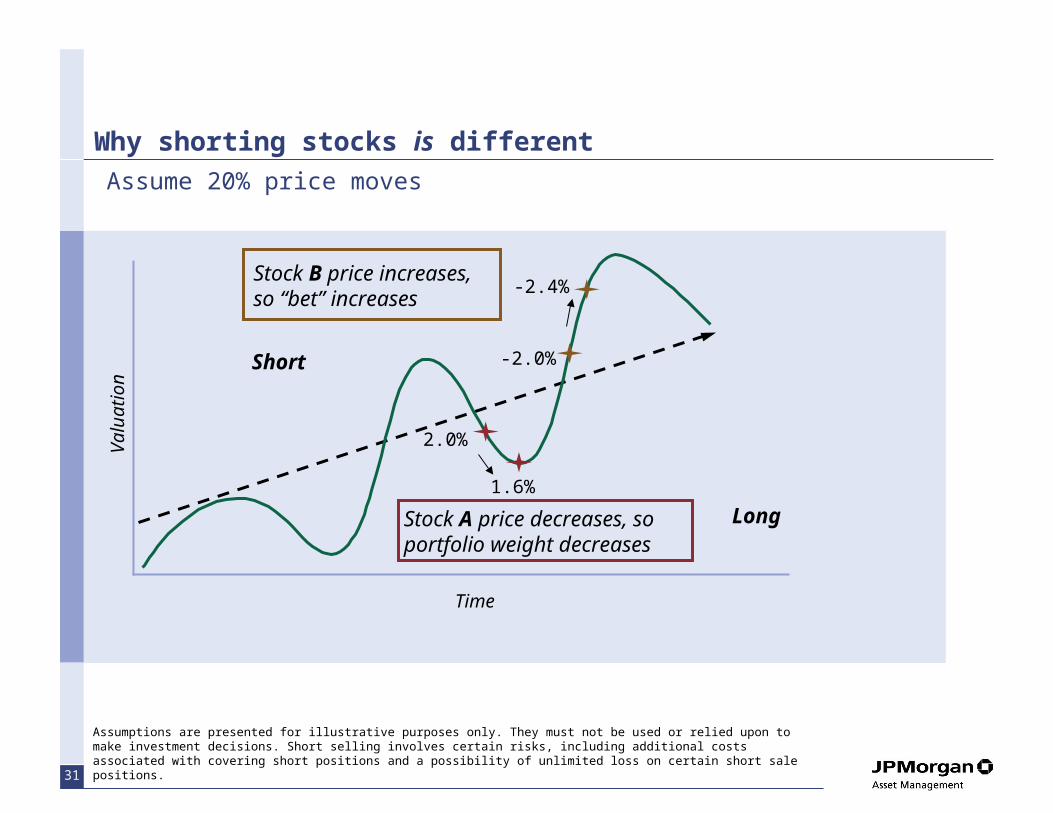
Why shorting stocks is different
2.0%
1.6%
-2.0%
-2.4%Stock B price increases, so “bet” increases
Long
Short
Stock A price decreases, so portfolio weight decreases
Time
Val
uat
ion
Assumptions are presented for illustrative purposes only. They must not be used or relied upon to make investment decisions. Short selling involves certain risks, including additional costs associated with covering short positions and a possibility of unlimited loss on certain short sale positions.
Assume 20% price moves

32
This document is intended solely to report on various investment views held by JPMorgan Asset Management. Opinions, estimates, forecasts, and statements of financial market trends that are based on current market conditions constitute our judgment and are subject to change without notice. We believe the information provided here is reliable but should not be assumed to be accurate or complete. The views and strategies described may not be suitable for all investors. References to specific securities, asset classes and financial markets are for illustrative purposes only and are not intended to be, and should not be interpreted as, recommendations. Indices do not include fees or operating expenses and are not available for actual investment. The information contained herein employs proprietary projections of expected returns as well as estimates of their future volatility. The relative relationships and forecasts contained herein are based upon proprietary research and are developed through analysis of historical data and capital markets theory. These estimates have certain inherent limitations, and unlike an actual performance record, they do not reflect actual trading, liquidity constraints, fees or other costs. References to future net returns are not promises or even estimates of actual returns a client portfolio may achieve. The forecasts contained herein are for illustrative purposes only and are not to be relied upon as advice or interpreted as a recommendation.
The value of investments and the income from them may fluctuate and your investment is not guaranteed. Past performance is no guarantee of future results. Please note current performance may be higher or lower than the performance data shown. Please note that investments in foreign markets are subject to special currency, political, and economic risks. Exchange rates may cause the value of underlying overseas investments to go down or up. Investments in emerging markets may be more volatile than other markets and the risk to your capital is therefore greater. Also, the economic and political situations may be more volatile than in established economies and these may adversely influence the value of investments made.
Performance results are gross of investment management fees. The deduction of an advisory fee reduces an investor’s return. Actual account performance will vary depending on individual portfolio security selection and the applicable fee schedule. Fees are available upon request.
JPMorgan Asset Management
The following is an example of the effect of compounded advisory fees over a period of time on the value of a client’s portfolio: A portfolio with a beginning value of $100 million, gaining an annual return of 10% per annum would grow to $259 million after 10 years, assuming no fees have been paid out. Conversely, a portfolio with a beginning value of $100 million, gaining an annual return of 10% per annum, but paying a fee of 1% per annum, would only grow to $235 million after 10 years. The annualized returns over the 10 year time period are 10.00% (gross of fees) and 8.91% (net of fees). If the fee in the above example was 0.25% per annum, the portfolio would grow to $253 million after 10 years and return 9.73% net of fees. The fees were calculated on a monthly basis, which shows the maximum effect of compounding.
Illustration showing impact of investment management fees: An investment of USD $1,000,000 under the management of JPMAM achieves a 10% compounded gross annual return for 10 years. If a management fee of 0.75% of average assets under management were charged per year for the 10-year period, the annual return would be 9.25% and the value of assets would be USD $2,422,225 net of fees, compared with USD $2,593,742 gross of fees. Therefore, the investment management fee, and any other expenses incurred in the management of the portfolio, will reduce the client’s return.
The securities mentioned throughout the presentation are shown for illustrative purposes only and should not be interpreted as recommendations to buy or sell. A full list of firm recommendations for the past year is available upon request.
JPMorgan Asset Management is the marketing name for the asset management businesses of JPMorgan Chase & Co. and its affiliates worldwide.
Copyright 2006 JPMorgan Chase & Co. All rights reserved.


![[Webinar] The growth playbook from $0 to $1 billion - with Mike Volpe](https://static.cupdf.com/doc/110x72/58ec9e981a28ab8a4b8b473b/webinar-the-growth-playbook-from-0-to-1-billion-with-mike-volpe.jpg)


