University of South Florida Scholar Commons Graduate eses and Dissertations Graduate School 11-4-2016 You’re Not What I Expected: Expectancy Violations and Performance Ratings Britany Telford University of South Florida, [email protected] Follow this and additional works at: hp://scholarcommons.usf.edu/etd Part of the Psychology Commons is esis is brought to you for free and open access by the Graduate School at Scholar Commons. It has been accepted for inclusion in Graduate eses and Dissertations by an authorized administrator of Scholar Commons. For more information, please contact [email protected]. Scholar Commons Citation Telford, Britany, "You’re Not What I Expected: Expectancy Violations and Performance Ratings" (2016). Graduate eses and Dissertations. hp://scholarcommons.usf.edu/etd/6593

Welcome message from author
This document is posted to help you gain knowledge. Please leave a comment to let me know what you think about it! Share it to your friends and learn new things together.
Transcript

University of South FloridaScholar Commons
Graduate Theses and Dissertations Graduate School
11-4-2016
You’re Not What I Expected: ExpectancyViolations and Performance RatingsBritany TelfordUniversity of South Florida, [email protected]
Follow this and additional works at: http://scholarcommons.usf.edu/etd
Part of the Psychology Commons
This Thesis is brought to you for free and open access by the Graduate School at Scholar Commons. It has been accepted for inclusion in GraduateTheses and Dissertations by an authorized administrator of Scholar Commons. For more information, please contact [email protected].
Scholar Commons CitationTelford, Britany, "You’re Not What I Expected: Expectancy Violations and Performance Ratings" (2016). Graduate Theses andDissertations.http://scholarcommons.usf.edu/etd/6593

You’re Not What I Expected:
Expectancy Violations and Performance Ratings
by
Britany N. Telford
A thesis submitted in partial fulfillment
of the requirements for the degree of
Doctor of Philosophy
with a concentration in Research Methodology
Department of Psychology
College of Arts and Sciences
University of South Florida
Major Professor: Walter Borman, Ph.D.
Michael Coovert, Ph.D.
Sandra Schneider, Ph.D.
Date of Approval:
September 9, 2016
Keywords: Performance Appraisal, Job Performance, Expectancy Violation, Bias, OCB
Copyright © 2016, Britany N. Telford

DEDICATION
To my family for their unwavering support and encouragement. This thesis, as well as everything
else I have accomplished, would never have been possible without you.

ACKNOWLEDGEMENTS
First, I would like to thank Dr. Wally Borman for his invaluable support, advice, and editing. I
would also like the thank Drs. Mike Coovert and Sandy Schneider for their guidance throughout
this project.
i
TABLE OF CONTENTS
List of Tables iii
List of Figures iv
Abstract v
Chapter One: Introduction 1
Expectancy Violations 2
Performance Appraisal 6
Chapter Two: Study 1 9
Introduction 9
Job Performance 11
Method 13
Participants 13
Materials 14
Vignette Development 14
Pre and Post Task Performance Appraisal 16
Expectation Violation 16
Reward Recommendation 17
Demographics 17
Procedure 17
Results 18
Discussion 22
Chapter Three: Study 2 24
Organizational Citizenship Behavior 24
Method 27
Participants 27
Materials 28
Vignette Development 28
Pre and Post OCB Performance Appraisal 29
Expectation Violation 29
Reward Recommendations 29
Demographics 29
Results 30
Discussion 33
Chapter 4: General Discussion 35

ii
Limitations and Future Research 36
Conclusions 38
References 39
Appendices 47
Appendix A: OCB Scale 48
Appendix B: Example Performance Vignettes 50
Appendix C: Task Performance Appraisal 53
Appendix D: Violation Scales 54
Appendix E: Reward Recommendations 55
Appendix F: Demographics 56
Appendix G: Treatment Groups 57
Appendix H: Introduction Story 58
Appendix I: Hypotheses 59
Appendix J: IRB Approval Letter 60

iii
LIST OF TABLES
Table 1: Study 1 Demographics by Condition 14
Table 2: Study 1 Vignette Descriptive Statistics 16
Table 3: Study 2 Demographics by Condition 27
Table 4: Study 2 Vignette Descriptive Statistics 28
iv
LIST OF FIGURES
Figure 1: The interaction between pre-hire and on-the-job task performance on violation
of expectation 20
Figure 2: The interaction between pre-hire and on-the-job task performance on task
performance ratings 21
Figure 3: The interaction between pre-hire and on-the-job task performance on reward
recommendations 21
Figure 4: The interaction between pre-hire and on-the-job OCB on expectation
violations 32
Figure 5: The interaction between pre-hire and on-the-job OCB on OCB ratings 32
Figure 6: The interaction between pre-hire and on-the-job OCB on reward
recommendations 33
v
ABSTRACT
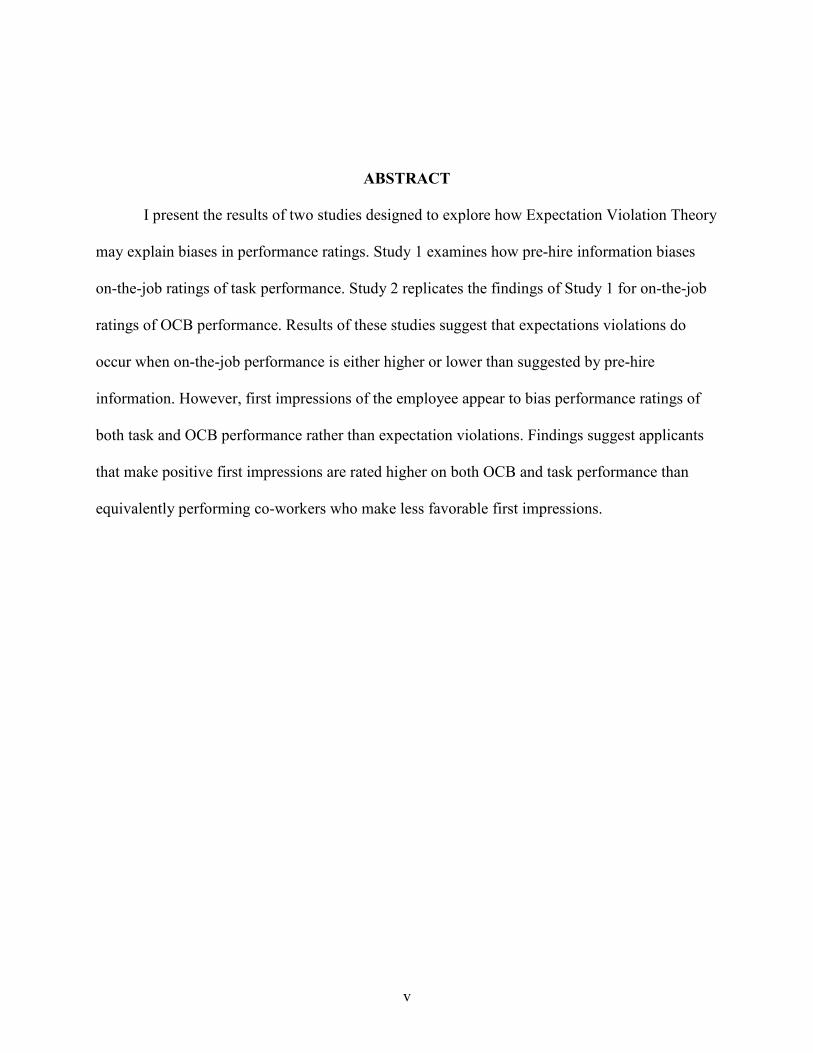
I present the results of two studies designed to explore how Expectation Violation Theory
may explain biases in performance ratings. Study 1 examines how pre-hire information biases
on-the-job ratings of task performance. Study 2 replicates the findings of Study 1 for on-the-job
ratings of OCB performance. Results of these studies suggest that expectations violations do
occur when on-the-job performance is either higher or lower than suggested by pre-hire
information. However, first impressions of the employee appear to bias performance ratings of
both task and OCB performance rather than expectation violations. Findings suggest applicants
that make positive first impressions are rated higher on both OCB and task performance than
equivalently performing co-workers who make less favorable first impressions.

1
CHAPTER ONE:
INTRODUCTION
“Expectations are premeditated resentments” (Anonymous, n.d.). This anonymous
quote expresses the impact of expectancy violations. We presume our expectations will
be met and dislike when reality falls short of these expectations. This phenomenon of
human nature is not abandoned when we enter the workplace and is particularly
applicable to job performance. Ambady and Rosenthal’s (1992) work demonstrated that
interviewers form an opinion of interviewees within seconds of meeting them.
Additionally, managers begin to form opinions and expectations about new hires before
they even arrive, based on sources such as the new hire’s recommendation letters, resume
or interview (Brown & Campion, 1994). However, the fact that a new employee’s
performance after hire may surpass, meet, or fall short of the manager’s pre-hire
expectations is seldom discussed. Using expectancy violation theory (EVT; Burgoon &
Jones, 1976) I investigate how the discrepancy between expected and actual performance
predicts both the supervisor’s ratings of the employee’s performance and supervisor’s
reward recommendations for the employee. This is of practical interest because
supervisors are gatekeepers for organizational decisions such as promotions, raises, and
terminations. Thus, a supervisor’s biased rating of the employee’s performance may have
large consequences for both the employee and the organization.
2
Expectancy Violations
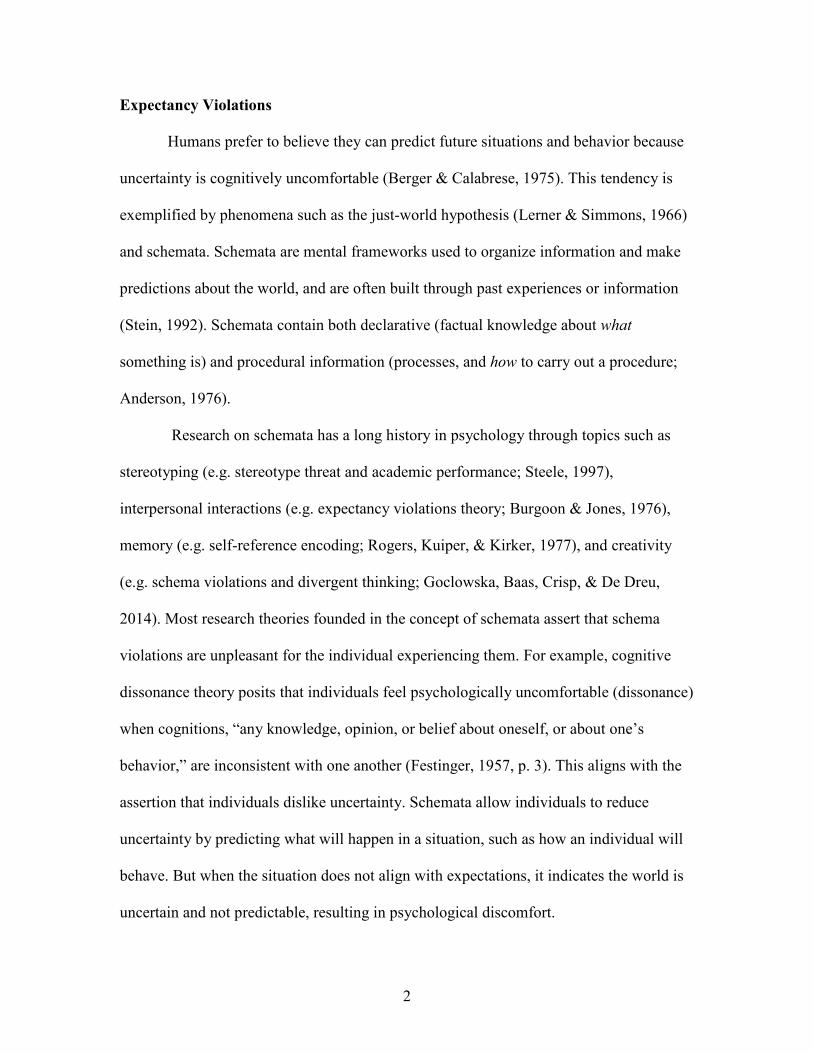
Humans prefer to believe they can predict future situations and behavior because
uncertainty is cognitively uncomfortable (Berger & Calabrese, 1975). This tendency is
exemplified by phenomena such as the just-world hypothesis (Lerner & Simmons, 1966)
and schemata. Schemata are mental frameworks used to organize information and make
predictions about the world, and are often built through past experiences or information
(Stein, 1992). Schemata contain both declarative (factual knowledge about what
something is) and procedural information (processes, and how to carry out a procedure;
Anderson, 1976).
Research on schemata has a long history in psychology through topics such as
stereotyping (e.g. stereotype threat and academic performance; Steele, 1997),
interpersonal interactions (e.g. expectancy violations theory; Burgoon & Jones, 1976),
memory (e.g. self-reference encoding; Rogers, Kuiper, & Kirker, 1977), and creativity
(e.g. schema violations and divergent thinking; Goclowska, Baas, Crisp, & De Dreu,
2014). Most research theories founded in the concept of schemata assert that schema
violations are unpleasant for the individual experiencing them. For example, cognitive
dissonance theory posits that individuals feel psychologically uncomfortable (dissonance)
when cognitions, “any knowledge, opinion, or belief about oneself, or about one’s
behavior,” are inconsistent with one another (Festinger, 1957, p. 3). This aligns with the
assertion that individuals dislike uncertainty. Schemata allow individuals to reduce
uncertainty by predicting what will happen in a situation, such as how an individual will
behave. But when the situation does not align with expectations, it indicates the world is
uncertain and not predictable, resulting in psychological discomfort.

3
Within the interpersonal domain, schemata allow individuals to form expectations
about how they and others should behave in interactions and relationships. For example,
expectancy violation theory (EVT; Burgoon & Jones, 1976; Burgoon, 1993), a theory
founded on the concept of schemata, utilizes them to demonstrate how people both form
expectations and react to violations of expectations. EVT has three central tenants:
expectations, violations, and valence. According to EVT, individuals form expectations,
predictable behaviors that can be attributed to a situation or individual (Burgoon, 1993).
These expectations may be based in social norms or born out of previous interactions
(Burgoon, 1993). Individuals use their expectations to reduce the ambiguity of future
situations or interpersonal encounters. For example, my co-worker generally responds to
emails within 24 hours. Based on my perception of his past performance, when I send an
email to my co-worker, I expect him to respond within 24 hours.
The second tenant of EVT, violations, occurs when an individual behaves in a
way that is contrary to expectations. For example, my co-worker generally responds to
emails within 24 hours, but took one week to respond to my most recent email. His late
response is a behavior that does not align with my expectation, thus is a violation. This
violation then leads to a judgment of the violator (Floyd & Voloudakis, 1999). This
judgment can be positive, (i.e., pleasant surprise after a spouse’s atypical show of
devotion) or negative (i.e., displeasure when your spouse arrives home later than usual
and misses dinner; Afifi & Mett, 1998). Thus, violations have a valence, specifically a
positive or negative violation valence, which is assigned after a breach in expectation
occurs.

4
EVT was originally proposed to explain how individuals perceive violations of
their personal space. However schema violation research has since been applied to other
domains such as interpersonal relationships (e.g. Bevan, 2003; Bevan, Ang & Fearns,
2014; Afifi & Faulkner, 2000), stereotype violations (e.g. Bettencourt, Dill, Greathouse,
Charlton, & Mulholland, 1996; Biernat, Vescio, & Billings, 1999; Joardar, 2011), and
verbal behavior expectancies (e.g. Johnson & Lewis, 2010). The impact of expectation
violations on subjective ratings has also been examined.
For example, Jackson, Sullivan, and Hodge (1993) had participants read fictitious
undergraduate college applications that either violated or did not violate race stereotype
schemata. The race stereotype schema for academic performance within the United
States, the country in which the study took place, is that blacks are low academic
performers and whites are high academic performers (Jackson et al., 1993). Applications
with equivalent academic information (e.g. GPA, extracurricular activities) were
manipulated such that the applicant was either a black or a white student. When the
application depicted high performance, participants rated black applicants more favorably
overall than white targets even though the applications were identical in all factors but
race. When the application depicted low performance, participants rated white applicants
less favorably overall than black participants. Jackson, Sullivan, and Hodge argue that
this is support for EVT because negative violations of expectations were rated less
favorably while positive violations of expectations were rated more favorably.
A study by Heilman and Chen (2005) replicated these findings for gender
stereotypes. The stereotype for females is that they should be communal and engage in
group oriented, nurturing behaviors. Conversely, men should be agentic and engage in

5
more aggressive behaviors that help them get ahead of others. The authors compared
three conditions for each gender (1) engaging in helping behavior when asked by a
coworker, (2) declining to engage in helping behavior when asked by a coworker, and (3)
no information about helping behavior. When men engaged in helping behavior,
participants rated their performance higher than the no information condition, but rated
woman equivalent to the no information condition for the same behavior. When men
declined helping, participants rated their performance equivalent to the no information
condition, but rated women’s performance lower than that condition for the same
behavior.
Though the authors do not propose theoretical underpinnings for this
phenomenon, I argue that EVT explains the bias. When women engaged in helping
behavior, they were performing as expected, thus there was no expectation violation and
they were consequently neither rewarded nor punished. Men who did not engage in
helping behavior were also performing as expected based on their gender stereotype, thus
they were neither rewarded nor punished for this behavior. However, when men did
engage in helping behavior, they were seen as positively violating expectations, and were
rewarded.
Looking beyond race and gender, research suggests that expectations about
personality may differentially influence subjective ratings. Bendersky and Shah (2013)
examined coworker contribution ratings over time using workplace vignettes. MTurk
participants were asked to rate how much a fictional coworker contributed before (time 1)
and after (time 2) learning how much the coworker was willing to contribute to the group
effort. Scenarios were manipulated such that the fictional coworker displayed high or low
6
extraversion. They found that at time 2, extraverts’ contributions were judged as lower
than their introverted counterparts, although their contributions were objectively the
same. Extraverts negatively violated expectations, thus were punished more harshly than
equally contributing introverts.
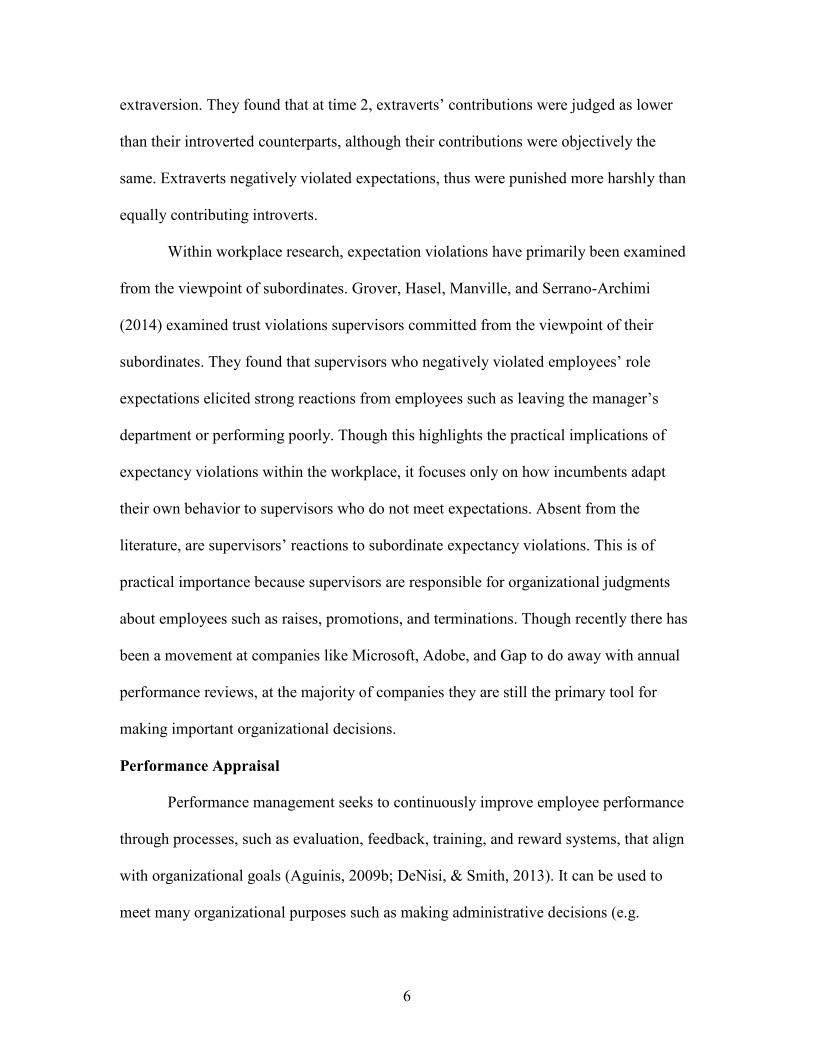
Within workplace research, expectation violations have primarily been examined
from the viewpoint of subordinates. Grover, Hasel, Manville, and Serrano-Archimi
(2014) examined trust violations supervisors committed from the viewpoint of their
subordinates. They found that supervisors who negatively violated employees’ role
expectations elicited strong reactions from employees such as leaving the manager’s
department or performing poorly. Though this highlights the practical implications of
expectancy violations within the workplace, it focuses only on how incumbents adapt
their own behavior to supervisors who do not meet expectations. Absent from the
literature, are supervisors’ reactions to subordinate expectancy violations. This is of
practical importance because supervisors are responsible for organizational judgments
about employees such as raises, promotions, and terminations. Though recently there has
been a movement at companies like Microsoft, Adobe, and Gap to do away with annual
performance reviews, at the majority of companies they are still the primary tool for
making important organizational decisions.
Performance Appraisal
Performance management seeks to continuously improve employee performance
through processes, such as evaluation, feedback, training, and reward systems, that align
with organizational goals (Aguinis, 2009b; DeNisi, & Smith, 2013). It can be used to
meet many organizational purposes such as making administrative decisions (e.g.

7
bonuses, raises, promotions, terminations), providing the legal documentation for such
decisions, producing developmental feedback for employees, and identifying where
training is needed (Aguinis, 2009a). In a study surveying 278 organizations, Rogers,
Bernthal, and Smith (2003) found that 91% of companies used a performance
management system. They also found that those with performance management systems
typically outperform those without in financial outcomes, customer satisfaction, and
employee retention.
Performance appraisal is one process within the larger entity of performance
management and has historically received a great amount of attention from researchers
and practitioners alike (Aguinis, 2009a). A review of articles from 2003-2007 listed
performance appraisal and feedback as the 3rd most popular article topic of the Journal of
Applied Psychology and 2nd most of Personnel Psychology (Cascio & Aguinis 2008).
Performance appraisal is an assessment technique to measure an employee’s or team’s
performance, and systematically identify strengths and weaknesses (Aguinis & Pierce,
2008). The performance constructs measured may vary, but two prominent examples are
task performance and organizational citizenship behavior which are discussed in detail in
studies one and two respectively. Judgment of performance may come from a mixture of
sources such as the employee him/herself, supervisors, peers, subordinates, or customers.
Most typically, supervisor reviews of performance are used. This practice aligns with
research demonstrating supervisor performance reviews are more reliable than peer or
self-appraisals (Viswesvaran, Ones, & Schmidt, 1996; Conway & Huffcutt, 1997).
However, accuracy is only one consideration when designing the assessment process and
each source has its place depending on the goals of the appraisal. For example, including

8
the employee in the process increases the perceptions of fairness and accuracy (Shore,
Adams, & Tashchian, 1998) and increases the chance the employee’s performance will
improve in the future (Aguinis, 2009b).
Because performance appraisal is a foundation for other processes within
performance management (e.g. the legal documentation for decision makings, basis of
employee feedback) judgment biases caused by supervisor reactions to employee
expectation violations may have direct consequences on the employee and the
organization. For example, appraisals that are too lenient may result in the promotion of
the wrong employees or cover up training needs. Employees who perceive performance
appraisals as unfair may choose to leave the company (Prendergast & Topel, 1993). Bias
may come from a variety of sources such as organizational politics (Bjerke et al., 1987),
rater personality (Bernadine et al., 2000), similarities between the rate and rater attitudes
(Abrami & Mizener, 1985), halo leniency, severity, (Viswesvaran et al., 2005), and
stereotypes (Heilman & Chen, 2005). I seek to bridge between two fields of research,
performance appraisal biases and expectation violations. The following two studies will
examine (1) if on-the-job performance can violate supervisor’s expectations formed pre-
hire, (2) if this violation creates performance appraisal bias, and (3) if this violation
creates bias in recommendations for rewards (e.g. raise, termination).
9
CHAPTER TWO
STUDY 1
Introduction
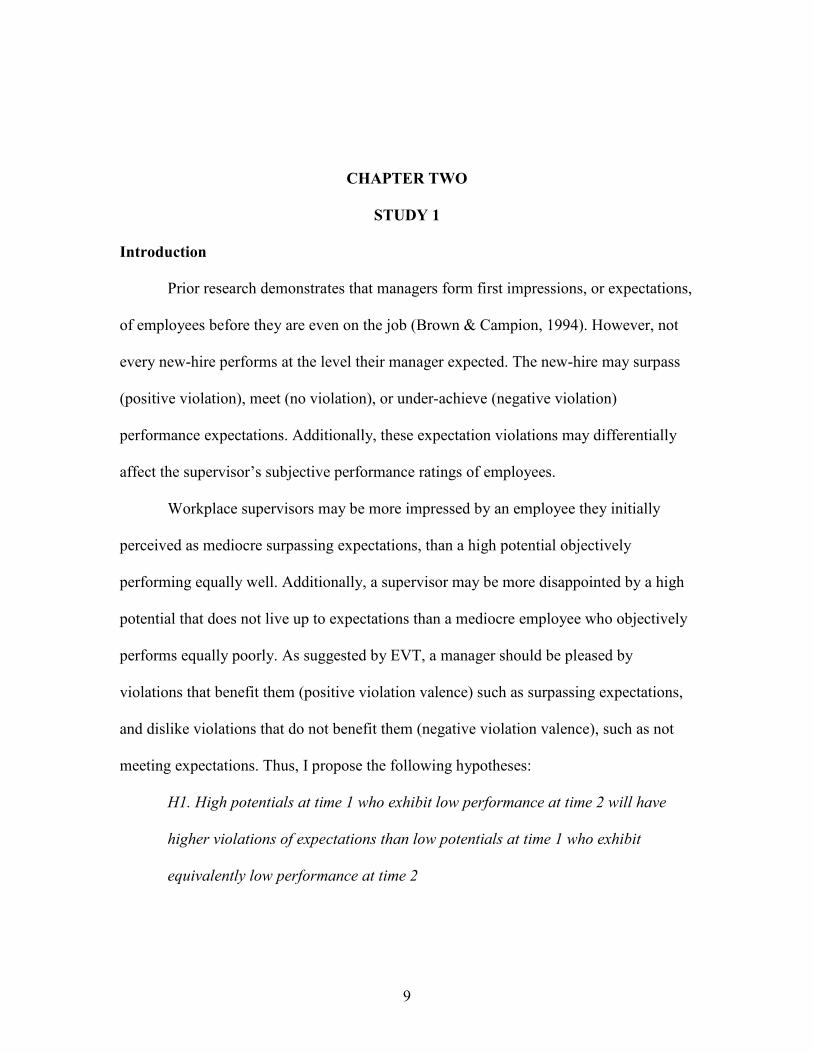
Prior research demonstrates that managers form first impressions, or expectations,
of employees before they are even on the job (Brown & Campion, 1994). However, not
every new-hire performs at the level their manager expected. The new-hire may surpass
(positive violation), meet (no violation), or under-achieve (negative violation)
performance expectations. Additionally, these expectation violations may differentially
affect the supervisor’s subjective performance ratings of employees.
Workplace supervisors may be more impressed by an employee they initially
perceived as mediocre surpassing expectations, than a high potential objectively
performing equally well. Additionally, a supervisor may be more disappointed by a high
potential that does not live up to expectations than a mediocre employee who objectively
performs equally poorly. As suggested by EVT, a manager should be pleased by
violations that benefit them (positive violation valence) such as surpassing expectations,
and dislike violations that do not benefit them (negative violation valence), such as not
meeting expectations. Thus, I propose the following hypotheses:
H1. High potentials at time 1 who exhibit low performance at time 2 will have
higher violations of expectations than low potentials at time 1 who exhibit
equivalently low performance at time 2

10
H2. High potentials at time 1 who exhibit high performance at time 2 will have
lower violations of expectations than low potentials at time 1 who exhibit
equivalently high performance at time 2.
H3. High potentials at time 1 who exhibit low performance at time 2 will have
lower performance ratings than low potentials at time 1 who exhibit equivalently
low performance at time 2
H4. High potentials at time 1 who exhibit high performance at time 2 will have
lower performance ratings than low potentials at time 1 who exhibit equivalently
high performance at time 2.
Although expectancy violation research has been applied to subjective ratings
(e.g. Jackson, 1993; Kernahan, Bartholow, & Bettencourt, 2000), more distal
consequences have not been examined. Performance appraisals are a foundation for many
other organizational decisions, thus biases in performance appraisals may have
consequences in other performance management domains. For example, do performance
expectation violations affect not only subjective performance ratings, but also
recommendations to reward or punish the employee?
H5. High potentials at time 1 who exhibit low performance at time 2 will have
lower reward recommendations than low potentials at time 1 who exhibit
equivalently low performance at time 2
H6. High potentials at time 1 who exhibit high performance at time 2 will have
lower reward recommendations than low potentials at time 1 who exhibit
equivalently high performance at time 2.
11
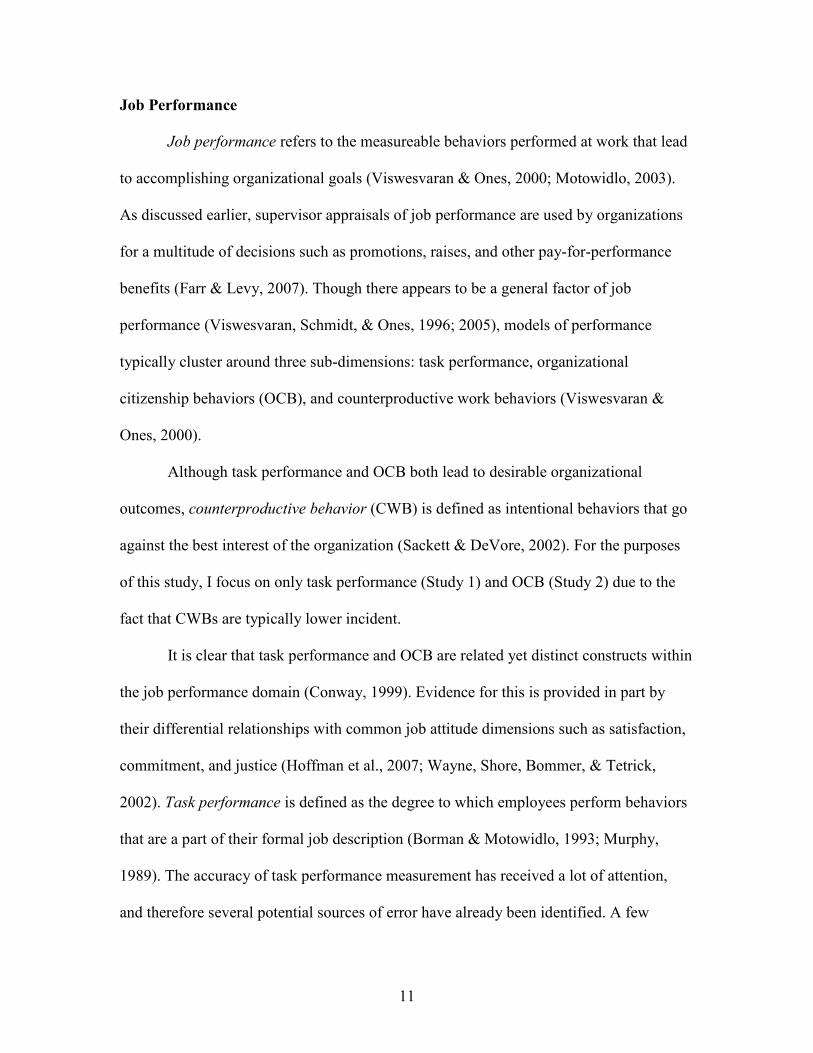
Job Performance
Job performance refers to the measureable behaviors performed at work that lead
to accomplishing organizational goals (Viswesvaran & Ones, 2000; Motowidlo, 2003).
As discussed earlier, supervisor appraisals of job performance are used by organizations
for a multitude of decisions such as promotions, raises, and other pay-for-performance
benefits (Farr & Levy, 2007). Though there appears to be a general factor of job
performance (Viswesvaran, Schmidt, & Ones, 1996; 2005), models of performance
typically cluster around three sub-dimensions: task performance, organizational
citizenship behaviors (OCB), and counterproductive work behaviors (Viswesvaran &
Ones, 2000).
Although task performance and OCB both lead to desirable organizational
outcomes, counterproductive behavior (CWB) is defined as intentional behaviors that go
against the best interest of the organization (Sackett & DeVore, 2002). For the purposes
of this study, I focus on only task performance (Study 1) and OCB (Study 2) due to the
fact that CWBs are typically lower incident.
It is clear that task performance and OCB are related yet distinct constructs within
the job performance domain (Conway, 1999). Evidence for this is provided in part by
their differential relationships with common job attitude dimensions such as satisfaction,
commitment, and justice (Hoffman et al., 2007; Wayne, Shore, Bommer, & Tetrick,
2002). Task performance is defined as the degree to which employees perform behaviors
that are a part of their formal job description (Borman & Motowidlo, 1993; Murphy,
1989). The accuracy of task performance measurement has received a lot of attention,
and therefore several potential sources of error have already been identified. A few

12
examples of these sources are halo, the tendency of raters to judge all aspects of an
individual using a general impression formed on only one or a few of the individual’s
characteristics (Viswesvaran et al., 2005); rating too leniently or too harshly across
employees (Vishwesvvaran et al., 2005); and the tendency of raters to rate employees
more similar to them higher than others (Abrami & Mezener, 1985).
Building upon the previously discussed studies that demonstrated biases in ratings
due to violations of expectations (e.g. Bendersky & Shah, 2013; Heilman & Chen, 2005;
Jackson, Sullivan & Hodge, 1993), performance expectation violations may be another
potential source of bias in task performance ratings. Specifically, employees’ whose on-
the-job performance is lower (negative violation) than expectations established pre-hire,
through information such as letters of recommendation, interviews, and resume, should
be rated lower than employees who do not violate expectations. Additionally, employees
who perform higher than expected (positive violation) should be rated higher than
employees who do not violate expectations. Thus I propose the following specific
hypotheses:
H1a. High potentials at time 1 who exhibit low task performance at time 2 will
have higher violations of expectations than low potentials at time 1 who exhibit
equivalently low task performance at time 2
H2a. High potentials at time 1 who exhibit high task performance at time 2 will
have lower violations of expectations than low potentials at time 1 who exhibit
equivalently high performance at time 2

13
H3a. High potentials at time 1 who exhibit low task performance at time 2 will
have lower task performance ratings than low potentials at time 1 who exhibit
equivalently low performance at time 2
H4a. High potentials at time 1 who exhibit high task performance at time 2 will
have lower performance ratings than low potentials at time 1 who exhibit
equivalently high task performance at time 2
H5a. High potentials at time 1 who exhibit low task performance at time 2 will
have lower reward recommendations than low potentials at time 1 who exhibit
equivalently low task performance at time 2
H6a. High potentials at time 1 who exhibit high task performance at time 2 will
have lower reward recommendations than low potentials at time 1 who exhibit
equivalently high task performance at time 2
Method
Participants
Participants were recruited using a publicly available listserv. The listserv
contained email address for approximately 10,000 engineers certified to practice in their
state. This list is a mix of several types of engineers including civil, and electrical.
Potential participants were emailed a description and link to the survey. Although this
was a large participant pool, response rates were small. This small response rate was
expected because there was no compensation, the email did not come from someone
personally known to the participants, and there was no way to know that the listed email
mailboxes were monitored regularly.

14
A total of 179 engineers, agreed to participate in Study 1. Two participants were
deleted from the study for incorrectly answering one or more attention questions leaving
177 participants for analyses. On average, participants were 49 years old and worked 45
hours per week. All participants had at least 1 year of experience as a manager of other
employees, and had 9 years of managerial experience on average. The majority, 78%, had
experience rating employee performance. Sample sizes and demographics for each
condition are available in Table 1.
Table 1. Study 1 Demographics by Condition
Condition N Age Hrs/
Wk
Male Race/Ethnicitya
White Black Hispanic Asian
Middle
Eastern
Pacific
Islander
American
Indian
1 44 50 44 75% 76% 0% 14% 5% 5% 0% 0%
2 44 49 48 86% 89% 0% 9% 0% 0% 0% 2%
3 46 49 44 89% 78% 6% 10% 2% 4% 0% 0%
4 42 50 45 81% 78% 7% 12% 0% 2% 0% 0%
a. Participants were allowed to choose more than one race/ethnicity
Materials
Vignette Development. Four vignettes were developed for this study;
specifically, two pre-hire vignettes administered at time 1 and two post-hire vignettes
administered at time 2. Pre-hire vignettes contained a letter of recommendation for the
potential new employee. Post-hire vignettes summarized the employee’s job
performance over the last six months. See Appendix B for the vignettes used in this study
and in study two.
Rotundo and Sackett’s (2002) profile development method was used to create the
vignettes. This process involved four major steps. Step 1) Two subject matter experts

15
(SMEs) in construction project management that had experience in performance appraisal
were asked to a) review the O*NET construction project managers task description for
accuracy, b) provide good and poor behavioral examples of performance on each of the
tasks, and c) provide examples of how these good and poor behaviors would be
communicated on a letter of recommendation.
Step 2) SMEs were asked to sort each behavior into task performance or OCB
based on the definitions provided previously. Examples of the O*NET task descriptions
include plan, schedule, or coordinate construction project activities to meet deadlines
and prepare and submit budget estimates, progress reports, or cost tracking reports.
Step 3) The behavioral examples were compiled into the vignettes. The two pre-
hire vignettes consisted of letters of recommendation manipulated to display either high
task performance or low task performance. The two post-hire vignettes displayed either
high task performance or low task performance using on-the-job behaviors provided by
the SMEs.
Step 4) Twenty-two Industrial and Organizational doctoral students served as
subject matter experts (SME) and rated each vignette on Williams and Anderson’s (1991)
7-item, in-role behavior measure (described in detail below). Vignettes were presented in
random order. This step ensured the vignettes were constructed such that they contained
the desired manipulations of high and low task performance. Descriptive statistics for
each vignette are available in Table 2. No modifications to the vignettes were deemed
necessary.
16
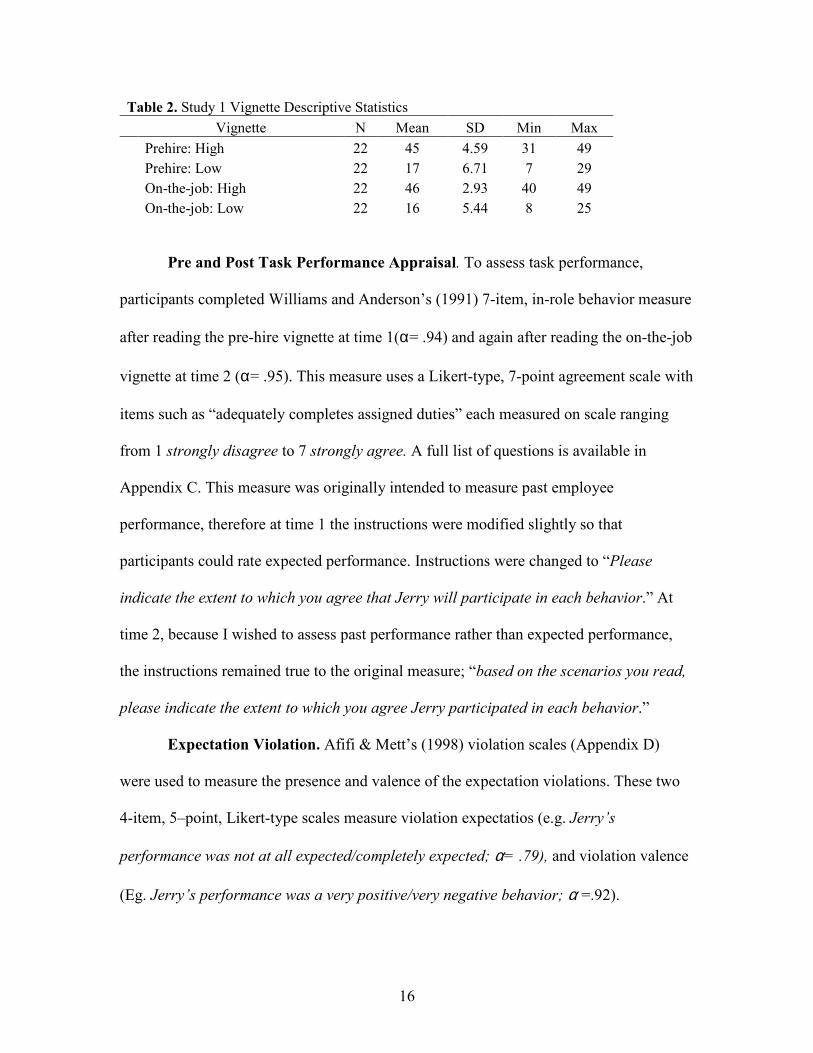
Table 2. Study 1 Vignette Descriptive Statistics
Vignette N Mean SD Min Max
Prehire: High 22 45 4.59 31 49
Prehire: Low 22 17 6.71 7 29
On-the-job: High 22 46 2.93 40 49
On-the-job: Low 22 16 5.44 8 25
Pre and Post Task Performance Appraisal. To assess task performance,
participants completed Williams and Anderson’s (1991) 7-item, in-role behavior measure
after reading the pre-hire vignette at time 1(α= .94) and again after reading the on-the-job
vignette at time 2 (α= .95). This measure uses a Likert-type, 7-point agreement scale with
items such as “adequately completes assigned duties” each measured on scale ranging
from 1 strongly disagree to 7 strongly agree. A full list of questions is available in
Appendix C. This measure was originally intended to measure past employee
performance, therefore at time 1 the instructions were modified slightly so that
participants could rate expected performance. Instructions were changed to “Please
indicate the extent to which you agree that Jerry will participate in each behavior.” At
time 2, because I wished to assess past performance rather than expected performance,
the instructions remained true to the original measure; “based on the scenarios you read,
please indicate the extent to which you agree Jerry participated in each behavior.”
Expectation Violation. Afifi & Mett’s (1998) violation scales (Appendix D)
were used to measure the presence and valence of the expectation violations. These two
4-item, 5–point, Likert-type scales measure violation expectatios (e.g. Jerry’s
performance was not at all expected/completely expected; α= .79), and violation valence
(Eg. Jerry’s performance was a very positive/very negative behavior; α =.92).

17
Reward Recommendations. Allen and Rush’s (1998) measure of reward
recommendations was used to assess the degree to with the rater would recommend the
employee for optional benefits such as a raise. This scale contains five items measured on
a 5-point scale (1) would definitely not recommend to (5) would recommend with
confidence. Additionally, two reverse coded items were added assessing
recommendations to demote and to terminate. Overall reliability was good α=.95.The full
7-item scale is available in Appendix E.
Demographics. Demographic questions included age, sex, ethnicity, average
hours worked per week, job industry, and managerial experience. These questions were
assessed at the end of the study. The full questionnaire is available in Appendix F.
Procedure
Qualtrics, a survey hosting site, was used to administer all information to the
participants. Participants first read through the Informed Consent. Once Informed
Consent was collected, the participant was randomly assigned to one of the four treatment
groups using Qualtrics’ survey flow randomizer option. The four treatment groups are
available in Appendix G.
All participants were presented with the same background story available in
Appendix H. This story informs them that they are the owner of a commercial
construction company. They have just won a new project, building a 13.2 million dollar
hotel, and they need a new project manager to run the job. Because this is a big job, they
will need a competent project manager who keeps on top of progress and doesn’t let
details fall through the cracks. Without a competent project manager, their company
could lose a large amount of money.

18
Second, participants read a letter of recommendation to establish performance
expectations for the new project manager. Third, each participant rated performance
expectations for the new hires using the Williams and Anderson (1991) in-role behavior
measure. Fourth, participants read a vignette describing the employee’s on-the-job
performance for the last six months. Fifth, after reading the performance descriptions,
participants once again completedWilliams and Anderson’s (1991) in-role behavior
measure. Sixth, participants completed Afifi & Mett’s (1998) violation scales. Seventh,
participants completed Allen and Rush’s (1998) measure of reward recommendations.
Last, participants responded to several demographic questions.
Results
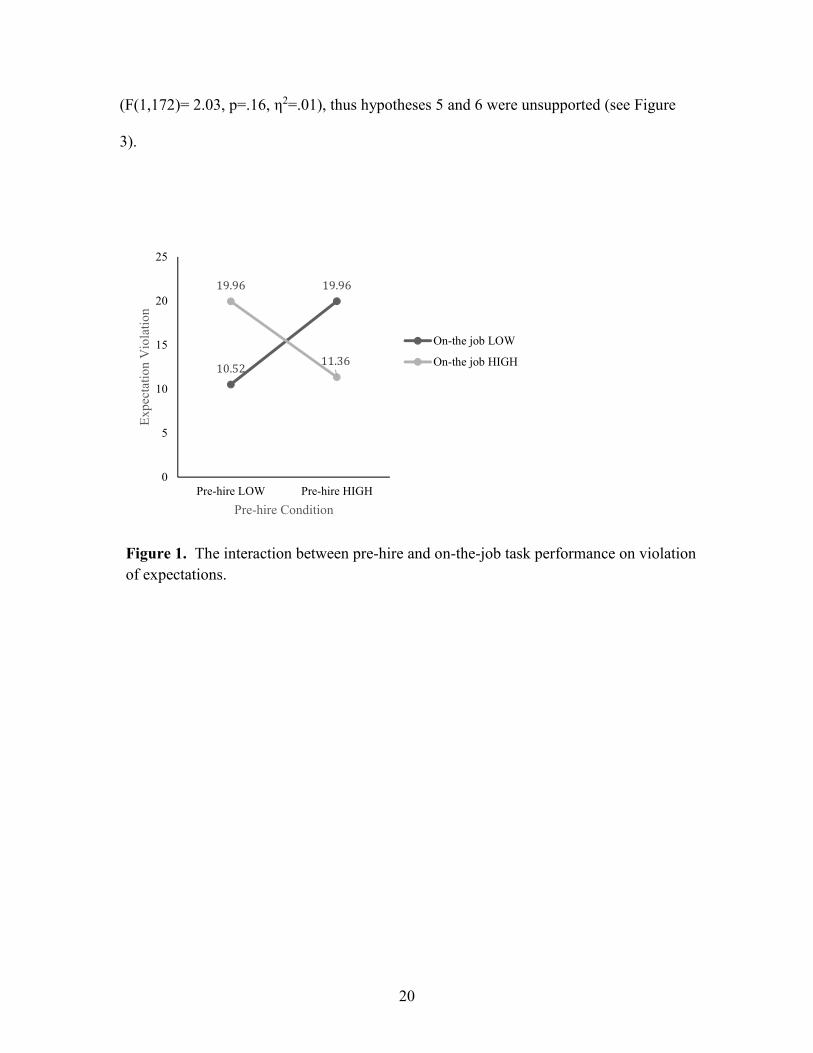
Hypotheses 1 and 2 essentially state that participants will report violations of
expectations when on-the-job performance is not equivalent to indicators of performance
presented pre-hire. Hypothesis H1 and H2 were tested with a factorial ANOVA followed
by pairwise comparisons. Results supported the hypothesized relationships. Specifically,
the interaction between scenario 1 and 2 was significant, F(1,72)=6.73, p<.0001, η2=
.642. When on the job performance was low, participants expressed greater expectation
violation for employees with high pre-hire behavior (M=19.96) than low pre-hire
behavior (M=10.52;p<.0001 ). Additionally, when on the job performance was high,
participants expressed greater expectation violation for employees with low pre-hire
behavior (M=19.96) than high pre-hire behavior (M=11.364; p<.0001). Note that
scenario 2 had a small main effect on violation expectation, F(1,172)=5.65, p=0.19,
η2=.032, but scenario 1 did not F(1,172)=.796, p= .74, η2= .005. Graphs depicting these
results are available in Figure 1.
19
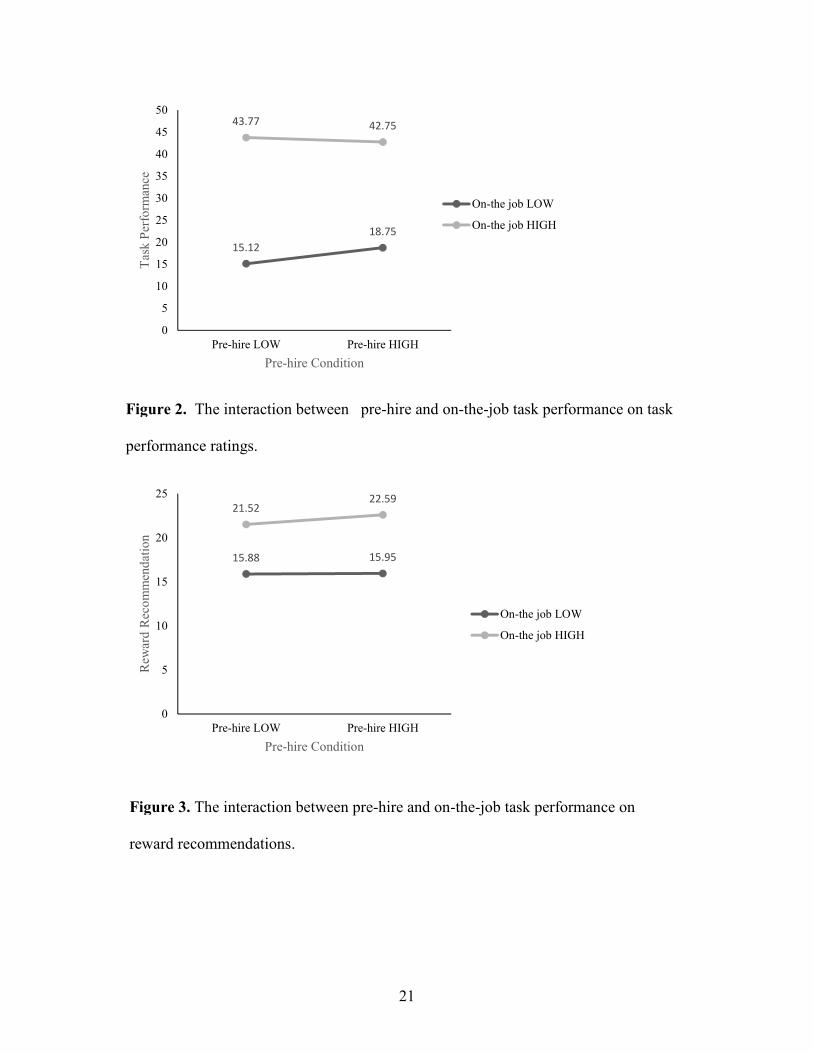
Hypotheses 3 and 4 proposed that on the job performance ratings would be biased
by expectation violations such that, compared to employees with no violation, employees
who performed worse than expected would have lower ratings and employees who
performed better than expected would have inflated ratings. These hypotheses were also
tested using a factorial ANOVA. Both the initial pre-hire scenario (F(1,173)=4.53,
p=.035, η 2= .026), and the on-the job scenario (F(1,173)=1278.94, p<.0001, η2= .881)
had a main effect on on-the-job task performance ratings. Additionally, the interaction
between the two was significant (F(1,173)=8.126, p=.005, η2= .045). Pairwise
comparisons revealed that Hypotheses 3 and 4 were unsupported. When on-the-job
performance was high, pre-hire behavior had no effect on performance ratings, (low
M=43.77, high M=42.75; p=.605. However, when on-the-job behaviors were low,
individuals with high pre-hire performance were rated significantly better (M=18.75) than
those with low pre-hire performance (M=15.12; p=.001; see Figure 2).
Hypotheses 5 and 6 proposed that, compared to employees with no expectation
violation, employees who performed worse than expected would have lower reward
recommendations and employees who performed better than expected would have higher
reward recommendations. Hypotheses 5 and 6 were also tested using factorial ANOVA
which was significant (F(1,172) = 104.18, p<.0001, η2 =.65. The pre-hire scenario did not
have a main effect on reward recommendations (F(1,172)=2.68, p=.10, η2= .02), but the
on-the-job scenario did F(1, 172)= 308.84 p<.0001, η2=.64) such that high on-the-job-
performance was awarded more reward recommendations (M=22.06) than low on-the-job
performance (M=15.918). The interaction between the scenarios was non-significant
20
(F(1,172)= 2.03, p=.16, η2=.01), thus hypotheses 5 and 6 were unsupported (see Figure
3).
10.52
19.9619.96
11.36
0
5
10
15
20
25
Pre-hire LOW Pre-hire HIGH
Exp
ecta
tio
n V
iola
tio
n
Pre-hire Condition
On-the job LOW
On-the job HIGH
Figure 1. The interaction between pre-hire and on-the-job task performance on violation
of expectations.
21
15.12
18.75
43.77 42.75
0
5
10
15
20
25
30
35
40
45
50
Pre-hire LOW Pre-hire HIGH
Tas
k P
erfo
rman
ce
Pre-hire Condition
On-the job LOW
On-the job HIGH
15.88 15.95
21.5222.59
0
5
10
15
20
25
Pre-hire LOW Pre-hire HIGH
Rew
ard
Rec
om
men
dat
ion
Pre-hire Condition
On-the job LOW
On-the job HIGH
Figure 2. The interaction between pre-hire and on-the-job task performance on task
performance ratings.
Figure 3. The interaction between pre-hire and on-the-job task performance on
reward recommendations.

22
Discussion
This study investigated expectancy violation theory as an explanation for biases in
task performance ratings. Using scenarios with varying pre-hire and on-the-job task
performance, performance expectations and violations were established. Over all
conditions, high on-the-job performance scenarios resulted in higher performance ratings
and more reward recommendations than low on-the-job performance ratings. This is good
news because it suggests that high performers receive better performance ratings and
rewards than low performers on average, regardless of expectations formed by
supervisors pre-hire. Another positive finding, though contrary to the hypotheses, was the
lack of bias in task performance ratings due to pre-hire information for high on-the-job
performers. Participants did experience expectation violation when on-the-job
performance was better or worse than that depicted in the pre-hire information, however
it did not appear to affect high on-the-job performers nor explain the bias in low on-the-
job performers.
Interestingly, low-on-the-job performers were rated differently depending on
whether they had high or low pre-hire performance indicators. One possible explanation
for this phenomenon is confirmation bias. Confirmation bias is the tendency to seek out,
interpret, and recall information that confirms a belief rather than disconfirms it (Oswald
& Grosjean, 2004). According to confirmation bias, participants should interpret the same
on-the-job performance scenario differently depending on their existing opinion of the
employee. This suggests that if a supervisor has an expectation the new employee will be
a high performer, he or she may give less importance to new information that contradicts
this expectation. Results suggest that the positive first impression was indeed beneficial
23
and caused more lenient ratings later on when the employee performed poorly. Study 2
attempts to see if this finding is repeated for OCBs or if expectation violations bias
results as originally proposed.

24
CHAPTER THREE
STUDY 2
In contrast to task performance, OCBs are voluntary work behaviors such as
backing up a team member, being cordial with co-workers, and positively representing
the company outside the office. Though they may not be a part of the formal job
description, these behaviors do contribute to supervisory ratings of job performance (Orr,
Sackett, and Mercer, 1989). This concept has been studied under several different names
and related dimensions [e.g. contextual performance (Borman & Montiwidlo, 1993),
organizational citizenship behavior (Organ, 1988), prosocial organizational behavior
(Brief & Motowidlo, 1986), organizational spontaneity (George & Brief, 1992), extrarole
behavior (Katz & Kahn, 1978; Van Dyne, Cummings, & Parks, 1995)], however
organizational citizenship behavior (OCB) is arguably the most popular terminology in
current research (Lepine, Erez, & Johnson, 2002).
Organizational citizenship behavior (OCB) is defined as discretionary behavior
that leads to accomplishing organizational goals (Viswesvaran & Ones, 2000; Organ,
1997). Note that Organ (1988) originally defined OCB as non-enforceable behavior that
is neither part of the organization’s job description nor formal reward system. However,
the current definition acknowledges that supervisors do indeed reward OCB (Organ,
1997; Viswesvaran & Ownes, 2000).
Smith, Organ, and Near (1983) originally proposed a two-dimensional OCB
model, that has since been expanded into a five factor model by Organ (1988). These five

25
factors are courtesy (being mindful of coworkers), conscientiousness (above-and-beyond
in dedication to the job), civic virtue (actively participating in optional organizational
meetings and keeping abreast of announcements) and sportsmanship (maintaining
positivity in the workplace). Podsakoff’s (1990) measure (available in appendix A) of
these five OCB sub-dimensions is still widely used, but some researchers argue that a
reconceptualization of this model is necessary.
Williams and Anderson (1991) argued for a two-factor model composed of OCB-
I, OCBs that primarily benefit the individual, but also meet organizational goals (e.g.
taking interest in coworkers, backing up behavior), and OCB-O, OCB that primarily
benefit the organization (e.g. notifying the organization of expected absences,
maintaining positivity at work). However, Hoffman, Blair, Meriac, and Woehr’s (2007)
meta-analysis did not support the notion that OCB-O and OCB-I were distinct
dimensions. Instead, the authors argue that OCB should be conceptualized as a one-
dimensional construct. This echoes the findings of Lepine, Erez, and Johnson’s (2002)
meta-analysis that demonstrated neither William and Anderson’s (1991) two factor nor
Organ’s (1998) five factor model accounted for incremental variance over the one factor
model. Thus, aggregating the five sub-dimensions of Podsakoff’s (1990) measure to
reflect a unidimensional measure of OCB is empirically supported.
Task performance and OCB are related, but contribute differentially to overall job
performance ratings (Motowidlo & Scotter, 1994). Thus, to better understand the
influence of pre-hire information on job performance ratings, it is important to examine
the previously proposed hypotheses for both performance dimensions to ascertain

26
whether the variable relationships function the same or differently. Study 2 examined the
relationships previously hypothesized, this time for OCB.
H1. High potentials at time 1 who exhibit low OCB at time 2 will have higher
violations of expectations than low potentials at time 1 who exhibit equivalently
low OCB at time 2
H2. High potentials at time 1 who exhibit high OCB at time 2 will have lower
violations of expectations than low potentials at time 1 who exhibit equivalently
high OCB at time 2
H3. High potentials at time 1 who exhibit low OCB at time 2 will have lower
performance ratings than low potentials at time 1 who exhibit equivalently low
OCB at time 2
H4. High potentials at time 1 who exhibit high OCB at time 2 will have lower
performance ratings than low potentials at time 1 who exhibit equivalently high
OCB at time 2
H5. High potentials at time 1 who exhibit low OCB at time 2 will have lower
reward recommendations than low potentials at time 1 who exhibit equivalently
low OCB at time 2
H6. High potentials at time 1 who exhibit high OCB at time 2 will have lower
reward recommendations than low potentials at time 1 who exhibit equivalently
high OCB at time 2
27
Method
Participants
Participants were again recruited using a publicly available listserv of engineers
certified to practice in their state. The list contained approximately 10,000 engineers and
was a mix of several types of engineers including civil, and electrical. It is important to
note that none of the potential participants in Study 2 were approached to participate in
Study 1. Potential participants were emailed a description of the survey and a link to it.
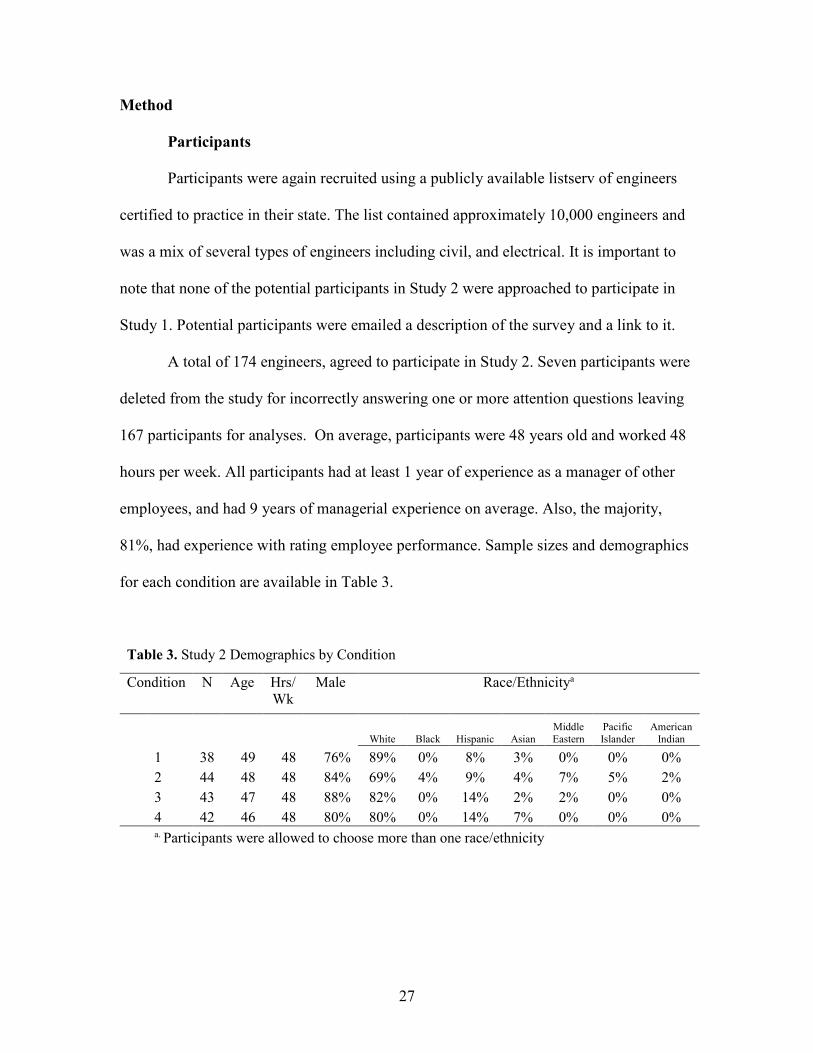
A total of 174 engineers, agreed to participate in Study 2. Seven participants were
deleted from the study for incorrectly answering one or more attention questions leaving
167 participants for analyses. On average, participants were 48 years old and worked 48
hours per week. All participants had at least 1 year of experience as a manager of other
employees, and had 9 years of managerial experience on average. Also, the majority,
81%, had experience with rating employee performance. Sample sizes and demographics
for each condition are available in Table 3.
Table 3. Study 2 Demographics by Condition
Condition N Age Hrs/
Wk
Male Race/Ethnicitya
White Black Hispanic Asian
Middle
Eastern
Pacific
Islander
American
Indian
1 38 49 48 76% 89% 0% 8% 3% 0% 0% 0%
2 44 48 48 84% 69% 4% 9% 4% 7% 5% 2%
3 43 47 48 88% 82% 0% 14% 2% 2% 0% 0%
4 42 46 48 80% 80% 0% 14% 7% 0% 0% 0%
a. Participants were allowed to choose more than one race/ethnicity

28
Materials
Vignette Development. Four vignettes were developed for this study using
Rotundo and Sacket’s (2002) profile development method. During vignette development
for Study 1, construction project managers were asked to provide good and poor
behavioral examples of the construction project manager O*NET behaviors, and to sort
each into tasks and OCBs. The OCB behavioral examples were combined to build the
vignettes for Study 2.
Two vignettes provided pre-hire information in the form of a letter of
recommendation for the potential new employee. One depicted high levels of OCB at his
previous job, and one depicted low levels. Two post-hire vignettes summarized the
employee’s OCB over the last six months on-the-job. Again, one depicted high on-the-
job OCB and the second depicted low on-the-job OCB. See Appendix B for these
vignettes.
Finally, twenty-two Industrial and Organizational doctoral students rated each
vignette on Podsakoff et al.’s (1990) 24-item OCB measure (described in detail below).
Vignettes were presented to raters in random order. This step ensured the vignettes were
constructed such that they contained the desired manipulations of high and low task
performance. Descriptive statistics for each vignette are available in Table 4.
Table 4. Study 2 Vignette Descriptive Statistics
Vignette N Mean SD Min Max
Prehire: High 21 141 16.16 106 165
Prehire: Low 20 56 13.60 37 87
On-the-job: High 22 148 13.54 122 167
On-the-job: Low 22 53 15.54 30 83
29
Pre and Post OCB Performance Appraisal. Podsakoff et al.’s (1990) 24-item
measure was used to measure OCB both at time 1 (α= .98) and at time 2 (α= .99). This
measure assesses Organ’s (1988) five facets of OCB: altruism, conscientiousness,
sportsmanship, courtesy, and civic virtue. Each facet is assessed with 5 items except civic
virtue, which has 4 items. The aggregate one-dimensional measure was used for all
analyses. Participants indicated their agreement with each item using a 7-point Likert-
type response ranging from 1 strongly disagree to 7 strongly agree. An example altruism
item is “This employee is always ready to lend a helping hand to those around him/her.”
The full measure is available in Appendix A.
Expectation Violation. Afifi & Mett’s (1998) violation scales (Appendix D)
were used to measure the presence and valence of the expectation violations. These two
4-item, 5–point, Likert-type scales measure violation expectations (e.g. Jerry’s
performance was not at all expected/completely expected; α= .83), and violation valence
(Eg. Jerry’s performance was a very positive/very negative behavior; α =.92).
Reward Recommendations. Allen and Rush’s (1998) measure of reward
recommendations was used to assess the degree to with the rater would recommend the
employee for optional benefits such as a raise. This scale contains five items measured on
a 5-point scale (1) would definitely not recommend to (5) would recommend with
confidence. Additionally, two reverse coded items were added assessing
recommendations to demote and to terminate. Overall reliability was good α=.97. The
full 7-item scale is available in Appendix E.
Demographics. As in study 1, demographic questions included age, sex,
ethnicity, average hours worked per week, job industry, and managerial experience.

30
These questions were assessed at the end of the study. The full questionnaire is available
in Appendix F.
Results
Again, Hypotheses 1 and 2 essentially state that participants will report violations
of expectations when on-the-job OCB (scenario2) is not equivalent to OCB presented
pre-hire (scenario 1). This was tested using a factorial ANOVA followed by pairwise
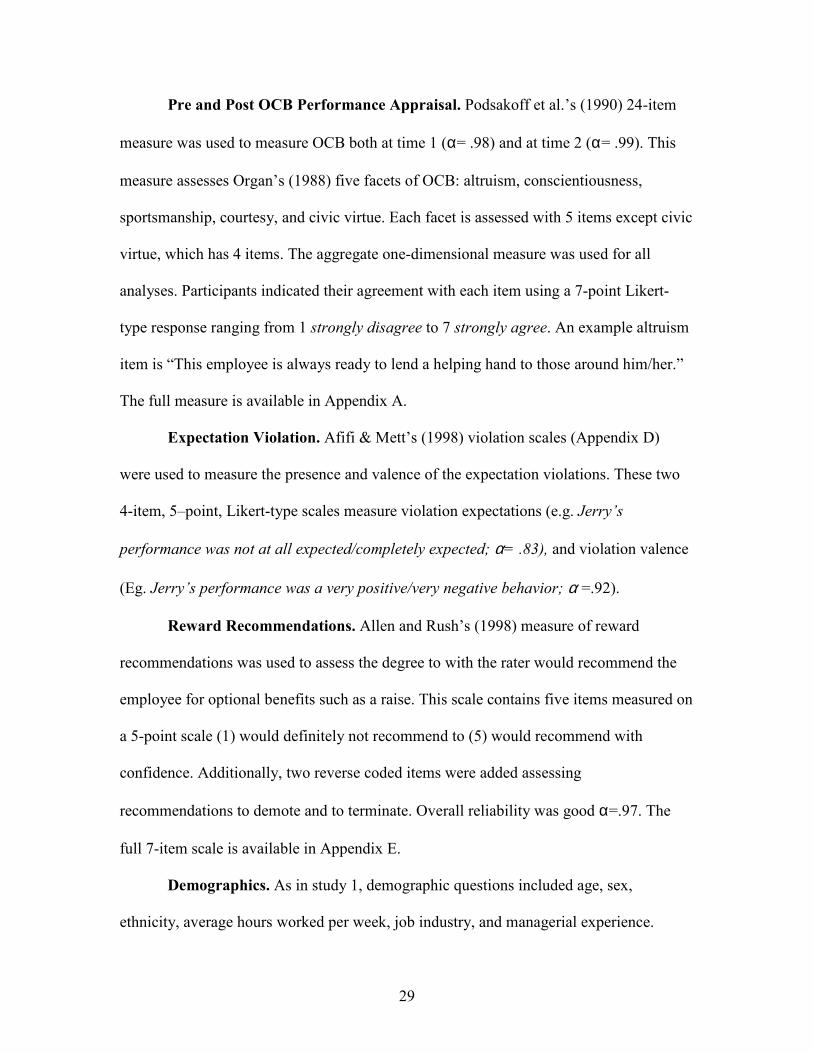
comparisons. The interaction was significant F(1,160)= 551.75, p<.001 η2=.775. When
on-the-job performance was low, employees with high pre-hire performance were rated
significantly higher (M=21.57), than those with low pre-hire performance (M=10.39).
When on-the-job performance was high participants with low pre-hire OCB (M=23.64)
were rated higher than individuals with high pre-hire OCB (M=10.78). Thus, both
Hypotheses 1 and 2 were supported. Note that there was a significant main effect for
scenario 2 F(1,160)=551.75, p<.001, η2=.035 and a non-significant main effect for
scenario 1 (F(1,160)=2.699, but these results are not of relevance due to the significant
interaction. See Figure 4 for a visual representation of these relationships.
Hypotheses 3 and 4 proposed that on the job performance ratings would be biased
by expectation violations such that, compared to employees with no violation, employees
who engage in lower OCB than expected would have lower ratings and employees that
engage in OCB more than expected would have inflated ratings. A significant main effect
was seen for the pre-hire scenario F(1,162)=7.13, p=.008; η2=.042 and for the on-the-job
scenario, F(1,162)= 886.29, p<.0001, η2=.845. The interaction between the two was also
significant F(1,162)=1561, p<.0001, η2=.088, such that when on-the-job OCB was low,
high pre-hire OCB rated significantly higher (M=71.75) than low pre-hire OCB

31
(M=55.31; p<.0001; see Figure 5). When on-the-job OCB was high, low pre-hire
M=139.05 and high prehire (M=135.86) OCB were not significantly different p=.375.
Thus, both hypotheses were unsupported.
Hypotheses 5 and 6 proposed that reward recommendations would be biased by
expectation violations such that, compared to employees with no violation, employees
who engage in lower OCB than expected would receive lower reward recommendations
and employees who engage in OCB more than expected would receive higher reward
recommendations. There was a significant main effect for the pre-hire scenario F(1,160)=
.07, p=.001, η2=.070 and on the on-the-job scenario F(1,160)= 699.53, p<.000, η2=.814
(see Figure 6). More importantly, there was a significant interaction F(1,160)= 8.331,
p=.004, η2=.049, such that when on-the-job OCB was low, employees with high pre-hire
OCB (M=17.00) were rewarded significantly more than those with low pre-hire OCB
p<.0001(13.32) p<.0001. When on the job OCB was high, employees with high pre-hire
OCB (M=30.65) and low pre-hire OCB (M=30.31) did not differ p=.69. Thus,
Hypotheses 5 and 6 were unsupported.
32
55.31
71.75
139.05 135.87
0
20
40
60
80
100
120
140
160
Pre-hire LOW Pre-hire HIGH
OC
B R
atin
g
Pre-hire Condition
On-the job LOW
On-the job HIGH
10.39
21.57
23.64
10.78
0
5
10
15
20
25
Pre-hire LOW Pre-hire HIGH
Exp
ecta
tion V
iola
tion
Pre-hire Condition
On-the job LOW
On-the job HIGH
Figure 4. The interaction between pre-hire and on-the-job OCB on expectation
violations.
Figure 5. The interaction between pre-hire and on-the-job OCB on OCB ratings.

33
Discussion
This study was designed as a replication of Study 1 using a different job
performance construct, OCB. Expectations for performance were established using pre-
hire letters of recommendation depicting either high or low OCB behavior at a past job.
Violations of expectation were created using on-the-job performance vignettes depicting
either high or low OCB. Only Hypotheses 1 and 2, that expectation violations would
occur, were supported. When on-the-job OCB was either higher or lower than indicated
by pre-hire letters of recommendation, participants reported more expectation violations
than when on-the-job OCB was equivalent to pre-hire letters. Again, this suggests that
pre-hire information, such as letters of recommendation, can lead to expectations about
the employee’s performance. However, violations do not appear to bias on-the-job ratings
of OCB. Rather, pre-hire information appears to bias on-the-job OCB ratings differently
13.32
17
30.31 30.65
0
5
10
15
20
25
30
35
Pre-hire LOW Pre-hire HIGH
Rew
ard
Rec
om
men
dat
ion
Pre-hire Condition
On-the job LOW
On-the job HIGH
Figure 6. The interaction between pre-hire and on-the-job OCB on reward
recommendations.

34
than proposed. When on-the-job OCB was high, there was no apparent bias based on pre-
hire information. When on-the-job OCB was low, employees with high pre-hire OCB
letters of recommendation received significantly higher OCB ratings than those with no
violation. These employees also received more reward recommendations. This suggests
that pre-hire information does indeed bias on-the job OCB ratings, though it appears that
this matters only for people performing poorly on-the-job. As seen in Study 1, poor on-
the-job performance was judged less harshly if the employee made a positive first
impression using pre-hire information. Potential explanations for these findings are
discussed in the General Discussion.

35
CHAPTER FOUR
GENERAL DISCUSSION
Expectation violations for both studies were in the proposed directions. This
supports the notion that supervisors form expectations of how an employee will perform
on-the-job based on pre-hire information such as letters of recommendation. It also
supports the notion that supervisors are cognizant of violations of these expectations
when on-the-job performance is either higher or lower than indicated by pre-hire
information. Expectations appear to have influenced these ratings such that individuals
with high pre-hire behaviors were rated higher than those with low pre-hire behaviors
even when they exhibited equivalently low on-the-job performance. This pattern is also
seen within reward recommendations in Study 2 which is problematic because it indicates
employees engaging in equivalent OCB on-the-job may be differentially rewarded due to
biases developed pre-hire.
One potential explanation for these results is confirmation bias, the tendency to
seek out, interpret, and recall information that confirms a belief rather than disconfirms it
(Oswald & Grosjean, 2004). Supervisors who form a performance expectation for an
employee may ignore or give less importance to on-the-job performance that does not
confirm their expectation. An example of confirmation bias can be seen in a study by
Jonas, Schulz-Hardt, Frey and Thelen (2001). Participants were presented with sixteen
expert opinions and disproportionately read evidence that supported rather than opposed
their point of view. Participants chose to ignore credible information that did not align

36
with their pre-existing attitudes. In a similar manner, participants in the current set of
studies may have paid less attention to on-the-job performance behaviors that did not
confirm their expectations.
This expectancy confirmation is also seen in Dougherty, Turban, and Callender’s
(1994) study of interviewing practices. Managers were given information about potential
applicants, such as their test scores and application. Better pre-hire information was
correlated with interviewers’ use of positive interview style, and more selling of the
company during the interview. Managers’ opinions of applicants’ affected their behavior
in a way that helped or hurt the applicant in the interview. Thus, it is important for
employees to create a positive first impression and to consider that the first impression is
formed as soon as any information about the employee is conveyed. This first impression
create supervisor expectations that bias later interactions and performance ratings,
especially if on-the-job performance is low. An employee who made a good first
impression may be offered more chances than a coworker performing equally poorly.
Limitations and Future Research
Though confirmation bias offers up a potential explanation for the findings of
these studies, it is still unclear why the bias occurred only for low on-the-job performers.
The replication of this finding in Study 2 makes it less likely it is a statistical anomaly.
Only two levels of performance (high and low) were used, making it difficult to
understand the boundaries of this phenomenon. Future research should address this
limitation using more variation in performance.
Another limitation of both studies is the use of vignettes rather than real world
behavior. In most organizations, impressions of the employee’s on-the-job performance
37
are made through multiple interactions and sources of information over time, rather than
just reading a letter of recommendation. Perceptions of an employee’s performance are
likely modified with each of these interactions. Additionally, a vignette cannot
realistically simulate the richness of real-world supervisor-employee interactions, which
further limits the generalizability of these findings. Repeating these studies in the field
longitudinally will be necessary to ensure generalizability and investigate the boundaries
of the confirmation bias.
Future research should also examine the type of pre-hire information and how this
might differentially bias later performance ratings. These studies used letters of
recommendation, which is only one form of pre-hire information. Other forms provide
different facets of the applicant’s personality which may lead to stronger or weaker first
impressions. For example, interviews allow applicants to explain their past performance,
whereas letters of recommendation are written by someone other than the applicant.
Supervisors may weigh one source more heavily than the other more when forming their
first impression.
Finally, it is unclear why EVT theory did not explain the biases in the current set
of studies, but did explain the biases in similar studies (e.g. Bendersky & Shah, 2013;
Heilman & Chen, 2005; Jackson, Sullivan & Hodge, 1993). Future research should
specifically examine if EVT is only relevant when there are strongly held cultural
stereotypes such as for race and gender. Future research should also examine the
variables of EVT and first impressions together to uncover how they interact.
38
Conclusions
These two studies were designed to examine performance expectations as a
source of performance appraisal bias using EVT theory as the underlying mechanism for
this phenomenon. Though expectation violations did occur, EVT theory did not explain
the biases in these studies. Rather, expectations may have caused participants to engage
in confirmation bias. However, this bias only existed for low performers, which suggest
that on-the-job performance may moderate this phenomenon. This pair of studies
demonstrates both the influence of expectations and the criticality of pre-interview
information. Supervisors often receive information about potential employees, such as
their application, resume, letters of recommendation, and test scores, before ever meeting
them in person. It is important for applicants to realize the impact this pre-hire
information may have, not just on their hiring chances, but also on their long term
relationship with their supervisor.

39
REFERENCES
Abrami, P. C., & Mizener, D. A. (1985). Student/instructor attitude similarity, student
ratings, and course performance. Journal of Educational Psychology, 77(6), 693.
Allen, T. D., & Rush, M. C. (1998). The effects of organizational citizenship behavior on
performance judgments: A field study and a laboratory experiment. Journal of
Applied Psychology, 83(2), 247-260. doi:10.1037/0021-9010.83.2.247
Ambady, N., & Rosenthal, R. (1992). Thin slices of expressive behavior as predictors of
interpersonal consequences: A meta-analysis. Psychological Bulletin, 111, 256–
274.
Anderson, J. (1976). Language, memory and thought. Hillsdale, NJ: Erlbaum Associates.
Afifi, W. A., & Faulkner, S. L. (2000). On being 'just friends': The frequency and impact
of sexual activity in cross-sex friendships. Journal of Social and Personal
Relationships, 17(2), 205-222. doi:10.1177/0265407500172003
Afifi, W.A., & Metts, S. (1998). Characteristics and consequences of expectation
violations in close relationships Journal of Social and Personal Relationships, 15,
365–392
Aguinis, H. (2009a). An expanded view of performance management. Performance
management: Putting research into practice, 1-43.
Aguinis , H.( 2009b). Performance management ( 2nd ed .). Upper Saddle River, NJ :
Pearson Prentice Hall .

40
Aguinis, H., & Pierce, C. A. (2008). Enhancing the relevance of organizational behavior
by embracing performance management research. Journal of Organizational
Behavior, 29(1), 139-145.
Bendersky, C., & Shah, N. P. (2013). The downfall of extraverts and rise of neurotics:
The dynamic process of status allocation in task groups. Academy of Management
Journal, 56(2), 387-406.
Berger, C. R., Calabrese, R. J. (1975). Some exploration in initial interaction and beyond:
Toward a developmental theory of communication. Human Communication
Research, 1, 99–112.
Bernthal, P. R., Rogers, R. W., & Smith, A. B. (2003). Managing performance: Building
accountability for organizational success. Pittsburgh, PA: Development
Dimensions International.
Bettencourt, B.A., Dill, K.E., Greathouse, S.A., Charlton, K., & Mulholland, A. (1996).
Evaluations of ingroup and outgroup members: The role of category-based
expectancy violation. Journal of experimental social psychology 33(3), 244-275.
Bevan, J. L. (2003). Expectancy violation theory and sexual resistance in close, cross-sex
relationships. Communication Monographs, 70(1), 68-82. doi:10.1080/715114662
Bevan, J.L., Ang, P.C., Fearns, J.B. (2014) Being unfriended on Facebook: An
application of expectancy violation theory. Computers in Human Behavior 33
171–178.
Biernat, M., Vescio, T. K., & Billings, L. S. (1999). Black sheep and expectancy
violation: Integrating two models of social judgment. European Journal of Social
Psychology, 29(4), 523-542.
41
Bjerke, D. G., Cleveland, J. N., Morrison, R. F., & Wilson, W. C. (1987).Officer fitness
report evaluation study (No. NPRDC-TR-88-4). Navy Personnel Research and
Development Center San Diego, CA.
Borman, W. C., & Motowidlo, S. J. (1993). Expanding the criterion domain to include
elements of contextual performance. In N. Schmitt & W. C. Borman (Eds.),
Personnel selection in organizations (pp. 71-98). San Francisco: Jossey-Bass.
Brief, A. P., & Motowidlo, S. J. (1986). Prosocial organizational behaviors. Academy of
Management Review, 11, 710–725
Brown, B.K., & Campion, M.A. (1994) Biodata phenomenology: Recruiters’ perceptions
and use of biographical information in resume screening. Journal of Applied
Psychology, 79, 897-908.
Burgoon, J.K. (1993). Interpersonal expectations, expectancy violations, and emotional
communication. Journal of Language and Social Psychology, 12(1) 30-48.
Burgoon, J.K. & Jones, S.B. (1976). Toward a theory of personal space expectations and
their violations. Human Communication Research, 2 p. 131–146
Conway, J.M. (1999). Distinguishing contextual performance from task performance for
managerial jobs. Journal of Applied Psychology, 84 (1), 3-13.
Conway, J. M., & Huffcutt, A. I. (1997). Psychometric properties of multisource
performance ratings: A meta-analysis of subordinate, supervisor, peer, and self-
ratings. Human Performance, 10(4), 331-360.
DeNisi, A., & Smith, C. E. (2014). Performance appraisal, performance management, and
firm-level performance: A review, a proposed model, and new directions for
future research. The Academy of Management Annals,8(1), 127-179.

42
Festinger, L. (1957). A Theory of cognitive dissonance. Stanford, CA: Stanford
University Press.
Floyd, K., & Voloudakis, M. (1999). Attributions for expectancy violating changes in
affectionate behavior in platonic friendships. The Journal of Psychology:
Interdisciplinary and Applied, 133(1), 32-48. doi:10.1080/00223989909599720
George, J. M., & Brief, A. P. (1992). Feeling good-doing good: A conceptual analysis of
the mood at work-organizational spontaneity relationship. Psychological
Bulletin, 112(2), 310-329. doi:10.1037/0033-2909.112.2.310
Gocłowska, M. A., Baas, M., Crisp, R. J., & De Dreu, C. W. (2014). Whether social
schema violations help or hurt creativity depends on need for
structure. Personality and Social Psychology Bulletin, 40(8), 959-971.
doi:10.1177/0146167214533132
Grover, S. L., Hasel, M. C., Manville, C., & Serrano-Archimi, C. (2014). Follower
reactions to leader trust violations: A grounded theory of violation types,
likelihood of recovery, and recovery process. European Management Journal,
doi:10.1016/j.emj.2014.01.002
Heilman, M. E. & Chen, J. J. (2005). Same behavior, different consequences: Reactions
to men’s and women’s altruistic citizenship behavior. Journal of Applied
Psychology, 90(3), 431-441.
Hoffman, B. J., Blair, C. A., Meriac, J. P., & Woehr, D. J. (2007). Expanding the
criterion domain? A quantitative review of the OCB literature. Journal of Applied
Psychology, 92(2), 555-566. doi:10.1037/0021-9010.92.2.55

43
Jackson, L. A., Sullivan, L. A., & Hodge, C. N. (1993). Stereotype effects of attributions,
predictions, and evaluations: No two social judgments are quite alike. Journal of
Personality and Social Psychology, 65(1), 69-84. doi:10.1037/0022-3514.65.1.69
Joardar, A. (2011). Examining changes in group acceptance of a newcomer from a
different culture: An expectancy violation perspective. International Journal of
Cross Cultural Management, 11(3), 341-362. doi:10.1177/1470595811425630
Johnson, D. I., & Lewis, N. (2010). Perceptions of swearing in the work setting: An
expectancy violations theory perspective. Communication Reports, 23(2), 106-
118. doi:10.1080/08934215.2010.511401
Jonas, E., Schulz-Hardt, S., Frey, D., & Thelen, N. (2001). Confirmation bias in
sequential information search after preliminary decisions: An expansion of
dissonance theoretical research on selective exposure to information. Journal of
Personality And Social Psychology, 80(4), 557-571. doi:10.1037/0022-
3514.80.4.557
Katz, D., & Kahn, R.L. (1978). The social psychology of organizations. New York:
Wiley.
Kernahan, C., Bartholow, B. D., & Bettencourt, B. A. (2000). Effects of category-based
expectancy violation on affect-related evaluations: Toward a comprehensive
model. Basic and Applied Social Psychology, 22(2), 85-100.
doi:10.1207/15324830051036171
LePine, J. A., Erez, A., & Johnson, D. E. (2002). The nature and dimensionality of
organizational citizenship behavior: A critical review and meta-analysis. Journal
of Applied Psychology, 87(1), 52-65. doi:10.1037/0021-9010.87.1.52

44
Lerner, M. J., & Simmons, C. H. (1966). Observer’s reaction to the “innocent victim”:
Compassion or rejection? Journal of Personality and Social Psychology, 4, 203–
210.
Motowidlo, S. J. 2003. Job Performance. Handbook of Psychology. One:3:39–53.
Motowidlo, S. J., & Van Scotter, J. R. (1994). Evidence that task performance should be
distinguished from contextual performance. Journal of Applied psychology, 79(4),
475.
Organ, D.W. (1988). Organizational citizenship behavior: The good soldier syndrome.
Lexington MA: Lexington Books.
Organ, D. W. (1997). Organizational citizenship behavior: It's construct clean-up
time. Human Performance, 10(2), 85-97. doi:10.1207/s15327043hup1002_2
Podsakoff, P.M., MacKenzie, S.B., Moorman, R.H., Fetter, R. (1990). Transformational
leader behaviors and their effects on followers’ trust in leader, satisfaction, and
organizational citizenship behaviors. Leadership Quarterly, 1(2), 107-142.
Prendergast, C., & Topel, R. (1993). Discretion and bias in performance
evaluation. European Economic Review, 37(2-3), 355-365.
Rogers, T. B., Kuiper, N. A., & Kirker, W. S. (1977). Self-reference and the encoding of
personal information. Journal of Personality and Social Psychology, 35(9), 677-
688. doi:10.1037/0022-3514.35.9.677
Rotundo, M., & Sackett, P. R. (2002). The relative importance of task, citizenship, and
counterproductive performance to global ratings of job performance: A policy-
capturing approach. Journal of Applied Psychology, 87(1), 66-80.
doi:10.1037/0021-9010.87.1.66
45
Sackett, P. R., & DeVore, C. J. (2002). Counterproductive behaviors at work. In
Handbook of industrial, work and organizational psychology: Personnel
psychology (Vol. 1, pp. 145–164). Thousand Oaks, CA: Sage Publications Ltd.
Shore , T. H. , Adams , J. S. , & Tashchian , A.( 1998 ). Effects of self - appraisal
information, appraisal purpose, and feedback target on performance appraisal
ratings. Journal of Business and Psychology, 12, 283 – 298.
Smith, C. A., Organ, D. W., & Near, J. P. (1983). Organizational citizenship behavior: Its
nature and antecedents. Journal of Applied Psychology,68(4), 653-663.
doi:10.1037/0021-9010.68.4.653
Steele, C. M. (1997). A threat in the air: How stereotypes shape intellectual identity and
performance. American Psychologist, 52(6), 613-629. doi:10.1037/0003-
066X.52.6.613
Stein, D. J. (1992). Schemas in the cognitive and clinical sciences. Journal of
Psychotherapy Integration, 2, 45-63
Van Dyne, L., Cummings, L. L., & McLean Parks, J. M. (1995). Extra-role behaviors: In
pursuit of construct and definitional clarity (A bridge over muddied waters). In L.
L. Cummings & B. M. Staw (Eds.), Research in organizational behavior (Vol. 17,
pp. 215–285). Greenwich, CT: JAI Press.
Viswesvaran, C., & Ones, D. S. (2000). Perspectives on models of job performance.
International Journal of Selection and Assessment, 8(4), 216-226.
doi:10.1111/1468-2389.00151
46
Viswesvaran, C., Ones, D. S., & Schmidt, F.L. (1996). Comparative analysis of the
reliability of job performance ratings. Journal of Applied Psychology, 81, 557-
574.
Viswesvaran, C., Schmidt, F., & Ones, D.S. (1996, April). Modeling job performance: Is
there a general factor? Poster presented at the eleventh annual meeting of the
Society for Industrial and Organizational Psychology, San Diego, CA.
Viswesvaran, C., Schmidt, F. L., & Ones, D. S. (2005). Is There a General Factor in
Ratings of Job Performance? A Meta-Analytic Framework for Disentangling
Substantive and Error Influences. Journal of Applied Psychology, 90(1), 108-131.
doi:10.1037/0021-9010.90.1.108
Wayne, S. J., Shore, L. M., Bommer, W. H., & Tetrick, L. E. (2002). The role of fair
treatment and rewards in perceptions of organizational support and leader-
member exchange. Journal of Applied Psychology, 87(3), 590-598.
doi:10.1037/0021-9010.87.3.590
Williams, L. J., & Anderson, S. E. (1991). Job satisfaction and organizational
commitment as predictors of organizational citizenship and in-role behaviors.
Journal of Management, 17(3), 601-617. doi:10.1177/014920639101700305

47
APPENDICES

48
Appendix A: OCB Scale
Adapted from Podsakoff, MacKenzie, Moorman, and Fetter (1990)
Time 1 (pre-hire) Instructions: Please rate the extent to which you expect Jerry to perform
the following behaviors.
Time 2 (post-hire) Instructions: Please rate the extent to which you think Jerry performed
the following behaviors.
1.Strongly Disagree
2. Disagree
3. Somewhat Disagree
4. Neither Agree nor Disagree
5. Somewhat Agree
6.Agree
7. Strongly Agree
Altruism
1. Helps others who have been absent.
2. Helps others who have heavy workloads.
3. Helps orient new people even though it is not required.
4. Willingly helps others who have work related problems.
5. Is always ready to lend a helping hand to those around him/her.
Conscientiousness
1. Attendance at work is above the norm.
2. Does not take extra breaks.
3. Obeys company rules and regulations even when no one is watching.
4. Is one of my most conscientious employees.
5. Believes in giving an honest day’s work for an honest day’s pay.
Sportsmanship
1. Consumes a lot of time complaining about trivial matters. (R)
2. Always focuses on what is wrong rather than the positive side. (R)
3. Tends to make “mountains out of molehills.” (R)
4. Always finds fault with what the organization is doing. (R)
5. Is the classic “squeaky wheel” that always needs greasing. (R)
Courtesy
1. Takes steps to try to prevent problems with other workers.
2. Is mindful of how his/her behavior affects other people’s jobs.
3. Does not abuse the rights of others.
49
4. Tries to avoid creating problems for coworkers.
5. Considers the impact of his/her actions on coworkers.
Civic Virtue
1. Attends meetings that are not mandatory, but are considered important.
2. Attends functions that are not required, but help the company image.
3. Keeps abreast of changes in the organization.
4. Reads and keeps up with organization announcements, memos, and so on.

50
Appendix B: Example Performance Vignettes
I. Pre-Hire
a. Scenario 1: High Task Performance
I have worked closely with Jerry for the past 5 years. He is very
organized and keeps concise records of all decisions made on the project.
He holds weekly meetings with the job-site staff in which he monitors
project progress and sets project goals for the upcoming week.
Additionally, throughout the week he checks in with the project
team to ensure they are on track for goal completion. When there are
changes to the building plans, he works closely with the subcontractors
and building owner to renegotiate contracts and ensure the entire team is
onboard with all changes.
He personally reviews subcontractor work before payment is made
to ensure the work is completed as billed and up to company quality
standards. His attention to financial details has ensured that all of the
projects he’s managed have been completed on-time and under budget.
b. Scenario 2: Low Task Performance
I have worked closely with Jerry for the past 5 years. He is
unorganized and does not document project decisions. He has a laissez-
faire management style, such that he lets his project team perform without
much oversite.
Subcontractors and building owners that work with him frequently
complain that they are not aware of the buildings’ progress or changes to
the building plans. He does not check up on the quality of subcontractor
work done in the building before payment is made, nor does he re-budget
when there are changes to the building plan. His lack of attention to
financial details has resulted in many of the projects he’s managed being
completed late, and over budget.
c. Scenario 3: High OCB
I have worked closely with Jerry for the past 5 years. He
consistently goes above and beyond his job description. This is apparent in
the culture he creates within every project team he works with. He
encourages a positive, can-do attitude from his employees. He takes the
project team out to lunch once a month, to build cohesiveness and boost
morale. He consistently shows an interest in the lives of his team
members, and is always available to back-up a subordinate that is
overworked. He is a mentor to many young employees in our
organization.
He makes himself available after work hours to answer any
questions the building owners or subcontracts may have. Additionally, he
regularly participates in community trade events to build relationships
with vendors and promote the company.
d. Scenario 4: Low OCB

51
I have worked closely with Jerry for the past 5 years. He typically does
the minimum amount of work required. He complains often about the quality
of the work his team members’ produce, and speaks negatively about his co-
workers in front of subcontractors and building owners. Young employees
prefer not to work on his team because he does not provide any mentorship.
He asks that his team members focus on their tasks when at work and
not spend time talking about their personal lives. He leaves the job site by
5pm every day and makes it clear he does not want to be bothered after hours.
He does not join his co-workers when they participate in community trade
events to build relationships with vendors and promote the company.
II. Post-Hire
a. Scenario 5: High Task Performance
Jerry has been working with us for the past 6-months. The project he is
managing is on-time and within-budget. This is likely due to his attention to
detail and close monitoring of team progress. He is organized with project
details, and communicates information promptly and concisely with all team
members. There have been significant changes to the building from the
architect and Jerry has successfully adapted these changes. For example, he
has renegotiated subcontractor contracts and timelines and ensured the
building owner is kept abreast of cost and scope changes.
b. Scenario 6: Low Task Performance
Jerry has been working with us for the past 6-months. The project he is
managing is not on-time, nor within-budget. There have been significant
changes to the building from the architect and Jerry has had difficulty
adapting these changes. He struggles to organize project details and needs to
communicate with his team more frequently. He has spoken with
subcontractors about the changes, but did not submit time or cost changes to
the owner to ensure we and the subcontractors would be compensated for the
additional work.
c. Scenario 7: High OCB
Jerry has been working with us for the past 6-months. He has quickly
established himself as a mentor to young up-and-coming employees. He rarely
misses a day of work, and consistently makes himself available to weekend
emergencies. He volunteered to help with this year’s recruitment, and
travelled to several colleges to promote the company. Though this job requires
long hours and can be stressful, Jerry always comes to work with a positive
attitude. When subordinates have difficulty handling a heavy workload, he
offers assistance and helps them develop a plan to successfully complete
tasks.
d. Scenario 8: Low OCB
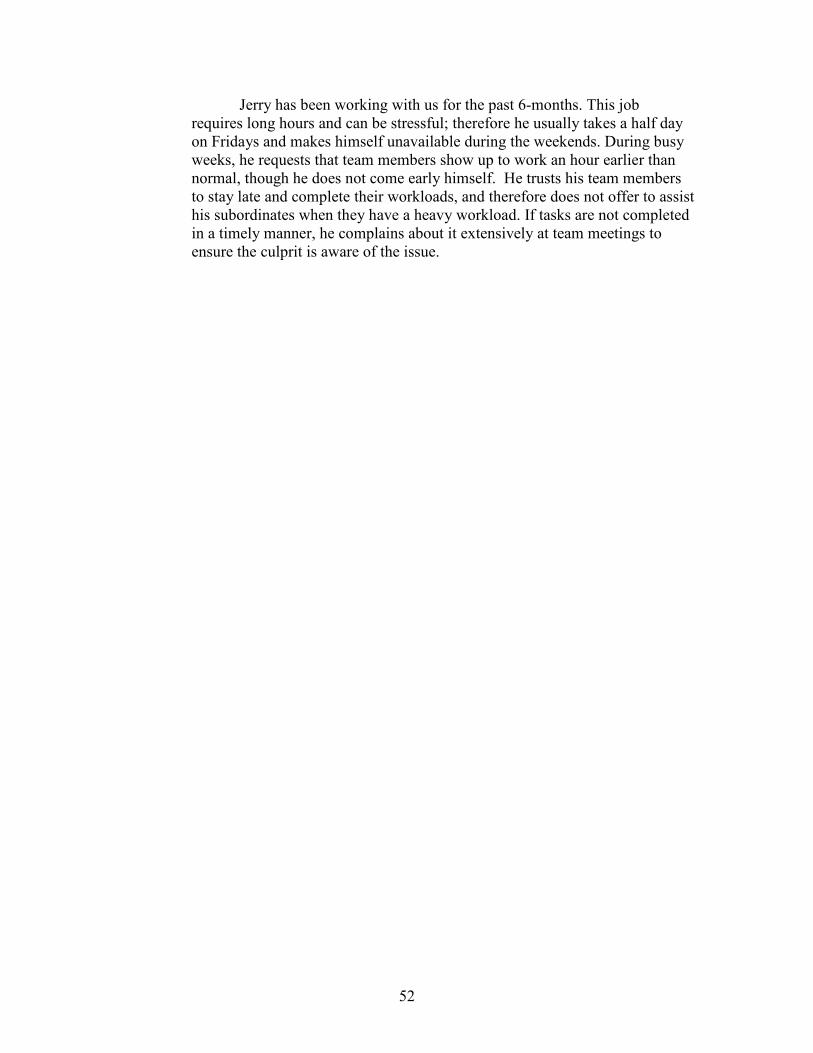
52
Jerry has been working with us for the past 6-months. This job
requires long hours and can be stressful; therefore he usually takes a half day
on Fridays and makes himself unavailable during the weekends. During busy
weeks, he requests that team members show up to work an hour earlier than
normal, though he does not come early himself. He trusts his team members
to stay late and complete their workloads, and therefore does not offer to assist
his subordinates when they have a heavy workload. If tasks are not completed
in a timely manner, he complains about it extensively at team meetings to
ensure the culprit is aware of the issue.
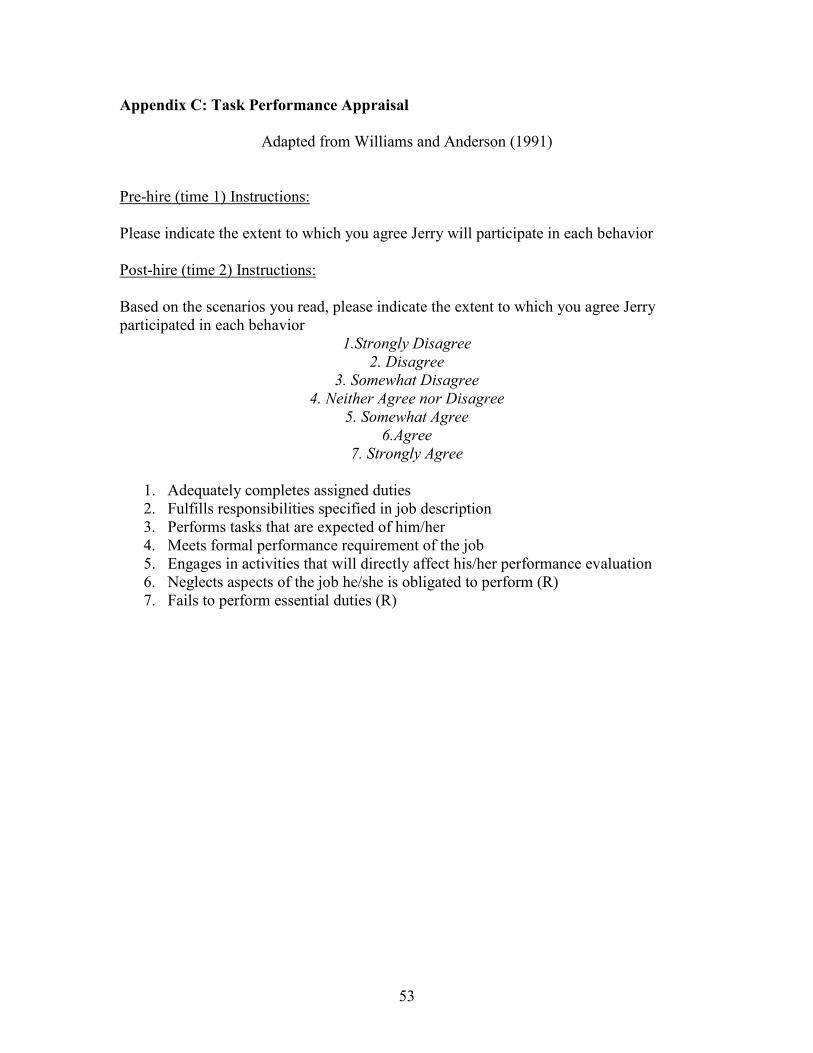
53
Appendix C: Task Performance Appraisal
Adapted from Williams and Anderson (1991)
Pre-hire (time 1) Instructions:
Please indicate the extent to which you agree Jerry will participate in each behavior
Post-hire (time 2) Instructions:
Based on the scenarios you read, please indicate the extent to which you agree Jerry
participated in each behavior
1.Strongly Disagree
2. Disagree
3. Somewhat Disagree
4. Neither Agree nor Disagree
5. Somewhat Agree
6.Agree
7. Strongly Agree
1. Adequately completes assigned duties
2. Fulfills responsibilities specified in job description
3. Performs tasks that are expected of him/her
4. Meets formal performance requirement of the job
5. Engages in activities that will directly affect his/her performance evaluation
6. Neglects aspects of the job he/she is obligated to perform (R)
7. Fails to perform essential duties (R)
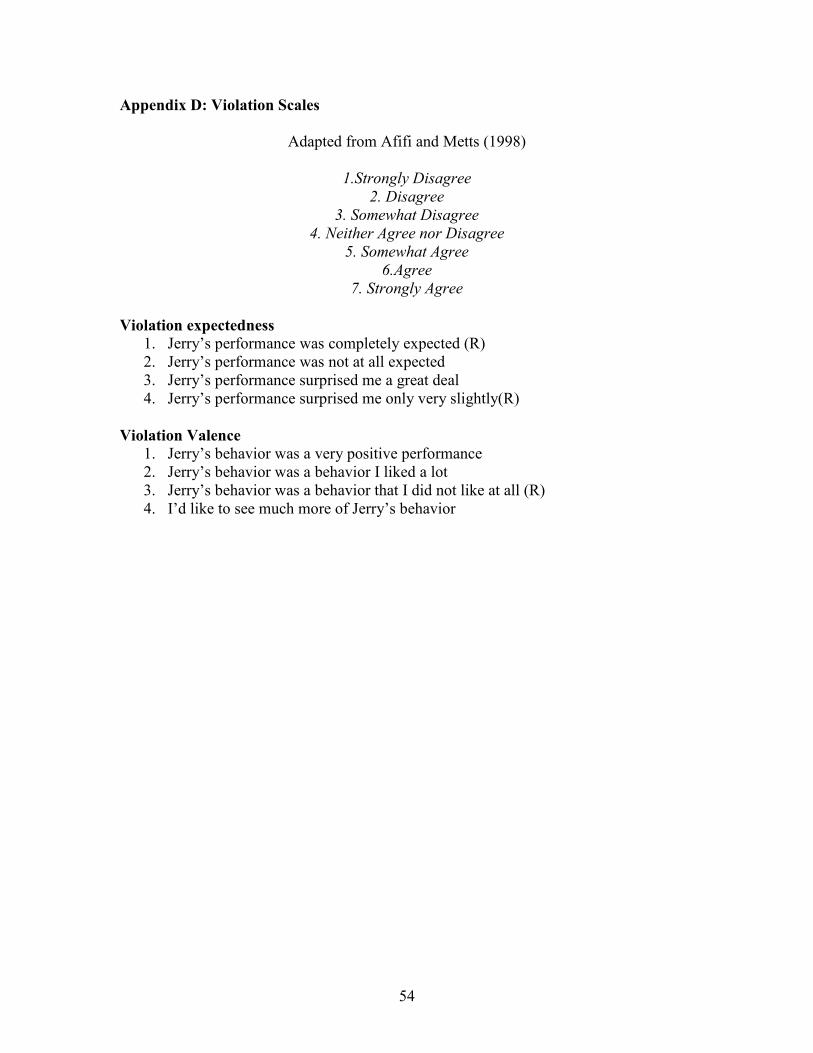
54
Appendix D: Violation Scales
Adapted from Afifi and Metts (1998)
1.Strongly Disagree
2. Disagree
3. Somewhat Disagree
4. Neither Agree nor Disagree
5. Somewhat Agree
6.Agree
7. Strongly Agree
Violation expectedness
1. Jerry’s performance was completely expected (R)
2. Jerry’s performance was not at all expected
3. Jerry’s performance surprised me a great deal
4. Jerry’s performance surprised me only very slightly(R)
Violation Valence 1. Jerry’s behavior was a very positive performance
2. Jerry’s behavior was a behavior I liked a lot
3. Jerry’s behavior was a behavior that I did not like at all (R)
4. I’d like to see much more of Jerry’s behavior
55
Appendix E: Reward Recommendations
Adapted from Allen and Rush (1998)
Using the rating scale below, please rate the extent to which you would recommend Jerry
for each of the following.
1. Would definitely not recommend
2. Would not recommend
3. Neutral
4. Would recommend
5. Would definitely recommend
1. Raise (salary increase)
2. Promotion
3. High profile project
4. Public recognition (e.g. a company award)
5. Opportunities for professional development
6. Termination (R)
7. Demotion (R)
56
Appendix F: Demographics
1. On average how many hours do you work at your job per week (If currently
unemployed mark 0)
a. ______ hours per week on average
2. How many years of experience do you have as a supervisor or manager of other
employees?
a. Dropdown box (0, less than 1 year, 1, 2, 3…30, more than 30
3. Do you have experience rating the performance of employees?
a. Yes
b. No
4. Do you currently or have you ever worked in the construction industry?
a. Yes
b. No
5. What sex do you identify with?
a. Male
b. Female
6. In what year were you born?
a. ______
7. What race/ethnicity do you identify with? (Check all that apply)
a. White
b. Black
c. Hispanic
d. Asian
e. Middle Eastern or North African
f. Pacific Islander
g. American Indian or Alaskan Native

57
Appendix G: Treatment Groups
Scenarios numbers correspond to the example scenarios in Appendix B. Treatment group
numbers correspond to the hypothesis testing comparison groups in Appendix I.
Treatment
Group
Performance
Variable
Time 1
Scenario
Time 2
Scenario
1 Task Performance 1 5
2 Task Performance 1 6
3 Task Performance 2 5
4 Task Performance 2 6
5 OCB 3 7
6 OCB 3 8
7 OCB 4 7
8 OCB 4 8

58
Appendix H: Introduction Story
You are the owner of a commercial construction company. You have just won a
new project, building a 13.2 million dollar hotel, and need to hire a new project manager
to run the job. Because this is a big job, you will need a competent project manager that
keeps on top of progress and doesn’t let details fall through the cracks. Without a
competent project manager, your company could lose a large amount of money.

59
Appendix I: Hypotheses
DV
Pe
rfo
ram
an
ce
Typ
e
Co
mp
ari
so
n G
rou
ps
Exp
ecta
tio
n
Vio
lati
on
H1
aH
igh
po
ten
tials
at
tim
e 1
who
exh
ibit
low
ta
sk p
erfo
rma
nce
at
tim
e 2
wil
l ha
ve
hig
her
vio
lati
ons
of
exp
ecta
tion
s th
an l
ow
pote
nti
als
at
tim
e 1
wh
o e
xhib
it e
qu
iva
lentl
y lo
w t
ask
per
form
ance
at
tim
e 2
Ta
sk
Gro
up
2 v
s G
rou
p 4
Exp
ecta
tio
n
Vio
lati
on
H1
bH
igh
po
ten
tials
at
tim
e 1
who
exh
ibit
low
OC
B a
t ti
me
2 w
ill
hav
e hig
her
vio
lati
ons
of
expec
tati
ons
than
lo
w p
ote
nti
als
at
tim
e 1
who
exh
ibit
eq
uiv
ale
ntl
y lo
w O
CB
at
tim
e 2
OC
BG
rou
p 6
vs G
rou
p 8
Exp
ecta
tio
n
Vio
lati
on
H2
aH
igh
po
ten
tials
at
tim
e 1
who
exh
ibit
hig
h t
ask
per
form
an
ce a
t ti
me
2 w
ill
ha
ve
low
er
vio
lati
ons
of
exp
ecta
tion
s th
an l
ow
pote
nti
als
at
tim
e 1
wh
o e
xhib
it e
qu
iva
lentl
y h
igh
per
form
ance
at
tim
e 2
.
Ta
sk
Gro
up
1 v
s G
rou
p 3
Exp
ecta
tio
n
Vio
lati
on
H2
bH
igh
po
ten
tials
at
tim
e 1
who
exh
ibit
hig
h O
CB
at
tim
e 2 w
ill h
av
e lo
wer
vio
lati
ons
of
expec
tati
ons
than
lo
w p
ote
nti
als
at
tim
e 1
who
exh
ibit
eq
uiv
ale
ntl
y hig
h O
CB
at
tim
e 2
OC
BG
rou
p 5
vs G
rou
p 7
Pe
rfo
rma
nce
H3
aH
igh
po
ten
tials
at
tim
e 1
who
exh
ibit
low
ta
sk p
erfo
rma
nce
at
tim
e 2
wil
l ha
ve
low
er t
ask
per
form
ance
ra
ting
s th
an l
ow
pote
nti
als
at
tim
e 1 w
ho e
xhib
it e
qu
iva
lentl
y lo
w p
erfo
rma
nce
at
tim
e 2
Ta
sk
Gro
up
2 v
s G
rou
p 4
Pe
rfo
rma
nce
H3
bH
igh
po
ten
tials
at
tim
e 1
who
exh
ibit
low
OC
B a
t ti
me
2 w
ill
hav
e lo
wer
per
form
an
ce
rati
ngs
than
lo
w p
ote
nti
als
at
tim
e 1
who
exh
ibit
eq
uiv
ale
ntl
y lo
w O
CB
at
tim
e 2
OC
BG
rou
p 6
vs G
rou
p 8
Pe
rfo
rma
nce
H4
aH
igh
po
ten
tials
at
tim
e 1
who
exh
ibit
hig
h t
ask
per
form
an
ce a
t ti
me
2 w
ill
ha
ve
low
er
per
form
ance
ra
ting
s th
an l
ow
pote
nti
als
at
tim
e 1 w
ho e
xhib
it e
qu
iva
lentl
y h
igh
task
per
form
ance
at
tim
e 2
Ta
sk
Gro
up
1 v
s G
rou
p 3
Pe
rfo
rma
nce
H4
bH
igh
po
ten
tials
at
tim
e 1
who
exh
ibit
hig
h O
CB
at
tim
e 2 w
ill h
av
e lo
wer
per
form
ance
rati
ngs
than
lo
w p
ote
nti
als
at
tim
e 1
who
exh
ibit
eq
uiv
ale
ntl
y hig
h O
CB
at
tim
e 2
OC
BG
rou
p 5
vs G
rou
p 7
Re
wa
rd
H5
aH
igh
po
ten
tials
at
tim
e 1
who
exh
ibit
low
ta
sk p
erfo
rma
nce
at
tim
e 2
wil
l ha
ve
low
er r
eward
reco
mm
enda
tio
ns
tha
n lo
w p
ote
nti
als
at
tim
e 1
wh
o e
xh
ibit
eq
uiv
ale
ntl
y lo
w t
ask
per
form
ance
at
tim
e 2
Ta
sk
Gro
up
2 v
s G
rou
p 4
Re
wa
rd
H5
bH
igh
po
ten
tials
at
tim
e 1
who
exh
ibit
low
OC
B a
t ti
me
2 w
ill
hav
e lo
wer
rew
ard
reco
mm
enda
tio
ns
tha
n lo
w p
ote
nti
als
at
tim
e 1
wh
o e
xh
ibit
eq
uiv
ale
ntl
y lo
w O
CB
at
tim
e 2
OC
BG
rou
p 6
vs G
rou
p 8
Re
wa
rdH
6a
Hig
h p
ote
nti
als
at
tim
e 1
who
exh
ibit
hig
h t
ask
per
form
an
ce a
t ti
me
2 w
ill
ha
ve
low
er
rew
ard
rec
om
men
dati
ons
than
lo
w p
ote
nti
als
at
tim
e 1 w
ho
exh
ibit
eq
uiv
ale
ntl
y hig
h t
ask
per
form
ance
at
tim
e 2
.
Ta
sk
Gro
up
1 v
s G
rou
p 3
Re
wa
rdH
6b
Hig
h p
ote
nti
als
at
tim
e 1
who
exh
ibit
hig
h O
CB
at
tim
e 2 w
ill h
av
e lo
wer
rew
ard
reco
mm
enda
tio
ns
tha
n lo
w p
ote
nti
als
at
tim
e 1
wh
o e
xh
ibit
eq
uiv
ale
ntl
y h
igh
OC
B a
t ti
me
2.
OC
BG
rou
p 5
vs G
rou
p 7
Hyp
oth
esis
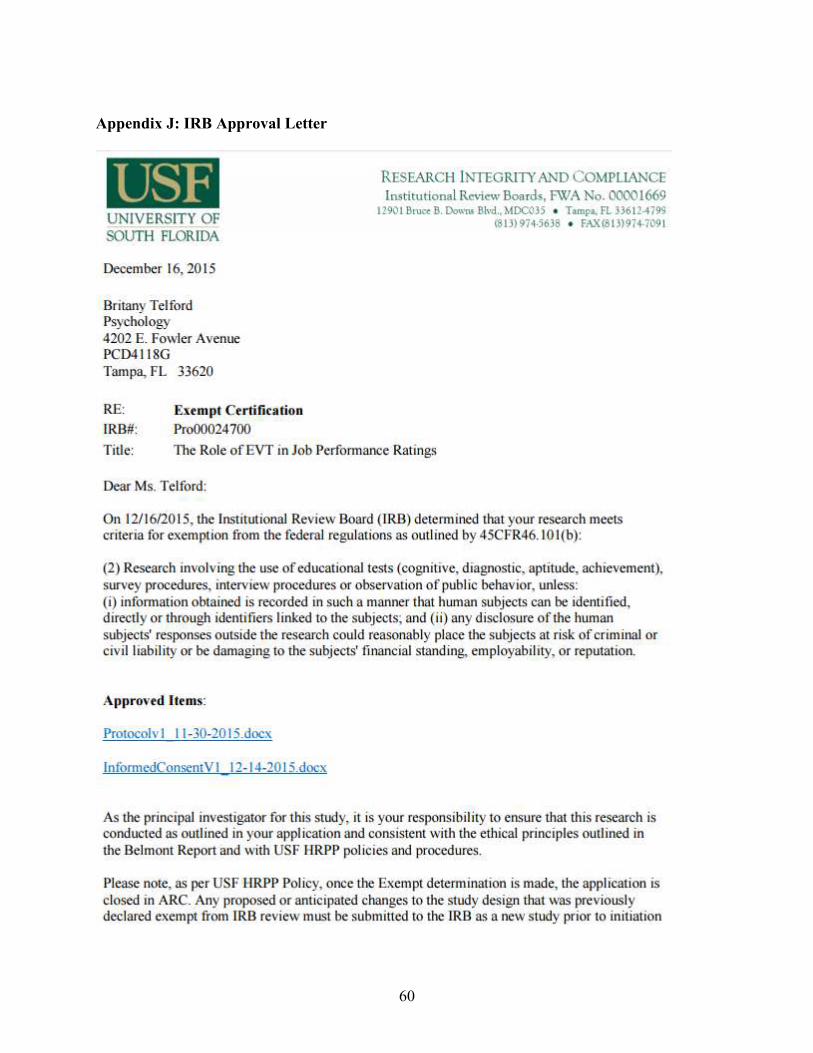
60
Appendix J: IRB Approval Letter

61
Related Documents