Strategic Business Development & Intelligence, Kent County Council www.kent.gov.uk/research Business Intelligence Statistical Bulletin January 2018 Life expectancy in Kent Related information This bulletin presents life expectancy at birth and at age 65 for males and females in Kent for 2014-2016 along with a 10-year time series of change. Additional health state life expectancy at birth and at age 65 for Kent the South East and England are also presented. Summary of findings Males born in Kent between 2014 and 2016 have a life expectancy of 79.9 years, whilst for females it is 83.4 years. +3.4 years longer than males. The England average is 79.5 years for males and 83.1 years for females. +3.6 years longer than males. Life expectancy at birth for males in Kent has increased by +2.3 years over the past ten years and by +1.7 years for females. In Kent, a male resident aged 65 between 2014 and 2016 can expect to live another 18.9 years, whereas for a female it is 21.3 years. The England average is 18.8 years for males and 21.1 years for females. Nationally, life expectancy at age 65 for males has increased by +1.7 years and for females by +1.3 years over the last 10 years. In Kent, the increase has been +1.5 years for males and +1.3 years for females. Despite the increase in male life expectancy being greater than the increase in female life expectancy over the past ten years, females can still expect to live longer than males. Males born in Kent between 2014 and 2016 have a healthy life expectancy up to age 64.2 years, whilst females born at this time can expect to be healthy up to 65.1 years. The Population and Census web page contains further information which you may find useful. Population change presents a time-series of population estimates and an analysis of population growth Population forecasts presents the latest thinking about future population levels 2011 Census provides information of the characteristics of the population NOTE: within this bulletin ’Kent’ refers to the Kent County Council (KCC) area which excludes Medway Strategic Business Development & Intelligence Kent County Council Sessions House Maidstone Kent ME14 1XQ Email: [email protected] Tel: 03000 417444

Welcome message from author
This document is posted to help you gain knowledge. Please leave a comment to let me know what you think about it! Share it to your friends and learn new things together.
Transcript
Strategic Business Development & Intelligence, Kent County Council www.kent.gov.uk/research
[ Business Intelligence Statistical Bulletin January 2018
Life expectancy in Kent
Related information
This bulletin presents life expectancy at birth and at age 65 for males and females in Kent for 2014-2016 along with a 10-year time series of change. Additional health state life expectancy at birth and at age 65 for Kent the South East and England are also presented. Summary of findings Males born in Kent between 2014 and 2016 have a
life expectancy of 79.9 years, whilst for females it is 83.4 years. +3.4 years longer than males. The England average is 79.5 years for males and 83.1 years for females. +3.6 years longer than males.
Life expectancy at birth for males in Kent has increased by +2.3 years over the past ten years and by +1.7 years for females.
In Kent, a male resident aged 65 between 2014 and 2016 can expect to live another 18.9 years, whereas for a female it is 21.3 years. The England average is 18.8 years for males and 21.1 years for females.
Nationally, life expectancy at age 65 for males has increased by +1.7 years and for females by +1.3 years over the last 10 years. In Kent, the increase has been +1.5 years for males and +1.3 years for females.
Despite the increase in male life expectancy being greater than the increase in female life expectancy over the past ten years, females can still expect to live longer than males.
Males born in Kent between 2014 and 2016 have a healthy life expectancy up to age 64.2 years, whilst females born at this time can expect to be healthy up to 65.1 years.
The Population and Census
web page contains further
information which you may find
useful.
Population change presents a
time-series of population
estimates and an analysis of
population growth
Population forecasts presents
the latest thinking about future
population levels
2011 Census provides
information of the
characteristics of the
population
NOTE: within this bulletin
’Kent’ refers to the Kent
County Council (KCC) area
which excludes Medway
Strategic Business
Development &
Intelligence
Kent County Council
Sessions House
Maidstone
Kent
ME14 1XQ
Email:
Tel: 03000 417444
Strategic Business Development & Intelligence, Kent County Council www.kent.gov.uk/research
Page 1
Introduction
Life expectancy figures are provided annually by the Office for National
Statistics (ONS). The latest information for England and Wales was released
on 7 December 2017 and presents a revised time-series from the year
2004/06 to 2014/16.
All figures are three year averages, produced by aggregating the number of
deaths and mid-year population estimates across each three-year period. This
provides large enough numbers to ensure that figures presented are
sufficiently robust and eliminates any effects of extremely large numbers of
births or deaths in any one year.
Life expectancy is the estimated number of years a person would be expected to survive if he or she continued to experience the area’s mortality rate at that time throughout the rest of their life. The figures reflect mortality of those living in an area at that point in time rather than those born in the area. Healthy life expectancy (HLE) is an estimate of the number of years lived in “Very good” or “Good” general health, based on how individuals perceive their general health. Disability-free life expectancy (DFLE) is an estimate of the number of years lived without a long-lasting physical or mental health condition that limits daily activities. Two sets of figures are produced. Life expectancy at birth and life expectancy at age 65;
Life expectancy at birth is the number of years a person living in an area could be expected to survive if they were to experience that area’s mortality rates for all people for the rest of their life.
Life expectancy at age 65 is the number of years a person aged 65 or over living in an area could expect to live if they were to experience that area’s mortality rates for people aged 65 and above. Therefore if the life expectancy at birth of someone born in an area is 80 the life expectancy of a person aged 65 may exceed or fall lower than 15 years because the mortality rates applied are different.
Both sets publish figures for males and females separately. A combined set
of life expectancy figures for total persons is not available and cannot be
calculated from the male and female figures contained in this bulletin.
This bulletin presents the most recent life expectancy at birth data followed by
an analysis of how life expectancy at birth has changed over recent years.
This is followed by the latest life expectancy at age 65 before going on to
show how life expectancy at age 65 has changed over time. National, regional
and local district authority level data for Kent is presented. Finally, health state
life expectancy data is presented for Kent, the South East and England.
Strategic Business Development & Intelligence, Kent County Council www.kent.gov.uk/research
Page 2
Life Expectancy at Birth
English regions
A male born in England between 2014/16 can expect to live for 79.5 years
and a female born at the same time can live to 83.1 years. Life expectancy
varies across the regions by as much as 2.8 years for men and 2.7 years for
women.
Males born in the North East between 2014 and 2016 can expect to live 77.8
years. This 1.7 years less than the England rate and is the lowest male life
expectancy at birth of all of the regions.
The North East also has the lowest life expectancy at birth for females which
at 81.5 years is 1.6 years less than the England rate.
Babies born within the South East, East of England, London and the South
West, have greater life expectancies than the England average. The South
East has the highest life expectancy for males and the London has the
highest life expectancy for females of all the regions. See Table 1 for details.
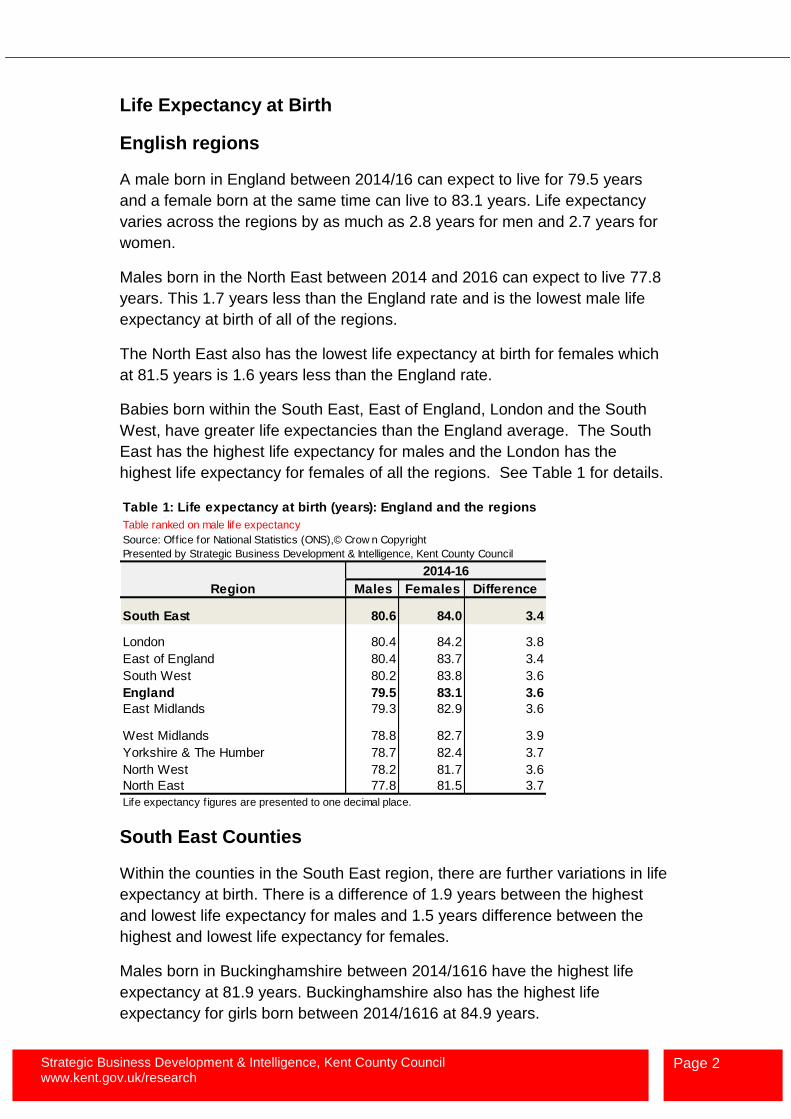
Table 1: Life expectancy at birth (years): England and the regions
Table ranked on male life expectancy
Source: Office for National Statistics (ONS),© Crow n Copyright
Presented by Strategic Business Development & Intelligence, Kent County Council
2014-16
Region Males Females Difference
South East 80.6 84.0 3.4
London 80.4 84.2 3.8
East of England 80.4 83.7 3.4
South West 80.2 83.8 3.6
England 79.5 83.1 3.6
East Midlands 79.3 82.9 3.6
West Midlands 78.8 82.7 3.9
Yorkshire & The Humber 78.7 82.4 3.7
North West 78.2 81.7 3.6
North East 77.8 81.5 3.7
Life expectancy f igures are presented to one decimal place.
South East Counties
Within the counties in the South East region, there are further variations in life
expectancy at birth. There is a difference of 1.9 years between the highest
and lowest life expectancy for males and 1.5 years difference between the
highest and lowest life expectancy for females.
Males born in Buckinghamshire between 2014/1616 have the highest life
expectancy at 81.9 years. Buckinghamshire also has the highest life
expectancy for girls born between 2014/1616 at 84.9 years.
Strategic Business Development & Intelligence, Kent County Council www.kent.gov.uk/research
Page 3
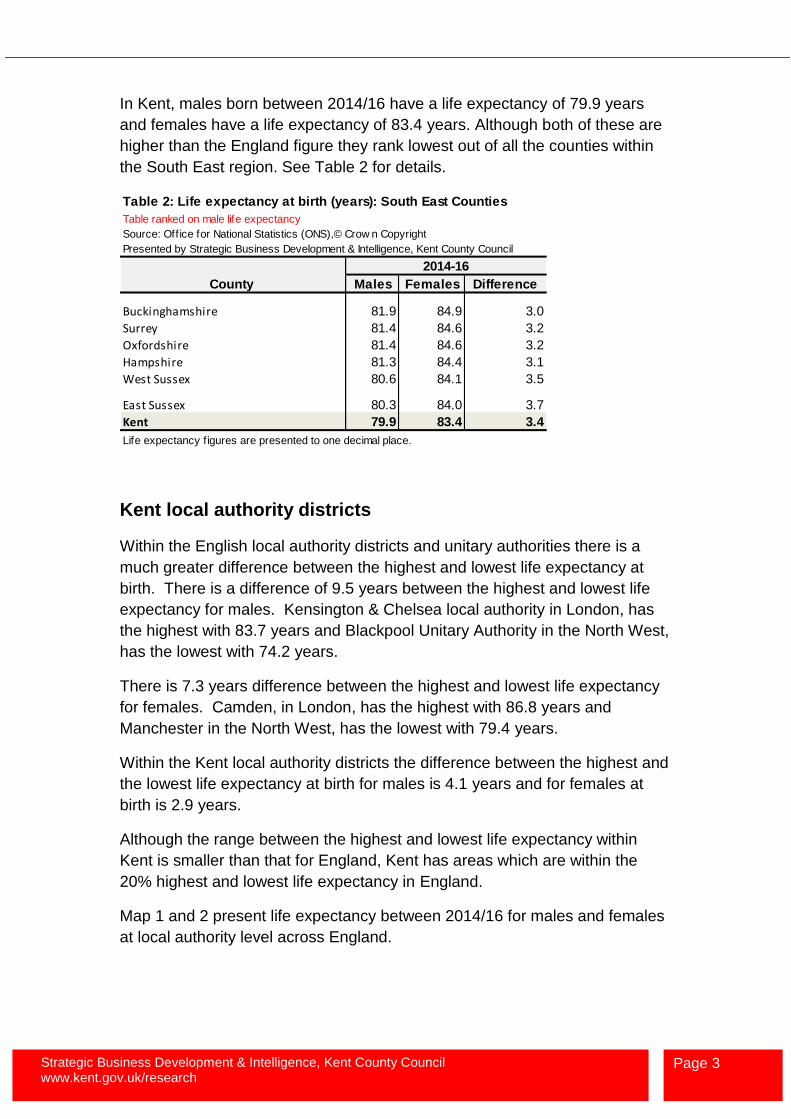
In Kent, males born between 2014/16 have a life expectancy of 79.9 years
and females have a life expectancy of 83.4 years. Although both of these are
higher than the England figure they rank lowest out of all the counties within
the South East region. See Table 2 for details.
Table 2: Life expectancy at birth (years): South East Counties
Table ranked on male life expectancy
Source: Office for National Statistics (ONS),© Crow n Copyright
Presented by Strategic Business Development & Intelligence, Kent County Council
2014-16
County Males Females Difference
Buckinghamshire 81.9 84.9 3.0
Surrey 81.4 84.6 3.2
Oxfordshire 81.4 84.6 3.2
Hampshire 81.3 84.4 3.1
West Sussex 80.6 84.1 3.5
East Sussex 80.3 84.0 3.7
Kent 79.9 83.4 3.4
Life expectancy f igures are presented to one decimal place.
Kent local authority districts
Within the English local authority districts and unitary authorities there is a
much greater difference between the highest and lowest life expectancy at
birth. There is a difference of 9.5 years between the highest and lowest life
expectancy for males. Kensington & Chelsea local authority in London, has
the highest with 83.7 years and Blackpool Unitary Authority in the North West,
has the lowest with 74.2 years.
There is 7.3 years difference between the highest and lowest life expectancy
for females. Camden, in London, has the highest with 86.8 years and
Manchester in the North West, has the lowest with 79.4 years.
Within the Kent local authority districts the difference between the highest and
the lowest life expectancy at birth for males is 4.1 years and for females at
birth is 2.9 years.
Although the range between the highest and lowest life expectancy within
Kent is smaller than that for England, Kent has areas which are within the
20% highest and lowest life expectancy in England.
Map 1 and 2 present life expectancy between 2014/16 for males and females
at local authority level across England.
Strategic Business Development & Intelligence, Kent County Council www.kent.gov.uk/research
Page 4
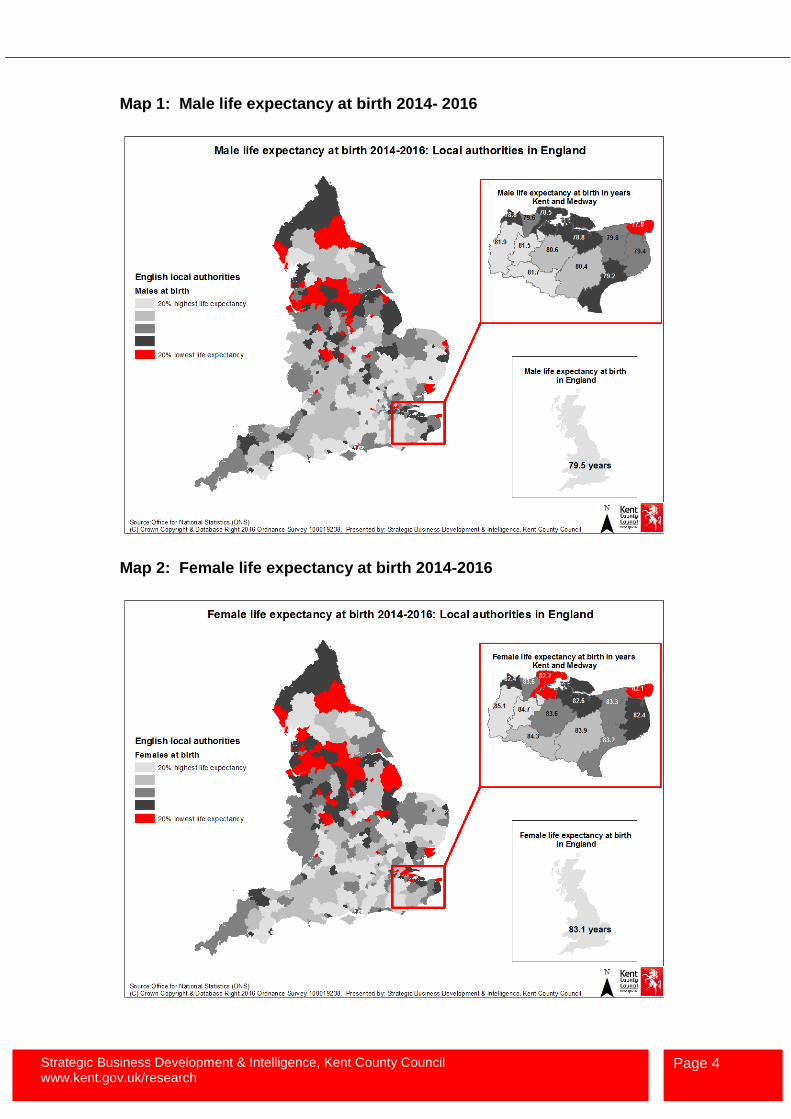
Map 1: Male life expectancy at birth 2014- 2016
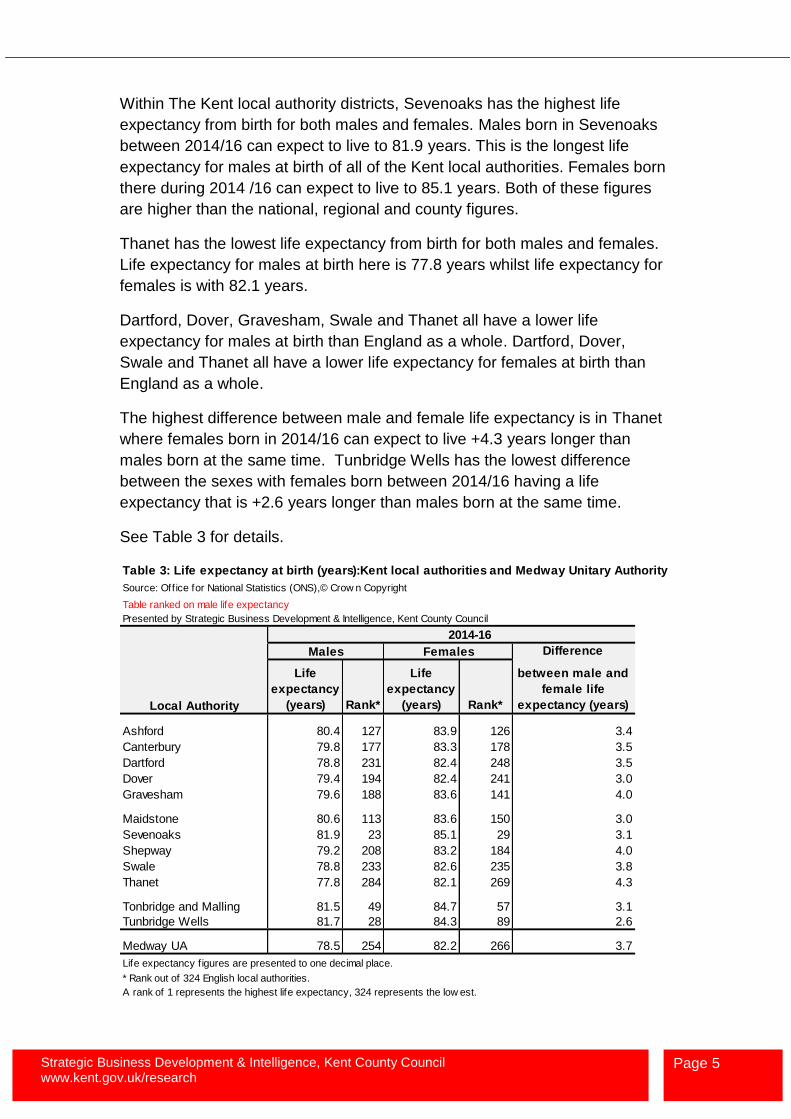
Map 2: Female life expectancy at birth 2014-2016
Strategic Business Development & Intelligence, Kent County Council www.kent.gov.uk/research
Page 5
Within The Kent local authority districts, Sevenoaks has the highest life
expectancy from birth for both males and females. Males born in Sevenoaks
between 2014/16 can expect to live to 81.9 years. This is the longest life
expectancy for males at birth of all of the Kent local authorities. Females born
there during 2014 /16 can expect to live to 85.1 years. Both of these figures
are higher than the national, regional and county figures.
Thanet has the lowest life expectancy from birth for both males and females.
Life expectancy for males at birth here is 77.8 years whilst life expectancy for
females is with 82.1 years.
Dartford, Dover, Gravesham, Swale and Thanet all have a lower life
expectancy for males at birth than England as a whole. Dartford, Dover,
Swale and Thanet all have a lower life expectancy for females at birth than
England as a whole.
The highest difference between male and female life expectancy is in Thanet
where females born in 2014/16 can expect to live +4.3 years longer than
males born at the same time. Tunbridge Wells has the lowest difference
between the sexes with females born between 2014/16 having a life
expectancy that is +2.6 years longer than males born at the same time.
See Table 3 for details.
Table 3: Life expectancy at birth (years):Kent local authorities and Medway Unitary Authority
Source: Office for National Statistics (ONS),© Crow n Copyright
Table ranked on male life expectancy
Presented by Strategic Business Development & Intelligence, Kent County Council
2014-16 2014-16
Males Females Difference
Local Authority
Life
expectancy
(years) Rank*
Life
expectancy
(years) Rank*
between male and
female life
expectancy (years)
Ashford 80.4 127 83.9 126 3.4
Canterbury 79.8 177 83.3 178 3.5
Dartford 78.8 231 82.4 248 3.5
Dover 79.4 194 82.4 241 3.0
Gravesham 79.6 188 83.6 141 4.0
Maidstone 80.6 113 83.6 150 3.0
Sevenoaks 81.9 23 85.1 29 3.1
Shepway 79.2 208 83.2 184 4.0
Swale 78.8 233 82.6 235 3.8
Thanet 77.8 284 82.1 269 4.3
Tonbridge and Malling 81.5 49 84.7 57 3.1
Tunbridge Wells 81.7 28 84.3 89 2.6
Medway UA 78.5 254 82.2 266 3.7
Life expectancy f igures are presented to one decimal place.
* Rank out of 324 English local authorities.
A rank of 1 represents the highest life expectancy, 324 represents the low est.
Strategic Business Development & Intelligence, Kent County Council www.kent.gov.uk/research
Page 6
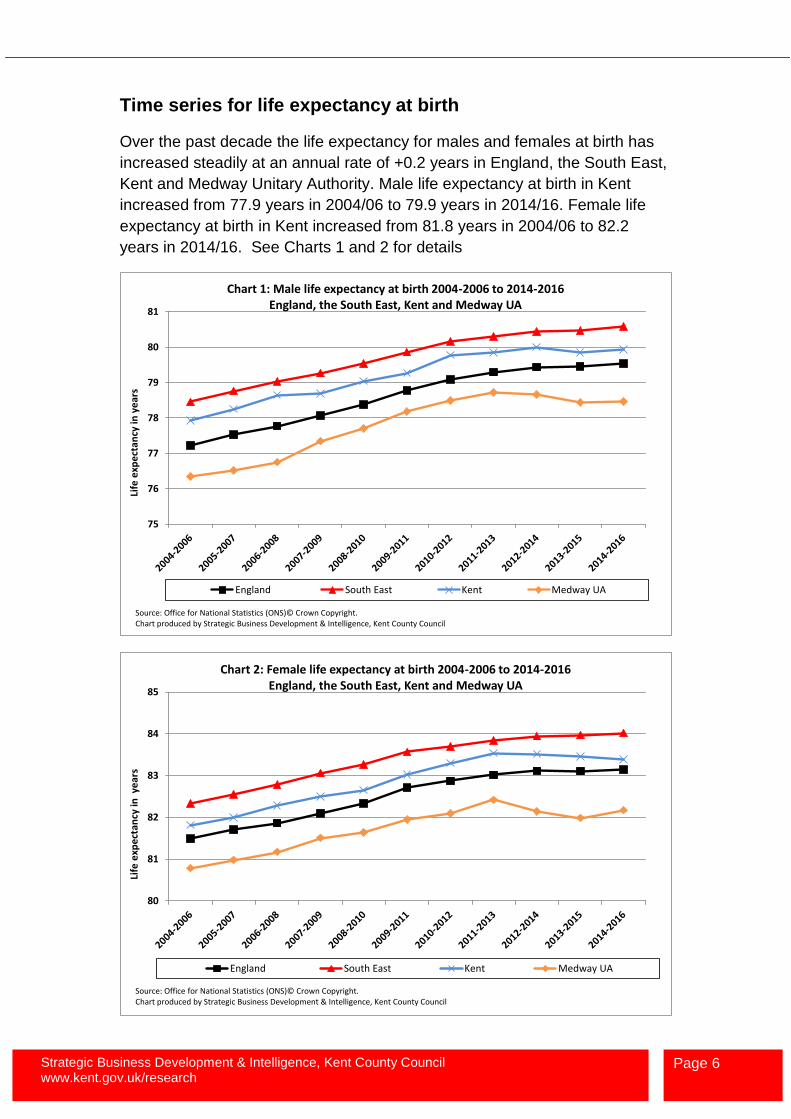
Time series for life expectancy at birth
Over the past decade the life expectancy for males and females at birth has
increased steadily at an annual rate of +0.2 years in England, the South East,
Kent and Medway Unitary Authority. Male life expectancy at birth in Kent
increased from 77.9 years in 2004/06 to 79.9 years in 2014/16. Female life
expectancy at birth in Kent increased from 81.8 years in 2004/06 to 82.2
years in 2014/16. See Charts 1 and 2 for details
75
76
77
78
79
80
81
Life
exp
ect
ancy
in y
ear
s
Chart 1: Male life expectancy at birth 2004-2006 to 2014-2016England, the South East, Kent and Medway UA
England South East Kent Medway UA
Source: Office for National Statistics (ONS)© Crown Copyright. Chart produced by Strategic Business Development & Intelligence, Kent County Council
80
81
82
83
84
85
Life
exp
ect
ancy
in y
ear
s
Chart 2: Female life expectancy at birth 2004-2006 to 2014-2016England, the South East, Kent and Medway UA
England South East Kent Medway UA
Source: Office for National Statistics (ONS)© Crown Copyright. Chart produced by Strategic Business Development & Intelligence, Kent County Council
Strategic Business Development & Intelligence, Kent County Council www.kent.gov.uk/research
Page 7
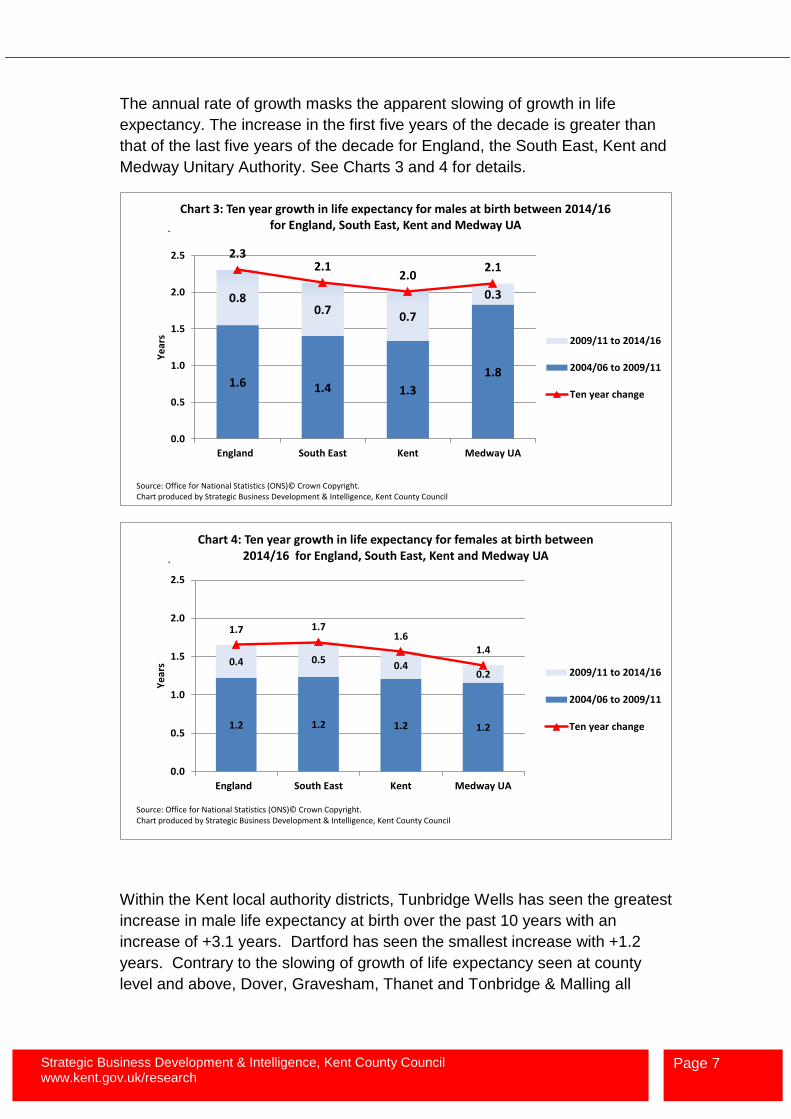
The annual rate of growth masks the apparent slowing of growth in life
expectancy. The increase in the first five years of the decade is greater than
that of the last five years of the decade for England, the South East, Kent and
Medway Unitary Authority. See Charts 3 and 4 for details.
1.6 1.4 1.3
1.8
0.80.7
0.7
0.3
2.32.1
2.02.1
0.0
0.5
1.0
1.5
2.0
2.5
England South East Kent Medway UA
Ye
ars
Chart 3: Ten year growth in life expectancy for males at birth between 2014/16 for England, South East, Kent and Medway UA
2009/11 to 2014/16
2004/06 to 2009/11
Ten year change
Source: Office for National Statistics (ONS)© Crown Copyright. Chart produced by Strategic Business Development & Intelligence, Kent County Council
.
1.2 1.2 1.2 1.2
0.4 0.50.4
0.2
1.7 1.71.6
1.4
0.0
0.5
1.0
1.5
2.0
2.5
England South East Kent Medway UA
Ye
ars
Chart 4: Ten year growth in life expectancy for females at birth between 2014/16 for England, South East, Kent and Medway UA
2009/11 to 2014/16
2004/06 to 2009/11
Ten year change
Source: Office for National Statistics (ONS)© Crown Copyright. Chart produced by Strategic Business Development & Intelligence, Kent County Council
.
Within the Kent local authority districts, Tunbridge Wells has seen the greatest
increase in male life expectancy at birth over the past 10 years with an
increase of +3.1 years. Dartford has seen the smallest increase with +1.2
years. Contrary to the slowing of growth of life expectancy seen at county
level and above, Dover, Gravesham, Thanet and Tonbridge & Malling all
Strategic Business Development & Intelligence, Kent County Council www.kent.gov.uk/research
Page 8
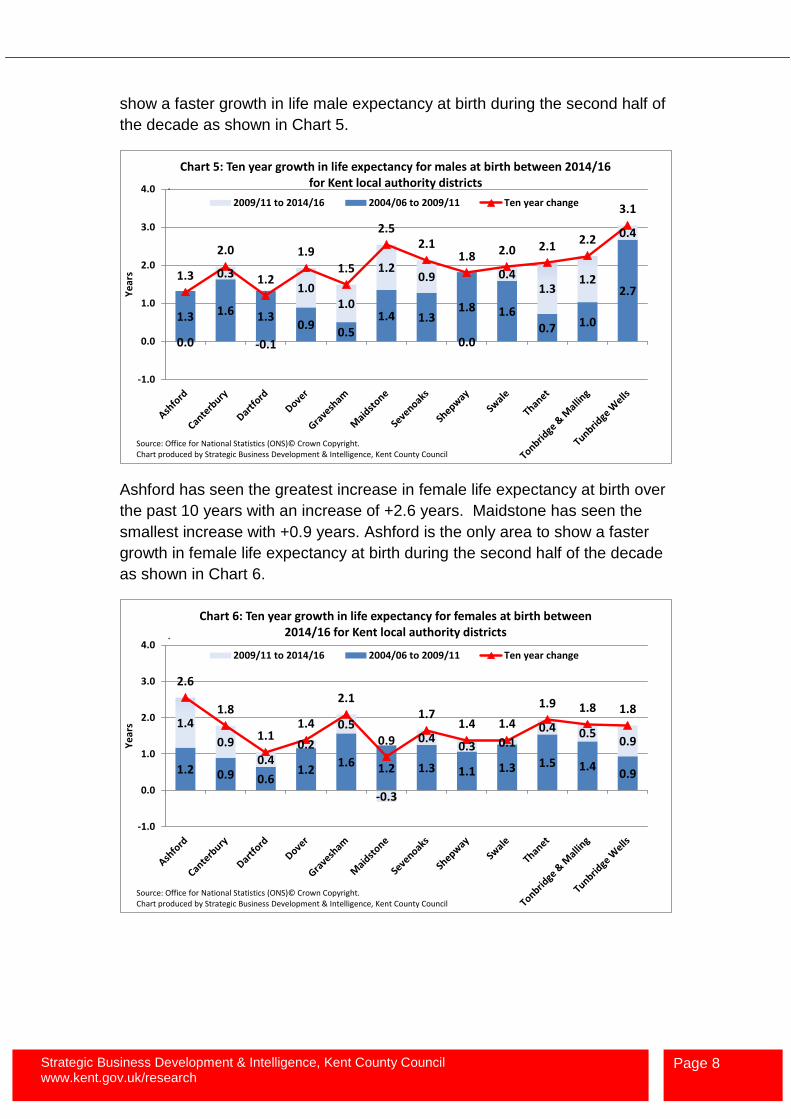
show a faster growth in life male expectancy at birth during the second half of
the decade as shown in Chart 5.
1.3 1.6 1.30.9
0.51.4 1.3
1.8 1.6
0.7 1.0
2.7
0.0
0.3
-0.1
1.01.0
1.20.9
0.0
0.41.3
1.2
0.4
1.3
2.0
1.2
1.9
1.5
2.52.1
1.8 2.0 2.12.2
3.1
-1.0
0.0
1.0
2.0
3.0
4.0
Ye
ars
Chart 5: Ten year growth in life expectancy for males at birth between 2014/16 for Kent local authority districts
2009/11 to 2014/16 2004/06 to 2009/11 Ten year change
Source: Office for National Statistics (ONS)© Crown Copyright. Chart produced by Strategic Business Development & Intelligence, Kent County Council
.
Ashford has seen the greatest increase in female life expectancy at birth over
the past 10 years with an increase of +2.6 years. Maidstone has seen the
smallest increase with +0.9 years. Ashford is the only area to show a faster
growth in female life expectancy at birth during the second half of the decade
as shown in Chart 6.
1.2 0.9 0.61.2
1.6 1.2 1.3 1.1 1.3 1.5 1.40.9
1.4
0.9
0.40.2
0.5
-0.3
0.40.3 0.1
0.4 0.50.9
2.6
1.8
1.11.4
2.1
0.9
1.71.4 1.4
1.9 1.8 1.8
-1.0
0.0
1.0
2.0
3.0
4.0
Ye
ars
Chart 6: Ten year growth in life expectancy for females at birth between 2014/16 for Kent local authority districts
2009/11 to 2014/16 2004/06 to 2009/11 Ten year change
Source: Office for National Statistics (ONS)© Crown Copyright. Chart produced by Strategic Business Development & Intelligence, Kent County Council
.
Strategic Business Development & Intelligence, Kent County Council www.kent.gov.uk/research
Page 9
Life Expectancy at age 65
English regions
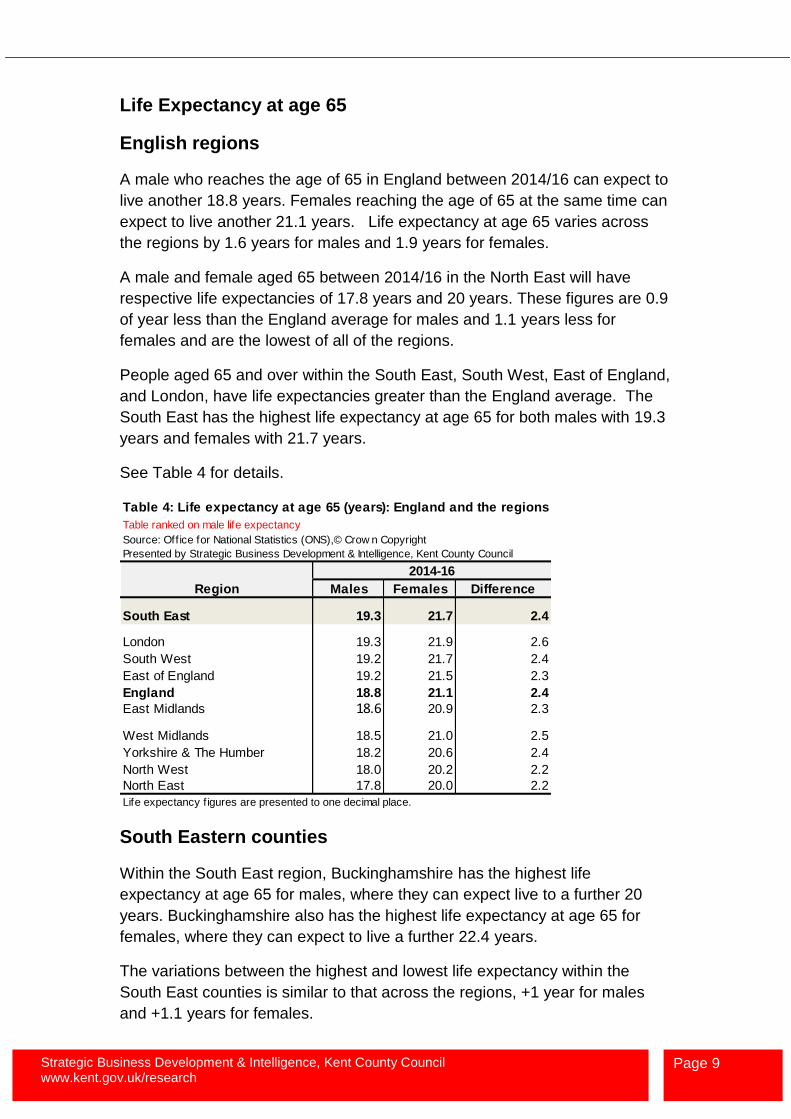
A male who reaches the age of 65 in England between 2014/16 can expect to
live another 18.8 years. Females reaching the age of 65 at the same time can
expect to live another 21.1 years. Life expectancy at age 65 varies across
the regions by 1.6 years for males and 1.9 years for females.
A male and female aged 65 between 2014/16 in the North East will have
respective life expectancies of 17.8 years and 20 years. These figures are 0.9
of year less than the England average for males and 1.1 years less for
females and are the lowest of all of the regions.
People aged 65 and over within the South East, South West, East of England,
and London, have life expectancies greater than the England average. The
South East has the highest life expectancy at age 65 for both males with 19.3
years and females with 21.7 years.
See Table 4 for details.
Table 4: Life expectancy at age 65 (years): England and the regions
Table ranked on male life expectancy
Source: Office for National Statistics (ONS),© Crow n Copyright
Presented by Strategic Business Development & Intelligence, Kent County Council
2014-16
Region Males Females Difference
South East 19.3 21.7 2.4
London 19.3 21.9 2.6
South West 19.2 21.7 2.4
East of England 19.2 21.5 2.3
England 18.8 21.1 2.4
East Midlands 18.6 20.9 2.3
West Midlands 18.5 21.0 2.5
Yorkshire & The Humber 18.2 20.6 2.4
North West 18.0 20.2 2.2
North East 17.8 20.0 2.2
Life expectancy f igures are presented to one decimal place.
South Eastern counties
Within the South East region, Buckinghamshire has the highest life
expectancy at age 65 for males, where they can expect live to a further 20
years. Buckinghamshire also has the highest life expectancy at age 65 for
females, where they can expect to live a further 22.4 years.
The variations between the highest and lowest life expectancy within the
South East counties is similar to that across the regions, +1 year for males
and +1.1 years for females.
Strategic Business Development & Intelligence, Kent County Council www.kent.gov.uk/research
Page 10
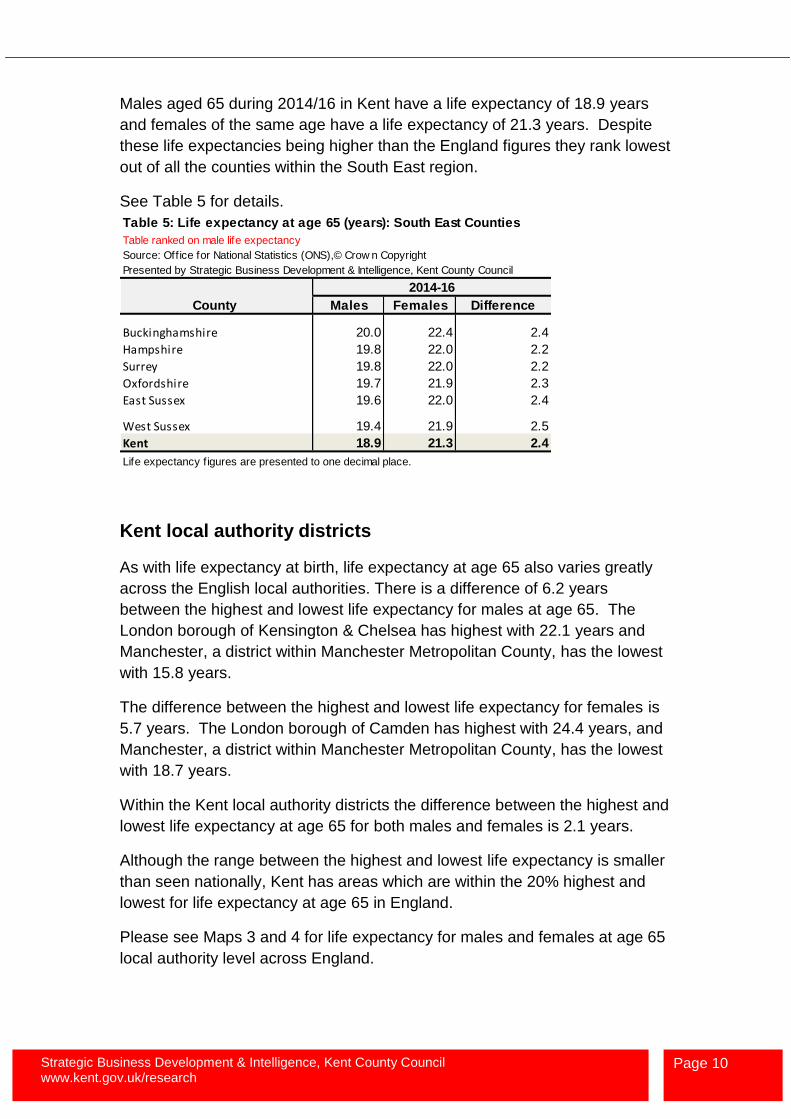
Males aged 65 during 2014/16 in Kent have a life expectancy of 18.9 years
and females of the same age have a life expectancy of 21.3 years. Despite
these life expectancies being higher than the England figures they rank lowest
out of all the counties within the South East region.
See Table 5 for details.
Table 5: Life expectancy at age 65 (years): South East Counties
Table ranked on male life expectancy
Source: Office for National Statistics (ONS),© Crow n Copyright
Presented by Strategic Business Development & Intelligence, Kent County Council
2014-16
County Males Females Difference
Buckinghamshire 20.0 22.4 2.4
Hampshire 19.8 22.0 2.2
Surrey 19.8 22.0 2.2
Oxfordshire 19.7 21.9 2.3
East Sussex 19.6 22.0 2.4
West Sussex 19.4 21.9 2.5
Kent 18.9 21.3 2.4
Life expectancy f igures are presented to one decimal place.
Kent local authority districts
As with life expectancy at birth, life expectancy at age 65 also varies greatly
across the English local authorities. There is a difference of 6.2 years
between the highest and lowest life expectancy for males at age 65. The
London borough of Kensington & Chelsea has highest with 22.1 years and
Manchester, a district within Manchester Metropolitan County, has the lowest
with 15.8 years.
The difference between the highest and lowest life expectancy for females is
5.7 years. The London borough of Camden has highest with 24.4 years, and
Manchester, a district within Manchester Metropolitan County, has the lowest
with 18.7 years.
Within the Kent local authority districts the difference between the highest and
lowest life expectancy at age 65 for both males and females is 2.1 years.
Although the range between the highest and lowest life expectancy is smaller
than seen nationally, Kent has areas which are within the 20% highest and
lowest for life expectancy at age 65 in England.
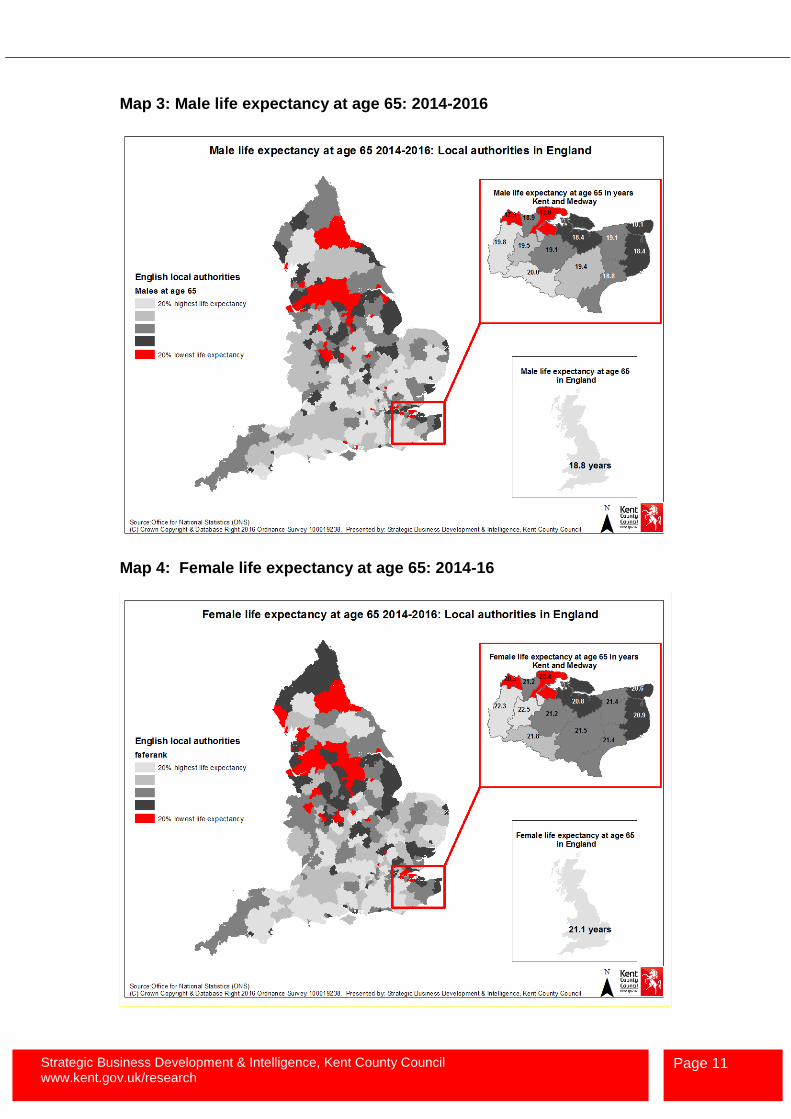
Please see Maps 3 and 4 for life expectancy for males and females at age 65
local authority level across England.
Strategic Business Development & Intelligence, Kent County Council www.kent.gov.uk/research
Page 11
Map 3: Male life expectancy at age 65: 2014-2016
Map 4: Female life expectancy at age 65: 2014-16
Strategic Business Development & Intelligence, Kent County Council www.kent.gov.uk/research
Page 12
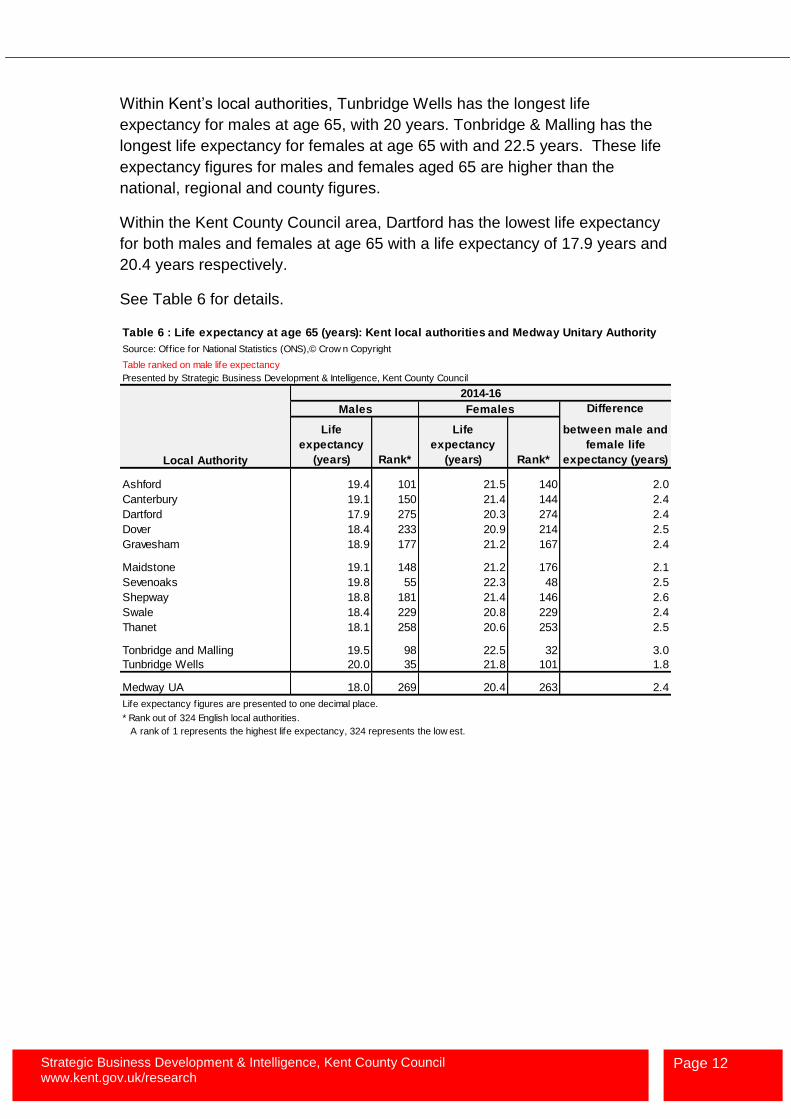
Within Kent’s local authorities, Tunbridge Wells has the longest life
expectancy for males at age 65, with 20 years. Tonbridge & Malling has the
longest life expectancy for females at age 65 with and 22.5 years. These life
expectancy figures for males and females aged 65 are higher than the
national, regional and county figures.
Within the Kent County Council area, Dartford has the lowest life expectancy
for both males and females at age 65 with a life expectancy of 17.9 years and
20.4 years respectively.
See Table 6 for details.
Table 6 : Life expectancy at age 65 (years): Kent local authorities and Medway Unitary Authority
Source: Office for National Statistics (ONS),© Crow n Copyright
Table ranked on male life expectancy
Presented by Strategic Business Development & Intelligence, Kent County Council
2014-16
Males Females Difference
Local Authority
Life
expectancy
(years) Rank*
Life
expectancy
(years) Rank*
between male and
female life
expectancy (years)
Ashford 19.4 101 21.5 140 2.0
Canterbury 19.1 150 21.4 144 2.4
Dartford 17.9 275 20.3 274 2.4
Dover 18.4 233 20.9 214 2.5
Gravesham 18.9 177 21.2 167 2.4
Maidstone 19.1 148 21.2 176 2.1
Sevenoaks 19.8 55 22.3 48 2.5
Shepway 18.8 181 21.4 146 2.6
Swale 18.4 229 20.8 229 2.4
Thanet 18.1 258 20.6 253 2.5
Tonbridge and Malling 19.5 98 22.5 32 3.0
Tunbridge Wells 20.0 35 21.8 101 1.8
Medway UA 18.0 269 20.4 263 2.4
Life expectancy f igures are presented to one decimal place.
* Rank out of 324 English local authorities.
A rank of 1 represents the highest life expectancy, 324 represents the low est.
Strategic Business Development & Intelligence, Kent County Council www.kent.gov.uk/research
Page 13
Time series for life expectancy at age 65
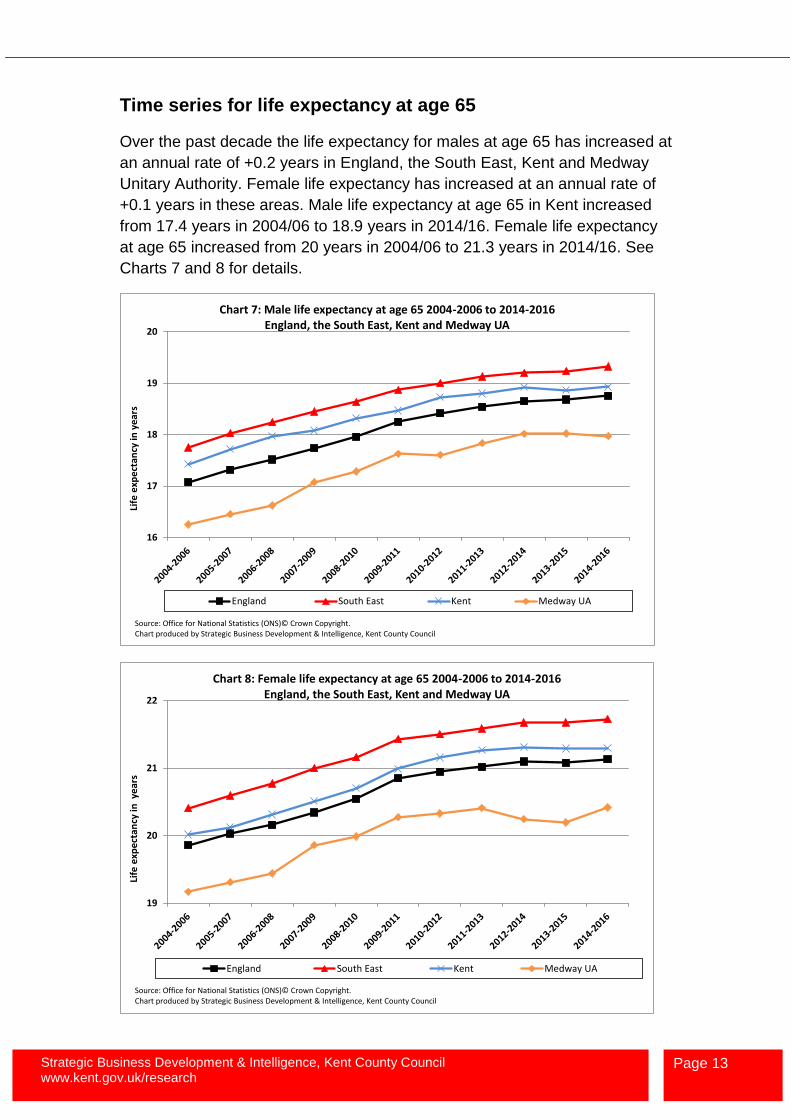
Over the past decade the life expectancy for males at age 65 has increased at
an annual rate of +0.2 years in England, the South East, Kent and Medway
Unitary Authority. Female life expectancy has increased at an annual rate of
+0.1 years in these areas. Male life expectancy at age 65 in Kent increased
from 17.4 years in 2004/06 to 18.9 years in 2014/16. Female life expectancy
at age 65 increased from 20 years in 2004/06 to 21.3 years in 2014/16. See
Charts 7 and 8 for details.
16
17
18
19
20
Life
exp
ect
ancy
in y
ear
s
Chart 7: Male life expectancy at age 65 2004-2006 to 2014-2016England, the South East, Kent and Medway UA
England South East Kent Medway UA
Source: Office for National Statistics (ONS)© Crown Copyright. Chart produced by Strategic Business Development & Intelligence, Kent County Council
19
20
21
22
Life
exp
ect
ancy
in y
ear
s
Chart 8: Female life expectancy at age 65 2004-2006 to 2014-2016England, the South East, Kent and Medway UA
England South East Kent Medway UA
Source: Office for National Statistics (ONS)© Crown Copyright. Chart produced by Strategic Business Development & Intelligence, Kent County Council
Strategic Business Development & Intelligence, Kent County Council www.kent.gov.uk/research
Page 14
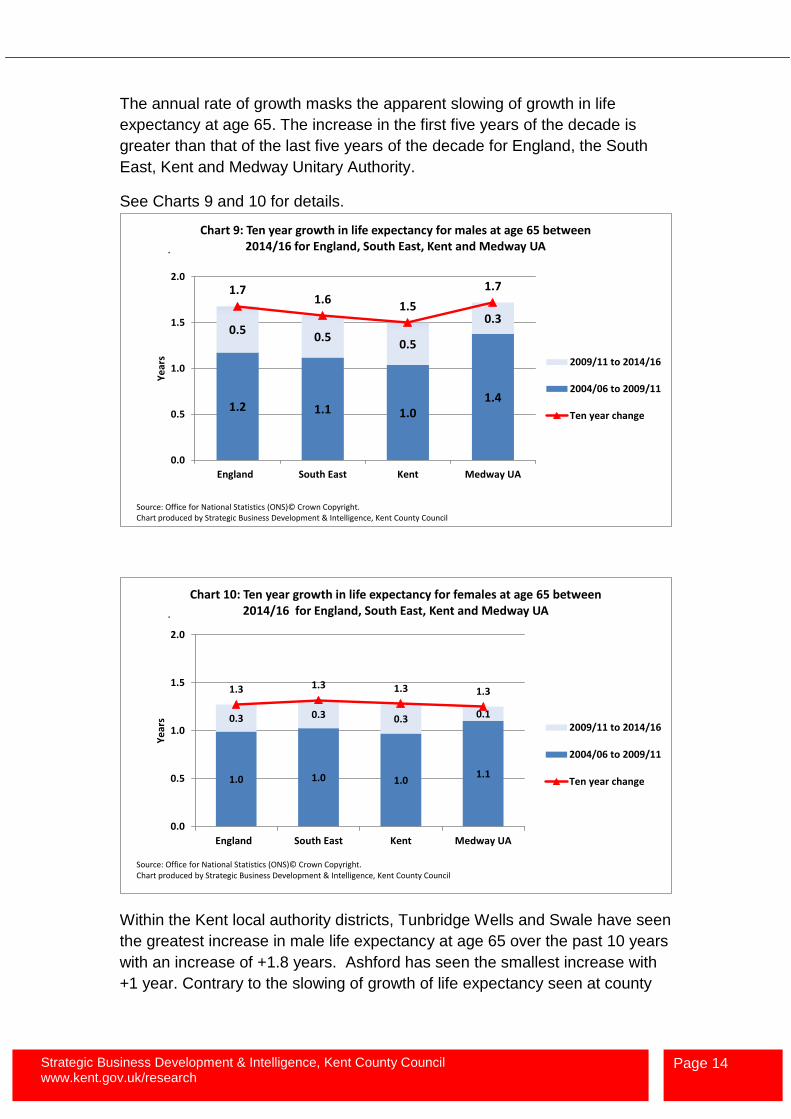
The annual rate of growth masks the apparent slowing of growth in life
expectancy at age 65. The increase in the first five years of the decade is
greater than that of the last five years of the decade for England, the South
East, Kent and Medway Unitary Authority.
See Charts 9 and 10 for details.
1.2 1.1 1.01.4
0.50.5
0.5
0.3
1.71.6
1.5
1.7
0.0
0.5
1.0
1.5
2.0
England South East Kent Medway UA
Ye
ars
Chart 9: Ten year growth in life expectancy for males at age 65 between 2014/16 for England, South East, Kent and Medway UA
2009/11 to 2014/16
2004/06 to 2009/11
Ten year change
Source: Office for National Statistics (ONS)© Crown Copyright. Chart produced by Strategic Business Development & Intelligence, Kent County Council
.
1.0 1.0 1.01.1
0.3 0.3 0.3 0.1
1.3 1.3 1.3 1.3
0.0
0.5
1.0
1.5
2.0
England South East Kent Medway UA
Ye
ars
Chart 10: Ten year growth in life expectancy for females at age 65 between 2014/16 for England, South East, Kent and Medway UA
2009/11 to 2014/16
2004/06 to 2009/11
Ten year change
Source: Office for National Statistics (ONS)© Crown Copyright. Chart produced by Strategic Business Development & Intelligence, Kent County Council
.
Within the Kent local authority districts, Tunbridge Wells and Swale have seen
the greatest increase in male life expectancy at age 65 over the past 10 years
with an increase of +1.8 years. Ashford has seen the smallest increase with
+1 year. Contrary to the slowing of growth of life expectancy seen at county
Strategic Business Development & Intelligence, Kent County Council www.kent.gov.uk/research
Page 15
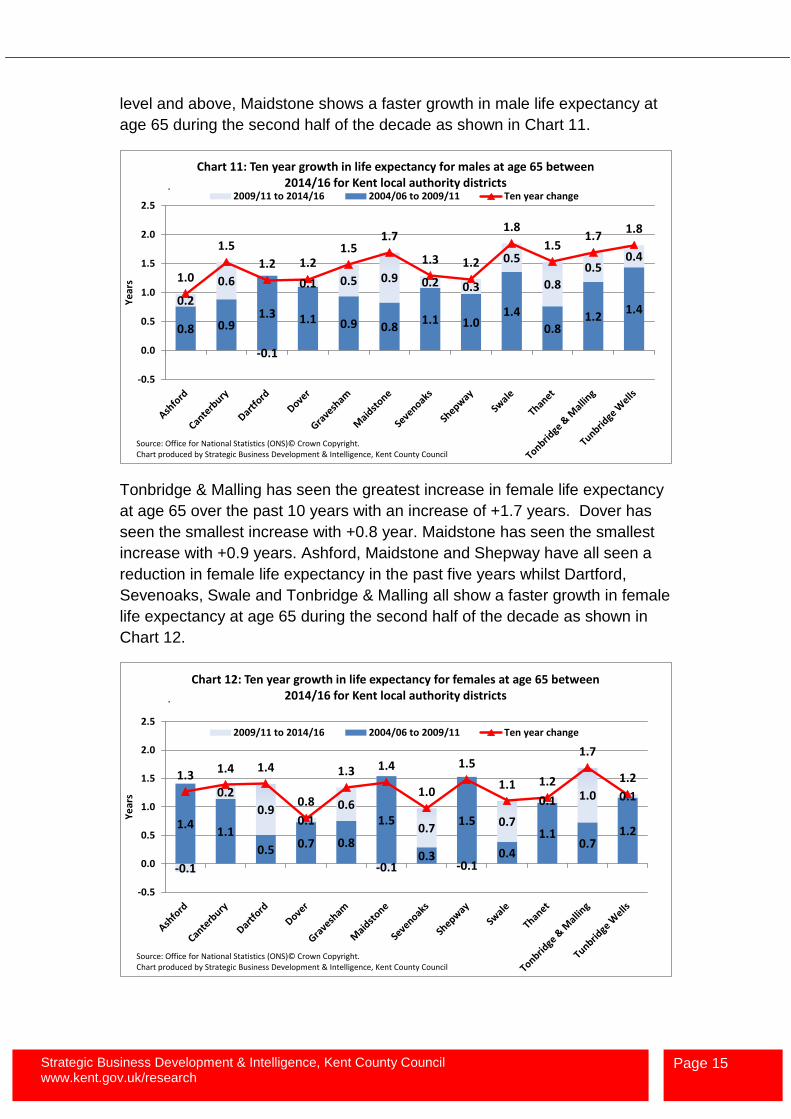
level and above, Maidstone shows a faster growth in male life expectancy at
age 65 during the second half of the decade as shown in Chart 11.
0.8 0.91.3 1.1 0.9 0.8
1.1 1.01.4
0.81.2
1.40.2
0.6
-0.1
0.1 0.5 0.9 0.2 0.3
0.5
0.8
0.50.4
1.0
1.5
1.2 1.21.5
1.7
1.3 1.2
1.8
1.51.7
1.8
-0.5
0.0
0.5
1.0
1.5
2.0
2.5
Ye
ars
Chart 11: Ten year growth in life expectancy for males at age 65 between 2014/16 for Kent local authority districts
2009/11 to 2014/16 2004/06 to 2009/11 Ten year change
Source: Office for National Statistics (ONS)© Crown Copyright. Chart produced by Strategic Business Development & Intelligence, Kent County Council
.
Tonbridge & Malling has seen the greatest increase in female life expectancy
at age 65 over the past 10 years with an increase of +1.7 years. Dover has
seen the smallest increase with +0.8 year. Maidstone has seen the smallest
increase with +0.9 years. Ashford, Maidstone and Shepway have all seen a
reduction in female life expectancy in the past five years whilst Dartford,
Sevenoaks, Swale and Tonbridge & Malling all show a faster growth in female
life expectancy at age 65 during the second half of the decade as shown in
Chart 12.
1.41.1
0.5 0.7 0.8
1.5
0.3
1.5
0.4
1.10.7
1.2
-0.1
0.2
0.90.1
0.6
-0.1
0.7
-0.1
0.7
0.1 1.0 0.1
1.31.4 1.4
0.8
1.3 1.4
1.0
1.5
1.1 1.2
1.7
1.2
-0.5
0.0
0.5
1.0
1.5
2.0
2.5
Ye
ars
Chart 12: Ten year growth in life expectancy for females at age 65 between 2014/16 for Kent local authority districts
2009/11 to 2014/16 2004/06 to 2009/11 Ten year change
Source: Office for National Statistics (ONS)© Crown Copyright. Chart produced by Strategic Business Development & Intelligence, Kent County Council
.
Strategic Business Development & Intelligence, Kent County Council www.kent.gov.uk/research
Page 16
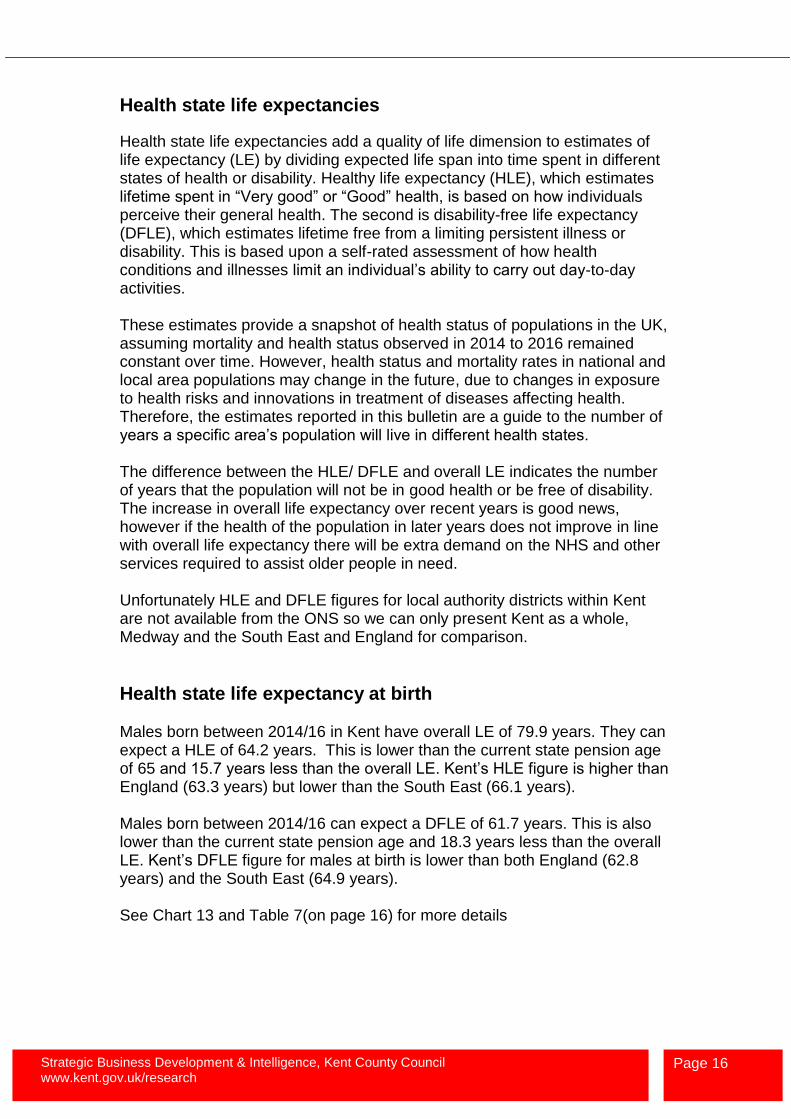
Health state life expectancies
Health state life expectancies add a quality of life dimension to estimates of life expectancy (LE) by dividing expected life span into time spent in different states of health or disability. Healthy life expectancy (HLE), which estimates lifetime spent in “Very good” or “Good” health, is based on how individuals perceive their general health. The second is disability-free life expectancy (DFLE), which estimates lifetime free from a limiting persistent illness or disability. This is based upon a self-rated assessment of how health conditions and illnesses limit an individual’s ability to carry out day-to-day activities. These estimates provide a snapshot of health status of populations in the UK, assuming mortality and health status observed in 2014 to 2016 remained constant over time. However, health status and mortality rates in national and local area populations may change in the future, due to changes in exposure to health risks and innovations in treatment of diseases affecting health. Therefore, the estimates reported in this bulletin are a guide to the number of years a specific area’s population will live in different health states. The difference between the HLE/ DFLE and overall LE indicates the number of years that the population will not be in good health or be free of disability. The increase in overall life expectancy over recent years is good news, however if the health of the population in later years does not improve in line with overall life expectancy there will be extra demand on the NHS and other services required to assist older people in need. Unfortunately HLE and DFLE figures for local authority districts within Kent are not available from the ONS so we can only present Kent as a whole, Medway and the South East and England for comparison.
Health state life expectancy at birth
Males born between 2014/16 in Kent have overall LE of 79.9 years. They can expect a HLE of 64.2 years. This is lower than the current state pension age of 65 and 15.7 years less than the overall LE. Kent’s HLE figure is higher than England (63.3 years) but lower than the South East (66.1 years). Males born between 2014/16 can expect a DFLE of 61.7 years. This is also lower than the current state pension age and 18.3 years less than the overall LE. Kent’s DFLE figure for males at birth is lower than both England (62.8 years) and the South East (64.9 years). See Chart 13 and Table 7(on page 16) for more details

Strategic Business Development & Intelligence, Kent County Council www.kent.gov.uk/research
Page 17
79.5 80.6 79.9 78.5
63.366.1
64.262.2
62.864.9
61.7 62.3
50
60
70
80
90
England South East Kent Medway
Age
in y
ear
s
Chart 13: Health state life expectancies at birth for males born between 2014/16
Life expectancy
Healthy life expectancy
Disability Free lifeexpectany
Source: Office for National Statistics (ONS) Crown CopyrightChart presented by Strategic Business Development & Intelligence, Kent County Council
Females born between 2014/16 in Kent have overall LE of 83.4 years. They can expect a HLE of 65.1 years. This is equal to the current state pension age and 18.3 years less than the overall LE. Kent’s HLE figure is higher than England (63.9 years) but lower than the South East (66.3 years). Females born between 2014/16 can expect a DFLE of 62.3 years. This is lower than the current state pension age and 21.1 years less than the overall LE. Kent’s DFLE figure for females at birth is the same as England but lower than the South East (63.9 years). See Chart 14 and Table 7(on page 18) for more details
83.1 84.0 83.4 82.2
63.966.3 65.1
59.7
62.3 63.9 62.358.1
50
60
70
80
90
England South East Kent Medway
Age
in y
ear
s
Chart 14: Health state life expectancies at birth for females born between 2014/16
Life expectancy
Healthy life expectancy
Disability Free lifeexpectany
Source: Office for National Statistics (ONS) Crown CopyrightChart presented by Strategic Business Development & Intelligence, Kent County Council
Strategic Business Development & Intelligence, Kent County Council www.kent.gov.uk/research
Page 18
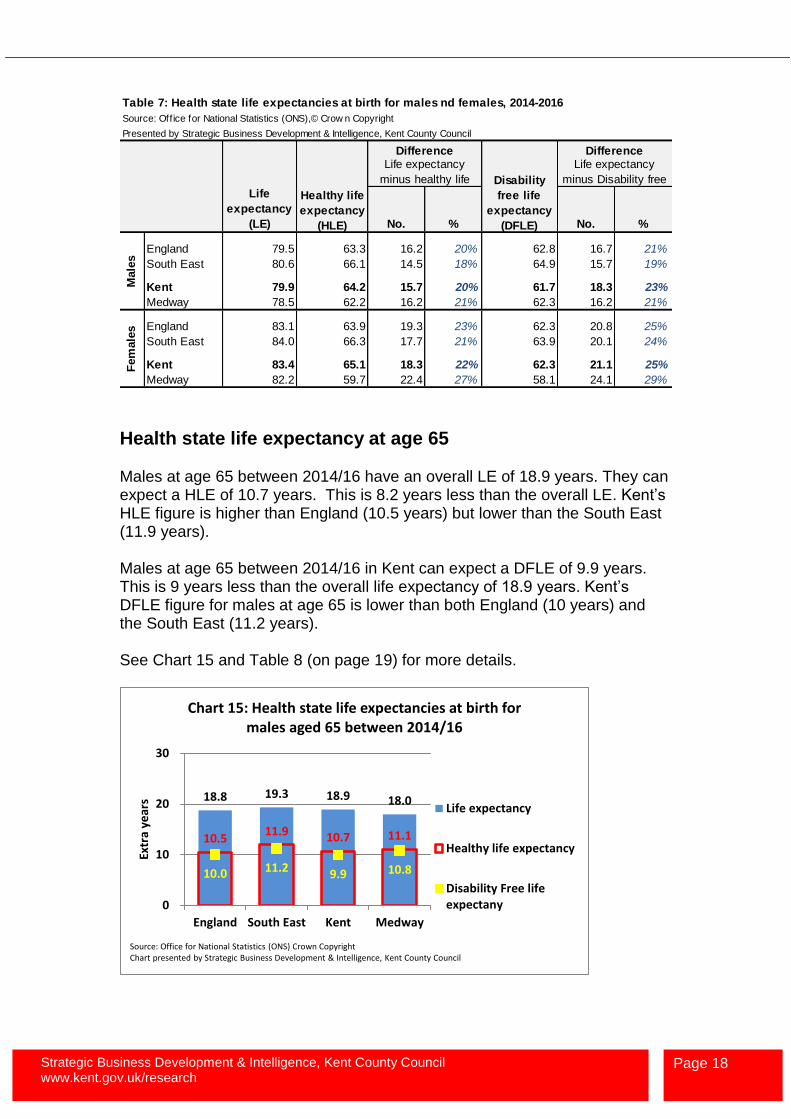
Table 7: Health state life expectancies at birth for males nd females, 2014-2016
Source: Office for National Statistics (ONS),© Crow n Copyright
Presented by Strategic Business Development & Intelligence, Kent County Council
Difference DifferenceLife expectancy
minus healthy life
Life expectancy
minus Disability free
Life
expectancy
(LE) No. % No. %
England 79.5 63.3 16.2 20% 62.8 16.7 21%
South East 80.6 66.1 14.5 18% 64.9 15.7 19%
Kent 79.9 64.2 15.7 20% 61.7 18.3 23%
Medway 78.5 62.2 16.2 21% 62.3 16.2 21%
England 83.1 63.9 19.3 23% 62.3 20.8 25%
South East 84.0 66.3 17.7 21% 63.9 20.1 24%
Kent 83.4 65.1 18.3 22% 62.3 21.1 25%
Medway 82.2 59.7 22.4 27% 58.1 24.1 29%
Male
sF
em
ale
s
Disability
free life
expectancy
(DFLE)
Healthy life
expectancy
(HLE)
Health state life expectancy at age 65
Males at age 65 between 2014/16 have an overall LE of 18.9 years. They can expect a HLE of 10.7 years. This is 8.2 years less than the overall LE. Kent’s HLE figure is higher than England (10.5 years) but lower than the South East (11.9 years). Males at age 65 between 2014/16 in Kent can expect a DFLE of 9.9 years. This is 9 years less than the overall life expectancy of 18.9 years. Kent’s DFLE figure for males at age 65 is lower than both England (10 years) and the South East (11.2 years). See Chart 15 and Table 8 (on page 19) for more details.
18.8 19.3 18.9 18.0
10.511.9 10.7 11.1
10.0 11.2 9.9 10.8
0
10
20
30
England South East Kent Medway
Extr
a ye
ars
Chart 15: Health state life expectancies at birth for males aged 65 between 2014/16
Life expectancy
Healthy life expectancy
Disability Free lifeexpectany
Source: Office for National Statistics (ONS) Crown CopyrightChart presented by Strategic Business Development & Intelligence, Kent County Council
Strategic Business Development & Intelligence, Kent County Council www.kent.gov.uk/research
Page 19
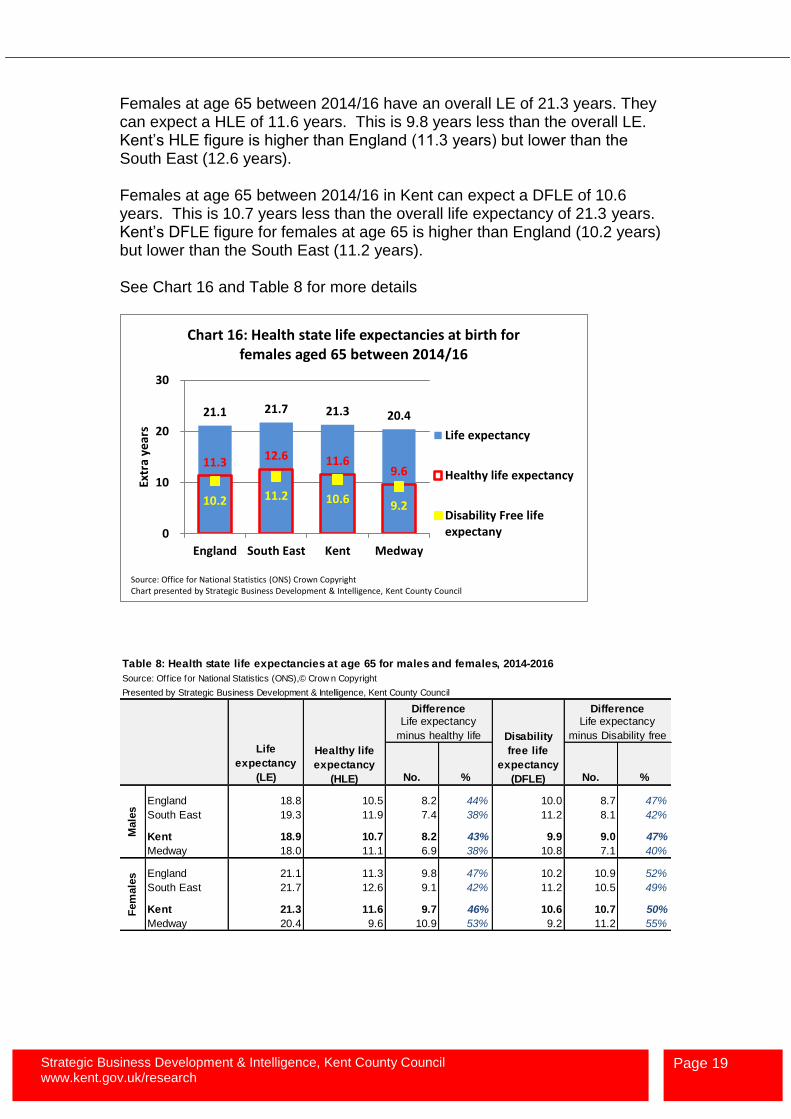
Females at age 65 between 2014/16 have an overall LE of 21.3 years. They can expect a HLE of 11.6 years. This is 9.8 years less than the overall LE. Kent’s HLE figure is higher than England (11.3 years) but lower than the South East (12.6 years). Females at age 65 between 2014/16 in Kent can expect a DFLE of 10.6 years. This is 10.7 years less than the overall life expectancy of 21.3 years. Kent’s DFLE figure for females at age 65 is higher than England (10.2 years) but lower than the South East (11.2 years). See Chart 16 and Table 8 for more details
21.1 21.7 21.3 20.4
11.312.6 11.6
9.6
10.2 11.2 10.69.2
0
10
20
30
England South East Kent Medway
Extr
a ye
ars
Chart 16: Health state life expectancies at birth for females aged 65 between 2014/16
Life expectancy
Healthy life expectancy
Disability Free lifeexpectany
Source: Office for National Statistics (ONS) Crown CopyrightChart presented by Strategic Business Development & Intelligence, Kent County Council
Table 8: Health state life expectancies at age 65 for males and females, 2014-2016
Source: Office for National Statistics (ONS),© Crow n Copyright
Presented by Strategic Business Development & Intelligence, Kent County Council
Difference DifferenceLife expectancy
minus healthy life
Life expectancy
minus Disability free
Life
expectancy
(LE) No. % No. %
England 18.8 10.5 8.2 44% 10.0 8.7 47%
South East 19.3 11.9 7.4 38% 11.2 8.1 42%
Kent 18.9 10.7 8.2 43% 9.9 9.0 47%
Medway 18.0 11.1 6.9 38% 10.8 7.1 40%
England 21.1 11.3 9.8 47% 10.2 10.9 52%
South East 21.7 12.6 9.1 42% 11.2 10.5 49%
Kent 21.3 11.6 9.7 46% 10.6 10.7 50%
Medway 20.4 9.6 10.9 53% 9.2 11.2 55%
Male
sF
em
ale
s
Healthy life
expectancy
(HLE)
Disability
free life
expectancy
(DFLE)
Related Documents