Trends in life expectancy and healthy life expectancy Future of an ageing population: evidence review Foresight, Government Office for Science

Welcome message from author
This document is posted to help you gain knowledge. Please leave a comment to let me know what you think about it! Share it to your friends and learn new things together.
Transcript
Trends in life expectancy and healthy life expectancy
Future of an ageing population: evidence review Foresight, Government Office for Science
Trends in life expectancy and healthy life expectancy
Carol Jagger
Newcastle University Institute for Ageing and Institute of Health & Society
March 2015
This review has been commissioned as part of the UK government’s Foresight Future of an Ageing Population project. The views expressed do not represent policy of any government or organisation.
Contents Executive summary ................................................................................................................................ 4
1. Introduction ........................................................................................................................................ 5
2. Past trends in LE, HLE and DFLE in the UK ..................................................................................... 7
2.1 Past trends in UK life expectancy ................................................................................................... 7
2.2 UK life expectancy trends in comparison with other EU countries ................................................... 8
2.3 UK life expectancy trends in comparison with other OECD countries.............................................. 8
2.4 Past trends in UK health expectancies .......................................................................................... 11
2.5 UK health expectancy trends in comparison with other EU countries ............................................ 12
2.6 UK health expectancy trends in comparison with other OECD countries ...................................... 13
3. Inequalities in LE, HLE and DFLE within the UK ............................................................................ 17
3.1 Life expectancy ............................................................................................................................. 17
3.2 DFLE and HLE ............................................................................................................................. 18
4. Main influences on LE, HLE and DFLE ........................................................................................... 21
4.1 Chronic conditions ........................................................................................................................ 21
4.2 Health behaviours ......................................................................................................................... 22
4.3 Socio-economic and environmental factors ................................................................................... 23
5. Future trends in LE, HLE and DFLE in the UK ............................................................................... 24
6. Conclusion ........................................................................................................................................ 25
References ............................................................................................................................................ 26
Executive summary With the steady rise of life expectancy in the UK, as elsewhere, and the rising number of older, and very old, people, there is a need to capture quality as well as quantity of remaining years lived. Health expectancies, such as disability-free life expectancy (DFLE) and healthy life expectancy (HLE), are the two main population health indicators in the UK. This Evidence Review looks at past trends in UK life and health expectancies at various ages (birth, ages 65 and 85), regional inequalities in these indicators, and the major factors which will influence future trends.
Key findings are:
• Increases in heath expectancies in the UK are not keeping pace with gains in life expectancy, particularly at older ages. This expansion of ill health and disability is also observed in some EU countries, Japan and the USA, although other European countries (Belgium, Sweden, Switzerland) appear to be experiencing compression of disability, possibly due to smaller gains in life expectancy.
• Inequalities in health expectancies between local areas in the UK are much larger than inequalities in life expectancy and are widening. This is likely to be contributing to the slower gains in health expectancies overall.
• The high proportion of local areas in the North of England with DFLE at birth below 65 will be challenging for further extending working life.
• Regional variations in unemployment, deprivation and ethnicity contribute to inequalities in health expectancies.
• Lower DFLE in many non-white ethnic groups, particularly South Asians, may moderate DFLE increases as these populations age into the older population.
• There have been reductions in some disabling diseases and unhealthy behaviours which influence health expectancies. However the prevalence of others, particularly diabetes and obesity, is still rising.
• Projections of health expectancy are scarce and at present are not able to explicitly include changes in diseases, lifestyle factors or socio-economic status which might influence future health expectancy trends.
• Analysis of trends in health expectancies is challenging as a result of changes in underlying health and disability questions, lack of inclusion of the institutionalised population in inter-censal years, and only recent adoption of the standard EU disability question.
4
1. Introduction Over the last 50 years or so life expectancy has been rising steadily in most countries of the world and it shows little sign of abating. While infectious diseases were the main cause of death, it was reasonable to equate life expectancy increases with better health. However the rise in importance of chronic diseases as the leading cause of death, along with growing numbers of the very old, means that life expectancy is no longer sufficient to measure health and should be supplemented by measures that capture the quality of remaining years as well as the quantity.
Health expectancy, which combines information on mortality and morbidity, has gained importance as a population health indicator, predominantly to provide evidence for one of the three theories relating trends in life expectancy to those of health expectancy:
• compression of morbidity where health expectancy is increasing faster than life expectancy so the extra years of life are healthy ones;
• expansion of morbidity where the extra years of life are unhealthy ones due to advances in medical treatments and technology keeping alive those who would previously have died; and
• dynamic equilibrium where years with ill health are increasing but the severity of conditions is reducing.
It is crucial to analyse population health alongside mortality, as with health expectancies, to accurately reflect the effect of unhealthy behaviours or risk factors, because most of the latter reduce mortality as well as health.
The policy relevance of health expectancy has grown in the last decade, with a number of countries now incorporating health expectancy into policies for improving the health of their population, for example Japan, the USA and the EU. The UK has a long series of two health expectancies: disability-free life expectancy (DFLE), based on the limiting longstanding illness question; and healthy life expectancy (HLE), based on self-reported health, reported by the Office for National Statistics (ONS) at national and sub-national level, the latter to monitor health inequalities.
Health expectancies have been regularly cited in government reviews on ageing and health, for example the House of Lords report Ready for Ageing and the Marmot Review, and have been recommended for routine monitoring of inequalities (Marmot and Goldblatt, 2013). Nevertheless, the Public Health and NHS Outcomes Frameworks and the NHS allocation formula include mortality only.
Despite the growing importance of health expectancy in policy, monitoring trends both within and between countries is problematic. Trends across the UK decennial censuses (these being the only time points to include health of the institutionalised population) are hampered by changes in the underlying health and disability questions. For the 1991 and 2001 censuses these have been resolved by mathematical modelling and for sub-national estimates the added assumption that the national impact of the question change is applicable sub-nationally (Wohland et al., 2014a). Lack of harmonisation of health measures remains the major limitation in comparisons of health expectancies between countries, although differences in survey design
5
and calculation methods can also hamper robust comparisons. The Global Burden of Disease programme has overcome these deficiencies to some extent using complex modelling techniques to estimate healthy life expectancy for 187 countries worldwide (Salomon et al., 2012).
Progress is being made by the EU, whose preferred health indicator is healthy life years (HLY), a DFLE that it reports annually for its 28 constituent countries. In addition there has been regular monitoring and revisions to improve harmonisation of the underlying activity limitation question: the Global Activity Limitation Indicator (GALI) (Van Oyen et al., 2006). Although the GALI question is imperfect, it does attempt to measure limitations in participating in usual social and economic roles, which is in keeping with participation restriction as envisaged in the World Health Organization International Classification of Functioning, Disability and Health. There is, however, no agreed definition of social participation, despite its importance for healthy ageing. Specific instruments to measure social participation have been developed, for example the Keele Assessment of Participation, which has been widely used to assess the impact of musculoskeletal conditions. Many longitudinal surveys also include questions eliciting participation in social activities, and social participation has been operationalised in the Survey of Health and Retirement in Europe (SHARE), the English Longitudinal Study of Ageing (ELSA) and in the MRC Cognitive Function and Ageing Studies (CFAS I and II), and could be operationalised in others.
This review, structured in four sections, will focus on past and future trends in life expectancy (LE), HLE and DFLE at birth, age 65 and additionally age 85 (the fastest growing demographic), past and current regional inequalities in these indicators, and the major factors influencing them. Section 1 covers past trends in LE, HLE and DFLE and includes comparisons of the UK with selected EU countries (Belgium, France, the Netherlands, Sweden) as well as wider OECD countries (Japan, USA, Switzerland). In Section 2 past trends in and current levels of inequalities in LE, HLE and DFLE between UK sub-national geographies are described. The major diseases, socio-demographic and lifestyle factors known to influence life and health expectancies and their current levels and trends are covered in the third section. The final section details the most recent projections of life and health expectancies with a focus on the medium term (2025) and long term (2040). Because trends in health expectancies are best assessed by cross-sectional data on health and period life tables using the Sullivan method (Sullivan, 1971), only trends in period, rather than cohort, LE will be covered.
6
2. Past trends in LE, HLE and DFLE in the UK In this section trends in life and health expectancies at birth, age 65 and age 80/85 are reviewed for the UK alongside comparable trends for selected EU countries (Belgium, France, the Netherlands, Sweden) and for wider OECD countries (Japan, Switzerland, the USA).
2.1 Past trends in UK life expectancy
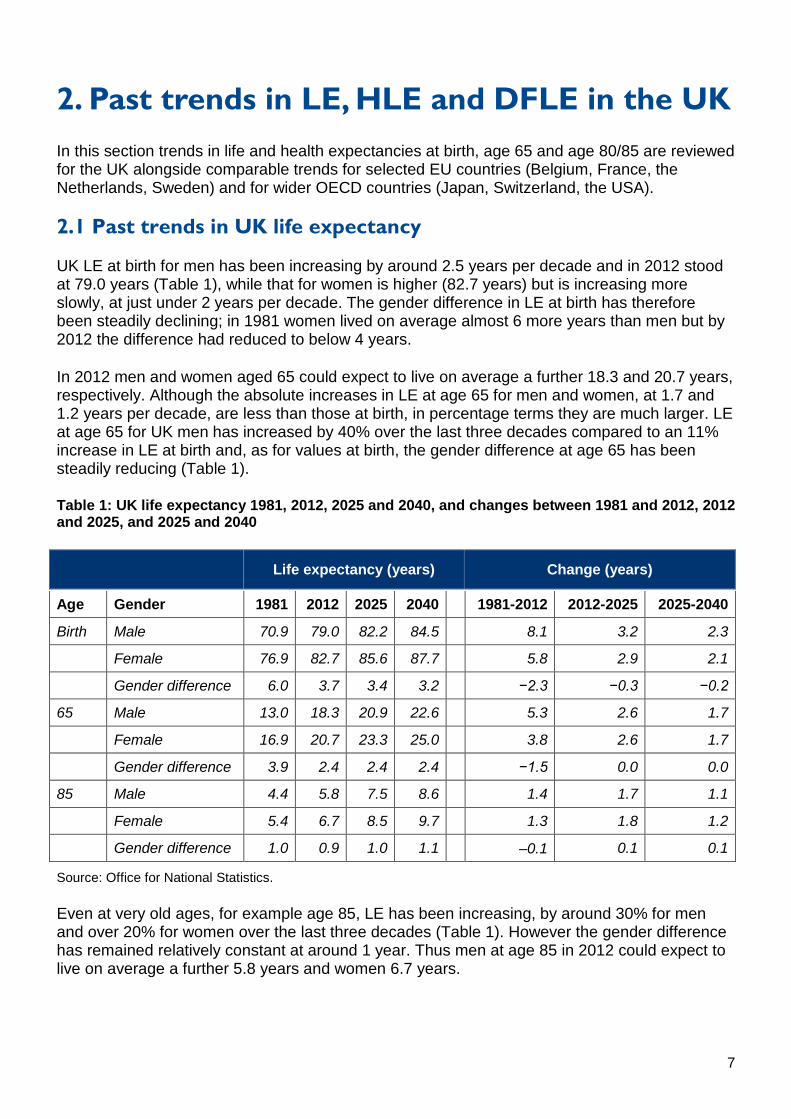
UK LE at birth for men has been increasing by around 2.5 years per decade and in 2012 stood at 79.0 years (Table 1), while that for women is higher (82.7 years) but is increasing more slowly, at just under 2 years per decade. The gender difference in LE at birth has therefore been steadily declining; in 1981 women lived on average almost 6 more years than men but by 2012 the difference had reduced to below 4 years.
In 2012 men and women aged 65 could expect to live on average a further 18.3 and 20.7 years, respectively. Although the absolute increases in LE at age 65 for men and women, at 1.7 and 1.2 years per decade, are less than those at birth, in percentage terms they are much larger. LE at age 65 for UK men has increased by 40% over the last three decades compared to an 11% increase in LE at birth and, as for values at birth, the gender difference at age 65 has been steadily reducing (Table 1).
Table 1: UK life expectancy 1981, 2012, 2025 and 2040, and changes between 1981 and 2012, 2012 and 2025, and 2025 and 2040
Life expectancy (years) Change (years)
Age Gender 1981 2012 2025 2040 1981-2012 2012-2025 2025-2040
Birth Male 70.9 79.0 82.2 84.5 8.1 3.2 2.3
Female 76.9 82.7 85.6 87.7 5.8 2.9 2.1
Gender difference 6.0 3.7 3.4 3.2 −2.3 −0.3 −0.2
65 Male 13.0 18.3 20.9 22.6 5.3 2.6 1.7
Female 16.9 20.7 23.3 25.0 3.8 2.6 1.7
Gender difference 3.9 2.4 2.4 2.4 −1.5 0.0 0.0
85 Male 4.4 5.8 7.5 8.6 1.4 1.7 1.1
Female 5.4 6.7 8.5 9.7 1.3 1.8 1.2
Gender difference 1.0 0.9 1.0 1.1 –0.1 0.1 0.1
Source: Office for National Statistics.
Even at very old ages, for example age 85, LE has been increasing, by around 30% for men and over 20% for women over the last three decades (Table 1). However the gender difference has remained relatively constant at around 1 year. Thus men at age 85 in 2012 could expect to live on average a further 5.8 years and women 6.7 years.
7
2.2 UK life expectancy trends in comparison with other EU countries
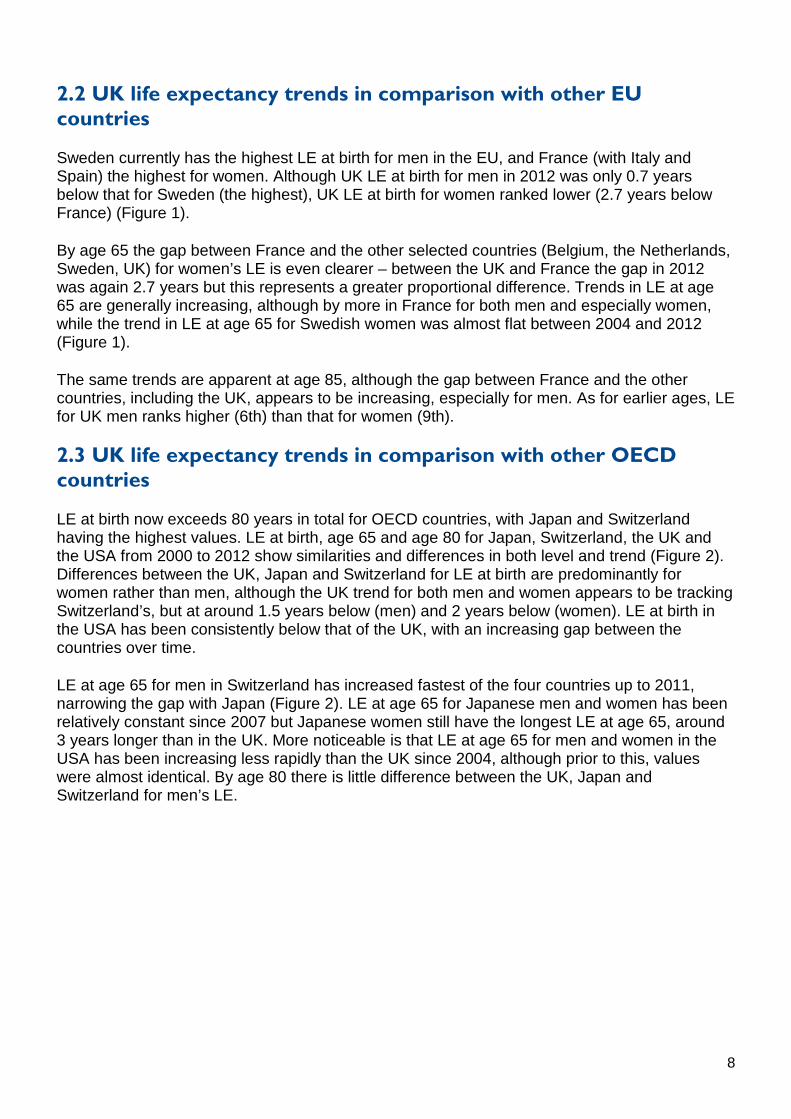
Sweden currently has the highest LE at birth for men in the EU, and France (with Italy and Spain) the highest for women. Although UK LE at birth for men in 2012 was only 0.7 years below that for Sweden (the highest), UK LE at birth for women ranked lower (2.7 years below France) (Figure 1).
By age 65 the gap between France and the other selected countries (Belgium, the Netherlands, Sweden, UK) for women’s LE is even clearer – between the UK and France the gap in 2012 was again 2.7 years but this represents a greater proportional difference. Trends in LE at age 65 are generally increasing, although by more in France for both men and especially women, while the trend in LE at age 65 for Swedish women was almost flat between 2004 and 2012 (Figure 1).
The same trends are apparent at age 85, although the gap between France and the other countries, including the UK, appears to be increasing, especially for men. As for earlier ages, LE for UK men ranks higher (6th) than that for women (9th).
2.3 UK life expectancy trends in comparison with other OECD countries
LE at birth now exceeds 80 years in total for OECD countries, with Japan and Switzerland having the highest values. LE at birth, age 65 and age 80 for Japan, Switzerland, the UK and the USA from 2000 to 2012 show similarities and differences in both level and trend (Figure 2). Differences between the UK, Japan and Switzerland for LE at birth are predominantly for women rather than men, although the UK trend for both men and women appears to be tracking Switzerland’s, but at around 1.5 years below (men) and 2 years below (women). LE at birth in the USA has been consistently below that of the UK, with an increasing gap between the countries over time.
LE at age 65 for men in Switzerland has increased fastest of the four countries up to 2011, narrowing the gap with Japan (Figure 2). LE at age 65 for Japanese men and women has been relatively constant since 2007 but Japanese women still have the longest LE at age 65, around 3 years longer than in the UK. More noticeable is that LE at age 65 for men and women in the USA has been increasing less rapidly than the UK since 2004, although prior to this, values were almost identical. By age 80 there is little difference between the UK, Japan and Switzerland for men’s LE.
8
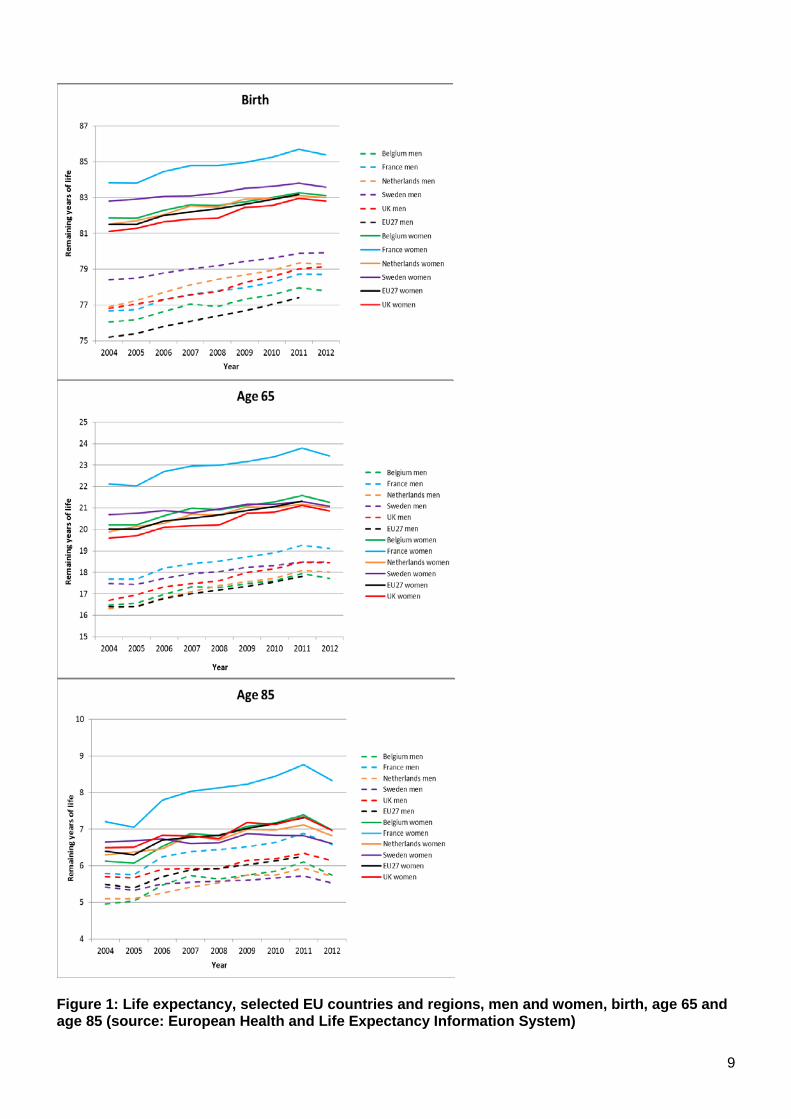
Figure 1: Life expectancy, selected EU countries and regions, men and women, birth, age 65 and age 85 (source: European Health and Life Expectancy Information System)
9
Figure 2: Life expectancy, selected OECD countries, men and women, birth, age 65 and age 80 (source: OECD)
10
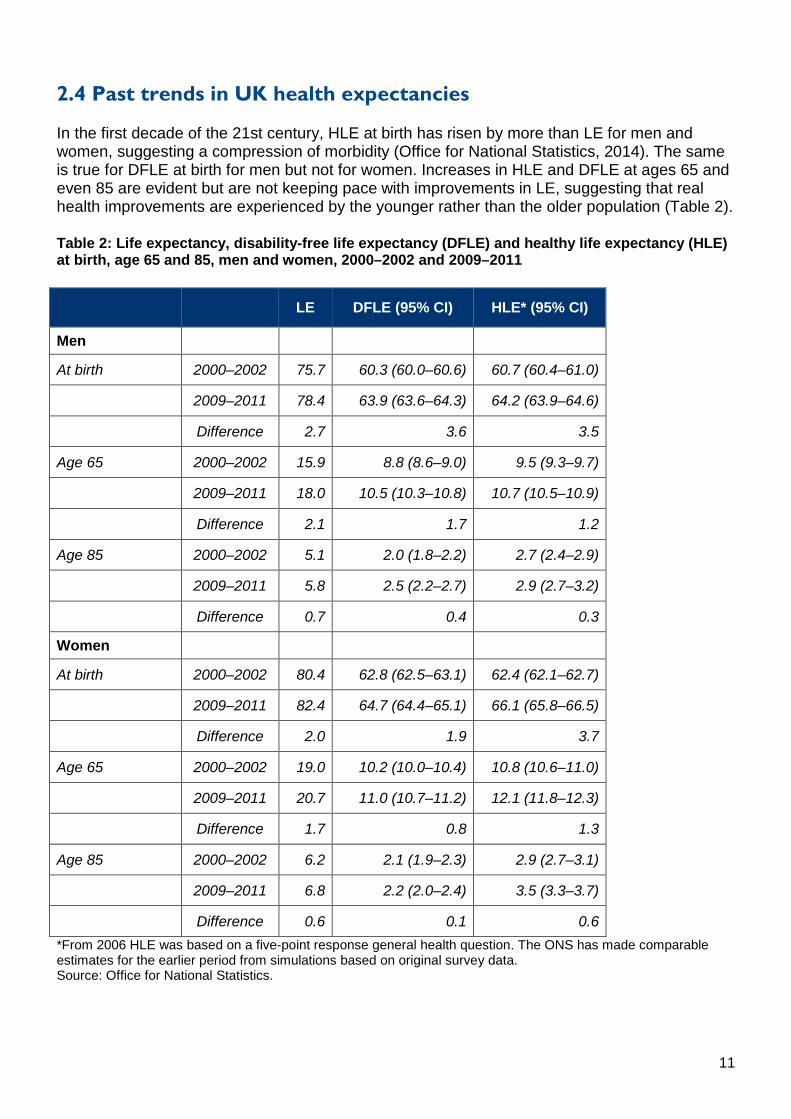
2.4 Past trends in UK health expectancies
In the first decade of the 21st century, HLE at birth has risen by more than LE for men and women, suggesting a compression of morbidity (Office for National Statistics, 2014). The same is true for DFLE at birth for men but not for women. Increases in HLE and DFLE at ages 65 and even 85 are evident but are not keeping pace with improvements in LE, suggesting that real health improvements are experienced by the younger rather than the older population (Table 2).
Table 2: Life expectancy, disability-free life expectancy (DFLE) and healthy life expectancy (HLE) at birth, age 65 and 85, men and women, 2000–2002 and 2009–2011
LE DFLE (95% CI) HLE* (95% CI)
Men
At birth 2000–2002 75.7 60.3 (60.0–60.6) 60.7 (60.4–61.0)
2009–2011 78.4 63.9 (63.6–64.3) 64.2 (63.9–64.6)
Difference 2.7 3.6 3.5
Age 65 2000–2002 15.9 8.8 (8.6–9.0) 9.5 (9.3–9.7)
2009–2011 18.0 10.5 (10.3–10.8) 10.7 (10.5–10.9)
Difference 2.1 1.7 1.2
Age 85 2000–2002 5.1 2.0 (1.8–2.2) 2.7 (2.4–2.9)
2009–2011 5.8 2.5 (2.2–2.7) 2.9 (2.7–3.2)
Difference 0.7 0.4 0.3
Women
At birth 2000–2002 80.4 62.8 (62.5–63.1) 62.4 (62.1–62.7)
2009–2011 82.4 64.7 (64.4–65.1) 66.1 (65.8–66.5)
Difference 2.0 1.9 3.7
Age 65 2000–2002 19.0 10.2 (10.0–10.4) 10.8 (10.6–11.0)
2009–2011 20.7 11.0 (10.7–11.2) 12.1 (11.8–12.3)
Difference 1.7 0.8 1.3
Age 85 2000–2002 6.2 2.1 (1.9–2.3) 2.9 (2.7–3.1)
2009–2011 6.8 2.2 (2.0–2.4) 3.5 (3.3–3.7)
Difference 0.6 0.1 0.6 *From 2006 HLE was based on a five-point response general health question. The ONS has made comparable estimates for the earlier period from simulations based on original survey data. Source: Office for National Statistics.
11
In general, gender differences in LE are much greater than gender differences in DFLE or HLE, suggesting that most of the extra years of life for women are years with disability or ill health. In addition levels of HLE tend to be slightly higher at any given age than those for DFLE. Self-rated health, the underlying question for HLE, is a more holistic measure of health, although it has been consistently shown to be a strong predictor of service use and mortality in many studies worldwide. It may be more likely to tap mental ill health than the limiting longstanding illness question underpinning DFLE, but changes over time in self-rated health (or between social groups) may be a result of different health expectations. Self-rated general health is certainly known to be influenced by the position of the question relative to other health questions within the same survey. In addition, older people may report high self-rated health despite considerable morbidity, as some conditions are equated with ageing rather than illness. This is true to a much lesser extent with the DFLE question, although this may be affected by levels of disability benefit.
Past trends in health expectancies for the UK, particularly for HLE, based on self-rated health, are problematic due to changes in questions over time. Absence of the institutionalised population is also an issue, although more so at very late old age.
2.5 UK health expectancy trends in comparison with other EU countries
The EU has a common health question, the GALI, upon which the HLY indicator is based, but comparability issues across Europe remain, particularly for the UK which only recently adopted the GALI fully. Comparisons are therefore restricted to the selected countries in the previous section for the period 2005–2010 because the UK question then changed.
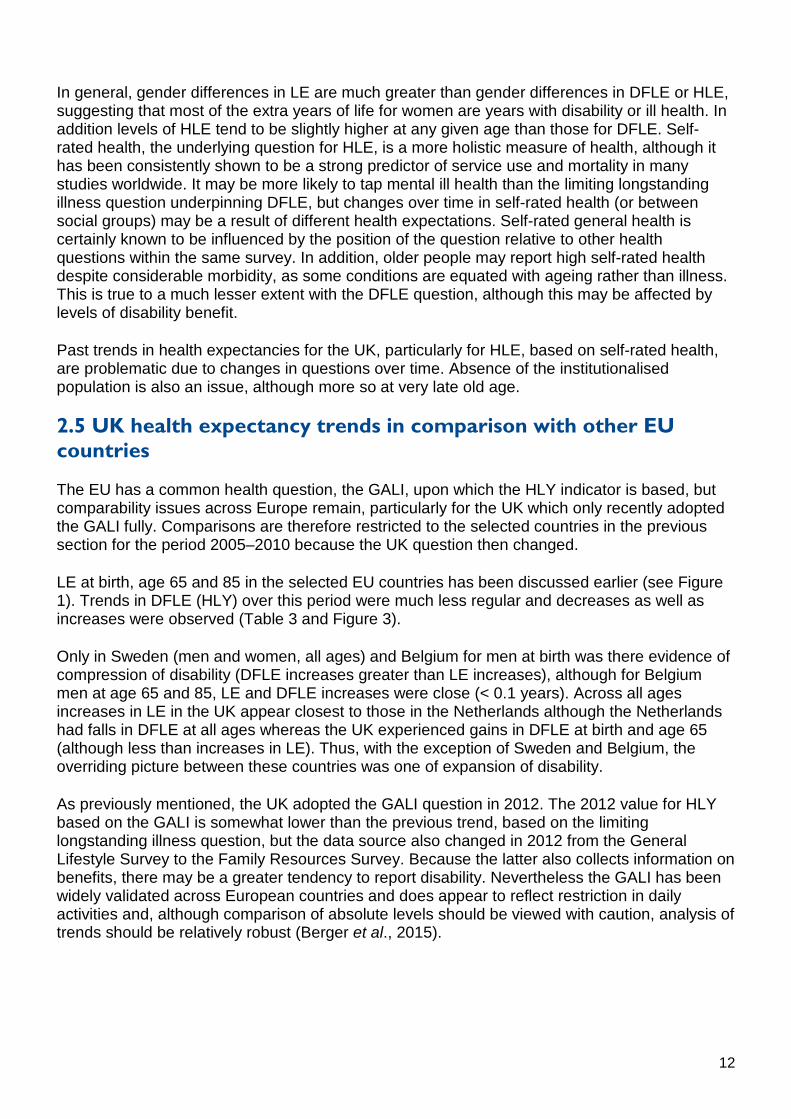
LE at birth, age 65 and 85 in the selected EU countries has been discussed earlier (see Figure 1). Trends in DFLE (HLY) over this period were much less regular and decreases as well as increases were observed (Table 3 and Figure 3).
Only in Sweden (men and women, all ages) and Belgium for men at birth was there evidence of compression of disability (DFLE increases greater than LE increases), although for Belgium men at age 65 and 85, LE and DFLE increases were close (< 0.1 years). Across all ages increases in LE in the UK appear closest to those in the Netherlands although the Netherlands had falls in DFLE at all ages whereas the UK experienced gains in DFLE at birth and age 65 (although less than increases in LE). Thus, with the exception of Sweden and Belgium, the overriding picture between these countries was one of expansion of disability.
As previously mentioned, the UK adopted the GALI question in 2012. The 2012 value for HLY based on the GALI is somewhat lower than the previous trend, based on the limiting longstanding illness question, but the data source also changed in 2012 from the General Lifestyle Survey to the Family Resources Survey. Because the latter also collects information on benefits, there may be a greater tendency to report disability. Nevertheless the GALI has been widely validated across European countries and does appear to reflect restriction in daily activities and, although comparison of absolute levels should be viewed with caution, analysis of trends should be relatively robust (Berger et al., 2015).
12
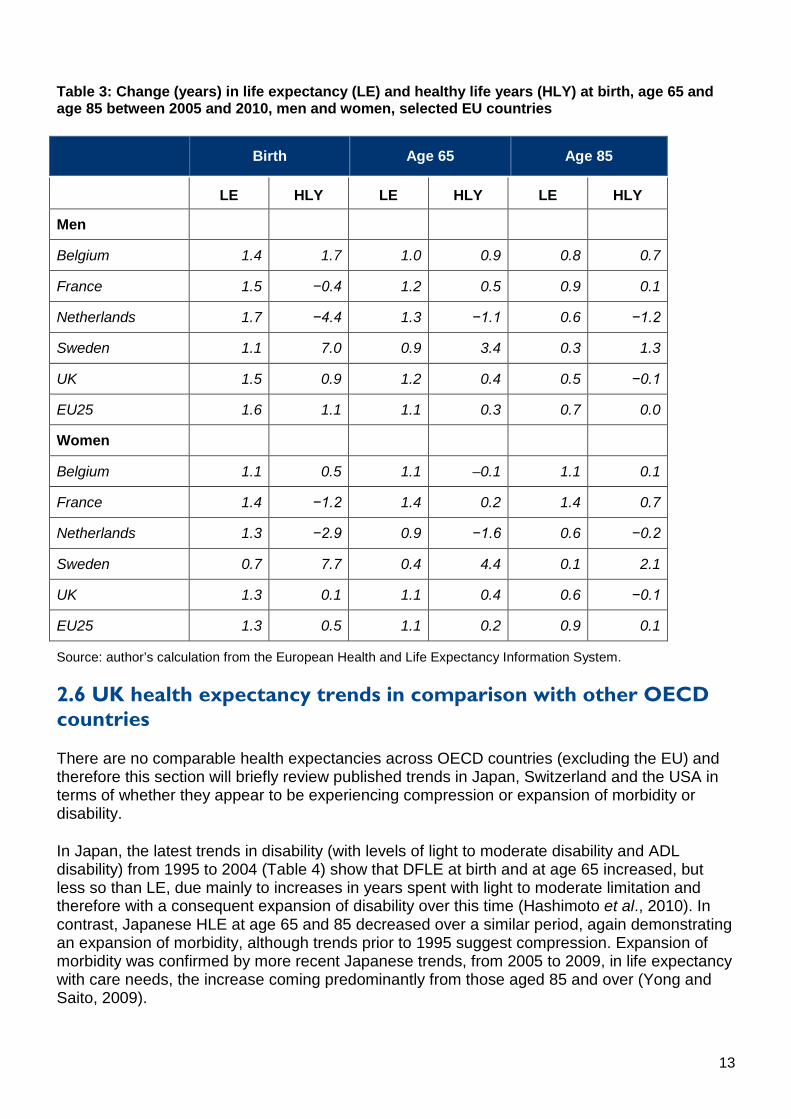
Table 3: Change (years) in life expectancy (LE) and healthy life years (HLY) at birth, age 65 and age 85 between 2005 and 2010, men and women, selected EU countries
Birth Age 65 Age 85
Birth Birth Age 65 Age 65 Age 85 Age 85
Gender/country LE HLY LE HLY LE HLY
Men
Belgium 1.4 1.7 1.0 0.9 0.8 0.7
France 1.5 −0.4 1.2 0.5 0.9 0.1
Netherlands 1.7 −4.4 1.3 −1.1 0.6 −1.2
Sweden 1.1 7.0 0.9 3.4 0.3 1.3
UK 1.5 0.9 1.2 0.4 0.5 −0.1
EU25 1.6 1.1 1.1 0.3 0.7 0.0
Women
Belgium 1.1 0.5 1.1 –0.1 1.1 0.1
France 1.4 −1.2 1.4 0.2 1.4 0.7
Netherlands 1.3 −2.9 0.9 −1.6 0.6 −0.2
Sweden 0.7 7.7 0.4 4.4 0.1 2.1
UK 1.3 0.1 1.1 0.4 0.6 −0.1
EU25 1.3 0.5 1.1 0.2 0.9 0.1
Source: author’s calculation from the European Health and Life Expectancy Information System.
2.6 UK health expectancy trends in comparison with other OECD countries
There are no comparable health expectancies across OECD countries (excluding the EU) and therefore this section will briefly review published trends in Japan, Switzerland and the USA in terms of whether they appear to be experiencing compression or expansion of morbidity or disability.
In Japan, the latest trends in disability (with levels of light to moderate disability and ADL disability) from 1995 to 2004 (Table 4) show that DFLE at birth and at age 65 increased, but less so than LE, due mainly to increases in years spent with light to moderate limitation and therefore with a consequent expansion of disability over this time (Hashimoto et al., 2010). In contrast, Japanese HLE at age 65 and 85 decreased over a similar period, again demonstrating an expansion of morbidity, although trends prior to 1995 suggest compression. Expansion of morbidity was confirmed by more recent Japanese trends, from 2005 to 2009, in life expectancy with care needs, the increase coming predominantly from those aged 85 and over (Yong and Saito, 2009).
13
Figure 3: Life expectancy (LE) and disability-free life expectancy (DFLE) based on healthy life-years, selected EU countries and regions, men at birth, age 65 and 85 (source: European Health and Life Expectancy Information System)
DFLE (HLY) and HLE (years of good or better self-rated health) based on the European SILC questions have been available for Switzerland since 2008, although stability of the questions over time within the country and comparability with the standard has not been as rigorously validated as other EU countries. Changes in DFLE between 2008 and 2012 show increases of around 3 years at birth and 1.4 years at age 65 for both men and women, much greater than the increases in LE (< 1 year at birth and age 65). By age 85 DFLE trends differ between men and women with increases in DFLE for men and decreases for women alongside decreases in LE
14
for both men and women (Table 4). Changes in HLE (years in good or more self-rated health) were in the same direction as DFLE although increases were smaller.
The USA routinely reports DFLE (years free of chronic condition-induced activity limitation) from a question in the National Health Interview Survey. The latest published trends from 2000 to 2006 (Molla and Madans, 2010) show increases in DFLE at all ages, although these are lower than increases in LE at birth and similar to changes in LE at ages 65 and 85 (Table 4).
UK trends in DFLE and HLE from routine national data have been discussed earlier in this section (see Table 2) but for ease of comparison are included again here. The UK national picture was of increasing LE, DFLE and HLE (smaller for women than men at all ages) with a compression observed at birth in morbidity (men and women) and in disability (men only) but not at older ages. New results (data not shown) from the Cognitive Function and Ageing Study (CFAS) confirm these trends, but with the benefit of identical questions and survey design at the two time points (Jagger et al., 2015).
15
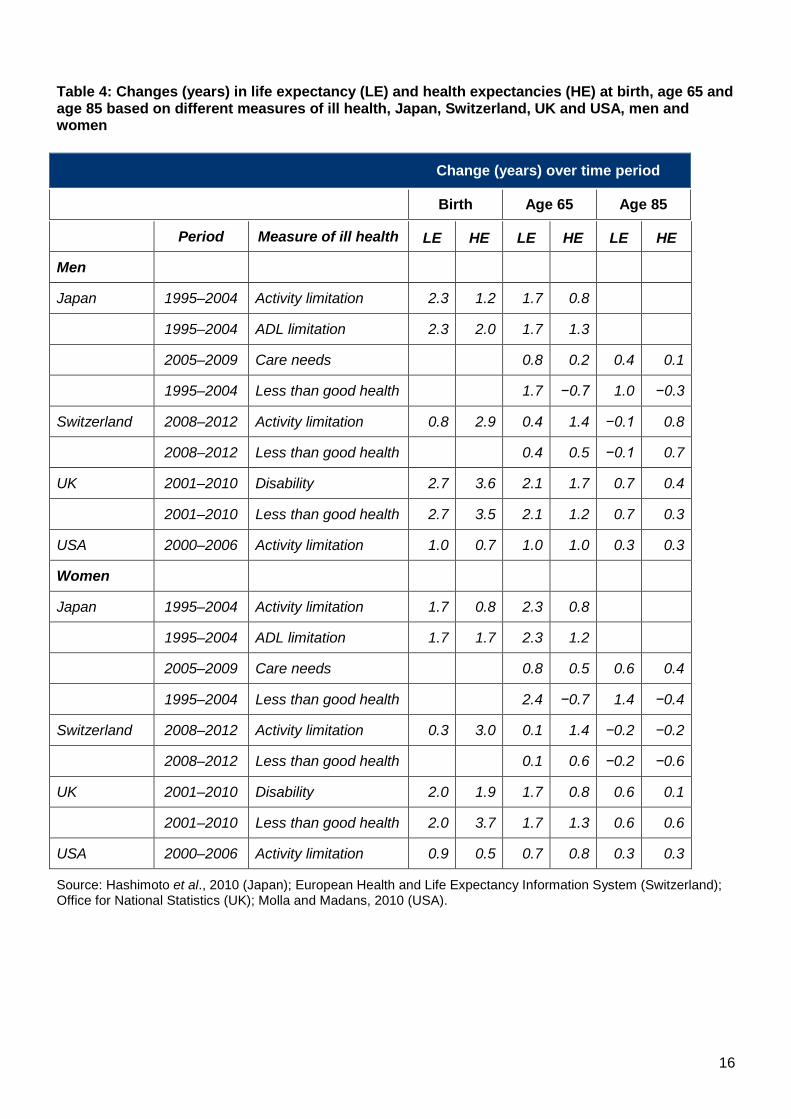
Table 4: Changes (years) in life expectancy (LE) and health expectancies (HE) at birth, age 65 and age 85 based on different measures of ill health, Japan, Switzerland, UK and USA, men and women
Change (years) over time period
Birth Age 65 Age 85
Gender/Country Period Measure of ill health Birth
LE Birth
HE Age 65
LE Age 65
HE Age 85
LE Age 85
HE
Men
Japan 1995–2004 Activity limitation 2.3 1.2 1.7 0.8
1995–2004 ADL limitation 2.3 2.0 1.7 1.3
2005–2009 Care needs 0.8 0.2 0.4 0.1
1995–2004 Less than good health 1.7 −0.7 1.0 −0.3
Switzerland 2008–2012 Activity limitation 0.8 2.9 0.4 1.4 −0.1 0.8
2008–2012 Less than good health 0.4 0.5 −0.1 0.7
UK 2001–2010 Disability 2.7 3.6 2.1 1.7 0.7 0.4
2001–2010 Less than good health 2.7 3.5 2.1 1.2 0.7 0.3
USA 2000–2006 Activity limitation 1.0 0.7 1.0 1.0 0.3 0.3
Women
Japan 1995–2004 Activity limitation 1.7 0.8 2.3 0.8
1995–2004 ADL limitation 1.7 1.7 2.3 1.2
2005–2009 Care needs 0.8 0.5 0.6 0.4
1995–2004 Less than good health 2.4 −0.7 1.4 −0.4
Switzerland 2008–2012 Activity limitation 0.3 3.0 0.1 1.4 −0.2 −0.2
2008–2012 Less than good health 0.1 0.6 −0.2 −0.6
UK 2001–2010 Disability 2.0 1.9 1.7 0.8 0.6 0.1
2001–2010 Less than good health 2.0 3.7 1.7 1.3 0.6 0.6
USA 2000–2006 Activity limitation 0.9 0.5 0.7 0.8 0.3 0.3
Source: Hashimoto et al., 2010 (Japan); European Health and Life Expectancy Information System (Switzerland); Office for National Statistics (UK); Molla and Madans, 2010 (USA).
16
3. Inequalities in LE, HLE and DFLE within the UK Inequalities in health and mortality are a longstanding issue in England. Thirty years ago the Black Report (Department of Health and Social Security, 1980) highlighted health inequalities across Britain and more recently the Marmot Review (Marmot, 2010) has brought the topic back to the attention of politicians and policy makers. In this section the focus will be on mortality and health from 1991 onwards, as from this time onwards it became possible to measure inequality because health expectancy could be estimated on a local area level instead of only nationally.
3.1 Life expectancy
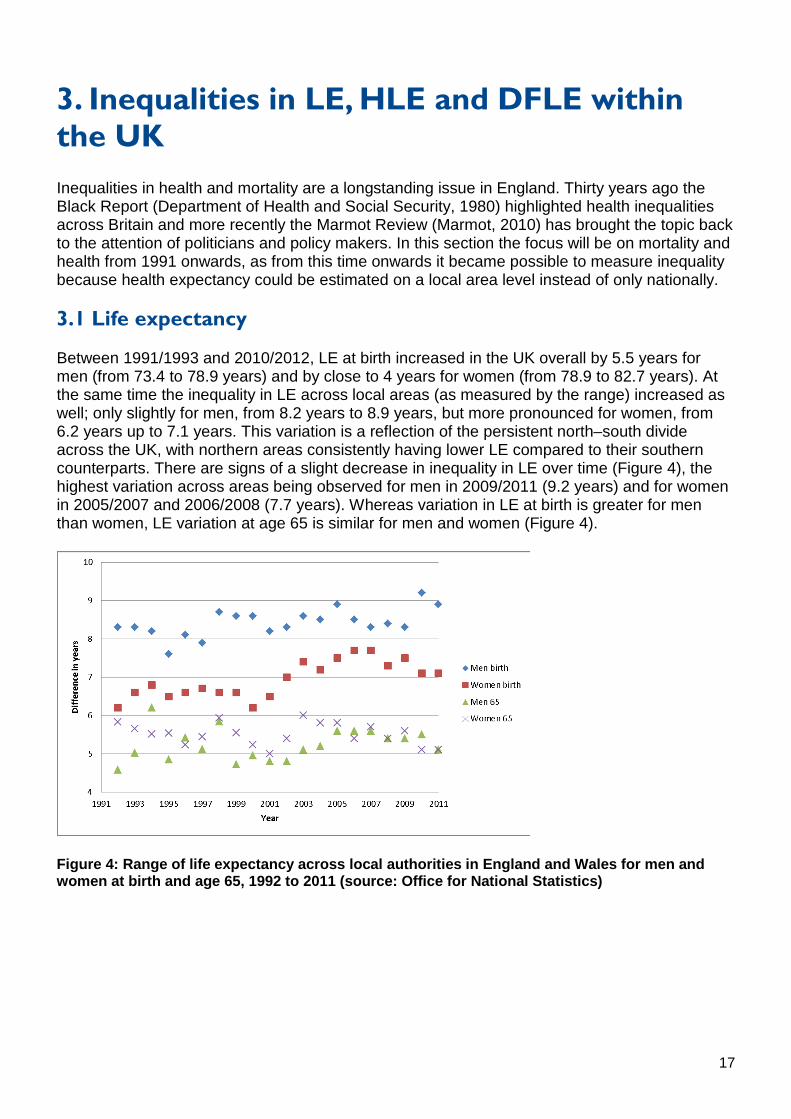
Between 1991/1993 and 2010/2012, LE at birth increased in the UK overall by 5.5 years for men (from 73.4 to 78.9 years) and by close to 4 years for women (from 78.9 to 82.7 years). At the same time the inequality in LE across local areas (as measured by the range) increased as well; only slightly for men, from 8.2 years to 8.9 years, but more pronounced for women, from 6.2 years up to 7.1 years. This variation is a reflection of the persistent north–south divide across the UK, with northern areas consistently having lower LE compared to their southern counterparts. There are signs of a slight decrease in inequality in LE over time (Figure 4), the highest variation across areas being observed for men in 2009/2011 (9.2 years) and for women in 2005/2007 and 2006/2008 (7.7 years). Whereas variation in LE at birth is greater for men than women, LE variation at age 65 is similar for men and women (Figure 4).
Figure 4: Range of life expectancy across local authorities in England and Wales for men and women at birth and age 65, 1992 to 2011 (source: Office for National Statistics)
17
3.2 DFLE and HLE
DFLE was measured for the first time across all UK local areas in 1991, when a limiting longstanding illness question was included in the census. In 2001 a further question on self-rated health was added. As mentioned previously, these questions have changed slightly in subsequent censuses and 2011 harmonised values are still to be estimated. Inequalities are again measured by the range across units. This and other measures of inequality (standard deviation) may be differentially sensitive to the size of units analysed or to outliers, but this is unlikely to substantially affect the trends.
Unlike inequalities in LE at birth across local authorities in England and Wales, which fluctuated around 8.5 years for men and 7.7 years for women between 1991 and 2001, inequalities in DFLE are larger, close to 14 years for women and almost 19 years for men in 1991, and increased further to 16.5 years for women in 2001, although inequality for men remained static. The larger inequalities for DFLE than LE and increasing trend between 1991 and 2001 are also true at age 65 and 85 (Table 5).
The north–south divide is still evident at age 65, but by 85 it has disappeared and variation in DFLE at age 85 is more related to urban/rural residence, possibly because of better access to services (Wohland et al., 2014a). HLE variations at birth, measured for the first time in 2001 across local areas, were slightly lower than differences in DFLE (Table 5) but have also increased over time. A clear north–south divide is still apparent even on a larger geographical scale, that is, English Regions, and again DFLE inequalities (around 7 years) exceed LE inequalities (around 2.5 years). The highest DFLE are observed in the South East, East of England, and South West and the lowest in the North East and the North West.
State pension age for UK women will rise to 65 by 2018, to 66 for men and women by 2020, with a further increase to 68 by 2046 at the latest. The relationship between health and work is bidirectional, with benefits of work on physical and mental health, although if longer working life is accompanied by an increase in the time spent with health problems and work disability, continued working will be problematic. Figures for DFLE for 2010–12 suggest that there are particular regions of England where extending working life will be a challenge, as on average men and women already have an onset of activity limitation by age 65. Notable is the North East, where all the local authorities have low DFLE (DFLE less than 65 years) and almost all are very low (DFLE significantly less than 65 years) (Table 6). The North West and Yorkshire and the Humber similarly have around 80% of local authorities with very low DFLE. These figures for northern regions are in stark contrast to England as a whole (around 50% very low) and the East of England and the South West, which have less than 20% of local authorities with very low DFLE.
18
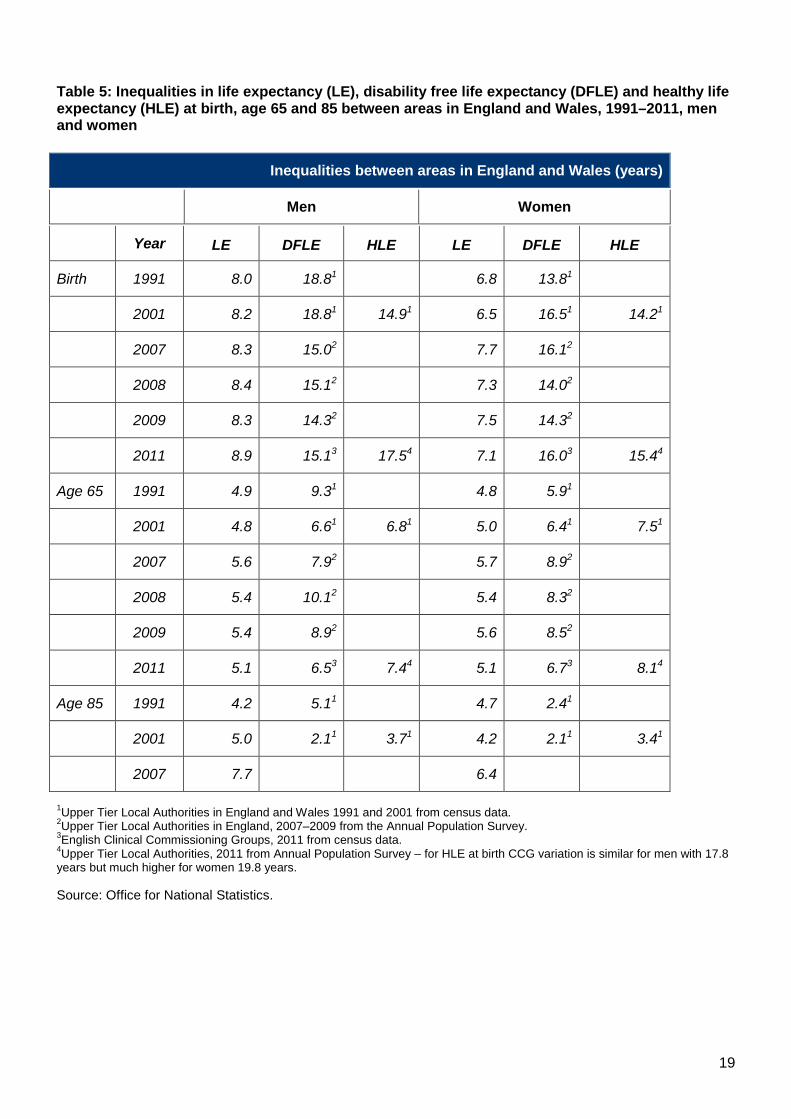
Table 5: Inequalities in life expectancy (LE), disability free life expectancy (DFLE) and healthy life expectancy (HLE) at birth, age 65 and 85 between areas in England and Wales, 1991–2011, men and women
Inequalities between areas in England and Wales (years)
Men Women
Year Men
LE Men
DFLE Men
HLE Women
LE Women
DFLE Women
HLE
Birth 1991 8.0 18.81 6.8 13.81
2001 8.2 18.81 14.91 6.5 16.51 14.21
2007 8.3 15.02 7.7 16.12
2008 8.4 15.12 7.3 14.02
2009 8.3 14.32 7.5 14.32
2011 8.9 15.13 17.54 7.1 16.03 15.44
Age 65 1991 4.9 9.31 4.8 5.91
2001 4.8 6.61 6.81 5.0 6.41 7.51
2007 5.6 7.92 5.7 8.92
2008 5.4 10.12 5.4 8.32
2009 5.4 8.92 5.6 8.52
2011 5.1 6.53 7.44 5.1 6.73 8.14
Age 85 1991 4.2 5.11 4.7 2.41
2001 5.0 2.11 3.71 4.2 2.11 3.41
2007 7.7 6.4
1Upper Tier Local Authorities in England and Wales 1991 and 2001 from census data. 2Upper Tier Local Authorities in England, 2007–2009 from the Annual Population Survey. 3English Clinical Commissioning Groups, 2011 from census data. 4Upper Tier Local Authorities, 2011 from Annual Population Survey – for HLE at birth CCG variation is similar for men with 17.8 years but much higher for women 19.8 years.
Source: Office for National Statistics.
19
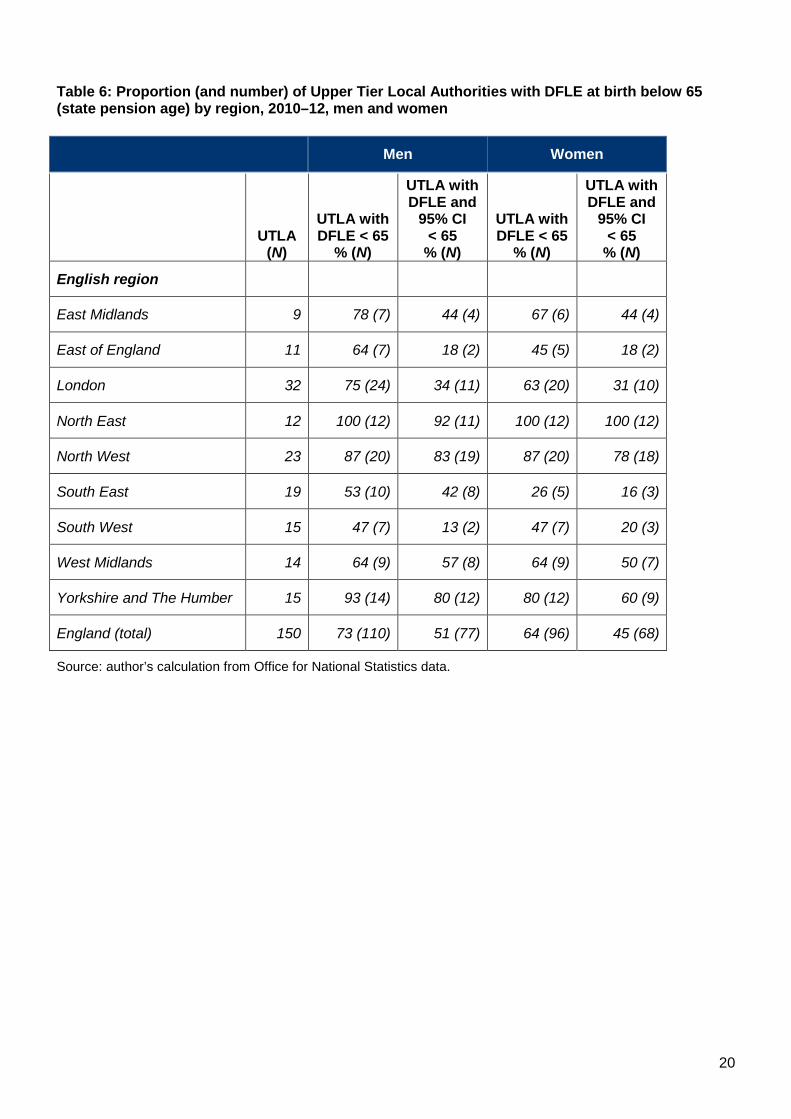
Table 6: Proportion (and number) of Upper Tier Local Authorities with DFLE at birth below 65 (state pension age) by region, 2010–12, men and women
Men Women
UTLA
(N)
Men
UTLA with DFLE < 65
% (N)
Men
UTLA with DFLE and
95% CI < 65
% (N)
Women
UTLA with DFLE < 65
% (N)
Women
UTLA with DFLE and
95% CI < 65
% (N)
English region
East Midlands 9 78 (7) 44 (4) 67 (6) 44 (4)
East of England 11 64 (7) 18 (2) 45 (5) 18 (2)
London 32 75 (24) 34 (11) 63 (20) 31 (10)
North East 12 100 (12) 92 (11) 100 (12) 100 (12)
North West 23 87 (20) 83 (19) 87 (20) 78 (18)
South East 19 53 (10) 42 (8) 26 (5) 16 (3)
South West 15 47 (7) 13 (2) 47 (7) 20 (3)
West Midlands 14 64 (9) 57 (8) 64 (9) 50 (7)
Yorkshire and The Humber 15 93 (14) 80 (12) 80 (12) 60 (9)
England (total) 150 73 (110) 51 (77) 64 (96) 45 (68)
Source: author’s calculation from Office for National Statistics data.
20
4. Main influences on LE, HLE and DFLE Increases in LE over the last decades in the UK and indeed in Europe and North America have been in greater part due to falling cardiovascular mortality, as a result of improvements in lifestyle factors (reductions in smoking), reductions in case fatality due to improved treatment and primary and secondary prevention of cardiovascular disease through statins. This section will focus on the factors that influence LE, DFLE and HLE and their current levels and trends in the UK under three broad headings: chronic conditions, health behaviours, and socio-economic and environmental factors.
4.1 Chronic conditions
Many chronic conditions that influence LE/mortality rates are also disabling conditions and therefore influence DFLE. However the balance between fatality and disabling consequence is crucial because this contributes towards compression or expansion of disability. Thus a condition that is more fatal than disabling, if eliminated, would produce gains in LE that are greater than gains in DFLE because longer LE itself puts more of the population at risk of other chronic disabling conditions. On the other hand, eliminating a condition that has low fatality but high disabling effects (for example arthritis) would produce almost all the gains in DFLE.
Studies that have examined the potential effect of diseases on DFLE have mostly done so using cross-sectional data through cause-deleted life tables (Hashimoto et al., 2012). These studies have noted that the impact of elimination of cancer and cardiovascular disease would be to increase DFLE but, as they also have high fatality rates, years with disability would also increase. A major drawback with this method is its reliance on death certification data and therefore the effect of non-fatal diseases cannot be determined. The method may also be inconsistent in the presence of comorbidity (which rises substantially with age). Newer techniques allow for comorbidity (Klijs et al., 2011b), but again are based on cross-sectional survey data for the assessment of the disabling effect of diseases, although at least non-fatal diseases can now be included. Indeed musculoskeletal disease and cardiovascular disease were found to contribute the most to the burden of disability, with chronic non-specific lung disease for men and diabetes for women also having a large contribution.
Longitudinal studies with mortality follow-up are the optimal method for assessing the impact of fatal and non-fatal diseases on DFLE, although these need to be large if low prevalence conditions such as diabetes are to be assessed. Using these methods, stroke was found to infer the greatest effect on LE at age 65 for men and diabetes for women, while stroke had the greatest reduction in DFLE for men and women, regardless of severity of disability included (Jagger et al., 2007). Cognitive impairment/dementia and diabetes had the second and third largest effect on DFLE, again regardless of severity of disability. Nevertheless, greater overall gains in DFLE, at least of mild severity, could be attained from elimination of arthritis and visual impairment because these conditions have little effect on extending LE but infer moderate reductions in DFLE, particularly in women (Figure 5). Respiratory disease (asthma and/or bronchitis) reduced LE and DFLE by around 2 years, although when lung function is objectively measured, severe obstruction reduced DFLE by just over 1 year and life expectancy by less than 0.5 years (Locke et al., 2013).
21
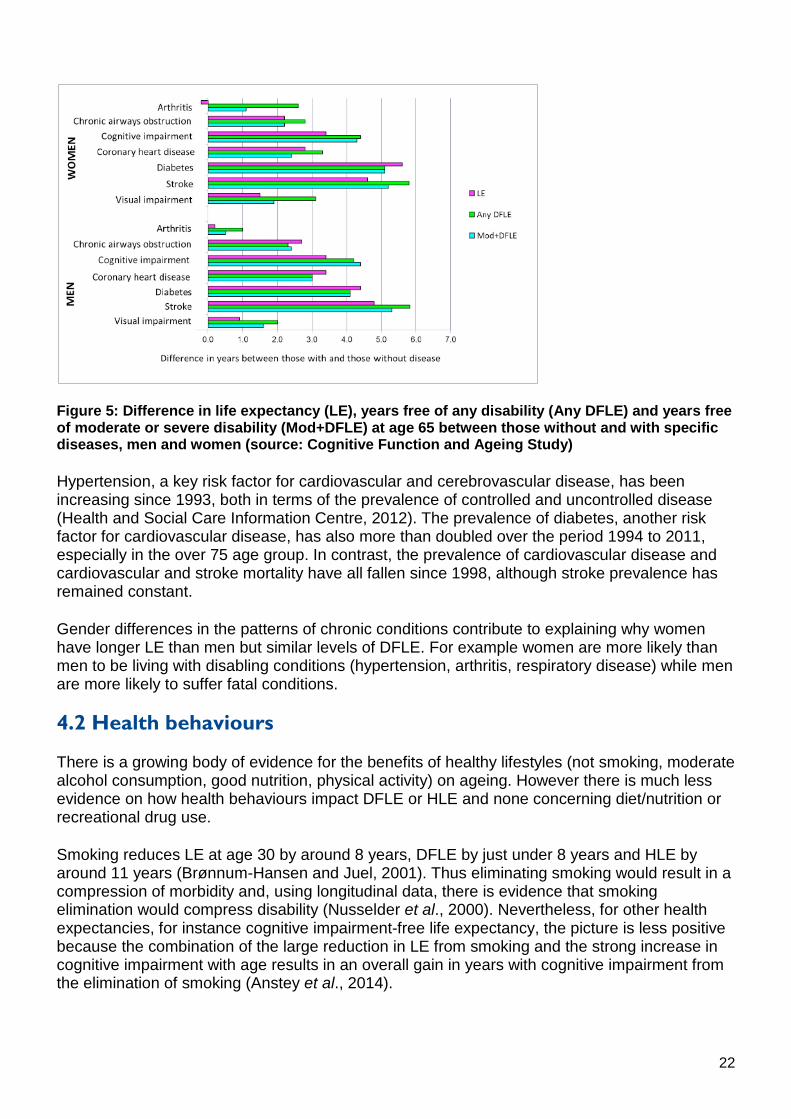
Figure 5: Difference in life expectancy (LE), years free of any disability (Any DFLE) and years free of moderate or severe disability (Mod+DFLE) at age 65 between those without and with specific diseases, men and women (source: Cognitive Function and Ageing Study)
Hypertension, a key risk factor for cardiovascular and cerebrovascular disease, has been increasing since 1993, both in terms of the prevalence of controlled and uncontrolled disease (Health and Social Care Information Centre, 2012). The prevalence of diabetes, another risk factor for cardiovascular disease, has also more than doubled over the period 1994 to 2011, especially in the over 75 age group. In contrast, the prevalence of cardiovascular disease and cardiovascular and stroke mortality have all fallen since 1998, although stroke prevalence has remained constant.
Gender differences in the patterns of chronic conditions contribute to explaining why women have longer LE than men but similar levels of DFLE. For example women are more likely than men to be living with disabling conditions (hypertension, arthritis, respiratory disease) while men are more likely to suffer fatal conditions.
4.2 Health behaviours
There is a growing body of evidence for the benefits of healthy lifestyles (not smoking, moderate alcohol consumption, good nutrition, physical activity) on ageing. However there is much less evidence on how health behaviours impact DFLE or HLE and none concerning diet/nutrition or recreational drug use.
Smoking reduces LE at age 30 by around 8 years, DFLE by just under 8 years and HLE by around 11 years (Brønnum-Hansen and Juel, 2001). Thus eliminating smoking would result in a compression of morbidity and, using longitudinal data, there is evidence that smoking elimination would compress disability (Nusselder et al., 2000). Nevertheless, for other health expectancies, for instance cognitive impairment-free life expectancy, the picture is less positive because the combination of the large reduction in LE from smoking and the strong increase in cognitive impairment with age results in an overall gain in years with cognitive impairment from the elimination of smoking (Anstey et al., 2014).
22
There appears to be a consensus from studies in Europe and the USA that, at least at older ages, obesity has more of an impact on DFLE than LE. When compared to smoking and alcohol consumption, obesity reduced LE at age 55 by only 1.4 years (smoking: 4.0 years; alcohol consumption: 3.0 years) but increased years with disability by 5.9 years (smoking: 3.8 years; alcohol consumption: 3.1 years) (Klijs et al., 2011a). As to whether physical activity has a greater effect on LE than DFLE remains equivocal.
Positive reductions have been observed in smoking, alcohol consumption and physical inactivity in the UK, although all are self-report measures from the Health Survey for England. Cigarette smoking decreased among most age groups, men and women, between 1993 and 2011, with the exception of men aged 25–34, who were most likely to be current smokers in 2011; in 2040 this group will be aged 54–63 years. Women aged 16–34, on the other hand, had the largest decrease in smoking. The proportion of men and women consuming more than the government guidelines for alcohol (4 units for men and 3 units for women daily) has shown little change (men) or decreased (women) over the period 2006 to 2011 and the same is true for the proportion consuming more than twice the recommended amount on any day. Likewise the proportion of men and women meeting recommendations for levels of physical activity generally increased among both men and women between 1997 and 2008.
In contrast there have been marked increases in obesity between 1993 and 2011, from 13% to 24% of men and from 16% to 26% of women, although slower increases were evident in the second half of the period. Waist circumference, as a measure of central adiposity, also increased significantly over the same period for both men and women, with the proportion of women with a raised waist circumference almost doubling.
4.3 Socio-economic and environmental factors
The impact of socio-economic status (SES) on years lived with disability and ill health has previously been reviewed (Jagger and Robine, 2011). In the UK, life tables are only routinely available by gender, region and deprivation, restricting analysis by other SES groups. There is evidence that regional variations in DFLE (the north–south divide referred to earlier) are not solely explained by greater deprivation in the north, because northern wards, in comparison to southern ones with equally high levels of deprivation, still have lower DFLE (by 5 years), while there is no difference between northern and southern wards with similarly low deprivation (Rasulo et al., 2007).
For the UK, longitudinal studies are the main means of estimating DFLE by education, social class and income. Generally SES has been found to be positively associated with DFLE and LE regardless of the SES measure and differences in DFLE between SES groups larger than differences in LE.
Meta-regression techniques are increasingly used to understand which SES and environmental factors are related to DFLE and because these analyses are undertaken at a regional or country level, they do not require differentiation of the life table by SES. Most recently social class, unemployment and education were found to be strongly related to variation in LE and DFLE at birth but were less influential in explaining variations at age 85. Moreover ethnicity, measured by the proportion of non-white population, had a stronger association with DFLE in 2001 than 1991, confirming the lower DFLE found for many of the non-white ethnic groups (Wohland et al., 2014b). This lower DFLE, particularly for South Asians, may moderate DFLE increases as these populations age into the older population.
23
5. Future trends in LE, HLE and DFLE in the UK LE projections for the UK population and sub-national geographies are published every 2 years by the ONS. The projections take into account estimated changes in fertility, migration and mortality, these being informed by the Expert Advisory Group to the National Population Projections. The most recent projections (2012-based) show continued rises in life expectancy at all ages although these will attenuate slightly in the medium to longer term (2025 to 2040) (Table 1).
The latest projections of LE for EU countries (2010-based) assume a ‘convergence hypothesis’, where countries with the lowest LE are assumed to have the greatest increases, resulting in a long-term convergence and therefore a reduction in LE between countries (Eurostat, 2012). These projections, as those for the UK, are deterministic, using high and low variants to indicate the influence of changes in underlying assumptions, rather than confidence intervals as measures of uncertainty from stochastic models. In general these projections assume LE will increase by the same amount as previously, or that increases will be smaller, or that mortality rates in specific age groups will increase or decrease. Fully probabilistic projections of LE have been produced using Bayesian hierarchical modelling and more recent adaptations that project LE for women and then model the gender difference to obtain that for men, find higher LE for men than those produced by the UN (Raftery et al., 2014).
In contrast to projections of LE, projections of DFLE or HLE are lacking. Simple extrapolation of current trends in DFLE (HLY) by EU country under specific scenarios has been used to assess the likelihood of reaching the EU target of an increase in two HLY between 2010 and 2020 (Jagger et al., 2013). Projections of DFLE to 2030 have been made for the Netherlands by forecasting transition probabilities between health states within a multistate modelling framework, including estimates of uncertainty (Majer et al., 2013). A similar although deterministic macrosimulation model, SIMPOP (Jagger et al., 2009), was extended to produce projections of DFLE under different health scenarios, although DFLE results have not been published.
24
6. Conclusion The UK has a long series of LE, DFLE and HLE at national and sub-national level, affording a generally sound basis for analysis of past trends in these indicators. However changes in underlying questions for DFLE and HLE, lack of inclusion of the institutionalised population in inter-censal years and only recent adoption of the standard EU DFLE question, make trends analysis challenging. Nevertheless, the latest data suggest that increases in DFLE and HLE in the UK are not keeping pace with gains in LE, particularly at later ages. Generally trends are similar for DFLE and HLE, although absolute levels of HLE tend to be slightly higher than DFLE.
This expansion of ill health and disability in the UK is also observed in other EU countries (France, the Netherlands), Japan and the USA but not in Belgium, Sweden or Switzerland, where LE gains appear smaller and compression is seen. A further issue for the UK is the widening of inequalities in DFLE and HLE between local areas, inequalities in DFLE and HLE being much greater than those in LE. This is no doubt contributing to the slower gains in DFLE overall. The high proportion of local areas in the north with DFLE at birth below 65 will be challenging for employers and individuals with rising state pension age.
With regard to future trends in LE, DFLE and HLE, reductions have been observed in some disabling diseases and unhealthy behaviours which influence DFLE. However the prevalence of diabetes and obesity is still rising and regional variations in unemployment, deprivation and alcohol consumption may well contribute to DFLE inequalities. Projections of DFLE and HLE are scarce and at present are not able to explicitly include changes in diseases or lifestyle factors or SES might affect future DFLE.
25
References Anstey, K. J., Kingston, A., Kiely, K. M., Luszcz, M. A., Mitchell, P. and Jagger, C. (2014) The influence of smoking, sedentary lifestyle and obesity on cognitive impairment-free life expectancy. International Journal of Epidemiology 43, 1874–1883.
Berger, N., Van Oyen, H., Cambois, E., Fouweather, T., Jagger, C., Nusselder, W. and Robine, J.-M. (2015) Assessing the validity of the Global Activity Limitation Indicator in fourteen European countries. BMC Medical Research Methodology 15, 1.
Brønnum-Hansen, H. and Juel, K. (2001) Abstention from smoking extends life and compresses morbidity: a population based study of health expectancy among smokers and never smokers in Denmark. Tobacco Control 10, 273–278.
Department of Health and Social Security (1980) Inequalities in Health: Report of a Research Working Group Chaired by Sir Douglas Black. London: DHSS.
Eurostat (2012) The 2012 Ageing Report: Underlying Assumptions and Projection Methodologies. Brussels: European Commission.
Hashimoto, S., Kawado, M., Seko, R., Murakami, Y., Hayashi, M., Kato, M., Noda, T., Ojima, T., Nagai, M. and Tsuji, I. (2010) Trends in disability-free life expectancy in Japan, 1995-2004. Journal of Epidemiology 20, 308–312.
Hashimoto, S., Kawado, M., Yamada, H., Seko, R., Murakami, Y., Hayashi, M., Kato, M., Noda, T., Ojima, T., Nagai, M. and Tsuji, I. (2012) Gains in disability-free life expectancy from elimination of diseases and injuries in Japan. Journal of Epidemiology 22, 199–204.
Health and Social Care Information Centre (2012) Health Survey for England 2011: Trend tables [NS]. Available at: http://www.hscic.gov.uk/catalogue/PUB09302 (accessed 8 May 2015).
Jagger, C. and Robine, J. M. (2011) Healthy life expectancy. In: Rogers, R. G. and Crimmins, E. M. (eds). International Handbook of Adult Mortality. Springer Netherlands, pp. 551–568.
Jagger, C., Matthews, F., Wohland, P., Fouweather, T., Stephan, B., Robinson, L., Arthur, A. and Brayne, C. (2015) A comparison of health expectancies from the Cognitive Function and Ageing Studies over two decades in England. Lancet (in press).
Jagger, C., Matthews, R., Lindesay, J., Robinson, T., Croft, P. and Brayne, C. (2009) The effect of dementia trends and treatments on longevity and disability: a simulation model based on the MRC Cognitive Function and Ageing Study (MRC CFAS). Age and Ageing 38, 319–325.
Jagger, C., Matthews, R., Matthews, F., Robinson, T., Robine, J. M. and Brayne, C. (2007) The burden of diseases on disability-free life expectancy in later life. Journals of Gerontology. Series A Biological Sciences and Medical Sciences 62, 408–414.
Jagger, C., McKee, M., Christensen, K., Lagiewka, K., Nusselder, W., Van Oyen, H., Cambois, E., Jeune, B. and Robine, J.-M. (2013) Mind the gap – reaching the European target of a 2-year increase in healthy life years in the next decade. European Journal of Public Health 23, 829–833.
26
Klijs, B., Mackenbach, J. P. and Kunst, A. E. (2011a) Obesity, smoking, alcohol consumption and years lived with disability: a Sullivan life table approach. BMC Public Health 11, 378.
Klijs, B., Nusselder, W. J., Looman, C. W. and Mackenbach, J. P. (2011b) Contribution of chronic disease to the burden of disability. PloS One 6, e25325.
Locke, E., Thielke, S., Diehr, P., Wilsdon, A. G., Barr, R. G., Hansel, N., Kapur, V. K., Krishnan, J., Enright, P., Heckbert, S. R., Kronmal, R. A. and Fan, V. S. (2013) Effects of respiratory and non-respiratory factors on disability among older adults with airway obstruction: the Cardiovascular Health Study. Journal of Chronic Obstructive Pulmonary Disease 10, 588–596.
Majer, I. M., Stevens, R., Nusselder, W. J., Mackenbach, J. P. and van Baal, P. H. M. (2013) Modeling and forecasting health expectancy: Theoretical framework and application. Demography 50, 673–697.
Marmot, M. (2010) Fair Society, Healthy Lives: The Marmot Review. London: University College London.
Marmot, M. and Goldblatt, P. (2013) Importance of monitoring health inequalities. BMJ 347, f6576.
Molla, M. T. and Madans, J. H. (2010) Life Expectancy Free of Chronic Condition-induced Activity Limitations Among White and Black Americans, 2000–2006. Vital and Health Statistics Series 3, Number 34. Washington, DC: National Center for Health Statistics. Available at: www.cdc.gov/nchs/data/series/sr_03/sr03_034.pdf (accessed 29 June 2015).
Nusselder, W. J., Looman, C. W. N., van de Mheen, P. J. M., van de Mheen, H. and Mackenbach, J. P. (2000) Smoking and the compression of morbidity. Journal of Epidemiology and Community Health 54, 566–574.
Office for National Statistics (2014) Statistical Bulletin: Health Expectancies at Birth and Age 65 in the United Kingdom, 2009–11.
Raftery, A. E., Lalic, N. and Gerland, P. (2014) Joint probabilistic projection of female and male life expectancy. Demographic Research 30, 795–821.
Rasulo, D., Bajekal, M. and Yar, M. (2007) Inequalities in health expectancies in England and Wales – small area analysis from the 2001 Census. Health Statistics Quarterly 34, 35–45.
Salomon, J. A., Wang, H., Freeman, M. K., Vos, T., Flaxman, A. D., Lopez, A. D. and Murray, C. J. L. (2012) Healthy life expectancy for 187 countries, 1990-2010: a systematic analysis for the Global Burden Disease Study 2010. Lancet 380, 2144–2162.
Sullivan, D. F. (1971) A single index of mortality and morbidity. Health Services Mental Health Administration Health Reports 86, 347–354.
Van Oyen, H., Van der Heyden, J., Perenboom, R. and Jagger, C. (2006) Monitoring population disability: evaluation of a new Global Activity Limitation Indicator (GALI). Sozial-Und Praventivmedizin 51, 153–161.
27
Wohland, P., Rees, P., Gillies, C., Alvanides, S., Matthews, F. E., O'Neill, V. and Jagger, C. (2014a) Drivers of inequality in disability-free expectancy at birth and age 85 across space and time in Great Britain. Journal of Epidemiology and Community Health 68, 826–833.
Wohland, P., Rees, P., Nazroo, J. and Jagger, C. (2014b) Inequalities in healthy life expectancy between ethnic groups in England and Wales in 2001. Ethnicity & Health 20, 341–353.
Yong, V. and Saito, Y. (2009) Trends in healthy life expectancy in Japan: 1986-2004. Demographic Research 20, 467–494.
28
© Crown copyright 2015
This publication is licensed under the terms of the Open Government Licence v3.0 except where otherwise stated. To view this licence, visit nationalarchives.gov.uk/doc/open-government-licence/version/3 or write to the Information Policy Team, The National Archives, Kew, London TW9 4DU, or email: [email protected].
Where we have identified any third party copyright information you will need to obtain permission from the copyright holders concerned.
This publication available from www.gov.uk/go-science
Contacts us if you have any enquiries about this publication, including requests for alternative formats, at:
Government Office for Science 1 Victoria Street London SW1H 0ET Tel: 020 7215 5000 Email: [email protected]
GS/15/13
Related Documents