XA04C1568 Core Physics Analysis in Support of the FNR HEU-LEU Demonstration Bxperiment David C. Losey, Forrest B. Brown, William R. Martin and John C. Lee Department of Nuclear Engineering The University of Michigan Abstract A core neutronics analysis has been undertaken to assess the impact of low-enrichment fuel on the performance and utilization of the FNR As part of this analytic effort a computer code system has been assembled which will be of general use in analyzing research reactors with MTR-type fuel. The code system has been extensively tested and verified in calcu- lations for the present high enrichment core. The analysis presented here compares the high-and-low enrichment fuels in batch and equilibrium core configurations which model the actual FNR oerating conditions. The two fuels are compared for cycle length, fuel burnup, and flux and power dis- tributions, as well as for the reactivity effects which are important in assessing the impact of LEU fuel on reactor shutdown margin. Presented at the International Meeting, Reduced-Enrichment Fuels Research and Test Reactors, Argonne National Laboratory, November 12-14, 1980. 450

Welcome message from author
This document is posted to help you gain knowledge. Please leave a comment to let me know what you think about it! Share it to your friends and learn new things together.
Transcript
XA04C1568
Core Physics Analysis in Support of theFNR HEU-LEU Demonstration Bxperiment
David C. Losey, Forrest B. Brown, William R. Martinand John C. Lee
Department of Nuclear EngineeringThe University of Michigan
Abstract
A core neutronics analysis has been undertaken to assess the impact
of low-enrichment fuel on the performance and utilization of the FNR As
part of this analytic effort a computer code system has been assembled
which will be of general use in analyzing research reactors with MTR-type
fuel. The code system has been extensively tested and verified in calcu-
lations for the present high enrichment core. The analysis presented here
compares the high-and-low enrichment fuels in batch and equilibrium core
configurations which model the actual FNR oerating conditions. The two
fuels are compared for cycle length, fuel burnup, and flux and power dis-
tributions, as well as for the reactivity effects which are important in
assessing the impact of LEU fuel on reactor shutdown margin.
Presented at the International Meeting, Reduced-Enrichment Fuels Research
and Test Reactors, Argonne National Laboratory, November 12-14, 1980.
450
1. INTRODUCTION
The University of Michigan Department of Nuclear Engineering and the
Michigan-memorial Phoenix Project are ngaged in a cooperative effort with
Argonne National Laboratory to test and analyze low enrichment fuel in the
Ford Nuclear Reactor. The effort is one element of the Reduced Enrichment
Research and Test Reactor CERTR) Program, which is itself one facet of
the overall U.S. policy seeking to minimize the risk of nuclear weapons
proliferation. A near-term objective of the RERTR program is-to demonstrate
and implementenrichment reductions from 9'3% to less than 20% or, where that
is impractical, to 45% within the next two years, based on currently quali-
fied fuel fabrication technology. A part of the effort to meet this objec-
tive is a whole-core demonstration with reduced enrichment fuel, which will
allow detailed testing and evaluation of the low enrichment fuel and an
assessment of its impact on research and test reactor performance and
utilization.
The Ford Nuclear Reactor (NRJ at The University of Michigan has been
selected for the low-power whole-core demonstration. ThIs demonstration
project includes development of methods to analyze MTR-type fuel and core
configurations, assisting in the design and analysis of the low enrichment
uranium (LEU) fuel, preparation of fuel procurement specifications, pre-
paring the requisite safety analysis report revision and license amendment
application, procuring the operating license amendment, planning and con-
ducting the experimental program, and analyzing the results of the experi-
ments, including comparisons with-analytical predictions.
451
The demonstration project at The University of Michigan has been divided
into several phases. The initial phase, which is essentially complete,
includes the work necessary to design and specify the fuel and obtain the
necessary license amendments. The LEU fuel has been designed and is pre-
sently being frabricated by two European vendors, NUKEM and CERCA. The LEU
fuel elements have a 167.3 gram fissile loading, which is 19.5% higher than
the present high enrichment uranium (EU) fuel. The initial phase of the demon-
stration project has also included anexperimental program to characterize
the current HEU core to provide a basis for comparison with the LEU core.
in addition, experimental techniques and equipment are being tested and
refined during this phase. A companion paper 1 presented at this conference
provides further discussion of the experimental portions of this project.
The major task of the project will be the actual whole-core testing of the
LEU fuel along with the necessary measurements and analysis of experimental
results and comparison with analytical predictions performed prior to core
loading. The present project schedule calls for actual loading of LEU fuel
elements in April, 1981. Further verification and iprovement of our calcu-
lational methods will also be performed along with the whole-core testing
program. Thus at the conclusion of the demonstration project, the impact
of LEU fuel on the FNR performance and utilization will be assessed experi-
mentally and compared with analytic predictions using methods developed
and implemented during this investigation.
This paper presents a detailed review of the analytical effort per-
fa d at The University of Michigan as a part of the demonstration project.
While many of our analytic results and methods have been summarized
452
2-6in earlier conference and project reports , a detailed summary of the
effort to date should be of use to the research reactor community. It is
hoped that this review will provide guidance to others planning similar
enrichment reductions and an appreciation of the practical considerations
in performing detailed reattor analyses which cannot be addressed in
generic studies. The following sections present a description of the cal-
culational methods used in the physics analysis, and comparisons of the
analysis and measurements used to validate the calculationalmodel for the
present high enrichment uranium fuel. W also present comparisons of the
physics analyses for the HEU and LU fuels, a summary of current efforts, and
our conclusions to date.
The NR currently uses highly enriched uranium MTR-type fuel.
To provide the means for a valid predictionof the impact of LEU fuel on
FNR operation, safety, and research usage, a generic neutronics model has
been developed. This model is based on standard, well-verified production
codes which are routinely -used in reactor analyses. These codes have been
modified only when necessary to accommodate the special characteristics
of small low-power research reactors with plate-type fuel. As such, the
methods of analysis should be applicable to a large number of research
reactors and accessible to many computing installations. The following
sections provide a brief description of the alculation model and its
verification.
II. CALCULATIONAL METHODS
A. Cputer Codes
All analyses were perf ormed with the standard, well-verif ied pro-
duction codes LEOPAIRD7, EPRI-HAMMER 8, 2DB9F ANISN 10 T0TRAN 11 I and VENTURE. 12
453
Brief descriptions of code capabilities are:
1) LEOPARD - a zero-dimensional unit-cell code using the MTTFT/
SOFOCATE scheme 54 fast and 172 thermal groups); has deple-
tion capability; cross-section library consists of an early
industrial data set.
2) EPRI-HAMMER - a one-dimensional integral transport
theory code using 54 fast and 30 thermal groups; cross-
section library constructed from ENDF/B-IV data.
3) 2D - a two-dimensional multi-group diffusion theory
code with depletion capability.
4) ANISN - a one-dimensional discrete ordinates transport
theory code.
5) TWOTRAN-II - a two-dimensional discrete ordinates
transport theory code.
6) VENTURE - a three-dimensional multi-group diffusion
theory code.
B. Code Modifications
The LEOPARD code originally performed a spectrum calculation
for lattices consisting of cylindrical fuel rods. The code was modified
to allow slab geometry and separate few-group edits for both lattice and
non-lattice regions. The principal modification was in the calculation
of thermal disadvantage factors by the ABH method for slab geometry. 13 A
summary of these modifications is given in Table .
454
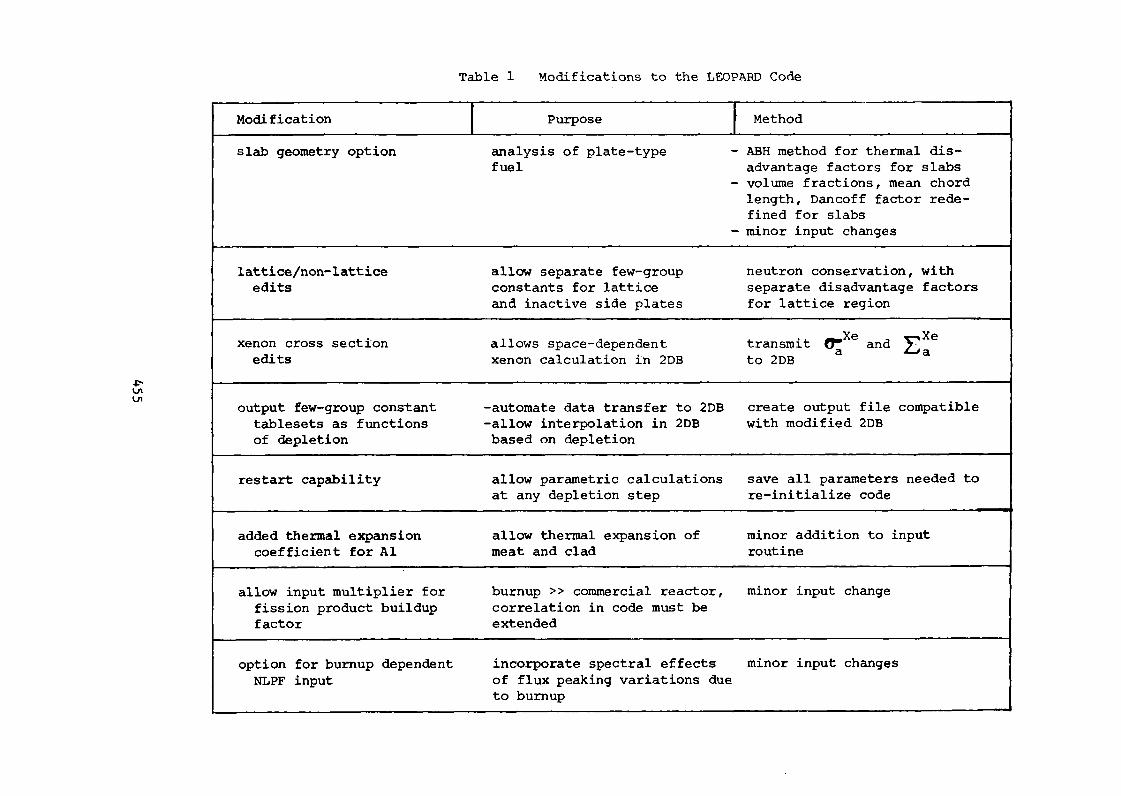
Table Modifications to the LEOPARD Code
Modification Purpose MethodT _slab geometry option analysis of plate-type - ABH method for thermal dis-
fuel advantage factors for slabs- volume fractions, mean chord
length, Dancoff factor rede-fined for slabs
- minor input changes
lattice/non-lattice allow separate few-group neutron conservation, withedits constants for lattice separate disadvantage factors
and inactive side plates for lattice region
xenon cross section allows space-dependent transmit eg Xe and Xeedits xenon calculation in 2DB to 2DB a Ea
.91LnLA
output few-group constant -automate data transfer to 2DB create output file compatibletablesets as functions -allow interpolation in 2DB with modified 2DBof depletion based on depletion
restart capability allow parametric calculations save all parameters needed toat any depletion step re-initialize code
added thermal expansion allow thermal expansion of minor addition to inputcoefficient for Al meat and clad routine
allow input multiplier for burnup >> commercial reactor, minor input changefission product buildup correlation in code must befactor extended
option for burnup dependent incorporate spectral effects minor input changesNLPF input of flux peaking variations due
to burnup
The modified LEOPARD code cmpares satisfactorily with the EPRI-
HAMMER code, an accuratel well-vexified code used in the analyst% of bench-
mark critical experiments. A typical comparison of k., and two-group para-.
meters in Table 2 shows that despite the many engineering approximations
in the LEOPARD code, it cmpares uite well with the more accurate HAMMER
code. Differences in few-group constants are ue primarily to differences
in the cross-section libraries - HAMMER -uses ENDF/B-iv ata while LEOPARD
uses an early industrial data set.
The 2DB code has been modified to allow a macroscopic depletion capa-
bility via interpolation of macroscopic cross sections as a function of
depletion. In addition, the isotopic balance equations for xenon and iodine
have been included to allow the correct xenon levels within the core as a
function of position and time (and macroscopic absorption cross sections are
appropriately modified). other modifications to 2DB have been aimed at
automating data handling, improving fuel shuffling and edit capabilities, and
greatly decreasing the computer run-time costs. These modifications are
summarized in Table 3.
C. Basic Calculation Method
The LEOPARD and 2DB codes were used for routine calculations of
core reactivity, depletion effects, and power and flux distributions. Special
methods for control rods and core leakage flux are described in subsequent
sections. For both HEU and the proposed LEU fuel, the following scheme was
used;
456
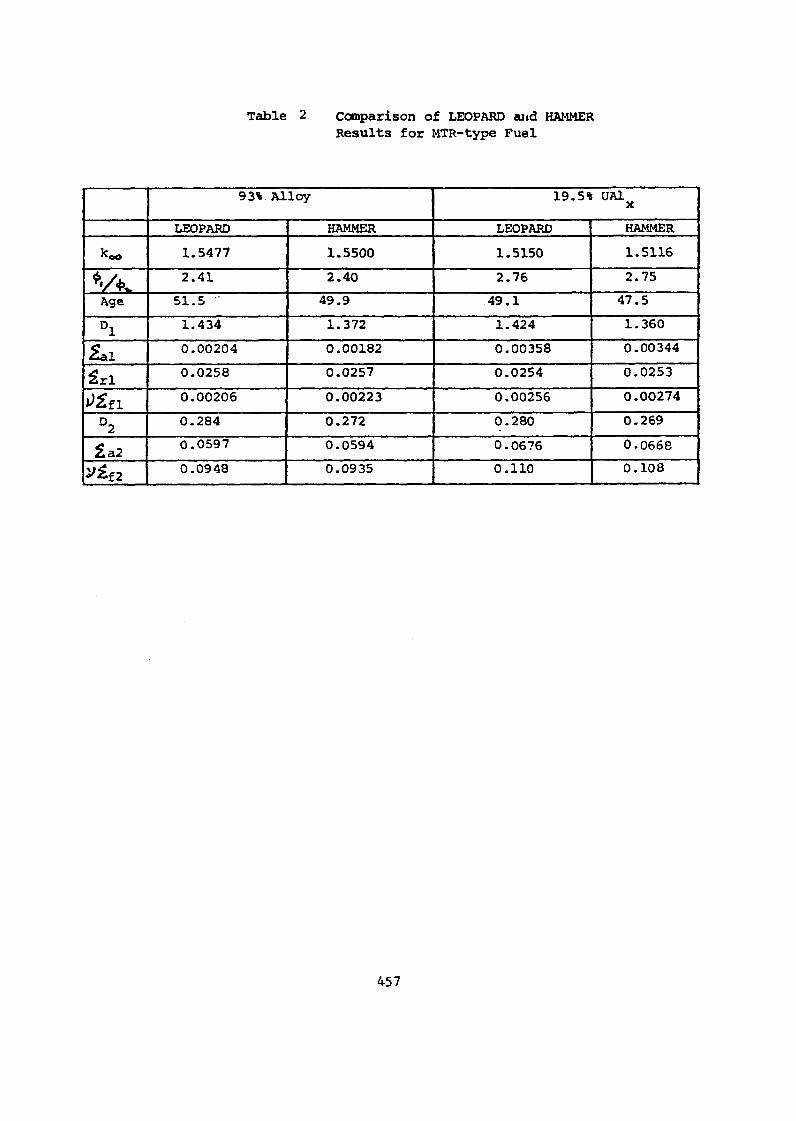
Table 2 Comparison of LEOPARD wd HAMMER
Results for MTR-type Fuel
93% Allay 19.5% UA1x
LEOPARD HAMMER LEOPARD HAMMER
koo 1.5477 1.5500 1.5150 1.5116
2.41 2.40 2.76 2.75
Age 51.5 49.9 .49.1 47.5
D1 1.434 1.372 1.424 1.360
Ll 0.00204 0.00182 0.00358 0.00344
:Ll 0.0258 0.0257 0.0254 0.0253
dEfl 0.00206 0.00223 0.00256 0.00274
D 0.284 0.272 0.280 0.2692
Ia2 0.0597 0.0594 0.0676 0.0666
;Iif-2 0.0948 0.0935 0.110 0.108
457
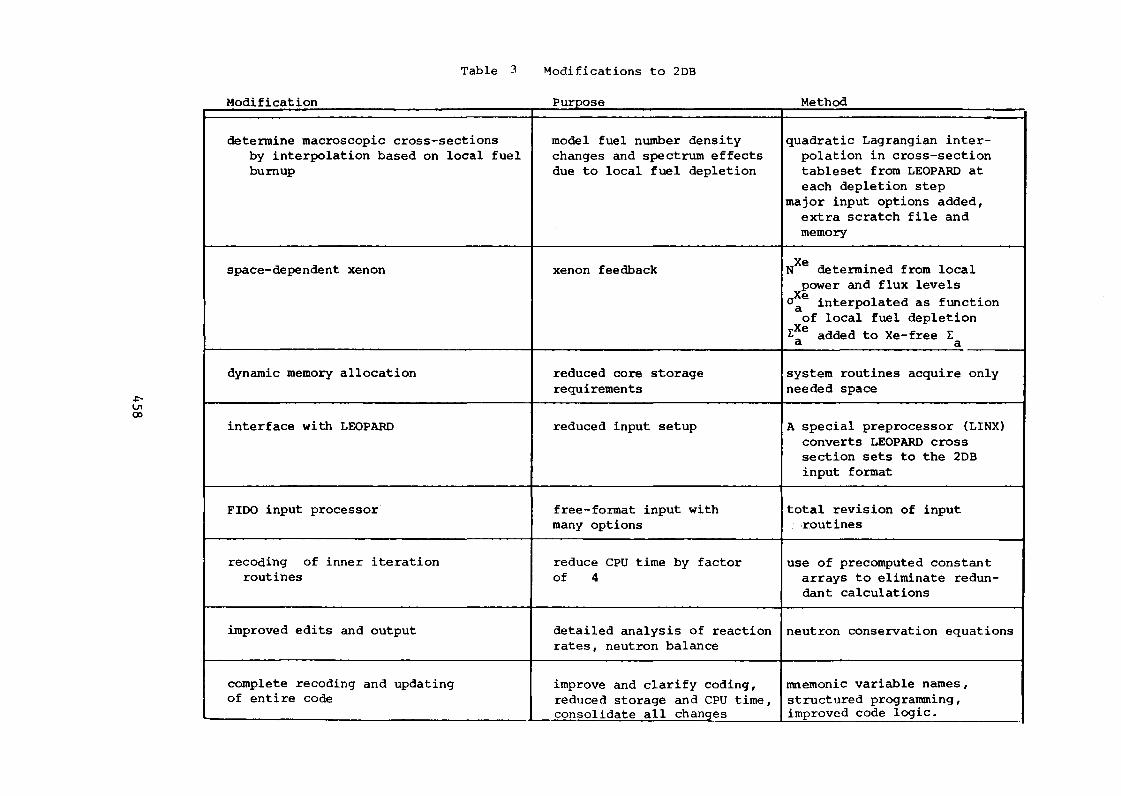
Table 3 Modifications to 2DB
modification Purpose Method
determine macroscopic cross-sections model fuel number density quadratic Lagrangian inter-
by interpolation based on local fuel changes and spectrum effects polation in cross-section
burnup due to local fuel depletion tableset from LEOPARD at
each depletion step
major input options added,
extra scratch file and
memory
space-dependent xenon xenon feedback NXe determined from local
power and flux levels
axe interpolated as functionaof local fuel depletion
Xe added to Xe-free Ea a
dynamic memory allocation reduced core storage system routines acquire only
requirements needed space
OD
interface with LEOPARD reduced input setup A special preprocessor (LINX)
converts LEOPARD cross
section sets to the 2DB
input format
FIDO input processor free-format input with total revision of input
many options
recoding of inner iteration reduce CPU time by factor use of precomputed constant
routines of 4 arrays to eliminate redun-
dant calculations
improved edits and output detailed analysis of reaction neutron conservation equations
rates, neutron balance
complete recoding and updating improve and clarify coding, mnemonic variable names,of entire code reduced storage and CPU time, structured programming,
L consolidate all changes improved code logic.
1) The LEOPARD code was used to generate few-group cross sections.
For most applications, two energy groups (fast and thermal) were
used, although four energy groups were chosen for several detailed
calculations.
The geometry chosen was a unit cell in slab geometry con-
sisting of a lattice region and a non-lattice or extra region.
The lattice region was composed of fuel meat, clad and water
channel. For regular assemblies, the extra region consiste of
the side plates, non-active portions of fuel plates-, and inter-
assembly water gaps, which are homogenized on a volume basis.
For special fuel assemblies, the central water hole was also
included in te extra region. Few-group macroscopic cross-section
sets were generated as functions.of depletion forthe lattice and
non-lattice regions and the total assembly.
For the water reflector and heavy water tank, the extra
region was chosen as H20 or D20 with a 25% H 20 content and a
volume fraction arbitrarily set equal to that of the lattice
region. The extra region few-group cross sections obtained in
this manner were used for the reflector and heavy water tank in
the subsequent global calculation.
2) Global diffusion theory calculations were performed with the 2DB
code. Three spatial mesh descriptions were used in x-y geometry.
A homogeneous description, with a x2 mesh per assembly, was used
for survey calculations, equilibrium core studies, and cycle
length studies. A discrete re-presentation, using a x6mesh per
459
assembly with the lattice and non-lattice portions of an
assembly explicitly represented, was used for detailed
analysis of power and flux distributions, temperature
coefficient, and control rod reactivity worth. A discrete
representation with a 2xl2 mesh per assembly was used for
verifying the adequacy of the 2x2 and x6 representations,
and for comparison with the measured flux distributions.
The various mesh structures are presented in Figure
Depletion was accounted for on the assembly level
by interpolating macroscopic cross sections as a function
of depletion (MWD/MT) for each assembly. The fuel shuffling
capability in the 2DB code allowed actual FNR operation to be
simulated. The axial buckling term for the 2DB code used to
approximate transverse leakage was based on a buckling and
zonal buckling modifiers obtained from three-dimensional
VENTURE calculations.
D. Control Rod Worth Calculations
FNR control (shim) rods are boron stainless steel containing
1.5 w/o natural boron. They are essentially black to thermal neutrons and
cause a drastic thermal flux depression when inserted. The presence of
such strong localized absorbers necessitates the use of transport theory
codes to adequately describe the large flux gradients. However, in a small
high leakage core like the FNR, control rod effects are not strictly local;
therefore, whole core calculations are needed, but are prohibitively expensive
for transport theory codes. To accurately treat both local and global
460

FNR Fuel Assemblies
SPECIAL PEGUIAR
2DB mesh Per Assembly
I oilI oil
W 6x6 12x12HUIDOEOUS NSCROE Mscrf-7
Figure I 2DB Mesh Description
461
effects, transport theory codes were used for assembly level calculations
to develop effective diffusion theory constants for global calculations.
Few-group constants for the control rod and surrounding water were
obtained from the EPRI-HAMMER code for a cylindricized special assembly.
Due to the strong spectral/spatial coupling in the rod it was necessary to
obtain few-group cross sections for three control rod regions - a surface
layer .1 cm thick, a second layer 3 cm thick, and the central region.
Since few thermal neutrons reach the central region, the control rod
perimeter, rather than volume, was preserved in the geometric representation.
Few-group constants for the special element lattice and side regions were
obtained from the EPRI-HAMMER calculations for one half of a special ele-
ment in slab geometry.
To accurately model the local effects of an inserted rod, the two-
dimensional transport code TWOTRAN was used in fine-mesh calculations for a
special assembly surrounded on all sides by one half of a regular assembly.
Three regions of the rod and the surrounding water were explicitly repre-
sented, while the surrounding lattice regions were homogenized.
To develop effective few-group diffusion theory constants for use in
global 2DB calculations, the 2DB code was used for the same geometry as in
TWOTRAN calculations, except that the control rod and surrounding water were
homogenized. Both fast and thermal absorption cross sections were varied
until the 2DB calculation yielded the same relative absorption in the control
region as the TWOTRAN result in each group. The resulting few-group con-
stants for the control region were then used in global 2DB calculations.
Although the flux distribution within the control region differed from the
462
transport theory results, we believe the relative absorption in the control
region and the flux in the surrounding fuel is accurately predicted in this
scheme.
Control rod worth was then determined by comparing global 2DB calcula-
tions for the 6x6 mesh/assembly description with and without control rod
inserted.
E. Calculation Methods for Temperature Coefficient of Reactivity and
Xenon Reactivity Worth
Calculationsof the temperature coefficient of reactivity and of
reactivity worth of xenon poisoning were performed with global 2DB calcula-
tions with a x6 mesh/assembly description. The two-group cross-sections
for these 2DB cases were obtained from unit-cell calculations with the
LEOPARD or the EPRI-HAMMER code, essentially following the basic scheme
outlined in Section II.C. To facilitate the calculation of the various
coefficients, several modifications have been made to 2DE and LOPARD A
microscopic xenon calculation has been added to 2DB which allows the calcu-
lation of spatially dependent xenon concentrations and corresponding adjust-
ment of the local macroscopic cross sections in the 2DB calculation.
The calculation of the isothermal coefficient of reactivity does not
require any additional modifications because cross sections are simply
generated at a different temperature input to LEOPARD. However, the power
defect of reactivity represents the total of all reactivity effects induced
by taking the reactor from a cold zero-power condition to normal operating
conditions. Due to the spatially nonuniform temperature and density changes
463
involved, the power defect cannot be predictedsolely on the basis of an
isothermal temperature oefficient. Therefore, additional changes were
necessary. In particular a restart capability has been added to LEOPARD
to allow the recalculation of the spectrum at any depletion step
with one or more variables changed from the base depletion calculation.
LEOPARD then calculates the resultant deviation AE in all cross sections
divided by the variable change A and outputs the "derivative" cross section
dE ) as a function of depletion. Th-e 2DB code then calculates-the localdE
change in the variable, e.g., the change in the moderator temperature from
the nominal temperature, and multiplies the interpolated derivative cross
section by this change and adds the increment to the base macroscopic cross
section, which is itself interpolated as a function of depletion and fuel
type. Extensive changes to 2DB were not needed because existing mixing
routines in 2DB were utilized. The d' cross section is treated as a micro-dE
scopic cross section, which is multiplied by the "density" AC and added to
the base macroscopic cross section E = IE)A�.0 0 (I
III. VERIFICATION OF ANALYTICAL METHODS
A. Spectrum Calculations
The two cross section generation codes that have been utilized,
LEOPARD and HAMMER, are well-verified codes and further effort to verify them
was not warranted except for the application of LEOPARD to slab geometry.
Since LEOPARD is a production code for pin cell geometry it was necessary
to compare our modified version with a code capable of treating slab geometry.
In particular we compared the slab version of LEOPARD with the HAMMER code for
both LEU and HEU MTR-type fuel. Table 2 contains a comparison of the various
464
neutronics parameters and macroscopic cross sections for a -unit cell
calculation. In addition, the LEOPARD code has been verified against
several critical assemblies, including the TRX rodded O2 and natural
14uranium slab lattices. The agreement has been reasonable, and has further
increased our confidence in the use of LEOPARD for routine calculations
for MTR-type fuel configurations.
B. Global Calculations-
To verify the accuracy of the analytic methods used in Pre-
dicting core physics parameters-for the HEU and LEU fuels the calculated
results have been compared with experimental data from the Bulk Shielding
Reactor (BSR J5 and for various FNR core configurations. The comparisons
for several FNR configurations sinmarizea in Table 4 indicates
the adequacy of the methods for calculating core criticality, power and
thermal flux distributions, and control rod worth. Results of preliminary
calculations simulating the power defect of reactivity dataare also presented
in this section.
The results presented in Table 4 indicate that core criticality is
predicted accurately in our calculations. These calculations have revealed
that considerable attention must be given to an accurate representation
of the fuel geometry and of trace isotopes, such as U-236. Leakage in the
axial direction in our two-dimensional y) 2DB calculations was represented
through the use of zone-dependent axial buckling obtained from three-dimensional
VENTURE calculations. The resultant 2_DB calculations are quite sensitive
to the input buckling distribution and care must be taken when determining
465
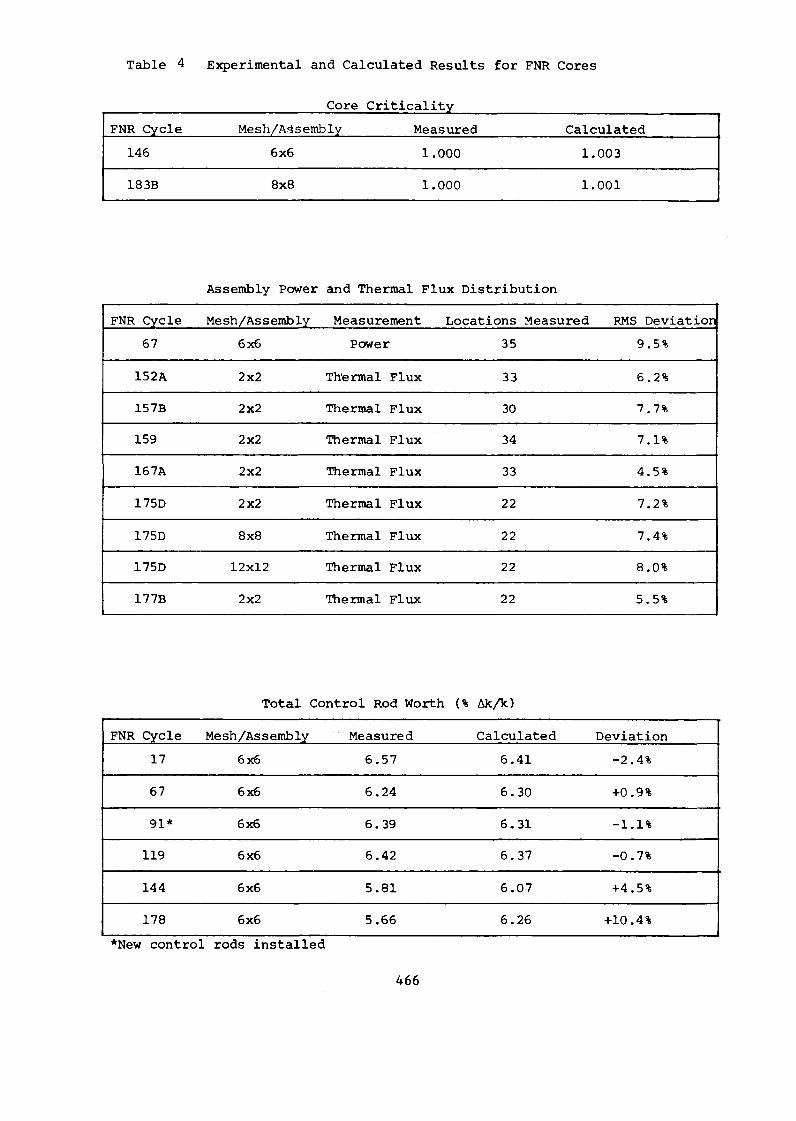
Table 4 Experimental and Calculated Results for FNR Cores
Core Criticality
FNR Cycle Mesh/Msembly Measured Calculated
146 6x6 1.000 1.003
183B 8x8 1.000 1.001
Assembly Pwer and Thermal Flux Distribution
FNR Cycle Mesh/Assembly Measurement Locations Measured RMS Deviation
67 6x6 Power 35 9.5%
152A 2x2 Thermal Flux 33 6.2%
157B 2x2 Thermal Flux 30 7.7%
159 2x2 Thermal Flux 34 7.1%
167A 2x2 Thermal Flux 33 4.5%
175D 2x2 Thermal Flux 22 7.2%
175D 8xB Thermal Flux 22 7.4%
175D 12xl2 Thermal Flux 22 8.0%
177B 2x2 The rmal Flux 22 5.5%
Total Control Rod Worth (% k/k)
FNR Cycle Mesh/Assembly Measured Calculated Deviation
17 6x6 6.57 6.41 -2.4%
67 6x6 6.24 6.30 +0.9%
91* 6x6 6.39 6.31 -1.1%
119 6x6 6.42 6.37 -0.7%
144 6x6 5.81 6.07 +4.5%
178 6x6 5.66 6.26 +10.4%
*New control rods installed
466
the transverse buckling for 2DB. The comparison of the clculated flux and
power distributions with the FNR data given in Table 4 indicates reasonable
agreement with MS deviations in the range 4- 10%. The comparison is based
on the thermal flux data obtained with self-powered rhodium detectors at the
core midplane and center of regular fuel elements. For Cycle 67, the power
distribution was obtained from the measured temperature rise across each
fuel assembly.
Control rod reactivity worth calculations were performed for six
different FNR configurations. The method for obtaining the rod worths
was discussed in Sec. II.D, except that the fuel depletion in the special
fuel elements was also modeled. Accordingly, isotopic number densities
for the lattice regions were taken from a LEOPARD depletion calculation
for a special element at the corresponding burnup points. These number
densities were then used in place of BOL number densities, and the sequence
of HAMMER calculations described in Sec. II.D was reneated. Full-core
6x6 2DB calculations were then performed with all rods out and then
separate runs were made with each of the three rods inserted. The calculated
and measured rod worths are compared in Table 4.
The measured rod worths were determined from period measurements for rod
positions in the upper half of the core. Considerable uncertainty exists in
the measured worths due to the conversion from half rod to full rod worth
16and due to the use of an assumed effective delayed neutron fraction of 755%.
The calculated worths are in good agreement, although the increasing differences
suggest that neglect of boron depletion over many years of operation may be a
source of error. Despite these uncertainties, the basic approach for computing
control rod worth appears valid for comparing rod worths in HEU and LEU cores.
467
A preliminary calculation of the FNR power defect has been performed
using the methods described above. However, the 2DB calculationbeing a two
dimensional calculation, cannot explicitly account for the effect of axial
variations in fuel and moderator temperatures. Therefore, as a first attempt
we have neglected axial variations and have represented radial temperature
profiles by assuming an average temperature for each fuel assembly, which
was determined on the basis of a DB calculation (to determine relative power
factors) and measured FNR core temperature drops and flow rates. With this
,Lkmodel, the power defect was calculated to be .16% k , which may be compared
with the experimental value of -. 21% Ak . Ile are currently attempting to improvek
our model, by including a typical axial power distribution into the analysis
by weighting the calculated temperature changes in an appropriate fashion.
IV DESCRIPTION OF BATCH AND EQUILIBRIUM CORE MODELS
To provide meaningful and comprehensive comparisions of HEU and pro-
posed LEU fuels, it is necessary to model both the intrinsic fuel properties
and the FNR operating conditions. For this purpose, two core configurations
were analyzed for both fuels. The first configuration is a batch core con-
sisting of fresh fuel assemblies, while the second configuration is an equili-
brium core. The batch core configuration allows a comparison of undepleted HEU
and LEU fuels, while the equilibrium core allows comparison of depletion
characteristics and shutdown margin for conditions typical of FNR operation.
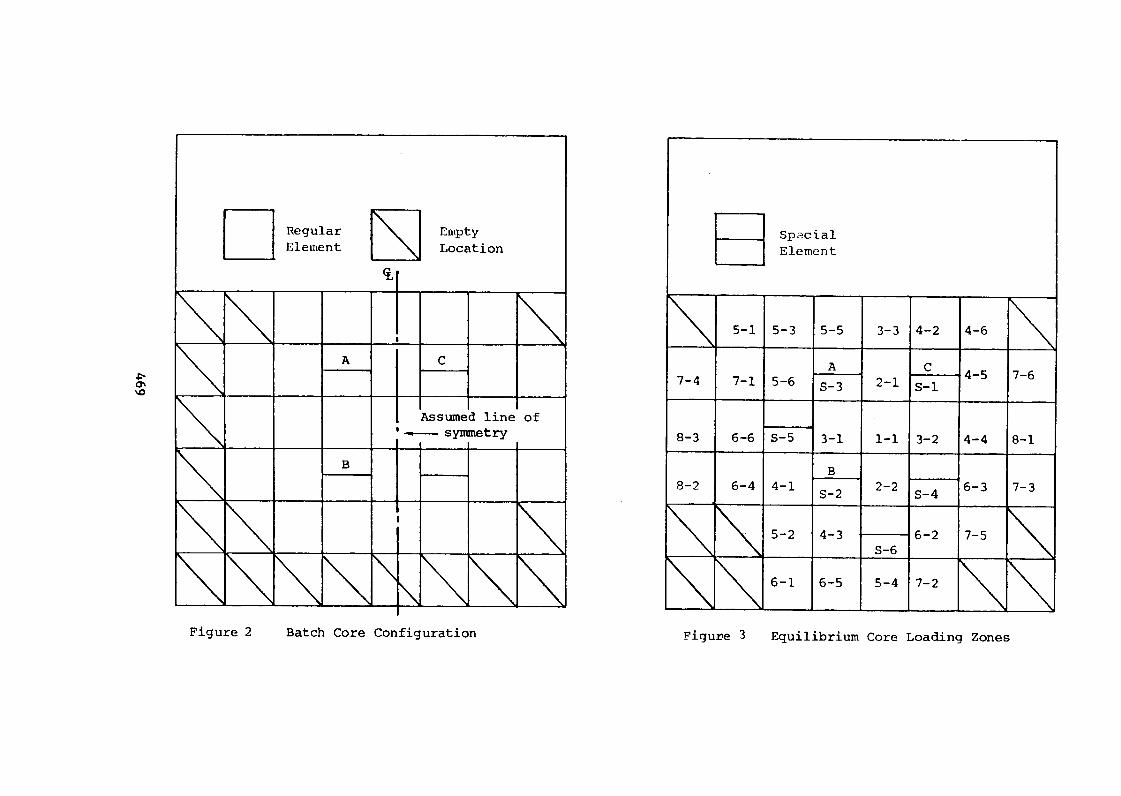
The atch core model illustrated in Figure 2 has 31 fresh fuel assemblies,
with four special assemblies at control rod locations. The configuration is
symmetric about the north/south midplane and was analyzed us-ing half-core
calculations.
468
Regular Empty Spacial
Element Location Element
(L
I - \\5-1 5-3 5-5 3-3 42 4-6
A A C 4-5 7-6
7-4 7-1 5-6 2- S-1S-3
Assumed line of
symmetry 8-3 6-6 S-5 3-1 1-1 3-2 4-4 8-1
B B
8-2 6-4 4-1 2-2 S-4 6-3 7-3
5-2 4-3 6-2 7-5
S-6
6-1 6-5 5-4 7-2
Figure 2 Batch Core Configuration vigure 3 Equilibrium Core Loading Zones
Although the FNR core configuration and fuel shuffling pattern are,
in practice, determined by operational requirements-, an equilibrium core
model was developed to allow a meaningful comparison of operating
characteristics for the HEU and the proposed LU cores. The equilibrium
core shown in Figure 3 uses an in/out shuffling scheme with fresh
elements loaded at the core center and moved outward to the core edge.
This scheme maximizes the reactivity worth at the core center, thus maxi-
mizing the control rod worth to achieve the required 3 AkA shutdown
margin. To compare different fuel typesin the equilibrium corethe end
of cycle (EOC) keff was preserved between different cases. Preserving
EOC keff provides the most realistic comparison of different fuel
types, because it attempts to model actual NR operation where
a core is depleted until the shim rods are nearly fully withdrawn.
Along with preserving the EOC k eff the core size is also maintained
constant. These two criteria essentially etermine the maximum fuel
burnup for a given fuel design. To achieve any higher burnup would
require that the core size be increased in order to maintain criticality.
once the maximum fuel burnup is determined by preserving k eff with a fixed
core size, calculations must be performed to verify that the core confi-
guration has the required 30% AA shutdown margin. Although the fuel
burnup and power distribution are roughly constant during each equili-
brium cycle, our equilibrium core configuration is chosen in such a way
that the core configuration repeats every sixth cycle.
The shuffling pattern in the equilibrium cycles divides the 33 regular
fuel element locations into eight loading zones as shown in Figure 3
Each regular element loading zone corresponds to core locations having
470
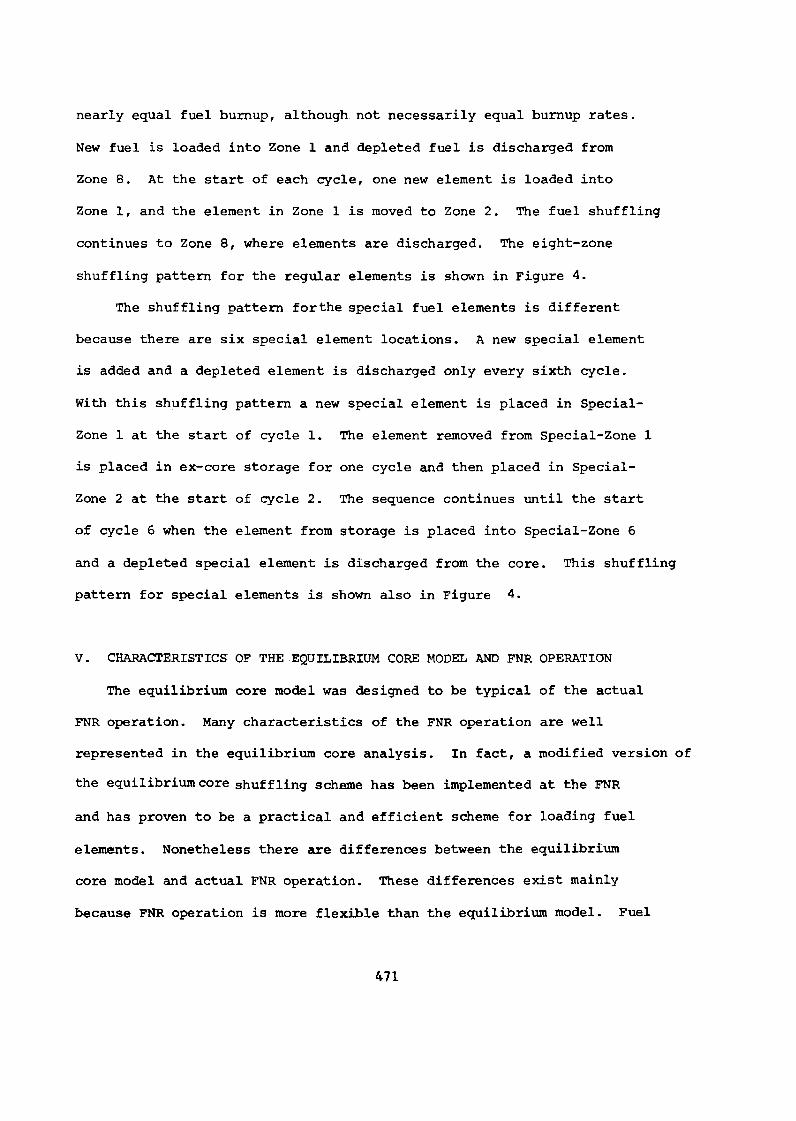
nearly equal fuel burnup, although not necessarily equal burnup rates.
New fuel is loaded into Zone and depleted fuel is discharged from
Zone B. At the start of each cycle, one new element is loaded into
Zone 1, and the element in Zone is moved to Zone 2 The fuel shuffling
continues to Zone 8, where elements are discharged. The eight-zone
shuffling pattern for the regular elements is shown in Figure 4.
The shuffling pattern forthe special fuel elements is different
because there are six special element locations. A new special element
is added and a depleted element is discharged only every sixth cycle.
With this shuffling pattern a new special element is placed in Special-
Zone at the start of cycle 1. The element removed from Special-Zone
is placed in ex-core storage for one cycle and then placed in Special-
Zone 2 at the start of cycle 2 The sequence continues until the start
of cycle 6 when the element from storage is placed into Special-Zone 6
and a depleted special element is discharged from the core. This shuffling
pattern for special elements is shown also in Figure 4.
V. CHARACTERISTICS OF THE EQUILIBRIUM CORE MODEL AND FNR OPERATION
The equilibrium core model was designed to be typical of the actual
FNR operation. Many characteristics of the FNR operation are well
represented in the equilibrium core analysis. In fact, a modified version of
the equilibrium core shuf fling scheme has been implemented at the FNR
and has proven to be a practical and efficient scheme for loading fuel
elemonts. Nonetheless there are differences between the equilibrium
core model and actual FNR operation. These differences exist mainly
because FNR operation is more flexible than the equilibrium model. Fuel
471
Figure 4 Equilibrium Core Shuffling Scheme
Regular Fuel Elements
Core Loading ZoneCycle 1 2 3 4 5 6 7 a
New Fuel
1 1-1 2-1 - 31 4-1 5-1 - 61 - 71 8-1
2 1-1 2-2 - 32 4-2 5-2 - 62 - 7-2 - 82
3 1-1 -2-1 3-3 4-3 5-3 63 - 7-3 - 83
4 1-1 2-2 3-1 4-4 5-4 - 64 - 7-4 8-1
5 1-1 2-1 -3-2 4-5 5-5 - 65 - 7-5 8-2
6 1-1 2-2 3-3 4-6 5-6 - 66 7-6 8-3
Discharge
Special Fuel Elements
Cycle Storage Core Loading StorageZone
1 New fuel S-1 x1
2 x1 4. S-2 x
3 x2 4- S-3 x3
4 x3 S-4 x4
5 x4 S-5 x5
6 x5 S-6 Discharge
472
elements need not be shuffled in any fixed pattern and the core confi-
guration does not repeat periodically. This section describes charac-
teristics of the equilibrium model and actual FNR core configurations,
and also explains important differences between the equilibrium analysis
and actual operation.
To verify the practicability of the equilibrium model, Table
presents a comparison of the calculated equilibrium core parameters and
actual core parameters basedon FNR operation. The comparisons indicate
that the proposed equilibrium cycle represents a reasonably practical
configuration for comparing the HFU and LEU fuel designs. on the average
fuel elements are shuffled just as often in both cores. The calculated
control rod worths for the equilibrium core compare well with the rod
worths measured inthe FNR.
The cycle length comparisons for the equilibrium and operating cores
in Table point out a difference between analytic models and actual
operations. In the equilibrium core modelcycle length is determined
by the discharge fuel burnup averaged over the regular and special fuel
elements. In contrast, the FNR operating cycle length is the time interval
between shim rod calibrationswhich are required by technical specifica-
tions whenever more than three fuel elements are shuffled. in calculations
comparing the HEU and LEU fuels the parameter most indicative of the time
between control rod calibrations or operating cycle length is the burnup
reactivity change rate, rather thanthe equilibrium core cycle length. With
a constraint on the allowable core excess reactivity, the length of
time the core can be maintained critical without shuffling more than
three fuel elements, thereby requiring rod recalibration, is determined
473

Table Comparisoniof Equilibrium Core and Actual FNR
Parameters.
rDperating HEUExperience* Equilibrium
operating cycle length (days) 17.6
Equilibrium cycle length (days) 11.0
Average number of elementshuffles/day .82 .80
Average discharge burnup(MWD/element)
Regular 19.4 19.2
Special 19.5 16.9
Calculated keff
Range 1.022-1.026 1.020-1.032
Average 1.024 1.025
Shim rod worth (%Ak/k)
Rod A 2.20 2.08
Rod 2.21 2.24
Rod C 2.00 2.17
Total 6.41 6.49
*Averaged from Oct. 78 to Nov. 79
474
by the fuel burnup reactivity change rate.
VI. CORE NEUTRONTC ANALYSES FOR THE HEU ALIM LEU FUELED CORES
The important neutronics parameters analyzed for the HEU and LEU
fueled cores are the temperature coefficients of reactivity, xenon
reactivity, control rod worth, discharge burnup, and the shutdown
margin. Comparisons of these neutronic parameters for the batch core
and equilibrium core configurations should provide a basis for assessing
the impact of LEU fuel on FNR performance and utilization. Before
discussing the results of these comparisons, the actual HEU and LEU
fuel configurations will be iscussed.
A. LEU and HEU Fuel Description
The selectionofthe LEU fuel esign was based on extensive
generic studies�and survey calculations carried out by Argonne National
17-19Laboratory The University of Michigan, and others. In addition,
constraints were imposed on the final esign as a result of the specific
PNR system configuration, FNR operational considerations, and the need to
obtain approval from the NRC of an amendment to the current NR operating
license. These constraints, which are unique to the FNR, had to be
factored into the final EU design.
Based on the above considerations, the LEU fuel design selected for
the FNR was identical in all external dimensions to the HEU fuel as shown
in Table 6 The conversion to EIJ fuel results in an increase in U-238
loading by a factor of nearly and an increased U-235 loading to overcome the
increased capture in U-238. To ccommodate the additional uranium loading, the
fuel meat thickness as increased 50% with a corresponding reduction in the
475
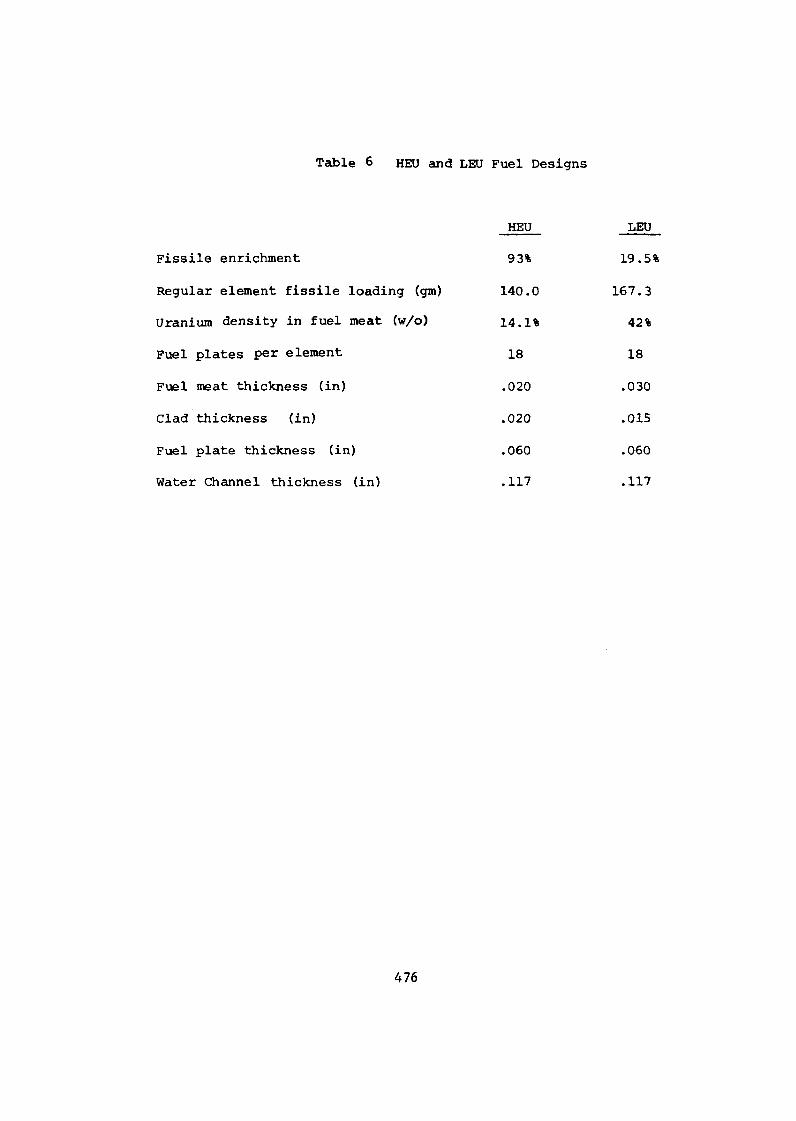
Table 6 HEU and LEU Fuel Designs
HEU LEU_
Fissile enrichment 93% 19.5%
Regular element fissile loading (gm) 140.0 167.3
Uranium density in fuel meat (w/o) 14.1% 42%
Fuel plates per element 18 18
Fuel meat thickness (in) .020 .030
Clad thickness (in) .020 .015
Fuel plate thickness (in) .060 .060
Water Channel thickness (in) .117 .117
476
cladding thickness, hence keeping a constant fuel plate thickness. The
FNR licensing considerations dictated the use of fuel with at most 42.0 w/o
uranium loading, which is considered to be an acceptable fuel design based
on experience and testing to date. Using 19.5% enriched uranium, the
above LEU design has 167.3 g of U-235 per fuel element, and results in
the same excess reactivity for the batch core as the HU fuel design,
as desired.
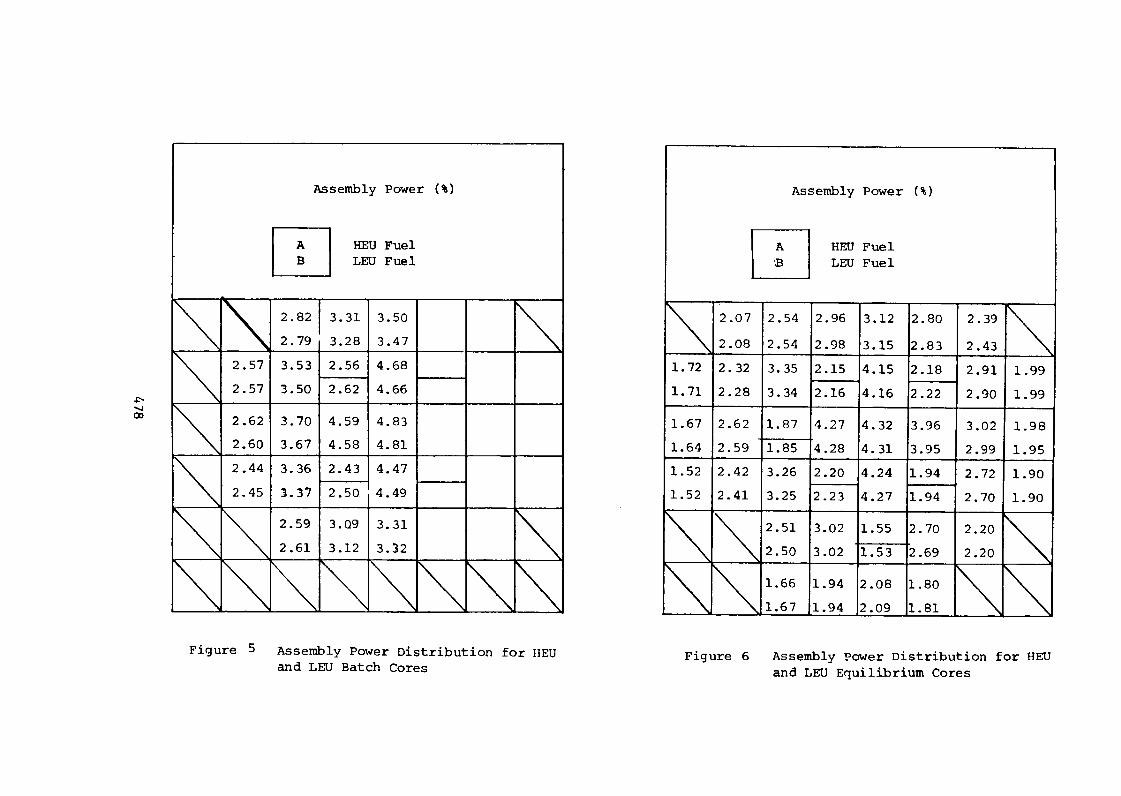
B. Flux and Power Distributions
Calculated power distributions for both HEU and LEU cores are
compared in Figures and 6 for batch cores and equilibrium cores,
respectively. Examination of these figures reveals only minor changes
between LEU and HEU cores. The largest change in assembly power, a 3%
relative increase, occurs ior special element locations. Additionally,
there is a small shift in the power distribution away from the heavy
water tank and toward a slightly improved overall symmetry about the
center. There is no evidence of changes which would required detailed
thermal-hyd.raulic analysis; in fact, the ratio of peak to average
assembly poweri��slightly reduced.
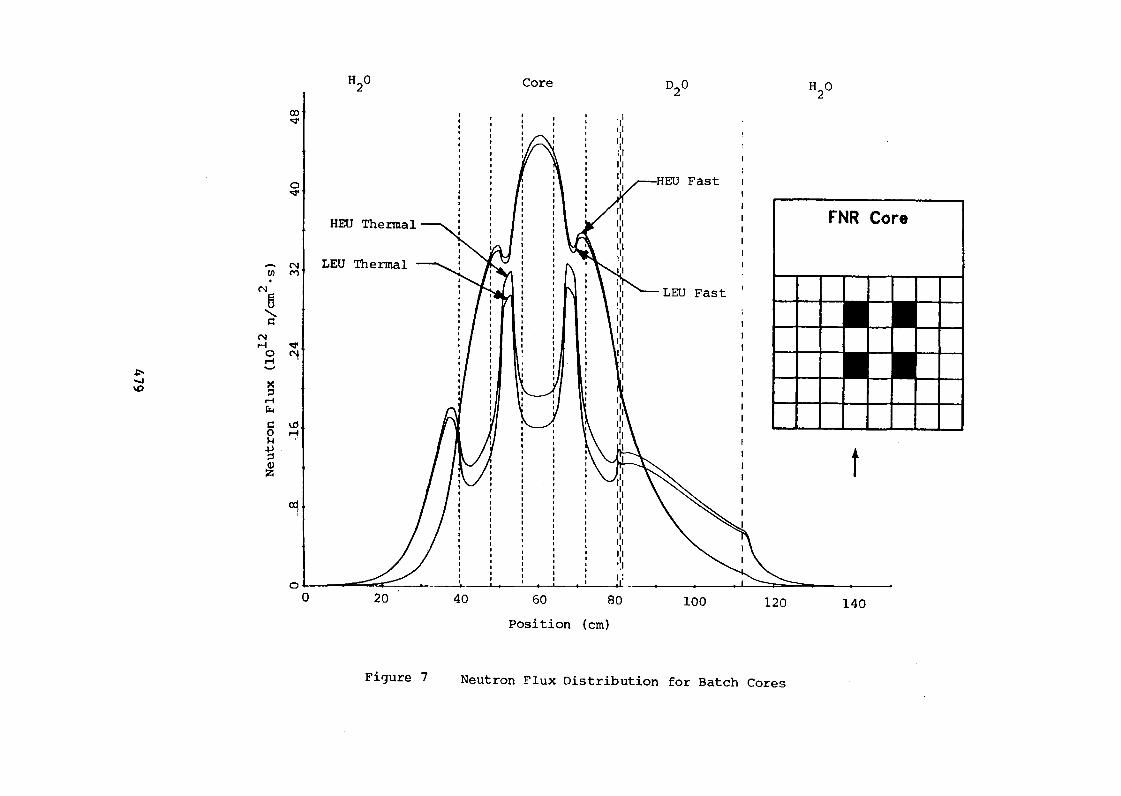
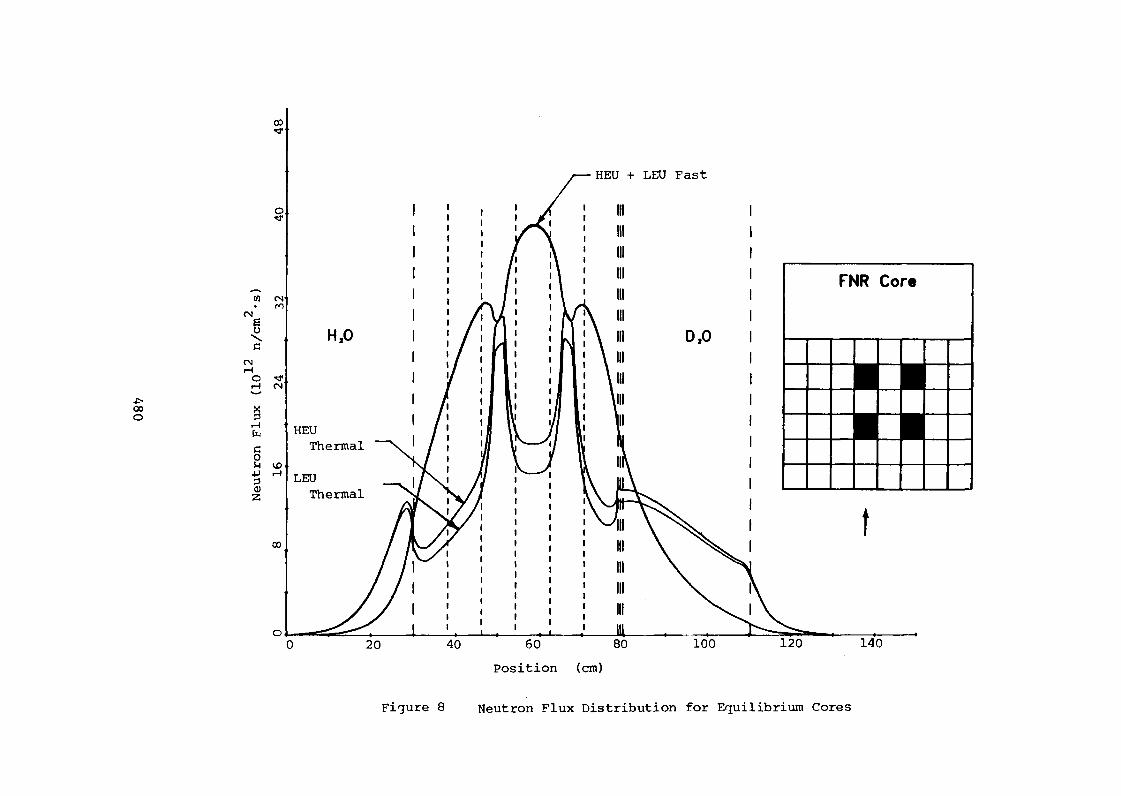
The calculated fast and thermal flux distributions are cpared in
Figures 7 and 8 for the batch and equilibrium cores, respectively.
The figures indicate that the fast flux distribution is perturbed very
little with LEU fuel. This is to be expected because the fast neutron
production and removal rates are nearly equal for the two cores. The
fast neutron productionis approximately constant because the core power
477
Assembly Power Assembly Power
A HEU uel HEU Fuel
B LEIJ Fuel LEU Fuel
2.82 3.31 3.50 2.07 2.54 2.96 3.12 2.80 2.39
2.79 3.28 3.47 2.08 2.54 2.98 3.15 2.83 2.43
2.57 3.53 2.56 4.68 1.72 2.32 3.35 2.15 4.15 2.18 2.91 1.99
2.57 3.50 4.66 1.71 2.28 3.34 4.16 2.90 1.99
co 2.62 3.70 4.59 4.83 1.67 2.62 1.87 4.27 4.32 3.96 3.02 1.98
2.60 3.67 4.58 4.81 1.64 2.59 1.85 4.28 4.31 3.95 2.99 1.95
2.44 3.36 2.43 4.47 1.52 2.42 3.26 2.20 4.24 1.94 2.72 1.90
2.45 3.37 4.49 1.52 2.41 3.25 2.23 4.27 1.94 2.70 1.90
2.51 3.02 1.55 2.70 2.202.59 3.Q9 3.31
2.61 3.12 3.12 2.50 3.02 1.53 2.69 2.20
1.66 1.94 2.08 1.80
1.67 2.09 1.81
Figure Assembly Power Distribution for HEU Figure 6 Assembly Power Distribution for HEUand LEU Batch Cores and LEU Equilibrium Cores
H20 Core D 0 H 0
OD
0 I EU Fast Iv
HEU Thermal FNR Core
N LEU Thermal
CI4 LEU Fast
CIq0
44
ITT
0 r-4
4.3
0 20 40 60 80 100 120 140
Position (cm)
Figure 7 Neutron Flux Distribution for Batch Cores
coNT
HEU + LEU Fast
FNR Core
H.0 D.0 I
-40
4-OD
:J
HEU
Thermal
0$4 %D
4j -4LEU
z Thermal
co
00 20 40 60 80 100 1�0 140
Position (cm)
Figure Neutron Flux Distribution for Equilibrium Cores
is held constant at 2 MW, while the fast neutron removal rate is nearly
constant due to the similar moderating properties of the two cores. That
is, the water channel dimensions are the same.
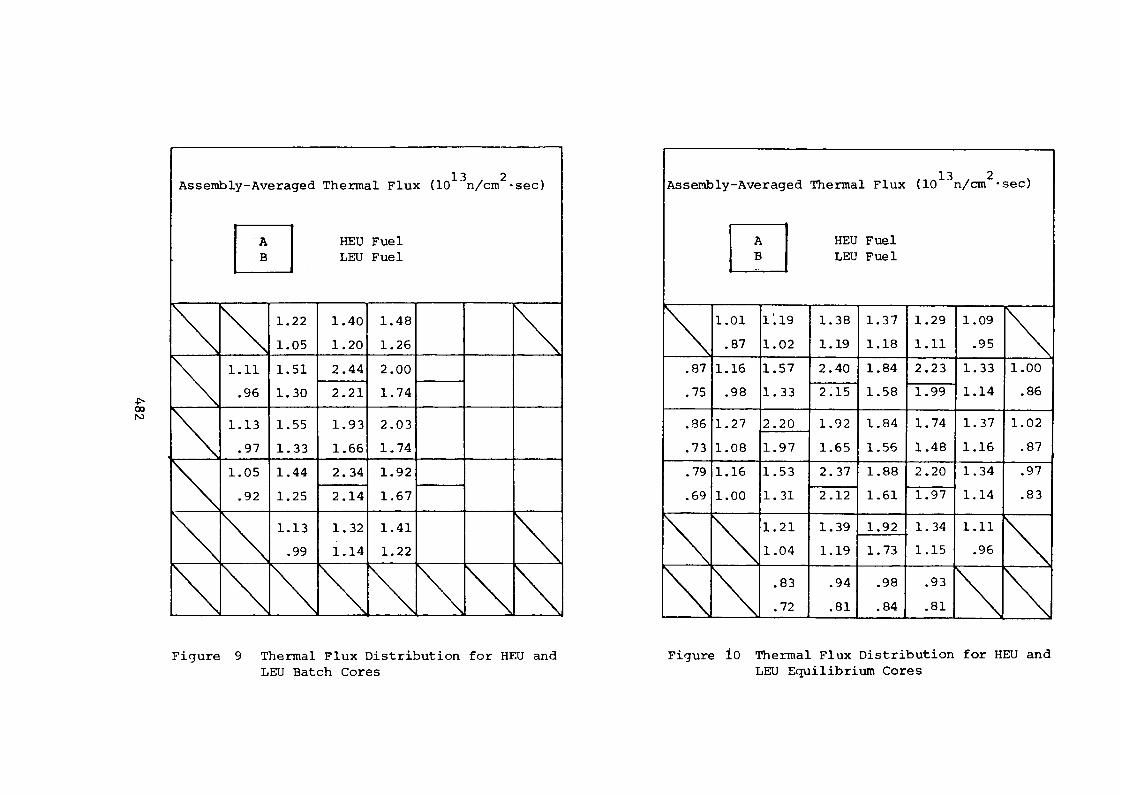
However, one expects to see significant changes in the incore thermal
flux distributions between the HEU and LEU fuels. For a well-moderated
thermal reactor at constant power, the thermal flux is nearly inversely
proportional to the fissile loading, hence one expects a reduction in thermal
flux for the LEU core. This effect is readily apparent in Figures 9 and 0
where the thermal flux in regular fuel elements is seen to decrease by
about 18%. For special fuel elements, the reduction in thermal flux
is only about 12%. This mitigation in the thermal flux decrease results
from the effect of the thermal flux peaking in the large waterhole. This
peak is primarily dependent on the fast flux, which is not significantly
different between the LEU and HEU fuels. Since the thermal flux level
within the special element will be affected by the waterhole peaking, the
overall effect is to mitigate the decrease in thermal flux. As noted
for the power distribution, there is a slight shift in thermal flux away
from the heavy water tank toward a slightly improved overall symmetry
about the center.
Excore thermal flux levels are important in the FNR because samples
are generally irradiated in the reflector regions. In particular
the heavy water reflector is of greatest interest because thermal
neutron beam tubes extend from the tank to the laboratory areas. Com-
parisons of the thermal flux levels in the light water reflector show
a flux depression varying from zero to 6. At distances well into the
light water reflector, there is no change because the primary source for
481
Assembly-Averaged Thermal Flux (10 13 n/cm2-sec) Assembly-Averaged Thermal Flux (10 13 n/cm 2-sec
HEU Fuel A HEU FuelLEU Fuel B LEU Fuel
1.22 1.40 1.48 1.0 1.19 1.38 1.37 1.29 1.09
1.05 1.20 1.26 .87 1.02 1.19 1.18 1.11 95
1.11 1.51 2.44 2.00 .87 1.16 1.57 2.40 1.84 2.23 1.33 1.00
- 96 1.30 1.74 .75 .98 1.33 2.15 1.58 1.99 1.14 .8600PO 1.13 1.55 1.93 2.03 .86 1.27 2.20 1.92 1.84 1.74 1.37 1.02
.97 1.33 1.66 1.74 .73 1.08 1.65 1.56 1.48 1.16 .87
1.05 1.44 2.34 1.92 .79 116 1.53 2.37 1.88 2.20 1.34 .97
.92 1.25 2.14 1.67 .69 1.00 1.31 2.12 1.61 1.97 1.14 .83
1.13 1.32 1.41 1.21 1.39 1.92 1.34 1.11
.99 1.14 1.22 1.04 1.19 1.73 1.15 .96
83 .94 .98 .93
.72 .81 .84 .81
Figure 9 Thermal Flux Distribution for HEU and Figure Thermal Flux Distribution for HEU andLEU Batch Cores LEU Equilibrium Cores
thermal neutrons is the slowing down of fast neutrons leaking from
the core. At locations closer to the core te contribution to the
thermal flux due to thermal leakage from the core is larger and, since
the thermal leakage is decreased by the increased fuel loading, there
is a correspondingly greater decrease in the thermal flux. Consistent
with this explanation, the relative thermal flux in the heavy water
tank is depressed somewhat more 48%) than in the light water reactor
due to the increase in the relative contribution of thermal leakage to
the heavy water tank thermal flux.
C. Temperature Ciefficient of Reactivity and Power Defect
The isothermal temperature coefficient of reactivity was com-
puted for the batch core model to be -8.4 pcm/OF for the HEU fuel and
-12.6 pcm/IF for the LEU fuel. The large increase is due almost
exclusively to the fuel Doppler effects. For the HEU fuel, fuel
Doppler effects are negligible due to the small amount of U-238 present.
For the LEU fuel, the large amount ofU-238 increases resonance absorp-
tions in'U-238,resulting in much larger sensitivity to fuel temperature.
The principal contribution to the temperature coefficient of reactivity for
both the HEU and LEU configurations is, however, the effect of the reduction in
moderator density on leakage and moderation.
As discussed earlier, the procedure for calculating the power defect
has not been fully developedand a comparison of the difference in the
power defect for the HEU and LEU cores has not been made. However,
a preliminary estimate has been made based on the observation that the
increase in the fuel Doppler effect is the principal difference in the
temperature effects between the HEU and the LEU designs. The change in
483

power defect of reactivity is estimated in the present analysis on the
basis of calculated temperature coefficients. Based on an average
core temperature rise of 71F, the power defect for the LEU fuel is
estimated to be about 03% Ak/k larger in magnitude than for HEU fuel.
For a typical FNR configuration, the excess reactivity required to
overcome thepower defect would thus change from a measured value of
.21% Ak/k for HEU to 24% Ak/k for LEU.
D. Xenon Reactivity Worth
The xenon reactivity worths of the HEU and LEU fuels are
compared in Tables 7 and for the batch and equilibrium core models,
respectively. For these cores the xenon worth is 46% lower for the
LEU than the HEU fuel. There are two competing effects responsible
for this decrease: First, the larger U-235 loading for the LEU core
results in lower incore thermal flux levels, with a greater 10-12%)
xenon concentration. Second, the increased fuel loading gives the
LEU core a larger neutron absorption cross section. As total core
absorption is increased, the fractional absorption in xenon, and thus
the xenon reactivity worth, is decreased. Although these two effects
tend to cancel one another, the latter effect dominates and xenon reacti-
vity worth is lowered by about .1% Ak/k.
E. Fuel Cycle Analyses
Equilibrium fuel cycle analyses have been performed for the
HEU and LEU cores and the results are presented in Table 9 The compari-
son of discharge fuel burnupwhich indicates a 50% increase for LEU fuel,
should be viewed with some care because of the extreme sensitivity of
484
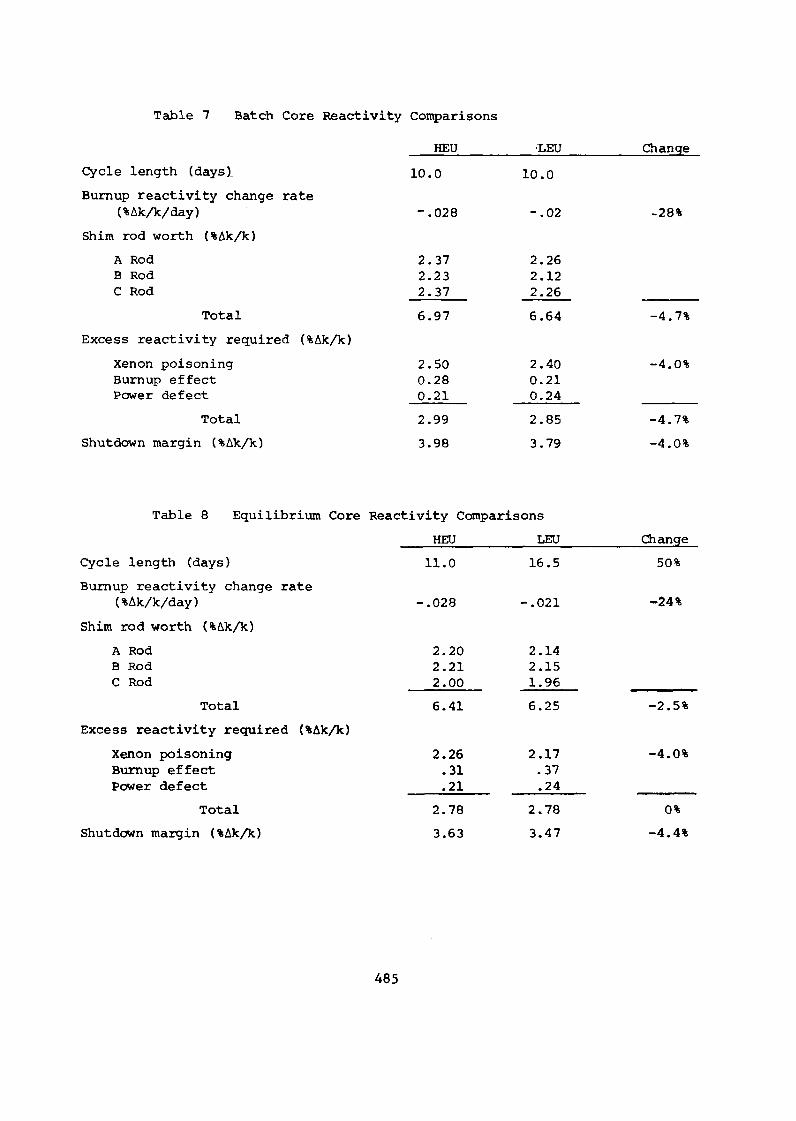
Table 7 Batch Core Reactivity Comparisons
HEU -LEU Ch, an ge
Cycle length (daysl 10.0 10.0
Burnup reactivity change rate(%Ak/k/day) -. 028 -. 02 -28%
Shim rod worth (%Ak/k)
A Rod 2.37 2.26B Rod 2.23 2.12C Rod 2.37 2.26
Total 6.97 6.64 -4.7%
Excess reactivity required (%Ak/k)
Xenon poisoning 2.50 2.40 -4.0%Burnup effect 0.28 0.21Power defect 0.21 0.24
Total 2.99 2.85 -4.7%
Shutdown margin (%Ak/k) 3.98 3.79 -4.0%
Table Equilibrium Core Reactivity Comparisons
HEU LEU Change
Cycle length (days) 11.0 16.5 50%
Burnup, reactivity change rate(%Ak/k/day) -. 028 -. 021 -24%
Shim rod worth (%Ak/k)
A Rod 2.20 2.14B Rod 2.21 2.15C Rod 2.00 1.96
Total 6.41 6.25 -2.5%
Excess reactivity required (%Ak/k)
Xenon poisoning 2.26 2.17 -4.0%Burnup effect .31 .37Power defect .21 .24
Total 2.78 2.78 0%
Shutdown margin (%Ak/k) 3.63 3.47 -4.4%
485
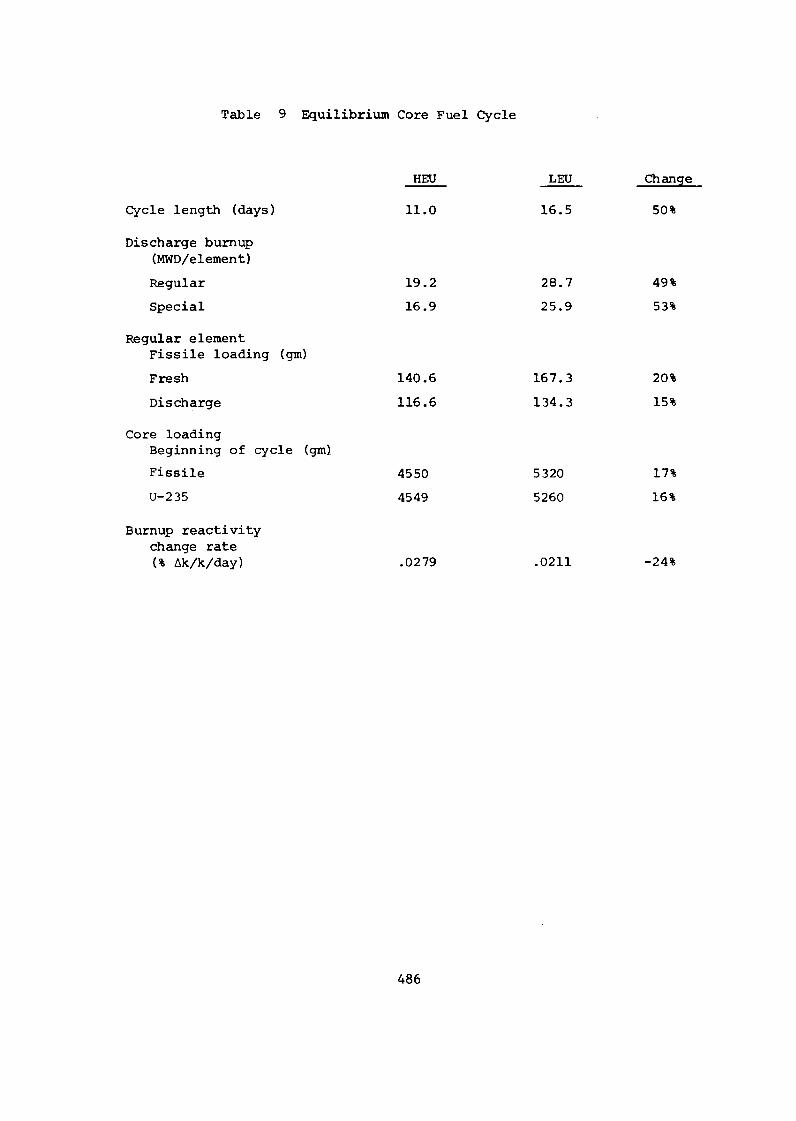
Table 9 Equilibrium Core Fuel Cycle
HEU LEU Change
Cycle length (days) 11.0 16.5 50%
Discharge burnup(MWD/element)
Regular 19.2 28.7 49%
Special 16.9 25.9 53%
Regular elementFissile loading (gm)
Fresh 140.6 167.3 20%
Discharge 116.6 134.3 15%
Core loadingBeginning of cycle (gm)
Fissile 4550 5320 17%
U-235 4549 5260 16%
Burnup reactivitychange rate(% Ak/k/day) .0279 .0211 -24%
486
discharge fuel burnup to core reactivity for the FNR core. For example,
in an equilibrium core analysis comparing two LEU core configurations,
a 0.5% Ak/k change in eigenvalue resulted in a 5% increase in the
discharge burnup. This sensitivity is a consequence of the relatively
low fissile depletion obtained in the FNR core. Typically only 17 of
the initial fissile inventory is depleted from the HEU fuel elements
before discharge. A significant change in the discharge fissile
depletion can be achieved with only a small relative change in the total
core fissile inventory, which is, of course, proportional to core
criticality. Thus, the predicted discharge burnup is very sensitive
to the calculated core criticality. In addition, this sensitivity
is magnified by the in/out shuffling pattern used at the FNR. This
shuffling scheme loads the depleted fuel elements into regions of
lower neutron importance. Thus, changes in the discharge burnup have a
relatively smaller effect on core criticality than with other shuffling
schemes. Because core size and core criticality are directly related,
discharge fuel burnup is also sensitive to core size. Therefore, to
provide valid comparisons a fixed core size was used in our equilibrium
core analysis. Calculations for both the batch and equilibrium cores
indicate a decrease in the burnup reactivity change rate with LEU fuel.
The decrease in reactivity change rate is a consequence of two factors.
Most importantly, the core fissile loading is higher with LEU fuel,
so that the fractional fuel depletion rate, and the burnup reactivity
change rate, are lowered. Production of Pu-239 in the LEU fuel also causes
a decrease in the burnup reactivity change rate. Fuel depletion calcu-
lations indicate that the Pu-239 production rate is approximately %
of the U-235 loss rate in the LEU core. This may translate into a
10-15% decrease in the burnup reactivity change rate, depending on the
487
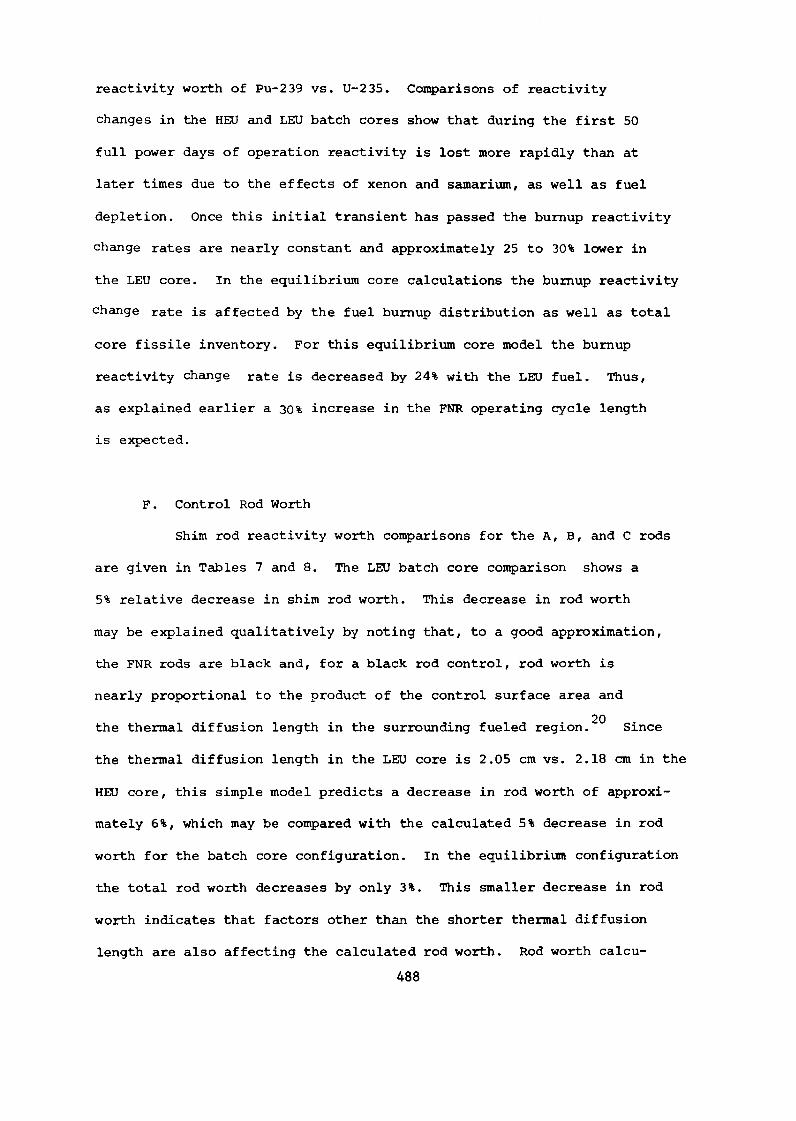
reactivity worth of Pu-239 vs. U-235. Comparisons of reactivity
changes in the HEU and LEU batch cores show that during the first 0
full power days of operation reactivity is lost more rapidly than at
later times due to the effects of xenon and samarium, as well as fuel
depletion. Once this initial transient has passed the burnup reactivity
change rates are nearly constant and approximately 25 to 30% lwer in
the LEU core. In the equilibrium core calculations the burnup reactivity
change rate is affected by the fuel burnup distribution as well as total
core fissile inventory. For this equilibrium core model the burnup
reactivity change rate is decreased by 24% with the LEU fuel. Thus,
as explained earlier a 30% increase in the FNR operating cycle length
is expected.
F. Control Rod Worth
Shim rod reactivity worth comparisons for the A, B, and C rods
are given in Tables 7 and 8. The LEU batch core comparison shows a
5% relative decrease in shim rod worth. This decrease in rod worth
may be explained qualitatively by noting that, to a good approximation,
the FNR rods are black and, for a black rod control, rod worth is
nearly proportional to the product of the control surface area and
the thermal diffusion length in the surrounding fueled region. 20 Since
the thermal diffusion length in the LEU core is 205 cm vs. 218 cm in the
HEU core, this simple model predicts a decrease in rod worth of approxi-
mately 6, which may be compared with the calculated 5% decrease in rod
worth for the batch core configuration. In the equilibrium configuration
the total rod worth decreases by only 3. This smaller decrease in rod
worth indicates that factors other than the shorter thermal diffusion
length are also affecting the calculated rod worth. Rod worth calcu-
488

lations for various equilibrium cores show that rod worth is also
affected by the discharge fuel burnup. As discharge burnup in the
outer fuel elements is increased, the core fissile loading and core
reactivity worth distribution shift toward the core center causing the
rod worth to increase. Thus the higher discharge burnup in the LEU
equilibrium core hasa mitigating effect on the decrease in rod worth,
and the net effect is a 3 decrease in total worth.
G. Comparison of Shutdown Margin
The most significant safety parameter related to core physics
analysis is the shutdown margin. This parameter is obtained by sub-
tracting the positive core excess reactivity required to overcome
xenon poisoning, fuel depletion, and the power defect from the total
control rod reactivity worth. The present technical specifications
require that the shutdown margin be at least 30% Ak/k. Any difference
between the estimated shutdown margin and the limiting value represents
excess reactivity available for experiments.
For the LEU batch core, it is seen from Table 7 that the lower excess
reactivity requirement is overshadowed by the decrease in control rod
reactivity worth. The shutdown margin of 379% A k/k is lower than for
the HEU core, but is still well above the 3 Ak/k requirement. Addi-
tionally, with the most reactive rod fully withdrawn, the shutdown margin
is 153% Ak/k, well in excess of the 75% Ak/k required.
Comparing the HEU and LEU equilibrium core results in Table
shows that the shutdown margin decreases slightly for the LEU core. The
computed value of 347% Ak/k is well in excess of the 30% Ak/k require-
ment. Also, the shutdown margin with.the most reactive control rod
fully withdrawn s 132% L/k, well above the 75% Ak/k required.
489
VII. ALTERNATIVE LU FUEL DEMNS
The LEU fuel design was selected for the full core demonstration
based on a criterion of creating minimum perturbations in reactor perfor-
mance. To determine effective ways of improving core performance, e.g.,
the core fuel burnup, control rod worth, and excore flux levels, several
alternative LEU fuel designs have also been studied.
This section presents -results of an equilibrium core study cmparing
the LEU fuel with an alternative higher loaded fuel design. The two fuel
designs are compared in Table 10 T fissile loading for the alterna-
tive fuel design has been increased to 175 gm by increasing the uranium
density in the fuel meat, without changing element dimensions. The impor-
tant conclusion of th!:�& alternative fuel design study is, thAt it iuay be
possible to significantly increase fuel burnup without degradingother
reactor performance characteristics.
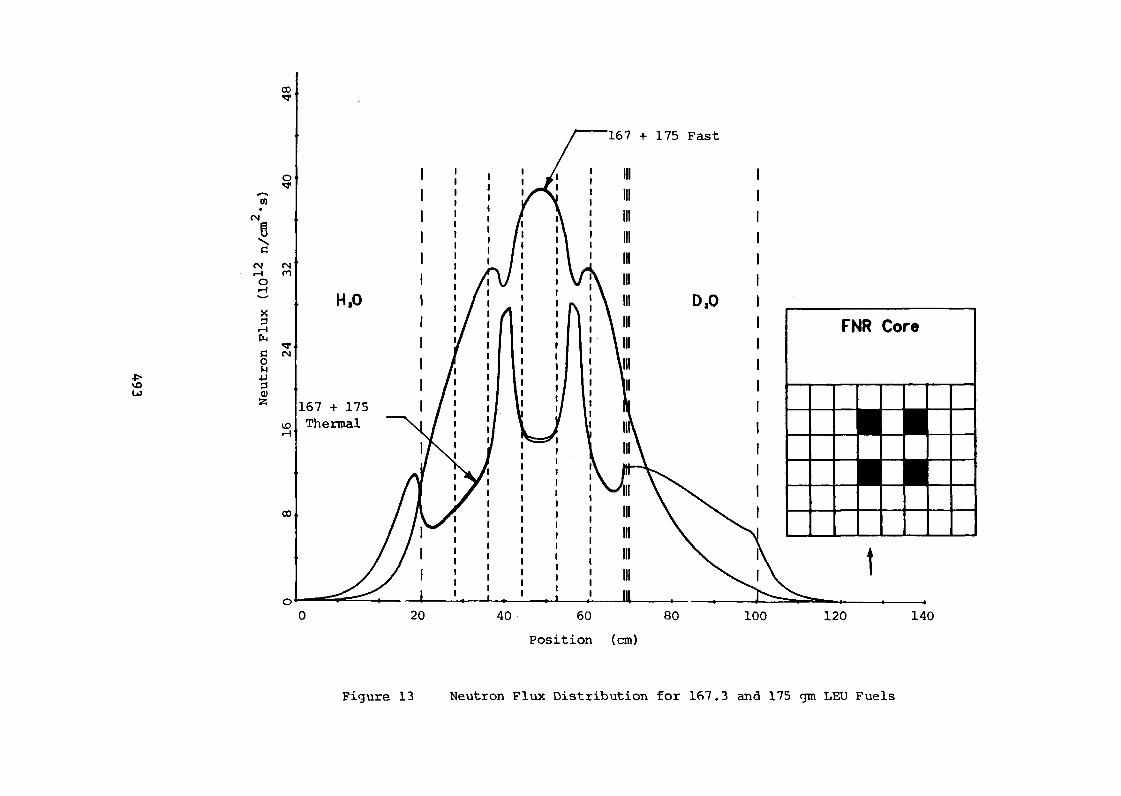
The equilibrium core power and thermal flux distributions for the
two fuels are compared in Figures 11, 12 and 13. The power distribution
comparisons show only a slight shift for the higher loaded fuel,
despite the increase in fuel burnup at the core edges. A maximum
increase of about 2 in assembly power occurs near the core center and
the heavy water tank. The thermal flux distribution comparison shows a
maximum decrease of less than 3 suggesting that the flux depression
caused by the higher loading is partially mitigated by the higher fissile
depletion.
Equilibrium core calculations predict a 26% increase in cycle length
and discharge burnup for the 175 gm fuel. As explained earlier, the
higher discharge burnup results because the fuel can be depleted longer
while maintaining a critical euilibrium configuration. The 175 gm fuel
490
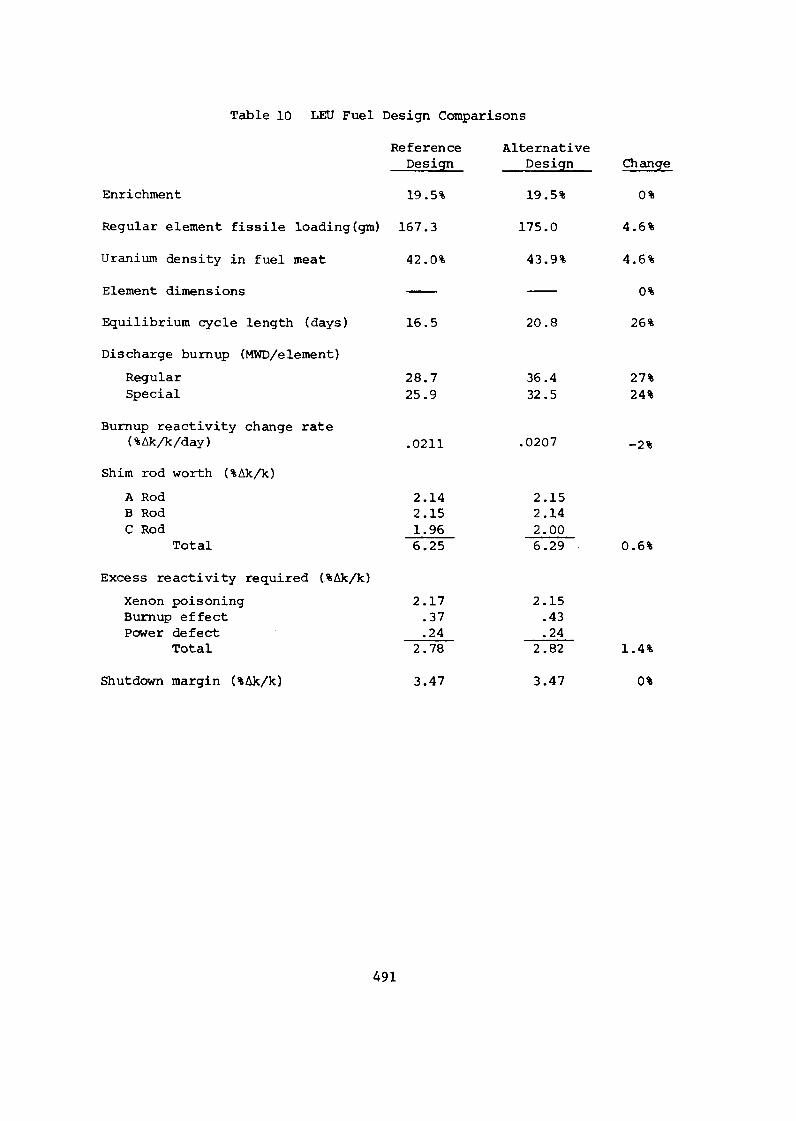
Table 10 LEU Fuel Design Comparisons
Reference AlternativeDesign Design Change
Enrichment 19.5% 19.5% 0%
Regular element fissile loading(gm) 167.3 175.0 4.6%
Uranium density in fuel meat 42.0% 43.9% 4.6%
Element dimensions 0%
Equilibrium cycle length (days) 16.5 20.8 26%
Discharge burnup (MWD/element)
Regular 28.7 36.4 27%
Special 25.9 32.5 24%
Burnup reactivity change rate(%Ak/k/day) .0211 .0207 -2%
Shim rod worth (%Ak/k)
A Rod 2.14 2.15B Rod 2.15 2.14C Rod 1.96 2.00
Total 6.25 6.29 0.6%
Excess reactivity required (.%Ak/k)
xenon poisoning 2.17 2.15Burnup effect .37 .43Power defect .24 .24
Total 2.78 2.82 1.4%
Shutdown margin (%Ak/k) 3.47 3.47 0%
491
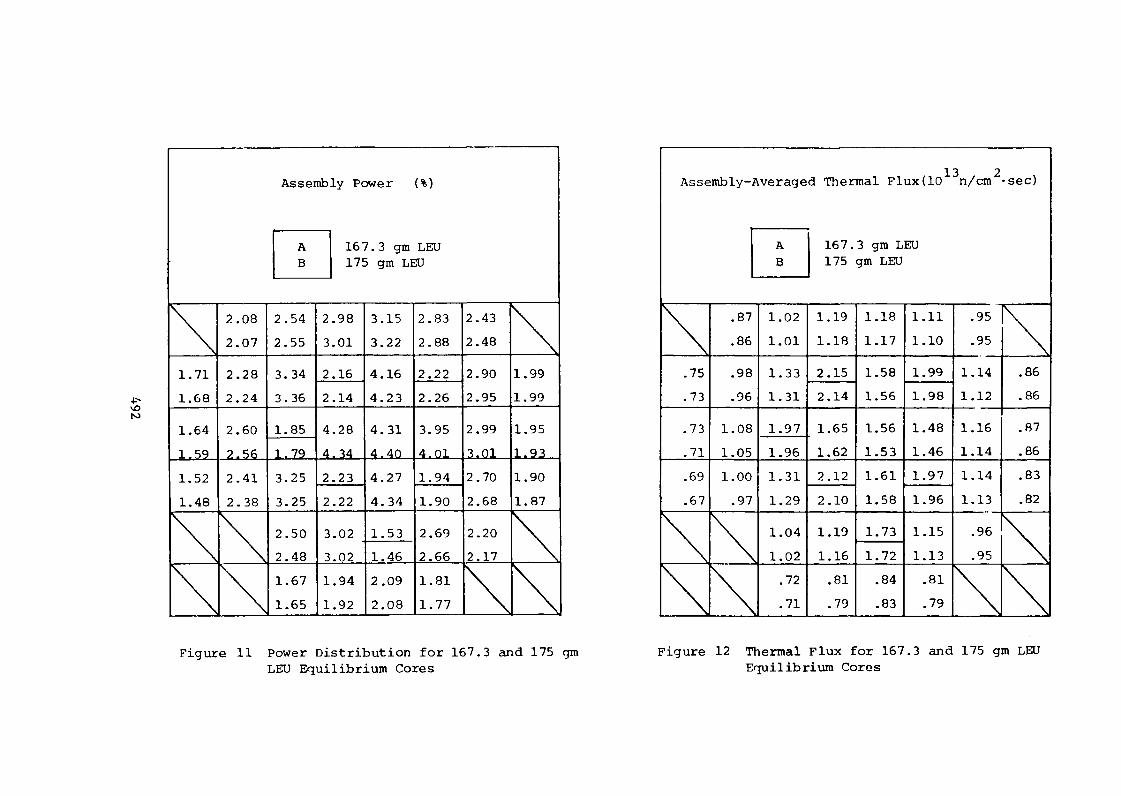
3 2Assembly Power M Assembly-Averaged Thermal Flux(10 n/cm sec)
A 167.3 gm LEU 167.3 gm LEUB 175 gm LEU 175 gm LEU
2.08 2.54 2.98 3.15 2.83 2.43 .87 1.02 119 1.18 1.11 .95
2.07 2.55 3.01 3.22 2.68 2.48 .86 1.01 1.18 1.17 1.10 .95
1.71 2.28 3.34 2.16 4.16 2.22 2.90 1.99 .75 .98 1.33 215 1.58 1.99 1.14 .86
4- 1.68 2.24 3.36 4.23 F2.26 2.95 1.99 .73 .96 1.31 F2.14 1.56 .98 1.12 .86
1.64 2.60 1.85 4.28 4.31 3.95 2.99 1.95 .73 l..08 1.97 165 1.56 1.48 1.16 .87
1.59 2.56 1.79 4.34 4.40 4.01 3.01 1.93 .71 1.05 1.62 1.53 1.46 1.14 .86
1.52 2.41 3.25 2.23 4.27 1.94 2.70 1.90 .69 1.00 1.31 2.12 1.61 1.97 1.14 .83
1.48 2.38 3.25 [2.22 4.34 [1.90 2.68 1.87 .67 .97 1.29 2.10 1.581 1.96 1.13 .82
2.50 3.02 1.53 2.69 2.20 1.04 1.19 1.73 1.15 .96
2.48 3.02 1.46 2.66 2.17 1.02 1.16 1.72 1.13 .95
1.67 1.94 2.09 1.81 72 .81 .84 .81
1.65 1.92 2.08 1.77 .71 .79 .831 .79
Figure 11 Power Distribution for 167.3 and 175 gm Figure 12 Thermal Flux for 167.3 and 175 gm LEULEU Equilibrium Cores Equilibrium Cores
OD
167 + 175 Fast
0
cq
IS,
CN
HO DO Ix0 I FNR Core
4j
Loz 167 175
,O Thermal
co
0 0 20 40 60 80 100 120 140
Position (cm)
Figure 13 Neutron Flux Distribution for 167.3 and 175 gm LEU Fuels
is initially more reactive because of the higher fissile loading, and loses
reactivity de to fuel burnup at a slower rate, as seen by the 2 decrease
in burnup reactivity change rate. As noted earlier, hwever, care must be
taken in interpreting these results because of the extreme sensitivity of
discharge fuel burnup, to core reactivity for the FNR.
Calculations of the reactivity effects for the two LEU fuels
predict no change in shutdown margin with the higher loaded fuel. The
control rod worth increasesby an almost insignificant amount because
the higher core edge depletion tends to increase core center reactivity
worth. Thus the shutdown margin, as well as the core power and thermAl flux
distribution, are not sgnificantly degraded even though-the dcharge
burnup is considerably higher for the 175 gm fuel design.
VIII. SUMMARY
A 19.5% enriched fuel design was selected and is being fabricated
as part of the FNR demonstration project. The fuel has a 167.3 gram
fissile loading and 18 fuel plates per assembly. To accommodate the
increased uranium content without changing fuel plate or assembly dimen-
sions, the uranium loading in the fuel meat has been increased to 42 w/o
and the fuel thickness-has been increased 50% while ecreasing the clad
thickness.
Extensive efforts have been devoted to developing calculational
methods for analyzing HEU and LEU fueled research reactors. These
methods make use of existing well verified computer codes whenever
possible and have been verified by comparison with data from several
research reactor cnfigurations.
494
To study all expected effects, the HEU fuel and LEU fuel were analyzed
and compared in both batch and equilibrium core models. These comparisons
serve to quantify predictions made on physical grounds The higher
fissile loading required to overcome the additionalU-238 absorptions
results in a large decrease in the in-core thermal flux. Thermal flux
levels in the reflector are depressed to a lesser degree because the
fast neutron leakage is nearly constant. The power distribution is not
perturbed to a significant degree. The equilibrium cycle length and
discharge fuel burnup are predicted to increase because the LEU core
can be depleted longer while-maintaining core criticality. There i a
small decrease in the -menon. worth-and control rod worth caused Ly hgher
core absorption. Comparisons for the equilibrium cores indicate that the
reduction in rod worth may he mitigated by the increased fuel burnup
of the LEU core. Most importantly the comparisons- predict no significant
change in the core shutdown margin.
The analytic methods described n the paper have provided a reasonable
assessment of the impacts-of LEU fuel on FNR performance. Hweverl there
remain areas which deserve frther study and additional refinement.
Some specific items currently being investigated at The University of
Michigan are:
1) Development of a new data library for the LEOPARD code
based upon ENDF/B-IV data.
2) investigation of optimal equilibrium core configurations using
linear/dynamic programming concepts.
3) Continued investigation of discrepancies between measured and
predicted rod worths, with a careful examination of possible
boron depletion effects.
4) Calculation of a eff' the effective delayed neutron fraction,
for both HEU and LEU cores.
495
5) Refinement of the power defect calculation to include non-
uniform axial effects.
6) Refinements in the determination and use of burnup dependent
non-lattice peaking factors for the LEOPARD code.
7) Extensive analysis of the leakage flux levels in the FNR
heavy water tank and beam port locations. Calculations
are planned using both discrete ordinates and Monte Carlo
methods.
496
REFERENCES
1. D. Wehe and J. S. King, "The FNR HEU-LEU Demonstration Experiment",
(to be presented at this conference).
2. H. Komoriya, J. C. Lee, and W. R. Martin, Trans. Am. Nucl. Soc., 32,
Suppl. 1, 31 1979).
3. F. B. Brown, D. C. Losey, D. K. Wehe, J. C. Lee and W. R. Martin,
Trans. Am. Nucl. Soc., 33, 746 1979).
4. D. C. Losey, F. B. Brown, W. R. Martin, J. C. Lee, and H. Komoriya,
Trans. Am. Nucl. Soc., 33, 748 1979).
5. W. Kerr, et al., "Low Enrichment Fuel Evaluation and Analysis Program,
Summary Report for the Period January 1979-December 1979", University
of Michigan Report (Jan. 1980).
6. D. C. Losey, F. B. Brown, J. C. Lee and W. R. Martin, Trans. Am.
Nucl. Soc., 34, 569 1980).
7. R. F. Barry, "LEOPARD - A Spectrum Dependent Non-Spatial Depletion
Code", WCAP-3269-26, Westinghouse Electric Corporation (Sept. 1963).
8. J. Barhen, W. Rothenstein, E. Taviv, "The HAMMER Code System", NP-565,
Electric Power Research Institute (October 1978).
9. W. W. Little, Jr. and R. W. Hardie, "2DB User's manual-Revision I",
BNWL-831 REV1, Battelle Pacific Northwest Laboratory (February 1969).
10. W. W. Engle, Jr., "A User's Manual for ANISN, a One-Dimensional
Discrete Ordinates Transport Code with Anisotropic Scattering",
K-1693, Oak Ridge Gaseous Diffusion Plant (March 1967).
11. K. D. Lathrop and F. W. Brinkley, "TWOTRAN-II - An Interfaced Expor-
table Version of the TWOTRAN Code for Two-Dimensional Transport",
Los Alamos Scientific Laboratory, LA-4848-MS 1973).
12. D. R. Vondy, T. B. Fowler, and G. W. Cunningham, "VENTURE: A Code
Block for Solving Multigroup Neutronics Problems Applying the Finite-
Difference Diffusion Theory Approximation to Neutron Transport", ORNL-
5062 1975).
13. M. H. Theys, Nucl. Sci. Eng. 7 58 1960).
14. J. Hardy, D. Klein, and J. J. Volpe, "A Study of Physics Parameters in
Several Water-Moderated Lattice.% of Slightly Enriched and Natural
Uranium:, WAPD-TM-931, 'Westinghouse Electric Corporation (March 1970).
15. E. B. Johnson, "Power Calibration for BSR Loading 33", CF-57-11-30,
Oak Ridge National Laboratory 19571.
16. J. L. Shapiro, "The Void Coefficient in an Enriched, Water Reactor",
Nucl. Sci. Eng., 12, 449 (1962Y.
497
17. H. Kmoriya to J. L. Snelgrove, "Reduced Enrichment Fuel ElementLoading Calculations for the Ford Nuclear Reactor", Argonne NationalLaboratory Internal Memorandum (February 14, 1979).
18. J. E. Matos and K. E. Freese, Trans. Am. Nucl. Soc., 33, 739 1979).
19. H. Komoriya, Trans. Am. Nucl. Soc., 33, 745 1979).
20. J. J. Duderstadt and W. R. Martin, Transport Theory, Wiley-Interscience,New York 1979).
498
Related Documents