Interagency Commodity Estimates Committee Forecasts World Agricultural Outlook Board, Chairing Agency Economic Research Service Foreign Agricultural Service Farm Service Agency Agricultural Marketing Service World Agricultural Supply and Demand Estimates Report of April 10, 2018

Welcome message from author
This document is posted to help you gain knowledge. Please leave a comment to let me know what you think about it! Share it to your friends and learn new things together.
Transcript

Interagency Commodity Estimates Committee ForecastsWorld Agricultural Outlook Board, Chairing Agency
Economic Research ServiceForeign Agricultural Service
Farm Service AgencyAgricultural Marketing Service
World Agricultural Supply and Demand EstimatesReport of April 10, 2018
WASDE: World Agricultural Supply and Demand Estimates
Secretary's WASDE Briefing Slides
Foreign Ag Service: World Agricultural Production
Weekly Weather and Crop Bulletin
Links to the latest WASDE related publicationsOffice of the Chief Economist
World Agricultural Outlook Board (WAOB)
US Drought Monitor ( in cooperation with NOAA and NDMC)
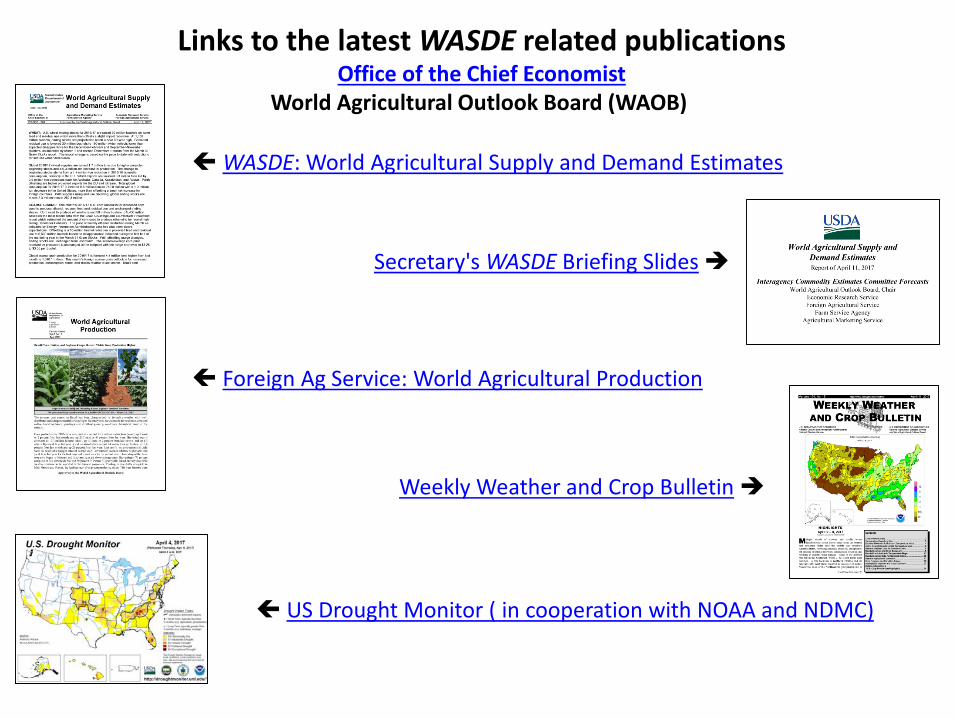
World Wheat Production
April 10, 2018
Country or Region2016/17 estimate
2017/18 forecast
Change from
March 8Change from
2016/17
World 750.7 759.8 1.0 9.1United States 62.8 47.4 -- -15.5
Foreign 687.9 712.4 1.0 24.5Argentina 18.4 18.0 -- -0.4Canada 31.7 30.0 -- -1.7Australia 30.4 21.5 -- -8.9European Union 145.3 151.6 -- 6.4Turkey 17.3 21.0 -- 3.8Russia 72.5 85.0 -- 12.5Ukraine 26.8 27.0 -- 0.2Kazakhstan 15.0 14.8 -- -0.2China 128.8 129.8 -- 0.9India 87.0 98.5 -- 11.5
Million Tons
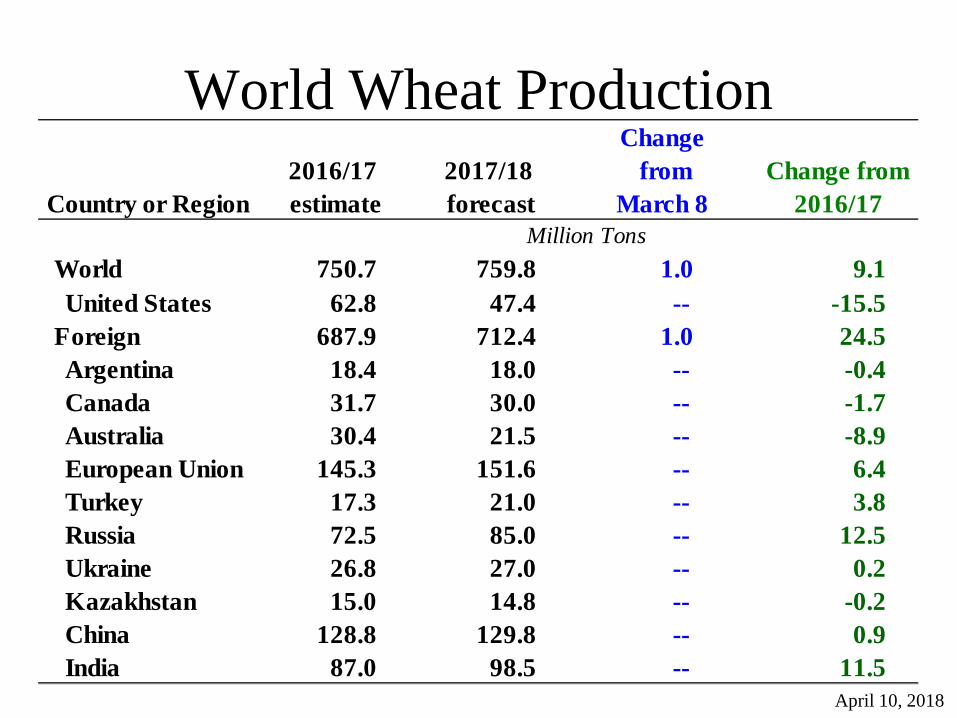
World Wheat Supply and Use
April 10, 2018
2016/17 estimate
2017/18 forecast
Change from
March 8Change from
2016/17
Beginning stocks 242.7 254.6 2.0 11.9Production 750.7 759.8 1.0 9.1Total Supply 993.4 1,014.4 3.0 20.9
Feed use 147.2 145.7 1.1 -1.5Total use 738.8 743.1 0.6 4.3
Trade 183.3 182.0 -0.0 -1.3Ending Stocks 254.6 271.2 2.3 16.6
Million Tons

U.S. Wheat Supply and Demand
April 10, 2018
2016/17 estimate
2017/18 forecast
Change from
March 8Change from
2016/17
Planted area (million acres) 50.1 46.0 -- -4.1Harvested area (million acres) 43.9 37.6 -- -6.3Yield (bushels per acre) 52.7 46.3 -- -6.3
Million bushelsBeginning stocks 976 1,181 -- 205Production 2,309 1,741 -- -568Imports 118 155 -- 37Total supply 3,402 3,076 -- -326
Food use 949 955 -- 6Seed 61 62 -- 1Feed and residual 156 70 -30 -86Domestic use 1,167 1,087 -30 -80
Exports 1,055 925 -- -130Total use 2,222 2,012 -30 -210
Ending stocks 1,181 1,064 30 -116
Stocks to use ratio 53.1 52.9 2.2 -0.2
Average market price 3.89 4.60/4.70 -- 0.76-- No change
Dollars per bushel
Percent

World Rice Production
April 10, 2018
Country or Region
2016/17 estimate
2017/18 forecast
Change from
March 8Change from
2016/17
World 486.2 487.5 1.20 1.3United States 7.1 5.7 -- -1.5
Foreign 479.0 481.8 1.20 2.8Argentina 0.9 0.8 -- -0.1Brazil 8.4 8.1 0.26 -0.3Egypt 4.8 4.3 -- -0.5Bangladesh 34.6 32.7 -- -1.9Burma 12.7 13.2 0.25 0.5Cambodia 4.9 5.0 -- 0.1China 145.0 146.0 -- 1.0India 109.7 110.0 -- 0.3Indonesia 36.9 37.0 -- 0.1Japan 7.8 7.6 -0.01 -0.2Sri Lanka 2.0 2.5 0.23 0.5Pakistan 6.9 7.5 0.30 0.6Philippines 11.7 12.3 0.33 0.6Thailand 19.2 20.4 -0.03 1.2Vietnam 27.4 28.5 -- 1.0
-- No change
Million Tons

World Rice Supply and Use2016/17 estimate
2017/18 forecast
Change from
March 8Change from
2016/17
Beginning stocks 132.7 137.1 -0.18 4.4Production 486.2 487.5 1.20 1.3Total Supply 618.9 624.6 1.02 5.7Total use 481.8 480.1 -0.34 -1.6
Trade 47.4 48.1 0.80 0.8Ending Stocks 137.1 144.4 1.36 7.3
Million Tons, milled
April 10, 2018

U.S. Rice Supply and DemandRough Equivalent of Rough and Milled Rice
April 10, 2018
2016/17 estimate
2017/18 forecast
Change from
March 8Change from
2016/17
Planted area (million acres) 3.15 2.46 -- -0.69Harvested area (million acres) 3.10 2.37 -- -0.72Yield (pounds per acre) 7,237 7,507 -- 270
Million cwtBeginning stocks 46.5 46.0 -- -0.4Production 224.1 178.2 -- -45.9Imports 23.5 25.0 0.1 1.5Total supply 294.1 249.3 0.1 -44.8
Domestic use 131.4 120.0 -- -11.4Exports 116.7 96.0 -4.0 -20.7Total use 248.0 216.0 -4.0 -32.0
Ending stocks 46.0 33.3 4.1 -12.8
Stocks to use ratio 18.6 15.4 2.1 -3.2
Average market price 10.40 12.40/12.80 0.10 2.20-- No change
Percent
Dollars per cwt
Agricultural Weather AssessmentsWorld Agricultural Outlook Board
MajorIntensityProductionMinor
*Source: IBGE
JAN FEB MAR APR MAY JUN JULAUG SEP OCT NOV DEC
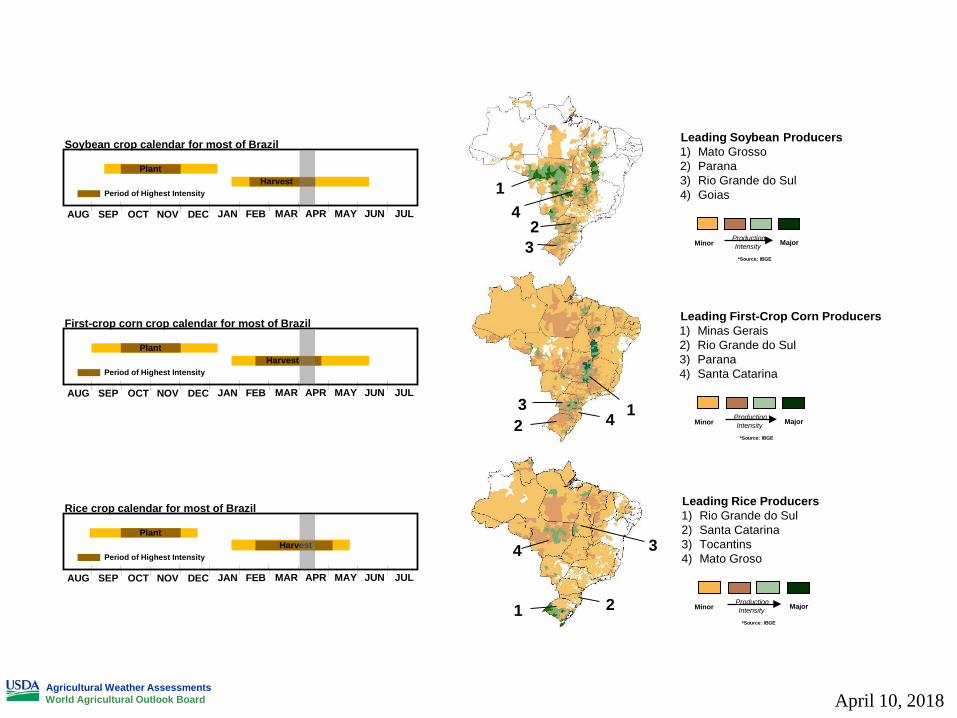
Soybean crop calendar for most of Brazil
Period of Highest Intensity
PlantHarvest
Leading Soybean Producers1) Mato Grosso2) Parana3) Rio Grande do Sul4) Goias1
23
4
MajorIntensityProductionMinor
*Source: IBGE
JAN FEB MAR APR MAY JUN JULAUG SEP OCT NOV DEC
First-crop corn crop calendar for most of Brazil
Period of Highest Intensity
PlantHarvest
Leading First-Crop Corn Producers1) Minas Gerais2) Rio Grande do Sul3) Parana4) Santa Catarina
123
4
MajorIntensityProductionMinor
*Source: IBGE
JAN FEB MAR APR MAY JUN JULAUG SEP OCT NOV DEC
Rice crop calendar for most of Brazil
Period of Highest Intensity
PlantHarvest
Leading Rice Producers1) Rio Grande do Sul2) Santa Catarina3) Tocantins4) Mato Groso4
1
3
2
April 10, 2018

MajorIntensityProductionMinor
*Source: IBGE
JAN FEB MAR APR MAY JUN JUL AUG SEP OCTNOV DEC
*Cotton crop calendar for most of Brazil
Period of Highest Intensity
PlantHarvest
Leading Cotton Producers1) Mato Grosso2) Bahia3) Mato Grosso do Sul4) Goias1 2
34
MajorIntensityProductionMinor
*Source: IBGE
Leading Second-Crop Corn Producers1) Mato Grosso2) Parana3) Mato Grosso do Sul4) Goias1
32 4
* Later planting (Feb – Jun) in northeast
JAN FEB MAR APR MAY JUN JUL AUG SEP OCTNOV DEC
Second-crop corn calendar for most of Brazil
Period of Highest Intensity
PlantHarvest
* Later planting (Apr – Jul) in northeast
Agricultural Weather AssessmentsWorld Agricultural Outlook Board April 10, 2018
Foreign Agricultural ServiceOffice of Global AnalysisIPA Division
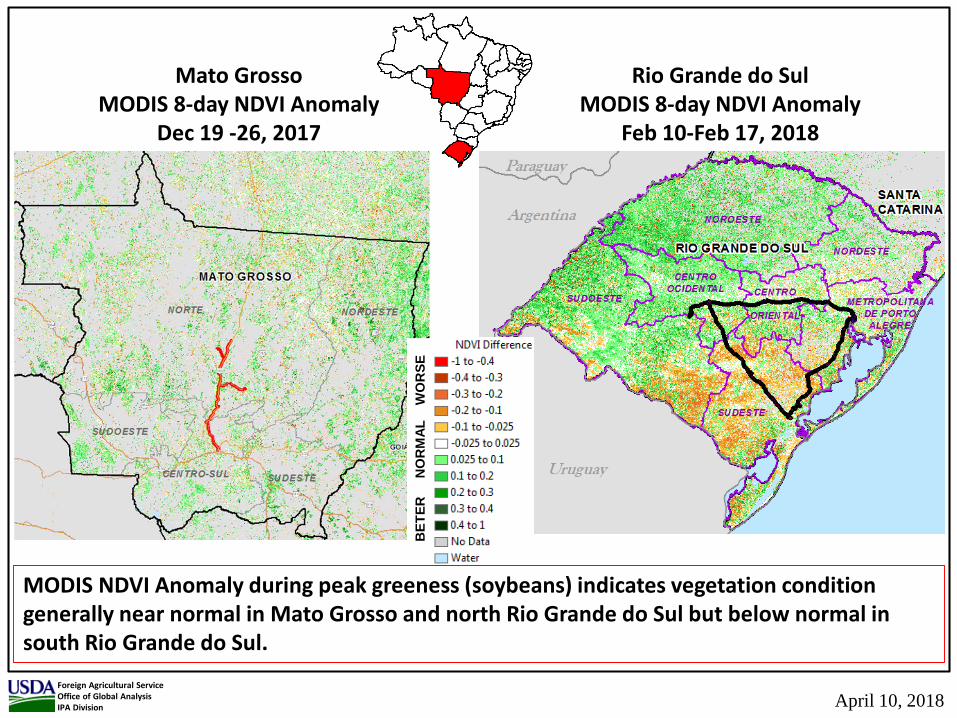
Mato GrossoMODIS 8-day NDVI Anomaly
Dec 19 -26, 2017
Rio Grande do SulMODIS 8-day NDVI Anomaly
Feb 10-Feb 17, 2018
BET
ER
NO
RM
AL
WO
RSE
MODIS NDVI Anomaly during peak greeness (soybeans) indicates vegetation condition generally near normal in Mato Grosso and north Rio Grande do Sul but below normal in south Rio Grande do Sul.
April 10, 2018
Foreign Agricultural ServiceOffice of Global AnalysisIPA Division
April 10, 2018
(%)
Rio Grandedo Sul
SantaCatarina
Mato GrossoBahia
Mato Grossodo Sul
Parana
SaoPaulo
MinasGerais
Goias
Tocantins
Maranhao
Piaui
ParaAmazonas
Rondonia
Roraima
Amapa
Acre
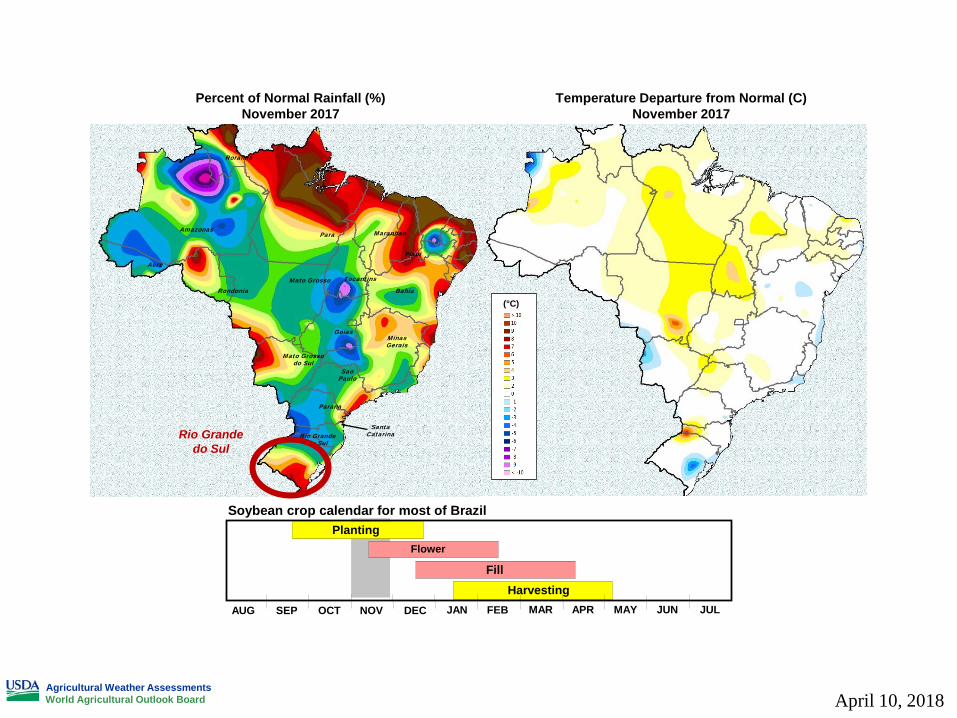
HarvestingJAN FEB MAR APR MAY JUN JULAUG SEP OCT NOV DEC
Soybean crop calendar for most of BrazilPlanting
FillFlower
Temperature Departure from Normal (C)November 2017
Percent of Normal Rainfall (%)November 2017
(°C)
Rio Grandedo Sul
SantaCatarina
Mato GrossoBahia
Mato Grossodo Sul
Parana
SaoPaulo
MinasGerais
Goias
Tocantins
Maranhao
Piaui
ParaAmazonas
Rondonia
Roraima
Amapa
Acre
Rio Grandedo Sul
Agricultural Weather AssessmentsWorld Agricultural Outlook Board April 10, 2018

Average
2017/18
2016/17
Average Rainfall:~1300 mm
(Sep 1 - Apr 30)
Agricultural Weather AssessmentsWorld Agricultural Outlook Board April 10, 2018

Average
2017/18
2016/17
Average Rainfall:~940 mm
(Sep 1 - Apr 30)
Agricultural Weather AssessmentsWorld Agricultural Outlook Board April 10, 2018

Average
2017/18
2016/17
Agricultural Weather AssessmentsWorld Agricultural Outlook Board April 10, 2018

2017/18
Average
2016/17
Agricultural Weather AssessmentsWorld Agricultural Outlook Board April 10, 2018

Average
2017/18
2016/17
Agricultural Weather AssessmentsWorld Agricultural Outlook Board April 10, 2018

Average
2017/18
2016/17
Agricultural Weather AssessmentsWorld Agricultural Outlook Board April 10, 2018

Brazil Soybeans
Rio Grandedo Sul
SantaCatarina
Major
Soybean Production*Average (2009-13)
IntensityProductionMinor
*Source: IBGE
Mato GrossoBahia
Mato Grossodo Sul
Parana
SaoPaulo
MinasGerais
Goias
Tocantins
Maranhao
Piaui
a – Cearab – Rio Grande do Nortec – Paraibad – Pernambucoe – Alagoasf – Sergipeh – Espirito Santoi – Rio de Janeiro
abc
de
f
h
i
Para
Amazonas
Rondonia
Roraima
Amapa
Acre
HarvestingJAN FEB MAR APR MAY JUN JULAUG SEP OCT NOV DEC
Soybean crop calendar for most of BrazilPlanting
FillFlower
Source: IBGE Brazil
* State-Level Production(as % of total)
Mato GrossoParanaRio Grande do SulGoiasMato Grosso do SulMinas GeraisBahiaSao PauloMaranhaoSanta CatarinaTocantinsOther
30191411
7442222
~3
* 2009 to 2013 Average
Agricultural Weather AssessmentsWorld Agricultural Outlook Board April 10, 2018
Foreign Agricultural ServiceOffice of Global AnalysisIPA Division
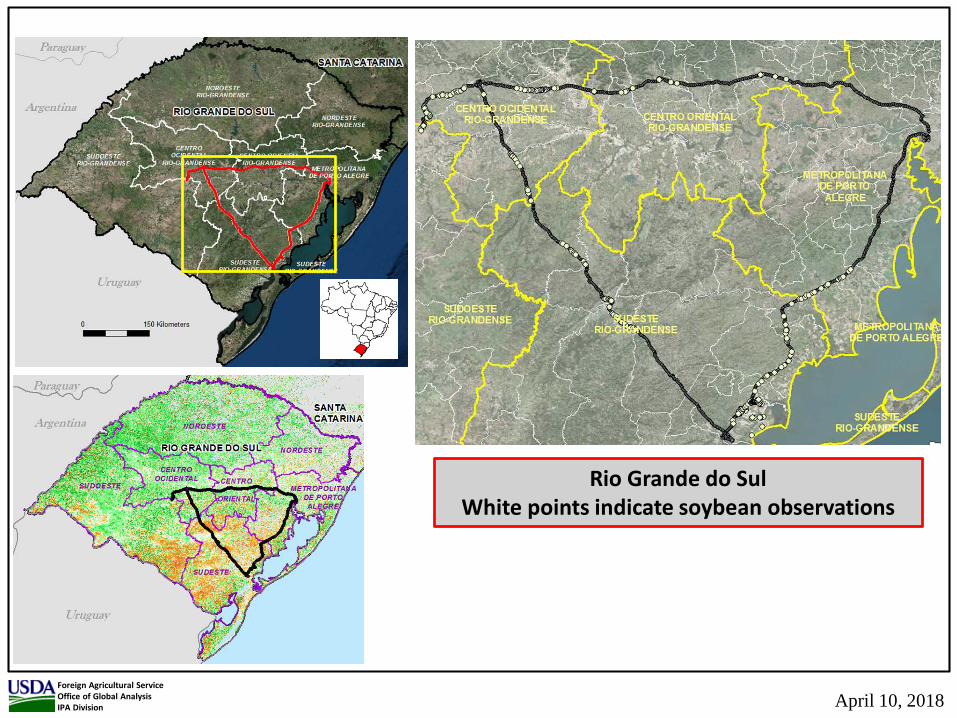
Rio Grande do SulWhite points indicate soybean observations
April 10, 2018
Foreign Agricultural ServiceOffice of Global AnalysisIPA Division
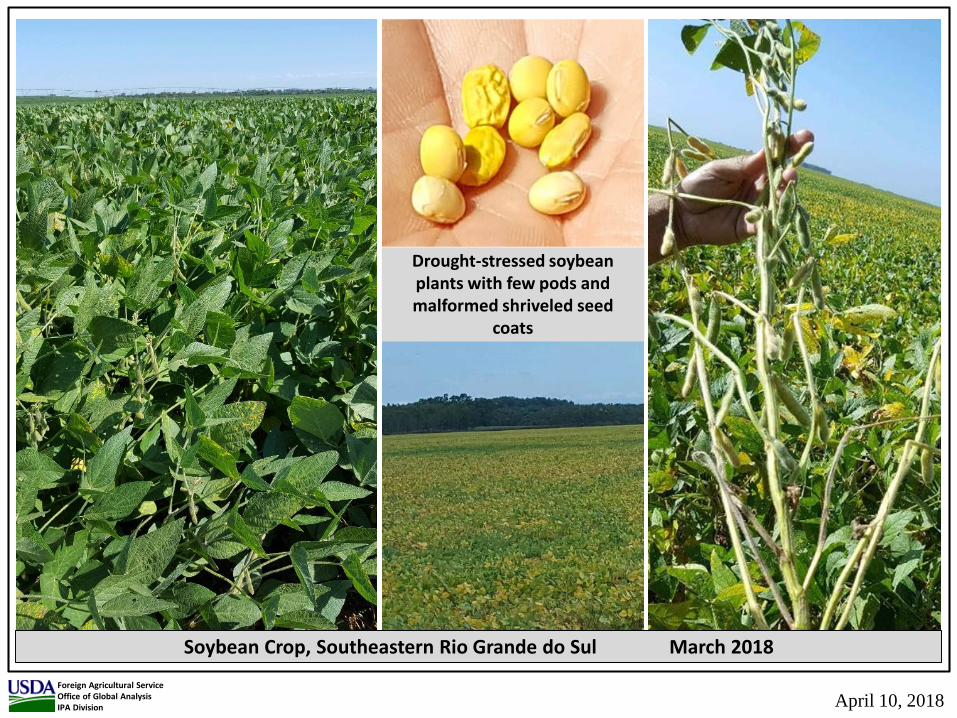
Drought-stressed soybean plants with few pods and malformed shriveled seed
coats
Soybean Crop, Southeastern Rio Grande do Sul March 2018
April 10, 2018
2.00
2.20
2.40
2.60
2.80
3.00
3.20
3.40
3.60
0
20,000
40,000
60,000
80,000
100,000
120,000
140,000
2007
/08
2008
/09
2009
/10
2010
/11
2011
/12
2012
/13
2013
/14
2014
/15
2015
/16
2016
/17
2017
/18
F
MT/
HA
Thou
sand
Hec
tare
s or M
etric
Tons
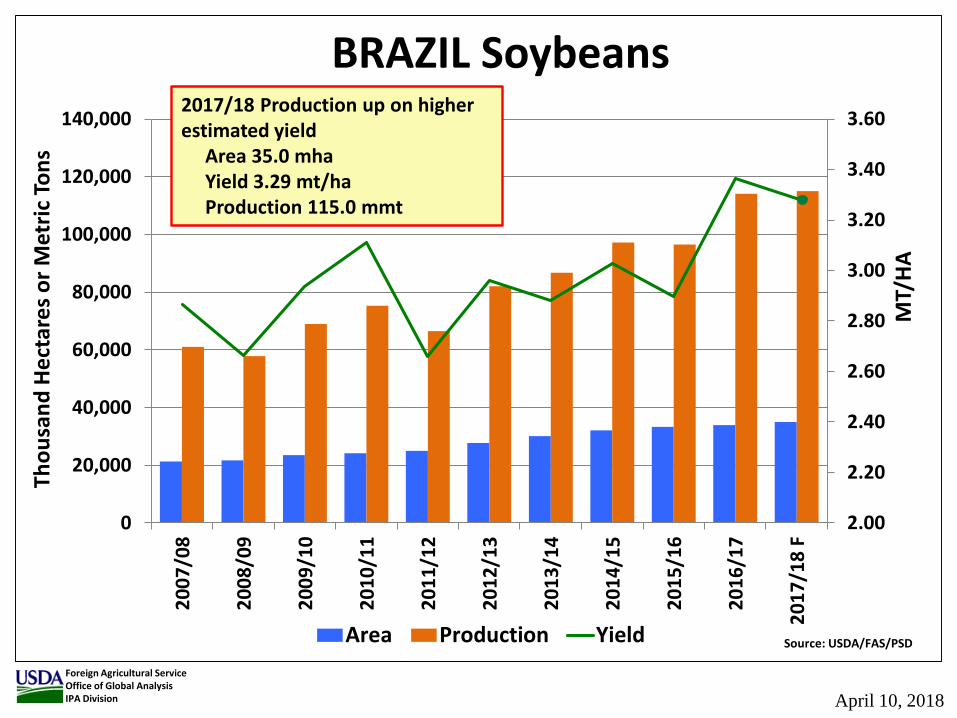
BRAZIL Soybeans
Area Production Yield Source: USDA/FAS/PSD
Foreign Agricultural ServiceOffice of Global AnalysisIPA Division
2017/18 Production up on higher estimated yield
Area 35.0 mhaYield 3.29 mt/haProduction 115.0 mmt
April 10, 2018

Brazil Corn (Second Crop)
Major
Corn Production*Average (2011-13)
IntensityProductionMinor*Source: IBGE
Rio Grandedo Sul
SantaCatarina
Mato GrossoBahia
Mato Grossodo Sul
Parana
SaoPaulo
MinasGerais
Goias
Tocantins
Maranhao
Piaui
a – Cearab – Rio Grande do Nortec – Paraibad – Pernambucoe – Alagoasf – Sergipeh – Espirito Santoi – Rio de Janeiro
abc
de
f
h
i
Para
Amazonas
Rondonia
Roraima
Amapa
Acre
JAN FEB MAR APR MAY JUN JUL AUG SEP OCT NOV DEC
2nd Corn crop calendar for most of Center-South Brazil
Plant
Harvest
Source: IBGE Brazil
* State-Level Production(as % of total)
Mato GrossoParanaMato Grosso do SulGoiasSao PauloMinas GeraisSergipeBahiaMaranhaoRondoniaOther States
39251512
311111
~1
* 2011 to 2013 Average
Agricultural Weather AssessmentsWorld Agricultural Outlook Board April 10, 2018

0.00
1.00
2.00
3.00
4.00
5.00
6.00
0
10,000
20,000
30,000
40,000
50,000
60,000
70,000
80,000
90,000
100,000
2006
/200
7
2007
/200
8
2008
/200
9
2009
/201
0
2010
/201
1
2011
/201
2
2012
/201
3
2013
/201
4
2014
/201
5
2015
/201
6
2016
/201
7
2017
/201
8 F
Yiel
d (m
t/ha
)
Thou
sand
Hec
tare
s or T
ons
Brazil Corn
Area (th ha) Production (th ton) Yield (mt/ha)
Foreign Agricultural ServiceOffice of Global AnalysisIPA Division
2017/18 Production down on lower areaArea 17.1 mha, Yield 5.38 mt/ha Production 92.0 mmt
Source: PSD FAS, USDAhttps://apps.fas.usda.gov/psdonline/app/index.html
April 10, 2018

Brazil Cotton
Source: IBGE Brazil
* State-Level Production(as % of total)
Mato GrossoBahiaGoiasMato Grosso do SulSao PauloMinas GeraisMaranhaoParanaPiauiOther States
5028
8433111
~1
* 2005 to 2009 Average
Major
Cotton Production*Average (2005-09)
IntensityProductionMinor
*Source: IBGE
Rio Grandedo Sul
SantaCatarina
Mato GrossoBahia
Mato Grossodo Sul
Parana
SaoPaulo
MinasGerais
Goias
Tocantins
Maranhao
Piaui
a – Cearab – Rio Grande do Nortec – Paraibad – Pernambucoe – Alagoasf – Sergipeh – Espirito Santoi – Rio de Janeiro
abc
de
f
h
i
Para
Amazonas
Rondonia
Roraima
Amapa
Acre
JAN FEB MAR APR MAY JUN JUL AUG SEP OCT NOV DEC
Cotton crop calendar for most of Center-South BrazilPlanting
Harvesting
JAN FEB MAR APR MAY JUN JUL AUG SEP OCT NOV DEC
Cotton crop calendar for most of Northeastern Brazil
Period of Highest Intensity
Period of Highest IntensityPlantingHarvesting
Agricultural Weather AssessmentsWorld Agricultural Outlook Board April 10, 2018

Foreign Agricultural ServiceOffice of Global AnalysisIPA Division
Site visit to new AMPA/SENAR facility in Sorriso:• 200+ hectares• field trials for cotton and soybeans• research pest and disease resistance• training on equipment, applications,
pivot irrigation• main focus is to increase efficiencies.
April 10, 2018

1000
1100
1200
1300
1400
1500
1600
1700
0
500
1,000
1,500
2,000
2,500
2007
/200
8
2008
/200
9
2009
/201
0
2010
/201
1
2011
/201
2
2012
/201
3
2013
/201
4
2014
/201
5
2015
/201
6
2016
/201
7
2017
/201
8F
kilo
gram
/Hec
tare
Thou
sand
Hec
tare
s or M
etric
Tons
BRAZIL Cotton
Area Production Yield Source: USDA FAS PSD
Foreign Agricultural ServiceOffice of Global AnalysisIPA Division
2017/18 Production up on higher area and yieldArea 1.18 mha, Yield 1.61 mt/ha Production 8.7 MBales, 1.89 mmt
April 10, 2018

Brazil Rice
Source: IBGE Brazil
* State-Level Production(as % of total)
Rio Grande do SulSanta CatarinaMato GrossoMaranhaoParaTocantinsGoiasMato Grosso do SulPiauiMinas GeraisParanaRondoniaRoraimaOther States
57996332222111
~3* 2005 to 2009 Average
Major
Rice Production*Average (2005-09)
IntensityProductionMinor
*Source: IBGE
Rio Grandedo Sul
SantaCatarina
Mato GrossoBahia
Mato Grossodo Sul
Parana
SaoPaulo
MinasGerais
Goias
Tocantins
Maranhao
Piaui
a – Cearab – Rio Grande do Nortec – Paraibad – Pernambucoe – Alagoasf – Sergipeh – Espirito Santoi – Rio de Janeiro
abc
de
f
h
i
Para
Amazonas
Rondonia
Roraima
Amapa
Acre
JAN FEB MAR APR MAY JUN JUL AUG SEP OCT NOV DEC
Rice crop calendar for most of Center-South BrazilPLANT
HARVEST
JAN FEB MAR APR MAY JUN JUL AUG SEP OCT NOV DEC
Rice crop calendar for most of Northeastern BrazilPLANT
HARVEST
Agricultural Weather AssessmentsWorld Agricultural Outlook Board April 10, 2018
Foreign Agricultural ServiceOffice of Global AnalysisIPA Division
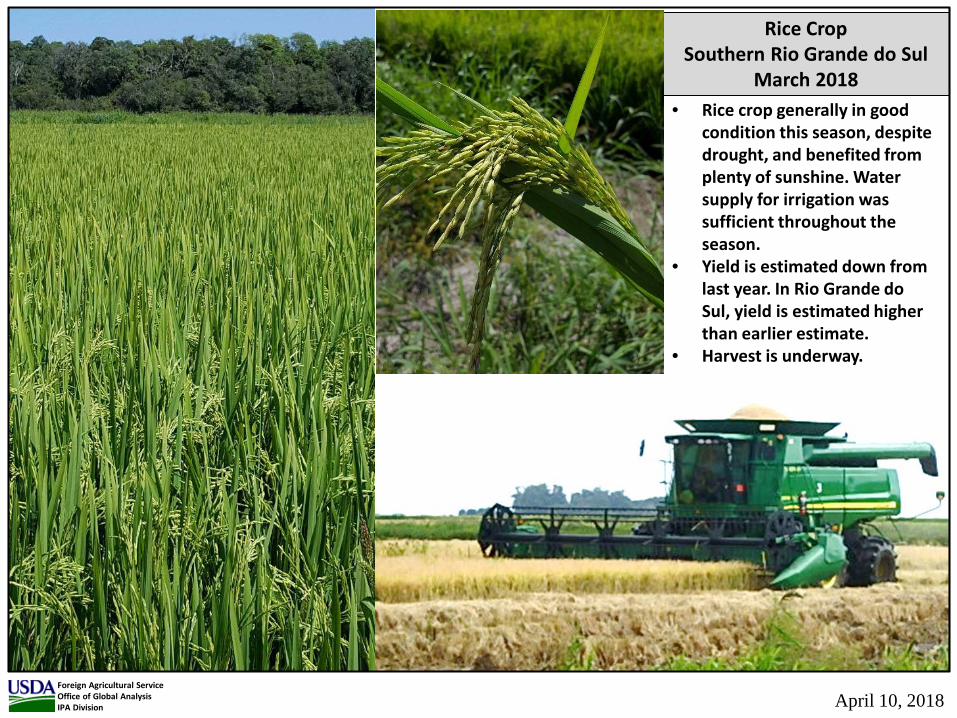
Rice CropSouthern Rio Grande do Sul
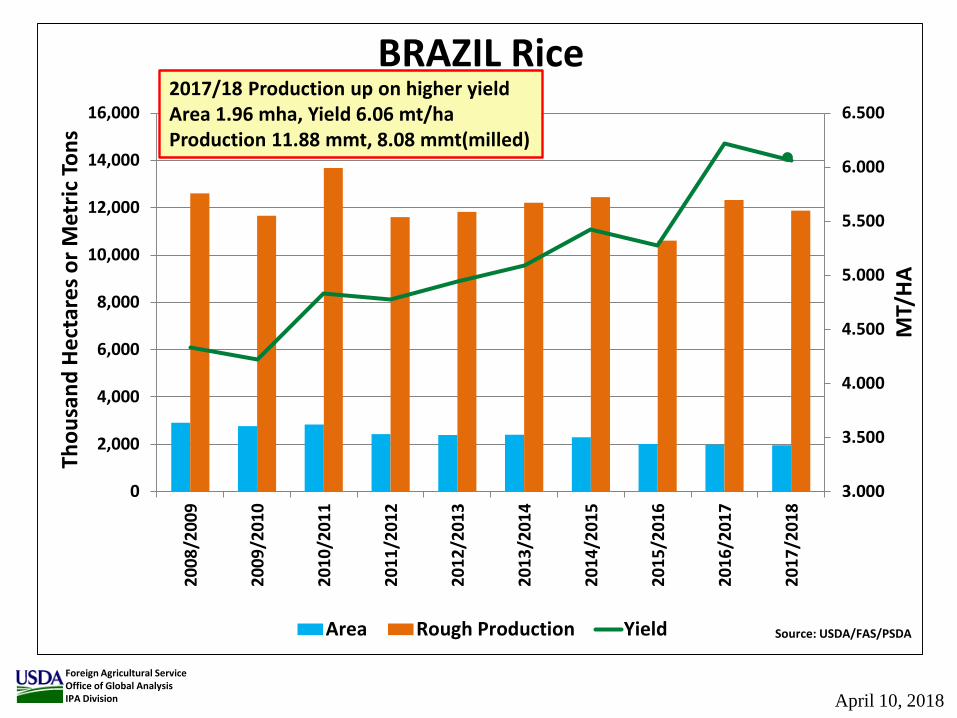
March 2018 • Rice crop generally in good
condition this season, despite drought, and benefited from plenty of sunshine. Water supply for irrigation was sufficient throughout the season.
• Yield is estimated down from last year. In Rio Grande do Sul, yield is estimated higher than earlier estimate.
• Harvest is underway.
April 10, 2018
3.000
3.500
4.000
4.500
5.000
5.500
6.000
6.500
0
2,000
4,000
6,000
8,000
10,000
12,000
14,000
16,000
2008
/200
9
2009
/201
0
2010
/201
1
2011
/201
2
2012
/201
3
2013
/201
4
2014
/201
5
2015
/201
6
2016
/201
7
2017
/201
8
MT/
HA
Thou
sand
Hec
tare
s or M
etric
Tons
BRAZIL Rice
Area Rough Production Yield Source: USDA/FAS/PSDA
Foreign Agricultural ServiceOffice of Global AnalysisIPA Division
2017/18 Production up on higher yieldArea 1.96 mha, Yield 6.06 mt/ha Production 11.88 mmt, 8.08 mmt(milled)
April 10, 2018
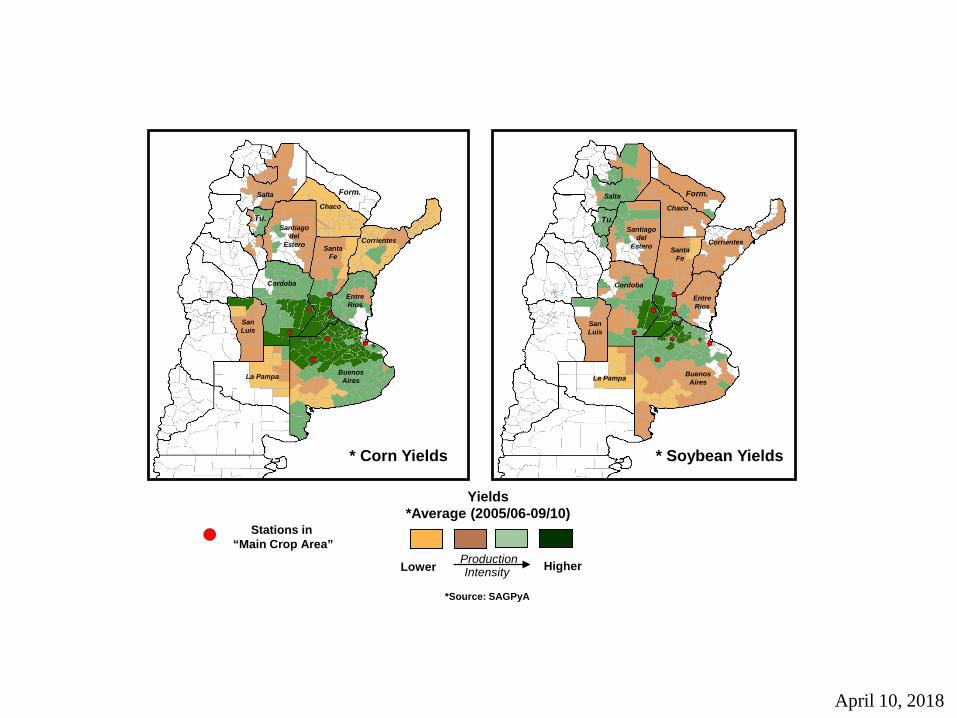
Higher
Yields*Average (2005/06-09/10)
IntensityProductionLower
*Source: SAGPyA
* Corn Yields
Stations in “Main Crop Area”
BuenosAiresLa Pampa
EntreRios
SantaFe
Cordoba
Chaco
Santiagodel
Estero
SanLuis
Salta
Corrientes
Form.
Tu.
BuenosAiresLa Pampa
EntreRios
SantaFe
Cordoba
Chaco
Santiagodel
Estero
SanLuis
Salta
Corrientes
Form.
Tu.
* Soybean Yields
April 10, 2018

Jan Lockup
2017/18
Average
ConsensusDeclining Condition,
But Time For Improvement
Several analogs showing possibility of improvement
Agricultural Weather AssessmentsWorld Agricultural Outlook Board April 10, 2018
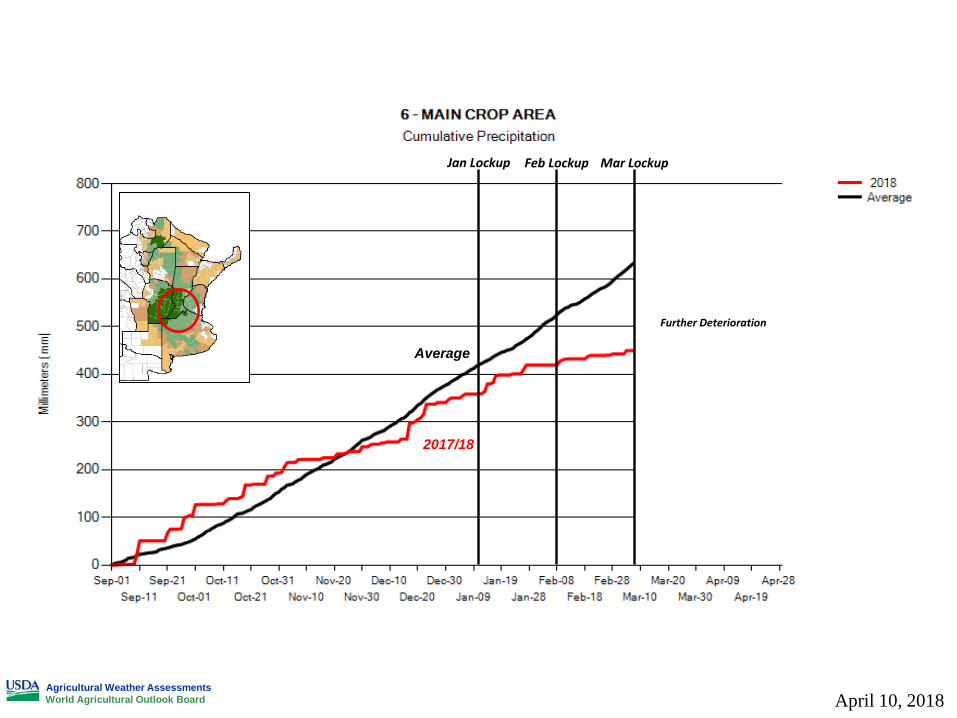
Jan Lockup
2017/18
Mar Lockup
Further Deterioration
Feb Lockup
Average
Agricultural Weather AssessmentsWorld Agricultural Outlook Board April 10, 2018
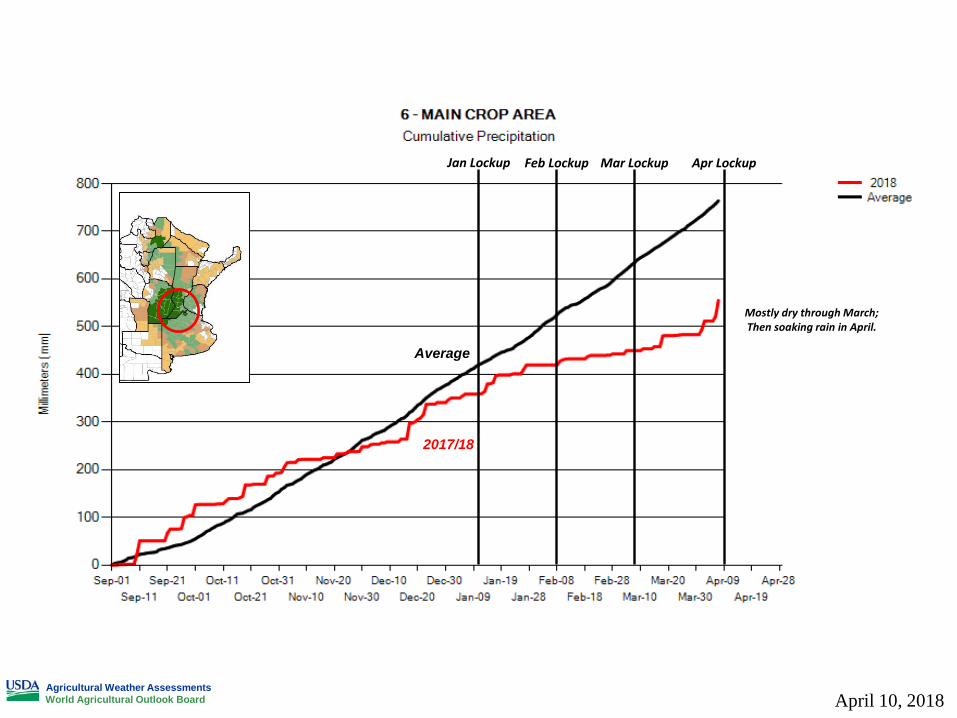
Jan Lockup
2017/18
Mar Lockup
Mostly dry through March;Then soaking rain in April.
Feb Lockup Apr Lockup
Average
Agricultural Weather AssessmentsWorld Agricultural Outlook Board April 10, 2018

Agricultural Weather AssessmentsWorld Agricultural Outlook Board April 10, 2018
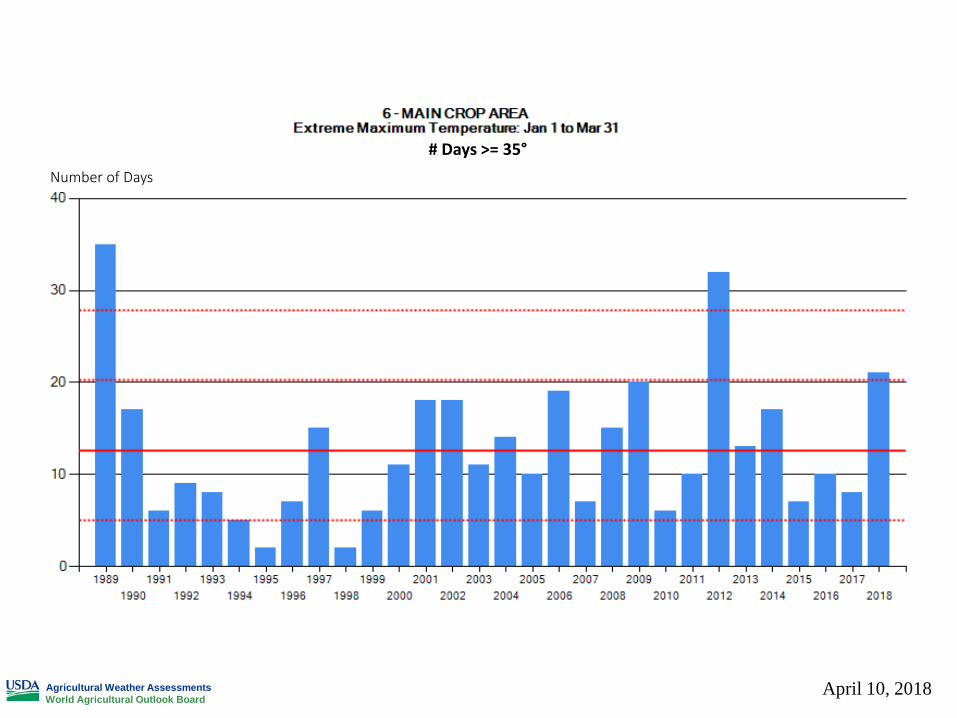
# Days >= 35°
Agricultural Weather AssessmentsWorld Agricultural Outlook Board
April 10, 2018
Number of Days

April 10, 2018
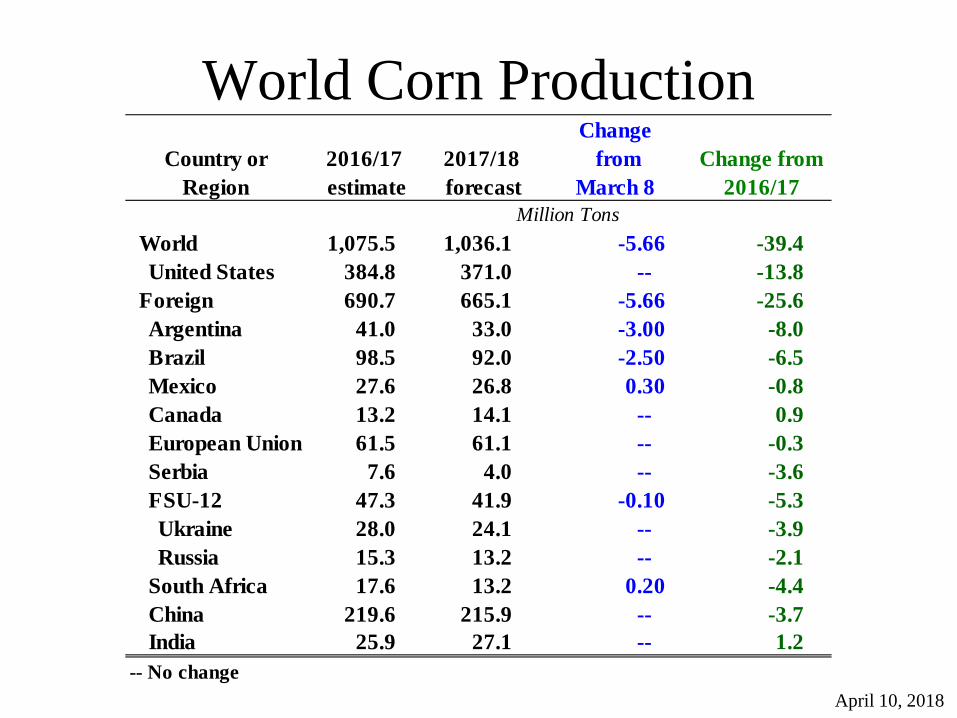
World Corn Production
April 10, 2018
Country or Region
2016/17 estimate
2017/18 forecast
Change from
March 8Change from
2016/17
World 1,075.5 1,036.1 -5.66 -39.4United States 384.8 371.0 -- -13.8
Foreign 690.7 665.1 -5.66 -25.6Argentina 41.0 33.0 -3.00 -8.0Brazil 98.5 92.0 -2.50 -6.5Mexico 27.6 26.8 0.30 -0.8Canada 13.2 14.1 -- 0.9European Union 61.5 61.1 -- -0.3Serbia 7.6 4.0 -- -3.6FSU-12 47.3 41.9 -0.10 -5.3Ukraine 28.0 24.1 -- -3.9Russia 15.3 13.2 -- -2.1
South Africa 17.6 13.2 0.20 -4.4China 219.6 215.9 -- -3.7India 25.9 27.1 -- 1.2
-- No change
Million Tons

World Corn Supply and Use2016/17 estimate
2017/18 forecast
Change from
March 8Change from
2016/17
Beginning stocks 213.9 230.9 -1.0 17.0Production 1,075.5 1,036.1 -5.7 -39.4Total Supply 1,289.4 1,267.0 -6.6 -22.5
Feed use 632.0 650.0 -3.8 18.0Total use 1,058.5 1,069.2 -5.2 10.7
Trade 159.8 152.6 -3.4 -7.2Ending Stocks 230.9 197.8 -1.4 -33.1
Million Tons
April 10, 2018

U.S. Corn Supply and Demand
April 10, 2018
2016/17 estimate
2017/18 forecast
Change from
March 8Change from
2016/17
Planted area (million acres) 94.0 90.2 -- -3.8Harvested area (million acres) 86.7 82.7 -- -4.0Yield (bushels per acre) 174.6 176.6 -- 2.0
Million bushelsBeginning stocks 1,737 2,293 -- 556Production 15,148 14,604 -- -544Imports 57 50 -- -7Total supply 16,942 16,947 -- 5
Feed and residual 5,472 5,500 -50 28Food, seed, and industrial 6,883 7,040 -5 157Ethanol 5,432 5,575 -- 143Domestic use 12,356 12,540 -55 184
Exports 2,293 2,225 -- -68Total use 14,649 14,765 -55 116
Ending stocks 2,293 2,182 55 -111
Stocks to use ratio 15.7 14.8 0.4 -0.9
Average market price 3.36 3.20/3.50 -- -0.01-- No change
Percent
Dollars per bushel

World Soybean Production
April 10, 2018
Country or Region
2016/17 estimate
2017/18 forecast
Change from
March 8Change from
2016/17
World 350.8 334.8 -6.1 -16.0United States 116.9 119.5 -- 2.6
Foreign 233.8 215.3 -6.1 -18.6Argentina 57.8 40.0 -7.0 -17.8Brazil 114.1 115.0 2.0 0.9Paraguay 10.7 9.2 -- -1.5Canada 6.6 8.0 -- 1.4India 11.0 9.0 -0.5 -2.0China 12.9 14.2 -- 1.3
-- No change
Million Tons

World Soybean Supply and Use
April 10, 2018
2016/17 estimate
2017/18 forecast
Change from
March 8Change from
2016/17
Beginning stocks 78.5 96.7 0.1 18.2Production 350.8 334.8 -6.1 -16.0Total Supply 429.3 431.5 -6.0 2.3
Domestic crush 288.2 299.2 -1.6 11.0Total use 329.4 342.0 -1.7 12.6
Trade 147.5 150.4 -0.2 2.9Ending Stocks 96.7 90.8 -3.6 -5.9
Addendum:Beginning stocksArgentina plus Brazil 50.2 61.7 -- 11.5
Imports*China 93.5 97.0 -- 3.5
-- No change*From all Sources
Million Tons
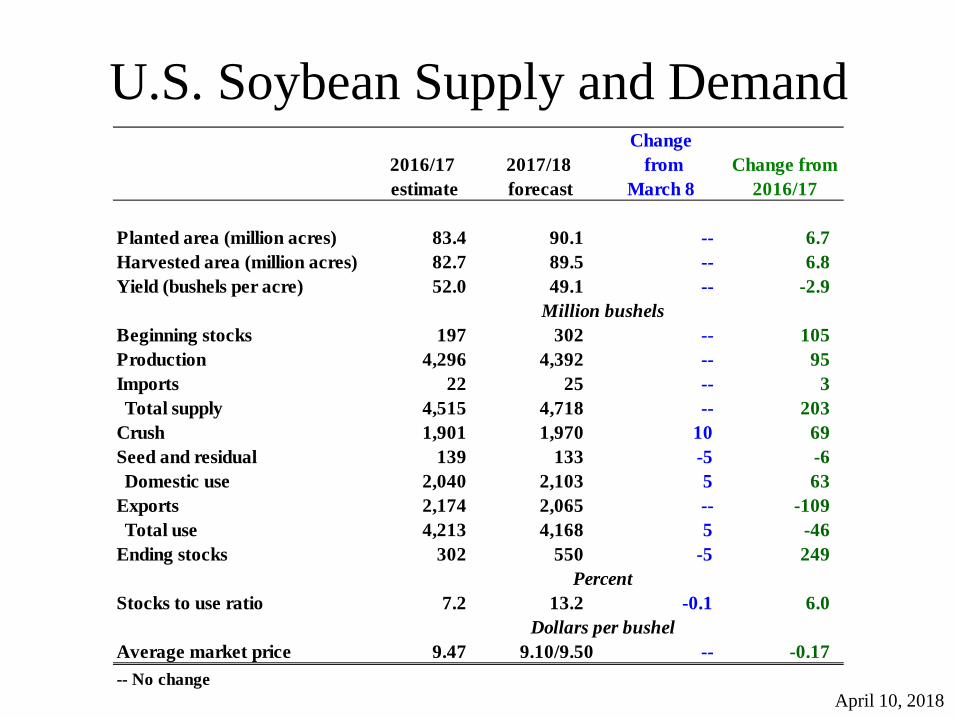
U.S. Soybean Supply and Demand
April 10, 2018
2016/17 estimate
2017/18 forecast
Change from
March 8Change from
2016/17
Planted area (million acres) 83.4 90.1 -- 6.7Harvested area (million acres) 82.7 89.5 -- 6.8Yield (bushels per acre) 52.0 49.1 -- -2.9
Million bushelsBeginning stocks 197 302 -- 105Production 4,296 4,392 -- 95Imports 22 25 -- 3Total supply 4,515 4,718 -- 203
Crush 1,901 1,970 10 69Seed and residual 139 133 -5 -6Domestic use 2,040 2,103 5 63
Exports 2,174 2,065 -- -109Total use 4,213 4,168 5 -46
Ending stocks 302 550 -5 249Percent
Stocks to use ratio 7.2 13.2 -0.1 6.0
Average market price 9.47 9.10/9.50 -- -0.17-- No change
Dollars per bushel

World Cotton Production
April 10, 2018
Country or Region2016/17 estimate
2017/18 forecast
Change from
March 8Change from
2016/17
World 106.8 122.2 0.25 15.4United States 17.2 21.0 -- 3.9
Foreign 89.6 101.2 0.25 11.6Argentina 0.8 0.8 -0.02 0.1Brazil 7.0 8.7 0.70 1.7Turkey 3.2 4.0 -- 0.8Australia 4.1 4.7 -- 0.7China 22.8 27.5 -- 4.8India 27.0 28.5 -- 1.5Pakistan 7.7 8.2 -- 0.5Uzbekistan 3.7 3.6 -- -0.1African Franc Zone 5.1 5.2 -- 0.1
-- No change
Million Bales

World Cotton Supply and Use
April 10, 2018
2016/17 estimate
2017/18 forecast
Change from
March 8Change from
2016/17
Beginning stocks 94.9 86.8 -0.90 -8.1Production 106.8 122.2 0.25 15.4Total Supply 201.7 209.0 -0.66 7.3
Consumption 114.8 120.4 -0.41 5.6Trade 37.5 39.1 0.23 1.5Ending Stocks 86.8 88.3 -0.55 1.5
Addendum:China Ending Stocks 48.4 41.0 -- -7.5
-- No change
Million Bales

U.S. Cotton Supply and Demand
April 10, 2018
2016/17 estimate
2017/18 forecast
Change from
March 8Change from
2016/17
Planted area (million acres) 10.07 12.61 -- 2.54Harvested area (million acres) 9.51 11.35 -- 1.84Yield (pounds per acre) 867 889 -- 22
Million balesBeginning stocks 3.80 2.75 -- -1.05Imports 0.01 0.01 -- 0.00Production 17.17 21.03 -- 3.86Total supply 20.98 23.79 -- 2.81
Mill use 3.25 3.35 -- 0.10Exports 14.92 15.00 0.20 0.08Total use 18.17 18.35 0.20 0.18
Unaccounted 0.06 0.14 -- 0.08Ending stocks 2.75 5.30 -0.20 2.55
PercentStocks/use 15.1 28.9 -1.4 13.7
Average market price 68.00 67.0/69.0 -1.0 0.00-- No change
Cents per pound
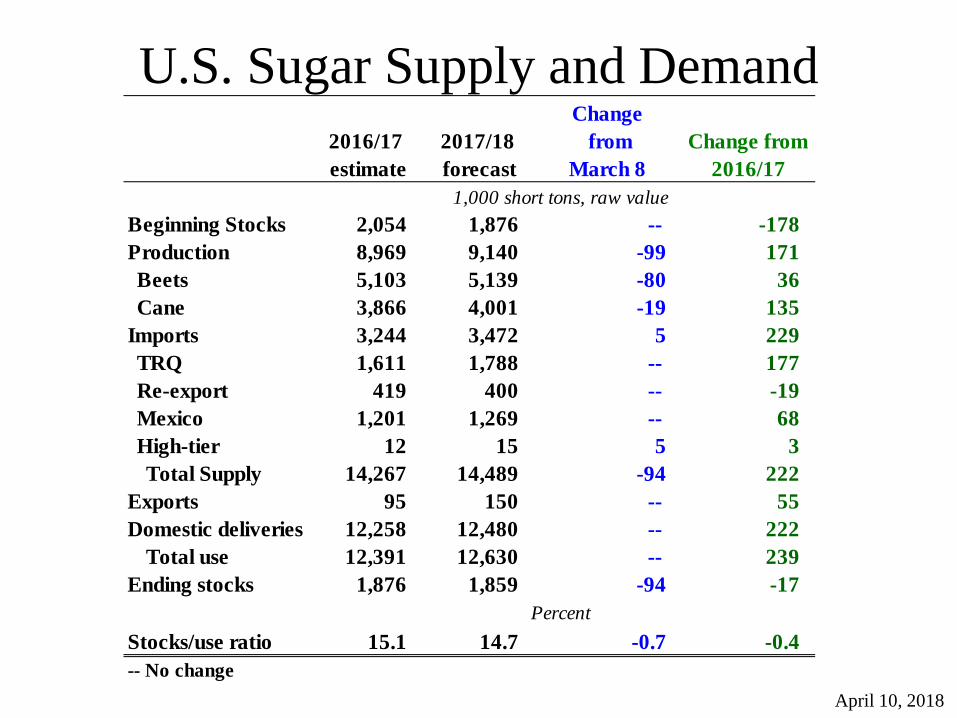
U.S. Sugar Supply and Demand
April 10, 2018
2016/17 estimate
2017/18 forecast
Change from
March 8Change from
2016/17
Beginning Stocks 2,054 1,876 -- -178Production 8,969 9,140 -99 171Beets 5,103 5,139 -80 36Cane 3,866 4,001 -19 135
Imports 3,244 3,472 5 229TRQ 1,611 1,788 -- 177Re-export 419 400 -- -19Mexico 1,201 1,269 -- 68High-tier 12 15 5 3Total Supply 14,267 14,489 -94 222
Exports 95 150 -- 55Domestic deliveries 12,258 12,480 -- 222
Total use 12,391 12,630 -- 239Ending stocks 1,876 1,859 -94 -17
PercentStocks/use ratio 15.1 14.7 -0.7 -0.4-- No change
1,000 short tons, raw value

Mexico Sugar Supply and Demand
April 10, 2018
2016/17 estimate
2017/18 forecast
Change from
March 8Change from
2016/17
Beginning stocks 1,037 1,002 -- -35Production 5,957 6,050 -- 93Imports 93 170 -- 77Total Supply 7,087 7,222 -- 135
Domestic use 4,851 4,886 -- 35Exports 1,234 1,347 -- 114Total Use 6,085 6,233 -- 149
Ending stocks 1,002 989 -- -13-- No change
Thousand MT

U.S. Meat Production and Prices
April 10, 2018
2017estimate
2018 forecast
Change from
March 8Change from
2017ProductionBeef 26.17 27.64 -0.05 1.46Pork 25.58 26.81 -0.11 1.22Broilers 41.66 42.35 -0.25 0.69Turkey 5.98 5.95 -0.03 -0.04Total meat 100.15 103.49 -0.43 3.34
Prices Dollars/cwtSteers 121.52 116.40 -3.22 -5.11Hogs 50.48 45.78 -2.60 -4.70
Cents/lbBroilers 93.5 95.4 4.0 1.9Turkey 96.1 84.3 -4.0 -11.8
Billion pounds

U.S. Meat TradeMillion Pounds
April 10, 2018
2017estimate
2018 forecast
Change from
March 8Change from
2017
Beef 2,862 3,025 -- 163Pork 5,632 5,900 -25 268Broilers 6,780 6,950 -- 170Turkey 621 645 10 24Mature Chickens 130 125 -20 -5
Total meat 16,032 16,653 -35 621Imports
Beef 2,994 3,040 -- 46-- No change
Exports

U.S. Milk Supply and Demand
April 10, 2018
2017estimate
2018 forecast
Change from
March 8Change from
2017
Production 215.5 219.0 0.0 3.6Fat BasisImports 6.0 5.6 -0.1 -0.4Commercial use 210.4 214.7 -0.1 4.2Exports 9.3 9.6 -0.0 0.3
Skim-solid BasisImports 6.1 5.9 -- -0.2Commercial use 177.5 180.9 -0.7 3.4Exports 40.8 43.4 0.6 2.6
-- No change
Billion pounds

U.S. Dairy Product Prices
April 10, 2018
2017estimate
2018 forecast
Change from
March 8Change from
2017
Product pricesCheese 1.63 1.57 -0.00 -0.06Butter 2.33 2.25 -0.01 -0.08Nonfat dry milk 0.87 0.72 -0.00 -0.14Dry whey 0.44 0.25 -0.03 -0.19
Class prices Dollars/cwtClass III 16.17 14.45 -0.15 -1.72Class IV 15.16 13.55 -0.05 -1.61All milk 17.63 15.85 -0.20 -1.78
Dollars/pound
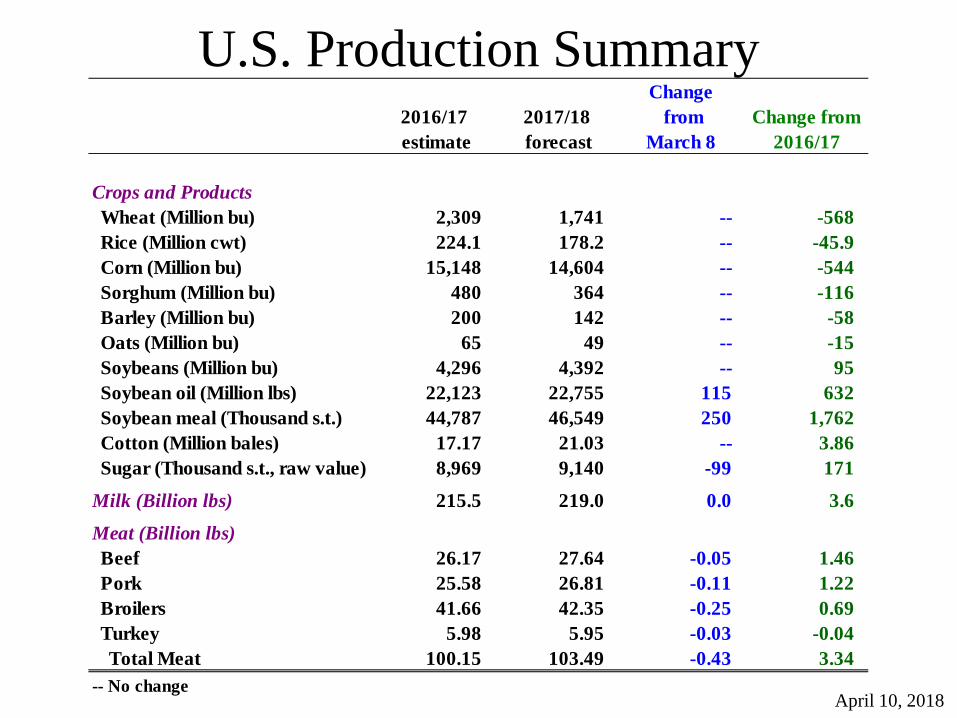
U.S. Production Summary
April 10, 2018
2016/17 estimate
2017/18 forecast
Change from
March 8Change from
2016/17
Crops and ProductsWheat (Million bu) 2,309 1,741 -- -568Rice (Million cwt) 224.1 178.2 -- -45.9Corn (Million bu) 15,148 14,604 -- -544Sorghum (Million bu) 480 364 -- -116Barley (Million bu) 200 142 -- -58Oats (Million bu) 65 49 -- -15Soybeans (Million bu) 4,296 4,392 -- 95Soybean oil (Million lbs) 22,123 22,755 115 632Soybean meal (Thousand s.t.) 44,787 46,549 250 1,762Cotton (Million bales) 17.17 21.03 -- 3.86Sugar (Thousand s.t., raw value) 8,969 9,140 -99 171
Milk (Billion lbs) 215.5 219.0 0.0 3.6
Meat (Billion lbs)Beef 26.17 27.64 -0.05 1.46Pork 25.58 26.81 -0.11 1.22Broilers 41.66 42.35 -0.25 0.69Turkey 5.98 5.95 -0.03 -0.04Total Meat 100.15 103.49 -0.43 3.34
-- No change

Domestic Demand Summary
April 10, 2018
2016/17 estimate
2017/18 forecast
Change from
March 8Change from
2016/17
Crops and ProductsWheat (Million bu) 1,167 1,087 -30 -80Rice (Million cwt) 131.4 120.0 -- -11.4Corn (Million bu) 12,356 12,540 -55 184Sorghum (Million bu) 245 125 -5 -120Barley (Million bu) 201 187 -10 -14Oats (Million bu) 158 163 -5 5Soybeans (Million bu) 2,040 2,103 5 63Soybean oil (Million lbs) 19,862 20,800 -200 938Soybean meal (Thousand s.t.) 33,399 34,550 250 1,151Cotton (Million bales) 3.25 3.35 -- 0.10Sugar (Thousand s.t., raw value) 12,258 12,480 -- 222
Milk (Billion lbs, fat basis) 210.4 214.7 -0.1 4.2
Meat (Billion lbs)Beef 26.48 27.69 -0.03 1.21Pork 21.03 21.93 -0.06 0.90Broilers 34.48 35.10 -0.25 0.62Turkey 5.35 5.33 -0.04 -0.03Total meat 88.23 90.93 -0.36 2.70
-- No change

U.S. Export Summary
April 10, 2018
2016/17 estimate
2017/18 forecast
Change from
March 8Change from
2016/17
Crops and productsWheat (Million bu) 1,055 925 -- -130Rice (Million cwt) 116.7 96.0 -4.0 -20.7Corn (Million bu) 2,293 2,225 -- -68Sorghum (Million bu) 241 245 -- 4Barley (Million bu) 4 6 -- 2Soybeans (Million bu) 2,174 2,065 -- -109Soybean oil (Million lbs) 2,556 2,000 100 -556Soybean meal (Thousand s.t.) 11,601 12,500 100 899Cotton (Million bales) 14.92 15.00 0.20 0.08
Meat (Million lbs)Beef 2,862 3,025 -- 163Pork 5,632 5,900 -25 268Broilers 6,780 6,950 -- 170Turkey 621 645 10 24Mature Chickens 130 125 -20 -5Total meat 16,032 16,653 -35 621
-- No change

Price Summary
April 10, 2018
2016/17 estimate
2017/18 forecast
Change from
March 8Change from
2016/17
Crops and productsWheat ($/bu) 3.89 4.65 -- 0.76Rice ($/cwt) 10.40 12.60 0.10 2.20Corn ($/bu) 3.36 3.35 -- -0.01Soybeans ($/bu) 9.47 9.30 -- -0.17Soybean oil (¢/lb) 32.48 31.50 -- -0.98Soybean meal ($/s.t.) 316.88 350.00 10.00 33.12Cotton (¢/lb) 68.00 68.00 -1.00 0.00
LivestockSteers ($/cwt) 121.52 116.40 -3.22 -5.11Hogs ($/cwt) 50.48 45.78 -2.60 -4.70Broilers (¢/lb) 93.5 95.4 4.0 1.9Turkeys (¢/lb) 96.1 84.3 -4.0 -11.8
Dairy productsCheese 1.63 1.57 0.00 -0.06Butter 2.33 2.25 -0.01 -0.08Nonfat dry milk 0.87 0.72 -0.00 -0.14Dry whey 0.44 0.25 -0.03 -0.19
Milk classesClass III ($/cwt) 16.17 14.45 -0.15 -1.72Class IV ($/cwt) 15.16 13.55 -0.05 -1.61All milk ($/cwt) 17.63 15.85 -0.20 -1.78
-- No change
Related Documents