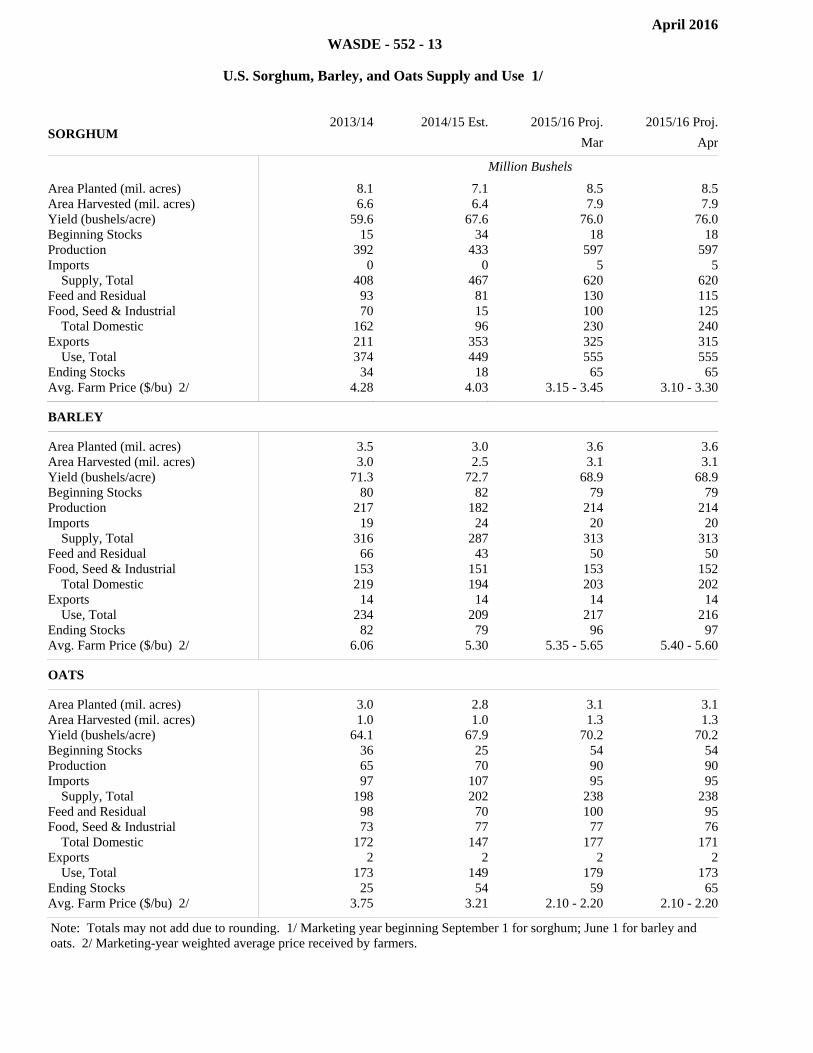
ISSN: 1554-9089 World Agricultural Supply and Demand Estimates Office of the Chief Economist Agricultural Marketing Service Farm Service Agency Economic Research Service Foreign Agricultural Service WASDE - 552 Approved by the World Agricultural Outlook Board April 12, 2016 WHEAT: U.S. wheat endings stocks for 2015/16 are projected 10 million bushels higher on reduced feed and residual use. At 976 million bushels, these would be the largest ending stocks since 1987. The reduced feed and residual use reflects lower disappearance during the December-February and September-November quarters as indicated by March 1 stocks and revised December 1 stocks, both from the March 31 Grain Stocks report. The projected season-average farm price is lowered $0.10 on the high end to $4.90 to $5.00. Global 2015/16 wheat supplies are raised 1.0 million tons primarily on increased production, which is a record 733.1 million tons. EU production is raised 1.5 million tons to a record 160.0 million, and Argentina is raised 0.3 million tons to 11.3 million, both on updated government data. Partially offsetting are a 0.6-million-ton reduction for Ethiopia, and a 0.4-million-ton reduction for Pakistan. World exports are raised 0.4 million tons to 163.1 million. World wheat consumption for 2015/16 is lowered 0.7 million tons on both reduced feed and food use. With supplies rising and use declining, global ending stocks are raised 1.7 million tons to 239.3 million, and remain record large. COARSE GRAINS: U.S. feed grain ending stocks for 2015/16 are projected higher with increases for corn, barley, and oats based on indicated disappearance as reported in the March 31 Grain Stocks and adjustments to seed use based on intended acreage from Prospective Plantings. Corn feed and residual use is projected 50 million bushels lower reflecting indicated disappearance through the first half of the marketing year. Corn use in ethanol production is projected 25 million bushels higher on a stronger-than-expected pace of weekly ethanol production through March as reported by the Energy Information Administration. Projected corn ending stocks are raised 25 million bushels. The projected season-average farm price for corn is lowered 5 cents at the midpoint to $3.55 per bushel, with the range lowered 10 cents on the high end. Offsetting usage changes are made for 2015/16 U.S. sorghum this month. Projected feed and residual use is lowered 15 million bushels based on the March 1 stocks. Sorghum food, seed, and industrial use is projected 25 million bushels higher based on robust use of sorghum to make ethanol during February as indicated in the latest Grain Crushings and Co-Products Production report. Projected exports are lowered 10 million bushels as sales have declined sharply in recent weeks. The sorghum farm price range is projected 10 cents lower at the midpoint to $3.20 per bushel as discounts to corn remain large in the latest data.

Welcome message from author
This document is posted to help you gain knowledge. Please leave a comment to let me know what you think about it! Share it to your friends and learn new things together.
Transcript

ISSN: 1554-9089
World Agricultural Supply and Demand Estimates
Office of the Chief Economist
Agricultural Marketing Service Farm Service Agency
Economic Research Service Foreign Agricultural Service
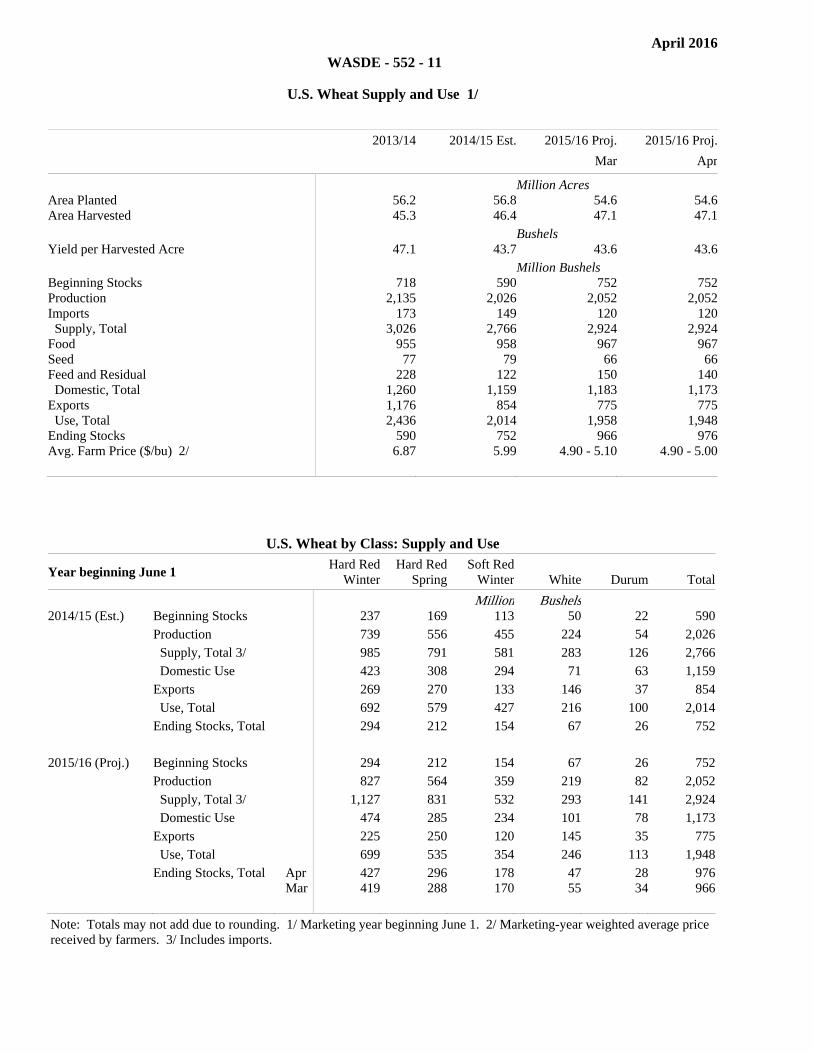
WASDE - 552 Approved by the World Agricultural Outlook Board April 12, 2016 WHEAT: U.S. wheat endings stocks for 2015/16 are projected 10 million bushels higher on reduced feed and residual use. At 976 million bushels, these would be the largest ending stocks since 1987. The reduced feed and residual use reflects lower disappearance during the December-February and September-November quarters as indicated by March 1 stocks and revised December 1 stocks, both from the March 31 Grain Stocks report. The projected season-average farm price is lowered $0.10 on the high end to $4.90 to $5.00. Global 2015/16 wheat supplies are raised 1.0 million tons primarily on increased production, which is a record 733.1 million tons. EU production is raised 1.5 million tons to a record 160.0 million, and Argentina is raised 0.3 million tons to 11.3 million, both on updated government data. Partially offsetting are a 0.6-million-ton reduction for Ethiopia, and a 0.4-million-ton reduction for Pakistan. World exports are raised 0.4 million tons to 163.1 million. World wheat consumption for 2015/16 is lowered 0.7 million tons on both reduced feed and food use. With supplies rising and use declining, global ending stocks are raised 1.7 million tons to 239.3 million, and remain record large. COARSE GRAINS: U.S. feed grain ending stocks for 2015/16 are projected higher with increases for corn, barley, and oats based on indicated disappearance as reported in the March 31 Grain Stocks and adjustments to seed use based on intended acreage from Prospective Plantings. Corn feed and residual use is projected 50 million bushels lower reflecting indicated disappearance through the first half of the marketing year. Corn use in ethanol production is projected 25 million bushels higher on a stronger-than-expected pace of weekly ethanol production through March as reported by the Energy Information Administration. Projected corn ending stocks are raised 25 million bushels. The projected season-average farm price for corn is lowered 5 cents at the midpoint to $3.55 per bushel, with the range lowered 10 cents on the high end. Offsetting usage changes are made for 2015/16 U.S. sorghum this month. Projected feed and residual use is lowered 15 million bushels based on the March 1 stocks. Sorghum food, seed, and industrial use is projected 25 million bushels higher based on robust use of sorghum to make ethanol during February as indicated in the latest Grain Crushings and Co-Products Production report. Projected exports are lowered 10 million bushels as sales have declined sharply in recent weeks. The sorghum farm price range is projected 10 cents lower at the midpoint to $3.20 per bushel as discounts to corn remain large in the latest data.
WASDE-552-2
Global coarse grain supplies for 2015/16 are projected 0.3 million tons higher with a number of mostly offsetting changes. Corn production is raised 1.0 million tons for Argentina, as timely rain during February and March was beneficial following some dryness and heat during January. Barley production for Argentina is raised 0.6 million tons on greater area and better-than-expected yields. Argentina corn production is also revised 1.7 million tons higher for 2014/15. Mali corn production for 2015/16 is 0.6 million tons higher following favorable summer rain over the main production areas. Sorghum output is lowered 3.1 million tons for Sudan and 1.2 million tons for Ethiopia, as El Niño conditions over the past year reduced rain in key growing areas. There are also a number of other smaller changes to coarse grains production in several other countries of Sub-Saharan Africa. Elsewhere, corn production is raised 0.5 million tons for both Mexico and Serbia. Production is raised for Mexico reflecting the latest government statistics which indicate higher winter planted area in Sinaloa. The change for Serbia is based on the latest government revisions for the crop that was grown last summer. Global coarse grain exports for 2015/16 are raised 3.5 million tons as increases for corn and barley more than offset a small reduction for sorghum. Corn exports are raised 2.0 million tons for Argentina, 0.3 million tons each for the EU and Russia, and 0.2 million tons for Ukraine. Vietnam corn imports are raised 2.0 million tons, reflecting trade data and updated estimates for feed and residual disappearance. Corn imports for the EU are lowered 1.0 million tons, on a slowing import license pace and large, competitively priced wheat supplies, which are expected to support greater domestic wheat feeding. Corn consumption for Japan is revised lower for several years reflecting official government statistics. Barley exports are raised for the EU and Argentina with higher imports for Saudi Arabia and Iran. Sorghum imports are lowered for China but raised for Mexico. China corn feeding is raised, offsetting a decline in wheat as internal market prices are expected to favor corn. China corn ending stocks for 2015/16 are lowered 2.0 million tons, but the reduction is more than offset by larger stocks in Japan, the United States, Vietnam, Serbia, and Argentina. Global corn ending stocks are projected 1.9 million tons higher. RICE: U.S. 2015/16 rice supplies are lowered 0.5 million cwt on lower long-grain imports. Long-grain ending stocks are lowered 0.5 million cwt to 22.5 million. All rice ending stocks are now 43.4 million cwt. The all rice and long-grain season-average prices are each lowered $0.30 per cwt at the midpoint to $12.30 to $12.70 and $10.80 to $11.20, respectively. Medium- and short-grain prices are also down with the California price lowered $0.50 per cwt at the midpoint and the Other States price lowered $0.20 per cwt at the midpoint. Global rice supplies for 2015/16 are lowered 0.5 million tons, primarily on reduced production. Brazil and Pakistan production are lowered 0.3 million tons and 0.2 million tons, respectively, both on updated government statistics. Global trade and domestic use projections are both lowered fractionally. Global ending stocks are lowered 0.3 million tons to 90.2 million.

WASDE-552-3
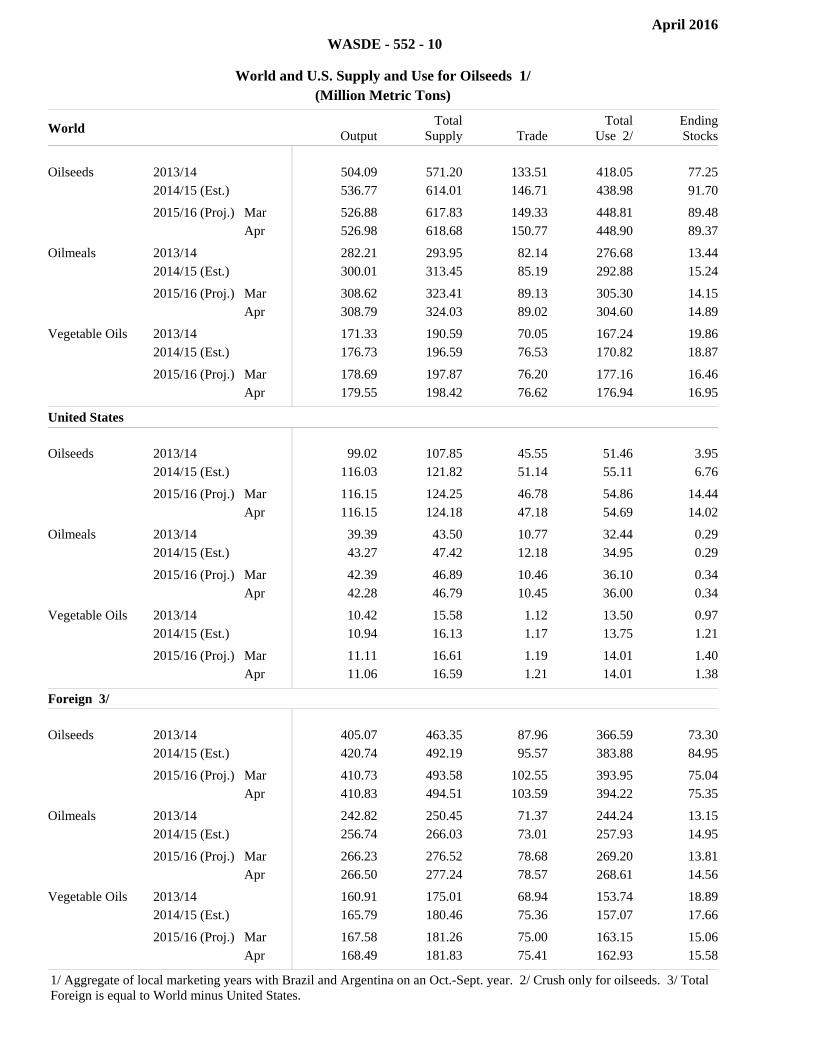
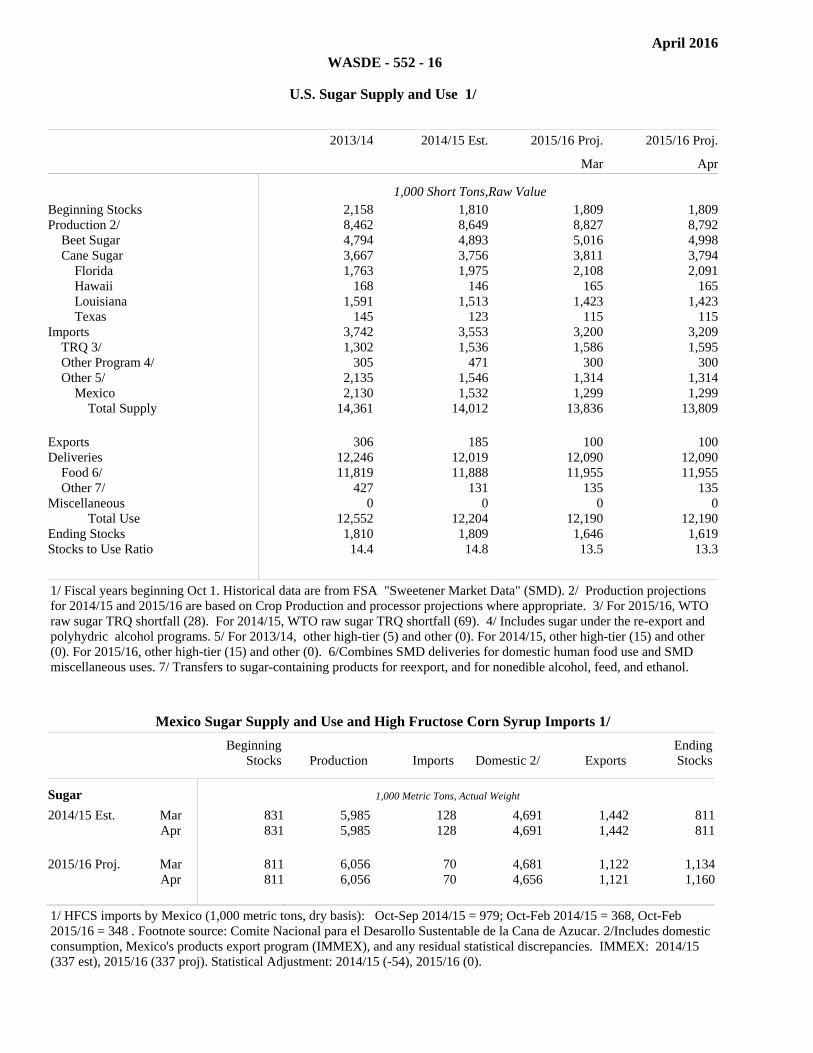
OILSEEDS: U.S. soybean supply and use changes for 2015/16 include higher exports, lower seed use, and lower ending stocks. Soybean exports are increased 15 million bushels to 1,705 million reflecting stronger global soybean imports led by China and several other countries including Iran, Bangladesh, and Mexico. Seed use is reduced slightly in line with plantings indicated in the March 31 Prospective Plantings report. Soybean ending stocks are projected at 445 million bushels, down 15 million from last month. Soybean crush and balance sheets for soybean meal and oil are unchanged. Forecast price ranges for soybeans and products are narrowed this month with midpoints all unchanged. Global oilseed production for 2015/16 is projected at 527.0 million tons, marginally higher than last month, with small, mostly offsetting changes in foreign production. Global soybean production is virtually unchanged at 320.2 million tons as a projected boost to Argentina production offsets a decline for India. Argentina soybean production is projected at 59.0 million tons, up 0.5 million, as a higher forecast yield more than offsets a decline to harvested area. India soybean production is lowered 0.5 million tons to 7.5 million on reduced harvested area and yield. Yields are estimated at just 0.66 tons per hectare, reflecting excessive moisture in Madhya Pradesh and erratic rainfall in Maharashtra. Other changes include reduced soybean production for China, and increased rapeseed production for the EU and China. China sunflowerseed production is also raised, but more than offset by lower forecasts for the EU, Brazil, and Argentina. For 2014/15, global soybean production is raised 1.0 million tons to 319.5 million on a larger estimate for Brazil. Brazil 2014/15 soybean production is boosted as marketing year trade and crush data indicate a larger production estimate. Global oilseed trade for 2015/16 is projected at 150.8 million tons, up 1.4 million mainly reflecting increased soybean trade. Increased exports projected for Brazil and the United States are only partly offset by reductions for Argentina and India. Soybean imports are raised 1.0 million tons to 83.0 million for China reflecting stronger-than-expected imports from Brazil. Higher soybean imports are projected for several other countries including Iran, Japan, Bangladesh, and Mexico. Partly offsetting are soybean import reductions for Vietnam, Egypt, Venezuela, and Chile. Global soybean ending stocks are projected at 79.0 million tons, up 0.2 million with gains for Argentina and China mostly offset with reductions for Brazil and the United States. SUGAR: U.S. sugar production for 2015/16 is decreased by 35,418 short tons, raw value (STRV) due to lower expected sucrose recovery from both sugarbeet slicing and from sugarcane milling in Florida. Imports are increased by 8,646 STRV, mostly due to more calendar year 2016 shipments under Free Trade Agreements occurring in the fiscal year 2015/16 than originally anticipated. Imports from Mexico are lowered slightly on the basis of a rounding adjustment. There are no use changes. Ending stocks for 2015/16 are projected at 1.619 million STRV, implying a stocks-to-use ratio of 13.3 percent.

WASDE-552-4
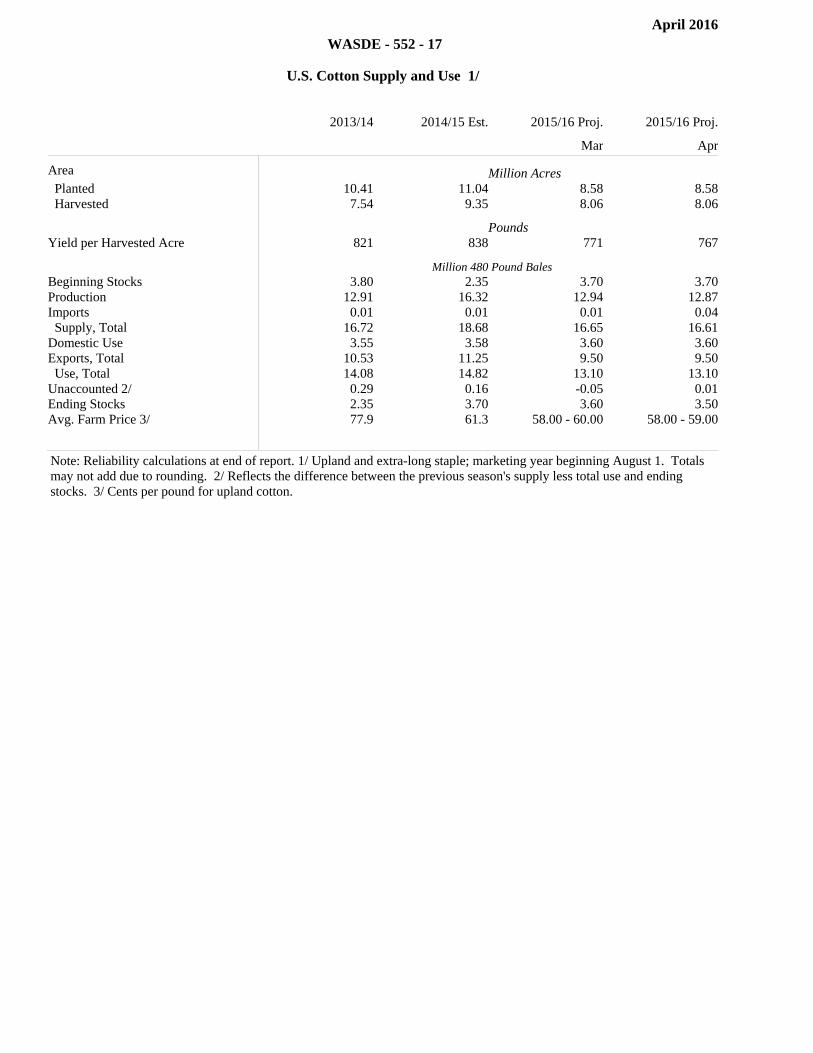
Mexico sugar deliveries for 2015/16 human consumption are lowered by 25,241 metric tons (MT) to 4.319 million. Exports are reduced slightly due to a rounding adjustment. Ending stocks are projected at 1.160 million MT implying a stocks-to-consumption ratio of 26.85 percent. LIVESTOCK, POULTRY, AND DAIRY: The 2016 forecast of total red meat and poultry production is raised from last month as higher expected cattle slaughter and heavier carcass weights more than offset a lower pork production forecast. The Quarterly Hogs and Pigs report, released March 25, estimated that growth in pigs per litter in the first quarter was slower than expected and that producers expected to farrow fewer sows in March-May than previously intended. Coupled with slower-than-expected first quarter slaughter, forecast pork production is reduced. No change is made to broiler and turkey production. The beef import forecast is raised and the export is reduced from last month based on recent trade data. The strength of the U.S. dollar continues to make the United States an attractive market for imports and constrains exports. Pork imports are raised on the strength of the dollar, but improving demand in several importing countries is providing support for increased exports. The broiler export forecast is unchanged from last month, but turkey exports are reduced on a slower pace of export recovery. The cattle price forecast is reduced from last month on relatively weak demand and larger expected fed cattle supplies. Hog prices are lowered on weaker demand. No change is made to 2016 broiler and turkey prices. Egg prices are reduced on weaker demand. The milk production forecast is increased from last month on a slower reduction in the cow inventory and slightly faster growth in milk per cow. Fat basis exports are raised on strong exports of butterfat-containing products, but strong imports of butterfat and cheese supported an increase in the fat basis import forecast. Skim-solids exports and imports are lowered on the pace of trade to date. The butter and nonfat dry milk (NDM) price forecast are reduced from last month on relatively large supplies and continued pressure from weak international prices. Cheese and whey prices are unchanged at the midpoint, but the range is narrowed for cheese. With no change made to cheese and whey, the Class III price is unchanged at the midpoint. The Class IV price is lowered on lower butter and NDM prices. The annual all milk price forecast is unchanged at the midpoint as stronger first-half prices are offset by lower second-half price forecasts. COTTON: The U.S. cotton 2015/16 supply and demand forecasts show only marginal changes from last month. Production is decreased 73,000 bales to reflect USDA’s March Cotton Ginnings report. Domestic mill use and exports are unchanged. With small adjustments to imports and the “unaccounted” residual, ending stocks are lowered 100,000 bales to 3.5 million. The marketing year average price received by producers is

WASDE-552-5
expected to fall between 58.0 and 59.0 cents per pound, a reduction of 1.0 cent at the upper end of the range. The world cotton 2015/16 supply and demand forecasts include lower estimated beginning stocks and production combined with slightly higher consumption, resulting in a 1.1-million-bale reduction in ending stocks. Beginning stocks are lowered about 300,000 bales, mainly for Greece and Malaysia on historical revisions, partly offset by an increase for Brazil. World production is reduced 400,000 bales, with reductions in Côte d’Ivoire, Mali, and Brazil. Consumption is raised for China and Pakistan, but is lowered for Indonesia, Bangladesh, and Turkey. World stocks are now projected at 102.2 million bales. Approved by the Secretary of Agriculture and the Chairman of the World Agricultural Outlook Board, Seth D. Meyer, (202) 720-6030. This report was prepared by the Interagency Commodity Estimates Committees.
APPROVED BY:
ROBERT C. JOHANSSON
SECRETARY OF AGRICULTURE DESIGNATE

WASDE-552-6
INTERAGENCY COMMODITY ESTIMATES COMMITTEES
Note: The World Agricultural Outlook Board reviews and approves the World Agricultural Supply and
Demand Estimates (WASDE) report. The Board’s analysts chair the Interagency Commodity
Estimates Committees (ICECs) that prepare the monthly report.
Wheat: William Chambers, ICEC Chair, WAOB, E-mail: [email protected] Jennifer Bond, ERS; Teresa McKeivier, FAS; Mark Simone, FSA. Rice: William Chambers, ICEC Chair, WAOB, E-mail: wchambers @oce.usda.gov Nathan Childs, ERS; Rachel Trego, FAS; Mark Simone, FSA. Feed Grains: Jerry Norton, ICEC Chair, WAOB, E-mail: [email protected] Thomas Capehart, ERS; Yoonhee Macke, FAS; Pete Riley, FSA. Oilseeds: Keith Menzie, ICEC Chair, WAOB, E-mail: [email protected] Mark Ash, ERS; Bill George, FAS; Susan Proper, FSA. Cotton: Carol Skelly, ICEC Chair, WAOB, E-mail: [email protected] Darryl Earnest, AMS; Leslie Meyer, ERS; James Johnson, FAS; Sherrie Grimm, FSA. Sugar: Stephen Haley, ICEC Chair, WAOB, E-mail: [email protected] Michael McConnell, ERS; Ron Lord, FAS; Barbara Fecso, FSA. Meat Animals: Shayle Shagam, ICEC Chair, WAOB, E-mail: [email protected] Sherry Wise, AMS; Kenneth Mathews, ERS; Claire Mezoughem, FAS; Dale Leuck, FSA. Poultry: Shayle Shagam, ICEC Chair, WAOB, E-mail: [email protected] Larry Haller, AMS; David Harvey, ERS; Joanna Hitchner, FAS; Milton Madison, FSA. Dairy: Shayle Shagam, ICEC Chair, WAOB, E-mail: [email protected] Roger Cryan, AMS; Jerry Cessna, ERS; Paul Kiendl, FAS; Milton Madison, FSA.
In 2016, The WASDE report will be released on May. 10, Jun. 10, Jul. 12, Aug. 12, Sep. 12, Oct. 12, Nov. 9, Dec. 9.
WASDE-552-7
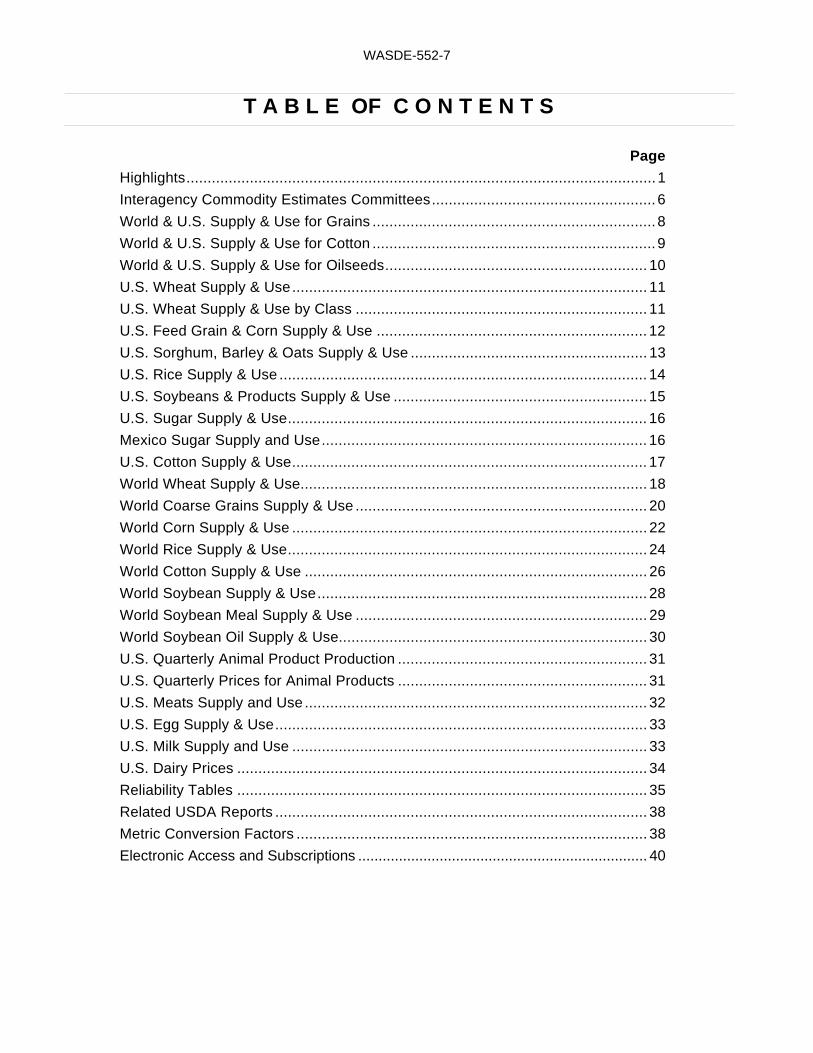
T A B L E OF C O N T E N T S
Page
Highlights ............................................................................................................... 1
Interagency Commodity Estimates Committees ..................................................... 6
World & U.S. Supply & Use for Grains ................................................................... 8
World & U.S. Supply & Use for Cotton ................................................................... 9
World & U.S. Supply & Use for Oilseeds .............................................................. 10
U.S. Wheat Supply & Use .................................................................................... 11
U.S. Wheat Supply & Use by Class ..................................................................... 11
U.S. Feed Grain & Corn Supply & Use ................................................................ 12
U.S. Sorghum, Barley & Oats Supply & Use ........................................................ 13
U.S. Rice Supply & Use ....................................................................................... 14
U.S. Soybeans & Products Supply & Use ............................................................ 15
U.S. Sugar Supply & Use ..................................................................................... 16
Mexico Sugar Supply and Use ............................................................................. 16
U.S. Cotton Supply & Use .................................................................................... 17
World Wheat Supply & Use .................................................................................. 18
World Coarse Grains Supply & Use ..................................................................... 20
World Corn Supply & Use .................................................................................... 22
World Rice Supply & Use ..................................................................................... 24
World Cotton Supply & Use ................................................................................. 26
World Soybean Supply & Use .............................................................................. 28
World Soybean Meal Supply & Use ..................................................................... 29
World Soybean Oil Supply & Use......................................................................... 30
U.S. Quarterly Animal Product Production ........................................................... 31
U.S. Quarterly Prices for Animal Products ........................................................... 31
U.S. Meats Supply and Use ................................................................................. 32
U.S. Egg Supply & Use ........................................................................................ 33
U.S. Milk Supply and Use .................................................................................... 33
U.S. Dairy Prices ................................................................................................. 34
Reliability Tables ................................................................................................. 35
Related USDA Reports ........................................................................................ 38
Metric Conversion Factors ................................................................................... 38
Electronic Access and Subscriptions ....................................................................... 40

April 2016
WASDE - 552 - 8
World and U.S Supply and Use for Grains 1/
Million Metric Tons
World OutputTotal
SupplyTrade 2/
TotalUse 3/
EndingStocks
Total Grains 4/ 2013/14 2473.04 2924.65 372.54 2412.01 512.64
2014/15 (Est.) 2507.65 3020.29 393.70 2458.20 562.09filler filler filler filler filler
2015/16 (Proj.) Mar 2466.96 3026.42 365.08 2455.24 571.18
2015/16 (Proj.) Apr 2465.11 3027.20 368.97 2452.66 574.54filler filler filler filler filler
Wheat 2013/14 714.92 891.81 165.90 697.89 193.92
2014/15 (Est.) 725.44 919.36 164.07 704.56 214.80filler filler filler filler filler
2015/16 (Proj.) Mar 732.32 946.96 162.73 709.37 237.59
2015/16 (Proj.) Apr 733.14 947.94 163.13 708.69 239.26filler filler filler filler filler
Coarse Grains 5/ 2013/14 1279.70 1443.86 164.41 1232.50 211.36
2014/15 (Est.) 1303.41 1514.77 185.65 1271.09 243.68filler filler filler filler filler
2015/16 (Proj.) Mar 1263.56 1504.71 160.69 1261.63 243.08
2015/16 (Proj.) Apr 1261.34 1505.01 164.22 1259.90 245.12filler filler filler filler filler
Rice, milled 2013/14 478.42 588.98 42.23 481.61 107.37
2014/15 (Est.) 478.80 586.16 43.98 482.54 103.62filler filler filler filler filler
2015/16 (Proj.) Mar 471.09 574.75 41.66 484.23 90.51
2015/16 (Proj.) Apr 470.63 574.25 41.61 484.08 90.17filler filler filler filler filler
United States Output
TotalSupply Trade 2/
TotalUse 3/
EndingStocks
Total Grains 4/ 2013/14 431.31 484.21 89.49 343.31 51.40
2014/15 (Est.) 439.49 499.16 83.13 347.06 68.98filler filler filler filler filler
2015/16 (Proj.) Mar 428.85 505.55 74.77 351.77 79.01
2015/16 (Proj.) Apr 428.85 505.54 74.52 351.04 79.98filler filler filler filler filler
Wheat 2013/14 58.11 82.35 32.00 34.29 16.07
2014/15 (Est.) 55.15 75.28 23.25 31.55 20.48filler filler filler filler filler
2015/16 (Proj.) Mar 55.84 79.58 21.09 32.20 26.29
2015/16 (Proj.) Apr 55.84 79.58 21.09 31.93 26.56filler filler filler filler filler
Coarse Grains 5/ 2013/14 367.09 393.85 54.49 305.05 34.31
2014/15 (Est.) 377.23 414.96 56.67 311.35 46.95filler filler filler filler filler
2015/16 (Proj.) Mar 366.90 417.55 50.51 315.72 51.32
2015/16 (Proj.) Apr 366.90 417.55 50.25 315.26 52.04filler filler filler filler filler
Rice, milled 2013/14 6.12 8.01 3.01 3.98 1.03
2014/15 (Est.) 7.11 8.91 3.21 4.16 1.55filler filler filler filler filler
2015/16 (Proj.) Mar 6.11 8.42 3.18 3.85 1.39
2015/16 (Proj.) Apr 6.11 8.41 3.18 3.85 1.38filler filler filler filler filler
1/ Aggregate of local marketing years. 2/ Based on export estimate. See individual commodity tables for treatment of export/import imbalances. 3/ Total use for the United States is equal to domestic consumption only (excludes exports). 4/ Wheat, coarse grains, and milled rice. 5/ Corn, sorghum, barley, oats, rye, millet, and mixed grains (for U.S. excludes millet and mixed grains).

April 2016
WASDE - 552 - 9
World and U.S. Supply and Use for Grains, Continued 1/
Million Metric Tons
Foreign 3/ Output
TotalSupply Trade 2/
TotalUse
EndingStocks
Total Grains 4/ 2013/14 2,041.73 2,440.44 283.05 2,068.69 461.24
2014/15 (Est.) 2,068.16 2,521.13 310.57 2,111.14 493.12filler filler filler filler filler
2015/16 (Proj.) Mar 2,038.11 2,520.87 290.30 2,103.47 492.17
2015/16 (Proj.) Apr 2,036.26 2,521.67 294.45 2,101.62 494.56filler filler filler filler filler
Wheat 2013/14 656.82 809.45 133.90 663.61 177.85
2014/15 (Est.) 670.29 844.08 140.82 673.00 194.32filler filler filler filler filler
2015/16 (Proj.) Mar 676.48 867.38 141.64 677.18 211.30
2015/16 (Proj.) Apr 677.30 868.36 142.04 676.75 212.70filler filler filler filler filler
Coarse Grains 5/ 2013/14 912.62 1,050.01 109.92 927.45 177.05
2014/15 (Est.) 926.18 1,099.81 128.99 959.74 196.73filler filler filler filler filler
2015/16 (Proj.) Mar 896.65 1,087.16 110.18 945.92 191.75
2015/16 (Proj.) Apr 894.43 1,087.46 113.97 944.64 193.08filler filler filler filler filler
Rice, milled 2013/14 472.30 580.97 39.22 477.63 106.34
2014/15 (Est.) 471.69 577.25 40.77 478.39 102.07filler filler filler filler filler
2015/16 (Proj.) Mar 464.98 566.32 38.48 480.38 89.12
2015/16 (Proj.) Apr 464.52 565.84 38.44 480.23 88.79filler filler filler filler filler
1/ Aggregate of local marketing years. 2/ Based on export estimate. See individual commodity tables for treatment of export/import imbalances. 3/ Total foreign is equal to world minus United States. 4/ Wheat, coarse grains, and milled rice. 5/ Corn, sorghum, barley, oats, rye, millet, and mixed grains.
World and U.S. Supply and Use for Cotton 1/
Million 480-lb. Bales
Output
TotalSupply Trade 2/
TotalUse 3/
EndingStocks
World 2013/14 120.41 212.07 40.87 109.92 102.86
2014/15 (Est.) 119.07 221.94 35.38 110.20 111.88filler filler filler filler filler
2015/16 (Proj.) Mar 100.22 212.39 34.90 109.21 103.34
2015/16 (Proj.) Apr 99.80 211.68 34.84 109.59 102.22filler filler filler filler filler
United States 2013/14 12.91 16.72 10.53 3.55 2.35
2014/15 (Est.) 16.32 18.68 11.25 3.58 3.70filler filler filler filler filler
2015/16 (Proj.) Mar 12.94 16.65 9.50 3.60 3.60
2015/16 (Proj.) Apr 12.87 16.61 9.50 3.60 3.50filler filler filler filler filler
Foreign 4/ 2013/14 107.50 195.34 30.34 106.37 100.51
2014/15 (Est.) 102.75 203.26 24.13 106.63 108.18filler filler filler filler filler
2015/16 (Proj.) Mar 87.28 195.73 25.40 105.61 99.74
2015/16 (Proj.) Apr 86.93 195.07 25.34 105.99 98.72filler filler filler filler filler
1/ Marketing year beginning August 1. 2/ Based on export estimate. 3/ Includes mill use only. 4/ Total Foreign is equal to world minus United States. See global cotton tables for treatment of export/import imbalances. * Planted area based on March 31 Prospective Plantings. Harvested area based on the previous 10-year average abandonment by region, with the Southwest estimated at 15 percent due to favorable moisture. Yield per harvested acre based on the previous 3-year average by region, with the Southwest adjusted to the 10-year average.
April 2016
WASDE - 552 - 10
World and U.S. Supply and Use for Oilseeds 1/
(Million Metric Tons)
World Output
TotalSupply Trade
TotalUse 2/
EndingStocks
Oilseeds 2013/14 504.09 571.20 133.51 418.05 77.25
2014/15 (Est.) 536.77 614.01 146.71 438.98 91.70filler filler filler filler filler
2015/16 (Proj.) Mar 526.88 617.83 149.33 448.81 89.48
2015/16 (Proj.) Apr 526.98 618.68 150.77 448.90 89.37filler filler filler filler filler
Oilmeals 2013/14 282.21 293.95 82.14 276.68 13.44
2014/15 (Est.) 300.01 313.45 85.19 292.88 15.24filler filler filler filler filler
2015/16 (Proj.) Mar 308.62 323.41 89.13 305.30 14.15
2015/16 (Proj.) Apr 308.79 324.03 89.02 304.60 14.89filler filler filler filler filler
Vegetable Oils 2013/14 171.33 190.59 70.05 167.24 19.86
2014/15 (Est.) 176.73 196.59 76.53 170.82 18.87filler filler filler filler filler
2015/16 (Proj.) Mar 178.69 197.87 76.20 177.16 16.46
2015/16 (Proj.) Apr 179.55 198.42 76.62 176.94 16.95filler filler filler filler filler
United States Output
Total Supply Trade
Total Use 2/ Ending
Stocks
Oilseeds 2013/14 99.02 107.85 45.55 51.46 3.95
2014/15 (Est.) 116.03 121.82 51.14 55.11 6.76filler filler filler filler filler
2015/16 (Proj.) Mar 116.15 124.25 46.78 54.86 14.44
2015/16 (Proj.) Apr 116.15 124.18 47.18 54.69 14.02filler filler filler filler filler
Oilmeals 2013/14 39.39 43.50 10.77 32.44 0.29
2014/15 (Est.) 43.27 47.42 12.18 34.95 0.29filler filler filler filler filler
2015/16 (Proj.) Mar 42.39 46.89 10.46 36.10 0.34
2015/16 (Proj.) Apr 42.28 46.79 10.45 36.00 0.34filler filler filler filler filler
Vegetable Oils 2013/14 10.42 15.58 1.12 13.50 0.97
2014/15 (Est.) 10.94 16.13 1.17 13.75 1.21filler filler filler filler filler
2015/16 (Proj.) Mar 11.11 16.61 1.19 14.01 1.40
2015/16 (Proj.) Apr 11.06 16.59 1.21 14.01 1.38filler filler filler filler filler
Foreign 3/ Output
TotalSupply Trade
TotalUse 2/
EndingStocks
Oilseeds 2013/14 405.07 463.35 87.96 366.59 73.30
2014/15 (Est.) 420.74 492.19 95.57 383.88 84.95filler filler filler filler filler
2015/16 (Proj.) Mar 410.73 493.58 102.55 393.95 75.04
2015/16 (Proj.) Apr 410.83 494.51 103.59 394.22 75.35filler filler filler filler filler
Oilmeals 2013/14 242.82 250.45 71.37 244.24 13.15
2014/15 (Est.) 256.74 266.03 73.01 257.93 14.95filler filler filler filler filler
2015/16 (Proj.) Mar 266.23 276.52 78.68 269.20 13.81
2015/16 (Proj.) Apr 266.50 277.24 78.57 268.61 14.56filler filler filler filler filler
Vegetable Oils 2013/14 160.91 175.01 68.94 153.74 18.89
2014/15 (Est.) 165.79 180.46 75.36 157.07 17.66filler filler filler filler filler
2015/16 (Proj.) Mar 167.58 181.26 75.00 163.15 15.06
2015/16 (Proj.) Apr 168.49 181.83 75.41 162.93 15.58filler filler filler filler filler
1/ Aggregate of local marketing years with Brazil and Argentina on an Oct.-Sept. year. 2/ Crush only for oilseeds. 3/ Total Foreign is equal to World minus United States.
April 2016
WASDE - 552 - 11
U.S. Wheat Supply and Use 1/
2013/14 2014/15 Est. 2015/16 Proj. 2015/16 Proj.
Mar Apr
Million Acres Area Planted 56.2 56.8 54.6 54.6Area Harvested 45.3 46.4 47.1 47.1 Bushels Yield per Harvested Acre 47.1 43.7 43.6 43.6 Million Bushels Beginning Stocks 718 590 752 752Production 2,135 2,026 2,052 2,052Imports 173 149 120 120 Supply, Total 3,026 2,766 2,924 2,924Food 955 958 967 967Seed 77 79 66 66Feed and Residual 228 122 150 140 Domestic, Total 1,260 1,159 1,183 1,173Exports 1,176 854 775 775 Use, Total 2,436 2,014 1,958 1,948Ending Stocks 590 752 966 976Avg. Farm Price ($/bu) 2/ 6.87 5.99 4.90 - 5.10 4.90 - 5.00
U.S. Wheat by Class: Supply and Use
Year beginning June 1 Hard RedWinter
Hard RedSpring
Soft RedWinter White Durum Total
Million Bushels 2014/15 (Est.) Beginning Stocks 237 169 113 50 22 590
Production 739 556 455 224 54 2,026
Supply, Total 3/ 985 791 581 283 126 2,766
Domestic Use 423 308 294 71 63 1,159
Exports 269 270 133 146 37 854
Use, Total 692 579 427 216 100 2,014
Ending Stocks, Total 294 212 154 67 26 752
2015/16 (Proj.) Beginning Stocks 294 212 154 67 26 752
Production 827 564 359 219 82 2,052
Supply, Total 3/ 1,127 831 532 293 141 2,924
Domestic Use 474 285 234 101 78 1,173
Exports 225 250 120 145 35 775
Use, Total 699 535 354 246 113 1,948
Ending Stocks, Total Apr 427 296 178 47 28 976Ending Stocks, Total Mar 419 288 170 55 34 966
Note: Totals may not add due to rounding. 1/ Marketing year beginning June 1. 2/ Marketing-year weighted average price received by farmers. 3/ Includes imports.

April 2016
WASDE - 552 - 12
U.S. Feed Grain and Corn Supply and Use 1/
FEED GRAINS 2013/14 2014/15 Est. 2015/16 Proj. 2015/16 Proj.
Mar Apr
Million Acres Area Planted 109.9 103.5 103.1 103.1Area Harvested 98.1 93.1 93.0 93.0 Metric Tons Yield per Harvested Acre 3.74 4.05 3.94 3.94 Million Metric Tons Beginning Stocks 23.5 34.3 46.9 46.9Production 366.9 377.1 366.6 366.6Imports 3.0 3.2 3.5 3.5 Supply, Total 393.4 414.5 417.0 417.0Feed and Residual 133.5 139.5 140.7 139.0Food, Seed & Industrial 171.1 171.4 174.5 175.8 Domestic, Total 304.6 310.9 315.2 314.8Exports 54.5 56.7 50.5 50.2 Use, Total 359.1 367.6 365.7 365.0Ending Stocks 34.3 46.9 51.3 52.0
CORN 2013/14 2014/15 Est. 2015/16 Proj. 2015/16 Proj.
March April
Million Acres Area Planted 95.4 90.6 88.0 88.0Area Harvested 87.5 83.1 80.7 80.7 Bushels Yield per Harvested Acre 158.1 171.0 168.4 168.4 Million Bushels Beginning Stocks 821 1,232 1,731 1,731Production 13,829 14,216 13,601 13,601Imports 36 32 50 50 Supply, Total 14,686 15,479 15,382 15,382Feed and Residual 5,040 5,324 5,300 5,250Food, Seed & Industrial 2/ 6,493 6,560 6,595 6,621 Ethanol & by-products 3/ 5,124 5,200 5,225 5,250 Domestic, Total 11,534 11,883 11,895 11,871Exports 1,920 1,864 1,650 1,650 Use, Total 13,454 13,748 13,545 13,521Ending Stocks 1,232 1,731 1,837 1,862Avg. Farm Price ($/bu) 4/ 4.46 3.70 3.40 - 3.80 3.40 - 3.70
Note: Totals may not add due to rounding. 1/ Marketing year beginning September 1 for corn and sorghum; June 1 for barley and oats. 2/ For a breakout of FSI corn uses, see Feed Outlook table 5 or access the data on the Web through the Feed Grains Database at www.ers.usda.gov/data-products/feed-grains-database.aspx. 3/ Corn processed in ethanol plants to produce ethanol and by-products including distillers' grains, corn gluten feed, corn gluten meal, and corn oil. 4/ Marketing-year weighted average price received by farmers.
April 2016
WASDE - 552 - 13
U.S. Sorghum, Barley, and Oats Supply and Use 1/
SORGHUM 2013/14 2014/15 Est. 2015/16 Proj. 2015/16 Proj.
Mar Apr
Million Bushels Filler Filler Filler Filler Filler
Area Planted (mil. acres) 8.1 7.1 8.5 8.5Area Harvested (mil. acres) 6.6 6.4 7.9 7.9Yield (bushels/acre) 59.6 67.6 76.0 76.0Beginning Stocks 15 34 18 18Production 392 433 597 597Imports 0 0 5 5 Supply, Total 408 467 620 620Feed and Residual 93 81 130 115Food, Seed & Industrial 70 15 100 125 Total Domestic 162 96 230 240Exports 211 353 325 315 Use, Total 374 449 555 555Ending Stocks 34 18 65 65Avg. Farm Price ($/bu) 2/ 4.28 4.03 3.15 - 3.45 3.10 - 3.30Filler Filler Filler Filler Filler
BARLEY 2013/14 2014/15 Est. 2015/16 Proj. 2015/16 Proj.
March April
Filler Filler Filler Filler Filler
Area Planted (mil. acres) 3.5 3.0 3.6 3.6Area Harvested (mil. acres) 3.0 2.5 3.1 3.1Yield (bushels/acre) 71.3 72.7 68.9 68.9Beginning Stocks 80 82 79 79Production 217 182 214 214Imports 19 24 20 20 Supply, Total 316 287 313 313Feed and Residual 66 43 50 50Food, Seed & Industrial 153 151 153 152 Total Domestic 219 194 203 202Exports 14 14 14 14 Use, Total 234 209 217 216Ending Stocks 82 79 96 97Avg. Farm Price ($/bu) 2/ 6.06 5.30 5.35 - 5.65 5.40 - 5.60Filler Filler Filler Filler Filler
OATS 2013/14 2014/15 Est. 2015/16 Proj. 2015/16 Proj.
March April
Filler Filler Filler Filler Filler
Area Planted (mil. acres) 3.0 2.8 3.1 3.1Area Harvested (mil. acres) 1.0 1.0 1.3 1.3Yield (bushels/acre) 64.1 67.9 70.2 70.2Beginning Stocks 36 25 54 54Production 65 70 90 90Imports 97 107 95 95 Supply, Total 198 202 238 238Feed and Residual 98 70 100 95Food, Seed & Industrial 73 77 77 76 Total Domestic 172 147 177 171Exports 2 2 2 2 Use, Total 173 149 179 173Ending Stocks 25 54 59 65Avg. Farm Price ($/bu) 2/ 3.75 3.21 2.10 - 2.20 2.10 - 2.20Filler Filler Filler Filler Filler
Note: Totals may not add due to rounding. 1/ Marketing year beginning September 1 for sorghum; June 1 for barley and oats. 2/ Marketing-year weighted average price received by farmers.

April 2016
WASDE - 552 - 14
U.S. Rice Supply and Use 1/
(Rough Equivalent of Rough and Milled Rice)
TOTAL RICE 2013/14 2014/15 Est. 2015/16 Proj. 2015/16 Proj.
Mar Apr
Million Acres Area Planted 2.49 2.95 2.61 2.61Area Harvested 2.47 2.93 2.58 2.58Filler
Pounds Yield per Harvested Acre 7,694 7,576 7,470 7,470 Million Hundredweight Beginning Stocks 2/ 36.4 31.8 48.5 48.5 Production 190.0 222.2 192.3 192.3 Imports 23.1 24.7 24.0 23.5 Supply, Total 249.5 278.7 264.9 264.4 Domestic & Residual 3/ 124.4 129.9 121.0 121.0 Exports, Total 4/ 93.3 100.3 100.0 100.0 Rough 28.0 34.0 33.0 33.0 Milled (rough equiv.) 65.3 66.3 67.0 67.0 Use, Total 217.7 230.2 221.0 221.0 Ending Stocks 31.8 48.5 43.9 43.4Avg. Milling Yield (%) 5/ 71.00 70.50 70.00 70.00Avg. Farm Price ($/cwt) 6/ 16.30 13.40 12.40 - 13.20 12.30 - 12.70Total
LONG-GRAIN RICE 2013/14 2014/15 Est. 2015/16 Proj. 2015/16 Proj.
March April
Harvested Acres (mil.) 1.77 2.20 1.84 1.84 Yield (pounds/acre) 7,464 7,407 7,218 7,218 Beginning Stocks 21.9 16.2 26.5 26.5 Production 131.9 162.7 133.0 133.0 Supply, Total 7/ 173.3 200.0 180.0 179.5 Domestic & Residual 3/ 95.3 102.7 88.0 88.0 Exports 8/ 61.9 70.8 69.0 69.0 Use, Total 157.1 173.5 157.0 157.0 Ending Stocks 16.2 26.5 23.0 22.5 Avg. Farm Price ($/cwt) 6/ 15.40 11.90 11.00 - 11.60 10.80 - 11.20Filler Filler Filler Filler Filler
MEDIUM & SHORT-GRAIN RICE 2013/14 2014/15 Est. 2015/16 Proj. 2015/16 Proj.
March April
Harvested Acres (mil.) 0.70 0.74 0.73 0.73 Yield (pounds/acre) 8,270 8,080 8,103 8,103 Beginning Stocks 12.2 13.3 20.2 20.2 Production 58.1 59.6 59.3 59.3 Supply, Total 7/ 73.8 76.8 83.0 83.0 Domestic & Residual 3/ 29.1 27.1 33.0 33.0 Exports 8/ 31.4 29.5 31.0 31.0 Use, Total 60.5 56.7 64.0 64.0 Ending Stocks 13.3 20.2 19.0 19.0 Avg. Farm Price ($/cwt) 1/ 6/ 9/ 19.20 18.30 16.00 - 16.80 15.70 - 16.30 California 10/ 20.70 21.60 18.50 - 19.50 18.20 - 18.80 Other States 1/ 15.70 14.40 11.40 - 12.00 11.20 - 11.80Filler Filler Filler Filler Filler
Note: Totals may not add due to rounding. 1/ Marketing year beginning August 1. 2/ Includes the following quantities of broken kernel rice (type undetermined) not included in estimates of beginning stocks by type (in mil. cwt): 2013/14-2.1; 2014/15-2.3; 2015/16-1.9. 3/ Residual includes unreported use, processing losses, and estimating errors. Use by type may not add to total rice use because of the difference in brokens between beginning and ending stocks. 4/ Includes rough rice and milled rice exports. Milled rice exports are converted to an equivalent rough basis. 5/ Expressed as a percent, i.e., the total quantity of whole kernel and broken rice produced divided by the quantity of rough rice milled. The 2013/14 and 2014/15 milling yield is based on the Farm Service Agency (FSA) warehouse stored loan data for long, medium, and short grain rice. The 2015/16 milling yield is calculated using the previous five-year Olympic average-- 2010/11-2014/15. 6/ Marketing-year weighted average price received by farmers. 7/ Includes imports. 8/ Exports by type of rice are estimated. 9/ The medium/short-grain season-average- farm price (SAFP) largely reflects rice that is marketed through price pools in California. The pool price is not final until all the rice in the pool is marketed for the crop year. Therefore, SAFP forecasts based on the average of NASS monthly prices and the final price may differ. For example, the average difference between the August WASDE SAFP forecast and the final price has averaged $1.65 per cwt from 2008/09-2013/14, with a high of $3.50 per cwt in 2008/09 and a low of $0.60 per cwt in 2009/10. 10/ Marketing year beginning October 1.

April 2016
WASDE - 552 - 15
U.S. Soybeans and Products Supply and Use (Domestic Measure) 1/
SOYBEANS 2013/14 2014/15 Est. 2015/16 Proj. 2015/16 Proj.
Mar AprFiller Filler Filler Filler Filler
Million Acres Area Planted 76.8 83.3 82.7 82.7Area Harvested 76.3 82.6 81.8 81.8Filler
Bushels Yield per Harvested Acre 44.0 47.5 48.0 48.0
Million Bushels Beginning Stocks 141 92 191 191Production 3,358 3,927 3,929 3,929Imports 72 33 30 30 Supply, Total 3,570 4,052 4,150 4,150Crushings 1,734 1,873 1,870 1,870Exports 1,638 1,843 1,690 1,705Seed 97 96 96 95Residual 10 49 34 34 Use, Total 3,478 3,862 3,690 3,705Ending Stocks 92 191 460 445Avg. Farm Price ($/bu) 2/ 13.00 10.10 8.25 - 9.25 8.50 - 9.00Total
SOYBEAN OIL 2013/14 2014/15 Est. 2015/16 Proj. 2015/16 Proj.
March April
Filler Filler Filler Filler Filler
Million Pounds Beginning Stocks 1,655 1,165 1,855 1,855Production 4/ 20,130 21,399 21,730 21,730Imports 165 264 300 300 Supply, Total 21,950 22,828 23,885 23,885Domestic Disappearance 18,908 18,959 19,600 19,600 Biodiesel 3/ 5,010 5,037 5,500 5,500 Food, Feed & other Industrial 13,898 13,923 14,100 14,100Exports 1,877 2,014 2,100 2,100 Use, Total 20,785 20,973 21,700 21,700Ending stocks 1,165 1,855 2,185 2,185Avg. Price (c/lb) 2/ 38.23 31.60 28.50 - 31.50 29.00 - 31.00Total
SOYBEAN MEAL 2013/14 2014/15 Est. 2015/16 Proj. 2015/16 Proj.
March April
Filler 1 2 3 4
Thousand Short Tons Beginning Stocks 275 250 260 260Production 4/ 40,685 45,062 44,165 44,165Imports 383 333 375 375 Supply, Total 41,343 45,645 44,800 44,800Domestic Disappearance 29,547 32,235 33,300 33,300Exports 11,546 13,150 11,200 11,200 Use, Total 41,093 45,384 44,500 44,500Ending Stocks 250 260 300 300Avg. Price ($/s.t.) 2/ 489.94 368.49 270.00 - 300.00 275.00 - 295.00Total
Note: Totals may not add due to rounding. Reliability calculations at end of report. 1/ Marketing year beginning September 1 for soybeans; October 1 for soybean oil and soybean meal. 2/ Prices: soybeans, marketing year weighted average price received by farmers; oil, simple average of crude soybean oil, Decatur; meal, simple average of 48 percent protein, Decatur. 3/ Reflects only biodiesel made from methyl ester as reported by the U.S. Energy Information Administration. 4/ Based on an October year crush of 1,903 million bushels for 2014/15 and 1,870 million bushels for 2015/16.
April 2016
WASDE - 552 - 16
U.S. Sugar Supply and Use 1/
2013/14 2014/15 Est. 2015/16 Proj. 2015/16 Proj.
Mar AprFiller Filler Filler Filler Filler
1,000 Short Tons, Raw Value Beginning Stocks 2,158 1,810 1,809 1,809Production 2/ 8,462 8,649 8,827 8,792 Beet Sugar 4,794 4,893 5,016 4,998 Cane Sugar 3,667 3,756 3,811 3,794 Florida 1,763 1,975 2,108 2,091 Hawaii 168 146 165 165 Louisiana 1,591 1,513 1,423 1,423 Texas 145 123 115 115Imports 3,742 3,553 3,200 3,209 TRQ 3/ 1,302 1,536 1,586 1,595 Other Program 4/ 305 471 300 300 Other 5/ 2,135 1,546 1,314 1,314 Mexico 2,130 1,532 1,299 1,299 Total Supply 14,361 14,012 13,836 13,809 Exports 306 185 100 100Deliveries 12,246 12,019 12,090 12,090 Food 6/ 11,819 11,888 11,955 11,955 Other 7/ 427 131 135 135Miscellaneous 0 0 0 0 Total Use 12,552 12,204 12,190 12,190Ending Stocks 1,810 1,809 1,646 1,619Stocks to Use Ratio 14.4 14.8 13.5 13.3Total
1/ Fiscal years beginning Oct 1. Historical data are from FSA "Sweetener Market Data" (SMD). 2/ Production projections for 2014/15 and 2015/16 are based on Crop Production and processor projections where appropriate. 3/ For 2015/16, WTO raw sugar TRQ shortfall (28). For 2014/15, WTO raw sugar TRQ shortfall (69). 4/ Includes sugar under the re-export and polyhydric alcohol programs. 5/ For 2013/14, other high-tier (5) and other (0). For 2014/15, other high-tier (15) and other (0). For 2015/16, other high-tier (15) and other (0). 6/Combines SMD deliveries for domestic human food use and SMD miscellaneous uses. 7/ Transfers to sugar-containing products for reexport, and for nonedible alcohol, feed, and ethanol.
Mexico Sugar Supply and Use and High Fructose Corn Syrup Imports 1/
Beginning
Stocks Production Imports Domestic 2/ Exports EndingStocks
Sugar 1,000 Metric Tons, Actual Weight 2014/15 Est. Mar 831 5,985 128 4,691 1,442 8112014/15 Est. Apr 831 5,985 128 4,691 1,442 811
2015/16 Proj. Mar 811 6,056 70 4,681 1,122 1,1342015/16 Proj. Apr 811 6,056 70 4,656 1,121 1,160
1/ HFCS imports by Mexico (1,000 metric tons, dry basis): Oct-Sep 2014/15 = 979; Oct-Feb 2014/15 = 368, Oct-Feb 2015/16 = 348 . Footnote source: Comite Nacional para el Desarollo Sustentable de la Cana de Azucar. 2/Includes domestic consumption, Mexico's products export program (IMMEX), and any residual statistical discrepancies. IMMEX: 2014/15 (337 est), 2015/16 (337 proj). Statistical Adjustment: 2014/15 (-54), 2015/16 (0).
April 2016
WASDE - 552 - 17
U.S. Cotton Supply and Use 1/
2013/14 2014/15 Est. 2015/16 Proj. 2015/16 Proj.
Mar AprFiller Filler Filler Filler Filler
Area Million Acres Planted 10.41 11.04 8.58 8.58 Harvested 7.54 9.35 8.06 8.06Filler
Pounds Yield per Harvested Acre 821 838 771 767
Million 480 Pound Bales Beginning Stocks 3.80 2.35 3.70 3.70Production 12.91 16.32 12.94 12.87Imports 0.01 0.01 0.01 0.04 Supply, Total 16.72 18.68 16.65 16.61Domestic Use 3.55 3.58 3.60 3.60Exports, Total 10.53 11.25 9.50 9.50 Use, Total 14.08 14.82 13.10 13.10Unaccounted 2/ 0.29 0.16 -0.05 0.01Ending Stocks 2.35 3.70 3.60 3.50Avg. Farm Price 3/ 77.9 61.3 58.00 - 60.00 58.00 - 59.00Total
Note: Reliability calculations at end of report. 1/ Upland and extra-long staple; marketing year beginning August 1. Totals may not add due to rounding. 2/ Reflects the difference between the previous season's supply less total use and ending stocks. 3/ Cents per pound for upland cotton.
April 2016
WASDE - 552 - 18
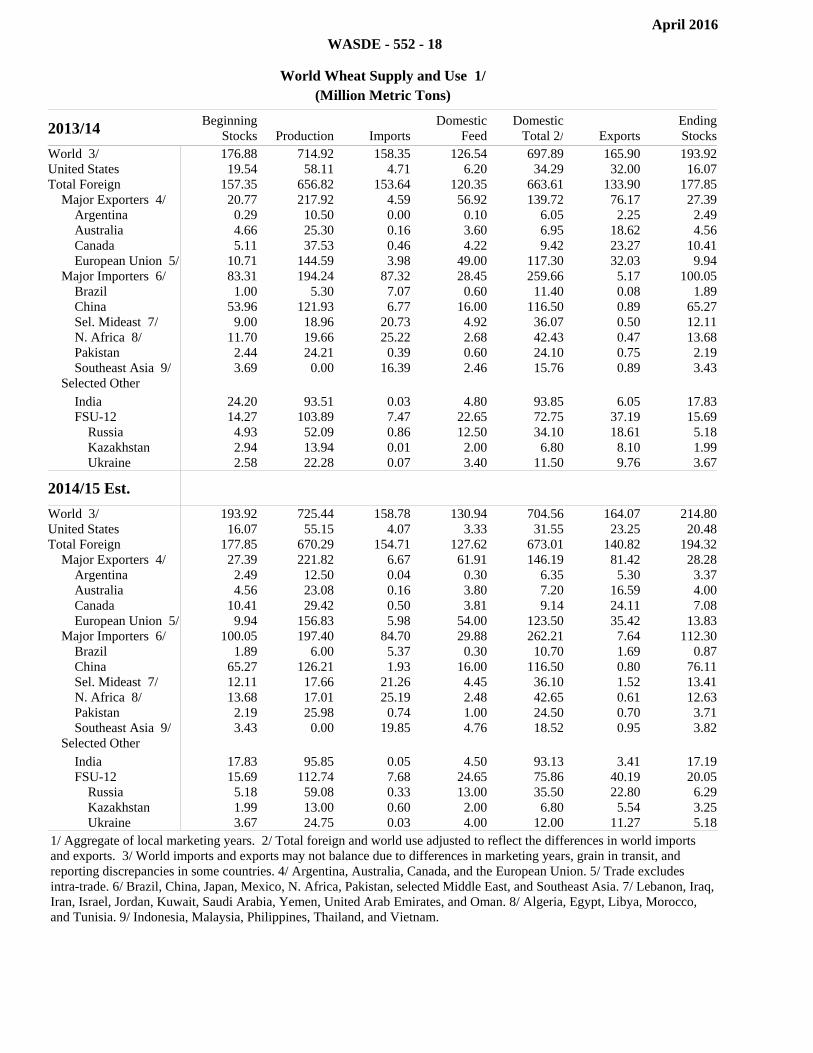
World Wheat Supply and Use 1/
(Million Metric Tons)
2013/14 BeginningStocks Production Imports
DomesticFeed
DomesticTotal 2/ Exports
EndingStocks
World 3/ 176.88 714.92 158.35 126.54 697.89 165.90 193.92United States 19.54 58.11 4.71 6.20 34.29 32.00 16.07Total Foreign 157.35 656.82 153.64 120.35 663.61 133.90 177.85 Major Exporters 4/ 20.77 217.92 4.59 56.92 139.72 76.17 27.39 Argentina 0.29 10.50 0.00 0.10 6.05 2.25 2.49 Australia 4.66 25.30 0.16 3.60 6.95 18.62 4.56 Canada 5.11 37.53 0.46 4.22 9.42 23.27 10.41 European Union 5/ 10.71 144.59 3.98 49.00 117.30 32.03 9.94 Major Importers 6/ 83.31 194.24 87.32 28.45 259.66 5.17 100.05 Brazil 1.00 5.30 7.07 0.60 11.40 0.08 1.89 China 53.96 121.93 6.77 16.00 116.50 0.89 65.27 Sel. Mideast 7/ 9.00 18.96 20.73 4.92 36.07 0.50 12.11 N. Africa 8/ 11.70 19.66 25.22 2.68 42.43 0.47 13.68 Pakistan 2.44 24.21 0.39 0.60 24.10 0.75 2.19 Southeast Asia 9/ 3.69 0.00 16.39 2.46 15.76 0.89 3.43 Selected Other India 24.20 93.51 0.03 4.80 93.85 6.05 17.83 FSU-12 14.27 103.89 7.47 22.65 72.75 37.19 15.69 Russia 4.93 52.09 0.86 12.50 34.10 18.61 5.18 Kazakhstan 2.94 13.94 0.01 2.00 6.80 8.10 1.99 Ukraine 2.58 22.28 0.07 3.40 11.50 9.76 3.67
2014/15 Est. Beginning Stocks Production Imports
Domestic Feed
Domestic Total 2/ Exports
Ending Stocks
World 3/ 193.92 725.44 158.78 130.94 704.56 164.07 214.80United States 16.07 55.15 4.07 3.33 31.55 23.25 20.48Total Foreign 177.85 670.29 154.71 127.62 673.01 140.82 194.32 Major Exporters 4/ 27.39 221.82 6.67 61.91 146.19 81.42 28.28 Argentina 2.49 12.50 0.04 0.30 6.35 5.30 3.37 Australia 4.56 23.08 0.16 3.80 7.20 16.59 4.00 Canada 10.41 29.42 0.50 3.81 9.14 24.11 7.08 European Union 5/ 9.94 156.83 5.98 54.00 123.50 35.42 13.83 Major Importers 6/ 100.05 197.40 84.70 29.88 262.21 7.64 112.30 Brazil 1.89 6.00 5.37 0.30 10.70 1.69 0.87 China 65.27 126.21 1.93 16.00 116.50 0.80 76.11 Sel. Mideast 7/ 12.11 17.66 21.26 4.45 36.10 1.52 13.41 N. Africa 8/ 13.68 17.01 25.19 2.48 42.65 0.61 12.63 Pakistan 2.19 25.98 0.74 1.00 24.50 0.70 3.71 Southeast Asia 9/ 3.43 0.00 19.85 4.76 18.52 0.95 3.82 Selected Other India 17.83 95.85 0.05 4.50 93.13 3.41 17.19 FSU-12 15.69 112.74 7.68 24.65 75.86 40.19 20.05 Russia 5.18 59.08 0.33 13.00 35.50 22.80 6.29 Kazakhstan 1.99 13.00 0.60 2.00 6.80 5.54 3.25 Ukraine 3.67 24.75 0.03 4.00 12.00 11.27 5.18
1/ Aggregate of local marketing years. 2/ Total foreign and world use adjusted to reflect the differences in world imports and exports. 3/ World imports and exports may not balance due to differences in marketing years, grain in transit, and reporting discrepancies in some countries. 4/ Argentina, Australia, Canada, and the European Union. 5/ Trade excludes intra-trade. 6/ Brazil, China, Japan, Mexico, N. Africa, Pakistan, selected Middle East, and Southeast Asia. 7/ Lebanon, Iraq, Iran, Israel, Jordan, Kuwait, Saudi Arabia, Yemen, United Arab Emirates, and Oman. 8/ Algeria, Egypt, Libya, Morocco, and Tunisia. 9/ Indonesia, Malaysia, Philippines, Thailand, and Vietnam.
April 2016
WASDE - 552 - 19
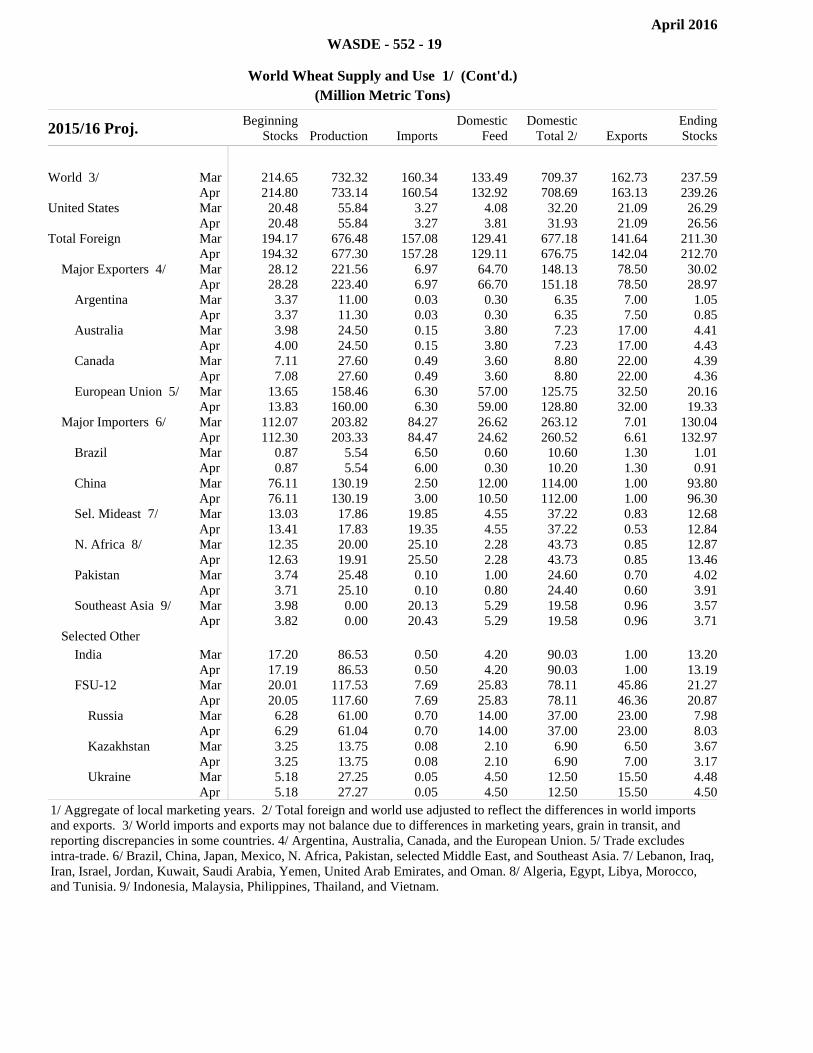
World Wheat Supply and Use 1/ (Cont'd.)
(Million Metric Tons)
2015/16 Proj. BeginningStocks Production Imports
DomesticFeed
DomesticTotal 2/ Exports
EndingStocks
World 3/ Mar 214.65 732.32 160.34 133.49 709.37 162.73 237.59
Apr 214.80 733.14 160.54 132.92 708.69 163.13 239.26United States Mar 20.48 55.84 3.27 4.08 32.20 21.09 26.29
Apr 20.48 55.84 3.27 3.81 31.93 21.09 26.56Total Foreign Mar 194.17 676.48 157.08 129.41 677.18 141.64 211.30
Apr 194.32 677.30 157.28 129.11 676.75 142.04 212.70 Major Exporters 4/ Mar 28.12 221.56 6.97 64.70 148.13 78.50 30.02
Apr 28.28 223.40 6.97 66.70 151.18 78.50 28.97 Argentina Mar 3.37 11.00 0.03 0.30 6.35 7.00 1.05
Apr 3.37 11.30 0.03 0.30 6.35 7.50 0.85 Australia Mar 3.98 24.50 0.15 3.80 7.23 17.00 4.41
Apr 4.00 24.50 0.15 3.80 7.23 17.00 4.43 Canada Mar 7.11 27.60 0.49 3.60 8.80 22.00 4.39
Apr 7.08 27.60 0.49 3.60 8.80 22.00 4.36 European Union 5/ Mar 13.65 158.46 6.30 57.00 125.75 32.50 20.16
Apr 13.83 160.00 6.30 59.00 128.80 32.00 19.33 Major Importers 6/ Mar 112.07 203.82 84.27 26.62 263.12 7.01 130.04
Apr 112.30 203.33 84.47 24.62 260.52 6.61 132.97 Brazil Mar 0.87 5.54 6.50 0.60 10.60 1.30 1.01
Apr 0.87 5.54 6.00 0.30 10.20 1.30 0.91 China Mar 76.11 130.19 2.50 12.00 114.00 1.00 93.80
Apr 76.11 130.19 3.00 10.50 112.00 1.00 96.30 Sel. Mideast 7/ Mar 13.03 17.86 19.85 4.55 37.22 0.83 12.68
Apr 13.41 17.83 19.35 4.55 37.22 0.53 12.84 N. Africa 8/ Mar 12.35 20.00 25.10 2.28 43.73 0.85 12.87
Apr 12.63 19.91 25.50 2.28 43.73 0.85 13.46 Pakistan Mar 3.74 25.48 0.10 1.00 24.60 0.70 4.02
Apr 3.71 25.10 0.10 0.80 24.40 0.60 3.91 Southeast Asia 9/ Mar 3.98 0.00 20.13 5.29 19.58 0.96 3.57
Apr 3.82 0.00 20.43 5.29 19.58 0.96 3.71 Selected Other India Mar 17.20 86.53 0.50 4.20 90.03 1.00 13.20
Apr 17.19 86.53 0.50 4.20 90.03 1.00 13.19 FSU-12 Mar 20.01 117.53 7.69 25.83 78.11 45.86 21.27
Apr 20.05 117.60 7.69 25.83 78.11 46.36 20.87 Russia Mar 6.28 61.00 0.70 14.00 37.00 23.00 7.98
Apr 6.29 61.04 0.70 14.00 37.00 23.00 8.03 Kazakhstan Mar 3.25 13.75 0.08 2.10 6.90 6.50 3.67
Apr 3.25 13.75 0.08 2.10 6.90 7.00 3.17 Ukraine Mar 5.18 27.25 0.05 4.50 12.50 15.50 4.48
Apr 5.18 27.27 0.05 4.50 12.50 15.50 4.50
1/ Aggregate of local marketing years. 2/ Total foreign and world use adjusted to reflect the differences in world imports and exports. 3/ World imports and exports may not balance due to differences in marketing years, grain in transit, and reporting discrepancies in some countries. 4/ Argentina, Australia, Canada, and the European Union. 5/ Trade excludes intra-trade. 6/ Brazil, China, Japan, Mexico, N. Africa, Pakistan, selected Middle East, and Southeast Asia. 7/ Lebanon, Iraq, Iran, Israel, Jordan, Kuwait, Saudi Arabia, Yemen, United Arab Emirates, and Oman. 8/ Algeria, Egypt, Libya, Morocco, and Tunisia. 9/ Indonesia, Malaysia, Philippines, Thailand, and Vietnam.

April 2016
WASDE - 552 - 20
World Coarse Grain Supply and Use 1/
(Million Metric Tons)
2013/14 BeginningStocks Production Imports
DomesticFeed
DomesticTotal 2/ Exports
EndingStocks
World 3/ 164.16 1,279.70 156.20 733.91 1,232.50 164.41 211.36United States 23.53 367.09 3.23 133.69 305.05 54.49 34.31Total Foreign 140.63 912.62 152.97 600.23 927.45 109.92 177.05 Major Exporters 4/ 16.74 174.69 1.81 81.23 111.25 56.45 25.54 Argentina 2.47 35.67 0.00 8.84 13.70 21.27 3.17 Australia 0.85 12.16 0.00 3.36 5.04 6.92 1.05 Brazil 9.56 82.60 1.11 48.28 58.03 20.98 14.26 Canada 3.02 28.75 0.54 15.14 22.37 5.29 4.65 Major Importers 5/ 34.12 249.57 113.03 259.85 341.51 10.98 44.24 European Union 6/ 13.06 158.92 16.27 122.36 164.11 8.63 15.50 Japan 1.63 0.19 17.50 13.61 17.57 0.00 1.75 Mexico 1.63 32.02 11.32 23.62 40.89 0.50 3.58 N. Afr & Mideast 7/ 9.94 31.00 30.66 50.37 57.93 0.30 13.36 Saudi Arabia 3.39 0.36 11.69 11.13 11.55 0.00 3.89 Southeast Asia 8/ 2.83 26.84 10.74 26.86 34.96 1.54 3.90 South Korea 1.29 0.19 10.50 7.80 10.11 0.00 1.87 Selected Other China 68.38 225.41 12.45 157.78 223.55 0.03 82.65 FSU-12 5.04 87.76 0.78 40.03 55.69 30.80 7.09 Russia 1.38 35.74 0.26 18.90 28.62 6.98 1.77 Ukraine 2.33 40.02 0.08 12.27 15.98 22.77 3.69
2014/15 Est. Beginning
Stocks Production ImportsDomestic
FeedDomestic
Total 2/ ExportsEndingStocks
World 3/ 211.36 1,303.41 168.48 750.17 1,271.09 185.65 243.68United States 34.31 377.23 3.42 139.69 311.35 56.67 46.95Total Foreign 177.05 926.18 165.07 610.48 959.74 128.99 196.73 Major Exporters 4/ 25.54 168.09 4.84 82.27 112.64 67.53 18.30 Argentina 3.17 35.73 0.01 9.07 14.23 21.39 3.29 Australia 1.05 11.65 0.00 2.99 4.66 7.19 0.85 Brazil 14.26 87.60 0.88 50.20 60.00 34.51 8.24 Canada 4.65 21.99 1.71 13.81 21.29 3.72 3.34 Major Importers 5/ 44.24 257.45 108.13 262.82 344.85 15.96 49.01 European Union 6/ 15.50 170.48 8.97 121.48 162.87 13.99 18.09 Japan 1.75 0.17 16.73 12.94 16.93 0.00 1.71 Mexico 3.58 32.39 11.55 24.40 41.93 0.79 4.81 N. Afr & Mideast 7/ 13.36 26.87 34.02 51.63 59.58 0.10 14.58 Saudi Arabia 3.89 0.36 11.26 11.15 11.63 0.00 3.88 Southeast Asia 8/ 3.90 26.86 11.41 29.29 37.30 1.07 3.80 South Korea 1.87 0.24 10.25 8.08 10.47 0.00 1.89 Selected Other China 82.65 222.75 25.70 158.80 229.06 0.02 102.02 FSU-12 7.09 91.60 0.82 41.90 57.93 33.87 7.71 Russia 1.77 40.39 0.09 20.88 31.14 8.67 2.44 Ukraine 3.69 39.39 0.03 11.62 15.23 24.33 3.54
1/ Aggregate of local marketing years. Coarse grains include corn, sorghum, barley, oats, rye, millet, and mixed grains (for U.S. excludes millet and mixed grains). 2/ Total foreign and world use adjusted to reflect the differences in world imports and exports. 3/ World imports and exports may not balance due to differences in marketing years, grain in transit, and reporting discrepancies in some countries. 4/ Argentina, Australia, Canada, Brazil, and South Africa. 5/ The European Union, Mexico, Japan, selected North Africa and Middle East, South Korea, Southeast Asia, and Taiwan. 6/ Trade excludes intra-trade. 7/ Algeria, Egypt, Iran, Israel, Jordan, Libya, Morocco, Syria, Tunisia, and Turkey. 8/ Indonesia, Malaysia, Philippines, Thailand, and Vietnam.
April 2016
WASDE - 552 - 21
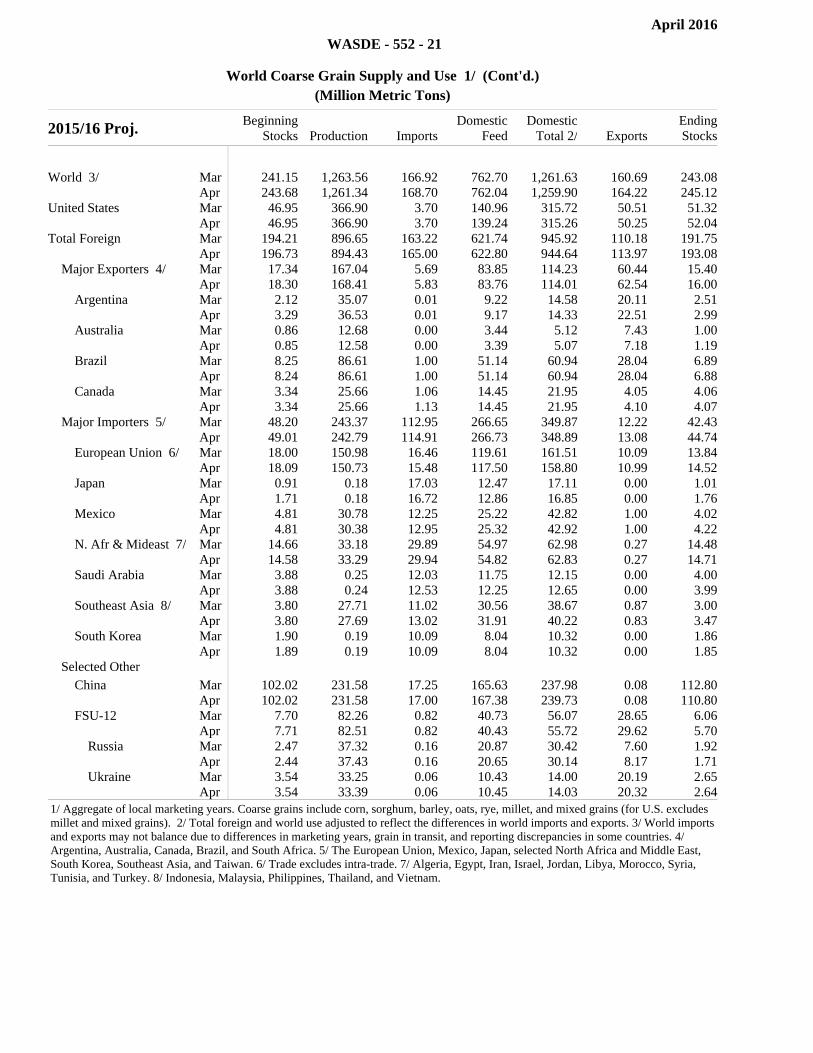
World Coarse Grain Supply and Use 1/ (Cont'd.)
(Million Metric Tons)
2015/16 Proj. BeginningStocks Production Imports
DomesticFeed
DomesticTotal 2/ Exports
EndingStocks
World 3/ Mar 241.15 1,263.56 166.92 762.70 1,261.63 160.69 243.08
Apr 243.68 1,261.34 168.70 762.04 1,259.90 164.22 245.12United States Mar 46.95 366.90 3.70 140.96 315.72 50.51 51.32
Apr 46.95 366.90 3.70 139.24 315.26 50.25 52.04Total Foreign Mar 194.21 896.65 163.22 621.74 945.92 110.18 191.75
Apr 196.73 894.43 165.00 622.80 944.64 113.97 193.08 Major Exporters 4/ Mar 17.34 167.04 5.69 83.85 114.23 60.44 15.40
Apr 18.30 168.41 5.83 83.76 114.01 62.54 16.00 Argentina Mar 2.12 35.07 0.01 9.22 14.58 20.11 2.51
Apr 3.29 36.53 0.01 9.17 14.33 22.51 2.99 Australia Mar 0.86 12.68 0.00 3.44 5.12 7.43 1.00
Apr 0.85 12.58 0.00 3.39 5.07 7.18 1.19 Brazil Mar 8.25 86.61 1.00 51.14 60.94 28.04 6.89
Apr 8.24 86.61 1.00 51.14 60.94 28.04 6.88 Canada Mar 3.34 25.66 1.06 14.45 21.95 4.05 4.06
Apr 3.34 25.66 1.13 14.45 21.95 4.10 4.07 Major Importers 5/ Mar 48.20 243.37 112.95 266.65 349.87 12.22 42.43
Apr 49.01 242.79 114.91 266.73 348.89 13.08 44.74 European Union 6/ Mar 18.00 150.98 16.46 119.61 161.51 10.09 13.84
Apr 18.09 150.73 15.48 117.50 158.80 10.99 14.52 Japan Mar 0.91 0.18 17.03 12.47 17.11 0.00 1.01
Apr 1.71 0.18 16.72 12.86 16.85 0.00 1.76 Mexico Mar 4.81 30.78 12.25 25.22 42.82 1.00 4.02
Apr 4.81 30.38 12.95 25.32 42.92 1.00 4.22 N. Afr & Mideast 7/ Mar 14.66 33.18 29.89 54.97 62.98 0.27 14.48
Apr 14.58 33.29 29.94 54.82 62.83 0.27 14.71 Saudi Arabia Mar 3.88 0.25 12.03 11.75 12.15 0.00 4.00
Apr 3.88 0.24 12.53 12.25 12.65 0.00 3.99 Southeast Asia 8/ Mar 3.80 27.71 11.02 30.56 38.67 0.87 3.00
Apr 3.80 27.69 13.02 31.91 40.22 0.83 3.47 South Korea Mar 1.90 0.19 10.09 8.04 10.32 0.00 1.86
Apr 1.89 0.19 10.09 8.04 10.32 0.00 1.85 Selected Other China Mar 102.02 231.58 17.25 165.63 237.98 0.08 112.80
Apr 102.02 231.58 17.00 167.38 239.73 0.08 110.80 FSU-12 Mar 7.70 82.26 0.82 40.73 56.07 28.65 6.06
Apr 7.71 82.51 0.82 40.43 55.72 29.62 5.70 Russia Mar 2.47 37.32 0.16 20.87 30.42 7.60 1.92
Apr 2.44 37.43 0.16 20.65 30.14 8.17 1.71 Ukraine Mar 3.54 33.25 0.06 10.43 14.00 20.19 2.65
Apr 3.54 33.39 0.06 10.45 14.03 20.32 2.64
1/ Aggregate of local marketing years. Coarse grains include corn, sorghum, barley, oats, rye, millet, and mixed grains (for U.S. excludes millet and mixed grains). 2/ Total foreign and world use adjusted to reflect the differences in world imports and exports. 3/ World imports and exports may not balance due to differences in marketing years, grain in transit, and reporting discrepancies in some countries. 4/ Argentina, Australia, Canada, Brazil, and South Africa. 5/ The European Union, Mexico, Japan, selected North Africa and Middle East, South Korea, Southeast Asia, and Taiwan. 6/ Trade excludes intra-trade. 7/ Algeria, Egypt, Iran, Israel, Jordan, Libya, Morocco, Syria, Tunisia, and Turkey. 8/ Indonesia, Malaysia, Philippines, Thailand, and Vietnam.
April 2016
WASDE - 552 - 22
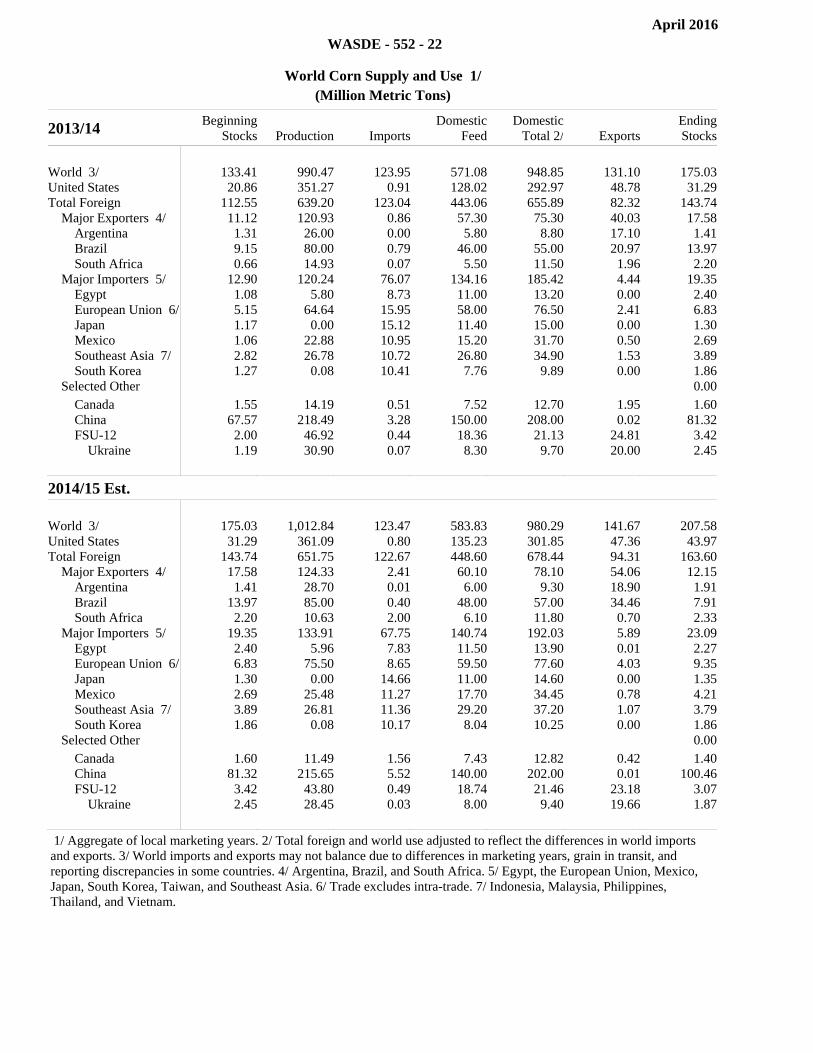
World Corn Supply and Use 1/
(Million Metric Tons)
2013/14 BeginningStocks Production Imports
DomesticFeed
DomesticTotal 2/ Exports
EndingStocks
World 3/ 133.41 990.47 123.95 571.08 948.85 131.10 175.03United States 20.86 351.27 0.91 128.02 292.97 48.78 31.29Total Foreign 112.55 639.20 123.04 443.06 655.89 82.32 143.74 Major Exporters 4/ 11.12 120.93 0.86 57.30 75.30 40.03 17.58 Argentina 1.31 26.00 0.00 5.80 8.80 17.10 1.41 Brazil 9.15 80.00 0.79 46.00 55.00 20.97 13.97 South Africa 0.66 14.93 0.07 5.50 11.50 1.96 2.20 Major Importers 5/ 12.90 120.24 76.07 134.16 185.42 4.44 19.35 Egypt 1.08 5.80 8.73 11.00 13.20 0.00 2.40 European Union 6/ 5.15 64.64 15.95 58.00 76.50 2.41 6.83 Japan 1.17 0.00 15.12 11.40 15.00 0.00 1.30 Mexico 1.06 22.88 10.95 15.20 31.70 0.50 2.69 Southeast Asia 7/ 2.82 26.78 10.72 26.80 34.90 1.53 3.89 South Korea 1.27 0.08 10.41 7.76 9.89 0.00 1.86 Selected Other 0.00 Canada 1.55 14.19 0.51 7.52 12.70 1.95 1.60 China 67.57 218.49 3.28 150.00 208.00 0.02 81.32 FSU-12 2.00 46.92 0.44 18.36 21.13 24.81 3.42 Ukraine 1.19 30.90 0.07 8.30 9.70 20.00 2.45
2014/15 Est. Beginning
Stocks Production ImportsDomestic
FeedDomestic
Total 2/ Exports Ending Stocks
World 3/ 175.03 1,012.84 123.47 583.83 980.29 141.67 207.58United States 31.29 361.09 0.80 135.23 301.85 47.36 43.97Total Foreign 143.74 651.75 122.67 448.60 678.44 94.31 163.60 Major Exporters 4/ 17.58 124.33 2.41 60.10 78.10 54.06 12.15 Argentina 1.41 28.70 0.01 6.00 9.30 18.90 1.91 Brazil 13.97 85.00 0.40 48.00 57.00 34.46 7.91 South Africa 2.20 10.63 2.00 6.10 11.80 0.70 2.33 Major Importers 5/ 19.35 133.91 67.75 140.74 192.03 5.89 23.09 Egypt 2.40 5.96 7.83 11.50 13.90 0.01 2.27 European Union 6/ 6.83 75.50 8.65 59.50 77.60 4.03 9.35 Japan 1.30 0.00 14.66 11.00 14.60 0.00 1.35 Mexico 2.69 25.48 11.27 17.70 34.45 0.78 4.21 Southeast Asia 7/ 3.89 26.81 11.36 29.20 37.20 1.07 3.79 South Korea 1.86 0.08 10.17 8.04 10.25 0.00 1.86 Selected Other 0.00 Canada 1.60 11.49 1.56 7.43 12.82 0.42 1.40 China 81.32 215.65 5.52 140.00 202.00 0.01 100.46 FSU-12 3.42 43.80 0.49 18.74 21.46 23.18 3.07 Ukraine 2.45 28.45 0.03 8.00 9.40 19.66 1.87
1/ Aggregate of local marketing years. 2/ Total foreign and world use adjusted to reflect the differences in world imports and exports. 3/ World imports and exports may not balance due to differences in marketing years, grain in transit, and reporting discrepancies in some countries. 4/ Argentina, Brazil, and South Africa. 5/ Egypt, the European Union, Mexico, Japan, South Korea, Taiwan, and Southeast Asia. 6/ Trade excludes intra-trade. 7/ Indonesia, Malaysia, Philippines, Thailand, and Vietnam.
April 2016
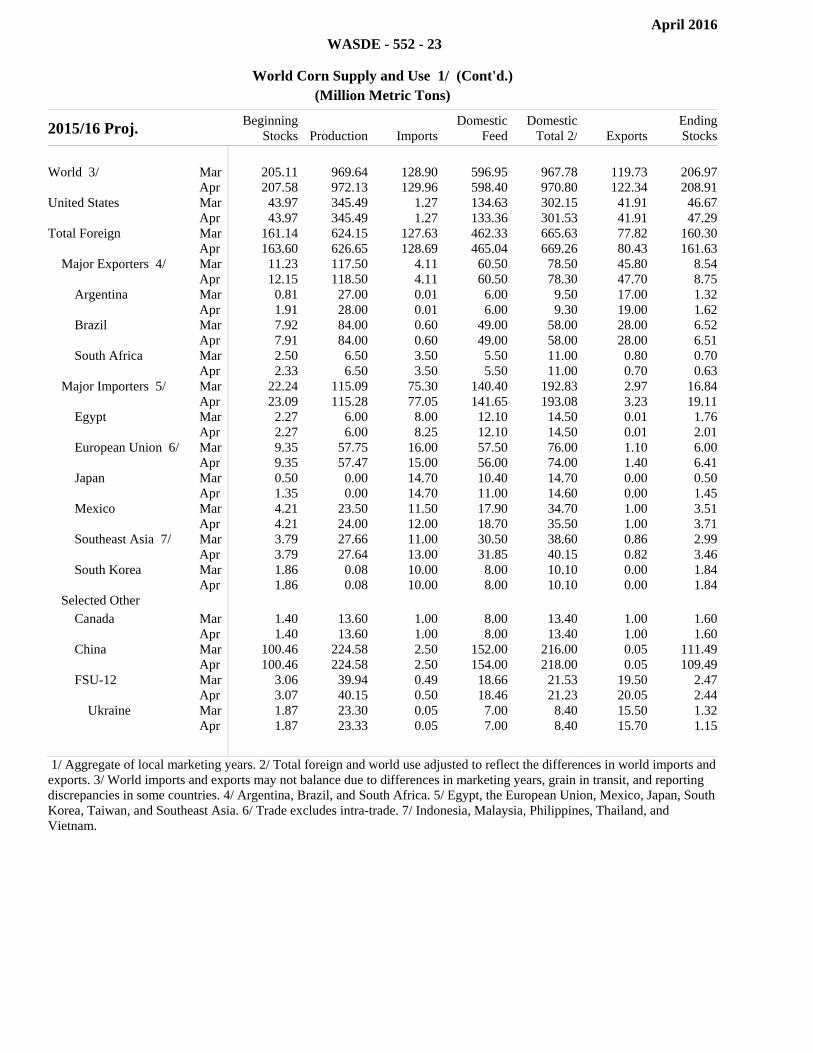
WASDE - 552 - 23
World Corn Supply and Use 1/ (Cont'd.)
(Million Metric Tons)
2015/16 Proj. BeginningStocks Production Imports
DomesticFeed
DomesticTotal 2/ Exports
EndingStocks
World 3/ Mar 205.11 969.64 128.90 596.95 967.78 119.73 206.97
Apr 207.58 972.13 129.96 598.40 970.80 122.34 208.91United States Mar 43.97 345.49 1.27 134.63 302.15 41.91 46.67
Apr 43.97 345.49 1.27 133.36 301.53 41.91 47.29Total Foreign Mar 161.14 624.15 127.63 462.33 665.63 77.82 160.30
Apr 163.60 626.65 128.69 465.04 669.26 80.43 161.63 Major Exporters 4/ Mar 11.23 117.50 4.11 60.50 78.50 45.80 8.54
Apr 12.15 118.50 4.11 60.50 78.30 47.70 8.75 Argentina Mar 0.81 27.00 0.01 6.00 9.50 17.00 1.32
Apr 1.91 28.00 0.01 6.00 9.30 19.00 1.62 Brazil Mar 7.92 84.00 0.60 49.00 58.00 28.00 6.52
Apr 7.91 84.00 0.60 49.00 58.00 28.00 6.51 South Africa Mar 2.50 6.50 3.50 5.50 11.00 0.80 0.70
Apr 2.33 6.50 3.50 5.50 11.00 0.70 0.63 Major Importers 5/ Mar 22.24 115.09 75.30 140.40 192.83 2.97 16.84
Apr 23.09 115.28 77.05 141.65 193.08 3.23 19.11 Egypt Mar 2.27 6.00 8.00 12.10 14.50 0.01 1.76
Apr 2.27 6.00 8.25 12.10 14.50 0.01 2.01 European Union 6/ Mar 9.35 57.75 16.00 57.50 76.00 1.10 6.00
Apr 9.35 57.47 15.00 56.00 74.00 1.40 6.41 Japan Mar 0.50 0.00 14.70 10.40 14.70 0.00 0.50
Apr 1.35 0.00 14.70 11.00 14.60 0.00 1.45 Mexico Mar 4.21 23.50 11.50 17.90 34.70 1.00 3.51
Apr 4.21 24.00 12.00 18.70 35.50 1.00 3.71 Southeast Asia 7/ Mar 3.79 27.66 11.00 30.50 38.60 0.86 2.99
Apr 3.79 27.64 13.00 31.85 40.15 0.82 3.46 South Korea Mar 1.86 0.08 10.00 8.00 10.10 0.00 1.84
Apr 1.86 0.08 10.00 8.00 10.10 0.00 1.84 Selected Other Canada Mar 1.40 13.60 1.00 8.00 13.40 1.00 1.60
Apr 1.40 13.60 1.00 8.00 13.40 1.00 1.60 China Mar 100.46 224.58 2.50 152.00 216.00 0.05 111.49
Apr 100.46 224.58 2.50 154.00 218.00 0.05 109.49 FSU-12 Mar 3.06 39.94 0.49 18.66 21.53 19.50 2.47
Apr 3.07 40.15 0.50 18.46 21.23 20.05 2.44 Ukraine Mar 1.87 23.30 0.05 7.00 8.40 15.50 1.32
Apr 1.87 23.33 0.05 7.00 8.40 15.70 1.15
1/ Aggregate of local marketing years. 2/ Total foreign and world use adjusted to reflect the differences in world imports and exports. 3/ World imports and exports may not balance due to differences in marketing years, grain in transit, and reporting discrepancies in some countries. 4/ Argentina, Brazil, and South Africa. 5/ Egypt, the European Union, Mexico, Japan, South Korea, Taiwan, and Southeast Asia. 6/ Trade excludes intra-trade. 7/ Indonesia, Malaysia, Philippines, Thailand, and Vietnam.

April 2016
WASDE - 552 - 24
World Rice Supply and Use (Milled Basis) 1/
(Million Metric Tons)
2013/14 BeginningStocks
Production Imports Total /2Domestic
Exports EndingStocks
World 3/ 110.56 478.42 38.40 481.61 42.23 107.37United States 1.16 6.12 0.73 3.98 3.01 1.03Total Foreign 109.41 472.30 37.66 477.63 39.22 106.34 Major Exporters 4/ 39.41 162.07 0.63 134.19 31.11 36.81 India 25.44 106.65 0.00 98.71 10.62 22.76 Pakistan 0.30 6.80 0.03 2.60 3.20 1.33 Thailand 12.81 20.46 0.30 10.88 10.97 11.72 Vietnam 0.86 28.16 0.30 22.00 6.33 1.00 Major Importers 5/ 12.51 64.32 12.42 76.99 1.10 11.15 Brazil 0.53 8.30 0.53 7.90 0.82 0.64 European Union 6/ 1.19 1.94 1.53 3.25 0.24 1.16 Indonesia 6.48 36.30 1.23 38.50 0.00 5.50 Nigeria 0.89 2.77 2.80 5.80 0.00 0.66 Philippines 1.49 11.86 1.20 12.85 0.00 1.70 Sel. Mideast 7/ 1.50 1.95 3.96 6.12 0.00 1.29 Selected Other 0.00 Burma 0.55 11.96 0.00 10.45 1.69 0.37 C. Amer & Carib 8/ 0.48 1.78 1.41 3.19 0.01 0.47 China 46.83 142.53 4.00 146.30 0.26 46.80 Egypt 0.43 4.75 0.03 4.00 0.60 0.60 Japan 2.86 7.93 0.66 8.38 0.06 3.01 Mexico 0.19 0.13 0.69 0.86 0.00 0.15 South Korea 0.78 4.23 0.31 4.42 0.00 0.90
2014/15 Est. Beginning
Stocks Production ImportsTotal /2
Domestic ExportsEndingStocks
World 3/ 107.37 478.80 41.06 482.54 43.98 103.62United States 1.03 7.11 0.78 4.16 3.21 1.55Total Foreign 106.34 471.69 40.28 478.39 40.77 102.07 Major Exporters 4/ 36.81 159.30 0.73 133.83 32.62 30.38 India 22.76 105.48 0.00 98.23 12.24 17.77 Pakistan 1.33 6.90 0.03 2.70 4.00 1.56 Thailand 11.72 18.75 0.30 10.90 9.78 10.10 Vietnam 1.00 28.17 0.40 22.00 6.61 0.96 Major Importers 5/ 11.15 64.06 14.13 77.30 1.21 10.84 Brazil 0.64 8.47 0.37 7.93 0.91 0.64 European Union 6/ 1.16 1.96 1.70 3.32 0.27 1.24 Indonesia 5.50 35.56 1.20 38.30 0.00 3.96 Nigeria 0.66 2.84 3.50 5.80 0.00 1.19 Philippines 1.70 11.92 1.80 13.20 0.00 2.21 Sel. Mideast 7/ 1.29 1.98 3.93 6.08 0.00 1.12 Selected Other 0.00 Burma 0.37 12.60 0.00 10.65 1.75 0.57 C. Amer & Carib 8/ 0.47 1.81 1.62 3.38 0.01 0.51 China 46.80 144.56 4.70 148.00 0.43 47.64 Egypt 0.60 4.53 0.03 4.00 0.25 0.92 Japan 3.01 7.85 0.64 8.60 0.07 2.82 Mexico 0.15 0.18 0.69 0.86 0.00 0.15 South Korea 0.90 4.24 0.47 4.42 0.00 1.19
1/ Aggregate of local marketing years. 2/ Total foreign and world use adjusted to reflect the differences in world imports and exports. Total domestic includes both domestic use and unreported disappearance. 3/ World imports and exports may not balance due to differences in some countries. 4/ India, Pakistan, Thailand, and Vietnam. 5/ Brazil, Indonesia, Hong Kong, Cote d'Ivoire, Nigeria, Philippines, selected Middle East, and the EU-28. 6/ Trade excludes intra-trade. 7/ Selected Middle East includes Iran, Iraq, and Saudi Arabia. 8/ Central American and Caribbean countries.
April 2016
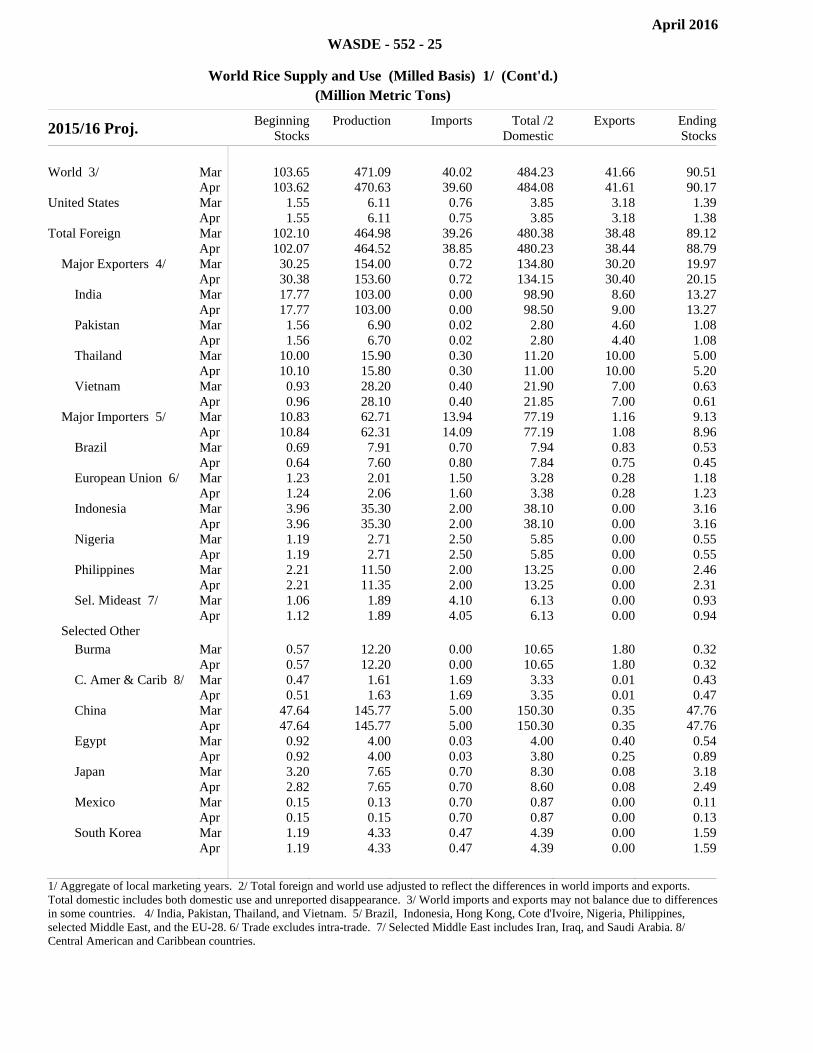
WASDE - 552 - 25
World Rice Supply and Use (Milled Basis) 1/ (Cont'd.)
(Million Metric Tons)
2015/16 Proj. BeginningStocks
Production Imports Total /2Domestic
Exports EndingStocks
World 3/ Mar 103.65 471.09 40.02 484.23 41.66 90.51
Apr 103.62 470.63 39.60 484.08 41.61 90.17United States Mar 1.55 6.11 0.76 3.85 3.18 1.39
Apr 1.55 6.11 0.75 3.85 3.18 1.38Total Foreign Mar 102.10 464.98 39.26 480.38 38.48 89.12
Apr 102.07 464.52 38.85 480.23 38.44 88.79 Major Exporters 4/ Mar 30.25 154.00 0.72 134.80 30.20 19.97
Apr 30.38 153.60 0.72 134.15 30.40 20.15 India Mar 17.77 103.00 0.00 98.90 8.60 13.27
Apr 17.77 103.00 0.00 98.50 9.00 13.27 Pakistan Mar 1.56 6.90 0.02 2.80 4.60 1.08
Apr 1.56 6.70 0.02 2.80 4.40 1.08 Thailand Mar 10.00 15.90 0.30 11.20 10.00 5.00
Apr 10.10 15.80 0.30 11.00 10.00 5.20 Vietnam Mar 0.93 28.20 0.40 21.90 7.00 0.63
Apr 0.96 28.10 0.40 21.85 7.00 0.61 Major Importers 5/ Mar 10.83 62.71 13.94 77.19 1.16 9.13
Apr 10.84 62.31 14.09 77.19 1.08 8.96 Brazil Mar 0.69 7.91 0.70 7.94 0.83 0.53
Apr 0.64 7.60 0.80 7.84 0.75 0.45 European Union 6/ Mar 1.23 2.01 1.50 3.28 0.28 1.18
Apr 1.24 2.06 1.60 3.38 0.28 1.23 Indonesia Mar 3.96 35.30 2.00 38.10 0.00 3.16
Apr 3.96 35.30 2.00 38.10 0.00 3.16 Nigeria Mar 1.19 2.71 2.50 5.85 0.00 0.55
Apr 1.19 2.71 2.50 5.85 0.00 0.55 Philippines Mar 2.21 11.50 2.00 13.25 0.00 2.46
Apr 2.21 11.35 2.00 13.25 0.00 2.31 Sel. Mideast 7/ Mar 1.06 1.89 4.10 6.13 0.00 0.93
Apr 1.12 1.89 4.05 6.13 0.00 0.94 Selected Other Burma Mar 0.57 12.20 0.00 10.65 1.80 0.32
Apr 0.57 12.20 0.00 10.65 1.80 0.32 C. Amer & Carib 8/ Mar 0.47 1.61 1.69 3.33 0.01 0.43
Apr 0.51 1.63 1.69 3.35 0.01 0.47 China Mar 47.64 145.77 5.00 150.30 0.35 47.76
Apr 47.64 145.77 5.00 150.30 0.35 47.76 Egypt Mar 0.92 4.00 0.03 4.00 0.40 0.54
Apr 0.92 4.00 0.03 3.80 0.25 0.89 Japan Mar 3.20 7.65 0.70 8.30 0.08 3.18
Apr 2.82 7.65 0.70 8.60 0.08 2.49 Mexico Mar 0.15 0.13 0.70 0.87 0.00 0.11
Apr 0.15 0.15 0.70 0.87 0.00 0.13 South Korea Mar 1.19 4.33 0.47 4.39 0.00 1.59
Apr 1.19 4.33 0.47 4.39 0.00 1.59
1/ Aggregate of local marketing years. 2/ Total foreign and world use adjusted to reflect the differences in world imports and exports. Total domestic includes both domestic use and unreported disappearance. 3/ World imports and exports may not balance due to differences in some countries. 4/ India, Pakistan, Thailand, and Vietnam. 5/ Brazil, Indonesia, Hong Kong, Cote d'Ivoire, Nigeria, Philippines, selected Middle East, and the EU-28. 6/ Trade excludes intra-trade. 7/ Selected Middle East includes Iran, Iraq, and Saudi Arabia. 8/ Central American and Caribbean countries.

April 2016
WASDE - 552 - 26
World Cotton Supply and Use 1/
(Million 480-Pound Bales)
2013/14 BeginningStocks
Production Imports DomesticUse
Exports Loss /2
EndingStocks
World 91.66 120.41 41.23 109.92 40.87 -0.36 102.86United States 3.80 12.91 0.01 3.55 10.53 0.29 2.35Total Foreign 87.86 107.50 41.22 106.37 30.34 -0.66 100.51 Major Exporters 4/ 27.37 57.03 1.36 32.00 26.58 -0.83 28.01 Central Asia 5/ 4.21 6.60 3/ 2.35 5.05 0.00 3.41 Afr. Fr. Zone 6/ 1.30 4.37 3/ 0.15 4.13 0.00 1.39 S. Hemis 7/ 9.73 14.04 0.29 5.26 7.74 -0.34 11.40 Australia 2.40 4.10 3/ 0.04 4.85 -0.20 1.81 Brazil 5.80 8.00 0.15 4.20 2.23 -0.15 7.67 India 11.80 31.00 0.68 23.25 9.26 -0.50 11.46 Major Importers 8/ 58.63 47.23 37.59 69.96 2.64 0.17 70.69 Mexico 0.65 0.93 1.04 1.85 0.16 0.03 0.58 China 50.36 32.75 14.12 34.50 0.03 0.00 62.71 European Union 9/ 0.41 1.60 0.87 0.85 1.60 0.05 0.38 Turkey 1.32 2.30 4.25 6.30 0.20 0.00 1.36 Pakistan 2.71 9.50 1.20 10.40 0.51 0.03 2.48 Indonesia 0.54 0.03 2.99 3.05 0.01 0.00 0.50 Thailand 0.24 3/ 1.55 1.53 0.00 0.03 0.24 Bangladesh 1.17 0.12 5.30 5.30 0.00 0.01 1.27 Vietnam 0.49 0.01 3.20 3.20 0.00 0.00 0.50
2014/15 Est. Beginning
Stocks Production ImportsDomestic
Use ExportsLoss
/2 EndingStocks
World 102.86 119.07 35.63 110.20 35.38 0.11 111.88United States 2.35 16.32 0.01 3.58 11.25 0.16 3.70Total Foreign 100.51 102.75 35.62 106.63 24.13 -0.05 108.18 Major Exporters 4/ 28.01 52.62 1.73 32.40 20.65 -0.23 29.54 Central Asia 5/ 3.41 6.20 3/ 2.46 4.69 0.00 2.45 Afr. Fr. Zone 6/ 1.39 5.09 3/ 0.14 4.33 0.00 2.00 S. Hemis 7/ 11.40 11.02 0.17 4.45 7.05 -0.24 11.32 Australia 1.81 2.30 3/ 0.04 2.39 -0.10 1.78 Brazil 7.67 7.00 0.02 3.40 3.91 -0.15 7.53 India 11.46 29.50 1.23 24.50 4.20 0.00 13.49 Major Importers 8/ 70.69 46.89 31.82 69.86 2.57 0.17 76.80 Mexico 0.58 1.32 0.83 1.85 0.17 0.03 0.69 China 62.71 30.00 8.28 33.00 0.07 0.00 67.92 European Union 9/ 0.38 1.64 0.86 0.87 1.62 0.05 0.33 Turkey 1.36 3.20 3.68 6.40 0.24 0.00 1.60 Pakistan 2.48 10.60 0.84 10.60 0.45 0.03 2.84 Indonesia 0.50 0.01 3.35 3.25 0.01 0.00 0.60 Thailand 0.24 3/ 1.48 1.48 0.00 0.03 0.22 Bangladesh 1.27 0.12 5.40 5.50 0.00 0.01 1.28 Vietnam 0.50 3/ 4.30 4.10 0.00 0.00 0.70
1/ Marketing year beginning August 1. Totals may not add exactly and trade may not balance due to rounding and other factors. 2/ Generally reflects cotton lost or destroyed in the marketing channel; for Australia, Brazil, China, and the United States, reflects the difference between implicit stocks based on supply less total use and indicated ending stocks. 3/ Less than 5,000 bales. 4/ Includes Egypt and Syria in addition to the countries and regions listed. 5/ Azerbaijan, Kazakhstan, Kyrgyzstan, Tajikistan, Turkmenistan, and Uzbekistan. 6/ Benin, Burkino Faso, Cameroon, Central African Republic, Chad, Cote d'Ivoire, Mali, Niger, Senegal, and Togo. 7/ Argentina, Australia, Brazil, Lesotho, Paraguay, South Africa, Tanzania, and Zimbabwe. 8/ In addition to the countries and regions listed, includes Hong Kong, Japan, Russia, South Korea, and Taiwan. 9/ Includes intra-EU trade.
April 2016
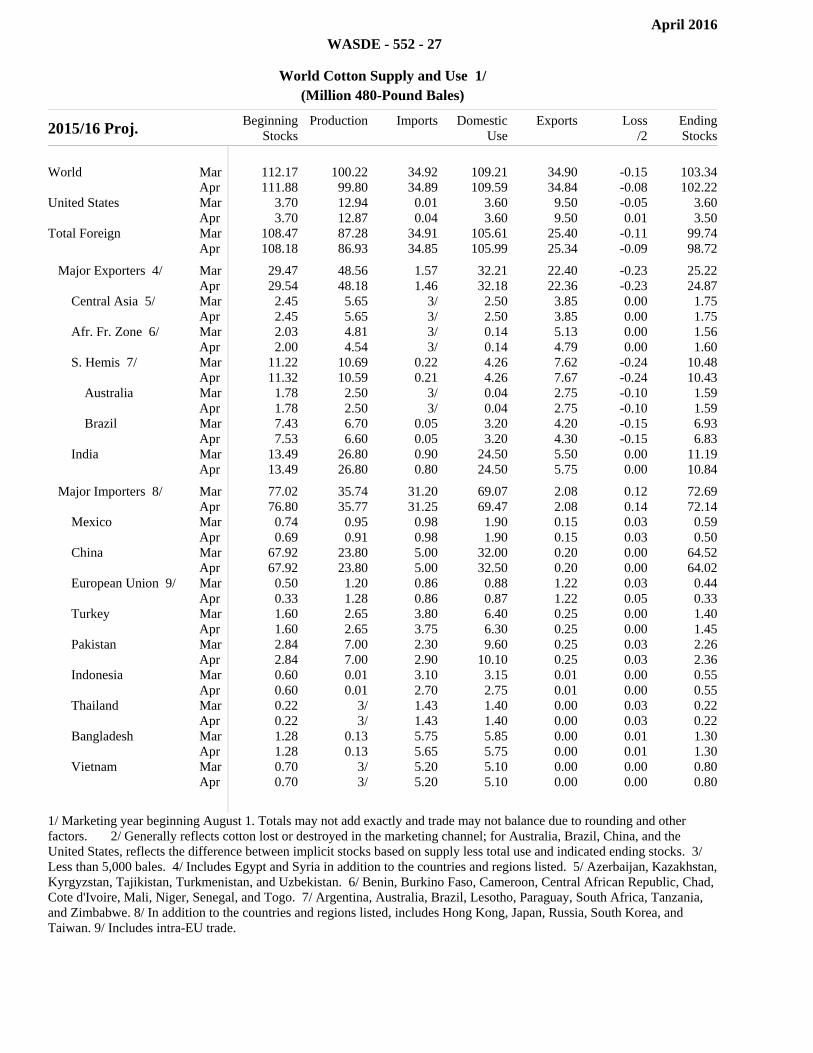
WASDE - 552 - 27
World Cotton Supply and Use 1/
(Million 480-Pound Bales)
2015/16 Proj. BeginningStocks
Production Imports DomesticUse
Exports Loss /2
EndingStocks
World Mar 112.17 100.22 34.92 109.21 34.90 -0.15 103.34
Apr 111.88 99.80 34.89 109.59 34.84 -0.08 102.22United States Mar 3.70 12.94 0.01 3.60 9.50 -0.05 3.60
Apr 3.70 12.87 0.04 3.60 9.50 0.01 3.50Total Foreign Mar 108.47 87.28 34.91 105.61 25.40 -0.11 99.74
Apr 108.18 86.93 34.85 105.99 25.34 -0.09 98.72filler filler filler filler filler filler filler
Major Exporters 4/ Mar 29.47 48.56 1.57 32.21 22.40 -0.23 25.22Apr 29.54 48.18 1.46 32.18 22.36 -0.23 24.87
Central Asia 5/ Mar 2.45 5.65 3/ 2.50 3.85 0.00 1.75Apr 2.45 5.65 3/ 2.50 3.85 0.00 1.75
Afr. Fr. Zone 6/ Mar 2.03 4.81 3/ 0.14 5.13 0.00 1.56Apr 2.00 4.54 3/ 0.14 4.79 0.00 1.60
S. Hemis 7/ Mar 11.22 10.69 0.22 4.26 7.62 -0.24 10.48Apr 11.32 10.59 0.21 4.26 7.67 -0.24 10.43
Australia Mar 1.78 2.50 3/ 0.04 2.75 -0.10 1.59Apr 1.78 2.50 3/ 0.04 2.75 -0.10 1.59
Brazil Mar 7.43 6.70 0.05 3.20 4.20 -0.15 6.93Apr 7.53 6.60 0.05 3.20 4.30 -0.15 6.83
India Mar 13.49 26.80 0.90 24.50 5.50 0.00 11.19Apr 13.49 26.80 0.80 24.50 5.75 0.00 10.84
filler filler filler filler filler filler filler
Major Importers 8/ Mar 77.02 35.74 31.20 69.07 2.08 0.12 72.69Apr 76.80 35.77 31.25 69.47 2.08 0.14 72.14
Mexico Mar 0.74 0.95 0.98 1.90 0.15 0.03 0.59Apr 0.69 0.91 0.98 1.90 0.15 0.03 0.50
China Mar 67.92 23.80 5.00 32.00 0.20 0.00 64.52Apr 67.92 23.80 5.00 32.50 0.20 0.00 64.02
European Union 9/ Mar 0.50 1.20 0.86 0.88 1.22 0.03 0.44Apr 0.33 1.28 0.86 0.87 1.22 0.05 0.33
Turkey Mar 1.60 2.65 3.80 6.40 0.25 0.00 1.40Apr 1.60 2.65 3.75 6.30 0.25 0.00 1.45
Pakistan Mar 2.84 7.00 2.30 9.60 0.25 0.03 2.26Apr 2.84 7.00 2.90 10.10 0.25 0.03 2.36
Indonesia Mar 0.60 0.01 3.10 3.15 0.01 0.00 0.55Apr 0.60 0.01 2.70 2.75 0.01 0.00 0.55
Thailand Mar 0.22 3/ 1.43 1.40 0.00 0.03 0.22Apr 0.22 3/ 1.43 1.40 0.00 0.03 0.22
Bangladesh Mar 1.28 0.13 5.75 5.85 0.00 0.01 1.30Apr 1.28 0.13 5.65 5.75 0.00 0.01 1.30
Vietnam Mar 0.70 3/ 5.20 5.10 0.00 0.00 0.80Apr 0.70 3/ 5.20 5.10 0.00 0.00 0.80
1/ Marketing year beginning August 1. Totals may not add exactly and trade may not balance due to rounding and other factors. 2/ Generally reflects cotton lost or destroyed in the marketing channel; for Australia, Brazil, China, and the United States, reflects the difference between implicit stocks based on supply less total use and indicated ending stocks. 3/ Less than 5,000 bales. 4/ Includes Egypt and Syria in addition to the countries and regions listed. 5/ Azerbaijan, Kazakhstan, Kyrgyzstan, Tajikistan, Turkmenistan, and Uzbekistan. 6/ Benin, Burkino Faso, Cameroon, Central African Republic, Chad, Cote d'Ivoire, Mali, Niger, Senegal, and Togo. 7/ Argentina, Australia, Brazil, Lesotho, Paraguay, South Africa, Tanzania, and Zimbabwe. 8/ In addition to the countries and regions listed, includes Hong Kong, Japan, Russia, South Korea, and Taiwan. 9/ Includes intra-EU trade.

April 2016
WASDE - 552 - 28
World Soybean Supply and Use 1/
(Million Metric Tons)
2013/14 BeginningStocks
Production Imports DomesticCrush
DomesticTotal
Exports EndingStocks
World 2/ 55.26 282.61 111.85 241.27 275.25 112.70 61.77United States 3.83 91.39 1.95 47.19 50.09 44.57 2.50Total Foreign 51.44 191.22 109.90 194.08 225.16 68.13 59.27 Major Exporters 3/ 35.01 151.59 0.63 76.47 83.13 62.67 41.43 Argentina 19.47 53.40 0.00 36.17 39.76 7.84 25.27 Brazil 15.36 86.70 0.61 36.86 39.81 46.83 16.02 Paraguay 0.15 8.19 0.01 3.35 3.41 4.80 0.13 Major Importers 4/ 13.76 14.48 96.52 91.35 109.13 0.34 15.29 China 12.38 11.95 70.36 68.85 80.60 0.22 13.88 European Union 0.74 1.21 13.29 13.40 14.56 0.06 0.62 Japan 0.18 0.20 2.89 1.97 3.05 0.00 0.23 Mexico 0.10 0.24 3.84 4.03 4.07 0.00 0.12
2014/15 Est. Beginning
Stocks Production ImportsDomestic
CrushDomestic
Total Exports Ending Stocks
World 2/ 61.77 319.55 122.08 262.08 299.69 125.97 77.73United States 2.50 106.88 0.90 50.98 54.93 50.17 5.19Total Foreign 59.27 212.67 121.17 211.11 244.76 75.81 72.54 Major Exporters 3/ 41.43 169.81 0.32 84.52 91.77 68.52 51.27 Argentina 25.27 61.40 0.00 40.24 44.40 10.57 31.70 Brazil 16.02 97.20 0.31 40.44 43.41 50.61 19.50 Paraguay 0.13 8.10 0.01 3.65 3.69 4.49 0.06 Major Importers 4/ 15.29 15.42 105.25 98.03 117.20 0.29 18.47 China 13.88 12.15 78.35 74.50 87.20 0.14 17.03 European Union 0.62 1.83 13.39 13.60 15.07 0.12 0.66 Japan 0.23 0.23 3.00 2.15 3.24 0.00 0.22 Mexico 0.12 0.36 3.82 4.18 4.21 0.00 0.08
2015/16 Proj. Beginning
Stocks Production Imports Domestic Crush
Domestic Total
Exports Ending Stocks
World 2/ Mar 77.14 320.21 128.16 278.04 315.75 130.90 78.87Apr 77.73 320.15 129.85 277.66 316.35 132.36 79.02
United States Mar 5.19 106.93 0.82 50.89 54.43 45.99 12.51Apr 5.19 106.93 0.82 50.89 54.42 46.40 12.11
Total Foreign Mar 71.95 213.27 127.35 227.15 261.32 84.90 66.36Apr 72.54 213.22 129.03 226.77 261.92 85.96 66.91
Major Exporters 3/ Mar 50.88 170.41 0.32 90.00 97.33 77.25 47.04Apr 51.27 170.91 0.37 90.00 97.47 78.35 46.74
Argentina Mar 31.80 58.50 0.00 45.70 49.85 11.80 28.65Apr 31.70 59.00 0.05 45.70 50.05 11.40 29.30
Brazil Mar 19.01 100.00 0.30 40.00 43.00 58.00 18.31Apr 19.50 100.00 0.30 40.00 43.00 59.50 17.30
Paraguay Mar 0.06 8.80 0.01 4.10 4.20 4.60 0.06Apr 0.06 8.80 0.01 4.10 4.14 4.60 0.13
Major Importers 4/ Mar 18.39 15.48 109.18 106.31 125.81 0.38 16.86Apr 18.47 15.41 110.43 105.99 126.15 0.33 17.83
China Mar 17.03 12.00 82.00 81.80 95.25 0.20 15.58Apr 17.03 11.80 83.00 81.80 95.25 0.15 16.43
European Union Mar 0.58 2.05 13.20 14.30 15.17 0.15 0.51Apr 0.66 2.20 13.20 13.80 15.32 0.15 0.59
Japan Mar 0.22 0.22 2.90 2.02 3.10 0.00 0.24Apr 0.22 0.22 3.10 2.20 3.30 0.00 0.24
Mexico Mar 0.08 0.36 3.85 4.15 4.19 0.00 0.10Apr 0.08 0.36 3.95 4.25 4.29 0.00 0.10
1/ Data based on local marketing years except Argentina and Brazil which are adjusted to an October-September year. 2/ World imports and exports may not balance due to differences in local marketing years and to time lags between reported exports and imports. Therefore, world supply may not equal world use. 3/ Argentina, Brazil, Paraguay, and Uruguay. 4/ China, European Union, Japan, Mexico, and Southeast Asia (includes Indonesia, Malaysia, Philippines, Vietnam, and Thailand).
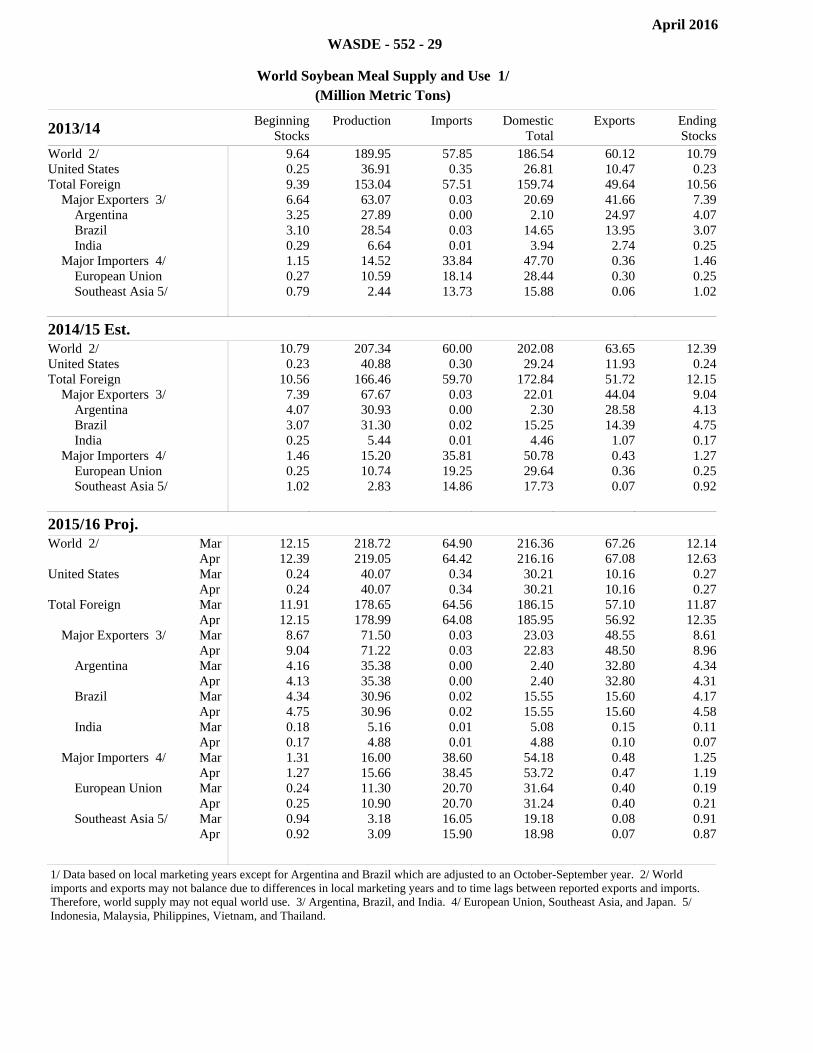
April 2016
WASDE - 552 - 29
World Soybean Meal Supply and Use 1/
(Million Metric Tons)
2013/14 BeginningStocks
Production Imports DomesticTotal
Exports EndingStocks
World 2/ 9.64 189.95 57.85 186.54 60.12 10.79United States 0.25 36.91 0.35 26.81 10.47 0.23Total Foreign 9.39 153.04 57.51 159.74 49.64 10.56 Major Exporters 3/ 6.64 63.07 0.03 20.69 41.66 7.39 Argentina 3.25 27.89 0.00 2.10 24.97 4.07 Brazil 3.10 28.54 0.03 14.65 13.95 3.07 India 0.29 6.64 0.01 3.94 2.74 0.25 Major Importers 4/ 1.15 14.52 33.84 47.70 0.36 1.46 European Union 0.27 10.59 18.14 28.44 0.30 0.25 Southeast Asia 5/ 0.79 2.44 13.73 15.88 0.06 1.02
2014/15 Est. Beginning
Stocks Production ImportsDomestic
Total Exports Ending Stocks
World 2/ 10.79 207.34 60.00 202.08 63.65 12.39United States 0.23 40.88 0.30 29.24 11.93 0.24Total Foreign 10.56 166.46 59.70 172.84 51.72 12.15 Major Exporters 3/ 7.39 67.67 0.03 22.01 44.04 9.04 Argentina 4.07 30.93 0.00 2.30 28.58 4.13 Brazil 3.07 31.30 0.02 15.25 14.39 4.75 India 0.25 5.44 0.01 4.46 1.07 0.17 Major Importers 4/ 1.46 15.20 35.81 50.78 0.43 1.27 European Union 0.25 10.74 19.25 29.64 0.36 0.25 Southeast Asia 5/ 1.02 2.83 14.86 17.73 0.07 0.92
2015/16 Proj. Beginning
Stocks Production Imports Domestic Total
Exports Ending Stocks
World 2/ Mar 12.15 218.72 64.90 216.36 67.26 12.14Apr 12.39 219.05 64.42 216.16 67.08 12.63
United States Mar 0.24 40.07 0.34 30.21 10.16 0.27Apr 0.24 40.07 0.34 30.21 10.16 0.27
Total Foreign Mar 11.91 178.65 64.56 186.15 57.10 11.87Apr 12.15 178.99 64.08 185.95 56.92 12.35
Major Exporters 3/ Mar 8.67 71.50 0.03 23.03 48.55 8.61Apr 9.04 71.22 0.03 22.83 48.50 8.96
Argentina Mar 4.16 35.38 0.00 2.40 32.80 4.34Apr 4.13 35.38 0.00 2.40 32.80 4.31
Brazil Mar 4.34 30.96 0.02 15.55 15.60 4.17Apr 4.75 30.96 0.02 15.55 15.60 4.58
India Mar 0.18 5.16 0.01 5.08 0.15 0.11Apr 0.17 4.88 0.01 4.88 0.10 0.07
Major Importers 4/ Mar 1.31 16.00 38.60 54.18 0.48 1.25Apr 1.27 15.66 38.45 53.72 0.47 1.19
European Union Mar 0.24 11.30 20.70 31.64 0.40 0.19Apr 0.25 10.90 20.70 31.24 0.40 0.21
Southeast Asia 5/ Mar 0.94 3.18 16.05 19.18 0.08 0.91Apr 0.92 3.09 15.90 18.98 0.07 0.87
1/ Data based on local marketing years except for Argentina and Brazil which are adjusted to an October-September year. 2/ World imports and exports may not balance due to differences in local marketing years and to time lags between reported exports and imports. Therefore, world supply may not equal world use. 3/ Argentina, Brazil, and India. 4/ European Union, Southeast Asia, and Japan. 5/ Indonesia, Malaysia, Philippines, Vietnam, and Thailand.

April 2016
WASDE - 552 - 30
World Soybean Oil Supply and Use 1/
(Million Metric Tons)
2013/14 BeginningStocks
Production Imports DomesticTotal
Exports EndingStocks
World 2/ 3.88 45.12 9.28 45.21 9.46 3.61United States 0.75 9.13 0.08 8.58 0.85 0.53Total Foreign 3.13 35.99 9.21 36.63 8.61 3.09 Major Exporters 3/ 0.86 16.40 0.34 10.38 6.23 0.99 Argentina 0.26 6.79 0.01 2.73 4.09 0.24 Brazil 0.40 7.07 0.00 5.71 1.38 0.39 European Union 0.21 2.55 0.33 1.95 0.77 0.37 Major Importers 4/ 1.42 14.22 4.59 18.69 0.21 1.34 China 1.02 12.34 1.35 13.65 0.09 0.97 India 0.25 1.48 1.83 3.30 0.00 0.26 North Africa 5/ 0.15 0.41 1.41 1.74 0.11 0.12
2014/15 Est. Beginning
Stocks Production ImportsDomestic
Total Exports Ending Stocks
World 2/ 3.61 49.04 10.01 47.87 11.10 3.69United States 0.53 9.71 0.12 8.60 0.91 0.84Total Foreign 3.09 39.33 9.89 39.27 10.19 2.85 Major Exporters 3/ 0.99 18.03 0.29 10.73 7.61 0.96 Argentina 0.24 7.69 0.02 2.50 5.09 0.35 Brazil 0.39 7.76 0.01 6.28 1.51 0.37 European Union 0.37 2.58 0.25 1.95 1.01 0.24 Major Importers 4/ 1.34 15.03 5.21 20.23 0.18 1.18 China 0.97 13.35 0.77 14.20 0.11 0.78 India 0.26 1.21 2.80 4.00 0.00 0.27 North Africa 5/ 0.12 0.47 1.64 2.03 0.07 0.13
2015/16 Proj. Beginning
Stocks Production Imports Domestic Total
Exports Ending Stocks
World 2/ Mar 3.62 52.01 11.26 51.28 11.95 3.65Apr 3.69 52.10 11.35 51.20 12.20 3.74
United States Mar 0.84 9.86 0.14 8.89 0.95 0.99Apr 0.84 9.86 0.14 8.89 0.95 0.99
Total Foreign Mar 2.78 42.15 11.12 42.39 11.00 2.66Apr 2.85 42.24 11.21 42.31 11.24 2.74
Major Exporters 3/ Mar 0.81 19.11 0.17 11.03 8.32 0.74Apr 0.96 19.04 0.27 10.88 8.52 0.88
Argentina Mar 0.25 8.71 0.01 2.66 5.93 0.38Apr 0.35 8.74 0.01 2.56 6.13 0.41
Brazil Mar 0.27 7.68 0.01 6.37 1.39 0.21Apr 0.37 7.68 0.01 6.37 1.39 0.31
European Union Mar 0.29 2.72 0.15 2.00 1.00 0.16Apr 0.24 2.62 0.25 1.95 1.00 0.16
Major Importers 4/ Mar 1.22 16.30 6.18 22.30 0.21 1.19Apr 1.18 16.22 6.18 22.26 0.19 1.13
China Mar 0.85 14.66 0.85 15.45 0.08 0.82Apr 0.78 14.66 0.82 15.45 0.11 0.69
India Mar 0.25 1.15 3.70 4.85 0.00 0.25Apr 0.27 1.09 3.70 4.75 0.00 0.30
North Africa 5/ Mar 0.13 0.50 1.63 2.00 0.13 0.12Apr 0.13 0.47 1.66 2.06 0.08 0.13
1/ Data based on local marketing years except for Argentina and Brazil which are adjusted to an October-September year. 2/ World imports and exports may not balance due to differences in local marketing years and to time lags between reported exports and imports. Therefore, world supply may not equal world use. 3/ Argentina, Brazil and European Union. 4/ China, India, and North Africa. 5/ Algeria, Egypt, Morocco, and Tunisia.

April 2016
WASDE - 552 - 31
U.S. Quarterly Animal Product Production 1/
Year and Quarter Beef Pork Red Meat2/
Broiler Turkey TotalPoultry 3/
Red Meat& Poultry
Egg Milk
Million Pounds Mil doz Bil lbs2014 Annual 24,252 22,843 47,345 38,565 5,756 44,842 92,187 8,431 206.1
2015 I 5,664 6,161 11,883 9,718 1,429 11,273 23,156 2,078 51.9 II 5,855 5,925 11,839 10,021 1,389 11,542 23,381 1,991 53.7
III 6,066 5,957 12,080 10,372 1,352 11,857 23,937 1,929 51.7
IV 6,105 6,456 12,620 9,937 1,458 11,526 24,146 1,980 51.3Annual
Mar Est. 23,690 24,499 48,422 40,048 5,627 46,198 94,619 7,977 208.6
Apr Est. 23,690 24,499 48,422 40,048 5,627 46,198 94,619 7,977 208.6
2016 I 5,945 6,240 12,243 10,100 1,425 11,650 23,893 2,025 52.8 II* 6,190 5,935 12,183 10,200 1,475 11,815 23,998 2,035 54.1
III* 6,395 6,170 12,621 10,500 1,525 12,165 24,786 2,085 52.5
IV* 6,295 6,625 12,980 10,300 1,585 12,020 25,000 2,160 52.4Annual
Mar Proj. 24,540 25,025 49,798 41,100 6,010 47,650 97,448 8,305 211.6
Apr Proj. 24,825 24,970 50,027 41,100 6,010 47,650 97,677 8,305 211.8
* Projection. 1/ Commercial production for red meats; federally inspected for poultry meats. 2/ Beef, pork, veal and lamb & mutton. 3/ Broilers, turkeys and mature chicken.
U.S. Quarterly Prices for Animal Products
Year and Quarter Steers
2/Barrowsand gilts
3/
Broilers4/
Turkeys5/
Eggs6/
Milk7/
Dol./cwt Dol./cwt Cents/lb. Cents/lb. Cents/doz. Dol./cwt2014 Annual 154.56 76.03 104.9 107.6 142.3 23.97
2015 I 162.43 48.47 97.0 99.6 146.9 17.00
II 158.11 53.20 104.2 108.5 170.3 16.70
III 144.22 54.59 83.7 126.4 235.7 16.93
IV 127.71 44.66 77.2 130.1 174.1 17.70Annual
Mar Est. 148.12 50.23 90.5 116.2 181.8 17.08
Apr Est. 148.12 50.23 90.5 116.2 181.8 17.08
2016 I 134.81 44.63 84.6 114.7 121.5 15.60-15.70
II* 132-138 48-50 84-88 114-118 85-89 14.40-14.80
III* 128-138 48-52 85-91 106-114 86-92 14.60-15.30
IV* 129-139 41-45 84-90 111-121 106-114 15.30-16.30Annual
Mar Proj. 133-142 46-49 84-88 111-117 137-145 14.95-15.55
Apr Proj. 131-137 46-48 84-88 111-117 100-104 15.00-15.50
*Projection. 1/ Simple average of months. 2/ 5-Area, Direct, Total all grades 3/ National Base, Live equiv 51-52% lean. 4/ Wholesale, National Composite Weighted Average. 5/ 8-16 lbs, hens National. 6/ Grade A large, New York, volume buyers. 7/ Prices received by farmers for all milk.

April 2016
WASDE - 552 - 32
U.S. Meats Supply and Use
Item Beginningstocks
Production1/ Imports
TotalSupply Exports
Ending Stocks
TotalUse
Per Capita2/ 3/
Million Pounds /4 Beef 2014 584 24,320 2,947 27,850 2,573 591 24,687 54.1
2015 Est. Mar 591 23,755 3,370 27,716 2,266 683 24,767 53.9Apr 591 23,755 3,370 27,716 2,266 683 24,767 53.9
2016 Proj. Mar 683 24,604 2,845 28,132 2,475 600 25,057 54.3Apr 683 24,889 2,900 28,472 2,455 630 25,387 55.0
Filler Filler Filler Filler Filler Filler Filler Filler
Pork 2014 618 22,861 1,008 24,486 4,857 559 19,071 46.4
2015 Est. Mar 559 24,517 1,111 26,187 4,941 590 20,656 49.9Apr 559 24,517 1,111 26,187 4,941 590 20,656 49.8
2016 Proj. Mar 590 25,043 1,100 26,733 5,100 625 21,008 50.4Apr 590 24,988 1,180 26,758 5,200 625 20,933 50.2
Filler Filler Filler Filler Filler Filler Filler Filler
Total Red Meat 5/
2014 1,230 47,441 4,149 52,820 7,436 1,190 44,195 101.7
2015 Est. Mar 1,190 48,515 4,695 54,400 7,212 1,320 45,868 105.0Apr 1,190 48,515 4,695 54,400 7,212 1,320 45,868 104.9
2016 Proj. Mar 1,320 49,891 4,140 55,351 7,585 1,265 46,501 105.9Apr 1,320 50,120 4,283 55,723 7,663 1,296 46,764 106.4
Filler Filler Filler Filler Filler Filler Filler Filler
Broiler 2014 669 38,153 117 38,938 7,301 680 30,957 83.3
2015 Est. Mar 680 39,620 130 40,430 6,319 832 33,279 89.0Apr 680 39,620 130 40,430 6,319 832 33,279 88.9
2016 Proj. Mar 832 40,660 123 41,616 6,740 690 34,186 90.8Apr 832 40,660 123 41,616 6,740 665 34,211 90.9
Filler Filler Filler Filler Filler Filler Filler Filler
Turkey 2014 237 5,756 28 6,021 805 193 5,022 15.7
2015 Est. Mar 193 5,627 45 5,865 533 201 5,131 16.0Apr 193 5,627 45 5,865 533 201 5,131 16.0
2016 Proj. Mar 201 6,010 43 6,254 655 250 5,349 16.5Apr 201 6,010 43 6,254 610 225 5,419 16.8
Filler Filler Filler Filler Filler Filler Filler Filler
Total Poultry 6/
2014 912 44,429 147 45,488 8,216 877 36,395 100.3
2015 Est. Mar 877 45,769 177 46,822 6,997 1,041 38,785 106.1Apr 877 45,769 177 46,822 6,997 1,041 38,785 106.0
2016 Proj. Mar 1,041 47,210 167 48,418 7,531 948 39,939 108.6Apr 1,041 47,210 169 48,420 7,486 899 40,035 108.9
Filler Filler Filler Filler Filler Filler Filler Filler
Red Meat & Poultry
2014 2,142 91,870 4,297 98,308 15,652 2,066 80,590 202.0
2015 Est. Mar 2,066 94,284 4,872 101,222 14,209 2,361 84,652 211.1Apr 2,066 94,284 4,872 101,222 14,209 2,361 84,652 210.9
2016 Proj. Mar 2,361 97,101 4,307 103,769 15,116 2,213 86,440 214.5Apr 2,361 97,330 4,452 104,143 15,149 2,195 86,799 215.3
1/ Total including farm production for red meats and, for poultry, federally inspected plus non-federally inspected, less condemnations. 2/ Pounds, retail-weight basis for red meat and broilers; certified ready-to-cook weight for turkey. 3/ Population source: Dept. of Commerce, Census Bureau. 4/ Carcass weight for red meats and certified ready-to-cook weight for poultry. 5/ Beef, pork, veal, lamb and mutton. 6/ Broilers, turkeys and mature chicken.

April 2016
WASDE - 552 - 33
U.S. Egg Supply and Use
Commodity 2013 2014 2015 Est. 2015 Est. 2016 Proj. 2016 Proj.
Mar Apr Mar Apr
Eggs Million Dozen Supply Beginning Stocks 20.8 23.0 23.3 23.3 31.1 31.1 Production 8,148.7 8,431.4 7,977.3 7,977.3 8,305.0 8,305.0 Imports 16.9 34.7 123.3 123.3 110.0 110.0 Total Supply 8,186.4 8,489.1 8,123.9 8,123.9 8,446.1 8,446.1 Use Exports 371.8 393.8 317.6 317.6 320.0 315.0 Hatching Use 964.8 980.7 995.4 995.4 1,015.0 1,015.0 Ending Stocks 23.0 23.3 31.1 31.1 26.0 26.0 Disappearance Total 6,826.7 7,091.3 6,779.8 6,779.8 7,085.1 7,090.1 Per Capita (number) 258.6 266.6 253.2 252.9 263.0 263.2Total
U.S. Milk Supply and Use
Commodity 2013 2014 2015 Est. 2015 Est. 2016 Proj. 2016 Proj.
Mar Apr Mar Apr
Milk Billion Pounds Production 201.2 206.1 208.6 208.6 211.6 211.8 Farm Use 1.0 1.0 1.0 1.0 1.0 1.0
Fat Basis Supply Beg. Commercial Stocks 12.2 11.2 11.2 11.2 13.3 13.3Marketings 200.3 205.1 207.7 207.7 210.6 210.9Imports 3.7 4.3 5.7 5.7 7.0 7.5 Total Cml. Supply 216.2 220.6 224.6 224.6 230.9 231.7
Fat Basis Use Commercial Exports 12.4 12.4 8.8 8.8 8.2 8.4Ending Commercial Stocks 11.2 11.2 13.3 13.3 12.4 12.7CCC Donations 0.0 0.0 0.0 0.0 0.0 0.0Domestic Commercial Use 192.6 196.9 202.5 202.5 210.3 210.6
Skim-solid Basis Supply Beg. Commercial Stocks 12.4 11.7 13.1 13.1 13.9 13.9Marketings 200.3 205.1 207.7 207.7 210.6 210.9Imports 5.3 5.6 5.9 5.9 6.4 6.2 Total Cml. Supply 217.9 222.4 226.7 226.7 230.8 230.9
Skim-solid Basis Use Commercial Exports 38.6 39.1 37.3 37.3 36.3 36.2Ending Commercial Stocks 11.7 13.1 13.9 13.9 14.1 14.1CCC Donations 0.0 0.0 0.0 0.0 0.0 0.0Domestic Commercial Use 167.7 170.2 175.5 175.5 180.5 180.6
Total
Note: Totals may not add due to rounding.

April 2016
WASDE - 552 - 34
U.S. Dairy Prices
Commodity 2013 2014 2015 Est. 2015 Est. 2016 Proj. 2016 Proj.
Mar Apr Mar Apr
Product Prices 1/ Dollars Per Pound Cheese 1.7683 2.1551 1.6454 1.6454 1.505-
1.565 1.510-1.560
Butter 1.5451 2.1361 2.0670 2.0670 2.010- 2.100
2.005-2.085
Nonfat Dry Milk 1.7066 1.7682 0.9016 0.9016 0.770- 0.820
0.760-0.800
Dry Whey 0.5902 0.6538 0.3804 0.3804 0.230- 0.260
0.230-0.260
Filler Dollars Per Cwt
Milk Prices 2/ Class III 17.99 22.34 15.80 15.80 13.60-
14.20 13.65-14.15
Class IV 19.05 22.09 14.35 14.35 13.05- 13.75
12.90-13.50
All Milk 3/ 20.05 23.97 17.08 17.08 14.95- 15.55
15.00-15.50
1/ Simple average of monthly prices calculated by AMS from weekly average dairy product prices for class price computations. 2/ Annual Class III and Class IV prices are the simple averages of monthly minimum Federal order milk prices paid by regulated plants for milk used in the respective classes. All milk price is the simple average of monthly prices received by farmers for milk at average test. 3/ Does not reflect any deductions from producers as authorized by legislation.

April 2016
WASDE - 552 - 35
Reliability of April Projections 1/
Note: Tables on pages 35-37 present a record of the April projection and the final Estimate. Using world wheat production as an example, the "root mean square error" means that chances are 2 out of 3 that the current forecast will not be above or below the final estimate by more than 0.5 percent. Chances are 9 out of 10 (90% confidence level) that the difference will not exceed 0.9 percent. The average difference between the April projection and the final estimate is 2 million tons, ranging from 0.1 million to 6.8 million tons. The April projection has been below the estimate 22 times and above 12 times.
Differences between forecast and final estimate 90 percent Years
Commodity and Region
Root mean square error
confidenceinterval Average Smallest Largest
BelowFinal
AboveFinal
WHEAT
Percent
Million Metric Tons
Production
World
0.5
0.9
2.0 0.1 6.8 22
12
U.S.
0.1
0.2
0.0 0.0 0.3 14
9
Foreign
0.6
1.0
2.0 0.2 6.8 22
12
Exports
World
4.0
6.8
4.1 0.4 14.3 27
7
U.S.
2.6
4.4
0.6 0.0 2.1 15
19
Foreign
5.2
8.8
4.1 0.3 13.3 27
7
Domestic Use
World
0.8
1.4
3.7 0.1 9.4 15
19
U.S.
3.3
5.6
0.8 0.0 2.2 13
21
Foreign
0.8
1.3
3.5 0.0 9.6 15
19
Ending Stocks
World
3.3
5.7
3.9 0.0 14.5 23
10
U.S.
8.7
14.8
1.0 0.0 4.1 23
11
Foreign
3.7
6.2
3.4 0.0 12.6 24
9
COARSE GRAINS 2/
Production
World
0.9
1.6
7.4 0.3 19.2 28
6
U.S.
0.2
0.3
0.1 0.0 1.3 14
7
Foreign
1.3
2.2
7.5 0.3 19.2 28
6
Exports
World
4.8
8.2
4.6 0.1 21.8 25
9
U.S.
6.5
11.0
2.6 0.0 7.2 18
16
Foreign
7.4
12.6
4.0 0.3 21.2 27
7
Domestic Use
World
0.8
1.4
5.1 0.0 20.0 14
20
U.S.
2.5
4.2
3.3 0.1 16.8 13
21
Foreign
0.9
1.6
4.8 0.2 17.3 20
14
Ending Stocks
World
8.0
13.5
9.9 0.3 27.0 29
5
U.S.
11.8
20.0
3.9 0.1 12.1 18
16
Foreign
10.4
17.7
7.8 0.5 24.2 28
6
RICE, milled
Production
World
1.3
2.3
3.4 0.2 13.3 28
6
U.S.
1.4
2.4
0.0 0.0 0.2 11
5
Foreign
1.3
2.3
3.4 0.1 13.3 28
6
Exports
World
8.2
13.9
1.4 0.1 4.5 28
6
U.S.
6.4
10.8
0.1 0.0 0.5 15
16
Foreign
9.1
15.4
1.3 0.0 4.4 28
6
Domestic Use
World
1.0
1.7
2.6 0.1 8.7 25
9
U.S.
7.0
11.8
0.2 0.0 0.5 12
21
Foreign
1.0
1.7
2.6 0.2 8.8 25
9
Ending Stocks
World
7.2
12.3
2.9 0.1 13.2 23
11
U.S.
19.5
33.2
0.2 0.0 0.4 21
13
Foreign
7.6
12.9
2.9 0.1 12.8 22
12
1/ Footnotes at end of table. CONTINUED

April 2016
WASDE - 552 - 36
Reliability of April Projections (Continued) 1/
Differences between forecast and final estimate
90 percent YearsCommodity and Region
Root mean square error
confidenceinterval Average Smallest Largest
BelowFinal
AboveFinal
SOYBEANS Percent Million Metric Tons Production
World 1.7 2.9 2.3 0.2 7.9 20 14U.S. 1.4 2.3 0.6 0.0 2.5 15 12Foreign 2.8 4.8 2.1 0.0 8.1 21 13
Exports World 5.2 8.9 2.4 0.1 10.3 22 12U.S. 5.3 9.0 1.1 0.0 3.0 24 10Foreign 12.1 20.5 2.1 0.2 8.8 19 15
Domestic Use World 1.8 3.1 2.5 0.0 10.3 20 14U.S. 2.3 3.9 0.8 0.1 2.4 23 11Foreign 2.2 3.8 2.1 0.0 10.4 18 16
Ending Stocks World 11.9 20.1 2.9 0.3 12.0 19 15U.S. 28.6 48.5 1.5 0.1 4.9 12 22Foreign 12.8 21.8 2.3 0.0 7.2 21 13
COTTON Million 480-Pound Bales Production
World 1.6 2.7 1.1 0.0 5.2 26 7U.S. 0.3 0.5 0.0 0.0 0.2 15 11Foreign 1.9 3.2 1.1 0.0 5.1 25 8
Exports World 4.3 7.3 1.0 0.1 4.2 21 13U.S. 4.7 8.0 0.4 0.0 1.4 14 17Foreign 5.4 9.2 0.9 0.1 3.9 21 13
Domestic Use World 1.6 2.7 1.2 0.0 4.6 19 15U.S. 3.1 5.3 0.2 0.0 0.6 18 12Foreign 1.6 2.7 1.2 0.2 4.5 19 15
Ending Stocks World 7.0 11.9 2.5 0.0 8.2 24 10U.S. 12.7 21.6 0.4 0.0 1.6 13 21Foreign 7.6 12.9 2.5 0.1 8.0 22 12
1/ Marketing years 1981/82 through 2014/15 for grains, soybeans, and cotton. Final for grains, soybeans, and cotton is defined as the first November estimate following the marketing year for 1981/82 through 2014/15. 2/ Includes corn, sorghum, barley, oats, rye, millet, and mixed grain.

April 2016
WASDE - 552 - 37
Reliability of United States April Projections 1/
Differences between forecast and final estimate
90 percent Years
Root mean square error
confidenceinterval Average Smallest Largest
BelowFinal
AboveFinal
CORN Percent Million Bushels Production 0.2 0.3 2 0 38 1 2Exports 6.4 10.8 91 13 209 15 19Domestic Use 2.3 3.9 114 5 474 14 20Ending Stocks 13.5 22.9 156 3 470 18 16
SORGHUM Production 0.2 0.3 0 0 4 0 2Exports 11.9 20.3 20 0 72 23 10Domestic Use 9.6 16.2 24 0 158 13 20Ending Stocks 37.8 64.2 22 0 148 15 18
BARLEY Production 0.7 1.2 1 0 11 14 4Exports 13.1 22.3 4 0 13 10 20Domestic Use 4.2 7.1 10 0 64 15 17Ending Stocks 11.0 18.6 12 0 52 22 11
OATS Production 0.3 0.6 0 0 2 4 4Exports 35.2 59.7 1 0 3 6 6Domestic Use 3.6 6.0 8 0 26 12 20Ending Stocks 12.7 21.5 9 1 30 21 13
SOYBEAN MEAL Thousand Short Tons Production 2.7 4.5 798 35 2,153 27 7Exports 8.0 13.6 503 25 1,700 28 6Domestic Use 2.3 3.8 511 100 2,066 24 10Ending Stocks 35.9 61.0 66 0 214 13 19
SOYBEAN OIL Million Pounds Production 2.7 4.6 383 15 1,058 27 7Exports 15.7 26.6 207 0 650 22 11Domestic Use 2.0 3.3 236 0 562 20 13Ending Stocks 17.3 29.3 240 5 753 23 11
ANIMAL PROD. 3/ Million Pounds Beef 2.4 4.1 498 19 1,388 23 11Pork 2.2 3.7 291 10 983 23 11Broilers 1.4 2.3 278 6 675 23 11Turkeys 2.6 4.5 103 3 398 19 15
Million Dozen Eggs 1.6 2.7 83 10 433 23 11
Billion Pounds Milk 1.2 2.0 1.4 0.0 5.2 17 14
1/ See pages 35 and 36 for record of reliability for U.S. wheat, rice, soybeans, and cotton. Marketing years 1981/82 through 2014/15 for grains, soybeans, and cotton. Final for grains, soybeans, and cotton is defined as the first November estimate following the marketing year for 1981/82 through 2014/15. Calendar years 1983 through 2014 for meats, eggs, and milk. Final for animal products is defined as the latest annual production estimate published by NASS for 1983-2014.
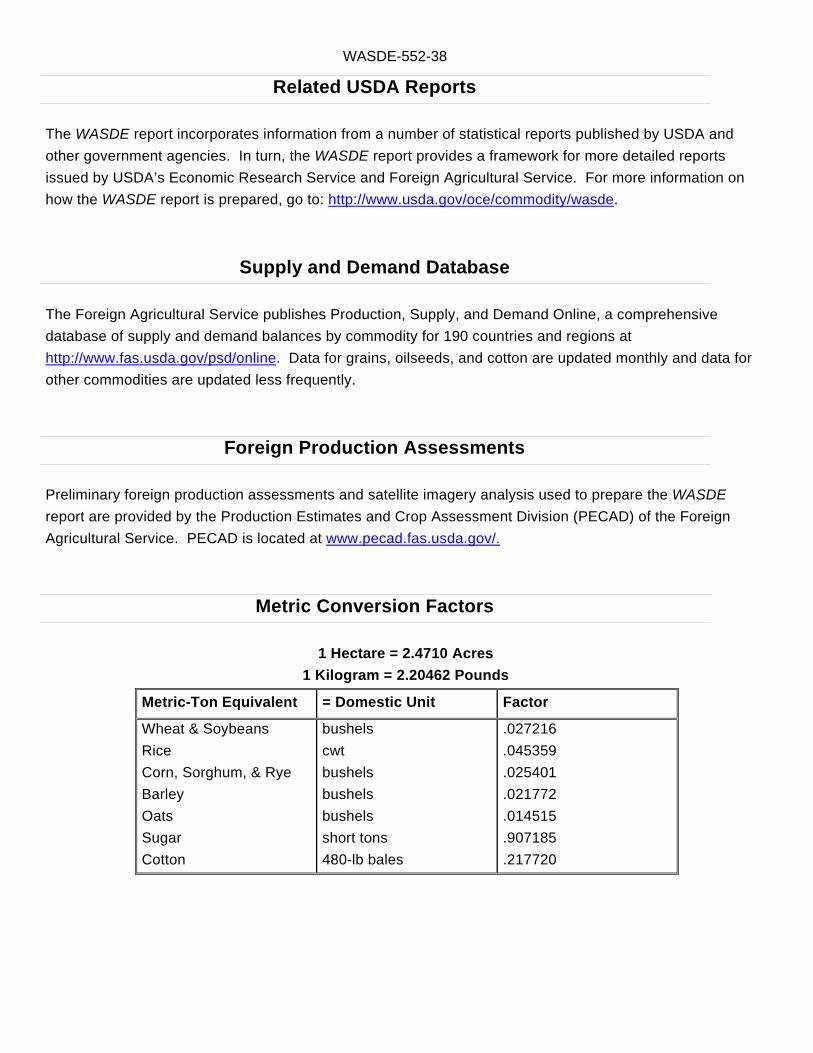
WASDE-552-38
Related USDA Reports
The WASDE report incorporates information from a number of statistical reports published by USDA and
other government agencies. In turn, the WASDE report provides a framework for more detailed reports
issued by USDA’s Economic Research Service and Foreign Agricultural Service. For more information on
how the WASDE report is prepared, go to: http://www.usda.gov/oce/commodity/wasde.
Supply and Demand Database
The Foreign Agricultural Service publishes Production, Supply, and Demand Online, a comprehensive
database of supply and demand balances by commodity for 190 countries and regions at
http://www.fas.usda.gov/psd/online. Data for grains, oilseeds, and cotton are updated monthly and data for
other commodities are updated less frequently.
Foreign Production Assessments
Preliminary foreign production assessments and satellite imagery analysis used to prepare the WASDE
report are provided by the Production Estimates and Crop Assessment Division (PECAD) of the Foreign
Agricultural Service. PECAD is located at www.pecad.fas.usda.gov/.
Metric Conversion Factors
1 Hectare = 2.4710 Acres
1 Kilogram = 2.20462 Pounds
Metric-Ton Equivalent = Domestic Unit Factor
Wheat & Soybeans
Rice
Corn, Sorghum, & Rye
Barley
Oats
Sugar
Cotton
bushels
cwt
bushels
bushels
bushels
short tons
480-lb bales
.027216
.045359
.025401
.021772
.014515
.907185
.217720

.
WASDE Notification System
Subscribers are notified through GovDelivery when the monthly World Agricultural Supply and Demand Estimates (WASDE) report is available.
Previous WASDE reports are available at http://usda.mannlib.cornell.edu/MannUsda/viewDocumentInfo.do?documentID=1194
For questions contact: Susan Carter at 202-720-5447 or [email protected]
World Agricultural Supply and Demand Estimates
WASDE-552 – April 12, 2016
WASDE Briefing Slides: The briefing slides which accompany today’s WASDE report will be available at http://www.usda.gov/oce/commodity/wasde/ Electronic Subscriptions: Download the WASDE report at http://usda.mannlib.cornell.edu/. Get a free e-mail subscription to the WASDE and other USDA crop reports at http://usda.mannlib.cornell.edu. Select the “Reports by E-Mail” bar to sign up.
The U.S. Department of Agriculture (USDA) prohibits discrimination in all its programs and
activities on the basis of race, color, national origin, gender, religion, age, disability, political
beliefs, sexual orientation, and marital or family status. (Not all prohibited bases apply to all
programs.) Persons with disabilities who require alternative means for communication of program
information (Braille, large print, audiotape, etc.) should contact USDA’s TARGET Center at 202-
720-2600 (voice and TDD).
To file a complaint of discrimination, write USDA, Director, Office of Civil Rights, Room 326-W,
Whitten Building, 1400 Independence Avenue, SW, Washington, D.C. 20250-9410 or call (202)
720-5964 (voice or TDD). USDA is an equal opportunity provider and employer.
Related Documents