ISSN: 1554-9089 World Agricultural Supply and Demand Estimates Office of the Chief Economist Agricultural Marketing Service Farm Service Agency Economic Research Service Foreign Agricultural Service WASDE - 536 Approved by the World Agricultural Outlook Board December 10, 2014 WHEAT: Projected U.S. wheat supplies for 2014/15 are raised 10 million bushels this month with higher projected imports. Increased production and higher imports from Canada are expected to add to U.S. wheat supplies. The entire import increase is for Durum. Domestic use projections and wheat exports are unchanged. However, a 15-million-bushel reduction for Hard Red Winter exports is offset by 5-million-bushel increases for Hard Red Spring, White, and Durum. Ending stocks for all wheat are projected 10 million bushels higher with the supply increase. The projected season-average farm price range is raised 10 cents per bushel at the midpoint to $5.80 to $6.20 per bushel on prices reported to date and recently higher cash and futures prices. Global wheat supplies for 2014/15 are raised 1.9 million tons with increased production offsetting lower beginning stocks. World wheat production remains record high and is raised 2.3 million tons led by a 1.8-million-ton increase for Canada. Kazakhstan is raised 0.5 million tons. Both production increases are from updated government statistics. Partly offsetting is a 0.4-million-ton reduction for global beginning stocks with Indonesia consumption raised for 2012/13 and 2013/14. Global wheat trade for 2014/15 is raised with exports up 3.1 million tons on larger supplies and stronger demand in several importing countries. Exports are raised 1.0 million tons for EU, and 0.5 million tons each for Canada, Iran, and Kazakhstan. The EU increase stems from competitive prices and a fast sales pace to date. The Canada and Kazakhstan increases reflect larger crops. Iran exports are raised on larger flour exports to nearby countries. Russia exports are lowered 0.5 million tons on increased competition, particularly from EU. Iran imports are raised 1.0 million tons on a fast pace of shipments from EU. Egypt imports are raised 0.5 million tons on increasing purchases from the private sector. Smaller increases are made for Bangladesh, Jordan, Colombia, Ethiopia, and Uzbekistan. Global wheat consumption for 2014/15 is down slightly. The biggest change is a 1.5-million- ton decrease in EU wheat feeding on larger coarse grain supplies and higher wheat exports. Canada wheat feeding is raised 0.5 million tons on the larger crop. Global ending stocks are projected 2.0 million tons higher mostly on increases for Canada, EU, and Russia. COARSE GRAINS: U.S. feed grain supply and use projections for 2014/15 are mostly unchanged as a small increase in projected corn food, seed, and industrial (FSI) use reduces ending stocks slightly. Expected corn use for sweeteners is raised 10 million bushels dropping projected corn ending stocks just below 2.0 billion bushels. Supply and use projections for the other feed grains are unchanged. The projected range for the season-average corn farm price is unchanged at $3.20 to $3.80 per bushel. The sorghum farm price range is raised 5 cents on each end to $3.20 to $3.80 per bushel, equal to corn, as strong demand from China supports sorghum prices.

Welcome message from author
This document is posted to help you gain knowledge. Please leave a comment to let me know what you think about it! Share it to your friends and learn new things together.
Transcript

ISSN: 1554-9089
World Agricultural Supply and Demand Estimates
Office of the Chief Economist
Agricultural Marketing Service Farm Service Agency
Economic Research Service Foreign Agricultural Service
WASDE - 536 Approved by the World Agricultural Outlook Board December 10, 2014 WHEAT: Projected U.S. wheat supplies for 2014/15 are raised 10 million bushels this month with higher projected imports. Increased production and higher imports from Canada are expected to add to U.S. wheat supplies. The entire import increase is for Durum. Domestic use projections and wheat exports are unchanged. However, a 15-million-bushel reduction for Hard Red Winter exports is offset by 5-million-bushel increases for Hard Red Spring, White, and Durum. Ending stocks for all wheat are projected 10 million bushels higher with the supply increase. The projected season-average farm price range is raised 10 cents per bushel at the midpoint to $5.80 to $6.20 per bushel on prices reported to date and recently higher cash and futures prices. Global wheat supplies for 2014/15 are raised 1.9 million tons with increased production offsetting lower beginning stocks. World wheat production remains record high and is raised 2.3 million tons led by a 1.8-million-ton increase for Canada. Kazakhstan is raised 0.5 million tons. Both production increases are from updated government statistics. Partly offsetting is a 0.4-million-ton reduction for global beginning stocks with Indonesia consumption raised for 2012/13 and 2013/14. Global wheat trade for 2014/15 is raised with exports up 3.1 million tons on larger supplies and stronger demand in several importing countries. Exports are raised 1.0 million tons for EU, and 0.5 million tons each for Canada, Iran, and Kazakhstan. The EU increase stems from competitive prices and a fast sales pace to date. The Canada and Kazakhstan increases reflect larger crops. Iran exports are raised on larger flour exports to nearby countries. Russia exports are lowered 0.5 million tons on increased competition, particularly from EU. Iran imports are raised 1.0 million tons on a fast pace of shipments from EU. Egypt imports are raised 0.5 million tons on increasing purchases from the private sector. Smaller increases are made for Bangladesh, Jordan, Colombia, Ethiopia, and Uzbekistan. Global wheat consumption for 2014/15 is down slightly. The biggest change is a 1.5-million-ton decrease in EU wheat feeding on larger coarse grain supplies and higher wheat exports. Canada wheat feeding is raised 0.5 million tons on the larger crop. Global ending stocks are projected 2.0 million tons higher mostly on increases for Canada, EU, and Russia. COARSE GRAINS: U.S. feed grain supply and use projections for 2014/15 are mostly unchanged as a small increase in projected corn food, seed, and industrial (FSI) use reduces ending stocks slightly. Expected corn use for sweeteners is raised 10 million bushels dropping projected corn ending stocks just below 2.0 billion bushels. Supply and use projections for the other feed grains are unchanged. The projected range for the season-average corn farm price is unchanged at $3.20 to $3.80 per bushel. The sorghum farm price range is raised 5 cents on each end to $3.20 to $3.80 per bushel, equal to corn, as strong demand from China supports sorghum prices.
WASDE-536-2
Global coarse grain supplies for 2014/15 are projected 1.1 million tons higher. Higher corn production for China and EU, higher rye production for Russia, and higher oats production for Canada, more than offset lower expected corn and barley output for Argentina. Upward production revisions largely reflect the latest official government estimates and harvest results. Corn production for Argentina is lowered 1.0 million tons reflecting lower expected plantings, but the reduction in area is partly offset by higher expected yields with abundant early season soil moisture in key growing areas. Global coarse grain consumption for 2014/15 is raised 2.5 million tons mostly on higher expected barley and mixed grain feeding for EU and higher sorghum feeding for China. Corn feeding is also raised for EU driving the increase in projected foreign corn consumption. EU livestock and poultry feeders are expected to shift rations toward coarse grains as abundant supplies and stronger wheat exports make coarse grain feeding more competitive. Global coarse grain trade for 2014/15 is mostly unchanged. China corn imports are lowered, but China sorghum imports are raised. Mostly offsetting the increase for China sorghum is a reduction for Japan sorghum imports. Barley imports are raised for Saudi Arabia. Barley exports are lowered for Argentina, but partly offset by an increase for EU. World corn exports are lowered slightly with a reduction for Argentina only partly offset by an increase for Vietnam. Global ending stocks are projected 0.7 million tons higher mostly reflecting the larger China corn crop. Small reductions in U.S. and EU corn stocks partly offset the increase for China. RICE: U.S. 2014/15 rice supplies at 273.9 million cwt are unchanged from a month ago. All rice domestic and residual use for 2014/15 is unchanged at 131.0 million cwt. U.S. long-grain exports are increased 1.0 million cwt to 69.0 million, bringing all rice exports to 103.0 million. Combined medium- and short-grain exports are unchanged at 34.0 million cwt. The increase in exports is due mostly to an expected increase to markets in the Middle East and South America. The all rice milled export forecast is raised 1.0 million cwt to 68.0 million, and rough rice exports are unchanged at 35.0 million. All rice ending stocks are lowered 1.0 million cwt to 39.9 million with long-grain stocks reduced to 27.0 million, and combined medium- and short-grain stocks unchanged at 10.6 million. The 2014/15 long-grain rice season-average farm price range is projected at $12.00 to $13.00 per cwt, down 20 cents per cwt on each end from last month. The combined medium- and short-grain farm price range is projected at $18.50 to $19.50 per cwt, down 50 cents per cwt on each end. The all rice season-average farm price is forecast at $14.00 to $15.00 per cwt, down 20 cents per cwt on each end. The drop in the price outlook is due mostly to an unexpected substantial drop in October prices reported by the National Agricultural Statistics Service in Agricultural Prices published on November 26 and price expectations for the remainder of the marketing year. Global 2014/15 rice supply and use are changed little from a month ago. Global rice production is projected at 475.2 million tons, up 0.2 million from last month due primarily to increased forecasts for China and South Korea, partially offset by a reduction for Indonesia. China’s rice production is forecast at a record 144.5 million tons, up 0.5 million tons from last month, and up more than 1 percent from last year. The revision is based on production estimates recently released by China’s National Bureau of Statistics. Indonesia’s 2014/15 rice crop is forecast at 36.5 million tons, down 0.5 million from last month, but up slightly from
WASDE-536-3
2013/14. The Philippine 2014/15 rice crop is forecast at 12.2 million tons, unchanged from last month, but up nearly 3 percent from last year. Typhoon Hagupit struck the Philippines on December 6 and tracked through some rice growing areas, but missed the larger producing regions. Initial reports from the government of the Philippines indicated that the storm had little impact on the overall rice crop. However, USDA will continue to assess the damage and offer a more complete supply and use analysis in next month’s supply and demand report. Global rice consumption for 2014/15 is forecast at a record 482.9 million tons, down slightly from last month. Global trade is raised 0.4 million tons based largely on increased imports by Indonesia; with exports raised for Burma, China, Thailand, and the United States. World 2014/15 ending stocks are raised 0.6 million tons, largely due to increases for China and Vietnam, partially offset by reductions for Burma, Indonesia, Thailand, and the United States. Stocks are also raised for Sri Lanka and South Korea. OILSEEDS: Total U.S. oilseed production for 2014/15 is projected at 117.0 million tons, down slightly due to a small reduction in cottonseed. Soybean exports are increased 40 million bushels to 1,760 million reflecting the record export pace in recent weeks and prospects for additional sales and shipments ahead of the South American harvest. With crush unchanged, soybean ending stocks for 2014/15 are projected at 410 million bushels, down 40 million from last month but still the highest since 2006/07. The U.S. season-average soybean price range for 2014/15 is projected at $9.00 to $11.00 per bushel, unchanged from last month. The soybean meal price is projected at $340 to $380 per short ton, up 10 dollars on both ends of the range. The soybean oil price range is projected at 32 to 36 cents per pound, down 2 cents on both ends reflecting lower-than-expected early season vegetable oil prices and lower petroleum prices. Global oilseed production for 2014/15 is projected at a record 530.7 million tons, up 1.8 million tons from last month. Foreign oilseed production accounts for most of the change on increases for soybeans, rapeseed, and sunflowerseed. Global soybean production is projected at a record 312.8 million tons with gains this month for Canada, Ukraine, and Paraguay. Global rapeseed production is projected at a record 71.9 million tons, up 1.2 million mainly on increased production for Canada, which is estimated at 15.6 million tons based on the latest survey results from Statistics Canada. Other changes include increased sunflowerseed production for EU and reduced peanut production for Argentina. Palm oil production is reduced for Indonesia for both 2013/14 and 2014/15 on revised yields. Global oilseed trade for 2014/15 is projected at 135.3 million tons, up 0.8 million from last month. Soybean exports account for most of the change with higher projections for the United States, Paraguay, Ukraine, and Canada only partly offset by reductions for Argentina and Brazil. Global oilseed ending stocks are projected at 104.1 million tons, up 1.1 million from last month and 23.5 million above year-earlier levels. Increased rapeseed stocks in Canada and higher soybean stocks in Brazil and Argentina are only partly offset with lower soybean stocks in the United States. SUGAR: U.S. 2014/15 total sugar supply is increased 189,844 short tons, raw value (STRV) from last month to 13.919 million. Based on sugarcane processors’ forecasts, Florida sugar production is increased by 144,869 STRV due to increased sugarcane yield and area, and Texas cane sugar production is increased by 2,865 STRV due to increased yield. Imports are increased by 42,110 STRV due to an expected increase from Mexico. With no other changes,
WASDE-536-4
ending stocks increase by the supply increase and are now projected at 1.675 million STRV, implying an ending stocks-to-use ratio of 13.7 percent. Elements of the U.S. 2013/14 sugar supply and use balance were adjusted to reflect revisions from Sweetener Market Data and the Foreign Agricultural Service. Mexico 2014/15 beginning stocks and production are unchanged but imports are reduced by 24,135 metric tons (MT) to reflect expected imports from the United States. Total imports consist of 181,865 MT from the United States -- all but 10,000 MT for Mexico’s sugar-containing products (IMMEX) program -- and 10,000 MT from non-U.S. sources for IMMEX. Total deliveries are reduced by 60,174 MT to reflect an expected decrease from last month in IMMEX activity. Deliveries to IMMEX are now projected at 323,826 MT and match IMMEX activity for 2013/14. Deliveries for consumption are unchanged and ending stocks are equal to 22.0 percent of those deliveries, or 924,000 MT, the same as last month. Exports for 2014/15 are calculated residually at 1.715 million MT. The 36,039 MT increase in exports is forecast to go to the U.S. market for a total of 1.390 million MT. Elements of the Mexico 2013/14 sugar supply and use balance were adjusted to reflect trade revisions from Mexico’s Secretariat of Economy (Economia) and IMMEX activity from Comité Nacional Para El Desarrollo Sustentable de la Caña de Azúcar (Conadesuca). LIVESTOCK, POULTRY, AND DAIRY: The forecast for total meat production in 2014 is lowered from last month, as lower beef production in the fourth quarter more than offsets increased pork production. Beef production is reduced as slaughter is expected lower. However, carcass weights remain heavy which partly offsets the decline. Hog slaughter for the fourth quarter is increased from last month as slaughter to date has been strong. A small revision is made to third-quarter broiler slaughter but the forecasts for fourth quarter broiler and turkey production are unchanged. For 2015, total meat production is slightly higher on small increase in beef production; other production forecasts are unchanged. USDA will release its Quarterly Hogs and Pigs report on December 23, providing an indication of producers’ sow farrowing intentions into 2015. The forecast for 2014 beef imports is raised on the pace of imports to date, but the export forecast is unchanged from last month. No change is made to 2015 forecasts. Pork imports are raised for 2014 and exports are reduced as relatively high prices are expected to encourage imports and limit sales opportunities. For 2015, the import forecast is raised but exports are unchanged. No change is made to the broiler or turkey export forecasts. The cattle price forecasts for 2014 and 2015 are raised from last month on continued demand strength and tight supplies of fed cattle. The hog price forecast for 2014 is lowered on current prices, but the 2015 price is unchanged. The broiler and turkey price forecasts for 2014 are raised. The turkey price forecast is increased for 2015 but broilers are unchanged. The egg price forecasts for 2014 and 2015 are raised on expectations of strong demand through the end of 2014 and into early 2015. The milk production forecast for 2014 is unchanged from last month, but is lowered for 2015 as growth in milk per cow is expected to be more moderate. Fat basis imports are reduced for 2014 as milkfat imports have been lower than expected. Export forecasts on a skim-solids basis are raised for 2014 on stronger whey product sales to date. Fat and skim-solids basis trade forecasts for 2015 are unchanged.
WASDE-536-5
The butter price is raised for 2014, reflecting current price movements, but the price forecast for 2015 is unchanged at the midpoint of the range. Cheese and nonfat dry milk (NDM) prices are reduced for both 2014 and 2015 as supplies are expected to remain large. Whey prices are unchanged from last month. Class III prices for 2014 and 2015 are lowered on weaker cheese prices. The Class IV price is unchanged for 2014 as a higher butter price is offset by a lower NDM price. For 2015 a lower NDM price results in a reduced Class IV price forecast. The all milk price is lowered to $24.05 to $24.15 per cwt for 2014 and $18.45 to $19.25 per cwt for 2015. COTTON: The U.S. cotton supply and demand estimates for 2014/15 include lower production and ending stocks compared to last month. Production is reduced 474,000 bales, due mainly to a lower crop estimate for Texas. Domestic mill use and exports are unchanged. Ending stocks are now forecast at 4.6 million bales, or one-third of total disappearance. The marketing-year average price received by producers is projected at 59 to 64 cents per pound, an increase of 3 cents on the lower end of the range, based on stronger-than-expected early season prices. Global cotton ending stocks for 2014/15 are raised again this month, as a lower consumption forecast is partially offset by lower production. Production is reduced for the United States and Greece, with smaller revisions in several other countries. Global consumption is reduced nearly 1.3 million bales, reflecting lower forecasts for China, India, Brazil, Pakistan, and Turkey. While the projected world consumption growth rate of 3.3 percent remains above the historical average, current indications are that mills’ response to this season’s sharply lower cotton prices is lagging previous expectations. World ending stocks are projected at just over 108 million bales. Approved by the Secretary of Agriculture and the Acting Chairperson of the World Agricultural Outlook Board, Seth Meyer, (202) 720-6030. This report was prepared by the Interagency Commodity Estimates Committees.
APPROVED BY:
JOSEPH W. GLAUBER
SECRETARY OF AGRICULTURE DESIGNATE

WASDE-536-6
INTERAGENCY COMMODITY ESTIMATES COMMITTEES
Note: The World Agricultural Outlook Board reviews and approves the World Agricultural Supply and
Demand Estimates (WASDE) report. The Board’s analysts chair the Interagency Commodity
Estimates Committees (ICECs) that prepare the monthly report.
Wheat: Jerry Norton, ICEC Chair, WAOB, E-mail: [email protected] Gary Vocke, ERS; Teresa McKeivier, FAS; Tom Tice, FSA. Rice: Andrew C. Aaronson, ICEC Chair, WAOB, E-mail: [email protected] Nathan Childs, ERS; Yoonhee Macke, FAS; Mark Simone, FSA. Feed Grains: Jerry Norton, ICEC Chair, WAOB, E-mail: [email protected] Thomas Capehart, ERS; Richard O’Meara, FAS; Pete Riley, FSA. Oilseeds: Keith Menzie, ICEC Chair, WAOB, E-mail: [email protected] Mark Ash, ERS; Bill George, FAS; Dale Leuck, FSA. Cotton: Carol Skelly, ICEC Chair, WAOB, E-mail: [email protected] Darryl Earnest, AMS; Leslie Meyer, ERS; James Johnson, FAS; Scott Sanford, FSA. Sugar: Stephen Haley, ICEC Chair, WAOB, E-mail: [email protected] Michael McConnell, ERS; Ron Lord, FAS; Barbara Fecso, FSA. Meat Animals: Shayle Shagam, ICEC Chair, WAOB, E-mail: [email protected] Sherry Wise, AMS; Kenneth Mathews, ERS; Claire Mezoughem, FAS; Dale Leuck, FSA. Poultry: Shayle Shagam, ICEC Chair, WAOB, E-mail: [email protected] Larry Haller, AMS; David Harvey, ERS; Claire Mezoughem, FAS; Milton Madison, FSA. Dairy: Shayle Shagam, ICEC Chair, WAOB, E-mail: [email protected] Uthra Raghunathan, AMS; Jerry Cessna, ERS; Paul Kiendl, FAS; Milton Madison, FSA.
In 2015, the WASDE report will be released on Jan. 12, Feb. 10, Mar. 10, Apr. 9, May 12, Jun. 10, Jul. 10, Aug. 12, Sep. 11, Oct. 9, Nov. 10, Dec. 9.
WASDE-536-7
T A B L E OF C O N T E N T S
Page
Highlights ............................................................................................................... 1
Interagency Commodity Estimates Committees ..................................................... 6
World & U.S. Supply & Use for Grains ................................................................... 8
World & U.S. Supply & Use for Cotton ................................................................... 9
World & U.S. Supply & Use for Oilseeds ............................................................. 10
U.S. Wheat Supply & Use .................................................................................... 11
U.S. Wheat Supply & Use by Class ..................................................................... 11
U.S. Feed Grain & Corn Supply & Use ................................................................ 12
U.S. Sorghum, Barley & Oats Supply & Use ........................................................ 13
U.S. Rice Supply & Use ....................................................................................... 14
U.S. Soybeans & Products Supply & Use ............................................................ 15
U.S. Sugar Supply & Use ..................................................................................... 16
Mexico Sugar Supply and Use ............................................................................. 16
U.S. Cotton Supply & Use .................................................................................... 17
World Wheat Supply & Use ................................................................................. 18
World Coarse Grains Supply & Use ..................................................................... 20
World Corn Supply & Use .................................................................................... 22
World Rice Supply & Use..................................................................................... 24
World Cotton Supply & Use ................................................................................. 26
World Soybean Supply & Use .............................................................................. 28
World Soybean Meal Supply & Use ..................................................................... 29
World Soybean Oil Supply & Use ........................................................................ 30
U.S. Quarterly Animal Product Production ........................................................... 31
U.S. Quarterly Prices for Animal Products ........................................................... 31
U.S. Meats Supply and Use ................................................................................. 32
U.S. Egg Supply & Use ........................................................................................ 33
U.S. Milk Supply and Use .................................................................................... 33
U.S. Dairy Prices ................................................................................................. 34
Reliability Tables ................................................................................................. 35
Related USDA Reports ........................................................................................ 38
Metric Conversion Factors ................................................................................... 38
Electronic Access and Subscriptions ....................................................................... 40
December 2014
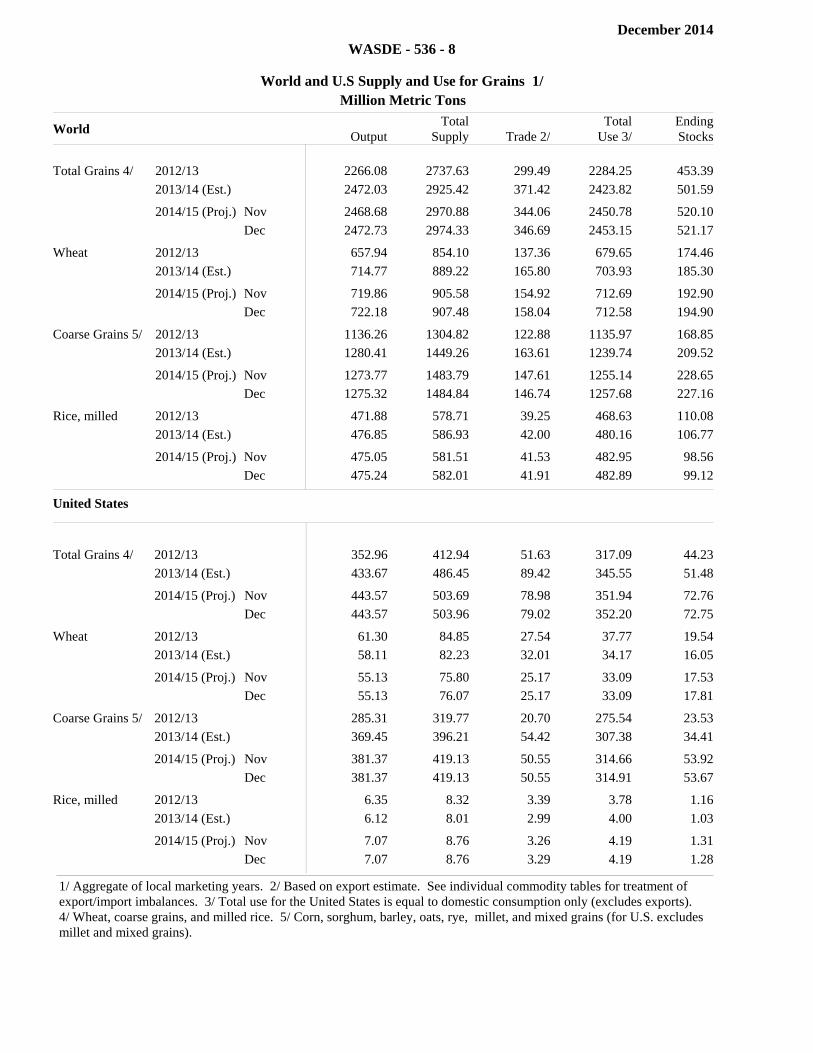
WASDE - 536 - 8
World and U.S Supply and Use for Grains 1/
Million Metric Tons
World Output
TotalSupply Trade 2/
TotalUse 3/
EndingStocks
Total Grains 4/ 2012/13 2266.08 2737.63 299.49 2284.25 453.39
2013/14 (Est.) 2472.03 2925.42 371.42 2423.82 501.59filler filler filler filler filler
2014/15 (Proj.) Nov 2468.68 2970.88 344.06 2450.78 520.10
2014/15 (Proj.) Dec 2472.73 2974.33 346.69 2453.15 521.17filler filler filler filler filler
Wheat 2012/13 657.94 854.10 137.36 679.65 174.46
2013/14 (Est.) 714.77 889.22 165.80 703.93 185.30filler filler filler filler filler
2014/15 (Proj.) Nov 719.86 905.58 154.92 712.69 192.90
2014/15 (Proj.) Dec 722.18 907.48 158.04 712.58 194.90filler filler filler filler filler
Coarse Grains 5/ 2012/13 1136.26 1304.82 122.88 1135.97 168.85
2013/14 (Est.) 1280.41 1449.26 163.61 1239.74 209.52filler filler filler filler filler
2014/15 (Proj.) Nov 1273.77 1483.79 147.61 1255.14 228.65
2014/15 (Proj.) Dec 1275.32 1484.84 146.74 1257.68 227.16filler filler filler filler filler
Rice, milled 2012/13 471.88 578.71 39.25 468.63 110.08
2013/14 (Est.) 476.85 586.93 42.00 480.16 106.77filler filler filler filler filler
2014/15 (Proj.) Nov 475.05 581.51 41.53 482.95 98.56
2014/15 (Proj.) Dec 475.24 582.01 41.91 482.89 99.12filler filler filler filler filler
United States Output
TotalSupply
Trade 2/ TotalUse 3/
EndingStocks
Total Grains 4/ 2012/13 352.96 412.94 51.63 317.09 44.23
2013/14 (Est.) 433.67 486.45 89.42 345.55 51.48filler filler filler filler filler
2014/15 (Proj.) Nov 443.57 503.69 78.98 351.94 72.76
2014/15 (Proj.) Dec 443.57 503.96 79.02 352.20 72.75filler filler filler filler filler
Wheat 2012/13 61.30 84.85 27.54 37.77 19.54
2013/14 (Est.) 58.11 82.23 32.01 34.17 16.05filler filler filler filler filler
2014/15 (Proj.) Nov 55.13 75.80 25.17 33.09 17.53
2014/15 (Proj.) Dec 55.13 76.07 25.17 33.09 17.81filler filler filler filler filler
Coarse Grains 5/ 2012/13 285.31 319.77 20.70 275.54 23.53
2013/14 (Est.) 369.45 396.21 54.42 307.38 34.41filler filler filler filler filler
2014/15 (Proj.) Nov 381.37 419.13 50.55 314.66 53.92
2014/15 (Proj.) Dec 381.37 419.13 50.55 314.91 53.67filler filler filler filler filler
Rice, milled 2012/13 6.35 8.32 3.39 3.78 1.16
2013/14 (Est.) 6.12 8.01 2.99 4.00 1.03filler filler filler filler filler
2014/15 (Proj.) Nov 7.07 8.76 3.26 4.19 1.31
2014/15 (Proj.) Dec 7.07 8.76 3.29 4.19 1.28filler filler filler filler filler
1/ Aggregate of local marketing years. 2/ Based on export estimate. See individual commodity tables for treatment of export/import imbalances. 3/ Total use for the United States is equal to domestic consumption only (excludes exports). 4/ Wheat, coarse grains, and milled rice. 5/ Corn, sorghum, barley, oats, rye, millet, and mixed grains (for U.S. excludes millet and mixed grains).
December 2014
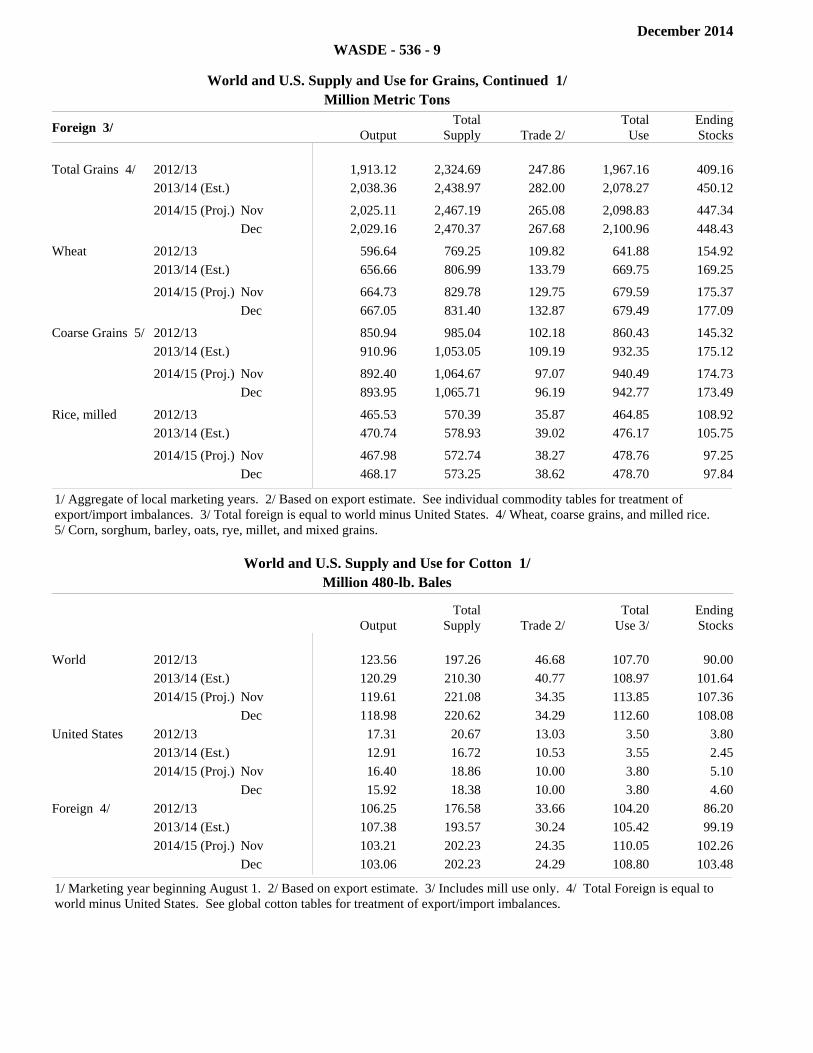
WASDE - 536 - 9
World and U.S. Supply and Use for Grains, Continued 1/
Million Metric Tons
Foreign 3/ Output
TotalSupply Trade 2/
TotalUse
EndingStocks
Total Grains 4/ 2012/13 1,913.12 2,324.69 247.86 1,967.16 409.16
2013/14 (Est.) 2,038.36 2,438.97 282.00 2,078.27 450.12filler filler filler filler filler
2014/15 (Proj.) Nov 2,025.11 2,467.19 265.08 2,098.83 447.34
2014/15 (Proj.) Dec 2,029.16 2,470.37 267.68 2,100.96 448.43filler filler filler filler filler
Wheat 2012/13 596.64 769.25 109.82 641.88 154.92
2013/14 (Est.) 656.66 806.99 133.79 669.75 169.25filler filler filler filler filler
2014/15 (Proj.) Nov 664.73 829.78 129.75 679.59 175.37
2014/15 (Proj.) Dec 667.05 831.40 132.87 679.49 177.09filler filler filler filler filler
Coarse Grains 5/ 2012/13 850.94 985.04 102.18 860.43 145.32
2013/14 (Est.) 910.96 1,053.05 109.19 932.35 175.12filler filler filler filler filler
2014/15 (Proj.) Nov 892.40 1,064.67 97.07 940.49 174.73
2014/15 (Proj.) Dec 893.95 1,065.71 96.19 942.77 173.49filler filler filler filler filler
Rice, milled 2012/13 465.53 570.39 35.87 464.85 108.92
2013/14 (Est.) 470.74 578.93 39.02 476.17 105.75filler filler filler filler filler
2014/15 (Proj.) Nov 467.98 572.74 38.27 478.76 97.25
2014/15 (Proj.) Dec 468.17 573.25 38.62 478.70 97.84filler filler filler filler filler
1/ Aggregate of local marketing years. 2/ Based on export estimate. See individual commodity tables for treatment of export/import imbalances. 3/ Total foreign is equal to world minus United States. 4/ Wheat, coarse grains, and milled rice. 5/ Corn, sorghum, barley, oats, rye, millet, and mixed grains.
World and U.S. Supply and Use for Cotton 1/
Million 480-lb. Bales
Output
TotalSupply Trade 2/
TotalUse 3/
EndingStocks
World 2012/13 123.56 197.26 46.68 107.70 90.00
2013/14 (Est.) 120.29 210.30 40.77 108.97 101.64
2014/15 (Proj.) Nov 119.61 221.08 34.35 113.85 107.36
2014/15 (Proj.) Dec 118.98 220.62 34.29 112.60 108.08
United States 2012/13 17.31 20.67 13.03 3.50 3.80
2013/14 (Est.) 12.91 16.72 10.53 3.55 2.45
2014/15 (Proj.) Nov 16.40 18.86 10.00 3.80 5.10
2014/15 (Proj.) Dec 15.92 18.38 10.00 3.80 4.60
Foreign 4/ 2012/13 106.25 176.58 33.66 104.20 86.20
2013/14 (Est.) 107.38 193.57 30.24 105.42 99.19
2014/15 (Proj.) Nov 103.21 202.23 24.35 110.05 102.26
2014/15 (Proj.) Dec 103.06 202.23 24.29 108.80 103.48
1/ Marketing year beginning August 1. 2/ Based on export estimate. 3/ Includes mill use only. 4/ Total Foreign is equal to world minus United States. See global cotton tables for treatment of export/import imbalances.
December 2014
WASDE - 536 - 10
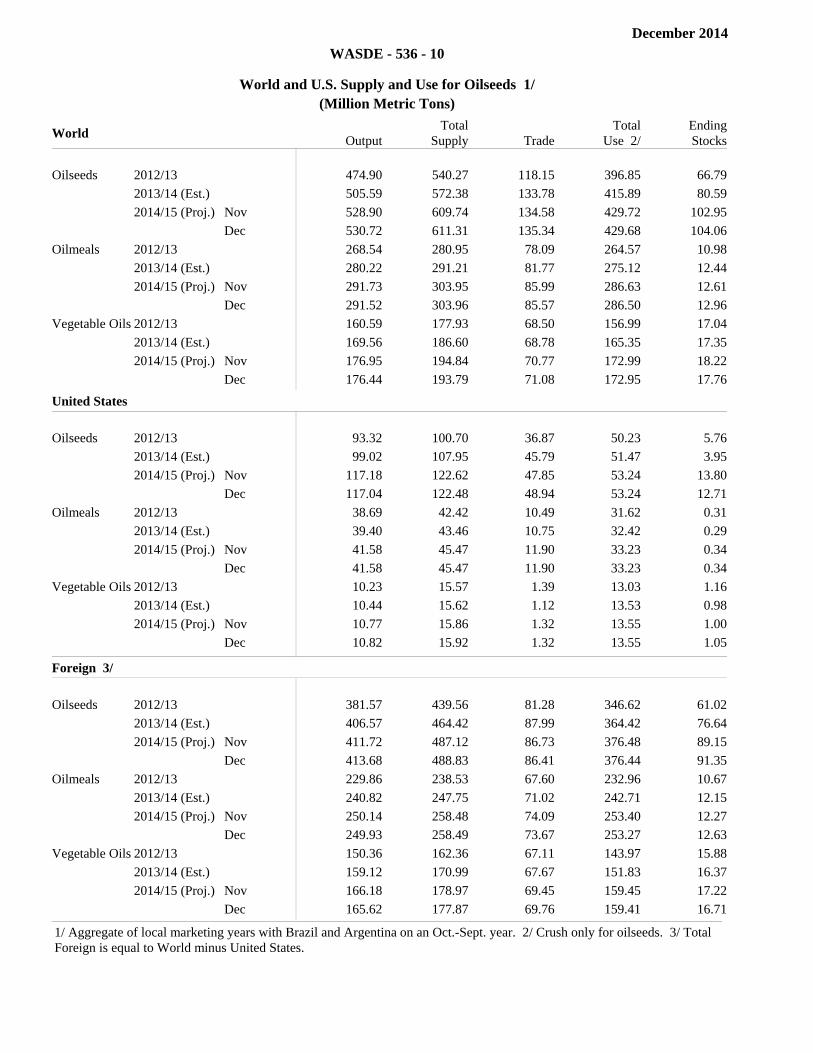
World and U.S. Supply and Use for Oilseeds 1/
(Million Metric Tons)
World Output
TotalSupply Trade
TotalUse 2/
EndingStocks
Oilseeds 2012/13 474.90 540.27 118.15 396.85 66.79
2013/14 (Est.) 505.59 572.38 133.78 415.89 80.59
2014/15 (Proj.) Nov 528.90 609.74 134.58 429.72 102.95
2014/15 (Proj.) Dec 530.72 611.31 135.34 429.68 104.06
Oilmeals 2012/13 268.54 280.95 78.09 264.57 10.98
2013/14 (Est.) 280.22 291.21 81.77 275.12 12.44
2014/15 (Proj.) Nov 291.73 303.95 85.99 286.63 12.61
2014/15 (Proj.) Dec 291.52 303.96 85.57 286.50 12.96
Vegetable Oils 2012/13 160.59 177.93 68.50 156.99 17.04
2013/14 (Est.) 169.56 186.60 68.78 165.35 17.35
2014/15 (Proj.) Nov 176.95 194.84 70.77 172.99 18.22
2014/15 (Proj.) Dec 176.44 193.79 71.08 172.95 17.76
United States Output
Total Supply Trade
Total Use 2/ Ending
Stocks
Oilseeds 2012/13 93.32 100.70 36.87 50.23 5.76
2013/14 (Est.) 99.02 107.95 45.79 51.47 3.95
2014/15 (Proj.) Nov 117.18 122.62 47.85 53.24 13.80
2014/15 (Proj.) Dec 117.04 122.48 48.94 53.24 12.71
Oilmeals 2012/13 38.69 42.42 10.49 31.62 0.31
2013/14 (Est.) 39.40 43.46 10.75 32.42 0.29
2014/15 (Proj.) Nov 41.58 45.47 11.90 33.23 0.34
2014/15 (Proj.) Dec 41.58 45.47 11.90 33.23 0.34
Vegetable Oils 2012/13 10.23 15.57 1.39 13.03 1.16
2013/14 (Est.) 10.44 15.62 1.12 13.53 0.98
2014/15 (Proj.) Nov 10.77 15.86 1.32 13.55 1.00
2014/15 (Proj.) Dec 10.82 15.92 1.32 13.55 1.05filler filler filler filler filler
Foreign 3/ Output
Total Supply Trade
Total Use 2/ Ending
Stocks
Oilseeds 2012/13 381.57 439.56 81.28 346.62 61.02
2013/14 (Est.) 406.57 464.42 87.99 364.42 76.64
2014/15 (Proj.) Nov 411.72 487.12 86.73 376.48 89.15
2014/15 (Proj.) Dec 413.68 488.83 86.41 376.44 91.35
Oilmeals 2012/13 229.86 238.53 67.60 232.96 10.67
2013/14 (Est.) 240.82 247.75 71.02 242.71 12.15
2014/15 (Proj.) Nov 250.14 258.48 74.09 253.40 12.27
2014/15 (Proj.) Dec 249.93 258.49 73.67 253.27 12.63
Vegetable Oils 2012/13 150.36 162.36 67.11 143.97 15.88
2013/14 (Est.) 159.12 170.99 67.67 151.83 16.37
2014/15 (Proj.) Nov 166.18 178.97 69.45 159.45 17.22
2014/15 (Proj.) Dec 165.62 177.87 69.76 159.41 16.71
1/ Aggregate of local marketing years with Brazil and Argentina on an Oct.-Sept. year. 2/ Crush only for oilseeds. 3/ Total Foreign is equal to World minus United States.

December 2014
WASDE - 536 - 11
U.S. Wheat Supply and Use 1/
2012/13 2013/14 Est. 2014/15 Proj. 2014/15 Proj.
Nov Dec Million Acres Area Planted 55.3 56.2 56.8 56.8Area Harvested 48.8 45.3 46.4 46.4 Bushels Yield per Harvested Acre 46.2 47.1 43.7 43.7 Million Bushels Beginning Stocks 743 718 590 590Production 2,252 2,135 2,026 2,026Imports 123 169 170 180 Supply, Total 3,118 3,021 2,785 2,795Food 945 951 960 960Seed 73 77 76 76Feed and Residual 370 228 180 180 Domestic, Total 1,388 1,256 1,216 1,216Exports 1,012 1,176 925 925 Use, Total 2,400 2,432 2,141 2,141Ending Stocks 718 590 644 654 CCC Inventory 0 0 0 0 Free Stocks 718 590 644 654 Outstanding Loans 8 8 45 45Avg. Farm Price ($/bu) 2/ 7.77 6.87 5.65 - 6.15 5.80 - 6.20
U.S. Wheat by Class: Supply and Use
Year beginning June 1 Hard RedWinter
Hard RedSpring
Soft RedWinter White Durum Total
Million Bushels 2013/14 (Est.) Beginning Stocks 343 165 124 63 23 718
Production 747 491 568 271 58 2,135
Supply, Total 3/ 1,109 733 713 341 125 3,021
Domestic Use 427 318 318 120 73 1,256
Exports 446 246 283 171 31 1,176
Use, Total 873 564 600 291 103 2,432
Ending Stocks, Total 236 169 113 50 22 590
2014/15 (Proj.) Beginning Stocks 236 169 113 50 22 590
Production 738 556 455 224 53 2,026
Supply, Total 3/ 985 805 583 283 140 2,795
Domestic Use 453 308 266 101 88 1,216
Exports 305 285 155 150 30 925
Use, Total 758 593 421 251 118 2,141
Ending Stocks, Total Dec 227 212 162 32 22 654
Ending Stocks, Total Nov 212 217 162 37 17 644
Note: Totals may not add due to rounding. 1/ Marketing year beginning June 1. 2/ Marketing-year weighted average price received by farmers. 3/ Includes imports.

December 2014
WASDE - 536 - 12
U.S. Feed Grain and Corn Supply and Use 1/
FEED GRAINS 2012/13 2013/14 Est. 2014/15 Proj. 2014/15 Proj. Nov Dec
Million Acres Area Planted 109.9 109.9 103.8 103.8Area Harvested 96.6 98.2 92.7 92.7 Metric Tons Yield per Harvested Acre 2.95 3.76 4.11 4.11 Million Metric Tons Beginning Stocks 27.8 23.5 34.4 34.4Production 285.1 369.3 381.2 381.2Imports 6.4 3.0 3.1 3.1 Supply, Total 319.4 395.8 418.7 418.7Feed and Residual 114.9 135.7 141.8 141.8Food Seed & Industrial 160.3 171.3 172.5 172.8 Domestic, Total 275.2 307.0 314.3 314.5Exports 20.7 54.4 50.5 50.5 Use, Total 295.8 361.4 364.8 365.1Ending Stocks 23.5 34.4 53.9 53.7 CCC Inventory 0.0 0.0 0.0 0.0 Free Stocks 23.5 34.4 53.9 53.7 Outstanding Loans 0.8 2.0 5.9 5.9
CORN 2012/13 2013/14 Est. 2014/15 Proj. 2014/15 Proj.
November December
Million Acres Area Planted 97.3 95.4 90.9 90.9Area Harvested 87.4 87.7 83.1 83.1 Bushels Yield per Harvested Acre 123.1 158.8 173.4 173.4 Million Bushels Beginning Stocks 989 821 1,236 1,236Production 10,755 13,925 14,407 14,407Imports 160 36 25 25 Supply, Total 11,904 14,782 15,668 15,668Feed and Residual 4,315 5,132 5,375 5,375Food, Seed & Industrial 2/ 6,038 6,497 6,535 6,545 Ethanol & by-products 3/ 4,641 5,134 5,150 5,150 Domestic, Total 10,353 11,629 11,910 11,920Exports 730 1,917 1,750 1,750 Use, Total 11,083 13,546 13,660 13,670Ending Stocks 821 1,236 2,008 1,998 CCC Inventory 0 0 0 0 Free Stocks 821 1,236 2,008 1,998 Outstanding Loans 32 76 230 230Avg. Farm Price ($/bu) 4/ 6.89 4.46 3.20 - 3.80 3.20 - 3.80
Note: Totals may not add due to rounding. 1/ Marketing year beginning September 1 for corn and sorghum; June 1 for barley and oats. 2/ For a breakout of FSI corn uses, see Feed Outlook table 5 or access the data on the Web through the FeedGrains Database at www.ers.usda.gov/data-products/feed-grains-database.aspx. 3/ Corn processed in ethanol plants to produce ethanol and by-products including distillers' grains, corn gluten feed, corn gluten meal, and corn oil. 4/ Marketing-year weighted average price received by farmers.

December 2014
WASDE - 536 - 13
U.S. Sorghum, Barley, and Oats Supply and Use 1/
SORGHUM 2012/13 2013/14 Est. 2014/15 Proj. 2014/15 Proj.
Nov Dec Million Bushels Filler Filler Filler Filler Filler
Area Planted (mil. acres) 6.3 8.1 7.2 7.2Area Harvested (mil. acres) 5.0 6.5 6.2 6.2Yield (bushels/acre) 49.6 59.6 66.1 66.1Beginning Stocks 23 15 34 34Production 248 389 408 408Imports 10 0 0 0 Supply, Total 280 404 442 442Feed and Residual 94 88 95 95Food, Seed & Industrial 95 70 80 80 Total Domestic 189 158 175 175Exports 76 212 230 230 Use, Total 265 370 405 405Ending Stocks 15 34 37 37Avg. Farm Price ($/bu) 2/ 6.33 4.28 3.15 - 3.75 3.20 - 3.80Filler Filler Filler Filler Filler
BARLEY 2012/13 2013/14 Est. 2014/15 Proj. 2014/15 Proj.
November December
Filler Filler Filler Filler Filler
Area Planted (mil. acres) 3.7 3.5 3.0 3.0Area Harvested (mil. acres) 3.3 3.0 2.4 2.4Yield (bushels/acre) 66.9 71.3 72.4 72.4Beginning Stocks 60 80 82 82Production 219 217 177 177Imports 23 19 35 35 Supply, Total 302 316 294 294Feed and Residual 58 65 60 60Food, Seed & Industrial 155 155 154 154 Total Domestic 213 220 214 214Exports 9 14 10 10 Use, Total 222 234 224 224Ending Stocks 80 82 70 70Avg. Farm Price ($/bu) 2/ 6.43 6.06 4.85 - 5.45 4.85 - 5.45Filler Filler Filler Filler Filler
OATS 2012/13 2013/14 Est. 2014/15 Proj. 2014/15 Proj.
November December
Filler Filler Filler Filler Filler
Area Planted (mil. acres) 2.7 3.0 2.7 2.7Area Harvested (mil. acres) 1.0 1.0 1.0 1.0Yield (bushels/acre) 61.2 64.1 67.7 67.7Beginning Stocks 55 36 25 25Production 61 65 70 70Imports 93 97 100 100 Supply, Total 209 198 194 194Feed and Residual 96 97 85 85Food, Seed & Industrial 76 75 77 77 Total Domestic 172 172 162 162Exports 1 2 2 2 Use, Total 173 173 164 164Ending Stocks 36 25 30 30Avg. Farm Price ($/bu) 2/ 3.89 3.75 3.00 - 3.50 3.05 - 3.45Filler Filler Filler Filler Filler
Note: Totals may not add due to rounding. 1/ Marketing year beginning September 1 for sorghum; June 1 for barley and oats. 2/ Marketing-year weighted average price received by farmers.

December 2014
WASDE - 536 - 14
U.S. Rice Supply and Use 1/
(Rough Equivalent of Rough and Milled Rice)
TOTAL RICE 2012/13 2013/14 Est. 2014/15 Proj. 2014/15 Proj.
Nov Dec Million Acres Area Planted 2.70 2.49 2.93 2.93Area Harvested 2.68 2.47 2.91 2.91Filler
Pounds Yield per Harvested Acre 7,463 7,694 7,597 7,597 Million Hundredweight Beginning Stocks 2/ 41.1 36.4 31.8 31.8 Production 199.9 189.9 221.1 221.1 Imports 21.1 23.1 21.0 21.0 Supply, Total 262.1 249.4 273.9 273.9 Domestic & Residual 3/ 119.0 124.9 131.0 131.0 Exports, Total 4/ 106.6 92.7 102.0 103.0 Rough 34.1 28.6 35.0 35.0 Milled (rough equiv.) 72.5 64.1 67.0 68.0 Use, Total 225.7 217.6 233.0 234.0 Ending Stocks 36.4 31.8 40.9 39.9Avg. Milling Yield (%) 5/ 70.00 71.00 70.50 70.50Avg. Farm Price ($/cwt) 6/ 15.10 16.10 14.20 - 15.20 14.00 - 15.00Total
LONG-GRAIN RICE 2012/13 2013/14 Est. 2014/15 Proj. 2014/15 Proj.
November December
Harvested Acres (mil.) 1.98 1.77 Yield (pounds/acre) 7,291 7,464 Beginning Stocks 24.3 21.9 16.2 16.2 Production 144.3 131.9 160.3 160.3 Supply, Total 7/ 187.3 173.3 195.0 195.0 Domestic & Residual 3/ 89.6 95.3 99.0 99.0 Exports 8/ 75.8 61.8 68.0 69.0 Use, Total 165.4 157.1 167.0 168.0 Ending Stocks 21.9 16.2 28.0 27.0 Avg. Farm Price ($/cwt) 6/ 14.50 15.40 12.20 - 13.20 12.00 - 13.00Filler Filler Filler Filler Filler
MEDIUM & SHORT-GRAIN RICE 2012/13 2013/14 Est. 2014/15 Proj. 2014/15 Proj.
November December
Harvested Acres (mil.) 0.70 0.70 Yield (pounds/acre) 7,951 8,272 Beginning Stocks 14.7 12.2 13.3 13.3 Production 55.7 58.0 60.8 60.8 Supply, Total 7/ 72.5 73.8 76.6 76.6 Domestic & Residual 3/ 29.4 29.6 32.0 32.0 Exports 8/ 30.8 30.9 34.0 34.0 Use, Total 60.3 60.4 66.0 66.0 Ending Stocks 12.2 13.3 10.6 10.6 Avg. Farm Price ($/cwt) 6/ 9/ 17.40 18.50 19.00 - 20.00 18.50 - 19.50Filler Filler Filler Filler Filler
Note: Totals may not add due to rounding. 1/ Marketing year beginning August 1. 2/ Includes the following quantities of broken kernel rice (type undetermined) not included in estimates of beginning stocks by type (in mil. cwt): 2012/13-2.1; 2013/14-2.3; 2014/15-2.3. 3/ Residual includes unreported use, processing losses, and estimating errors. Use by type may not add to total rice use because of the difference in brokens between beginning and ending stocks. 4/ Includes rough rice and milled rice exports. Milled rice exports are converted to an equivalent rough basis. 5/ Expressed as a percent, i.e., the total quantity of whole kernel and broken rice produced divided by the quantity of rough rice milled. Data supplied by the USA Rice Federation for years prior to 2013/14. The 2013/14 milling yield is calculated using Farm Service Agency (FSA) warehouse stored loan data for long, medium, and short grain rice. The year-to-year change in the FSA average all rice milling yield is applied to the WASDE reported 2012/13 milling yield to calculate the 2013/14 forecasted average milling yield. The 2014/15 milling yield is calculated using the previous five-year Olympic average-- 2009/10-2013/14. 6/ Marketing-year weighted average price received by farmers. 7/ Includes imports. 8/ Exports by type of rice are estimated. 9/ The medium/short-grain season-average- farm price (SAFP) largely reflects rice that is marketed through price pools in California. The pool price is not final until all the rice in the pool is marketed for the crop year. Therefore, SAFP forecasts based on the average of NASS monthly prices and the final price may differ. For example, the average difference between the August WASDE SAFP forecast and the final price has averaged $1.70 per cwt from 2008/09-2012/13, with a high of $3.50 per cwt in 2008/09 and a low of $0.60 per cwt in 2009/10.

December 2014
WASDE - 536 - 15
U.S. Soybeans and Products Supply and Use (Domestic Measure) 1/
SOYBEANS 2012/13 2013/14 Est. 2014/15 Proj. 2014/15 Proj.
Nov DecFiller Filler Filler Filler Filler
Million Acres Area Planted 77.2 76.8 84.2 84.2Area Harvested 76.1 76.3 83.4 83.4Filler
Bushels Yield per Harvested Acre 40.0 44.0 47.5 47.5
Million Bushels Beginning Stocks 169 141 92 92Production 3,042 3,358 3,958 3,958Imports 41 72 15 15 Supply, Total 3,252 3,570 4,065 4,065Crushings 1,689 1,734 1,780 1,780Exports 1,317 1,647 1,720 1,760Seed 89 98 92 92Residual 16 0 23 23 Use, Total 3,111 3,478 3,615 3,655Ending Stocks 141 92 450 410Avg. Farm Price ($/bu) 2/ 14.40 13.00 9.00 - 11.00 9.00 - 11.00Total
SOYBEAN OIL 2012/13 2013/14 Est. 2014/15 Proj. 2014/15 Proj.
November December
Filler Filler Filler Filler Filler
Million Pounds Beginning Stocks 2,540 1,705 1,165 1,165Production 4/ 19,820 20,130 20,560 20,680Imports 196 165 160 160 Supply, Total 22,555 22,000 21,885 22,005Domestic Disappearance 18,687 18,958 18,450 18,450 Biodiesel 3/ 4,689 4,800 4,800 4,800 Food, Feed & other Industrial 13,998 14,158 13,650 13,650Exports 2,164 1,877 2,100 2,100 Use, Total 20,850 20,835 20,550 20,550Ending stocks 1,705 1,165 1,335 1,455Avg. Price (c/lb) 2/ 47.13 38.23 34.00 - 38.00 32.00 - 36.00Total
SOYBEAN MEAL 2012/13 2013/14 Est. 2014/15 Proj. 2014/15 Proj.
November December
Filler 1 2 3 4
Thousand Short Tons Beginning Stocks 300 275 250 250Production 4/ 39,875 40,685 42,785 42,785Imports 245 336 165 165 Supply, Total 40,420 41,296 43,200 43,200Domestic Disappearance 28,969 29,496 30,100 30,100Exports 11,176 11,550 12,800 12,800 Use, Total 40,145 41,046 42,900 42,900Ending Stocks 275 250 300 300Avg. Price ($/s.t.) 2/ 468.11 489.94 330.00 - 370.00 340.00 - 380.00Total
Note: Totals may not add due to rounding. Reliability calculations at end of report. 1/ Marketing year beginning September 1 for soybeans; October 1 for soybean oil and soybean meal. 2/ Prices: soybeans, marketing year weighted average price received by farmers; oil, simple average of crude soybean oil, Decatur; meal, simple average of 48 percent protein, Decatur. 3/ Reflects only biodiesel made from methyl ester as reported by the U.S. Energy Information Administration. 4/ Based on an October year crush of 1,725 million bushels for 2013/14 and 1,800 million bushels for 2014/15.

December 2014
WASDE - 536 - 16
U.S. Sugar Supply and Use 1/
2012/13 2013/14 Est. 2014/15 Proj. 2014/15 Proj.
Nov DecFiller Filler Filler Filler Filler
1,000 Short Tons, Raw Value Beginning Stocks 1,979 2,158 1,796 1,796Production 2/ 8,982 8,457 8,462 8,610 Beet Sugar 5,076 4,794 4,870 4,870 Cane Sugar 3,906 3,663 3,592 3,740 Florida 1,867 1,759 1,770 1,915 Hawaii 179 168 180 180 Louisiana 1,686 1,591 1,520 1,520 Texas 173 145 122 125Imports 3,224 3,742 3,471 3,513 TRQ 3/ 957 1,302 1,479 1,479 Other Program 4/ 136 305 400 400 Other 5/ 2,131 2,135 1,592 1,634 Mexico 2,124 2,130 1,582 1,624 Total Supply 14,184 14,357 13,729 13,919 Exports 274 306 250 250Deliveries 11,752 12,255 11,994 11,994 Food 6/ 11,487 11,828 11,859 11,859 Other 7/ 265 427 135 135Miscellaneous 0 0 0 0 Total Use 12,026 12,561 12,244 12,244Ending Stocks 8/ 2,158 1,796 1,485 1,675Stocks to Use Ratio 17.9 14.3 12.1 13.7Total
1/ Fiscal years beginning Oct 1. Historical data are from FSA "Sweetener Market Data" (SMD). 2/ Production projections for 2013/14 and 2014/15 are based on Crop Production and processor projections where appropriate. 3/ For 2014/15, WTO raw sugar TRQ shortfall (99). For 2013/14, WTO raw sugar TRQ shortfall (237). 4/ Includes sugar under the re-export and polyhydric alcohol programs. 5/ For 2012/13, other high-tier (7) and other (0). For 2013/14, other high-tier (5) and other (0). For 2014/15, other high-tier (10) and other (0). 6/Combines SMD deliveries for domestic human food use and SMD miscellaneous uses. 7/ Transfers to sugar-containing products for reexport, and for nonedible alcohol, feed, and ethanol. 8/ For 2012/13, includes 316,415 short tons, raw value, of stocks held by the Commodity Credit Corporation.
Mexico Sugar Supply and Use and High Fructose Corn Syrup Imports 1/
Beginning
Stocks Production Imports Domestic 2/ ExportsEndingStocks
Sugar 1,000 Metric Tons, Actual Weight 2013/14 Est. Nov 1,460 6,021 129 4,285 2,494 8312013/14 Est. Dec 1,460 6,021 131 4,271 2,511 831
2014/15 Proj. Nov 831 6,140 216 4,584 1,679 9242014/15 Proj. Dec 831 6,140 192 4,524 1,715 924
1/ HFCS imports by Mexico (1,000 metric tons, dry basis): Oct-Sep 2013/14 = 913, Oct 2013 = 75, Oct 2014 = 82 . Footnote source: Comite Nacional para el Desarollo Sustentable de la Cana de Azucar. 2/Includes domestic consumption, Mexico's products export program (IMMEX), and any residual statistical discrepancies. IMMEX: 2013/14 (324 est), 2014/15 (324 proj). Statistical Adjustment: 2013/14 (-151), 2014/15 (0).

December 2014
WASDE - 536 - 17
U.S. Cotton Supply and Use 1/
2012/13 2013/14 Est. 2014/15 Proj. 2014/15 Proj.
Nov DecFiller Filler Filler Filler Filler
Area Million Acres Planted 12.26 10.41 11.01 11.01 Harvested 9.32 7.54 9.88 9.88Filler
Pounds Yield per Harvested Acre 892 821 797 773
Million 480 Pound Bales Beginning Stocks 3.35 3.80 2.45 2.45Production 17.31 12.91 16.40 15.92Imports 0.01 0.01 0.01 0.01 Supply, Total 20.67 16.72 18.86 18.38Domestic Use 3.50 3.55 3.80 3.80Exports, Total 13.03 10.53 10.00 10.00 Use, Total 16.53 14.08 13.80 13.80Unaccounted 2/ 0.35 0.19 -0.04 -0.02Ending Stocks 3.80 2.45 5.10 4.60Avg. Farm Price 3/ 72.5 77.9 56.0 - 64.0 59.0 - 64.0Total
Note: Reliability calculations at end of report. 1/ Upland and extra-long staple; marketing year beginning August 1. Totals may not add due to rounding. 2/ Reflects the difference between the previous season's supply less total use and ending stocks. 3/ Cents per pound for upland cotton.

December 2014
WASDE - 536 - 18
World Wheat Supply and Use 1/
(Million Metric Tons)
2012/13 Beginning
Stocks Production ImportsDomestic
FeedDomestic
Total 2/ ExportsEndingStocks
World 3/ 196.16 657.94 144.22 137.09 679.65 137.36 174.46United States 20.21 61.30 3.34 10.07 37.77 27.54 19.54Total Foreign 175.95 596.64 140.87 127.03 641.88 109.82 154.92 Major Exporters 4/ 27.23 193.21 5.91 59.06 141.79 63.85 20.71 Argentina 0.73 9.30 0.00 0.30 6.20 3.55 0.29 Australia 7.05 22.86 0.14 3.40 6.74 18.66 4.65 Canada 5.93 27.21 0.48 4.36 9.60 18.97 5.05 European Union 5/ 13.52 133.85 5.28 51.00 119.25 22.68 10.72 Major Importers 6/ 87.64 187.29 79.47 35.39 265.08 6.47 82.84 Brazil 1.75 4.38 7.36 0.20 10.90 1.58 1.00 China 55.95 121.02 2.96 25.00 125.00 0.97 53.96 Sel. Mideast 7/ 5.14 17.18 20.86 2.75 34.33 0.69 8.16 N. Africa 8/ 14.09 17.32 22.06 2.38 41.42 0.61 11.44 Pakistan 4.02 23.30 0.05 0.60 23.90 0.85 2.62 Southeast Asia 9/ 4.65 0.00 15.76 2.84 15.81 0.77 3.84 Selected Other 0.00 India 19.95 94.88 0.02 3.40 83.82 6.82 24.20 FSU-12 26.01 77.80 7.23 21.53 71.73 25.38 13.94 Russia 10.90 37.72 1.17 11.90 33.55 11.29 4.95 Kazakhstan 6.18 9.84 0.01 2.00 6.80 6.29 2.94 Ukraine 5.36 15.76 0.05 3.10 11.40 7.19 2.58
2013/14 Est. Beginning
Stocks Production ImportsDomestic
FeedDomestic
Total 2/ Exports Ending Stocks
World 3/ 174.46 714.77 156.59 130.25 703.93 165.80 185.30United States 19.54 58.11 4.59 6.19 34.17 32.01 16.05Total Foreign 154.92 656.66 152.00 124.06 669.75 133.79 169.25 Major Exporters 4/ 20.71 218.17 4.58 56.49 138.75 75.98 28.74 Argentina 0.29 10.50 0.01 0.10 6.05 2.20 2.54 Australia 4.65 27.01 0.15 3.60 6.95 18.62 6.24 Canada 5.05 37.53 0.45 4.79 10.00 23.24 9.80 European Union 5/ 10.72 143.13 3.98 48.00 115.75 31.93 10.16 Major Importers 6/ 82.84 194.06 87.32 32.40 265.85 5.28 93.09 Brazil 1.00 5.30 7.07 0.60 11.40 0.10 1.87 China 53.96 121.93 6.77 21.00 121.50 0.89 60.27 Sel. Mideast 7/ 8.16 18.92 20.69 3.72 37.04 0.58 10.15 N. Africa 8/ 11.44 19.72 25.24 2.68 42.42 0.50 13.48 Pakistan 2.62 24.00 0.39 0.60 24.10 0.75 2.16 Southeast Asia 9/ 3.84 0.00 16.40 2.46 15.84 0.88 3.53 Selected Other 0.00
India 24.20 93.51 0.03 4.80 94.01 5.90 17.83 FSU-12 13.94 103.87 7.39 22.85 73.08 37.10 15.02 Russia 4.95 52.09 0.80 12.50 34.10 18.53 5.21 Kazakhstan 2.94 13.94 0.01 2.00 6.80 8.10 1.99 Ukraine 2.58 22.28 0.07 3.40 11.50 9.76 3.67
1/ Aggregate of local marketing years. 2/ Total foreign and world use adjusted to reflect the differences in world imports and exports. 3/ World imports and exports may not balance due to differences in marketing years, grain in transit, and reporting discrepancies in some countries. 4/ Argentina, Australia, Canada, and the European Union. 5/ Trade excludes intra-trade. 6/ Brazil, China, Japan, Mexico, N. Africa, Pakistan, selected Middle East, and Southeast Asia. 7/ Lebanon, Iraq, Iran, Israel, Jordan, Kuwait, Saudi Arabia, Yemen, United Arab Emirates, and Oman. 8/ Algeria, Egypt, Libya, Morocco, and Tunisia. 9/ Indonesia, Malaysia, Philippines, Thailand, and Vietnam.
December 2014
WASDE - 536 - 19
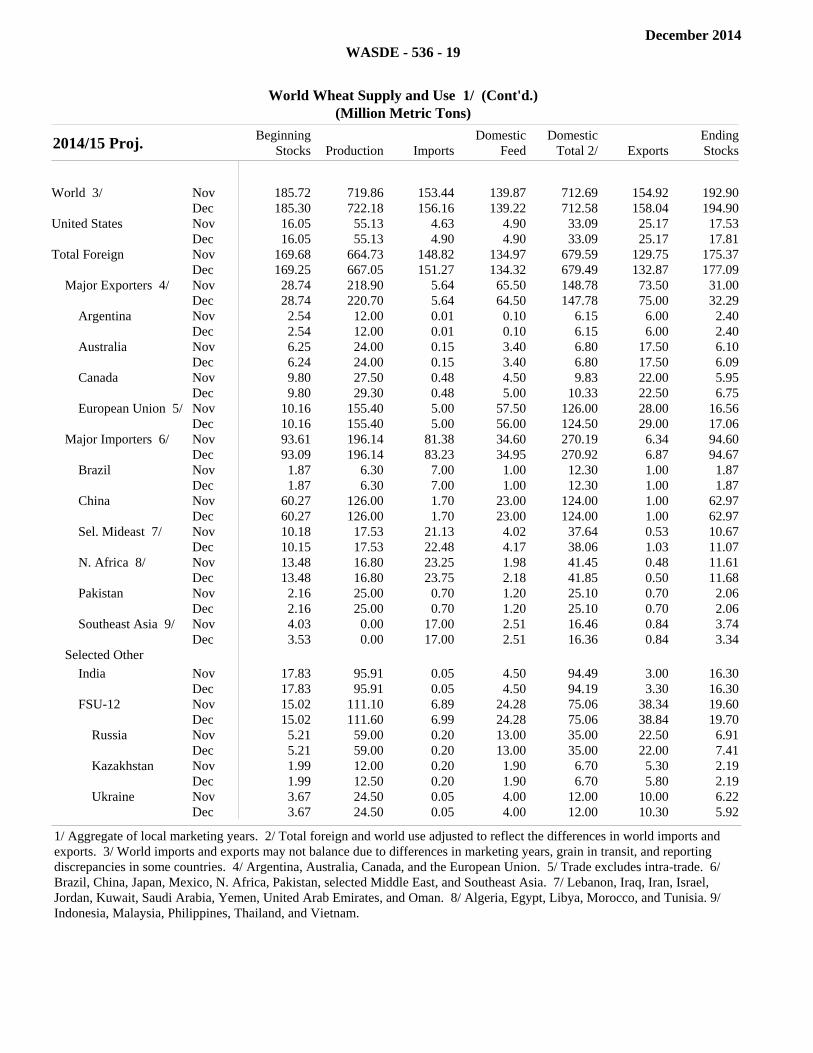
World Wheat Supply and Use 1/ (Cont'd.)
(Million Metric Tons)
2014/15 Proj. Beginning
Stocks Production ImportsDomestic
FeedDomestic
Total 2/ ExportsEndingStocks
World 3/ Nov 185.72 719.86 153.44 139.87 712.69 154.92 192.90
Dec 185.30 722.18 156.16 139.22 712.58 158.04 194.90United States Nov 16.05 55.13 4.63 4.90 33.09 25.17 17.53
Dec 16.05 55.13 4.90 4.90 33.09 25.17 17.81Total Foreign Nov 169.68 664.73 148.82 134.97 679.59 129.75 175.37
Dec 169.25 667.05 151.27 134.32 679.49 132.87 177.09 Major Exporters 4/ Nov 28.74 218.90 5.64 65.50 148.78 73.50 31.00
Dec 28.74 220.70 5.64 64.50 147.78 75.00 32.29 Argentina Nov 2.54 12.00 0.01 0.10 6.15 6.00 2.40
Dec 2.54 12.00 0.01 0.10 6.15 6.00 2.40 Australia Nov 6.25 24.00 0.15 3.40 6.80 17.50 6.10
Dec 6.24 24.00 0.15 3.40 6.80 17.50 6.09 Canada Nov 9.80 27.50 0.48 4.50 9.83 22.00 5.95
Dec 9.80 29.30 0.48 5.00 10.33 22.50 6.75 European Union 5/ Nov 10.16 155.40 5.00 57.50 126.00 28.00 16.56
Dec 10.16 155.40 5.00 56.00 124.50 29.00 17.06 Major Importers 6/ Nov 93.61 196.14 81.38 34.60 270.19 6.34 94.60
Dec 93.09 196.14 83.23 34.95 270.92 6.87 94.67 Brazil Nov 1.87 6.30 7.00 1.00 12.30 1.00 1.87
Dec 1.87 6.30 7.00 1.00 12.30 1.00 1.87 China Nov 60.27 126.00 1.70 23.00 124.00 1.00 62.97
Dec 60.27 126.00 1.70 23.00 124.00 1.00 62.97 Sel. Mideast 7/ Nov 10.18 17.53 21.13 4.02 37.64 0.53 10.67
Dec 10.15 17.53 22.48 4.17 38.06 1.03 11.07 N. Africa 8/ Nov 13.48 16.80 23.25 1.98 41.45 0.48 11.61
Dec 13.48 16.80 23.75 2.18 41.85 0.50 11.68 Pakistan Nov 2.16 25.00 0.70 1.20 25.10 0.70 2.06
Dec 2.16 25.00 0.70 1.20 25.10 0.70 2.06 Southeast Asia 9/ Nov 4.03 0.00 17.00 2.51 16.46 0.84 3.74
Dec 3.53 0.00 17.00 2.51 16.36 0.84 3.34 Selected Other India Nov 17.83 95.91 0.05 4.50 94.49 3.00 16.30
Dec 17.83 95.91 0.05 4.50 94.19 3.30 16.30 FSU-12 Nov 15.02 111.10 6.89 24.28 75.06 38.34 19.60
Dec 15.02 111.60 6.99 24.28 75.06 38.84 19.70 Russia Nov 5.21 59.00 0.20 13.00 35.00 22.50 6.91
Dec 5.21 59.00 0.20 13.00 35.00 22.00 7.41 Kazakhstan Nov 1.99 12.00 0.20 1.90 6.70 5.30 2.19
Dec 1.99 12.50 0.20 1.90 6.70 5.80 2.19 Ukraine Nov 3.67 24.50 0.05 4.00 12.00 10.00 6.22
Dec 3.67 24.50 0.05 4.00 12.00 10.30 5.92
1/ Aggregate of local marketing years. 2/ Total foreign and world use adjusted to reflect the differences in world imports and exports. 3/ World imports and exports may not balance due to differences in marketing years, grain in transit, and reporting discrepancies in some countries. 4/ Argentina, Australia, Canada, and the European Union. 5/ Trade excludes intra-trade. 6/ Brazil, China, Japan, Mexico, N. Africa, Pakistan, selected Middle East, and Southeast Asia. 7/ Lebanon, Iraq, Iran, Israel, Jordan, Kuwait, Saudi Arabia, Yemen, United Arab Emirates, and Oman. 8/ Algeria, Egypt, Libya, Morocco, and Tunisia. 9/ Indonesia, Malaysia, Philippines, Thailand, and Vietnam.

December 2014
WASDE - 536 - 20
World Coarse Grain Supply and Use 1/
(Million Metric Tons)
2012/13 Beginning
Stocks Production ImportsDomestic
FeedDomestic
Total 2/ ExportsEndingStocks
World 3/ 168.56 1,136.26 128.76 669.52 1,135.97 122.88 168.85United States 27.82 285.31 6.64 115.03 275.54 20.70 23.53Total Foreign 140.74 850.94 122.12 554.49 860.43 102.18 145.32 Major Exporters 4/ 19.38 170.21 1.97 76.93 105.23 62.11 24.22 Argentina 1.34 37.25 0.00 7.79 12.05 24.05 2.48 Australia 0.94 11.41 0.00 3.91 5.49 6.02 0.85 Brazil 9.82 84.25 1.27 47.05 55.80 24.98 14.56 Canada 3.39 24.43 0.51 12.97 20.26 4.99 3.08 Major Importers 5/ 38.90 227.34 92.10 238.36 317.44 8.10 32.80 European Union 6/ 15.60 145.89 11.84 113.68 153.10 7.36 12.87 Japan 1.09 0.18 17.74 13.22 18.03 0.00 0.98 Mexico 1.86 28.88 7.60 19.33 36.20 0.52 1.62 N. Afr & Mideast 7/ 12.56 26.48 23.53 45.85 53.03 0.13 9.41 Saudi Arabia 3.21 0.36 10.74 10.50 10.93 0.00 3.39 Southeast Asia 8/ 2.64 25.27 7.98 25.06 32.97 0.09 2.83 South Korea 1.54 0.21 8.27 6.53 8.71 0.00 1.31 Selected Other 0.00
China 60.37 212.19 5.60 146.05 209.67 0.11 68.39 FSU-12 6.16 68.22 0.73 35.55 50.21 19.87 5.04 Russia 1.81 28.66 0.34 16.40 25.13 4.30 1.38 Ukraine 2.42 29.53 0.05 10.93 14.66 15.00 2.33
2013/14 Est. Beginning
Stocks Production ImportsDomestic
FeedDomestic
Total 2/ Exports Ending Stocks
World 3/ 168.85 1,280.41 154.80 739.16 1,239.74 163.61 209.52United States 23.53 369.45 3.23 135.87 307.38 54.42 34.41Total Foreign 145.32 910.96 151.57 603.30 932.35 109.19 175.12 Major Exporters 4/ 24.22 173.33 1.87 82.01 112.07 56.46 30.90 Argentina 2.48 34.47 0.01 8.74 13.50 19.61 3.85 Australia 0.85 12.37 0.00 3.79 5.46 7.13 0.63 Brazil 14.56 82.41 1.20 48.58 58.38 21.52 18.28 Canada 3.08 28.75 0.54 15.40 22.58 5.19 4.60 Major Importers 5/ 32.80 248.54 112.56 257.28 339.88 10.99 43.03 European Union 6/ 12.87 158.42 16.13 121.88 163.80 8.63 15.00 Japan 0.98 0.18 17.50 12.88 17.69 0.00 0.97 Mexico 1.62 32.10 11.32 23.62 40.89 0.50 3.66 N. Afr & Mideast 7/ 9.41 30.22 29.90 49.08 56.59 0.31 12.62 Saudi Arabia 3.39 0.36 12.10 10.93 11.35 0.00 4.50 Southeast Asia 8/ 2.83 26.94 10.54 26.86 34.96 1.55 3.80 South Korea 1.31 0.21 10.50 7.85 10.12 0.00 1.90 Selected Other 0.00
China 68.39 225.07 12.45 161.78 227.60 0.03 78.27 FSU-12 5.04 87.63 0.73 40.12 55.98 30.72 6.70 Russia 1.38 35.74 0.21 18.80 28.52 6.95 1.86 Ukraine 2.33 39.92 0.08 12.32 16.23 22.77 3.33
1/ Aggregate of local marketing years. Coarse grains include corn, sorghum, barley, oats, rye, millet, and mixed grains (for U.S. excludes millet and mixed grains). 2/ Total foreign and world use adjusted to reflect the differences in world imports and exports. 3/ World imports and exports may not balance due to differences in marketing years, grain in transit, and reporting discrepancies in some countries. 4/ Argentina, Australia, Canada, Brazil, and South Africa. 5/ The European Union, Mexico, Japan, selected North Africa and Middle East, South Korea, Southeast Asia, and Taiwan. 6/ Trade excludes intra-trade. 7/ Algeria, Egypt, Iran, Israel, Jordan, Libya, Morocco, Syria, Tunisia, and Turkey. 8/ Indonesia, Malaysia, Philippines, Thailand, and Vietnam.

December 2014
WASDE - 536 - 21
World Coarse Grain Supply and Use 1/ (Cont'd.)
(Million Metric Tons)
2014/15 Proj. Beginning
Stocks Production ImportsDomestic
FeedDomestic
Total 2/ ExportsEndingStocks
World 3/ Nov 210.02 1,273.77 143.30 757.11 1,255.14 147.61 228.65
Dec 209.52 1,275.32 143.48 760.28 1,257.68 146.74 227.16United States Nov 34.41 381.37 3.35 141.92 314.66 50.55 53.92
Dec 34.41 381.37 3.35 141.92 314.91 50.55 53.67Total Foreign Nov 175.62 892.40 139.95 615.20 940.49 97.07 174.73
Dec 175.12 893.95 140.13 618.36 942.77 96.19 173.49 Major Exporters 4/ Nov 31.00 155.78 2.06 82.25 112.84 46.79 29.21
Dec 30.90 154.55 2.06 82.14 112.73 45.44 29.33 Argentina Nov 3.95 30.62 0.01 9.17 14.13 16.21 4.24
Dec 3.85 29.22 0.01 9.17 14.13 14.81 4.14 Australia Nov 0.63 11.21 0.00 4.16 5.84 5.35 0.65
Dec 0.63 11.21 0.00 4.11 5.79 5.40 0.65 Brazil Nov 18.28 78.11 1.21 50.08 59.90 19.51 18.18
Dec 18.28 78.11 1.21 50.08 59.90 19.51 18.18 Canada Nov 4.60 21.75 0.74 13.12 20.52 3.50 3.06
Dec 4.60 21.92 0.74 13.06 20.46 3.50 3.29 Major Importers 5/ Nov 43.30 252.02 100.84 259.04 342.60 10.46 43.10
Dec 43.03 252.83 101.12 261.99 345.45 10.88 40.64 European Union 6/ Nov 15.37 167.09 6.21 118.35 160.57 9.41 18.70
Dec 15.00 167.68 6.23 121.35 163.47 9.63 15.81 Japan Nov 0.97 0.18 18.29 13.68 18.49 0.00 0.95
Dec 0.97 0.18 17.99 13.38 18.19 0.00 0.95 Mexico Nov 3.60 31.34 11.20 24.42 41.94 0.50 3.70
Dec 3.66 31.34 11.20 24.42 41.94 0.50 3.76 N. Afr & Mideast 7/ Nov 12.58 25.19 31.37 51.07 58.83 0.11 10.19
Dec 12.62 25.19 31.37 51.07 58.83 0.11 10.23 Saudi Arabia Nov 4.50 0.36 10.50 11.20 11.68 0.00 3.69
Dec 4.50 0.36 11.05 11.45 11.93 0.00 3.99 Southeast Asia 8/ Nov 3.81 27.51 9.24 27.99 36.19 0.44 3.93
Dec 3.80 27.74 9.24 27.99 36.19 0.64 3.95 South Korea Nov 1.90 0.21 9.69 8.05 10.32 0.00 1.48
Dec 1.90 0.21 9.69 8.05 10.32 0.00 1.48 Selected Other China Nov 78.27 220.65 11.73 165.78 231.83 0.13 78.69
Dec 78.27 222.15 11.63 166.18 232.23 0.13 79.69 FSU-12 Nov 6.79 89.77 0.78 43.96 60.12 28.85 8.38
Dec 6.70 90.27 0.78 43.96 60.42 28.85 8.48 Russia Nov 1.95 40.50 0.18 22.10 32.30 7.41 2.91
Dec 1.86 41.00 0.18 22.10 32.60 7.41 3.02 Ukraine Nov 3.33 37.79 0.06 12.83 16.56 20.66 3.96
Dec 3.33 37.79 0.06 12.83 16.56 20.66 3.96
1/ Aggregate of local marketing years. Coarse grains include corn, sorghum, barley, oats, rye, millet, and mixed grains (for U.S. excludes millet and mixed grains). 2/ Total foreign and world use adjusted to reflect the differences in world imports and exports. 3/ World imports and exports may not balance due to differences in marketing years, grain in transit, and reporting discrepancies in some countries. 4/ Argentina, Australia, Canada, Brazil, and South Africa. 5/ The European Union, Mexico, Japan, selected North Africa and Middle East, South Korea, Southeast Asia, and Taiwan. 6/ Trade excludes intra-trade. 7/ Algeria, Egypt, Iran, Israel, Jordan, Libya, Morocco, Syria, Tunisia, and Turkey. 8/ Indonesia, Malaysia, Philippines, Thailand, and Vietnam.

December 2014
WASDE - 536 - 22
World Corn Supply and Use 1/
(Million Metric Tons)
2012/13 Beginning
Stocks Production ImportsDomestic
FeedDomestic
Total 2/ ExportsEndingStocks
World 3/ 134.53 867.97 99.42 518.77 864.70 95.16 137.80United States 25.12 273.19 4.06 109.60 262.97 18.55 20.86Total Foreign 109.41 594.77 95.35 409.17 601.72 76.61 116.94 Major Exporters 4/ 13.79 120.87 0.97 54.90 71.40 45.69 18.53 Argentina 0.90 27.00 0.00 5.30 7.90 18.69 1.32 Brazil 9.21 81.50 0.89 44.50 52.50 24.95 14.15 South Africa 3.68 12.37 0.08 5.10 11.00 2.06 3.06 Major Importers 5/ 15.36 111.62 56.86 119.58 168.81 2.82 12.22 Egypt 2.22 5.80 5.06 10.00 12.00 0.01 1.07 European Union 6/ 6.68 58.87 11.35 53.00 69.60 2.19 5.11 Japan 0.61 0.00 14.41 10.00 14.50 0.00 0.52 Mexico 1.32 21.59 5.68 11.00 27.00 0.52 1.06 Southeast Asia 7/ 2.64 25.22 7.96 25.00 32.90 0.09 2.82 South Korea 1.48 0.08 8.17 6.48 8.48 0.00 1.26 Selected Other 0.00
Canada 1.37 13.06 0.48 6.28 11.61 1.75 1.55 China 59.34 205.61 2.70 144.00 200.00 0.08 67.57 FSU-12 2.45 32.31 0.34 15.52 18.09 15.00 2.00 Ukraine 1.05 20.92 0.04 6.80 8.10 12.73 1.19
2013/14 Est. Beginning
Stocks Production ImportsDomestic
FeedDomestic
Total 2/ ExportsEnding Stocks
World 3/ 137.80 989.28 122.05 575.99 954.25 130.14 172.84United States 20.86 353.72 0.91 130.36 295.39 48.70 31.39Total Foreign 116.94 635.57 121.14 445.63 658.85 81.43 141.45 Major Exporters 4/ 18.53 119.05 0.83 57.20 75.20 40.00 23.21 Argentina 1.32 25.00 0.01 5.80 8.70 15.50 2.12 Brazil 14.15 79.30 0.80 46.00 55.00 21.50 17.75 South Africa 3.06 14.75 0.03 5.40 11.50 3.00 3.34 Major Importers 5/ 12.22 120.01 75.72 133.00 185.13 4.45 18.38 Egypt 1.07 5.80 8.50 11.00 13.20 0.01 2.16 European Union 6/ 5.11 64.19 15.82 57.50 76.00 2.40 6.71 Japan 0.52 0.00 15.12 10.60 15.10 0.00 0.55 Mexico 1.06 22.96 10.95 15.20 31.70 0.50 2.77 Southeast Asia 7/ 2.82 26.89 10.53 26.80 34.90 1.53 3.80 South Korea 1.26 0.08 10.41 7.80 9.90 0.00 1.85 Selected Other 0.00
Canada 1.55 14.19 0.50 7.62 12.80 1.85 1.59 China 67.57 218.49 3.28 154.00 212.00 0.02 77.32 FSU-12 2.00 46.90 0.42 18.67 21.44 24.65 3.24 Ukraine 1.19 30.90 0.05 8.50 9.90 20.00 2.24
1/ Aggregate of local marketing years. 2/ Total foreign and world use adjusted to reflect the differences in world imports and exports. 3/ World imports and exports may not balance due to differences in marketing years, grain in transit, and reporting discrepancies in some countries. 4/ Argentina, Brazil, and South Africa. 5/ Egypt, the European Union, Mexico, Japan, South Korea, Taiwan, and Southeast Asia. 6/ Trade excludes intra-trade. 7/ Indonesia, Malaysia, Philippines, Thailand, and Vietnam.

December 2014
WASDE - 536 - 23
World Corn Supply and Use 1/ (Cont'd.)
(Million Metric Tons)
2014/15 Proj. Beginning
Stocks Production ImportsDomestic
FeedDomestic
Total 2/ ExportsEndingStocks
World 3/ Nov 172.99 990.32 110.30 596.69 971.81 113.09 191.50
Dec 172.84 991.58 109.80 597.12 972.21 112.34 192.20United States Nov 31.39 365.97 0.64 136.53 302.53 44.45 51.01
Dec 31.39 365.97 0.64 136.53 302.78 44.45 50.75Total Foreign Nov 141.60 624.36 109.66 460.16 669.28 68.64 140.50
Dec 141.45 625.62 109.16 460.59 669.43 67.89 141.45 Major Exporters 4/ Nov 23.21 111.50 0.84 59.20 77.50 34.70 23.34
Dec 23.21 110.50 0.84 59.20 77.50 33.70 23.34 Argentina Nov 2.12 23.00 0.01 6.10 9.20 13.00 2.93
Dec 2.12 22.00 0.01 6.10 9.20 12.00 2.93 Brazil Nov 17.75 75.00 0.80 47.50 56.50 19.50 17.55
Dec 17.75 75.00 0.80 47.50 56.50 19.50 17.55 South Africa Nov 3.34 13.50 0.03 5.60 11.80 2.20 2.86
Dec 3.34 13.50 0.03 5.60 11.80 2.20 2.86 Major Importers 5/ Nov 18.51 129.48 62.80 136.50 189.58 3.45 17.77
Dec 18.38 130.24 62.80 137.00 190.08 3.65 17.70filler filler filler filler filler filler filler
Egypt Nov 2.16 5.75 7.50 11.50 13.80 0.01 1.60Dec 2.16 5.75 7.50 11.50 13.80 0.01 1.60
European Union 6/
Nov 6.88 73.05 6.00 57.50 76.50 2.50 6.93Dec 6.71 73.59 6.00 58.00 77.00 2.50 6.80
Japan Nov 0.55 0.00 15.40 10.90 15.40 0.00 0.55Dec 0.55 0.00 15.40 10.90 15.40 0.00 0.55
Mexico Nov 2.73 23.00 10.90 16.50 33.25 0.50 2.88Dec 2.77 23.00 10.90 16.50 33.25 0.50 2.92
Southeast Asia 7/ Nov 3.80 27.46 9.20 27.90 36.10 0.44 3.92Dec 3.80 27.68 9.20 27.90 36.10 0.64 3.95
South Korea Nov 1.85 0.08 9.60 8.00 10.10 0.00 1.42Dec 1.85 0.08 9.60 8.00 10.10 0.00 1.42
Selected Other Canada Nov 1.59 11.50 0.70 6.60 12.00 0.50 1.29
Dec 1.59 11.50 0.70 6.60 12.00 0.50 1.29 China Nov 77.32 214.00 2.50 158.00 216.00 0.10 77.72
Dec 77.32 215.50 2.00 158.00 216.00 0.10 78.72 FSU-12 Nov 3.33 42.66 0.42 20.29 23.16 19.84 3.41
Dec 3.24 42.66 0.42 20.29 23.16 19.84 3.32 Ukraine Nov 2.24 27.00 0.05 9.00 10.40 16.50 2.39
Dec 2.24 27.00 0.05 9.00 10.40 16.50 2.39
1/ Aggregate of local marketing years. 2/ Total foreign and world use adjusted to reflect the differences in world imports and exports. 3/ World imports and exports may not balance due to differences in marketing years, grain in transit, and reporting discrepancies in some countries. 4/ Argentina, Brazil, and South Africa. 5/ Egypt, the European Union, Mexico, Japan, South Korea, Taiwan, and Southeast Asia. 6/ Trade excludes intra-trade. 7/ Indonesia, Malaysia, Philippines, Thailand, and Vietnam.
December 2014
WASDE - 536 - 24
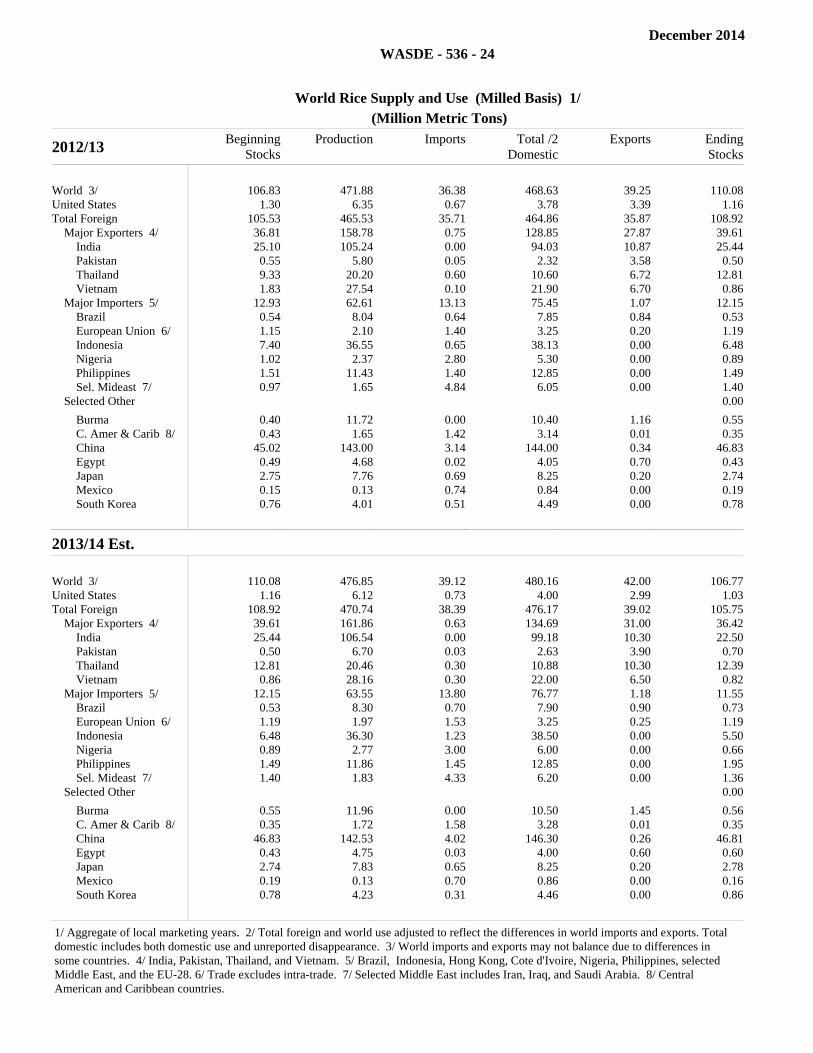
World Rice Supply and Use (Milled Basis) 1/
(Million Metric Tons)
2012/13 Beginning
StocksProduction Imports Total /2
DomesticExports Ending
Stocks
World 3/ 106.83 471.88 36.38 468.63 39.25 110.08United States 1.30 6.35 0.67 3.78 3.39 1.16Total Foreign 105.53 465.53 35.71 464.86 35.87 108.92 Major Exporters 4/ 36.81 158.78 0.75 128.85 27.87 39.61 India 25.10 105.24 0.00 94.03 10.87 25.44 Pakistan 0.55 5.80 0.05 2.32 3.58 0.50 Thailand 9.33 20.20 0.60 10.60 6.72 12.81 Vietnam 1.83 27.54 0.10 21.90 6.70 0.86 Major Importers 5/ 12.93 62.61 13.13 75.45 1.07 12.15 Brazil 0.54 8.04 0.64 7.85 0.84 0.53 European Union 6/ 1.15 2.10 1.40 3.25 0.20 1.19 Indonesia 7.40 36.55 0.65 38.13 0.00 6.48 Nigeria 1.02 2.37 2.80 5.30 0.00 0.89 Philippines 1.51 11.43 1.40 12.85 0.00 1.49 Sel. Mideast 7/ 0.97 1.65 4.84 6.05 0.00 1.40 Selected Other 0.00
Burma 0.40 11.72 0.00 10.40 1.16 0.55 C. Amer & Carib 8/ 0.43 1.65 1.42 3.14 0.01 0.35 China 45.02 143.00 3.14 144.00 0.34 46.83 Egypt 0.49 4.68 0.02 4.05 0.70 0.43 Japan 2.75 7.76 0.69 8.25 0.20 2.74 Mexico 0.15 0.13 0.74 0.84 0.00 0.19 South Korea 0.76 4.01 0.51 4.49 0.00 0.78
2013/14 Est. Beginning
Stocks Production ImportsTotal /2
Domestic ExportsEndingStocks
World 3/ 110.08 476.85 39.12 480.16 42.00 106.77United States 1.16 6.12 0.73 4.00 2.99 1.03Total Foreign 108.92 470.74 38.39 476.17 39.02 105.75 Major Exporters 4/ 39.61 161.86 0.63 134.69 31.00 36.42 India 25.44 106.54 0.00 99.18 10.30 22.50 Pakistan 0.50 6.70 0.03 2.63 3.90 0.70 Thailand 12.81 20.46 0.30 10.88 10.30 12.39 Vietnam 0.86 28.16 0.30 22.00 6.50 0.82 Major Importers 5/ 12.15 63.55 13.80 76.77 1.18 11.55 Brazil 0.53 8.30 0.70 7.90 0.90 0.73 European Union 6/ 1.19 1.97 1.53 3.25 0.25 1.19 Indonesia 6.48 36.30 1.23 38.50 0.00 5.50 Nigeria 0.89 2.77 3.00 6.00 0.00 0.66 Philippines 1.49 11.86 1.45 12.85 0.00 1.95 Sel. Mideast 7/ 1.40 1.83 4.33 6.20 0.00 1.36 Selected Other 0.00
Burma 0.55 11.96 0.00 10.50 1.45 0.56 C. Amer & Carib 8/ 0.35 1.72 1.58 3.28 0.01 0.35 China 46.83 142.53 4.02 146.30 0.26 46.81 Egypt 0.43 4.75 0.03 4.00 0.60 0.60 Japan 2.74 7.83 0.65 8.25 0.20 2.78 Mexico 0.19 0.13 0.70 0.86 0.00 0.16 South Korea 0.78 4.23 0.31 4.46 0.00 0.86
1/ Aggregate of local marketing years. 2/ Total foreign and world use adjusted to reflect the differences in world imports and exports. Total domestic includes both domestic use and unreported disappearance. 3/ World imports and exports may not balance due to differences in some countries. 4/ India, Pakistan, Thailand, and Vietnam. 5/ Brazil, Indonesia, Hong Kong, Cote d'Ivoire, Nigeria, Philippines, selected Middle East, and the EU-28. 6/ Trade excludes intra-trade. 7/ Selected Middle East includes Iran, Iraq, and Saudi Arabia. 8/ Central American and Caribbean countries.

December 2014
WASDE - 536 - 25
World Rice Supply and Use (Milled Basis) 1/ (Cont'd.)
(Million Metric Tons)
2014/15 Proj. Beginning
StocksProduction Imports Total /2
DomesticExports Ending
Stocks
World 3/ Nov 106.46 475.05 39.05 482.95 41.53 98.56
Dec 106.77 475.24 39.45 482.89 41.91 99.12United States Nov 1.03 7.07 0.67 4.19 3.26 1.31
filler filler filler filler filler filler
Dec 1.03 7.07 0.67 4.19 3.29 1.28Total Foreign Nov 105.43 467.98 38.38 478.76 38.27 97.25
filler filler filler filler filler filler
Dec 105.75 468.17 38.78 478.70 38.62 97.84 Major Exporters 4/ Nov 36.26 157.20 0.73 134.50 30.10 29.59
Dec 36.42 157.25 0.73 134.50 30.30 29.60 India Nov 22.50 102.00 0.00 99.00 8.70 16.80
Dec 22.50 102.00 0.00 99.00 8.70 16.80filler filler filler filler filler filler
Pakistan Nov 0.70 6.50 0.03 2.70 3.90 0.63Dec 0.70 6.50 0.03 2.70 3.90 0.63
Thailand Nov 12.39 20.50 0.30 10.90 10.80 11.49Dec 12.39 20.50 0.30 10.90 11.00 11.29
Vietnam Nov 0.66 28.20 0.40 21.90 6.70 0.66Dec 0.82 28.25 0.40 21.90 6.70 0.87
Major Importers 5/ Nov 11.39 64.43 14.40 78.13 1.15 10.94Dec 11.55 63.93 14.70 78.16 1.15 10.87
Brazil Nov 0.73 8.35 0.70 7.90 0.90 0.98filler filler filler filler filler filler
Dec 0.73 8.35 0.70 7.90 0.90 0.98 European Union 6/ Nov 1.16 1.95 1.50 3.23 0.22 1.16
Dec 1.19 1.95 1.50 3.26 0.22 1.16 Indonesia Nov 5.38 37.00 1.00 39.20 0.00 4.18
Dec 5.50 36.50 1.30 39.20 0.00 4.10 Nigeria Nov 0.66 2.55 3.50 6.10 0.00 0.61
Dec 0.66 2.55 3.50 6.10 0.00 0.61 Philippines Nov 1.95 12.20 1.60 13.20 0.00 2.55
Dec 1.95 12.20 1.60 13.20 0.00 2.55 Sel. Mideast 7/ Nov 1.36 1.85 4.48 6.38 0.00 1.31
Dec 1.36 1.85 4.48 6.38 0.00 1.31 Selected Other Burma Nov 0.71 12.15 0.00 11.00 1.30 0.56
Dec 0.56 12.15 0.00 10.90 1.40 0.41 C. Amer & Carib 8/ Nov 0.33 1.75 1.55 3.29 0.01 0.33
Dec 0.35 1.75 1.55 3.29 0.01 0.34 China Nov 46.70 144.00 3.90 148.00 0.35 46.25
Dec 46.81 144.50 4.00 148.00 0.40 46.91 Egypt Nov 0.60 4.50 0.03 4.00 0.50 0.63
Dec 0.60 4.50 0.03 4.00 0.50 0.63 Japan Nov 2.76 7.70 0.70 8.20 0.20 2.76
Dec 2.78 7.70 0.70 8.20 0.20 2.78 Mexico Nov 0.16 0.15 0.78 0.89 0.00 0.19
Dec 0.16 0.15 0.78 0.89 0.00 0.19 South Korea Nov 0.86 4.18 0.41 4.45 0.00 1.00
Dec 0.86 4.24 0.41 4.45 0.00 1.06
1/ Aggregate of local marketing years. 2/ Total foreign and world use adjusted to reflect the differences in world imports and exports. Total domestic includes both domestic use and unreported disappearance. 3/ World imports and exports may not balance due to differences in some countries. 4/ India, Pakistan, Thailand, and Vietnam. 5/ Brazil, Indonesia, Hong Kong, Cote d'Ivoire, Nigeria, Philippines, selected Middle East, and the EU-28. 6/ Trade excludes intra-trade. 7/ Selected Middle East includes Iran, Iraq, and Saudi Arabia. 8/ Central American and Caribbean countries.
December 2014
WASDE - 536 - 26
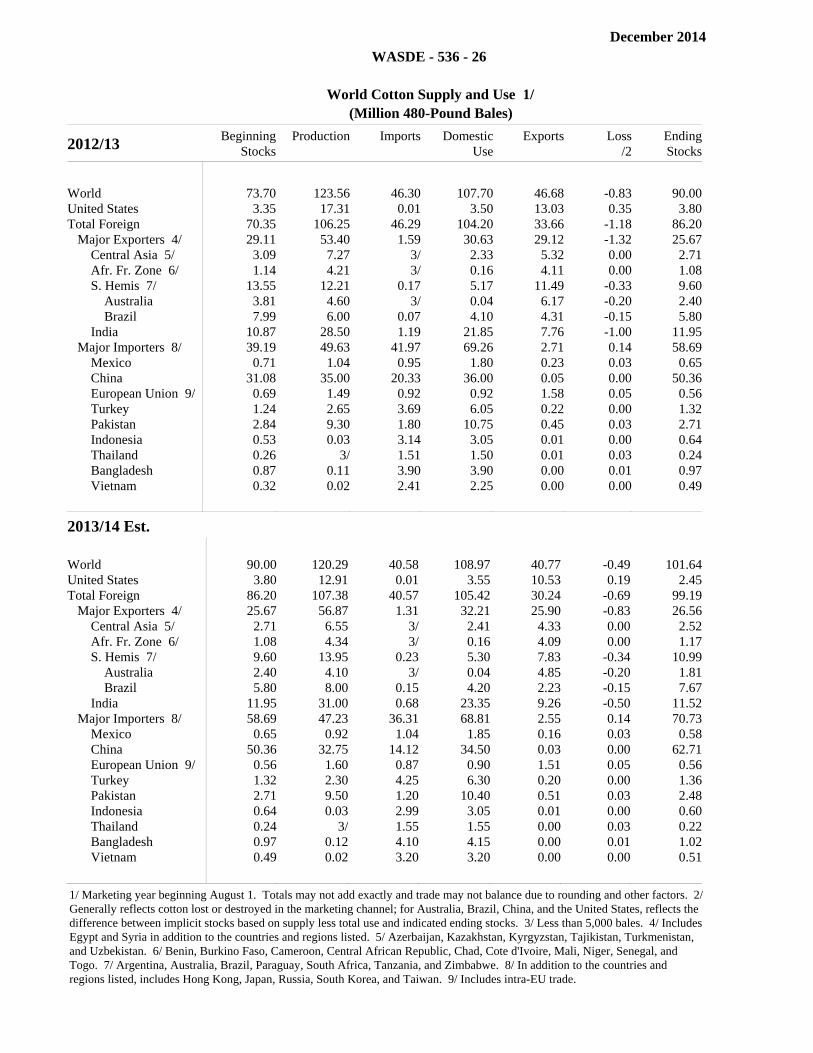
World Cotton Supply and Use 1/
(Million 480-Pound Bales)
2012/13 Beginning
StocksProduction Imports Domestic
UseExports Loss
/2 EndingStocks
World 73.70 123.56 46.30 107.70 46.68 -0.83 90.00United States 3.35 17.31 0.01 3.50 13.03 0.35 3.80Total Foreign 70.35 106.25 46.29 104.20 33.66 -1.18 86.20 Major Exporters 4/ 29.11 53.40 1.59 30.63 29.12 -1.32 25.67 Central Asia 5/ 3.09 7.27 3/ 2.33 5.32 0.00 2.71 Afr. Fr. Zone 6/ 1.14 4.21 3/ 0.16 4.11 0.00 1.08 S. Hemis 7/ 13.55 12.21 0.17 5.17 11.49 -0.33 9.60 Australia 3.81 4.60 3/ 0.04 6.17 -0.20 2.40 Brazil 7.99 6.00 0.07 4.10 4.31 -0.15 5.80 India 10.87 28.50 1.19 21.85 7.76 -1.00 11.95 Major Importers 8/ 39.19 49.63 41.97 69.26 2.71 0.14 58.69 Mexico 0.71 1.04 0.95 1.80 0.23 0.03 0.65 China 31.08 35.00 20.33 36.00 0.05 0.00 50.36 European Union 9/ 0.69 1.49 0.92 0.92 1.58 0.05 0.56 Turkey 1.24 2.65 3.69 6.05 0.22 0.00 1.32 Pakistan 2.84 9.30 1.80 10.75 0.45 0.03 2.71 Indonesia 0.53 0.03 3.14 3.05 0.01 0.00 0.64 Thailand 0.26 3/ 1.51 1.50 0.01 0.03 0.24 Bangladesh 0.87 0.11 3.90 3.90 0.00 0.01 0.97 Vietnam 0.32 0.02 2.41 2.25 0.00 0.00 0.49
2013/14 Est. Beginning
Stocks Production ImportsDomestic
Use ExportsLoss
/2 EndingStocks
World 90.00 120.29 40.58 108.97 40.77 -0.49 101.64United States 3.80 12.91 0.01 3.55 10.53 0.19 2.45Total Foreign 86.20 107.38 40.57 105.42 30.24 -0.69 99.19 Major Exporters 4/ 25.67 56.87 1.31 32.21 25.90 -0.83 26.56 Central Asia 5/ 2.71 6.55 3/ 2.41 4.33 0.00 2.52 Afr. Fr. Zone 6/ 1.08 4.34 3/ 0.16 4.09 0.00 1.17 S. Hemis 7/ 9.60 13.95 0.23 5.30 7.83 -0.34 10.99 Australia 2.40 4.10 3/ 0.04 4.85 -0.20 1.81 Brazil 5.80 8.00 0.15 4.20 2.23 -0.15 7.67 India 11.95 31.00 0.68 23.35 9.26 -0.50 11.52 Major Importers 8/ 58.69 47.23 36.31 68.81 2.55 0.14 70.73 Mexico 0.65 0.92 1.04 1.85 0.16 0.03 0.58 China 50.36 32.75 14.12 34.50 0.03 0.00 62.71 European Union 9/ 0.56 1.60 0.87 0.90 1.51 0.05 0.56 Turkey 1.32 2.30 4.25 6.30 0.20 0.00 1.36 Pakistan 2.71 9.50 1.20 10.40 0.51 0.03 2.48 Indonesia 0.64 0.03 2.99 3.05 0.01 0.00 0.60 Thailand 0.24 3/ 1.55 1.55 0.00 0.03 0.22 Bangladesh 0.97 0.12 4.10 4.15 0.00 0.01 1.02 Vietnam 0.49 0.02 3.20 3.20 0.00 0.00 0.51
1/ Marketing year beginning August 1. Totals may not add exactly and trade may not balance due to rounding and other factors. 2/ Generally reflects cotton lost or destroyed in the marketing channel; for Australia, Brazil, China, and the United States, reflects the difference between implicit stocks based on supply less total use and indicated ending stocks. 3/ Less than 5,000 bales. 4/ Includes Egypt and Syria in addition to the countries and regions listed. 5/ Azerbaijan, Kazakhstan, Kyrgyzstan, Tajikistan, Turkmenistan, and Uzbekistan. 6/ Benin, Burkino Faso, Cameroon, Central African Republic, Chad, Cote d'Ivoire, Mali, Niger, Senegal, and Togo. 7/ Argentina, Australia, Brazil, Paraguay, South Africa, Tanzania, and Zimbabwe. 8/ In addition to the countries and regions listed, includes Hong Kong, Japan, Russia, South Korea, and Taiwan. 9/ Includes intra-EU trade.

December 2014
WASDE - 536 - 27
World Cotton Supply and Use 1/
(Million 480-Pound Bales)
2014/15 Proj. Beginning
StocksProduction Imports Domestic
UseExports Loss
/2 EndingStocks
World Nov 101.48 119.61 34.35 113.85 34.35 -0.13 107.36
Dec 101.64 118.98 34.25 112.60 34.29 -0.10 108.08United States Nov 2.45 16.40 0.01 3.80 10.00 -0.04 5.10
Dec 2.45 15.92 0.01 3.80 10.00 -0.02 4.60Total Foreign Nov 99.03 103.21 34.34 110.05 24.35 -0.09 102.26
Dec 99.19 103.06 34.24 108.80 24.29 -0.09 103.48filler filler filler filler filler filler filler
Major Exporters 4/ Nov 26.36 53.75 1.31 33.09 20.03 -0.23 28.52Dec 26.56 53.71 1.61 32.54 20.04 -0.23 29.52
Central Asia 5/ Nov 2.52 6.34 3/ 2.35 3.60 0.00 2.91Dec 2.52 6.26 3/ 2.40 3.57 0.00 2.81
Afr. Fr. Zone 6/ Nov 1.17 4.66 3/ 0.15 4.01 0.00 1.67Dec 1.17 4.70 3/ 0.15 4.05 0.00 1.67
S. Hemis 7/ Nov 10.99 10.93 0.16 5.19 7.15 -0.24 9.97Dec 10.99 10.93 0.16 5.09 7.15 -0.24 10.07
Australia Nov 1.81 2.20 3/ 0.04 3.00 -0.10 1.07Dec 1.81 2.20 3/ 0.04 3.00 -0.10 1.07
Brazil Nov 7.67 7.00 0.08 4.10 3.40 -0.15 7.39Dec 7.67 7.00 0.08 4.00 3.40 -0.15 7.49
India Nov 11.32 31.00 0.80 24.50 5.00 0.00 13.62Dec 11.52 31.00 1.10 24.00 5.00 0.00 14.62
filler filler filler filler filler filler filler
Major Importers 8/ Nov 70.78 46.12 29.96 72.56 2.54 0.14 71.63Dec 70.73 46.00 29.56 71.86 2.45 0.14 71.86
Mexico Nov 0.58 1.22 1.03 1.88 0.20 0.03 0.72Dec 0.58 1.22 1.03 1.88 0.18 0.03 0.75
China Nov 62.71 30.00 7.00 37.50 0.05 0.00 62.16Dec 62.71 30.00 7.00 37.00 0.05 0.00 62.66
European Union 9/
Nov 0.56 1.79 0.86 0.92 1.50 0.05 0.74Dec 0.56 1.62 0.86 0.92 1.40 0.05 0.67
Turkey Nov 1.36 3.15 3.80 6.50 0.20 0.00 1.61Dec 1.36 3.20 3.60 6.40 0.23 0.00 1.53
Pakistan Nov 2.48 9.80 1.50 10.60 0.45 0.03 2.70Dec 2.48 9.80 1.40 10.50 0.45 0.03 2.70
Indonesia Nov 0.57 0.03 3.10 3.05 0.01 0.00 0.64Dec 0.60 0.03 3.10 3.10 0.01 0.00 0.62
Thailand Nov 0.29 3/ 1.58 1.50 0.01 0.03 0.34Dec 0.22 3/ 1.48 1.45 0.01 0.03 0.21
Bangladesh Nov 1.02 0.12 4.45 4.35 0.00 0.01 1.23Dec 1.02 0.12 4.45 4.35 0.00 0.01 1.23
Vietnam Nov 0.51 0.02 3.60 3.40 0.00 0.00 0.72Dec 0.51 0.02 3.60 3.40 0.00 0.00 0.72
1/ Marketing year beginning August 1. Totals may not add exactly and trade may not balance due to rounding and other factors. 2/ Generally reflects cotton lost or destroyed in the marketing channel; for Australia, Brazil, China, and the United States, reflects the difference between implicit stocks based on supply less total use and indicated ending stocks. 3/ Less than 5,000 bales. 4/ Includes Egypt and Syria in addition to the countries and regions listed. 5/ Azerbaijan, Kazakhstan, Kyrgyzstan, Tajikistan, Turkmenistan, and Uzbekistan. 6/ Benin, Burkino Faso, Cameroon, Central African Republic, Chad, Cote d'Ivoire, Mali, Niger, Senegal, and Togo. 7/ Argentina, Australia, Brazil, Paraguay, South Africa, Tanzania, and Zimbabwe. 8/ In addition to the countries and regions listed, includes Hong Kong, Japan, Russia, South Korea, and Taiwan. 9/ Includes intra-EU trade.
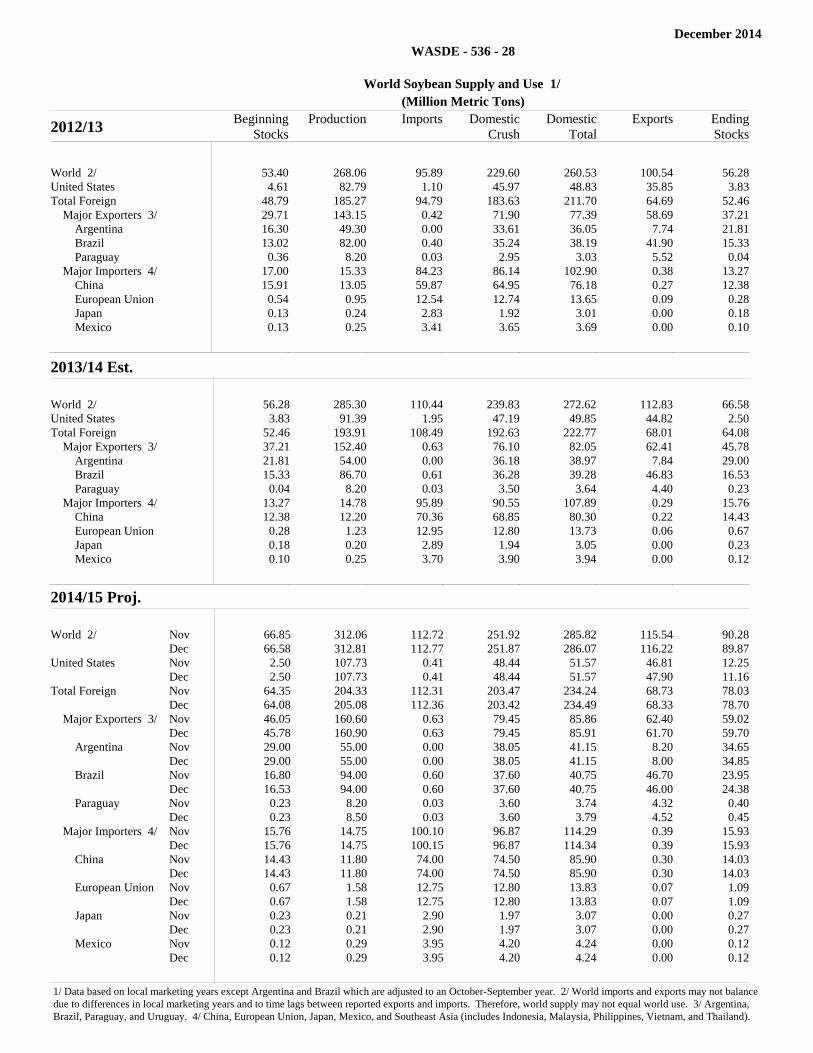
December 2014
WASDE - 536 - 28
World Soybean Supply and Use 1/
(Million Metric Tons)
2012/13 Beginning
StocksProduction Imports Domestic
CrushDomestic
TotalExports Ending
Stocks
World 2/ 53.40 268.06 95.89 229.60 260.53 100.54 56.28United States 4.61 82.79 1.10 45.97 48.83 35.85 3.83Total Foreign 48.79 185.27 94.79 183.63 211.70 64.69 52.46 Major Exporters 3/ 29.71 143.15 0.42 71.90 77.39 58.69 37.21 Argentina 16.30 49.30 0.00 33.61 36.05 7.74 21.81 Brazil 13.02 82.00 0.40 35.24 38.19 41.90 15.33 Paraguay 0.36 8.20 0.03 2.95 3.03 5.52 0.04 Major Importers 4/ 17.00 15.33 84.23 86.14 102.90 0.38 13.27 China 15.91 13.05 59.87 64.95 76.18 0.27 12.38 European Union 0.54 0.95 12.54 12.74 13.65 0.09 0.28 Japan 0.13 0.24 2.83 1.92 3.01 0.00 0.18 Mexico 0.13 0.25 3.41 3.65 3.69 0.00 0.10
2013/14 Est. Beginning
Stocks Production ImportsDomestic
CrushDomestic
Total ExportsEnding Stocks
World 2/ 56.28 285.30 110.44 239.83 272.62 112.83 66.58United States 3.83 91.39 1.95 47.19 49.85 44.82 2.50Total Foreign 52.46 193.91 108.49 192.63 222.77 68.01 64.08 Major Exporters 3/ 37.21 152.40 0.63 76.10 82.05 62.41 45.78 Argentina 21.81 54.00 0.00 36.18 38.97 7.84 29.00 Brazil 15.33 86.70 0.61 36.28 39.28 46.83 16.53 Paraguay 0.04 8.20 0.03 3.50 3.64 4.40 0.23 Major Importers 4/ 13.27 14.78 95.89 90.55 107.89 0.29 15.76 China 12.38 12.20 70.36 68.85 80.30 0.22 14.43 European Union 0.28 1.23 12.95 12.80 13.73 0.06 0.67 Japan 0.18 0.20 2.89 1.94 3.05 0.00 0.23 Mexico 0.10 0.25 3.70 3.90 3.94 0.00 0.12
2014/15 Proj. Beginning
Stocks Production Imports Domestic Crush
Domestic Total Exports Ending
Stocks
World 2/ Nov 66.85 312.06 112.72 251.92 285.82 115.54 90.28
Dec 66.58 312.81 112.77 251.87 286.07 116.22 89.87United States Nov 2.50 107.73 0.41 48.44 51.57 46.81 12.25
Dec 2.50 107.73 0.41 48.44 51.57 47.90 11.16Total Foreign Nov 64.35 204.33 112.31 203.47 234.24 68.73 78.03
Dec 64.08 205.08 112.36 203.42 234.49 68.33 78.70 Major Exporters 3/ Nov 46.05 160.60 0.63 79.45 85.86 62.40 59.02
Dec 45.78 160.90 0.63 79.45 85.91 61.70 59.70 Argentina Nov 29.00 55.00 0.00 38.05 41.15 8.20 34.65
Dec 29.00 55.00 0.00 38.05 41.15 8.00 34.85 Brazil Nov 16.80 94.00 0.60 37.60 40.75 46.70 23.95
Dec 16.53 94.00 0.60 37.60 40.75 46.00 24.38 Paraguay Nov 0.23 8.20 0.03 3.60 3.74 4.32 0.40
Dec 0.23 8.50 0.03 3.60 3.79 4.52 0.45 Major Importers 4/ Nov 15.76 14.75 100.10 96.87 114.29 0.39 15.93
Dec 15.76 14.75 100.15 96.87 114.34 0.39 15.93 China Nov 14.43 11.80 74.00 74.50 85.90 0.30 14.03
Dec 14.43 11.80 74.00 74.50 85.90 0.30 14.03 European Union Nov 0.67 1.58 12.75 12.80 13.83 0.07 1.09
Dec 0.67 1.58 12.75 12.80 13.83 0.07 1.09 Japan Nov 0.23 0.21 2.90 1.97 3.07 0.00 0.27
Dec 0.23 0.21 2.90 1.97 3.07 0.00 0.27 Mexico Nov 0.12 0.29 3.95 4.20 4.24 0.00 0.12
Dec 0.12 0.29 3.95 4.20 4.24 0.00 0.12
1/ Data based on local marketing years except Argentina and Brazil which are adjusted to an October-September year. 2/ World imports and exports may not balance due to differences in local marketing years and to time lags between reported exports and imports. Therefore, world supply may not equal world use. 3/ Argentina, Brazil, Paraguay, and Uruguay. 4/ China, European Union, Japan, Mexico, and Southeast Asia (includes Indonesia, Malaysia, Philippines, Vietnam, and Thailand).

December 2014
WASDE - 536 - 29
World Soybean Meal Supply and Use 1/
(Million Metric Tons)
2012/13 Beginning
StocksProduction Imports Domestic
TotalExports Ending
Stocks
World 2/ 9.93 180.85 53.85 177.30 57.84 9.49United States 0.27 36.17 0.22 26.28 10.14 0.25Total Foreign 9.65 144.67 53.63 151.02 47.70 9.24 Major Exporters 3/ 6.33 61.24 0.04 19.33 41.26 7.02 Argentina 2.92 26.09 0.00 1.60 23.67 3.74 Brazil 3.20 27.31 0.03 14.20 13.24 3.10 India 0.21 7.84 0.01 3.53 4.35 0.18 Major Importers 4/ 1.68 13.77 31.17 45.05 0.57 1.00 European Union 0.57 10.07 16.94 26.89 0.54 0.15 Southeast Asia 5/ 0.90 2.26 12.47 14.81 0.04 0.78
2013/14 Est. Beginning
Stocks Production ImportsDomestic
Total Exports Ending Stocks
World 2/ 9.49 188.39 57.43 185.20 59.62 10.48United States 0.25 36.91 0.31 26.76 10.48 0.23Total Foreign 9.24 151.48 57.13 158.45 49.15 10.26 Major Exporters 3/ 7.02 62.81 0.03 20.30 41.65 7.91 Argentina 3.74 27.95 0.00 1.80 24.96 4.93 Brazil 3.10 27.98 0.03 14.40 13.95 2.76 India 0.18 6.88 0.01 4.10 2.74 0.22 Major Importers 4/ 1.00 13.97 33.29 46.80 0.38 1.09 European Union 0.15 10.11 18.35 28.02 0.31 0.29 Southeast Asia 5/ 0.78 2.40 12.97 15.36 0.07 0.72
2014/15 Proj. Beginning
Stocks Production Imports Domestic Total
Exports Ending Stocks
World 2/ Nov 10.27 198.96 60.76 195.09 64.02 10.89
Dec 10.48 198.92 60.76 195.01 63.92 11.24United States Nov 0.23 38.81 0.15 27.31 11.61 0.27
Dec 0.23 38.81 0.15 27.31 11.61 0.27Total Foreign Nov 10.05 160.15 60.61 167.78 52.41 10.62
Dec 10.26 160.11 60.61 167.71 52.31 10.97 Major Exporters 3/ Nov 7.70 65.78 0.03 21.10 44.88 7.53
Dec 7.91 65.70 0.03 20.99 44.78 7.87 Argentina Nov 4.93 29.58 0.00 2.00 27.83 4.68
Dec 4.93 29.58 0.00 2.00 27.83 4.68 Brazil Nov 2.55 29.00 0.03 14.85 14.10 2.62
Dec 2.76 29.00 0.03 14.71 14.10 2.97 India Nov 0.22 7.20 0.01 4.25 2.95 0.23
Dec 0.22 7.12 0.01 4.28 2.85 0.22 Major Importers 4/ Nov 1.09 14.22 35.68 48.84 0.62 1.54
Dec 1.09 14.22 35.68 48.84 0.62 1.54 European Union Nov 0.29 10.08 19.80 29.04 0.55 0.57
Dec 0.29 10.08 19.80 29.04 0.55 0.57 Southeast Asia 5/ Nov 0.72 2.65 13.78 16.19 0.07 0.89
Dec 0.72 2.65 13.78 16.19 0.07 0.89
1/ Data based on local marketing years except for Argentina and Brazil which are adjusted to an October-September year. 2/ World imports and exports may not balance due to differences in local marketing years and to time lags between reported exports and imports. Therefore, world supply may not equal world use. 3/ Argentina, Brazil, and India. 4/ European Union, Southeast Asia, and Japan. 5/ Indonesia, Malaysia, Philippines, Vietnam, and Thailand.
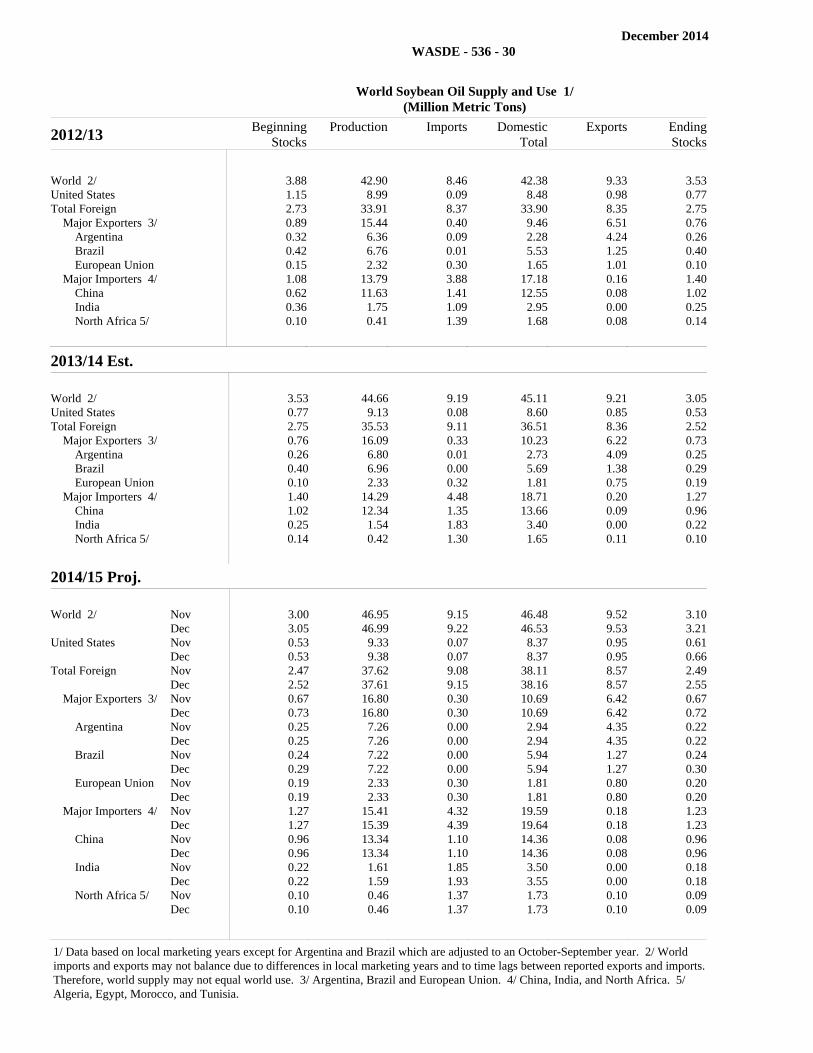
December 2014
WASDE - 536 - 30
World Soybean Oil Supply and Use 1/
(Million Metric Tons)
2012/13 Beginning
StocksProduction Imports Domestic
TotalExports Ending
Stocks
World 2/ 3.88 42.90 8.46 42.38 9.33 3.53United States 1.15 8.99 0.09 8.48 0.98 0.77Total Foreign 2.73 33.91 8.37 33.90 8.35 2.75 Major Exporters 3/ 0.89 15.44 0.40 9.46 6.51 0.76 Argentina 0.32 6.36 0.09 2.28 4.24 0.26 Brazil 0.42 6.76 0.01 5.53 1.25 0.40 European Union 0.15 2.32 0.30 1.65 1.01 0.10 Major Importers 4/ 1.08 13.79 3.88 17.18 0.16 1.40 China 0.62 11.63 1.41 12.55 0.08 1.02 India 0.36 1.75 1.09 2.95 0.00 0.25 North Africa 5/ 0.10 0.41 1.39 1.68 0.08 0.14
2013/14 Est. Beginning Stocks Production Imports
Domestic Total Exports Ending
Stocks
World 2/ 3.53 44.66 9.19 45.11 9.21 3.05United States 0.77 9.13 0.08 8.60 0.85 0.53Total Foreign 2.75 35.53 9.11 36.51 8.36 2.52 Major Exporters 3/ 0.76 16.09 0.33 10.23 6.22 0.73 Argentina 0.26 6.80 0.01 2.73 4.09 0.25 Brazil 0.40 6.96 0.00 5.69 1.38 0.29 European Union 0.10 2.33 0.32 1.81 0.75 0.19 Major Importers 4/ 1.40 14.29 4.48 18.71 0.20 1.27 China 1.02 12.34 1.35 13.66 0.09 0.96 India 0.25 1.54 1.83 3.40 0.00 0.22 North Africa 5/ 0.14 0.42 1.30 1.65 0.11 0.10
2014/15 Proj. Beginning
Stocks Production Imports Domestic Total
Exports Ending Stocks
World 2/ Nov 3.00 46.95 9.15 46.48 9.52 3.10
Dec 3.05 46.99 9.22 46.53 9.53 3.21United States Nov 0.53 9.33 0.07 8.37 0.95 0.61
Dec 0.53 9.38 0.07 8.37 0.95 0.66Total Foreign Nov 2.47 37.62 9.08 38.11 8.57 2.49
Dec 2.52 37.61 9.15 38.16 8.57 2.55 Major Exporters 3/ Nov 0.67 16.80 0.30 10.69 6.42 0.67
Dec 0.73 16.80 0.30 10.69 6.42 0.72 Argentina Nov 0.25 7.26 0.00 2.94 4.35 0.22
Dec 0.25 7.26 0.00 2.94 4.35 0.22 Brazil Nov 0.24 7.22 0.00 5.94 1.27 0.24
Dec 0.29 7.22 0.00 5.94 1.27 0.30 European Union Nov 0.19 2.33 0.30 1.81 0.80 0.20
Dec 0.19 2.33 0.30 1.81 0.80 0.20 Major Importers 4/ Nov 1.27 15.41 4.32 19.59 0.18 1.23
Dec 1.27 15.39 4.39 19.64 0.18 1.23 China Nov 0.96 13.34 1.10 14.36 0.08 0.96
Dec 0.96 13.34 1.10 14.36 0.08 0.96 India Nov 0.22 1.61 1.85 3.50 0.00 0.18
Dec 0.22 1.59 1.93 3.55 0.00 0.18 North Africa 5/ Nov 0.10 0.46 1.37 1.73 0.10 0.09
Dec 0.10 0.46 1.37 1.73 0.10 0.09
1/ Data based on local marketing years except for Argentina and Brazil which are adjusted to an October-September year. 2/ World imports and exports may not balance due to differences in local marketing years and to time lags between reported exports and imports. Therefore, world supply may not equal world use. 3/ Argentina, Brazil and European Union. 4/ China, India, and North Africa. 5/ Algeria, Egypt, Morocco, and Tunisia.
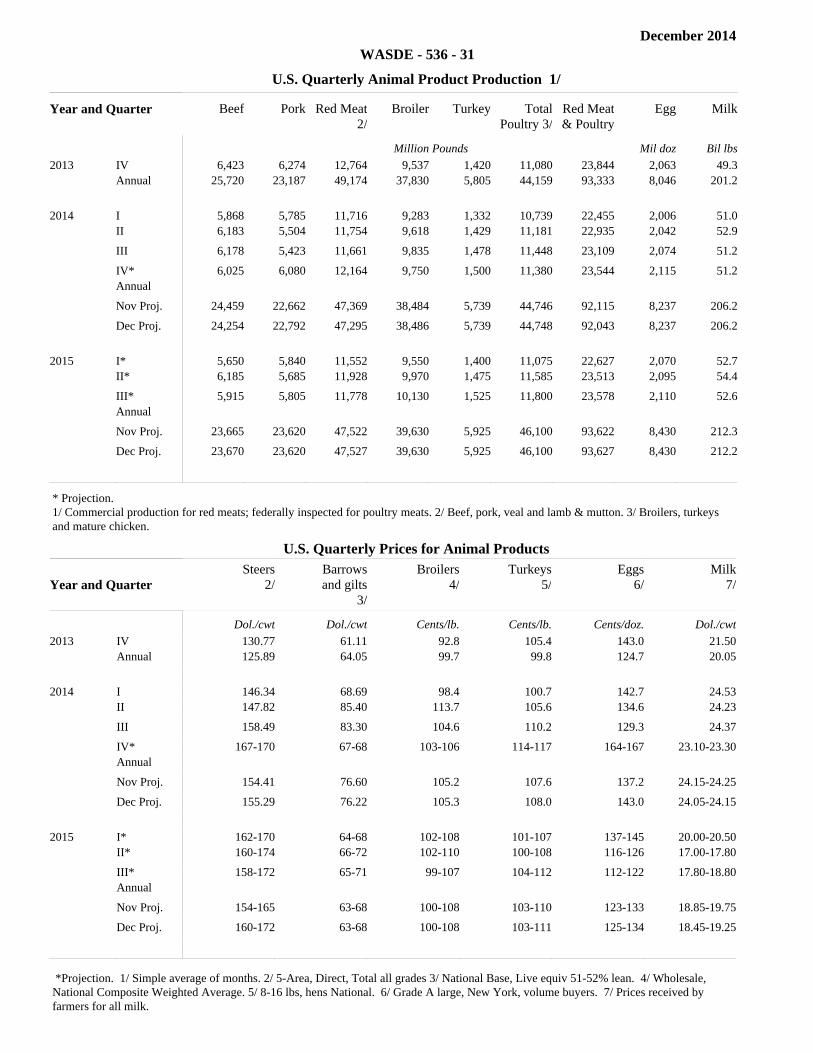
December 2014
WASDE - 536 - 31
U.S. Quarterly Animal Product Production 1/
Year and Quarter Beef Pork Red Meat2/
Broiler Turkey TotalPoultry 3/
Red Meat& Poultry
Egg Milk
Million Pounds Mil doz Bil lbs
2013 IV 6,423 6,274 12,764 9,537 1,420 11,080 23,844 2,063 49.3
Annual 25,720 23,187 49,174 37,830 5,805 44,159 93,333 8,046 201.2
2014 I 5,868 5,785 11,716 9,283 1,332 10,739 22,455 2,006 51.0
II 6,183 5,504 11,754 9,618 1,429 11,181 22,935 2,042 52.9
III 6,178 5,423 11,661 9,835 1,478 11,448 23,109 2,074 51.2
IV* 6,025 6,080 12,164 9,750 1,500 11,380 23,544 2,115 51.2Annual
Nov Proj. 24,459 22,662 47,369 38,484 5,739 44,746 92,115 8,237 206.2
Dec Proj. 24,254 22,792 47,295 38,486 5,739 44,748 92,043 8,237 206.2
2015 I* 5,650 5,840 11,552 9,550 1,400 11,075 22,627 2,070 52.7
II* 6,185 5,685 11,928 9,970 1,475 11,585 23,513 2,095 54.4
III* 5,915 5,805 11,778 10,130 1,525 11,800 23,578 2,110 52.6Annual
Nov Proj. 23,665 23,620 47,522 39,630 5,925 46,100 93,622 8,430 212.3
Dec Proj. 23,670 23,620 47,527 39,630 5,925 46,100 93,627 8,430 212.2
* Projection. 1/ Commercial production for red meats; federally inspected for poultry meats. 2/ Beef, pork, veal and lamb & mutton. 3/ Broilers, turkeys and mature chicken.
U.S. Quarterly Prices for Animal Products
Year and Quarter Steers
2/Barrowsand gilts
3/
Broilers4/
Turkeys5/
Eggs6/
Milk7/
Dol./cwt Dol./cwt Cents/lb. Cents/lb. Cents/doz. Dol./cwt
2013 IV 130.77 61.11 92.8 105.4 143.0 21.50
Annual 125.89 64.05 99.7 99.8 124.7 20.05
2014 I 146.34 68.69 98.4 100.7 142.7 24.53
II 147.82 85.40 113.7 105.6 134.6 24.23
III 158.49 83.30 104.6 110.2 129.3 24.37
IV* 167-170 67-68 103-106 114-117 164-167 23.10-23.30Annual
Nov Proj. 154.41 76.60 105.2 107.6 137.2 24.15-24.25
Dec Proj. 155.29 76.22 105.3 108.0 143.0 24.05-24.15
2015 I* 162-170 64-68 102-108 101-107 137-145 20.00-20.50
II* 160-174 66-72 102-110 100-108 116-126 17.00-17.80
III* 158-172 65-71 99-107 104-112 112-122 17.80-18.80Annual
Nov Proj. 154-165 63-68 100-108 103-110 123-133 18.85-19.75
Dec Proj. 160-172 63-68 100-108 103-111 125-134 18.45-19.25
*Projection. 1/ Simple average of months. 2/ 5-Area, Direct, Total all grades 3/ National Base, Live equiv 51-52% lean. 4/ Wholesale, National Composite Weighted Average. 5/ 8-16 lbs, hens National. 6/ Grade A large, New York, volume buyers. 7/ Prices received by farmers for all milk.

December 2014
WASDE - 536 - 32
U.S. Meats Supply and Use
Item Beginningstocks
Production1/ Imports
TotalSupply Exports
EndingStocks
TotalUse
Per Capita2/ 3/
Million Pounds /4 Beef 2013 608 25,791 2,250 28,649 2,590 584 25,475 56.3
2014 Proj. Nov 584 24,530 2,823 27,937 2,599 495 24,843 54.6Dec 584 24,325 2,848 27,757 2,599 495 24,663 54.2
2015 Proj. Nov 495 23,736 2,700 26,931 2,525 485 23,921 52.2Dec 495 23,741 2,700 26,936 2,525 485 23,926 52.2
Filler Filler Filler Filler Filler Filler Filler Filler
Pork 2013 625 23,200 880 24,705 4,992 618 19,095 46.8
2014 Proj. Nov 618 22,676 973 24,266 5,066 580 18,620 45.3Dec 618 22,806 1,008 24,431 4,966 570 18,895 46.0
2015 Proj. Nov 580 23,633 900 25,113 5,250 605 19,258 46.6Dec 570 23,633 910 25,113 5,250 605 19,258 46.6
Filler Filler Filler Filler Filler Filler Filler Filler
Total Red Meat 5/
2013 1,260 49,270 3,302 53,832 7,589 1,230 45,013 104.4
2014 Proj. Nov 1,230 47,464 3,977 52,670 7,673 1,118 43,879 101.0Dec 1,230 47,390 4,037 52,656 7,573 1,108 43,975 101.3
2015 Proj. Nov 1,118 47,617 3,766 52,501 7,784 1,133 43,584 99.8Dec 1,108 47,622 3,776 52,506 7,784 1,133 43,589 99.8
Filler Filler Filler Filler Filler Filler Filler Filler
Broiler 2013 651 37,425 122 38,199 7,345 669 30,184 81.9
2014 Proj. Nov 669 38,072 118 38,859 7,319 610 30,930 83.4Dec 669 38,074 114 38,857 7,319 610 30,928 83.4
2015 Proj. Nov 610 39,206 116 39,932 7,400 645 31,887 85.3Dec 610 39,206 116 39,932 7,400 645 31,887 85.3
Filler Filler Filler Filler Filler Filler Filler Filler
Turkey 2013 296 5,729 22 6,047 759 237 5,051 16.0
2014 Proj. Nov 237 5,739 29 6,005 799 215 4,991 15.7Dec 237 5,739 29 6,005 799 215 4,991 15.7
2015 Proj. Nov 215 5,925 28 6,168 820 275 5,073 15.8Dec 215 5,925 28 6,168 820 275 5,073 15.8
Filler Filler Filler Filler Filler Filler Filler Filler
Total Poultry 6/
2013 949 43,677 146 44,772 8,213 912 35,647 99.2
2014 Proj. Nov 912 44,334 149 45,394 8,224 830 36,340 100.3Dec 912 44,336 146 45,393 8,224 830 36,339 100.3
2015 Proj. Nov 830 45,675 146 46,651 8,345 925 37,381 102.4Dec 830 45,675 146 46,651 8,345 925 37,381 102.4
Filler Filler Filler Filler Filler Filler Filler Filler
Red Meat & Poultry
2013 2,208 92,947 3,449 98,604 15,802 2,142 80,660 203.6
2014 Proj. Nov 2,142 91,797 4,125 98,064 15,897 1,948 80,219 201.4Dec 2,142 91,725 4,182 98,049 15,797 1,938 80,314 201.7
2015 Proj. Nov 1,948 93,292 3,912 99,152 16,129 2,058 80,965 202.2Dec 1,938 93,297 3,922 99,157 16,129 2,058 80,970 202.3
1/ Total including farm production for red meats and, for poultry, federally inspected plus non-federally inspected, less condemnations. 2/ Pounds, retail-weight basis for red meat and broilers; certified ready-to-cook weight for turkey. 3/ Population source: Dept. of Commerce, Census Bureau. 4/ Carcass weight for red meats and certified ready-to-cook weight for poultry. 5/ Beef, pork, veal, lamb and mutton. 6/ Broilers, turkeys and mature chicken.

December 2014
WASDE - 536 - 33
U.S. Egg Supply and Use
Commodity 2012 2013 2014 Proj. 2014 Proj. 2015 Proj. 2015 Proj.
Nov Dec Nov Dec
Eggs Million Dozen Supply Beginning Stocks 27.7 20.8 23.0 23.0 23.0 23.0 Production 7,876.5 8,046.2 8,237.0 8,237.0 8,430.0 8,430.0 Imports 18.5 16.9 33.2 35.2 40.0 40.0 Total Supply 7,922.7 8,083.9 8,293.2 8,295.2 8,493.0 8,493.0 Use Exports 301.7 371.9 361.6 371.6 355.0 375.0 Hatching Use 940.8 959.9 975.2 975.2 1,000.0 1,000.0 Ending Stocks 20.8 23.0 23.0 23.0 23.0 23.0 Disappearance Total 6,659.4 6,729.1 6,933.4 6,925.4 7,115.0 7,095.0 Per Capita (number) 254.3 255.2 261.0 260.7 265.9 265.2Total
U.S. Milk Supply and Use
Commodity 2012 2013 2014 Proj. 2014 Proj. 2015 Proj. 2015 Proj.
Nov Dec Nov Dec
Milk Billion Pounds Production 200.6 201.2 206.2 206.2 212.3 212.2 Farm Use 1.0 1.0 1.0 1.0 1.0 1.0
Fat Basis Supply Beg. Commercial Stocks 10.9 12.2 11.2 11.2 10.5 11.1Marketings 199.7 200.2 205.2 205.2 211.3 211.3Imports 4.1 3.7 4.2 4.1 3.8 3.8 Total Cml. Supply 214.7 216.2 220.6 220.5 225.7 226.2
Fat Basis Use Commercial Exports 8.8 12.4 12.3 12.3 11.0 11.0Ending Commercial Stocks 12.2 11.2 10.5 11.1 12.1 12.2CCC Donations 0.0 0.0 0.0 0.0 0.0 0.0Domestic Commercial Use 193.7 192.6 197.8 197.1 202.6 203.0
Skim-solid Basis Supply Beg. Commercial Stocks 11.8 12.4 11.6 11.6 12.0 11.9Marketings 199.7 200.2 205.2 205.2 211.3 211.3Imports 5.7 5.3 5.8 5.8 5.4 5.4 Total Cml. Supply 217.2 217.9 222.6 222.7 228.8 228.6
Skim-solid Basis Use Commercial Exports 33.3 38.5 38.3 38.7 37.4 37.4Ending Commercial Stocks 12.4 11.6 12.0 11.9 12.8 12.6CCC Donations 0.0 0.0 0.0 0.0 0.0 0.0Domestic Commercial Use 171.5 167.7 172.3 172.1 178.6 178.6
Total
Note: Totals may not add due to rounding.

December 2014
WASDE - 536 - 34
U.S. Dairy Prices
Commodity 2012 2013 2014 Proj. 2014 Proj. 2015 Proj. 2015 Proj.
Nov Dec Nov Dec
Product Prices 1/ Dollars Per Pound Cheese 1.7076 1.7683 2.170-
2.1802.150-2.160
1.690-1.780
1.625-1.705
Butter 1.5943 1.5451 2.120-2.150
2.125-2.155
1.660-1.780
1.665-1.775
Nonfat Dry Milk 1.3279 1.7066 1.770-1.790
1.760-1.780
1.410-1.480
1.340-1.400
Dry Whey 0.5935 0.5902 0.650-0.660
0.650-0.660
0.560-0.590
0.560-0.590
Filler Dollars Per Cwt
Milk Prices 2/ Class III 17.44 17.99 22.50-
22.6022.30-22.40
17.15-18.05
16.55-17.35
Class IV 16.01 19.05 22.05-22.25
22.05-22.25
17.05-18.05
16.45-17.35
All Milk 3/ 18.52 20.05 24.15-24.25
24.05-24.15
18.85-19.75
18.45-19.25
1/ Simple average of monthly prices calculated by AMS from weekly average dairy product prices for class price computations. 2/ Annual Class III and Class IV prices are the simple averages of monthly minimum Federal order milk prices paid by regulated plants for milk used in the respective classes. All milk price is the simple average of monthly prices received by farmers for milk at average test. 3/ Does not reflect any deductions from producers as authorized by legislation.

December 2014WASDE - 536 - 35
Note: Tables on pages 35-37 present a record of the December projection and the final Estimate. Using world wheat production as an example, the "root mean square error" means that chances are 2 out of 3 that the current forecast will not be above or below the final estimate by more than 0.8 percent. Chances are 9 out of 10 (90% confidence level) that the difference will not exceed 1.4 percent. The average difference between the December projection and the final estimate is 4.0 million tons, ranging from 0.4 million to 10.2 million tons. The December projection has been below the estimate 24 times and above 9 times.
Reliability of December Projections 1/
Differences between forecast and final estimate 90 percent Years
Commodity and Region
Root mean square error
confidenceinterval Average Smallest Largest
BelowFinal
AboveFinal
WHEAT
Percent
Million Metric Tons
Production
World
0.8
1.4
4.0 0.4 10.2 24 9
U.S.
0.4
0.7
0.2 0.0 1.2 15 12
Foreign
1.0
1.6
4.0 0.4 10.3 24 9
Exports
World
5.4
9.1
5.3 0.1 18.3 27 6
U.S.
5.7
9.6
1.5 0.2 3.9 19 14
Foreign
6.6
11.3
5.2 0.5 17.9 29 4
Domestic Use
World
1.3
2.2
5.7 0.2 16.7 20 13
U.S.
5.9
10.0
1.5 0.1 3.6 10 23
Foreign
1.3
2.3
5.7 0.1 16.1 23 10
Ending Stocks
World
5.6
9.6
6.4 0.9 19.4 23 10
U.S.
10.8
18.3
1.7 0.1 7.0 21 12
Foreign
5.8
9.9
5.4 0.4 19.3 22 11
COARSE GRAINS 2/
Production
World
1.3
2.3
10.3 0.0 24.2 24 9
U.S.
1.4
2.3
2.4 0.0 7.5 18 15
Foreign
1.9
3.2
10.3 0.3 26.5 23 10
Exports
World
6.2
10.6
5.5 0.1 20.8 24 9
U.S.
15.9
27.0
5.4 0.1 12.8 13 20
Foreign
11.7
19.9
5.8 0.0 22.4 21 11
Domestic Use
World
1.2
2.1
8.7 0.3 22.8 19 14
U.S.
3.8
6.4
5.2 0.1 17.9 17 16
Foreign
1.4
2.3
7.9 0.3 22.7 21 12
Ending Stocks
World
10.1
17.2
12.6 1.0 30.3 27 6
U.S.
20.0
33.9
7.7 0.7 23.9 19 14
Foreign
13.3
22.6
10.5 0.4 31.8 26 7
RICE, milled
Production
World
2.0
3.5
5.7 0.0 16.2 26 7
U.S.
3.0
5.0
0.1 0.0 0.5 17 13
Foreign
2.1
3.5
5.7 0.1 16.2 27 6
Exports
World
9.6
16.3
1.7 0.1 6.1 26 7
U.S.
7.7
13.1
0.2 0.0 0.6 17 14
Foreign
10.8
18.4
1.6 0.0 6.0 24 9
Domestic Use
World
1.6
2.7
3.6 0.0 15.9 24 9
U.S.
7.5
12.8
0.2 0.0 0.6 17 16
Foreign
1.6
2.7
3.6 0.0 16.1 24 9
Ending Stocks
World
10.2
17.3
4.2 0.1 14.8 26 7
U.S.
21.8
37.0
0.2 0.0 0.8 18 15
Foreign
10.5
17.8
4.3 0.2 14.2 26 7
1/ Footnotes at end of table. CONTINUED
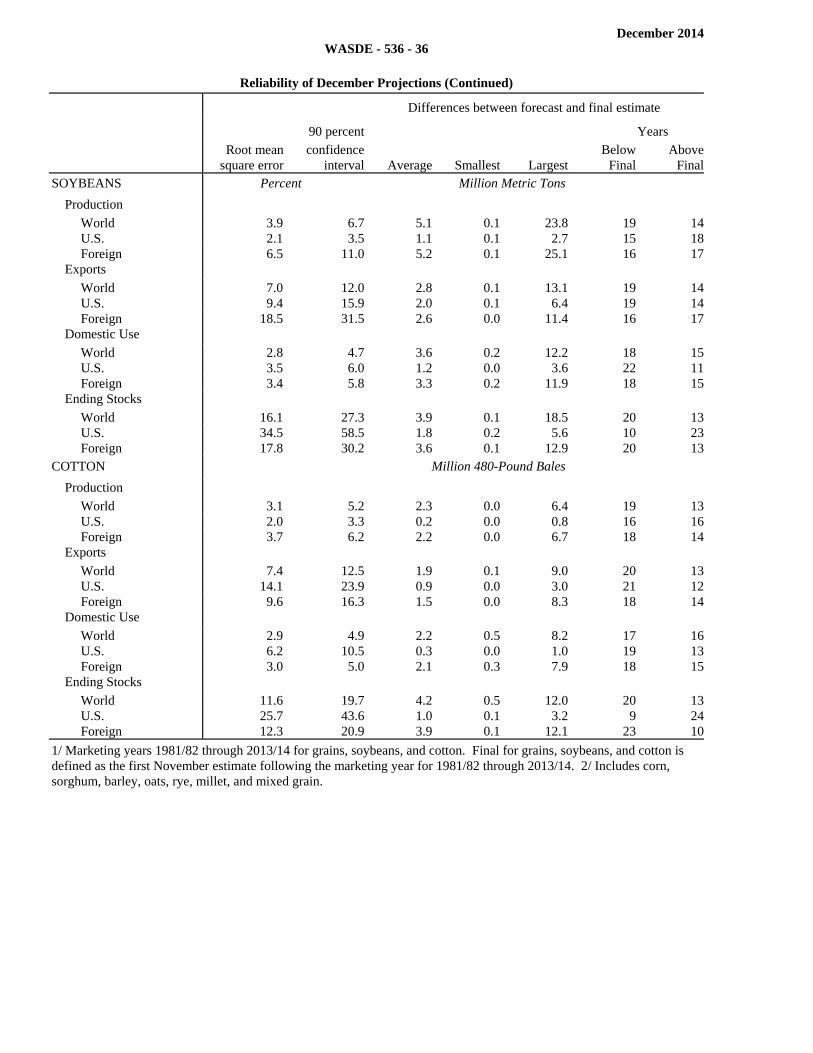
December 2014WASDE - 536 - 36
Reliability of December Projections (Continued)
Differences between forecast and final estimate
90 percent Years
Commodity and Region
Root mean square error
confidenceinterval Average Smallest Largest
BelowFinal
AboveFinal
SOYBEANS Percent Million Metric Tons Production
World 3.9 6.7 5.1 0.1 23.8 19 14U.S. 2.1 3.5 1.1 0.1 2.7 15 18Foreign 6.5 11.0 5.2 0.1 25.1 16 17
Exports World 7.0 12.0 2.8 0.1 13.1 19 14U.S. 9.4 15.9 2.0 0.1 6.4 19 14Foreign 18.5 31.5 2.6 0.0 11.4 16 17
Domestic Use World 2.8 4.7 3.6 0.2 12.2 18 15U.S. 3.5 6.0 1.2 0.0 3.6 22 11Foreign 3.4 5.8 3.3 0.2 11.9 18 15
Ending Stocks World 16.1 27.3 3.9 0.1 18.5 20 13U.S. 34.5 58.5 1.8 0.2 5.6 10 23Foreign 17.8 30.2 3.6 0.1 12.9 20 13
COTTON Million 480-Pound Bales Production
World 3.1 5.2 2.3 0.0 6.4 19 13U.S. 2.0 3.3 0.2 0.0 0.8 16 16Foreign 3.7 6.2 2.2 0.0 6.7 18 14
Exports World 7.4 12.5 1.9 0.1 9.0 20 13U.S. 14.1 23.9 0.9 0.0 3.0 21 12Foreign 9.6 16.3 1.5 0.0 8.3 18 14
Domestic Use World 2.9 4.9 2.2 0.5 8.2 17 16U.S. 6.2 10.5 0.3 0.0 1.0 19 13Foreign 3.0 5.0 2.1 0.3 7.9 18 15
Ending Stocks World 11.6 19.7 4.2 0.5 12.0 20 13U.S. 25.7 43.6 1.0 0.1 3.2 9 24Foreign 12.3 20.9 3.9 0.1 12.1 23 10
1/ Marketing years 1981/82 through 2013/14 for grains, soybeans, and cotton. Final for grains, soybeans, and cotton is defined as the first November estimate following the marketing year for 1981/82 through 2013/14. 2/ Includes corn, sorghum, barley, oats, rye, millet, and mixed grain.
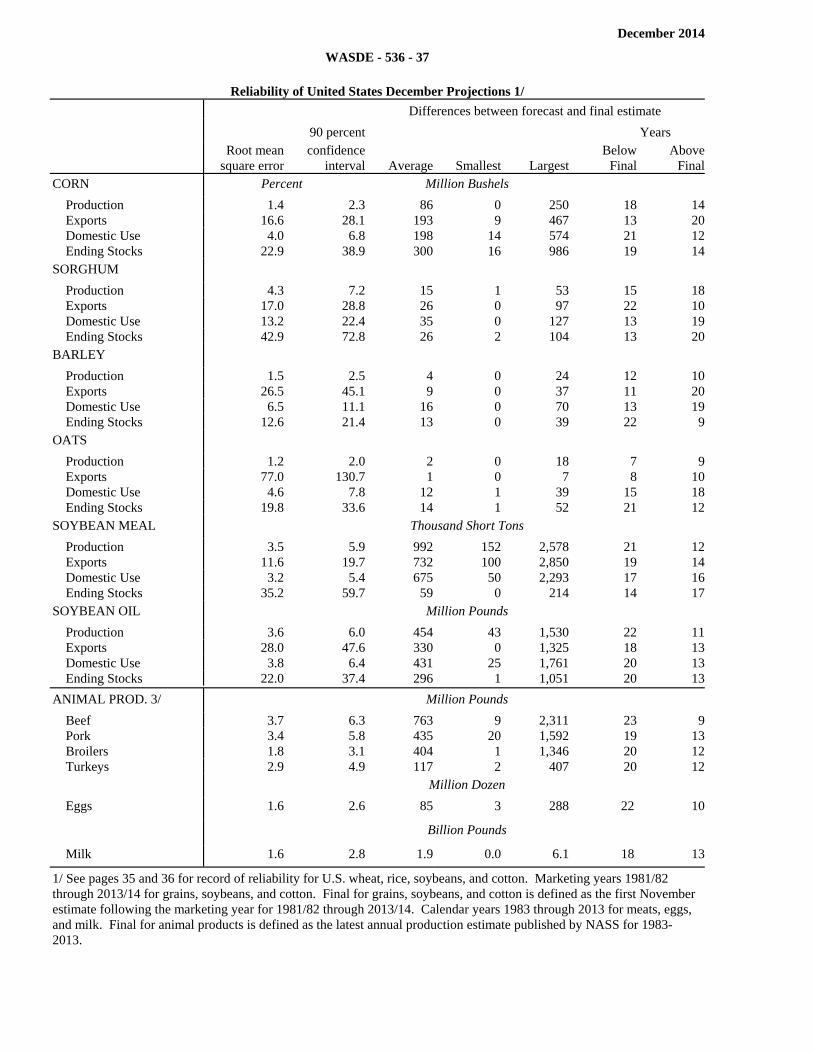
December 2014
WASDE - 536 - 37
Reliability of United States December Projections 1/
Differences between forecast and final estimate
90 percent Years
Root mean square error
confidenceinterval Average Smallest Largest
BelowFinal
AboveFinal
CORN Percent Million Bushels Production 1.4 2.3 86 0 250 18 14Exports 16.6 28.1 193 9 467 13 20Domestic Use 4.0 6.8 198 14 574 21 12Ending Stocks 22.9 38.9 300 16 986 19 14
SORGHUM Production 4.3 7.2 15 1 53 15 18Exports 17.0 28.8 26 0 97 22 10Domestic Use 13.2 22.4 35 0 127 13 19Ending Stocks 42.9 72.8 26 2 104 13 20
BARLEY Production 1.5 2.5 4 0 24 12 10Exports 26.5 45.1 9 0 37 11 20Domestic Use 6.5 11.1 16 0 70 13 19Ending Stocks 12.6 21.4 13 0 39 22 9
OATS Production 1.2 2.0 2 0 18 7 9Exports 77.0 130.7 1 0 7 8 10Domestic Use 4.6 7.8 12 1 39 15 18Ending Stocks 19.8 33.6 14 1 52 21 12
SOYBEAN MEAL Thousand Short Tons Production 3.5 5.9 992 152 2,578 21 12Exports 11.6 19.7 732 100 2,850 19 14Domestic Use 3.2 5.4 675 50 2,293 17 16Ending Stocks 35.2 59.7 59 0 214 14 17
SOYBEAN OIL Million Pounds Production 3.6 6.0 454 43 1,530 22 11Exports 28.0 47.6 330 0 1,325 18 13Domestic Use 3.8 6.4 431 25 1,761 20 13Ending Stocks 22.0 37.4 296 1 1,051 20 13
ANIMAL PROD. 3/ Million Pounds Beef 3.7 6.3 763 9 2,311 23 9Pork 3.4 5.8 435 20 1,592 19 13Broilers 1.8 3.1 404 1 1,346 20 12Turkeys 2.9 4.9 117 2 407 20 12
Million Dozen Eggs 1.6 2.6 85 3 288 22 10
Billion Pounds Milk 1.6 2.8 1.9 0.0 6.1 18 13
1/ See pages 35 and 36 for record of reliability for U.S. wheat, rice, soybeans, and cotton. Marketing years 1981/82 through 2013/14 for grains, soybeans, and cotton. Final for grains, soybeans, and cotton is defined as the first November estimate following the marketing year for 1981/82 through 2013/14. Calendar years 1983 through 2013 for meats, eggs, and milk. Final for animal products is defined as the latest annual production estimate published by NASS for 1983-2013.

WASDE-536-38
Related USDA Reports
The WASDE report incorporates information from a number of statistical reports published by USDA and
other government agencies. In turn, the WASDE report provides a framework for more detailed reports
issued by USDA’s Economic Research Service and Foreign Agricultural Service. For more information on
how the WASDE report is prepared, go to: http://www.usda.gov/oce/commodity/wasde.
Supply and Demand Database
The Foreign Agricultural Service publishes Production, Supply, and Demand Online, a comprehensive
database of supply and demand balances by commodity for 190 countries and regions at
http://www.fas.usda.gov/psd/online. Data for grains, oilseeds, and cotton are updated monthly and data for
other commodities are updated less frequently.
Foreign Production Assessments
Preliminary foreign production assessments and satellite imagery analysis used to prepare the WASDE
report are provided by the International Production Assessment Division (IPAD) of the Foreign Agricultural
Service located at www.pecad.fas.usda.gov/.
Metric Conversion Factors
1 Hectare = 2.4710 Acres
1 Kilogram = 2.20462 Pounds
Metric-Ton Equivalent = Domestic Unit Factor
Wheat & Soybeans
Rice
Corn, Sorghum, & Rye
Barley
Oats
Sugar
Cotton
bushels
cwt
bushels
bushels
bushels
short tons
480-lb bales
.027216
.045359
.025401
.021772
.014515
.907185
.217720


UNITED STATES DEPARTMENT OF AGRICULTURE WORLD AGRICULTURAL OUTLOOK BOARD WASHINGTON, D.C. 20250-3812 ___________________ OFFICIAL BUSINESS Penalty for Private Use, $300
FIRST-CLASS MAIL POSTAGE & FEES PAID
USDA PERMIT NO. G-289
World Agricultural Supply and Demand Estimates
WASDE-536 – December 10, 2014
Electronic Subscriptions: Download the WASDE report at http://usda.mannlib.cornell.edu/.
Get a free e-mail subscription to the WASDE and other USDA crop reports at
http://usda.mannlib.cornell.edu. Select the “Reports by E-Mail” bar to sign up.
Print Subscriptions: For print subscriptions, call the National Technical Information Service
(NTIS) at 1-800-999-6779 or 703-605-6220.
The U.S. Department of Agriculture (USDA) prohibits discrimination in all its programs and
activities on the basis of race, color, national origin, gender, religion, age, disability, political
beliefs, sexual orientation, and marital or family status. (Not all prohibited bases apply to all
programs.) Persons with disabilities who require alternative means for communication of program
information (Braille, large print, audiotape, etc.) should contact USDA’s TARGET Center at 202-
720-2600 (voice and TDD).
To file a complaint of discrimination, write USDA, Director, Office of Civil Rights, Room 326-W,
Whitten Building, 1400 Independence Avenue, SW, Washington, D.C. 20250-9410 or call (202)
720-5964 (voice or TDD). USDA is an equal opportunity provider and employer.
Related Documents