This version: September 13, 2013 Why Do Banks Use Financial Derivatives? * Shaofang Li** University of Ljubljana and Matej Marinč*** University of Ljubljana and University of Amsterdam Abstract In this paper we examine the impact of financial derivatives on systematic risk of publicly listed U.S. bank holding companies’ (BHCs) from 1997 to 2011. The empirical results provide evidence that the use of financial derivatives has significant effects on the BHCs’ systematic risk exposures. Our findings suggest that the more use of interest rate derivatives and credit derivatives corresponds to greater systematic interest rate risk and systematic credit risk, whereas the increased use of exchange rate derivatives is associated with lower systematic exchange rate risk. We also confirm that the use of financial derivatives for hedging purposes is negatively related to systematic risks of BHCs. During the global financial crisis, the relationship between interest rate derivatives and exchange rate derivatives and systematic risks became stronger than in normal time, and the positive relationship between credit derivatives and systematic credit risk became less pronounced. Keywords: Financial Derivatives, Interest Rate Derivatives, Exchange Rate Derivatives, Credit Derivatives, Systematic Risk JEL codes: G20, G21, G28 ____________________________ * The authors would like to thank Iftekhar Hasan, Joon Ho Hwang, Marko Kosak, Igor Loncarski, Nadia Massoud, Min-Teh Yu, the participants at the Midwest Finance Association Conference 2013 in Chicago and the participants at the 9 th Conference of Asia-Pacific Association of Derivatives (APDA2013) in Busan for their valuable comments and suggestions. All errors remain our own. ** Faculty of Economics, University of Ljubljana, Kardeljeva ploščad 17, 1000 Ljubljana, Slovenia, Email: [email protected]. *** Faculty of Economics, University of Ljubljana, Kardeljeva ploščad 17, 1000 Ljubljana, Slovenia, Email: [email protected], and Amsterdam Center for Law & Economics (ACLE), Faculty of Economics and Business, University of Amsterdam, Roetersstraat 11, 1018WB Amsterdam, The Netherlands, Email: [email protected].

Welcome message from author
This document is posted to help you gain knowledge. Please leave a comment to let me know what you think about it! Share it to your friends and learn new things together.
Transcript
This version: September 13, 2013
Why Do Banks Use Financial Derivatives?*
Shaofang Li**
University of Ljubljana
and
Matej Marinč***
University of Ljubljana and University of Amsterdam
Abstract
In this paper we examine the impact of financial derivatives on systematic risk of publicly listed U.S. bank
holding companies’ (BHCs) from 1997 to 2011. The empirical results provide evidence that the use of
financial derivatives has significant effects on the BHCs’ systematic risk exposures. Our findings suggest
that the more use of interest rate derivatives and credit derivatives corresponds to greater systematic interest
rate risk and systematic credit risk, whereas the increased use of exchange rate derivatives is associated with
lower systematic exchange rate risk. We also confirm that the use of financial derivatives for hedging
purposes is negatively related to systematic risks of BHCs. During the global financial crisis, the relationship
between interest rate derivatives and exchange rate derivatives and systematic risks became stronger than in
normal time, and the positive relationship between credit derivatives and systematic credit risk became less
pronounced.
Keywords: Financial Derivatives, Interest Rate Derivatives, Exchange Rate Derivatives, Credit Derivatives,
Systematic Risk
JEL codes: G20, G21, G28
____________________________
* The authors would like to thank Iftekhar Hasan, Joon Ho Hwang, Marko Kosak, Igor Loncarski, Nadia Massoud, Min-Teh Yu, the participants at
the Midwest Finance Association Conference 2013 in Chicago and the participants at the 9th Conference of Asia-Pacific Association of Derivatives
(APDA2013) in Busan for their valuable comments and suggestions. All errors remain our own.
** Faculty of Economics, University of Ljubljana, Kardeljeva ploščad 17, 1000 Ljubljana, Slovenia, Email: [email protected].
*** Faculty of Economics, University of Ljubljana, Kardeljeva ploščad 17, 1000 Ljubljana, Slovenia, Email: [email protected], and
Amsterdam Center for Law & Economics (ACLE), Faculty of Economics and Business, University of Amsterdam, Roetersstraat 11, 1018WB
Amsterdam, The Netherlands, Email: [email protected].
Why Do Banks Use Financial Derivatives?
Abstract
In this paper we examine the impact of financial derivatives on risk sensitivities of publicly listed U.S. bank
holding companies’ (BHCs) from 1997 to 2011. The empirical results provide evidence that the use of
financial derivatives has significant effects on the BHCs’ systematic risk exposures. Our findings suggest
that the more use of interest rate derivatives and credit derivatives corresponds to greater systematic interest
rate risk exposure and systematic credit risk exposure, while the increased use of exchange rate derivatives is
associated with lower systematic exchange rate risk exposure. We also confirm that the use of financial
derivatives for hedging purposes is negatively related to risk sensitivities of BHCs. During the global
financial crisis, the relationship between interest rate derivatives and exchange rate derivatives and
systematic risk exposures became stronger than in normal time, and the positive relationship between credit
derivatives and systematic credit risk exposure became less pronounced.
Keywords: Financial Derivatives, Interest Rate Derivatives, Exchange Rate Derivatives, Credit Derivatives,
Risk Exposures
JEL codes: G20, G21, G28
1
1. Introduction
Banks have drastically increased the use of financial derivatives in the last decades: the notional principal
amount of financial derivatives held by the U.S. bank holding companies (BHCs) rose from $7.34 trillion at
the end of 1990, to $231 trillion at the end of 2011. An increased activity in financial derivatives markets was
generally looked upon favorably before the global financial crisis 2007-2010. Greenspan (1999) noted that
“the value added of derivatives themselves derives from their ability to enhance the process of wealth
creation.” Trichet (2007) further explained that “price discovery in the credit derivatives market reduces the
risk of mispricing loans.” Recently, however, the perspective has turned around as the risks of financial
derivatives have become more evident. The Financial Stability Board (2010) concluded that “the crisis
demonstrated the potential for contagion arising from the interconnectedness of OTC derivatives market
participants and the limited transparency of counterparty relationships.” The unanswered question then is
whether banks use financial derivatives to hedge risk or rather to increase their risk exposures.
In this article we analyze why BHCs use financial derivatives and, more specifically, whether financial
derivatives expose BHCs further towards risks. We are interested in whether BHCs employ financial
derivatives for hedging or for speculative purposes. In particular, we measure whether the use of financial
derivatives is related to the risk exposures of BHCs towards systematic interest rate risk, exchange rate risk
and credit risk.
We collect on-balance-sheet, off-balance-sheet financial data and stock price on the publicly traded U.S.
BHCs from 1997 to 2011. The financial derivatives activity in the U.S. financial market is dominated by a
small group of large financial institutions (i.e., the top 25 BHCs hold 99.8% of the financial derivatives
(Office of the Comptroller of the Currency, 2011). Hence, we split our sample BHCs into large and small
BHCs (more vs. less than $50 million dollars). Figure 1 and Figure 2 depict the notional principal amounts of
interest rate, exchange rate and credit derivatives held by large BHCs and small BHCs in our sample.
<Insert Figure 1 and Figure 2 here>
Our analysis shows that a BHC’s use of financial derivatives is associated with its higher exposure towards
interest rate risk and credit risk and lower exposure toward exchange rate risk. Interestingly, the positive
relationship between financial derivatives and systematic risk exposure is more pronounced for large BHCs
than it is for small BHCs. These results may indicate that large BHCs with their main operations such as
prime brokerage, asset management, proprietary trading and market making primarily use financial
derivatives to derive trading related gains and that these activities (and the related involvement in derivatives)
expose them further towards systematic risk. In comparison, the results may indicate that small BHCs (with
2
main operations in deposit taking and commercial lending) to a larger extent employ financial derivatives to
hedge against systematic risk.
To further analyze what impact financial derivatives have on systematic risk exposures, we decompose
financial derivatives according to their reported purposes. Since March 1995, BHCs are required to report
whether their financial derivatives activity is for trading purposes or for purposes other than trading
(henceforth, for hedging).1 In Figure 3 and Figure 4, we report the use of financial derivatives according to
their reported purposes in the subsamples of large BHCs and small BHCs.
<Insert Figure 3 and Figure 4 here>
Our findings show that financial derivatives held for hedging are negatively and significantly related to
BHCs’ systematic risk exposures. The above result suggests not only that the use of financial derivatives is
aligned with the reported (hedging vs. trading) purposes but also that financial derivatives for hedging are
generally used to lower systematic risk exposures; that is, nondiversifiable risk exposures that investors
cannot trade away on the stock markets.
However, when splitting BHCs into large and small BHCs, this observation becomes slightly more nuanced.
That is, the reported purpose of financial derivatives is aligned with their impact on risks especially for large
BHCs but not for small BHCs. In particular, the use of financial derivatives for hedging is either statistically
insignificantly or even positively related to risks (in the case of exchange rate derivatives for small BHCs).
Hence, the reported purpose of financial derivatives seems to match their true purposes for large BHCs but
not necessarily for small BHCs.
Many recent regulatory attempts aim at separating commercial banking from more riskily banking activities
such as engagement in proprietary trading (see the Volker rule under Dodd–Frank Wall Street Reform and
Consumer Protection Act and Independent Commission on Banking (2011)).2 In this light, regulators aim at
separating financial derivatives that are used for hedging from the ones generated in proprietary trading
business. The problem that may occur is that it is difficult to determine when financial derivatives are used
for trading purposes and when for hedging purposes. Prohibiting financial derivatives for trading purposes
may hence give a false sense of safety because the risks may pile in financial derivatives with a declared
purpose of hedging. Our analysis shows that this already happens in the case of small BHCs. That is, for
1 Bank regulatory reports contain information on financial derivatives (interest rate, foreign exchange, commodity and equity
derivatives) held for trading purposes and for purposes other than trading, but do not break credit derivatives in this way. In our
analysis, we use notional principal amounts on credit derivatives contracts for which the bank is “beneficiary” (credit protection
bought) and for which the bank is “guarantor” (credit protection sold) as the variables to evaluate the use of credit derivatives. 2 This is understandable in light of huge bank losses in the global financial crisis. During the 2007-2010 financial crisis, large U.S.
and European banks lost more than $1 trillion on toxic assets and from bad loans from January 2007 to September 2009 (IMF,
2009).
3
small BHCs, engagement into financial derivatives for hedging is associated with higher exposures towards
exchange rate risk and credit risk.
We also analyze the impact of the global financial crisis on the use of financial derivatives. In the global
financial crisis, the relationship between interest rate derivatives and exchange rate derivatives and risk
exposures became stronger than in normal time, and the positive relationship between credit derivatives and
credit risk became less pronounced.
Our paper is closely related to Choi and Elyasiani (1997) and Yong, Faff and Chalmers (2009). Choi and
Elyasiani (1997) measure the interrelation of derivative exposure and interest rate and exchange rate risks of
the U.S. BHCs. They find that the use of financial derivatives further exposes BHCs towards risks and this
effect is particularly pronounced for exchange rate risk (see also Choi, Elyasiani and Kopecky (1992) and
Hirtle (1997)). More recently, Yong, Faff and Chalmers (2009) invesigate the relationship between financial
derivative activites and interest rate and exchange rate risks of Asia-Pacific banks, controling for the
influence of a large set of on-balance sheet banking activities. Their findings suggest that the level of interest
rate derivative activities is positively associated with long-term interest rate risk exposure but negatively
associated with short-term interest rate exposure, and the derivative activity of banks has no significant
influnce on their exchange rate risk exposure. We extend their analysis by including credit derivatives and
exploring the impact of financial derivatives held for trading and hedging purpose on systematic risks.
Chaudhry, et al. (2000) analyze how different types of exchange rate derivatives affect BHCs’ exposure
towards risks. They find that exchange rate options tend to increase risk whereas swaps are mainly used to
mitigate risk exposures. Carter and Sinkey (1998) focus on large community banks that act as end-users of
interest rate derivatives. They find that the use of interest rate derivatives is positively associated with interest
rate risk. Cyree, Huang and Lindley (2012) show that financial derivatives contributed neither to the increase
in bank values in the times of growth nor to the depletion of bank values in the global financial crisis.
The paper is organized as follows. Section 2 briefly reviews the extant literature on the use of financial
derivatives by financial institutions. Section 3 presents the data selection and basic data description. Section 4
describes the empirical methodology. Section 5 contains the empirical findings. It analyzes how the use of
financial derivatives affects BHCs’ risk exposures. Section 6 concludes the paper.
2. Literature Review on Why Banks Use Financial Derivatives
Broadly speaking, banks use financial derivatives to follow two, sometimes conflicting objectives. The first
4
objective is to use financial derivatives to hedge against the risks whereas the second is to collect revenues
and fees related to financial derivatives trading and origination.
In the spirit of Diamond’s (1984) model, banks would use financial derivatives to hedge against the
uncontrollable risks, such that they can focus on their core activity: monitoring their borrowers.3 Brewer,
Minton and Moser (2000) find that banks that use interest rate derivatives increase commercial and industrial
lending faster than banks that do not use interest-rate derivatives. Hirtle (2009) shows that the use of credit
derivatives increases the supply of bank credit but mainly for large firms. Banks could by hedging also focus
on the activities where they retain a competitive advantage. Schrand and Unal (1998) confirm this view in the
case of savings and loan institutions. Minton, Stulz and Williamson (2009) argue that the use of credit
derivatives by banks is limited questioning the size of the benefits of credit derivatives used for hedging
purposes.
Banks may use financial derivatives to lower the probability of default and in this way avoid the costs of
financial distress.4 In this view, banks would hedge especially the risks that exacerbate the costs of financial
distress (see Smith and Stulz (1985) and Stulz (2003)).5 Consistent with this theory, Purnanandam (2007)
shows empirically that banks closer to financial distress hedge against interest rate risk more aggressively.
Gorton and Rosen (1995) find that banks, especially large dealer banks, use interest rate derivatives mainly to
hedge against interest rate risk. Duffee and Zhou (2001) argue that credit derivatives hedge a bank against the
financial distress and this additional flexibility allows the bank to avoid lemon problem due to bank
information superiority. In recent study, Norden, Buston, and Wagner (2011) also find that banks use credit
derivatives to improve their management of credit risks. The notion that banks use financial derivatives to
hedge and that banks are risk-averse, however, is not universally accepted: Hirtle (1997), Sinkey and Carter
(2000), Gunther and Siems (2002) and Yong, et al. (2009) find that increases in the bank’s use of interest-rate
derivatives correspond to greater interest rate risk exposure.
Morisson (2005) stresses that hedging by financial derivatives has a dark side. He argues that the
informational value of a bank loan ceases to exist if banks can trade in the credit derivatives market. More
specifically, when the bank incorporates credit default protection, it is no longer exposed to the borrower’s
potential default. Consequently, the bank can no longer commit to monitoring and screening its borrowers.
In addition, the adverse selection problem may be present as well. The bank may want to buy credit
3 Boot and Thakor (1991) argue that banks with large off-balance sheet activities (e.g., loan commitments) lower their risk
exposures compared to banks that lend on a spot market. Their result dwells on observation that a loan commitment locks the bank
into the current interest rate which mitigates the asset substitution problem of the borrower if in the future the interest rates rise. 4 Bauer and Ryser (2004) formally model how banks use financial derivatives to mitigate the occurrence of bank runs. 5 Géczy, Minton and Schrand (1997) show that corporations use exchange rate derivatives to mitigate cash flow variations, such
that they are able to exploit profitable growth opportunities. For determinants of corporate hedging, see Nance, Smith Jr and
Smithson (1993) and Mian (1996).
5
protection against the borrowers it perceives as the most risky. This is aligned with empirical evidence from
Dahiya, Puri and Saunders (2003) that identifies a significant negative stock price reaction for a borrower
when a bank announces the borrower’s loan to be sold. Dewally and Shao (2012) find that the use of financial
derivatives by BHCs increases their opacity. Well-operating corporate governance can mitigate this effect.
Besides hedging purposes, banks also use financial derivatives for trading purposes. Revenues generated by
trading activities drive banks to provide financial derivative products to the small banks and nonfinancial
firms. Smith (1993) argues that banks should recognize the benefit of providing financial derivatives
products and the related services and make good use of it. Revenues come from generated fee income and
stronger customer relationships. If used for hedging purposes, financial derivatives can prevent financial
distress for bank customers (e.g., small banks, nonfinancial firms), increasing the stability of bank revenues.
The bank involvement in dealing and trading in financial derivatives markets requires a substantial
investment in capital, skilled employees, and good reputation, which all act as entry barriers for small banks.
Tufano (1989) analyzes financial innovations and the first-mover advantage in investment banking in light of
substantial costs associated with the development of new product. Hunter and Timme (1986) argue that the
size and technical efficiencies allow large banks to take a lead in financial innovations. Consequently, trading
activities of financial derivatives are limited to a set of large banks, whereas smaller banks have little chance
to provide full-size risk management services and a broad range of financial derivatives products to their
clients.
3. Data Sources, Sample Selection and Data Description
The data employed in this paper are combined from several sources. For financial derivatives data, we use
Call Report data from the BHC database at the Federal Reserve Bank of Chicago, where the firm-level data is
collected using the FR Y-9C report from 1997 to 2011.6 The Call Report contains quarterly balance sheet,
off-balance sheet, and income statement information for all U.S. BHCs. Second, we use historical BHCs’
stock prices from the Center of Research of Security Price (CRSP) at the University of Chicago.
Macroeconomic data is obtained from the Federal Reserve Board of Governors.7 Stock price and
macroeconomic data are monthly data between 1997 and 2011. We also split BHCs into large BHCs (whose
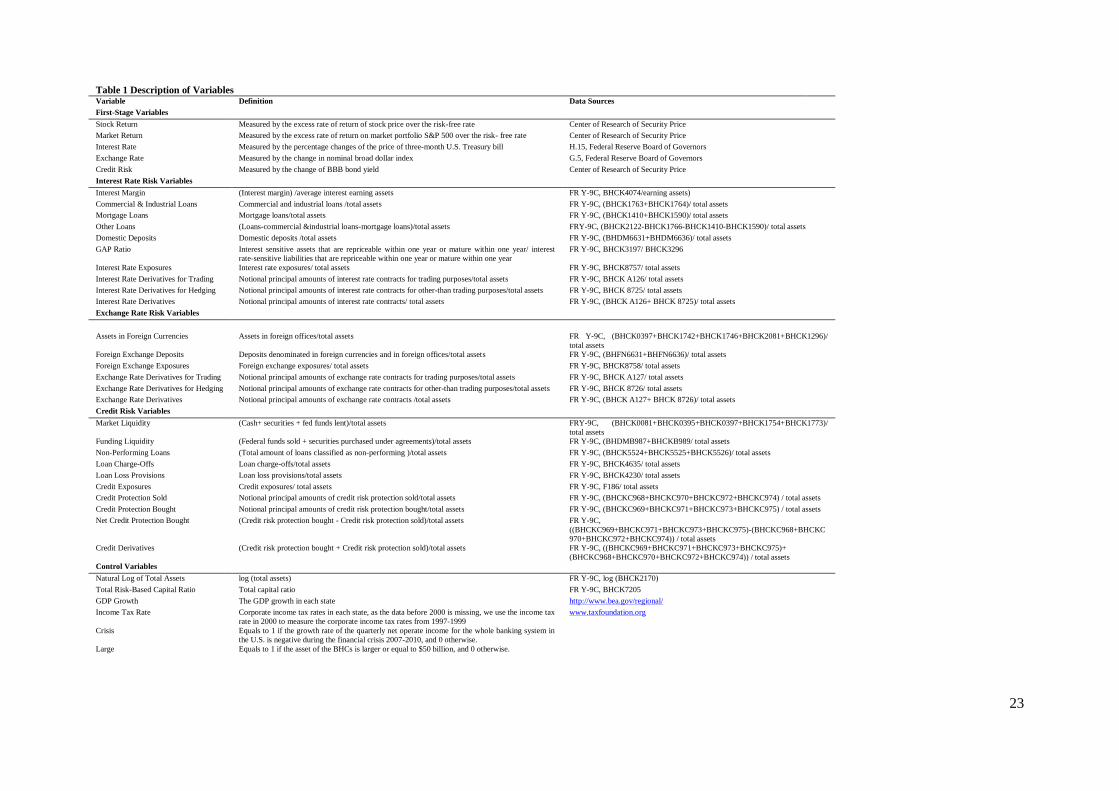
asset is equal to or higher than $50 billion) and small BHCs (whose asset is less than $50 billion).8 Table 1
6 These data are available at: https://www.chicagofed.org/applications/bhc_data/bhcdata_index.cfm. 7 These data are available at: http://www.federalreserve.gov/econresdata/default.htm. 8 Our decomposition is consistent with the classification of sections 165 and 166 of the Dodd-Frank Act in which BHCs with $50
billion or more in consolidated asset are automatically considered to be systemically important institutions (Dodd–Frank Wall Street
Reform and Consumer Protection Act and Independent Commission on Banking, 2011). See also
http://www.federalreserve.gov/newsevents/testimony/gibson20120516a.htm.
6
presents the variables, their definitions and sources.
<Insert Table 1 here>
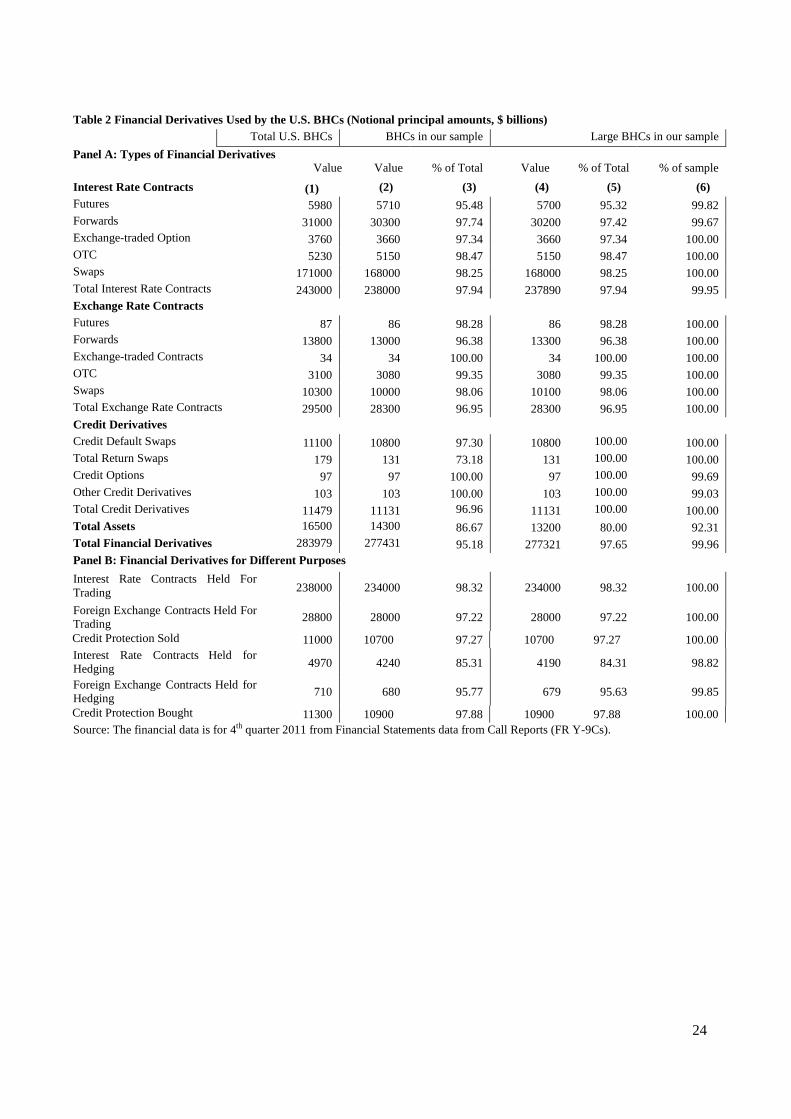
Table 2 summarizes the notional principal amounts of financial derivatives held by U.S. BHCs in the fourth
quarter of 2011. Panel A of Table 2 provides a breakdown of financial derivatives by contract types for all
U.S. BHCs included in Call Reports (in the first column), the BHCs in our sample (in the second column)
and the large BHCs in our sample (in the fourth column). In the fourth quarter of 2011, BHCs with total
assets of approximately $16.5 trillion held nearly $284 trillion of financial derivative contracts, indicating
that financial derivative contracts were more than 17 times of the BHCs’ total assets. Interest rate derivative
contracts (including futures, forwards, swaps and options) accounted for more than $243 trillion and nearly
86% of the total amount of financial derivatives. Exchange rate derivative contracts and credit derivative
contracts accounted for $29.5 trillion and $11.5 trillion, respectively. For the interest rate derivative
contracts, swaps were the largest individual derivative contract type, which accounted for more than $171
trillion and nearly 70% of interest rate contracts. In the case of exchange rate derivative contracts, the
exchange rate forwards were the most important individual contract type. The value of exchange rate
forwards was $13.8 trillion, nearly half of all exchange rate derivative contracts. For credit derivatives, 97%
of all credit derivatives held by U.S. BHCs were credit default swaps.
<Insert Table 2 here>
In the second column of Panel A we also summarize the financial derivatives data in our sample BHCs and
compare it to the data for the total U.S. BHCs (in third column). The total assets of the BHCs in our sample
were almost $14.3 trillion, which accounted for 87% of the total assets of total reported U.S. BHCs. The
financial derivative contracts used by BHCs in our sample were more than $277 trillion, 95% of the total
amount. This indicates that the BHCs in our sample well reflect the U.S. BHCs and the U.S. financial
derivatives market.
In the fourth column of Panel A, we summarize the use of financial derivatives by large BHCs in our
sample and compare it to the total U.S. BHCs (in the fifth column) and our sample BHCs (in the sixth
column). Large BHCs held $13.2 trillion of total assets, accounting for 80% of the total assets of all U.S.
BHCs and 92% of total assets of BHCs in our sample. Large BHCs held more than $277 trillion of
financial derivative contracts, which accounts for 97% of the total BHCs’ financial derivative contracts and
99.9% of financial derivative contracts in our sample. This indicates that large BHCs are the main
participants in the U.S. financial derivatives market.
7
Panel B of Table 2 presents the breakdown of financial derivatives with respect to their reported purposes
(trading vs. hedging). More than $277 trillion (out of $284 trillion held by the BHCs in total) of financial
derivative contracts were held for trading, which accounts for over 98% of all financial derivative contracts.
The financial derivatives held for trading were mainly (i.e., 98% of them) concentrated in large BHCs.
Concentration of financial derivatives in large BHCs was less pronounced for financial derivatives held for
hedging purposes. Out of all financial derivatives help for hedging purposes, large BHCs held 85% of them.
The implication is that small BHCs in our sample act as end-users in the financial derivatives market and
hold financial derivatives mainly for hedging purposes.
Table 3 compares the means of on-balance sheet and off-balance sheet variables for the total sample BHCs
and the two subsamples (i.e., large BHCs and small BHCs) in the period from 1997 to 2011. We report the
means, the difference in means and t-statistics based on unequal group variance. Panel A compares the use
of interest rate derivatives. Large BHCs have lower interest margin ratio, more loans and deposit and more
interest rate derivatives than small BHCs. Panel B focuses on exchange rate variables. Large BHCs have
more foreign currency assets and deposits and are more active in the exchange rate derivatives market than
small BHCs. Panel C depicts credit risk variables. Large BHCs have higher market liquidity and funding
liquidity, more loan charge offs, more loan provisions and non-performing loans, hold more credit
derivatives than small BHCs. Panel D presents control variables. Large BHCs’ total assets are 30 times
higher than small BHCs, they have lower capital ratio and hold more financial derivatives.
<Insert Table 3 here>
Table 3 shows that large and small BHCs employ different strategies to engage in financial derivatives
markets. Large banks can build on their scale advantage in financial derivatives activities. They act as
market markers and provide financial derivatives products to small banks and nonfinancial firm. Large
BHCs may focus on trading related activities in financial derivatives business where they contain
competitive advantage with respect to small BHCs due to their size. In contrast, small BHCs use financial
derivatives products mainly for hedging purposes as end-users.
4. Empirical Methodology
The empirical analysis employs two-stage time-series, cross-section regression model to examine the
relationship between risk exposures and the use of financial derivatives. The regression proceeds in two
stages (consistent with Fama and French (1992)). In the first-stage, the changes in the market return, interest
rate, exchange rate and credit spread are regressed against the stock returns of each BHC. In this way we
obtain risk betas that measure the BHC’s systematic (i.e., nondiversifiable) exposure towards systematic
8
market risk, interest rate risk, exchange rate risk and credit risk.9 In the second-stage regression, the
on-balance sheet variables and financial derivatives variables are regressed against risk betas.
First-stage Regression: The monthly stock returns of publicly traded BHCs are used to measure systematic
exposures of each bank towards market risk, interest rate risk, exchange rate risk and credit risk. Such
multi-factor model has also been employed by Flannery and James (1984), Choi and Elyasiani (1997) and
Hirtle (1997). The first-stage regression is as follows:
Stock Returnit=αi+βMarket,it Market Returnit+βInterest,it Interest Rateit+βExchange,it Exchange Rateit+βCredit,it Credit
Riskit + εit (1)
where βMarket,it, βInterest,it, βExchange,it, βCredit,it are risk exposures of BHC i towards market risk, interest rate risk,
exchange rate risk and credit risk exposures at time t, respectively; αi are constant error terms and εit are
random error terms.
Dependent variable Stock Return is the access rate of stock return over the risk-free rate (i.e., annualized rate
on three-month U.S. Treasury bill). Independent variable Market Return denotes the excess rate of return on
the Standard and Poor's 500 index over the risk-free rate.; Interest Rate is defined as the rate of change in the
price of three-month U.S. Treasury bill rate, i.e., (
) where r is annualized rate on three-month U.S.
Treasury bill; Exchange Rate is the rate of change in the nominal broad dollar index, i.e., (et-et-1)/et where e is
the value of the U.S. dollar against a basket of foreign currencies,10
Credit Risk is defined as the change of
BBB bond yield, i.e., (bt-bt-1)/bt-1, where b is the BBB bond yield in the U.S. market. All data are calculated
on a monthly basis.
To adjust for possible bias due to cross-equation dependencies, the regression equations for each of the BHCs
are estimated as a simultaneous equation system, using a modified Seemingly Unrelated Technique (SUR).
The modified SUR technique, developed by Chamberlain (1982), MaCurdy (1982) and Choi and Elyasiani
(1997), is a variation of the standard SUR method and produces asymptotically efficient estimates without
imposing either conditional homoskedasticity or serial independence restrictions on disturbance terms.11
9 This approach allows us to disentangle systematic (i.e., undiversifiable) risk into three components: systematic interest rate,
exchange rate, and credit risk and analyze the impact of the financial derivatives of the corresponding type. Rodriguez Moreno,
Mayordomo and Peña (2013) analyze the impact of financial derivatives on bank systemic risk. 10 The nominal broad dollar index is a weighted average of the foreign exchange value of the U.S. dollar against the currencies of a
broad group of major U.S. trading partners. Weights for the broad index can be found at
http://www.federalreserve.gov/releases/H10/Weights. For more information on exchange rate indexes for the U.S. dollar, see
"Indexes of the Foreign Exchange Value of the Dollar," Federal Reserve Bulletin, 91:1 (Winter 2005), pp. 1-8
(http://www.federalreserve.gov/pubs/bulletin/2005/winter05_index.pdf). 11 The SUR regression has been employed in recent studies by Viale, Kolari and Fraser (2009), Yong, et al. (2009), Ammer, Vega and
Wongswan (2010), Białkowski, Etebari and Wisniewski (2012) and Lim, Sum and Khun (2012).
9
The market model regressions are performed quarterly by using a 4-year rolling window between 1997 and
2011 to estimate quarterly-varying beta coefficients for each BHC. This process results in separate risk betas
for each BHC for each quarter in the sample.12
The values of βMarket,it, βInterest,it, βExchange,it, βCredit,it are therefore
quarterly and bank-specific data and are treated as panel data in the second-stage regression.
Second-stage Regression: In the second-stage, interest rate risk βInterest,it, exchange rate risk βExchange,it and
credit risk βCredit,it generated in the first-stage are regressed in a panel data regression against bank-specific
on-balance sheet and off-balance sheet (i.e., financial derivatives) variables.13
To increase the accuracy of
our estimation in the second-stage, we follow Doidge, Griffin and Williamson (2006) and Chue and Cook
(2008) and weight each observation by the inverse of the standard errors of βInterest,it, βExchange,it and βCredit,it
obtained in the first-stage. By this procedure, the betas that are estimated more precisely in the first-stage
regression receive a heavier weight in the second-stage regression.
The equations can be written as follows:
βInterest,it = γi+ δj Xjit + ηj Yjit (2)
where Xjit are on-balance-sheet variables (including Interest Margin, C&I Loans, Mortgage Loans, Other
Loans, Domestic Deposits) and three control variables (Size, Total Capital Ratio and GDP growth) and Yjit
are the notional principal amounts of interest rate derivatives used. In a slightly changed specification, Yjit
can be interest rate derivatives and interest rate derivatives for hedging.
βExchange,it =Фi+ ξj Аjit + ςj Вjit (3)
where Аjit are on balance sheet variables (including Assets in Foreign Currencies, Foreign Exchange
Deposits) and two control variables (Size, Total Capital Ratio and GDP growth) and Вjit are the notional
principal amounts of exchange rate derivatives used. In a slightly changed specification, Вjit can be exchange
rate derivatives and exchange rate derivatives for hedging.
βCredit,it =ψi+ μj Оjit + νj Рjit (4)
12 Based on the method of sample constructing, a number of BHCs drop out of the sample because of the mergers and failures during
our sample period. 13 The betas generated in the first stage are used as dependent variables in the second stage, the most recent literatures that use the
risk exposure as dependent variable in the second stage can be found in Chue and Cook (2008), Hutson and Stevenson (2009), Choi
and Jiang (2009), and Bredin (2011).
10
where Оjit are on balance sheet variables (including Market Liquidity, Funding Liquidity, Non-Performing
Loans, Loan Charge-Offs, Loan Loss Provisions) and two control variables (Size, Total Capital Ratio and
GDP growth) and Рjit are the notional principal amounts of credit derivatives used. In a slightly changed
specification, Рjit can be credit derivatives and net credit protection bought.
We also account for the presence of the global financial crisis by adding dummy variable Crisist which is
one during the financial crisis 2007-2010 and zero in all other periods. We estimate the following regression
equations:
βInterest,it = γi + δj Xjit + ηj Yjit + θi Crisist + κj Crisist Yjit (5)
βExchange,it = Фi + ξj Аjit + ςj Вjit + υi Crisist + ωj Crisist Вjit (6)
βCredit,it = ψi+ μj Оjit + νj Рjit +пi Crisist + ρj Crisist Рjit (7)
5. Empirical Results
5.1. First-stage Regression Results
In the first-stage, we estimate the beta coefficients of market risk, interest rate risk, exchange rate risk and
credit risk for each BHC in each quarter in our sample. We also perform regressions for each group of the
BHCs in our sample. Correlations between the first-stage variables are shown in Table 4.
<Insert Table 4 here>
We observe from Table 4 that excess stock returns are significantly negatively correlated with changes in
exchange rate and bond yields but significantly positively correlated with changes in interest rate. Excess
stock returns are positively and insignificantly correlated with excess market returns for small BHCs whereas
the relationship is insignificant for large BHCs and for the total sample.
In Table 5, we report the results of the multifactor index model based on the entire sample period for the total
sample, large BHCs and small BHCs. The results indicate that market risk beta (βMarket) and interest rate beta
(βInterest) are statistically significant (at 1% level on two-tail tests) for the total sample and for two subsamples
(large BHCs and small BHCs). The exchange rate beta (βExchange) is significant for the total sample and small
BHCs but not for the large BHCs. The credit risk beta (βCredit) is significant in all cases.
11
<Insert Table 5 here>
In Table 5, risk betas can be compared across large and small BHCs. The market risk beta (βMarket) is higher
for the large BHCs, followed by the total sample and small BHCs. This is consistent with the popular notion
that large BHCs, acting as market makers and holding a large proportion of financial derivatives for trading
purposes, have higher risks and are more exposed to the market risk (Standard and Poor's, 2011). The results
also show that small BHCs are more sensitive to systematic interest rate risk, exchange rate risk and credit
risk than large BHCs. Higher sensitivity to systematic interest rate risk and credit risk is aligned with the
notion that lending (and associated credit risk) is the core business of small BHCs.
Figure 5 to Figure 8 depict the movement of the average systematic interest rate risk, exchange rate risk,
credit risk and market risk for large and small BHCs. Systematic interest rate risk reached the bottom in years
2005 and 2006 and then increased with the start of the global financial crisis. This shows that the BHCs were
substantially exposed to higher systematic interest rate risk during the global financial crisis. Similarly,
systematic exchange rate risk, credit risk and market risk substantially increased in the global financial crisis.
At the end of the global financial crisis, we also observe that large BHCs are exposed to higher systematic
interest rate risk, exchange rate risk, credit risk and market risk than small BHCs (see Figure 5, 6, 7, and 8).
This observation is consistent with the notion that BHCs are exposed to higher systematic risks during the
financial crisis than in normal times and large BHCs are exposed to higher systematic risks than smaller ones.
<Insert Figure 5-Figure 8 here>
5.2. Bank-specific Determinants of Risk Betas: Initial Analysis
In this section we present the weighted instrumental-variable estimator of the second-stage regression using
the panel data regression model based on (2), (3) and (4). The dependent variables in the regression are
interest rate, exchange rate and credit risk betas generated in the first-stage regression. The independent
variables are the on-balance sheet variables and the financial derivatives variables (see Table 3). Three
control variables are introduced: the natural log of total assets, the total risk-based capital ratio and the GDP
growth. The regressions also include the bank-specific fixed effects and yearly dummy variables to control
for macroeconomic factors that may vary over time. All standard errors are heteroskedasticity-consistent.
In the estimation, the financial derivatives variables and the interacted terms between Crisis and financial
derivatives variables are instrumented with their one quarter lagged counterparties, exposures variables from
trading revenue (interest rate exposures, foreign exchange exposures and credit exposures), and income tax

12
rate.14
Following Baum (2006), the GMM estimator is also employed to obtain the consistent and efficient
estimation in the presence of non-i.i.d errors.
Instrument variables are statistically significant (at least at 10%) at large in the first-stage of weighted
instrument-variable estimation. For the Anderson and Rubin (1949) test of the validity of the instruments, the
hypothesis that the instruments are not valid is rejected at the 5% level for all regression model based on (2),
(3) and (4). Besides this, the underidentification test (measured by Kleibergen-Paap rk LM statistic,
Kleibergen and Paap (2006)), and weak identification test (measured by Cragg-Donald Wald F statistic and
Kleibergen-Paap Wald rk F statistic, Cragg and Donald (1993) and Baum, Schaffer and Stillman (2007)) also
confirm the validity of instrumental variables.
Correlations among the variables used in the second-stage estimation are presented in Table 6. Correlations
among on-balance sheet variables and off-balance sheet variables related to interest rate risk (in Panel A) are
generally low, while the correlations among BHCs’ size and interest rate derivatives variables (interest rate
derivatives for trading, interest rate derivatives for hedging, and interest rate derivatives) are generally higher
(above 0.2). This indicates that there is no multicollinearity problem between the on-balance sheet variables
and that a BHC’s size in an important driver of the use of interest rate derivatives.
The correlations between variables related to exchange rate risk and credit risk are presented in Panel B and
Panel C of Table 6 respectively.
<Insert Table 6 here>
Figure 9 to Figure 11 provide the first inspection of the impact of the use of financial derivatives (i.e., interest
rate derivatives, exchange rate derivatives and credit derivatives) on systematic risk sensitivities. BHCs are
split in quartiles according to how intensively they use financial derivatives (interest rate derivatives/total
assets, exchange rate derivatives/total assets and credit derivatives/total assets). Figure 9 shows that the
fourth quartile of BHCs (i.e., the BHCs with the most intensive use of interest rate derivatives) is exposed to
the highest systematic interest rate risk during the global financial crisis. The quartile of BHCs with the most
intensive use of credit derivatives is exposed to the highest systematic credit risk sensitivity during the global
financial crisis (see Figure 11). In contrast, the quartile of BHCs with the most intensive use of exchange rate
derivatives is exposed to the lowest systematic exchange rate risk sensitivity during the global financial crisis
(see Figure 10).
<Insert Figure 9 to Figure 11 here>
Table 7 provides the weighted instrumental-variable regression results. Panel A analyzes the exposure
14 Ashcraft (2008) uses corporate income tax rates as an instrument for the mix of debt in regulator capital.
13
towards systematic interest rate risk. The results show that commercial and industrial loans, and mortgage
loans are positively and significantly associated with systematic interest rate risk for the large BHCs. On the
other hand, domestic deposits are negatively associated with systematic interest rate risk for the total sample
(but this relationship is statistically significant only for the small BHCs). This may indicate that especially
small BHCs with higher lending activities are exposed to higher systematic interest rate risk.
<Insert Table7 here>
Panel A in Table 7 shows the use of interest rate derivatives is positively (and significantly at 1% for the total
sample) associated with systematic interest rate risk. This indicates that interest rate derivatives are not
successfully used for hedging purposes. Rather, they may be used for fee generating business such as trading.
This result is consistent with the previous studies (e.g., Hirtle (1997); Reichert and Shyu (2003); Yong, et al.
(2009)).
Panel A in Table 7 also shows that higher GAP ratio and higher Total risk-based capital ratio are associated
with higher interest rate risk for large BHCs. The size of a BHC has a significant and positive impact on
systematic interest rate risk for the total sample and for small BHCs. This is consistent with previous findings
by Elyasiani and Mansur (1998, 2004), Saporoschenko (2002), Reichert and Shyu (2003), and Faff, Hodgson
and Kremmer (2005). GDP growth has a significant and positive impact on systematic interest rate risk for
large BHCs. In contrast, the relation between GDP growth and interest rate risk is negative for the small
BHCs.
Panel B in Table 7 analyzes systematic exchange rate risk of BHCs. The use of exchange rate derivatives is
negatively (and significantly at 1%) associated with systematic exchange rate risk for the total sample, large
BHCs, and small BHCs. This demonstrates that BHCs are less exposed to systematic exchange rate risk the
more they use exchange rate derivatives. The interaction term between the dummy variable Large and
exchange rate derivatives is positive and statistically significant at 5%. In addition, the economic impact of
exchange rate derivatives on systematic exchange rate risk is more pronounced for small BHCs than for large
BHCs, indicating that the hedging purpose of exchange rate derivatives is especially strong for small BHCs.
Panel B in Table 7 also shows that foreign exchange deposits are positively associated with systematic
exchange rate risk for small BHCs whereas assets in foreign currencies are positively associated with
systematic exchange rate risk for the total sample and large BHCs but negatively for small BHCs. The
explanation may be that small BHCs naturally combine foreign exchange deposit-taking with lending in
same foreign currencies and better hedge against exchange rate risk than large BHCs. We also see that total
assets are negatively and significantly associated with systematic exchange rate risk (for large BHCs). This
14
may suggest that especially large BHCs have powers to expand in assets in foreign currencies and collect
foreign exchange deposits and, by doing this, they expose themselves to systematic exchange rate risk.
Panel C of Table 7 depicts the credit risk exposures of BHCs. The use of credit derivatives is positively and
significantly related to systematic credit risk for the total sample, large BHCs, and small BHCs. The
relationship is stronger for large BHCs than for the total sample or small BHCs. In addition, the interaction
term between dummy variable Large and Credit derivatives is positive and statistically significant at 1%.
This indicates that especially large BHCs use credit derivatives predominantly not to hedge but to further
expose themselves towards systematic credit risk.
Market liquidity is negatively and significantly at 1% associated with systematic credit risk for the total
sample and small BHCs but not for large BHCs. The explanation may be that liquid funds help BHCs to
mitigate their exposure towards systematic credit risk. Loan charge offs are positively associated with credit
risk but the relationship is statistically significant (at 1%) only for the total sample. In the case of large BHCs,
loan loss provisions are negatively and significantly (at 5%) associated with systematic credit risk. The size
of a BHC is positively (and statistically significant at 1%) related to systematic credit risk.
In short, the use of interest rate derivatives and credit derivatives is positively and significantly related to
systematic interest rate and credit risk. In contrast, the use of exchange rate derivatives is negatively and
significantly associated with systematic exchange rate risk. Small BHCs better use financial derivatives to
hedge (that is, to lower their systematic risk exposures more successfully) than large BHCs.
5.3. Reported Purposes of Financial Derivatives and Risks
To further depict the relationship between risks and financial derivatives, we analyze how financial
derivatives for hedging purposes affect systematic interest rate risk, exchange rate risk, and credit risk.15
<Insert Table 8 here>
Panel A in Table 8 shows that interest derivatives for hedging are negatively and significantly related to
systematic interest rate risk for the total sample and large BHCs, whereas interest rate derivatives for hedging
have no significant effect on systematic interest rate risk of small BHCs. The results suggest that the reported
purpose of financial derivatives is aligned with their impact on systematic exposure of a BHC. That is, BHCs
15 BHCs reports do not break credit derivatives into credit derivatives held for trading and for hedging purpose. Hence, we use the net
credit protection bought, which is the difference between the notional principal of credit derivatives on which the bank is the
beneficiary (credit protection bought) and the notional principal amount of credit derivatives on which the bank is guarantor (credit
protection sold). See also Minton, Stulz and Williamson (2009) and Hirtle (2009).
15
with a higher proportion of interest rate derivatives for hedging are less exposed towards systematic interest
rate risk than BHCs with a lower proportion of interest rate derivatives for hedging. The negative impact of
interest rate derivatives for hedging on risk is stronger for large BHCs than small BHCs.
Panel B in Table 8 reports results for exchange rate derivatives and exchange rate derivatives for hedging.
The direct effect of increased exchange rate derivatives is negative and significant for total sample, large
BHCs and small BHCs. For total BHCs and large BHCs, exchange rate derivatives for hedging have a
significant effect on systematic exchange rate risk: exchange rate risk appears to decline as the amount of
exchange rate derivatives for hedging increases. Exchange rate risk to small BHCs appears to increase as the
exchange rate derivatives for hedging rise.
Panel C in Table 8 shows that net credit protection bought is negatively related to credit risk for total BHCs
and large BHCs (only significant for large BHCs at 1%), whereas the sign is positive and insignificant for
small BHCs.
The relationships between on-balance sheet variables, control variables and risk betas are similar as reported
in Table 7. These results point to the different impact of financial derivatives for hedging across different
types of BHCs. Large BHCs are more likely use the exchange rate derivatives in international financial
markets whereas small BHCs are mainly focus on the domestic market. The different impact of financial
derivatives for hedging on risks for large BHCs and small BHCs can also be observed: the negative impact of
financial derivatives for hedging is significantly higher for large BHCs.
In brief, Table 8 confirms that financial derivatives for hedging are negatively related to risks of total sample
and large BHCs. This is aligned with the view that financial derivatives held for hedging will reduce risks. In
the second column of Table 8 we can also see that the interaction term between the dummy variable Large
(indicating large BHCs) and the proportion of financial derivatives used for hedging is consistently negative.
This indicates that large BHCs report the purpose of derivatives (i.e., hedging vs. trading) more consistently
with its impact on systematic risk.
We now analyze whether the relationship between risks and financial derivatives has changed in the global
financial crisis 2007-2010.
5.4. The Global Financial Crisis and Financial Derivatives
Table 9 analyzes the role of financial derivatives in the global financial crisis. The global financial crisis
16
denoted by dummy variable Crisis has a significantly positive (at 1%) impact on systematic interest rate risk
of the total sample and small BHCs. The coefficients of the interaction terms between Crisis and interest rate
derivatives are negative and significant (for the total sample and large BHCs), which suggests that the
positive impact of interest rate derivatives on systematic interest rate risk is stronger during the financial
crisis than in normal times (Panel A). While the dummy variable Crisis has no direct significant effect on
systematic exchange rate risk and credit risk, the coefficients of the interaction terms between Crisis and
exchange rate derivatives (for large BHCs and small BHCs) and between Crisis and credit derivatives (for
total sample and large BHCs) are negative and significant, which suggests that the impact of exchange rate
derivatives on systematic exchange rate risk is higher during the crisis than in normal time (Panel B), whereas
the impact of credit derivatives on credit risk is lower during the crisis than in normal times (Panel C).
<Insert Table 9 here>
Table 9 depicts the impact of the global financial crisis on systematic interest rate, exchange rate, and credit
risk. The positive relationship between interest rate derivatives and systematic interest rate risk becomes
more pronounced during the global financial crisis, whereas the negative relationship between exchange rate
derivatives and systematic exchange rate risk also becomes stronger during the global financial crisis. The
global financial crisis seems to lower the positive impact of credit derivatives on systematic credit risk for
total sample and large BHCs, whereas its impact in the case of small BHCs was not statistically significant.
In Table 10 we further examine financial derivatives based on their reported purposes (for hedging vs.
trading). For the total sample, interest rate derivatives are positively related to systematic interest rate risk
and the global financial crisis further exacerbates this positive relation. In contrast, interest rate derivatives
for hedging (ie. the proportion of interest rate derivatives for hedging in all interest derivatives) are
negatively related to systematic interest rate risk for the total sample and the global financial crisis has no
significant effect on the relationship between interest rate derivatives for hedging and systematic interest rate
risk. For large BHCs and small BHCs, the global financial crisis has a significantly positive effect on the
relationship between interest rate derivatives for hedging and systematic interest rate risk.
<Insert Table10 here>
The impact of the global financial crisis on systematic exchange rate risk is positive and statistically
significant at 1% for large BHCs. For the total sample, the interaction terms between Crisis and exchange rate
derivatives and exchange rate derivatives for hedging are statistically and negatively significant. This
indicates that the negative relationship between exchange rate derivatives (and exchange rate derivatives for
hedging) and systematic exchange rate risk is stronger during the global financial crisis than in normal times.
17
The global financial crisis negatively and significantly (at 1%) affects systematic credit risk. For the total
sample and for large BHCs, the global financial crisis decreases the positive relationship between credit
derivatives and credit risk. The global financial crisis has no significant impact on the relation between net
credit protection bought and credit risk.
In summary, Table 10 shows that for total sample and large BHCs, the global financial crisis increases the
positive (negative) relationship between financial derivatives and systematic interest rate risks (systematic
exchange rate risk), whereas the global financial crisis decreases the positive relation between credit
derivatives and systematic credit risk. For small BHCs, the global financial crisis only increases the negative
relationship between exchange rate derivatives and systematic exchange rate risks.
The impact of the global financial crisis can be explained in the following way. During the global financial
crisis, the risks associated with financial derivatives increased, which in turn increased the impact of financial
derivatives on risks sensitivity of BHCs. In addition, large BHCs may have increased the use financial
derivatives for trading (indicating speculative purposes). In contrast, small BHCs may have used financial
derivatives even more for hedging purposes which lowered their risk exposures during the global financial
crisis.
6. Conclusions
In this paper, we examine whether financial derivatives magnify or mitigate systematic interest rate risk,
exchange rate risk, and credit risk sensitivities of the publicly traded U.S. BHCs in the period from 1997 to
2011. The regression proceeds in two stages. In the first stage, the changes in the excess market returns,
risk-free interest rates, exchange rates, and interest rates on BBB rated bonds are regressed against the stock
returns of each bank. We apply a modified seeming unrelated simultaneous regression that adjusts for
cross-equation dependencies as well as heteroskedasticity and serial correlation. In this way, we obtain betas
that measure systematic market risk, interest rate risk, exchange rate risk, and credit risk. In the
second-stage regression, we employ the weighted instrumental-variables estimation to regress the on-balance
sheet variables and financial derivatives variables against systematic risk betas generated in the first stage.
The sample included in this paper accounts for more than 86% of the total assets of U.S. BHCs and more than
95% of the financial derivatives held by BHCs. Hence, the results well reflects the characteristic of BHCs
and U.S. financial derivatives market. Also, in order to examine the differences between BHCs that act as
dealers and the ones that act as end-users, we divide the sample into large BHCs and small BHCs. In addition,
18
we divide derivatives with respect to their reported purposes (i.e., trading vs. hedging).
Our empirical results provide evidence that the use of financial derivatives have significant effects on the risk
exposures. For BHCs in our sample, we find that the higher use of interest rate derivatives and credit
derivatives corresponds to greater systematic interest rate risk and credit risk, whereas more pronounced use
of exchange rate derivatives is associated with lower systematic exchange rate risk. By examining the effect
of financial derivatives for hedging on risk sensitivities, we find that the use of financial derivatives for
hedging purposes is negatively related to risk sensitivities of BHCs (especially for large BHCs). During the
global financial crisis, the relationship between interest rate and exchange rate derivatives and systematic risk
sensitivities became stronger than in normal times, and the positive relationship between credit derivatives
and systematic credit risk became less pronounced.
Policy implications immediately follow. Our analysis shows that caution is needed when limiting or even
banning the use of financial derivatives across BHCs (through e.g. the Volker rule in the Dodd-Frank Wall
Street Reform and Consumer Protection Act). We show that use of exchange rate derivatives generally
lowers systematic exchange rate risk of BHCs. In this light, banning the use of financial derivatives for
trading may make bank risk management less efficient (see also Thakor, 2012). In addition, financial
derivatives with a reported purpose of hedging decrease systematic risks especially in the case of large BHCs
but not in the case of small BHCs. This indicates that financial derivatives may increase systematic risks even
though the declared purpose of financial derivatives is hedging. Hence, to break the interconnection between
financial derivatives and systematic risks it may not be enough to allow BHCs to only use financial
derivatives for hedging purposes.
19
References
Ammer, J., Vega, C., and Wongswan, J. (2010). International Transmission of US Monetary Policy Shocks:
Evidence from Stock Prices. Journal of Money, Credit and Banking, 42, 179-198.
Anderson, T. W., and Rubin, H. (1949). Estimation of the parameters of a single equation in a complete
system of stochastic equations. The Annals of Mathematical Statistics, 20(1), 46-63.
Ashcraft, A. B. (2008). Does the market discipline banks? New evidence from regulatory capital mix.
Journal of Financial Intermediation, 17(4), 543-561.
Bauer, W., and Ryser, M. (2004). Risk management strategies for banks. Journal of Banking & Finance,
28(2), 331-352.
Baum, C. F. (2006). An introduction to modern econometrics using Stata: Stata Corp.
Baum, C. F., Schaffer, M. E., and Stillman, S. (2007). Enhanced routines for instrumental variables/GMM
estimation and testing. Stata Journal, 7(4), 465-506.
Białkowski, J., Etebari, A., and Wisniewski, T. P. (2012). Fast profits: Investor sentiment and stock returns
during Ramadan. Journal of Banking & Finance, 36(3), 835-845.
Boot, A. W. A., and Thakor, A. V. (1991). Off-balance sheet liabilities, deposit insurance and capital
regulation. Journal of Banking & Finance, 15(4), 825-846.
Bredin, D., and Hyde, S. (2011). Investigating sources of unanticipated exposure in industry stock returns.
Journal of Banking & Finance, 35(5), 1128-1142.
Brewer, E., Minton, B., and Moser, J. (2000). Interest-rate derivatives and bank lending. Journal of Banking
& Finance, 24(3), 353-379.
Carter, D. A., and Sinkey, J. F. (1998). The use of interest rate derivatives by end-users: The case of large
community banks. Journal of Financial Services Research, 14(1), 17-34.
Chamberlain, G. (1982). Multivariate regression models for panel data. Journal of Econometrics, 18(1),
5-46.
Chaudhry, M., Christie-David, R., Koch, T., and Reichert, A. (2000). The risk of foreign currency contingent
claims at US commercial banks. Journal of Banking & Finance, 24(9), 1399-1417.
Choi, J. J., and Elyasiani, E. (1997). Derivative exposure and the interest rate and exchange rate risks of US
banks. Journal of Financial Services Research, 12(2), 267-286.
Choi, J. J., Elyasiani, E., and Kopecky, K. J. (1992). The sensitivity of bank stock returns to market, interest
and exchange rate risks. Journal of Banking & Finance, 16(5), 983-1004.
Choi, J. J., and Jiang, C. (2009). Does multinationality matter? Implications of operational hedging for the
exchange risk exposure. Journal of Banking & Finance, 33(11), 1973-1982.
Chue, T. K., and Cook, D. (2008). Emerging market exchange rate exposure. Journal of Banking & Finance,
32(7), 1349-1362.
Cragg, J. G., and Donald, S. G. (1993). Testing identifiability and specification in instrumental variable
20
models. Econometric Theory, 9, 222-222.
Cyree, K. B., Huang, P., Lindley, J. T. (2012). The Economic Consequences of Banks’ Derivatives Use in
Good Times and Bad Times. Journal of Financial Services Research, 41, 121-144.
Dahiya, S., Puri, M., and Saunders, A. (2003). Bank borrowers and loan sales: New evidence on the
uniqueness of bank loans. Journal of Business, 76(4), 563-582.
Dewally, M., Shao, Y. (2012). Financial derivatives, opacity, and crash risk: Evidence from large US banks,
Journal of Financial Stability, forthcoming, http://dx.doi.org/10.1016/j.jfs.2012.11.001.
Diamond, D. (1984). Financial intermediation and delegated monitoring. The Review of Economic Studies,
51(3), 393-414.
Doidge, C., Griffin, J., and Williamson, R. (2006). Measuring the economic importance of exchange rate
exposure. Journal of Empirical Finance, 13(4), 550-576.
Duffee, G. R., and Zhou, C. (2001). Credit derivatives in banking: Useful tools for managing risk? Journal of
Monetary Economics, 48(1), 25-54.
Elyasiani, E., and Mansur, I. (1998). Sensitivity of the bank stock returns distribution to changes in the level
and volatility of interest rate: A GARCH-M model. Journal of Banking & Finance, 22(5), 535-563.
Elyasiani, E., and Mansur, I. (2004). Bank stock return sensitivities to the long-term and short-term interest
rates: a multivariate GARCH spproach. Managerial Finance, 30(9), 32-55.
Faff, R. W., Hodgson, A., and Kremmer, M. L. (2005). An investigation of the impact of interest rates and
interest rate volatility on Australian financial sector stock return distributions. Journal of Business
Finance & Accounting, 32(5‐6), 1001-1031.
Fama, E. F., and French, K. R. (1992). The cross-section of expected stock returns. Journal of Finance,
427-465.
Financial Stability Board. (2010). Implementing OTC derivatives market reforms: Financial Stability Board.
Flannery, M., and James, C. (1984). The effect of interest rate changes on the common stock returns of
financial institutions. Journal of Finance, 39(4), 1141-1153.
Géczy, C., Minton, B., and Schrand, C. (1997). Why firms use currency derivatives. Journal of Finance,
52(4), 1323-1354.
Gorton, G., and Rosen, R. (1995). Banks and derivatives. NBER Macroeconomics Annual, 10, 299-339.
Greenspan, A. (1999). Financial Derivatives, Before the Futures Industry Association. Boca Raton, Florida.
March 19, 1999
Gunther, J. W., and Siems, T. F. (2002). The likelihood and extent of banks' involvement with interest rate
derivatives as end users. Research in Finance, 19.
Hirtle, B. (1997). Derivatives, portfolio composition, and bank holding company interest rate risk exposure.
Journal of Financial Services Research, 12(2), 243-266.
Hirtle, B. (2009). Credit derivatives and bank credit supply. Journal of Financial Intermediation, 18(2),
125-150.
21
Hunter, W., and Timme, S. (1986). Technical change, organizational form, and the structure of bank
production. Journal of Money, Credit and Banking, 18(2), 152-166.
Hutson, E., and Stevenson, S. (2009). Openness, hedging incentives and foreign exchange exposure: A
firm-level multi-country study. Journal of International Business Studies, 41(1), 105-122.
IMF, M. a. C. M. D. (2009). Global Financial Stability Report, October 2009: Navigating the Financial
Challenges Ahead. 250.
Independent Commission on Banking. (2011). Final Report Recommendations. London.
Kleibergen, F., and Paap, R. (2006). Generalized reduced rank tests using the singular value decomposition.
Journal of Econometrics, 133(1), 97-126.
Lim, S., Sum, V., and Khun, C. (2012). Interest Rate Sensitivity of Stock Returns: Effects Across the
Maturity Profile and Direction of Interest Rate Changes. International Research Journal of Applied
Finance, Forthcoming.
MaCurdy, T. E. (1982). The use of time series processes to model the error structure of earnings in a
longitudinal data analysis. Journal of Econometrics, 18(1), 83-114.
Mian, S. (1996). Evidence on corporate hedging policy. Journal of Financial and Quantitative Analysis,
31(03), 419-439.
Minton, B. A., Stulz, R., and Williamson, R. (2009). How much do banks use credit derivatives to hedge
loans? Journal of Financial Services Research, 35(1), 1-31.
Morrison, A. D. (2005). Credit Derivatives, Disintermediation, and Investment Decisions*. The Journal of
Business, 78(2), 621-648.
Nance, D., Smith Jr, C., and Smithson, C. (1993). On the determinants of corporate hedging. Journal of
Finance, 48(1), 267-284.
Norden, L., Buston, C. S., and Wagner, W. (2011). Banks’ use of credit derivatives and the pricing of loans:
What is the channel and does it persist under adverse economic conditions: Working paper, Erasmus
University Rotterdam and Tilburg University.
Office of the Comptroller of the Currency. (2011). OCC's Quarterly Report on Bank Trading and Derivatives
Activities Fourth Quarter 2011.
http://www.occ.gov/topics/capital-markets/financial-markets/trading/derivatives/dq411.pdf
Purnanandam, A. (2007). Interest rate derivatives at commercial banks: an empirical investigation. Journal
of Monetary Economics, 54(6), 1769-1808.
Reichert, A., and Shyu, Y. (2003). Derivative activities and the risk of international banks: A market index
and VaR approach. International Review of Financial Analysis, 12(5), 489-511.
Rodriguez Moreno, M., Mayordomo, S., and Peña, J. I. (2013). Derivatives holdings and systemic risk in the
U.S. banking sector, Working paper, June 7.
Saporoschenko, A. (2002). The sensitivity of Japanese bank stock returns to economic factors: An
examination of asset/liability differences and main bank status. Global Finance Journal, 13(2),
22
253-270.
Schrand, C., and Unal, H. (1998). Hedging and coordinated risk management: Evidence from thrift
conversions. The Journal of Finance, 53(3), 979-1013.
Sinkey, J., and Carter, D. (2000). Evidence on the financial characteristics of banks that do and do not use
derivatives. The Quarterly Review of Economics and Finance, 40(4), 431-449.
Smith, C., and Stulz, R. (1985). The determinants of firms' hedging policies. Journal of Financial and
Quantitative Analysis, 20(04), 391-405.
Smith Jr, C. (1993). Risk management in banking. Advanced Strategies in Financial Risk Management,
147–162.
Standard and Poor's. (2011). Industry Risk for Investment Banking is Generally Higher than for Other
Financial Institutions. January 6.
Stulz, R. M. (2003). Risk management & derivatives: South-Western Pub.
Thakor, A. V. (2012). The economic consequences of the Volker rule. Center for capital markets
competitiveness, U.S. chamber of commerce.
Trichet, J.-C. (2007). Some reflections on the development of credit derivatives. Keynote address at the 22nd
Annual General Meeting of the International Swaps and Derivatives Association (ISDA), Boston, 18
April 2007.
Tufano, P. (1989). Financial innovation and first-mover advantages. Journal of Financial Economics, 25(2),
213-240.
Viale, A. M., Kolari, J. W., and Fraser, D. R. (2009). Common risk factors in bank stocks. Journal of Banking
& Finance, 33(3), 464-472.
Yong, H. H. A., Faff, R., and Chalmers, K. (2009). Derivative activities and Asia-Pacific banks’ interest rate
and exchange rate exposures. Journal of International Financial Markets, Institutions and Money,
19(1), 16-32.
23
Table 1 Description of Variables Variable Definition Data Sources
First-Stage Variables
Stock Return Measured by the excess rate of return of stock price over the risk-free rate Center of Research of Security Price
Market Return Measured by the excess rate of return on market portfolio S&P 500 over the risk- free rate Center of Research of Security Price
Interest Rate Measured by the percentage changes of the price of three-month U.S. Treasury bill H.15, Federal Reserve Board of Governors
Exchange Rate Measured by the change in nominal broad dollar index G.5, Federal Reserve Board of Governors
Credit Risk Measured by the change of BBB bond yield Center of Research of Security Price
Interest Rate Risk Variables
Interest Margin (Interest margin) /average interest earning assets FR Y-9C, BHCK4074/earning assets)
Commercial & Industrial Loans Commercial and industrial loans /total assets FR Y-9C, (BHCK1763+BHCK1764)/ total assets
Mortgage Loans Mortgage loans/total assets FR Y-9C, (BHCK1410+BHCK1590)/ total assets
Other Loans (Loans-commercial &industrial loans-mortgage loans)/total assets FRY-9C, (BHCK2122-BHCK1766-BHCK1410-BHCK1590)/ total assets
Domestic Deposits Domestic deposits /total assets FR Y-9C, (BHDM6631+BHDM6636)/ total assets
GAP Ratio Interest sensitive assets that are repriceable within one year or mature within one year/ interest
rate-sensitive liabilities that are repriceable within one year or mature within one year
FR Y-9C, BHCK3197/ BHCK3296
Interest Rate Exposures Interest rate exposures/ total assets FR Y-9C, BHCK8757/ total assets
Interest Rate Derivatives for Trading Notional principal amounts of interest rate contracts for trading purposes/total assets FR Y-9C, BHCK A126/ total assets
Interest Rate Derivatives for Hedging Notional principal amounts of interest rate contracts for other-than trading purposes/total assets FR Y-9C, BHCK 8725/ total assets
Interest Rate Derivatives Notional principal amounts of interest rate contracts/ total assets FR Y-9C, (BHCK A126+ BHCK 8725)/ total assets
Exchange Rate Risk Variables
Assets in Foreign Currencies Assets in foreign offices/total assets FR Y-9C, (BHCK0397+BHCK1742+BHCK1746+BHCK2081+BHCK1296)/
total assets
Foreign Exchange Deposits Deposits denominated in foreign currencies and in foreign offices/total assets FR Y-9C, (BHFN6631+BHFN6636)/ total assets
Foreign Exchange Exposures Foreign exchange exposures/ total assets FR Y-9C, BHCK8758/ total assets
Exchange Rate Derivatives for Trading Notional principal amounts of exchange rate contracts for trading purposes/total assets FR Y-9C, BHCK A127/ total assets
Exchange Rate Derivatives for Hedging Notional principal amounts of exchange rate contracts for other-than trading purposes/total assets FR Y-9C, BHCK 8726/ total assets
Exchange Rate Derivatives Notional principal amounts of exchange rate contracts /total assets FR Y-9C, (BHCK A127+ BHCK 8726)/ total assets
Credit Risk Variables
Market Liquidity (Cash+ securities + fed funds lent)/total assets FRY-9C, (BHCK0081+BHCK0395+BHCK0397+BHCK1754+BHCK1773)/
total assets
Funding Liquidity (Federal funds sold + securities purchased under agreements)/total assets FR Y-9C, (BHDMB987+BHCKB989/ total assets
Non-Performing Loans (Total amount of loans classified as non-performing )/total assets FR Y-9C, (BHCK5524+BHCK5525+BHCK5526)/ total assets
Loan Charge-Offs Loan charge-offs/total assets FR Y-9C, BHCK4635/ total assets
Loan Loss Provisions Loan loss provisions/total assets FR Y-9C, BHCK4230/ total assets
Credit Exposures Credit exposures/ total assets FR Y-9C, F186/ total assets
Credit Protection Sold Notional principal amounts of credit risk protection sold/total assets FR Y-9C, (BHCKC968+BHCKC970+BHCKC972+BHCKC974) / total assets
Credit Protection Bought Notional principal amounts of credit risk protection bought/total assets FR Y-9C, (BHCKC969+BHCKC971+BHCKC973+BHCKC975) / total assets
Net Credit Protection Bought (Credit risk protection bought - Credit risk protection sold)/total assets FR Y-9C,
((BHCKC969+BHCKC971+BHCKC973+BHCKC975)-(BHCKC968+BHCKC
970+BHCKC972+BHCKC974)) / total assets
Credit Derivatives (Credit risk protection bought + Credit risk protection sold)/total assets FR Y-9C, ((BHCKC969+BHCKC971+BHCKC973+BHCKC975)+
(BHCKC968+BHCKC970+BHCKC972+BHCKC974)) / total assets
Control Variables
Natural Log of Total Assets log (total assets) FR Y-9C, log (BHCK2170)
Total Risk-Based Capital Ratio Total capital ratio FR Y-9C, BHCK7205
GDP Growth The GDP growth in each state http://www.bea.gov/regional/
Income Tax Rate Corporate income tax rates in each state, as the data before 2000 is missing, we use the income tax
rate in 2000 to measure the corporate income tax rates from 1997-1999
www.taxfoundation.org
Crisis Equals to 1 if the growth rate of the quarterly net operate income for the whole banking system in
the U.S. is negative during the financial crisis 2007-2010, and 0 otherwise.
Large Equals to 1 if the asset of the BHCs is larger or equal to $50 billion, and 0 otherwise.
24
Table 2 Financial Derivatives Used by the U.S. BHCs (Notional principal amounts, $ billions)
Total U.S. BHCs BHCs in our sample Large BHCs in our sample
Panel A: Types of Financial Derivatives
Value Value
% of Total
Value % of Total
% of sample
Interest Rate Contracts (1) (2) (3) (4) (5) (6) Futures 5980 5710 95.48 5700 95.32 99.82
Forwards 31000 30300 97.74 30200 97.42 99.67
Exchange-traded Option 3760 3660 97.34 3660 97.34 100.00
OTC 5230 5150 98.47 5150 98.47 100.00
Swaps 171000 168000 98.25 168000 98.25 100.00
Total Interest Rate Contracts 243000 238000 97.94 237890 97.94 99.95
Exchange Rate Contracts
Futures 87 86 98.28 86 98.28 100.00
Forwards 13800 13000 96.38 13300 96.38 100.00
Exchange-traded Contracts 34 34 100.00 34 100.00 100.00
OTC 3100 3080 99.35 3080 99.35 100.00
Swaps 10300 10000 98.06 10100 98.06 100.00
Total Exchange Rate Contracts 29500 28300 96.95 28300 96.95 100.00
Credit Derivatives
Credit Default Swaps 11100 10800 97.30 10800 100.00 100.00
Total Return Swaps 179 131 73.18 131 100.00 100.00
Credit Options 97 97 100.00 97 100.00 99.69
Other Credit Derivatives 103 103 100.00 103 100.00 99.03
Total Credit Derivatives 11479 11131 96.96
11131 100.00 100.00
Total Assets 16500 14300
86.67 13200 80.00 92.31
Total Financial Derivatives 283979 277431 95.18 277321 97.65 99.96
Panel B: Financial Derivatives for Different Purposes
Interest Rate Contracts Held For
Trading 238000 234000 98.32 234000 98.32 100.00
Foreign Exchange Contracts Held For
Trading 28800 28000 97.22 28000 97.22 100.00
Credit Protection Sold 11000 10700 97.27 10700 97.27 100.00
Interest Rate Contracts Held for
Hedging 4970 4240 85.31 4190 84.31 98.82
Foreign Exchange Contracts Held for
Hedging 710 680 95.77 679 95.63 99.85
Credit Protection Bought 11300 10900 97.88 10900 97.88 100.00
Source: The financial data is for 4th quarter 2011 from Financial Statements data from Call Reports (FR Y-9Cs).
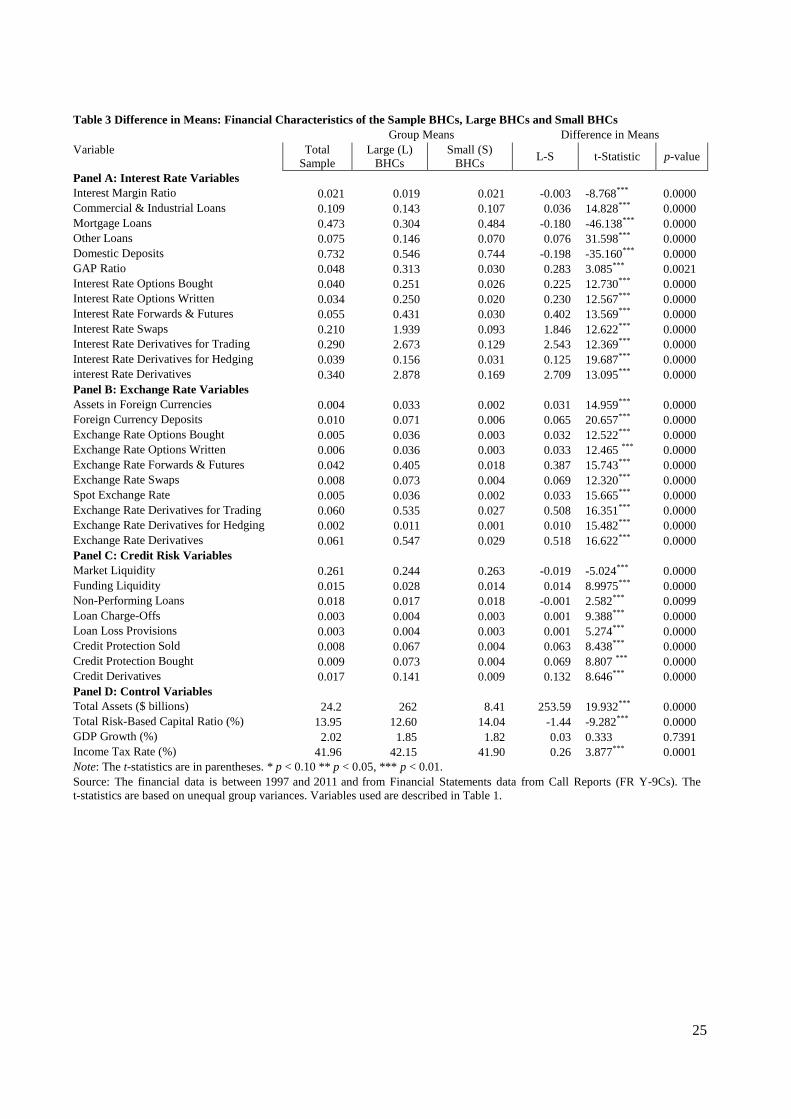
25
Table 3 Difference in Means: Financial Characteristics of the Sample BHCs, Large BHCs and Small BHCs
Group Means Difference in Means
Variable Total
Sample
Large (L)
BHCs
Small (S)
BHCs L-S t-Statistic p-value
Panel A: Interest Rate Variables
Interest Margin Ratio 0.021 0.019 0.021 -0.003 -8.768*** 0.0000
Commercial & Industrial Loans 0.109 0.143 0.107 0.036 14.828*** 0.0000
Mortgage Loans 0.473 0.304 0.484 -0.180 -46.138*** 0.0000
Other Loans 0.075 0.146 0.070 0.076 31.598*** 0.0000
Domestic Deposits 0.732 0.546 0.744 -0.198 -35.160*** 0.0000
GAP Ratio 0.048 0.313 0.030 0.283 3.085*** 0.0021
Interest Rate Options Bought 0.040 0.251 0.026 0.225 12.730*** 0.0000
Interest Rate Options Written 0.034 0.250 0.020 0.230 12.567*** 0.0000
Interest Rate Forwards & Futures 0.055 0.431 0.030 0.402 13.569*** 0.0000
Interest Rate Swaps 0.210 1.939 0.093 1.846 12.622*** 0.0000
Interest Rate Derivatives for Trading 0.290 2.673 0.129 2.543 12.369*** 0.0000
Interest Rate Derivatives for Hedging 0.039 0.156 0.031 0.125 19.687*** 0.0000
interest Rate Derivatives 0.340 2.878 0.169 2.709 13.095*** 0.0000
Panel B: Exchange Rate Variables
Assets in Foreign Currencies 0.004 0.033 0.002 0.031 14.959*** 0.0000
Foreign Currency Deposits 0.010 0.071 0.006 0.065 20.657*** 0.0000
Exchange Rate Options Bought 0.005 0.036 0.003 0.032 12.522*** 0.0000
Exchange Rate Options Written 0.006 0.036 0.003 0.033 12.465 *** 0.0000
Exchange Rate Forwards & Futures 0.042 0.405 0.018 0.387 15.743*** 0.0000
Exchange Rate Swaps 0.008 0.073 0.004 0.069 12.320*** 0.0000
Spot Exchange Rate 0.005 0.036 0.002 0.033 15.665*** 0.0000
Exchange Rate Derivatives for Trading 0.060 0.535 0.027 0.508 16.351*** 0.0000
Exchange Rate Derivatives for Hedging 0.002 0.011 0.001 0.010 15.482*** 0.0000
Exchange Rate Derivatives 0.061 0.547 0.029 0.518 16.622*** 0.0000
Panel C: Credit Risk Variables
Market Liquidity 0.261 0.244 0.263 -0.019 -5.024*** 0.0000
Funding Liquidity 0.015 0.028 0.014 0.014 8.9975*** 0.0000
Non-Performing Loans 0.018 0.017 0.018 -0.001 2.582*** 0.0099
Loan Charge-Offs 0.003 0.004 0.003 0.001 9.388*** 0.0000
Loan Loss Provisions 0.003 0.004 0.003 0.001 5.274*** 0.0000
Credit Protection Sold 0.008 0.067 0.004 0.063 8.438*** 0.0000
Credit Protection Bought 0.009 0.073 0.004 0.069 8.807 *** 0.0000
Credit Derivatives 0.017 0.141 0.009 0.132 8.646*** 0.0000
Panel D: Control Variables
Total Assets ($ billions) 24.2 262 8.41 253.59 19.932*** 0.0000
Total Risk-Based Capital Ratio (%) 13.95 12.60 14.04 -1.44 -9.282*** 0.0000
GDP Growth (%) 2.02 1.85 1.82 0.03 0.333 0.7391
Income Tax Rate (%) 41.96 42.15 41.90 0.26 3.877*** 0.0001
Note: The t-statistics are in parentheses. * p < 0.10 ** p < 0.05, *** p < 0.01.
Source: The financial data is between 1997 and 2011 and from Financial Statements data from Call Reports (FR Y-9Cs). The
t-statistics are based on unequal group variances. Variables used are described in Table 1.
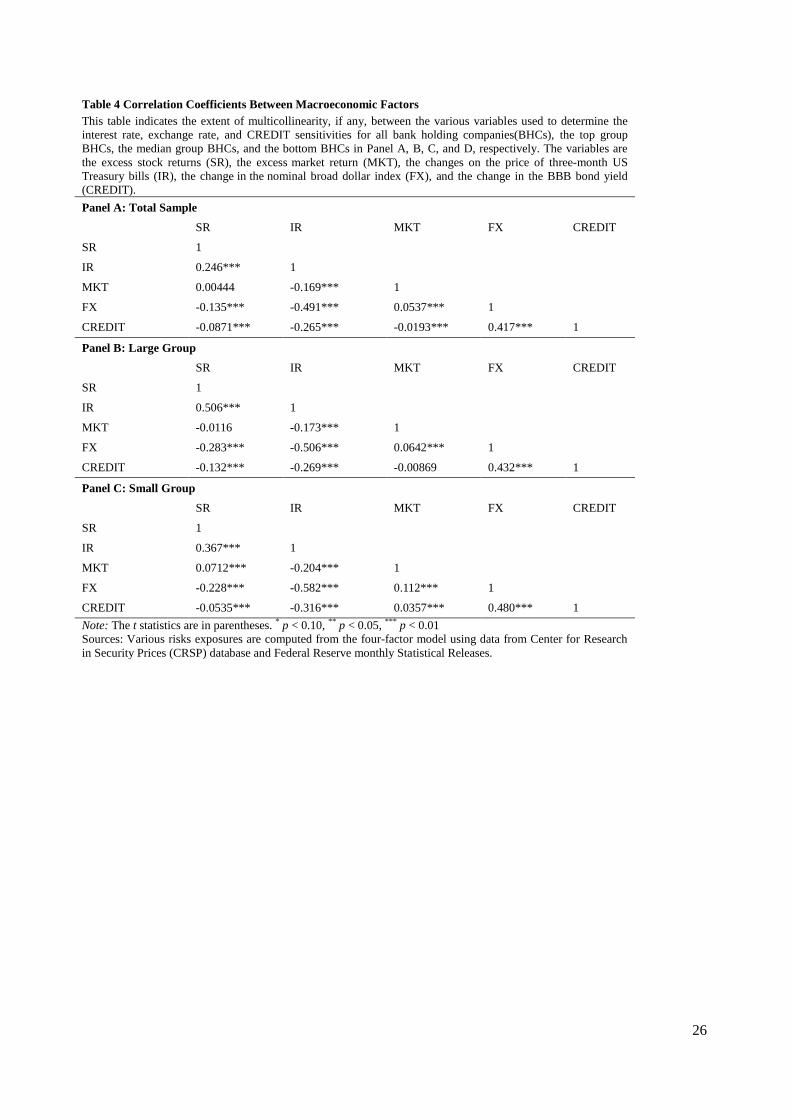
26
Table 4 Correlation Coefficients Between Macroeconomic Factors
This table indicates the extent of multicollinearity, if any, between the various variables used to determine the
interest rate, exchange rate, and CREDIT sensitivities for all bank holding companies(BHCs), the top group
BHCs, the median group BHCs, and the bottom BHCs in Panel A, B, C, and D, respectively. The variables are
the excess stock returns (SR), the excess market return (MKT), the changes on the price of three-month US
Treasury bills (IR), the change in the nominal broad dollar index (FX), and the change in the BBB bond yield
(CREDIT).
Panel A: Total Sample
SR IR MKT FX CREDIT
SR 1
IR 0.246*** 1
MKT 0.00444 -0.169*** 1
FX -0.135*** -0.491*** 0.0537*** 1
CREDIT -0.0871*** -0.265*** -0.0193*** 0.417*** 1
Panel B: Large Group
SR IR MKT FX CREDIT
SR 1
IR 0.506*** 1
MKT -0.0116 -0.173*** 1
FX -0.283*** -0.506*** 0.0642*** 1
CREDIT -0.132*** -0.269*** -0.00869 0.432*** 1
Panel C: Small Group
SR IR MKT FX CREDIT
SR 1
IR 0.367*** 1
MKT 0.0712*** -0.204*** 1
FX -0.228*** -0.582*** 0.112*** 1
CREDIT -0.0535*** -0.316*** 0.0357*** 0.480*** 1
Note: The t statistics are in parentheses. * p < 0.10, ** p < 0.05, *** p < 0.01
Sources: Various risks exposures are computed from the four-factor model using data from Center for Research
in Security Prices (CRSP) database and Federal Reserve monthly Statistical Releases.
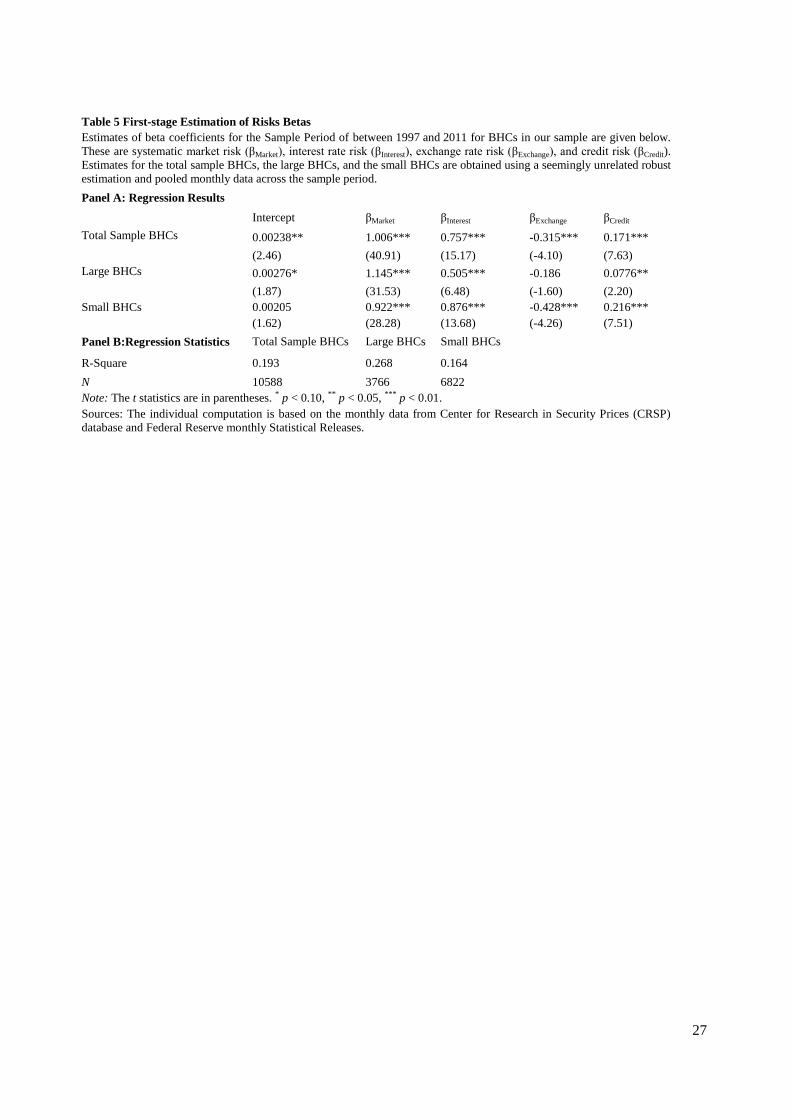
27
Table 5 First-stage Estimation of Risks Betas
Estimates of beta coefficients for the Sample Period of between 1997 and 2011 for BHCs in our sample are given below.
These are systematic market risk (βMarket), interest rate risk (βInterest), exchange rate risk (βExchange), and credit risk (βCredit).
Estimates for the total sample BHCs, the large BHCs, and the small BHCs are obtained using a seemingly unrelated robust
estimation and pooled monthly data across the sample period.
Panel A: Regression Results
Intercept βMarket βInterest βExchange βCredit
Total Sample BHCs 0.00238** 1.006*** 0.757*** -0.315*** 0.171***
(2.46) (40.91) (15.17) (-4.10) (7.63)
Large BHCs 0.00276* 1.145*** 0.505*** -0.186 0.0776**
(1.87) (31.53) (6.48) (-1.60) (2.20)
Small BHCs 0.00205 0.922*** 0.876*** -0.428*** 0.216***
(1.62) (28.28) (13.68) (-4.26) (7.51)
Panel B:Regression Statistics Total Sample BHCs Large BHCs Small BHCs
R-Square 0.193 0.268 0.164
N 10588 3766 6822
Note: The t statistics are in parentheses. * p < 0.10, ** p < 0.05, *** p < 0.01.
Sources: The individual computation is based on the monthly data from Center for Research in Security Prices (CRSP)
database and Federal Reserve monthly Statistical Releases.
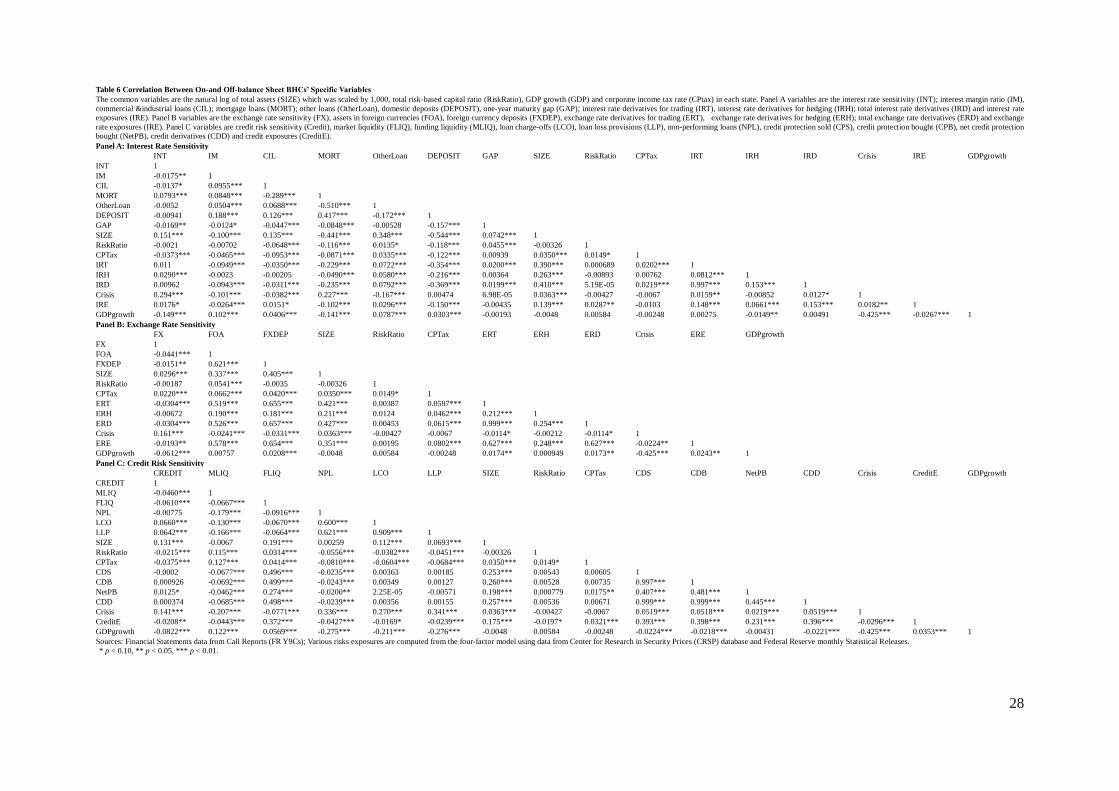
28
Table 6 Correlation Between On-and Off-balance Sheet BHCs’ Specific Variables
The common variables are the natural log of total assets (SIZE) which was scaled by 1,000, total risk-based capital ratio (RiskRatio), GDP growth (GDP) and corporate income tax rate (CPtax) in each state. Panel A variables are the interest rate sensitivity (INT); interest margin ratio (IM),
commercial &industrial loans (CIL); mortgage loans (MORT); other loans (OtherLoan), domestic deposits (DEPOSIT), one-year maturity gap (GAP); interest rate derivatives for trading (IRT), interest rate derivatives for hedging (IRH); total interest rate derivatives (IRD) and interest rate
exposures (IRE). Panel B variables are the exchange rate sensitivity (FX), assets in foreign currencies (FOA), foreign currency deposits (FXDEP), exchange rate derivatives for trading (ERT), exchange rate derivatives for hedging (ERH); total exchange rate derivatives (ERD) and exchange
rate exposures (IRE). Panel C variables are credit risk sensitivity (Credit), market liquidity (FLIQ), funding liquidity (MLIQ), loan charge-offs (LCO), loan loss provisions (LLP), non-performing loans (NPL), credit protection sold (CPS), credit protection bought (CPB), net credit protection
bought (NetPB), credit derivatives (CDD) and credit exposures (CreditE).
Panel A: Interest Rate Sensitivity
INT IM CIL MORT OtherLoan DEPOSIT GAP SIZE RiskRatio CPTax IRT IRH IRD Crisis IRE GDPgrowth
INT 1
IM -0.0175** 1
CIL -0.0137* 0.0955*** 1
MORT 0.0793*** 0.0848*** -0.289*** 1
OtherLoan -0.0052 0.0504*** 0.0688*** -0.510*** 1
DEPOSIT -0.00941 0.188*** 0.126*** 0.417*** -0.172*** 1
GAP -0.0169** -0.0124* -0.0447*** -0.0848*** -0.00528 -0.157*** 1
SIZE 0.151*** -0.100*** 0.135*** -0.441*** 0.348*** -0.544*** 0.0742*** 1
RiskRatio -0.0021 -0.00702 -0.0648*** -0.116*** 0.0135* -0.118*** 0.0455*** -0.00326 1
CPTax -0.0373*** -0.0465*** -0.0953*** -0.0871*** 0.0335*** -0.122*** 0.00939 0.0350*** 0.0149* 1
IRT 0.011 -0.0949*** -0.0350*** -0.229*** 0.0722*** -0.354*** 0.0200*** 0.390*** 0.000689 0.0202*** 1
IRH 0.0290*** -0.0023 -0.00205 -0.0490*** 0.0580*** -0.216*** 0.00364 0.263*** -0.00893 0.00762 0.0812*** 1
IRD 0.00962 -0.0943*** -0.0311*** -0.235*** 0.0792*** -0.369*** 0.0199*** 0.410*** 5.19E-05 0.0219*** 0.997*** 0.153*** 1
Crisis 0.294*** -0.101*** -0.0382*** 0.227*** -0.167*** 0.00474 6.98E-05 0.0363*** -0.00427 -0.0067 0.0159** -0.00852 0.0127* 1
IRE 0.0176* -0.0264*** 0.0151* -0.102*** 0.0296*** -0.150*** -0.00435 0.139*** 0.0287** -0.0103 0.148*** 0.0661*** 0.153*** 0.0182** 1
GDPgrowth -0.149*** 0.102*** 0.0406*** -0.141*** 0.0787*** 0.0303*** -0.00193 -0.0048 0.00584 -0.00248 0.00275 -0.0149** 0.00491 -0.425*** -0.0267*** 1
Panel B: Exchange Rate Sensitivity
FX FOA FXDEP SIZE RiskRatio CPTax ERT ERH ERD Crisis ERE GDPgrowth
FX 1
FOA -0.0441*** 1
FXDEP -0.0151** 0.621*** 1
SIZE 0.0296*** 0.337*** 0.405*** 1
RiskRatio -0.00187 0.0541*** -0.0035 -0.00326 1
CPTax 0.0220*** 0.0662*** 0.0420*** 0.0350*** 0.0149* 1
ERT -0.0304*** 0.519*** 0.655*** 0.421*** 0.00387 0.0597*** 1
ERH -0.00672 0.190*** 0.181*** 0.211*** 0.0124 0.0462*** 0.212*** 1
ERD -0.0304*** 0.526*** 0.657*** 0.427*** 0.00453 0.0615*** 0.999*** 0.254*** 1
Crisis 0.161*** -0.0241*** -0.0331*** 0.0363*** -0.00427 -0.0067 -0.0114* -0.00212 -0.0114* 1
ERE -0.0193** 0.578*** 0.654*** 0.351*** 0.00195 0.0802*** 0.627*** 0.248*** 0.627*** -0.0224** 1
GDPgrowth -0.0612*** 0.00757 0.0208*** -0.0048 0.00584 -0.00248 0.0174** 0.000949 0.0173** -0.425*** 0.0243** 1
Panel C: Credit Risk Sensitivity
CREDIT MLIQ FLIQ NPL LCO LLP SIZE RiskRatio CPTax CDS CDB NetPB CDD Crisis CreditE GDPgrowth
CREDIT 1
MLIQ -0.0460*** 1
FLIQ -0.0610*** -0.0667*** 1
NPL -0.00775 -0.179*** -0.0916*** 1
LCO 0.0660*** -0.130*** -0.0670*** 0.600*** 1
LLP 0.0642*** -0.166*** -0.0664*** 0.621*** 0.909*** 1
SIZE 0.131*** -0.0067 0.191*** 0.00259 0.112*** 0.0693*** 1
RiskRatio -0.0215*** 0.115*** 0.0314*** -0.0556*** -0.0382*** -0.0451*** -0.00326 1
CPTax -0.0375*** 0.127*** 0.0414*** -0.0810*** -0.0604*** -0.0684*** 0.0350*** 0.0149* 1
CDS -0.0002 -0.0677*** 0.496*** -0.0235*** 0.00363 0.00185 0.253*** 0.00543 0.00605 1
CDB 0.000926 -0.0692*** 0.499*** -0.0243*** 0.00349 0.00127 0.260*** 0.00528 0.00735 0.997*** 1
NetPB 0.0125* -0.0462*** 0.274*** -0.0200** 2.25E-05 -0.00571 0.198*** 0.000779 0.0175** 0.407*** 0.481*** 1
CDD 0.000374 -0.0685*** 0.498*** -0.0239*** 0.00356 0.00155 0.257*** 0.00536 0.00671 0.999*** 0.999*** 0.445*** 1
Crisis 0.141*** -0.207*** -0.0771*** 0.336*** 0.270*** 0.341*** 0.0363*** -0.00427 -0.0067 0.0519*** 0.0518*** 0.0219*** 0.0519*** 1
CreditE -0.0208** -0.0443*** 0.372*** -0.0427*** -0.0169* -0.0239*** 0.175*** -0.0197* 0.0321*** 0.393*** 0.398*** 0.231*** 0.396*** -0.0296*** 1
GDPgrowth -0.0822*** 0.122*** 0.0569*** -0.275*** -0.211*** -0.276*** -0.0048 0.00584 -0.00248 -0.0224*** -0.0218*** -0.00431 -0.0221*** -0.425*** 0.0353*** 1
Sources: Financial Statements data from Call Reports (FR Y9Cs); Various risks exposures are computed from the four-factor model using data from Center for Research in Security Prices (CRSP) database and Federal Reserve monthly Statistical Releases.
* p < 0.10, ** p < 0.05, *** p < 0.01.
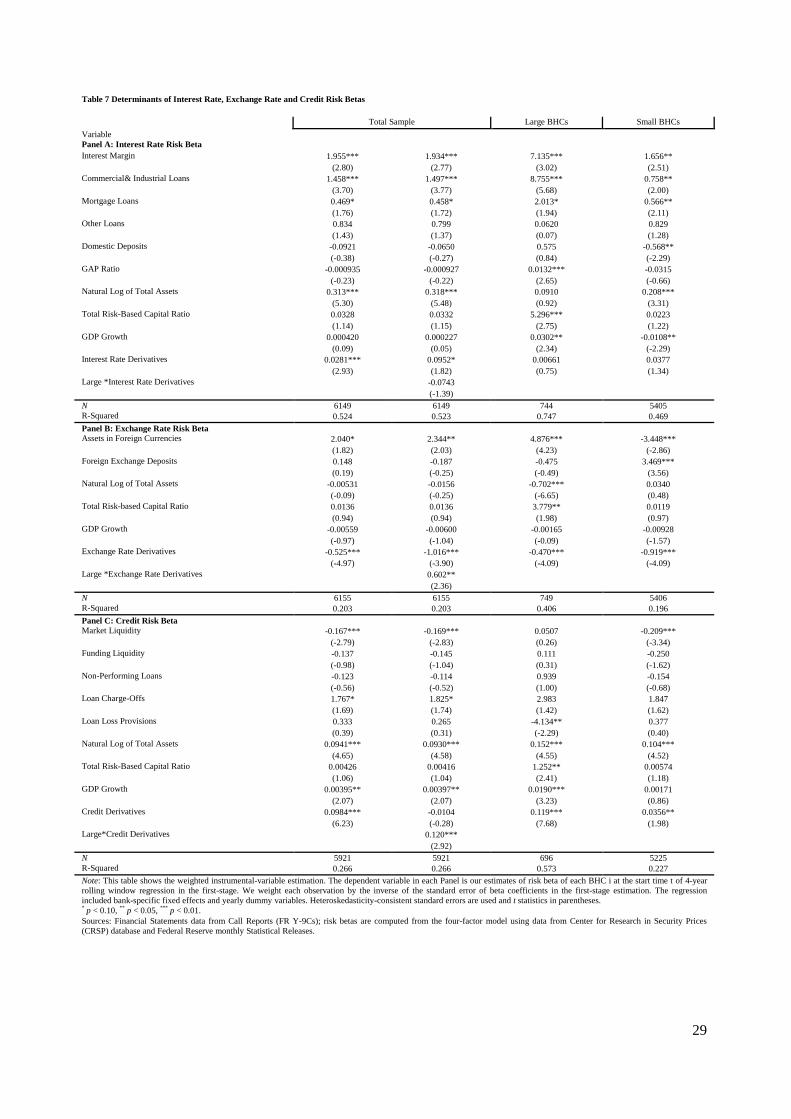
29
Table 7 Determinants of Interest Rate, Exchange Rate and Credit Risk Betas
Total Sample
Total Sample
Large BHCs Small BHCs
Variable
Panel A: Interest Rate Risk Beta
Interest Margin 1.955*** 1.934*** 7.135*** 1.656**
(2.80) (2.77) (3.02) (2.51)
Commercial& Industrial Loans 1.458*** 1.497*** 8.755*** 0.758**
(3.70) (3.77) (5.68) (2.00)
Mortgage Loans 0.469* 0.458* 2.013* 0.566**
(1.76) (1.72) (1.94) (2.11)
Other Loans 0.834 0.799 0.0620 0.829
(1.43) (1.37) (0.07) (1.28)
Domestic Deposits -0.0921 -0.0650 0.575 -0.568**
(-0.38) (-0.27) (0.84) (-2.29)
GAP Ratio -0.000935 -0.000927 0.0132*** -0.0315
(-0.23) (-0.22) (2.65) (-0.66)
Natural Log of Total Assets 0.313*** 0.318*** 0.0910 0.208***
(5.30) (5.48) (0.92) (3.31)
Total Risk-Based Capital Ratio 0.0328 0.0332 5.296*** 0.0223
(1.14) (1.15) (2.75) (1.22)
GDP Growth 0.000420 0.000227 0.0302** -0.0108**
(0.09) (0.05) (2.34) (-2.29)
Interest Rate Derivatives 0.0281*** 0.0952* 0.00661 0.0377
(2.93) (1.82) (0.75) (1.34)
Large *Interest Rate Derivatives
-0.0743
(-1.39)
N 6149 6149 744 5405
R-Squared 0.524 0.523 0.747 0.469
Panel B: Exchange Rate Risk Beta
Assets in Foreign Currencies 2.040* 2.344** 4.876*** -3.448***
(1.82) (2.03) (4.23) (-2.86)
Foreign Exchange Deposits 0.148 -0.187 -0.475 3.469***
(0.19) (-0.25) (-0.49) (3.56)
Natural Log of Total Assets -0.00531 -0.0156 -0.702*** 0.0340
(-0.09) (-0.25) (-6.65) (0.48)
Total Risk-based Capital Ratio 0.0136 0.0136 3.779** 0.0119
(0.94) (0.94) (1.98) (0.97)
GDP Growth -0.00559 -0.00600 -0.00165 -0.00928
(-0.97) (-1.04) (-0.09) (-1.57)
Exchange Rate Derivatives -0.525*** -1.016*** -0.470*** -0.919***
(-4.97) (-3.90) (-4.09) (-4.09)
Large *Exchange Rate Derivatives
0.602**
(2.36)
N 6155 6155 749 5406
R-Squared 0.203 0.203 0.406 0.196
Panel C: Credit Risk Beta
Market Liquidity -0.167*** -0.169*** 0.0507 -0.209***
(-2.79) (-2.83) (0.26) (-3.34)
Funding Liquidity -0.137 -0.145 0.111 -0.250
(-0.98) (-1.04) (0.31) (-1.62)
Non-Performing Loans -0.123 -0.114 0.939 -0.154
(-0.56) (-0.52) (1.00) (-0.68)
Loan Charge-Offs 1.767* 1.825* 2.983 1.847
(1.69) (1.74) (1.42) (1.62)
Loan Loss Provisions 0.333 0.265 -4.134** 0.377
(0.39) (0.31) (-2.29) (0.40)
Natural Log of Total Assets 0.0941*** 0.0930*** 0.152*** 0.104***
(4.65) (4.58) (4.55) (4.52)
Total Risk-Based Capital Ratio 0.00426 0.00416 1.252** 0.00574
(1.06) (1.04) (2.41) (1.18)
GDP Growth 0.00395** 0.00397** 0.0190*** 0.00171
(2.07) (2.07) (3.23) (0.86)
Credit Derivatives 0.0984*** -0.0104 0.119*** 0.0356**
(6.23) (-0.28) (7.68) (1.98)
Large*Credit Derivatives
0.120***
(2.92)
N 5921 5921 696 5225
R-Squared 0.266 0.266 0.573 0.227
Note: This table shows the weighted instrumental-variable estimation. The dependent variable in each Panel is our estimates of risk beta of each BHC i at the start time t of 4-year
rolling window regression in the first-stage. We weight each observation by the inverse of the standard error of beta coefficients in the first-stage estimation. The regression
included bank-specific fixed effects and yearly dummy variables. Heteroskedasticity-consistent standard errors are used and t statistics in parentheses. * p < 0.10,
** p < 0.05,
*** p < 0.01.
Sources: Financial Statements data from Call Reports (FR Y-9Cs); risk betas are computed from the four-factor model using data from Center for Research in Security Prices
(CRSP) database and Federal Reserve monthly Statistical Releases.
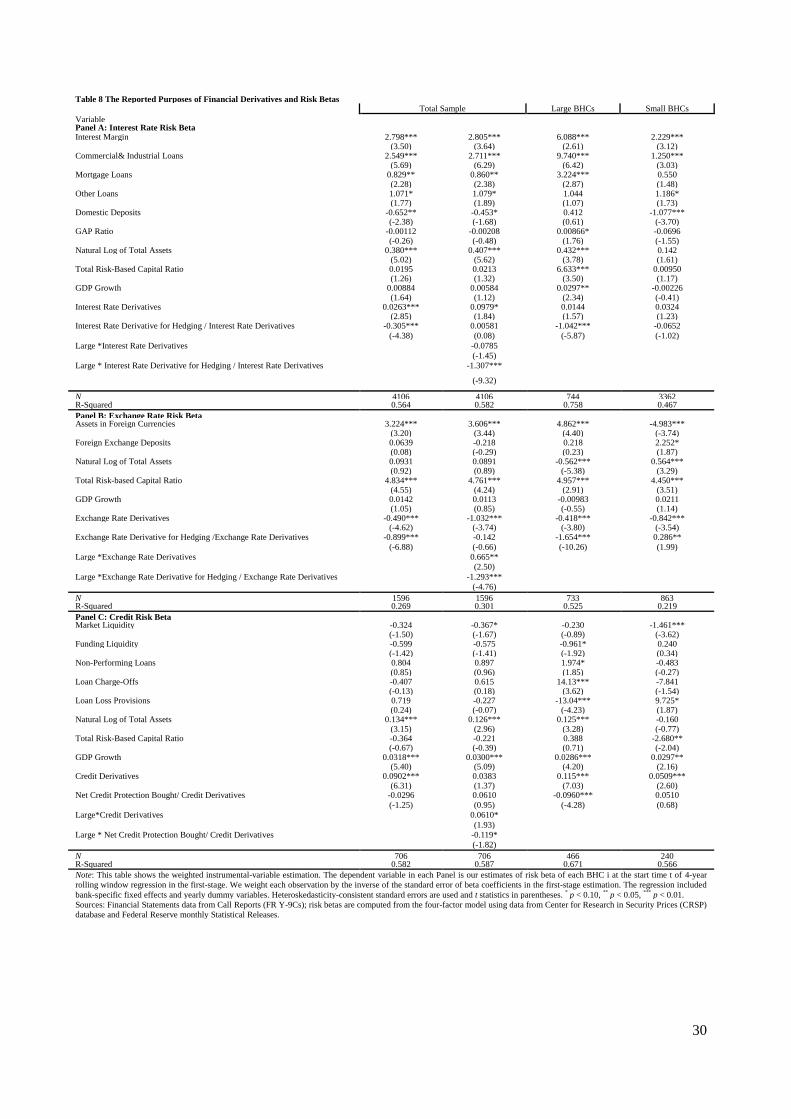
30
Table 8 The Reported Purposes of Financial Derivatives and Risk Betas Total Sample
Total Sample
Large BHCs Small BHCs
Variable Panel A: Interest Rate Risk Beta Interest Margin 2.798*** 2.805*** 6.088*** 2.229*** (3.50) (3.64) (2.61) (3.12) Commercial& Industrial Loans 2.549*** 2.711*** 9.740*** 1.250*** (5.69) (6.29) (6.42) (3.03) Mortgage Loans 0.829** 0.860** 3.224*** 0.550 (2.28) (2.38) (2.87) (1.48) Other Loans 1.071* 1.079* 1.044 1.186* (1.77) (1.89) (1.07) (1.73) Domestic Deposits -0.652** -0.453* 0.412 -1.077*** (-2.38) (-1.68) (0.61) (-3.70) GAP Ratio -0.00112 -0.00208 0.00866* -0.0696 (-0.26) (-0.48) (1.76) (-1.55) Natural Log of Total Assets 0.380*** 0.407*** 0.432*** 0.142 (5.02) (5.62) (3.78) (1.61) Total Risk-Based Capital Ratio 0.0195 0.0213 6.633*** 0.00950 (1.26) (1.32) (3.50) (1.17) GDP Growth 0.00884 0.00584 0.0297** -0.00226 (1.64) (1.12) (2.34) (-0.41) Interest Rate Derivatives 0.0263*** 0.0979* 0.0144 0.0324 (2.85) (1.84) (1.57) (1.23) Interest Rate Derivative for Hedging / Interest Rate Derivatives
-0.305*** 0.00581 -1.042*** -0.0652
(-4.38) (0.08) (-5.87) (-1.02)
Large *Interest Rate Derivatives
-0.0785
(-1.45)
Large * Interest Rate Derivative for Hedging / Interest Rate Derivatives
-1.307***
(-9.32)
N 4106 4106 744 3362 R-Squared 0.564 0.582 0.758 0.467
Panel B: Exchange Rate Risk Beta Assets in Foreign Currencies 3.224*** 3.606*** 4.862*** -4.983*** (3.20) (3.44) (4.40) (-3.74) Foreign Exchange Deposits 0.0639 -0.218 0.218 2.252* (0.08) (-0.29) (0.23) (1.87) Natural Log of Total Assets 0.0931 0.0891 -0.562*** 0.564*** (0.92) (0.89) (-5.38) (3.29) Total Risk-based Capital Ratio 4.834*** 4.761*** 4.957*** 4.450*** (4.55) (4.24) (2.91) (3.51) GDP Growth 0.0142 0.0113 -0.00983 0.0211 (1.05) (0.85) (-0.55) (1.14) Exchange Rate Derivatives -0.490*** -1.032*** -0.418*** -0.842*** (-4.62) (-3.74) (-3.80) (-3.54) Exchange Rate Derivative for Hedging /Exchange Rate Derivatives
-0.899*** -0.142 -1.654*** 0.286**
(-6.88) (-0.66) (-10.26) (1.99)
Large *Exchange Rate Derivatives
0.665**
(2.50)
Large *Exchange Rate Derivative for Hedging / Exchange Rate Derivatives
-1.293***
(-4.76)
N 1596 1596 733 863 R-Squared 0.269 0.301 0.525 0.219
Panel C: Credit Risk Beta Market Liquidity -0.324 -0.367* -0.230 -1.461*** (-1.50) (-1.67) (-0.89) (-3.62) Funding Liquidity -0.599 -0.575 -0.961* 0.240 (-1.42) (-1.41) (-1.92) (0.34) Non-Performing Loans 0.804 0.897 1.974* -0.483 (0.85) (0.96) (1.85) (-0.27) Loan Charge-Offs -0.407 0.615 14.13*** -7.841 (-0.13) (0.18) (3.62) (-1.54) Loan Loss Provisions 0.719 -0.227 -13.04*** 9.725* (0.24) (-0.07) (-4.23) (1.87) Natural Log of Total Assets 0.134*** 0.126*** 0.125*** -0.160 (3.15) (2.96) (3.28) (-0.77) Total Risk-Based Capital Ratio -0.364 -0.221 0.388 -2.680** (-0.67) (-0.39) (0.71) (-2.04) GDP Growth 0.0318*** 0.0300*** 0.0286*** 0.0297** (5.40) (5.09) (4.20) (2.16) Credit Derivatives 0.0902*** 0.0383 0.115*** 0.0509*** (6.31) (1.37) (7.03) (2.60) Net Credit Protection Bought/ Credit Derivatives -0.0296 0.0610 -0.0960*** 0.0510
(-1.25) (0.95) (-4.28) (0.68)
Large*Credit Derivatives
0.0610*
(1.93)
Large * Net Credit Protection Bought/ Credit Derivatives
-0.119*
(-1.82)
N 706 706 466 240 R-Squared 0.582 0.587 0.671 0.566
Note: This table shows the weighted instrumental-variable estimation. The dependent variable in each Panel is our estimates of risk beta of each BHC i at the start time t of 4-year
rolling window regression in the first-stage. We weight each observation by the inverse of the standard error of beta coefficients in the first-stage estimation. The regression included
bank-specific fixed effects and yearly dummy variables. Heteroskedasticity-consistent standard errors are used and t statistics in parentheses. * p < 0.10,
** p < 0.05,
*** p < 0.01.
Sources: Financial Statements data from Call Reports (FR Y-9Cs); risk betas are computed from the four-factor model using data from Center for Research in Security Prices (CRSP)
database and Federal Reserve monthly Statistical Releases.
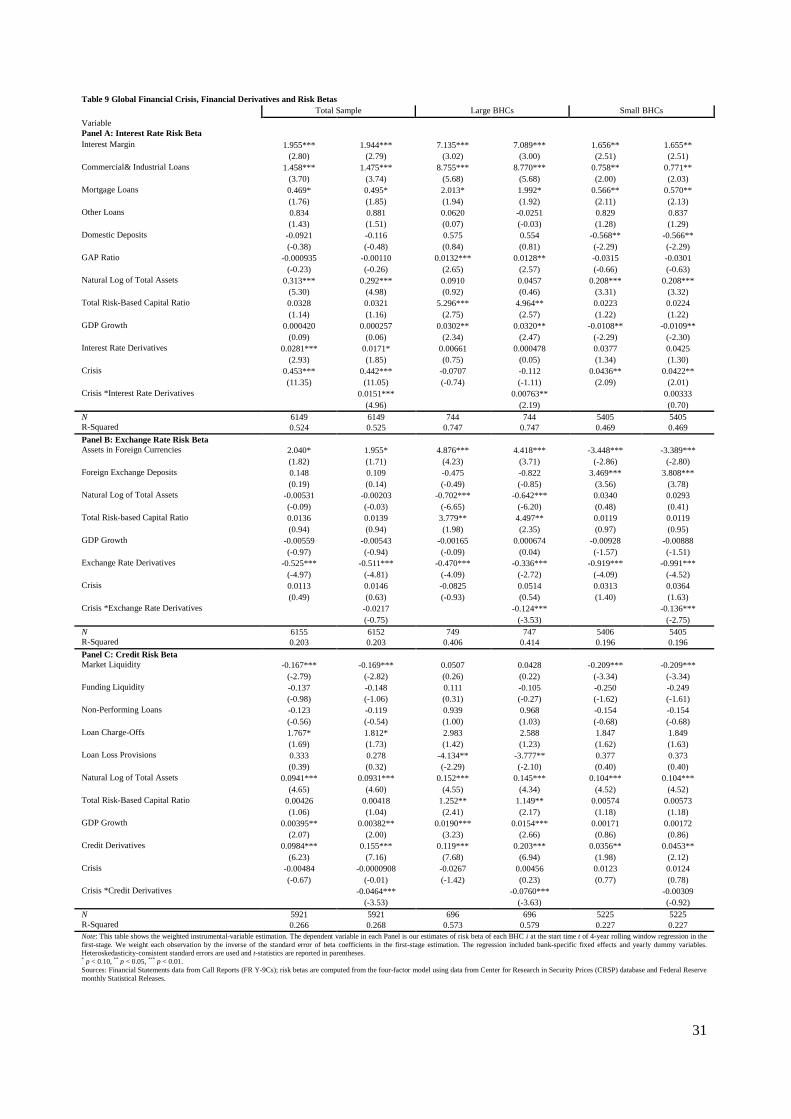
31
Table 9 Global Financial Crisis, Financial Derivatives and Risk Betas
Total Sample Large BHCs Small BHCs
Variable
Panel A: Interest Rate Risk Beta
Interest Margin 1.955*** 1.944*** 7.135*** 7.089*** 1.656** 1.655**
(2.80) (2.79) (3.02) (3.00) (2.51) (2.51)
Commercial& Industrial Loans 1.458*** 1.475*** 8.755*** 8.770*** 0.758** 0.771**
(3.70) (3.74) (5.68) (5.68) (2.00) (2.03)
Mortgage Loans 0.469* 0.495* 2.013* 1.992* 0.566** 0.570**
(1.76) (1.85) (1.94) (1.92) (2.11) (2.13)
Other Loans 0.834 0.881 0.0620 -0.0251 0.829 0.837
(1.43) (1.51) (0.07) (-0.03) (1.28) (1.29)
Domestic Deposits -0.0921 -0.116 0.575 0.554 -0.568** -0.566**
(-0.38) (-0.48) (0.84) (0.81) (-2.29) (-2.29)
GAP Ratio -0.000935 -0.00110 0.0132*** 0.0128** -0.0315 -0.0301
(-0.23) (-0.26) (2.65) (2.57) (-0.66) (-0.63)
Natural Log of Total Assets 0.313*** 0.292*** 0.0910 0.0457 0.208*** 0.208***
(5.30) (4.98) (0.92) (0.46) (3.31) (3.32)
Total Risk-Based Capital Ratio 0.0328 0.0321 5.296*** 4.964** 0.0223 0.0224
(1.14) (1.16) (2.75) (2.57) (1.22) (1.22)
GDP Growth 0.000420 0.000257 0.0302** 0.0320** -0.0108** -0.0109**
(0.09) (0.06) (2.34) (2.47) (-2.29) (-2.30)
Interest Rate Derivatives 0.0281*** 0.0171* 0.00661 0.000478 0.0377 0.0425
(2.93) (1.85) (0.75) (0.05) (1.34) (1.30)
Crisis 0.453*** 0.442*** -0.0707 -0.112 0.0436** 0.0422**
(11.35) (11.05) (-0.74) (-1.11) (2.09) (2.01)
Crisis *Interest Rate Derivatives
0.0151***
0.00763**
0.00333
(4.96)
(2.19)
(0.70)
N 6149 6149 744 744 5405 5405
R-Squared 0.524 0.525 0.747 0.747 0.469 0.469
Panel B: Exchange Rate Risk Beta
Assets in Foreign Currencies 2.040* 1.955* 4.876*** 4.418*** -3.448*** -3.389***
(1.82) (1.71) (4.23) (3.71) (-2.86) (-2.80)
Foreign Exchange Deposits 0.148 0.109 -0.475 -0.822 3.469*** 3.808***
(0.19) (0.14) (-0.49) (-0.85) (3.56) (3.78)
Natural Log of Total Assets -0.00531 -0.00203 -0.702*** -0.642*** 0.0340 0.0293
(-0.09) (-0.03) (-6.65) (-6.20) (0.48) (0.41)
Total Risk-based Capital Ratio 0.0136 0.0139 3.779** 4.497** 0.0119 0.0119
(0.94) (0.94) (1.98) (2.35) (0.97) (0.95)
GDP Growth -0.00559 -0.00543 -0.00165 0.000674 -0.00928 -0.00888
(-0.97) (-0.94) (-0.09) (0.04) (-1.57) (-1.51)
Exchange Rate Derivatives -0.525*** -0.511*** -0.470*** -0.336*** -0.919*** -0.991***
(-4.97) (-4.81) (-4.09) (-2.72) (-4.09) (-4.52)
Crisis 0.0113 0.0146 -0.0825 0.0514 0.0313 0.0364
(0.49) (0.63) (-0.93) (0.54) (1.40) (1.63)
Crisis *Exchange Rate Derivatives
-0.0217
-0.124***
-0.136***
(-0.75)
(-3.53)
(-2.75)
N 6155 6152 749 747 5406 5405
R-Squared 0.203 0.203 0.406 0.414 0.196 0.196
Panel C: Credit Risk Beta
Market Liquidity -0.167*** -0.169*** 0.0507 0.0428 -0.209*** -0.209***
(-2.79) (-2.82) (0.26) (0.22) (-3.34) (-3.34)
Funding Liquidity -0.137 -0.148 0.111 -0.105 -0.250 -0.249
(-0.98) (-1.06) (0.31) (-0.27) (-1.62) (-1.61)
Non-Performing Loans -0.123 -0.119 0.939 0.968 -0.154 -0.154
(-0.56) (-0.54) (1.00) (1.03) (-0.68) (-0.68)
Loan Charge-Offs 1.767* 1.812* 2.983 2.588 1.847 1.849
(1.69) (1.73) (1.42) (1.23) (1.62) (1.63)
Loan Loss Provisions 0.333 0.278 -4.134** -3.777** 0.377 0.373
(0.39) (0.32) (-2.29) (-2.10) (0.40) (0.40)
Natural Log of Total Assets 0.0941*** 0.0931*** 0.152*** 0.145*** 0.104*** 0.104***
(4.65) (4.60) (4.55) (4.34) (4.52) (4.52)
Total Risk-Based Capital Ratio 0.00426 0.00418 1.252** 1.149** 0.00574 0.00573
(1.06) (1.04) (2.41) (2.17) (1.18) (1.18)
GDP Growth 0.00395** 0.00382** 0.0190*** 0.0154*** 0.00171 0.00172
(2.07) (2.00) (3.23) (2.66) (0.86) (0.86)
Credit Derivatives 0.0984*** 0.155*** 0.119*** 0.203*** 0.0356** 0.0453**
(6.23) (7.16) (7.68) (6.94) (1.98) (2.12)
Crisis -0.00484 -0.0000908 -0.0267 0.00456 0.0123 0.0124
(-0.67) (-0.01) (-1.42) (0.23) (0.77) (0.78)
Crisis *Credit Derivatives
-0.0464***
-0.0760***
-0.00309
(-3.53)
(-3.63)
(-0.92)
N 5921 5921 696 696 5225 5225
R-Squared 0.266 0.268 0.573 0.579 0.227 0.227
Note: This table shows the weighted instrumental-variable estimation. The dependent variable in each Panel is our estimates of risk beta of each BHC i at the start time t of 4-year rolling window regression in the
first-stage. We weight each observation by the inverse of the standard error of beta coefficients in the first-stage estimation. The regression included bank-specific fixed effects and yearly dummy variables. Heteroskedasticity-consistent standard errors are used and t-statistics are reported in parentheses. * p < 0.10,
** p < 0.05,
*** p < 0.01.
Sources: Financial Statements data from Call Reports (FR Y-9Cs); risk betas are computed from the four-factor model using data from Center for Research in Security Prices (CRSP) database and Federal Reserve
monthly Statistical Releases.
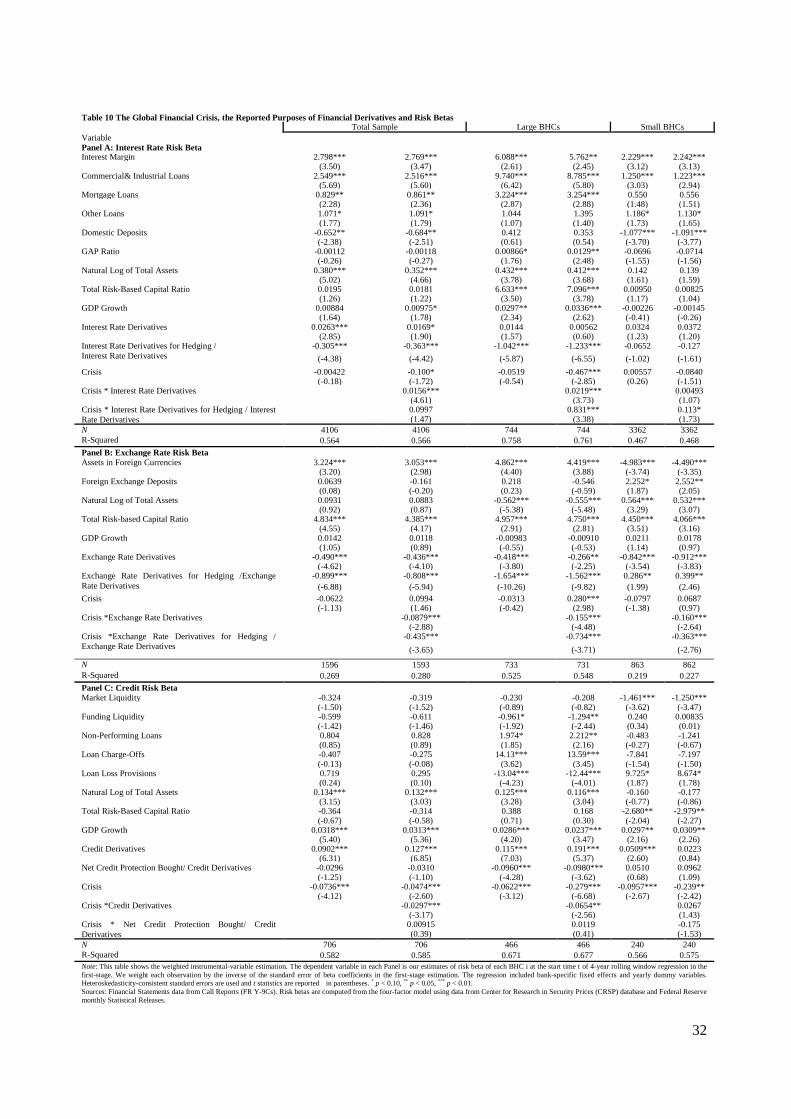
32
Table 10 The Global Financial Crisis, the Reported Purposes of Financial Derivatives and Risk Betas Total Sample Large BHCs Small BHCs
Variable
Panel A: Interest Rate Risk Beta Interest Margin 2.798*** 2.769*** 6.088*** 5.762** 2.229*** 2.242*** (3.50) (3.47) (2.61) (2.45) (3.12) (3.13) Commercial& Industrial Loans 2.549*** 2.516*** 9.740*** 8.785*** 1.250*** 1.223***
(5.69) (5.60) (6.42) (5.80) (3.03) (2.94) Mortgage Loans 0.829** 0.861** 3.224*** 3.254*** 0.550 0.556 (2.28) (2.36) (2.87) (2.88) (1.48) (1.51) Other Loans 1.071* 1.091* 1.044 1.395 1.186* 1.130* (1.77) (1.79) (1.07) (1.40) (1.73) (1.65) Domestic Deposits -0.652** -0.684** 0.412 0.353 -1.077*** -1.091*** (-2.38) (-2.51) (0.61) (0.54) (-3.70) (-3.77) GAP Ratio -0.00112 -0.00118 0.00866* 0.0129** -0.0696 -0.0714 (-0.26) (-0.27) (1.76) (2.48) (-1.55) (-1.56) Natural Log of Total Assets 0.380*** 0.352*** 0.432*** 0.412*** 0.142 0.139
(5.02) (4.66) (3.78) (3.68) (1.61) (1.59) Total Risk-Based Capital Ratio 0.0195 0.0181 6.633*** 7.096*** 0.00950 0.00825
(1.26) (1.22) (3.50) (3.78) (1.17) (1.04) GDP Growth 0.00884 0.00975* 0.0297** 0.0336*** -0.00226 -0.00145 (1.64) (1.78) (2.34) (2.62) (-0.41) (-0.26) Interest Rate Derivatives 0.0263*** 0.0169* 0.0144 0.00562 0.0324 0.0372 (2.85) (1.90) (1.57) (0.60) (1.23) (1.20) Interest Rate Derivatives for Hedging /
Interest Rate Derivatives
-0.305*** -0.363*** -1.042*** -1.233*** -0.0652 -0.127
(-4.38) (-4.42) (-5.87) (-6.55) (-1.02) (-1.61)
Crisis -0.00422 -0.100* -0.0519 -0.467*** 0.00557 -0.0840 (-0.18) (-1.72) (-0.54) (-2.85) (0.26) (-1.51) Crisis * Interest Rate Derivatives
0.0156***
0.0219***
0.00493
(4.61)
(3.73)
(1.07) Crisis * Interest Rate Derivatives for Hedging / Interest
Rate Derivatives
0.0997
0.831***
0.113*
(1.47)
(3.38)
(1.73)
N 4106 4106 744 744 3362 3362
R-Squared 0.564 0.566 0.758 0.761 0.467 0.468
Panel B: Exchange Rate Risk Beta
Assets in Foreign Currencies 3.224*** 3.053*** 4.862*** 4.419*** -4.983*** -4.490*** (3.20) (2.98) (4.40) (3.88) (-3.74) (-3.35)
Foreign Exchange Deposits 0.0639 -0.161 0.218 -0.546 2.252* 2.552** (0.08) (-0.20) (0.23) (-0.59) (1.87) (2.05)
Natural Log of Total Assets 0.0931 0.0883 -0.562*** -0.555*** 0.564*** 0.532*** (0.92) (0.87) (-5.38) (-5.48) (3.29) (3.07)
Total Risk-based Capital Ratio 4.834*** 4.385*** 4.957*** 4.750*** 4.450*** 4.066*** (4.55) (4.17) (2.91) (2.81) (3.51) (3.16)
GDP Growth 0.0142 0.0118 -0.00983 -0.00910 0.0211 0.0178 (1.05) (0.89) (-0.55) (-0.53) (1.14) (0.97) Exchange Rate Derivatives
-0.490*** -0.436*** -0.418*** -0.266** -0.842*** -0.912*** (-4.62) (-4.10) (-3.80) (-2.25) (-3.54) (-3.83)
Exchange Rate Derivatives for Hedging /Exchange
Rate Derivatives
-0.899*** -0.808*** -1.654*** -1.562*** 0.286** 0.399**
(-6.88) (-5.94) (-10.26) (-9.82) (1.99) (2.46)
Crisis -0.0622 0.0994 -0.0313 0.280*** -0.0797 0.0687 (-1.13) (1.46) (-0.42) (2.98) (-1.38) (0.97) Crisis *Exchange Rate Derivatives
-0.0879***
-0.155***
-0.160***
(-2.88)
(-4.48)
(-2.64) Crisis *Exchange Rate Derivatives for Hedging /
Exchange Rate Derivatives
-0.435***
-0.734***
-0.363***
(-3.65)
(-3.71)
(-2.76)
N 1596 1593 733 731 863 862
R-Squared 0.269 0.280 0.525 0.548 0.219 0.227
Panel C: Credit Risk Beta
Market Liquidity -0.324 -0.319 -0.230 -0.208 -1.461*** -1.250*** (-1.50) (-1.52) (-0.89) (-0.82) (-3.62) (-3.47) Funding Liquidity -0.599 -0.611 -0.961* -1.294** 0.240 0.00835 (-1.42) (-1.46) (-1.92) (-2.44) (0.34) (0.01) Non-Performing Loans 0.804 0.828 1.974* 2.212** -0.483 -1.241 (0.85) (0.89) (1.85) (2.16) (-0.27) (-0.67) Loan Charge-Offs -0.407 -0.275 14.13*** 13.59*** -7.841 -7.197 (-0.13) (-0.08) (3.62) (3.45) (-1.54) (-1.50) Loan Loss Provisions 0.719 0.295 -13.04*** -12.44*** 9.725* 8.674* (0.24) (0.10) (-4.23) (-4.01) (1.87) (1.78) Natural Log of Total Assets 0.134*** 0.132*** 0.125*** 0.116*** -0.160 -0.177
(3.15) (3.03) (3.28) (3.04) (-0.77) (-0.86) Total Risk-Based Capital Ratio -0.364 -0.314 0.388 0.168 -2.680** -2.979**
(-0.67) (-0.58) (0.71) (0.30) (-2.04) (-2.27) GDP Growth 0.0318*** 0.0313*** 0.0286*** 0.0237*** 0.0297** 0.0309** (5.40) (5.36) (4.20) (3.47) (2.16) (2.26) Credit Derivatives 0.0902*** 0.127*** 0.115*** 0.191*** 0.0509*** 0.0223 (6.31) (6.85) (7.03) (5.37) (2.60) (0.84) Net Credit Protection Bought/ Credit Derivatives -0.0296 -0.0310 -0.0960*** -0.0980*** 0.0510 0.0962
(-1.25) (-1.10) (-4.28) (-3.62) (0.68) (1.09) Crisis -0.0736*** -0.0474*** -0.0622*** -0.279*** -0.0957*** -0.239** (-4.12) (-2.60) (-3.12) (-6.68) (-2.67) (-2.42) Crisis *Credit Derivatives
-0.0297***
-0.0654**
0.0267
(-3.17)
(-2.56)
(1.43) Crisis * Net Credit Protection Bought/ Credit
Derivatives
0.00915
0.0119
-0.175
(0.39)
(0.41)
(-1.53)
N 706 706 466 466 240 240
R-Squared 0.582 0.585 0.671 0.677 0.566 0.575
Note: This table shows the weighted instrumental-variable estimation. The dependent variable in each Panel is our estimates of risk beta of each BHC i at the start time t of 4-year rolling window regression in the
first-stage. We weight each observation by the inverse of the standard error of beta coefficients in the first-stage estimation. The regression included bank-specific fixed effects and yearly dummy variables. Heteroskedasticity-consistent standard errors are used and t statistics are reported in parentheses.
* p < 0.10,
** p < 0.05,
*** p < 0.01.
Sources: Financial Statements data from Call Reports (FR Y-9Cs). Risk betas are computed from the four-factor model using data from Center for Research in Security Prices (CRSP) database and Federal Reserve
monthly Statistical Releases.
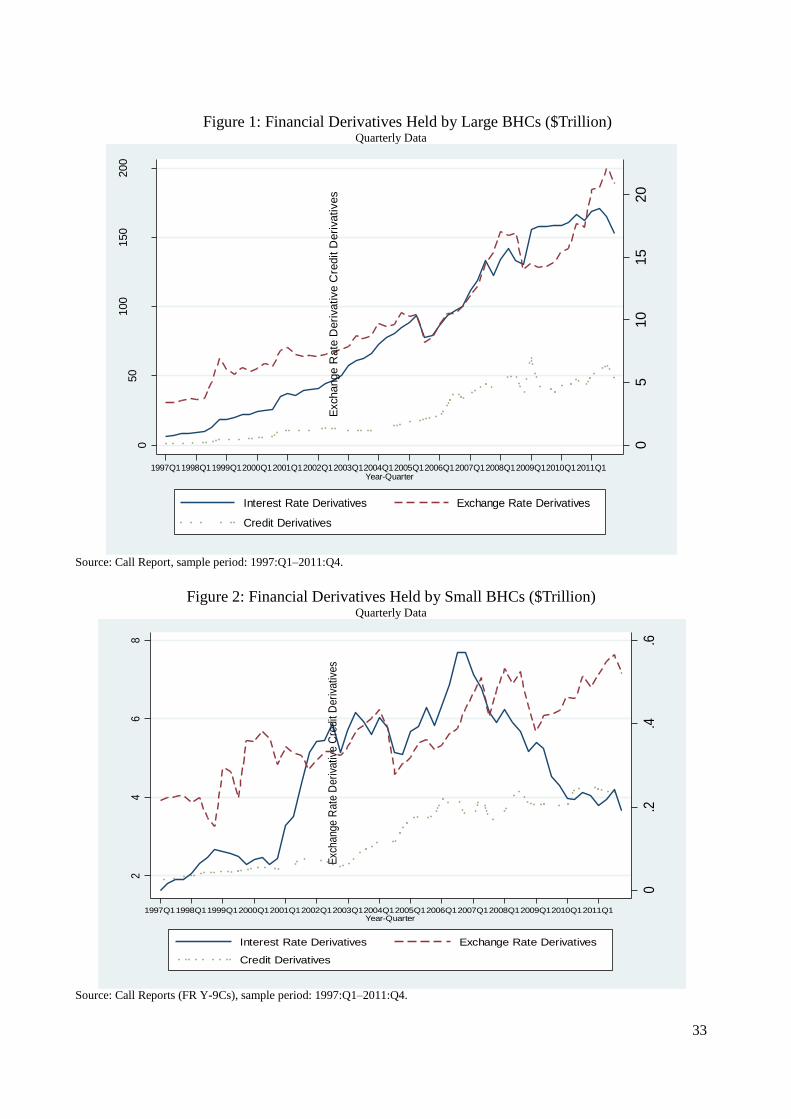
33
Figure 1: Financial Derivatives Held by Large BHCs ($Trillion) Quarterly Data
Source: Call Report, sample period: 1997:Q1–2011:Q4.
Figure 2: Financial Derivatives Held by Small BHCs ($Trillion) Quarterly Data
Source: Call Reports (FR Y-9Cs), sample period: 1997:Q1–2011:Q4.
05
10
15
20
Exchange R
ate
Deri
vative C
redit D
eri
vatives
050
100
150
200
Inte
rest
Rate
Deri
vative
1997Q11998Q11999Q12000Q12001Q12002Q12003Q12004Q12005Q12006Q12007Q12008Q12009Q12010Q12011Q1Year-Quarter
Interest Rate Derivatives Exchange Rate Derivatives
Credit Derivatives
0.2
.4.6
Exc
hange R
ate
Deri
vative
Cre
dit D
eri
vative
s
24
68
Inte
rest
Rate
Deri
vative
1997Q11998Q11999Q12000Q12001Q12002Q12003Q12004Q12005Q12006Q12007Q12008Q12009Q12010Q12011Q1Year-Quarter
Interest Rate Derivatives Exchange Rate Derivatives
Credit Derivatives
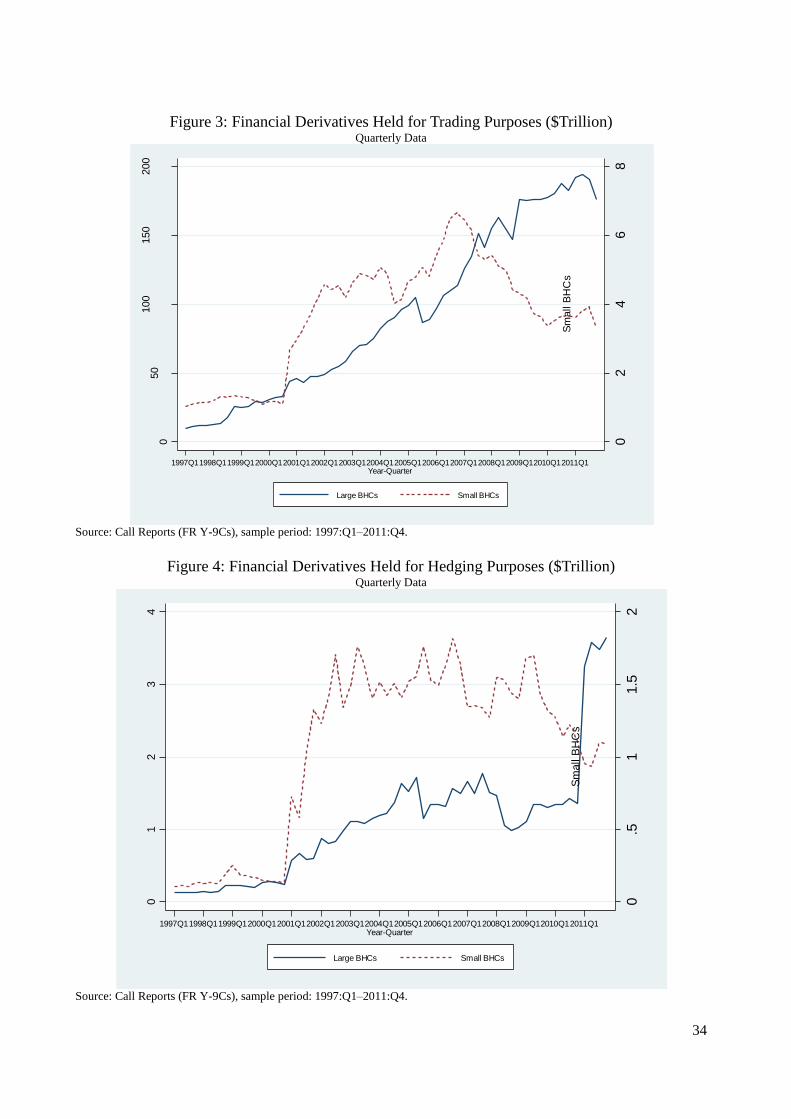
34
Figure 3: Financial Derivatives Held for Trading Purposes ($Trillion) Quarterly Data
Source: Call Reports (FR Y-9Cs), sample period: 1997:Q1–2011:Q4.
Figure 4: Financial Derivatives Held for Hedging Purposes ($Trillion) Quarterly Data
Source: Call Reports (FR Y-9Cs), sample period: 1997:Q1–2011:Q4.
02
46
8
Sm
all B
HC
s
050
100
150
200
Larg
e B
HC
s
1997Q11998Q11999Q12000Q12001Q12002Q12003Q12004Q12005Q12006Q12007Q12008Q12009Q12010Q12011Q1Year-Quarter
Large BHCs Small BHCs
0.5
11.5
2
Sm
all B
HC
s
01
23
4
Larg
e B
HC
s
1997Q11998Q11999Q12000Q12001Q12002Q12003Q12004Q12005Q12006Q12007Q12008Q12009Q12010Q12011Q1Year-Quarter
Large BHCs Small BHCs
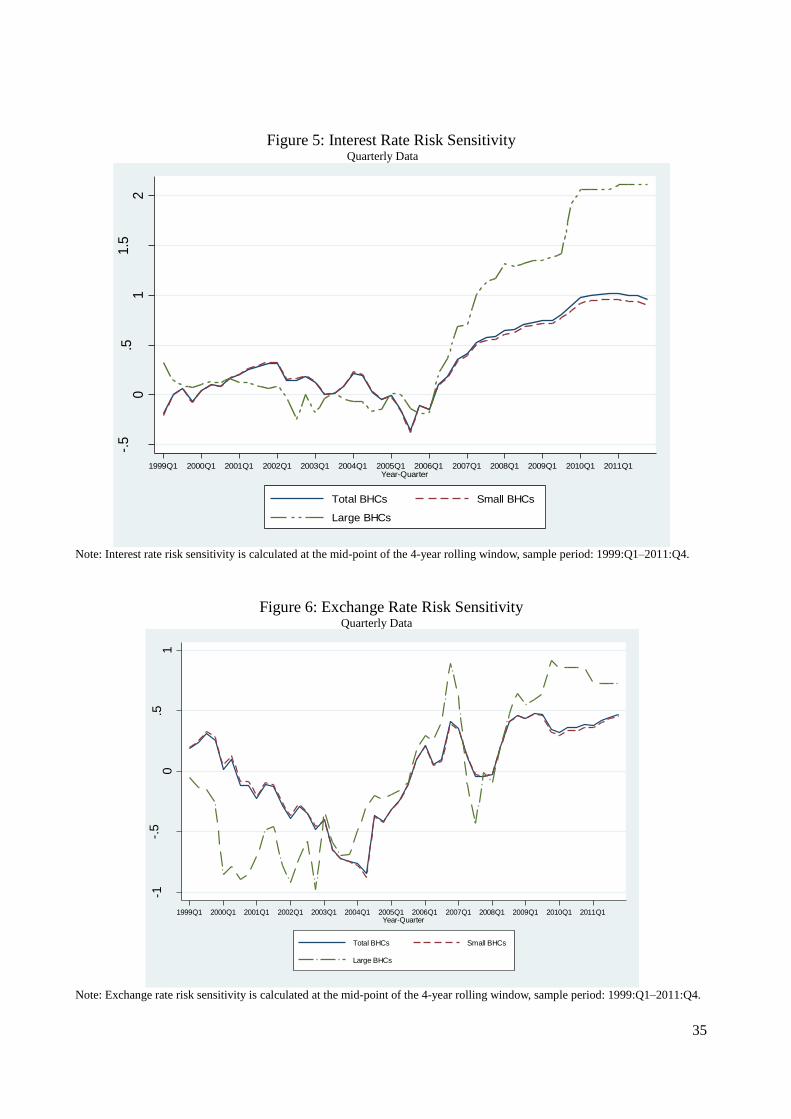
35
Figure 5: Interest Rate Risk Sensitivity Quarterly Data
Note: Interest rate risk sensitivity is calculated at the mid-point of the 4-year rolling window, sample period: 1999:Q1–2011:Q4.
Figure 6: Exchange Rate Risk Sensitivity Quarterly Data
Note: Exchange rate risk sensitivity is calculated at the mid-point of the 4-year rolling window, sample period: 1999:Q1–2011:Q4.
-.5
0.5
11.5
2
1999Q1 2000Q1 2001Q1 2002Q1 2003Q1 2004Q1 2005Q1 2006Q1 2007Q1 2008Q1 2009Q1 2010Q1 2011Q1Year-Quarter
Total BHCs Small BHCs
Large BHCs
-1-.
50
.51
1999Q1 2000Q1 2001Q1 2002Q1 2003Q1 2004Q1 2005Q1 2006Q1 2007Q1 2008Q1 2009Q1 2010Q1 2011Q1Year-Quarter
Total BHCs Small BHCs
Large BHCs
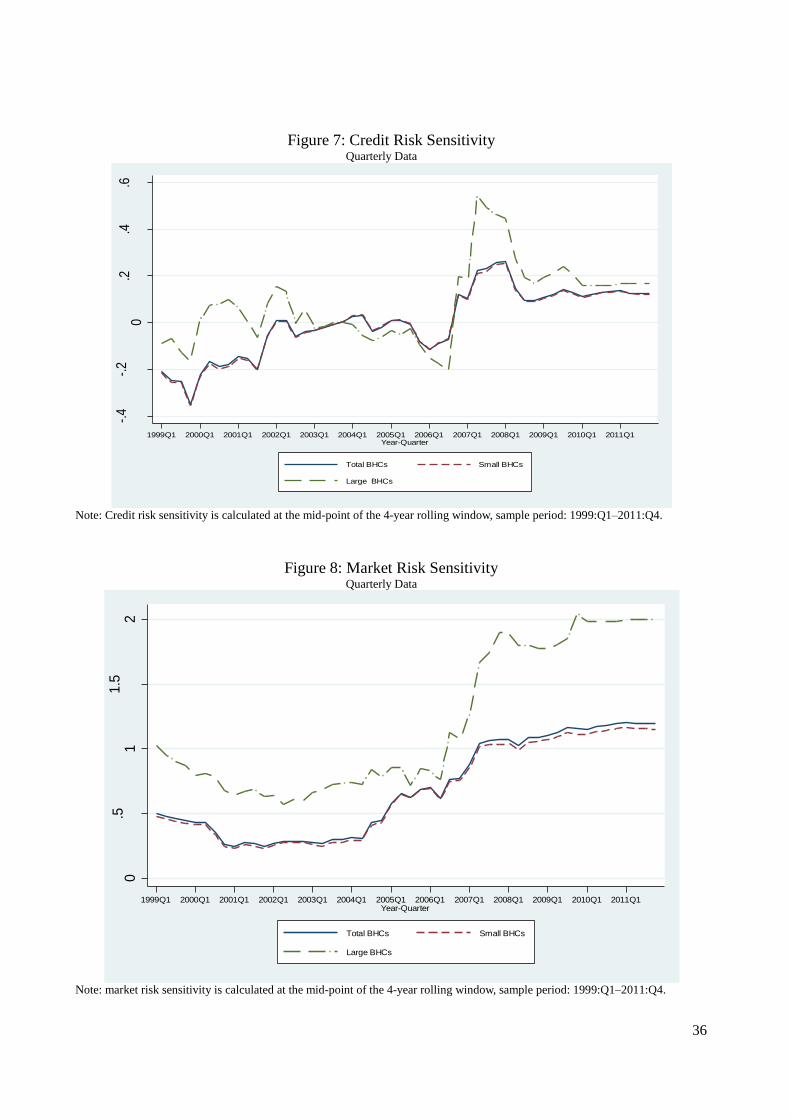
36
Figure 7: Credit Risk Sensitivity Quarterly Data
Note: Credit risk sensitivity is calculated at the mid-point of the 4-year rolling window, sample period: 1999:Q1–2011:Q4.
Figure 8: Market Risk Sensitivity Quarterly Data
Note: market risk sensitivity is calculated at the mid-point of the 4-year rolling window, sample period: 1999:Q1–2011:Q4.
-.4
-.2
0.2
.4.6
1999Q1 2000Q1 2001Q1 2002Q1 2003Q1 2004Q1 2005Q1 2006Q1 2007Q1 2008Q1 2009Q1 2010Q1 2011Q1Year-Quarter
Total BHCs Small BHCs
Large BHCs
0.5
11.5
2
1999Q1 2000Q1 2001Q1 2002Q1 2003Q1 2004Q1 2005Q1 2006Q1 2007Q1 2008Q1 2009Q1 2010Q1 2011Q1Year-Quarter
Total BHCs Small BHCs
Large BHCs
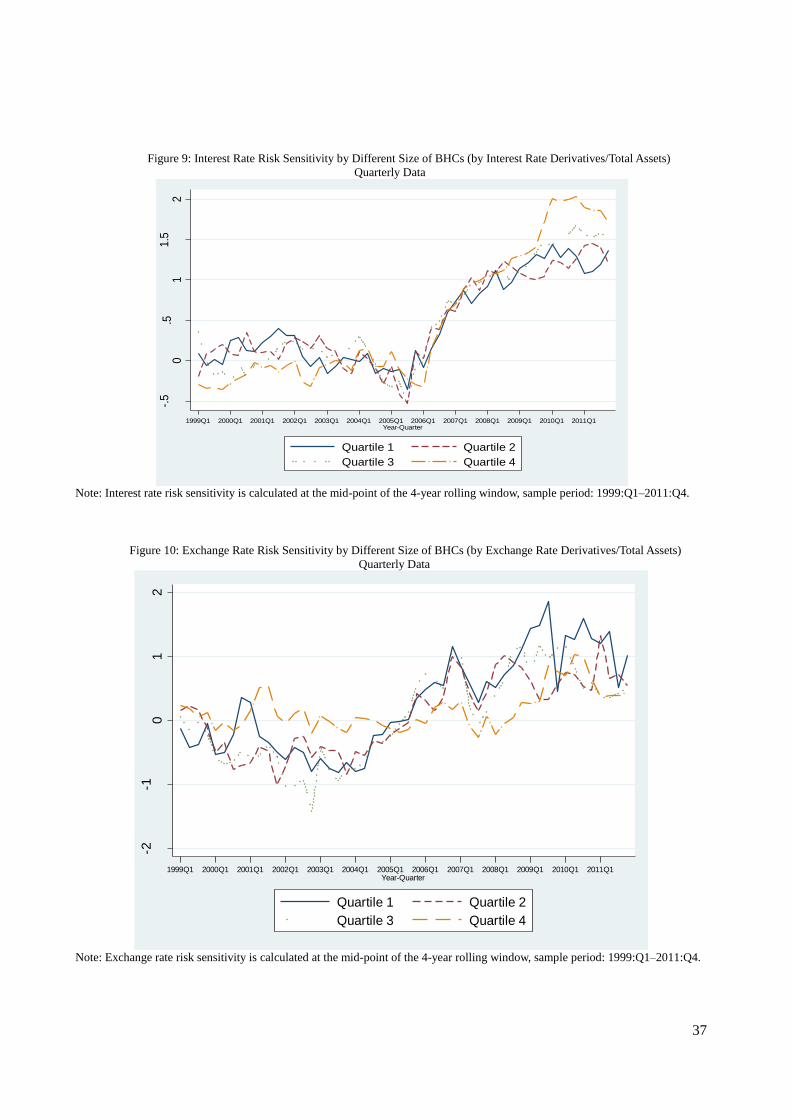
37
Figure 9: Interest Rate Risk Sensitivity by Different Size of BHCs (by Interest Rate Derivatives/Total Assets)
Quarterly Data
Note: Interest rate risk sensitivity is calculated at the mid-point of the 4-year rolling window, sample period: 1999:Q1–2011:Q4.
Figure 10: Exchange Rate Risk Sensitivity by Different Size of BHCs (by Exchange Rate Derivatives/Total Assets)
Quarterly Data
Note: Exchange rate risk sensitivity is calculated at the mid-point of the 4-year rolling window, sample period: 1999:Q1–2011:Q4.
-.5
0.5
11.5
2
1999Q1 2000Q1 2001Q1 2002Q1 2003Q1 2004Q1 2005Q1 2006Q1 2007Q1 2008Q1 2009Q1 2010Q1 2011Q1Year-Quarter
Quartile 1 Quartile 2
Quartile 3 Quartile 4
-2-1
01
2
1999Q1 2000Q1 2001Q1 2002Q1 2003Q1 2004Q1 2005Q1 2006Q1 2007Q1 2008Q1 2009Q1 2010Q1 2011Q1Year-Quarter
Quartile 1 Quartile 2
Quartile 3 Quartile 4

38
Figure 11: Credit Risk Sensitivity by Different Size of BHCs (by Credit Derivatives/Total Assets)
Quarterly Data
Note: Credit risk sensitivity is calculated at the mid-point of the 4-year rolling window, sample period: 1999:Q1–2011:Q4.
-.5
0.5
1
1999Q1 2000Q1 2001Q1 2002Q1 2003Q1 2004Q1 2005Q1 2006Q1 2007Q1 2008Q1 2009Q1 2010Q1 2011Q1Year-Quarter
Quartile 1 Quartile 2
Quartile 3 Quartile 4
Related Documents