This PDF is a selection from an out-of-print volume from the National Bureau of Economic Research Volume Title: NBER Macroeconomics Annual 1995, Volume 10 Volume Author/Editor: Ben S. Bernanke and Julio J. Rotemberg, eds. Volume Publisher: MIT Press Volume ISBN: 0-262-02394-6 Volume URL: http://www.nber.org/books/bern95-1 Conference Date: March 10-11, 1995 Publication Date: January 1995 Chapter Title: Banks and Derivatives Chapter Author: Gary Gorton, Richard Rosen Chapter URL: http://www.nber.org/chapters/c11023 Chapter pages in book: (p. 299 - 349)

Welcome message from author
This document is posted to help you gain knowledge. Please leave a comment to let me know what you think about it! Share it to your friends and learn new things together.
Transcript

This PDF is a selection from an out-of-print volume from the NationalBureau of Economic Research
Volume Title: NBER Macroeconomics Annual 1995, Volume 10
Volume Author/Editor: Ben S. Bernanke and Julio J. Rotemberg, eds.
Volume Publisher: MIT Press
Volume ISBN: 0-262-02394-6
Volume URL: http://www.nber.org/books/bern95-1
Conference Date: March 10-11, 1995
Publication Date: January 1995
Chapter Title: Banks and Derivatives
Chapter Author: Gary Gorton, Richard Rosen
Chapter URL: http://www.nber.org/chapters/c11023
Chapter pages in book: (p. 299 - 349)

Gary Gorton and Richard Rosen THE WHARTON SCHOOL, UNIVERSITY OF PENNSYLVANIA, AND NBER; AND THE WHARTON SCHOOL, UNIVERSITY OF PENNSYLVANIA
Banks and Derivatives
1. Introduction In the last ten to fifteen years financial derivative securities have become an important, and controversial, product.1 These securities are powerful instruments for transferring and hedging risk. However, they also allow
agents to quickly and cheaply take speculative risk. Determining whether
agents are hedging or speculating is not a simple matter because it is difficult to value portfolios of derivatives. The relationship between risk and derivatives is especially important in banking, since banks dominate most derivatives markets and, within banking, derivative holdings are concentrated at a few large banks. If large banks are using derivatives to increase risk, then recent losses on derivatives, such as those of Procter and Gamble and of Orange County, may seem small in comparison with the losses by banks. If, in addition, the major banks are all taking similar
gambles, then the banking system is vulnerable. This paper is the first to estimate the market-value and interest-rate sensitivity of bank derivative
positions. We focus on a single important derivative security, interest-rate
swaps, and find evidence that the banks, as a whole, take the same side in interest-rate swaps. The banking system's net position is somewhat interest-rate sensitive. Relatively small increases in interest rates can cause fairly large decline in the value of swaps held by banks. However,
Thanks to Ben Bernanke, Peter Garber, Julio Rotemberg, Cathy Schrand, and especially Greg Duffee for comments and suggestions. 1. A large number of reports by government and trade organizations have been devoted to
studying derivatives. See Bank for International Settlements (1992), Bank of England (1987, 1993), Basle Committee on Banking Supervision (1993a, b, c, d), Board of Gover- nors of the Federal Reserve System et al. (1993), Commodity Futures Trading Commis- sion (1993), Group of Thirty (1993a, b, 1994), House Banking Committee Minority Staff (1993), House Committee on Banking, Finance, and Urban Affairs (1993), U.S. Comptrol- ler of the Currency (1993A, B), and U.S. Government Accounting Office (1994).

300 * GORTON & ROSEN
our evidence suggests that swap positions are largely hedged elsewhere in bank portfolios.
Derivative securities are contracts that derive their value from the level of an underlying interest rate, foreign exchange rate, or price. Deriva- tives include swaps, options, forwards, and futures. At the end of 1992 the notional amount of outstanding interest-rate swaps was $6.0 trillion, and the outstanding notional amount of currency swaps was $1.1 trillion (Swaps Monitor (1993)). U.S. commercial banks alone held $2.1 trillion of interest rate swaps and $279 billion of foreign-exchange swaps (Call Re- ports of Income and Condition). Moreover, derivatives are concentrated in a relatively small number of financial intermediaries. For example, almost two-thirds of swaps are held by only 20 financial intermediaries. Of the amount held by U.S. commercial banks, seven large dealer banks ac- count for over 75%.
An interest-rate swap is a contract under which two parties exchange the net interest payments on an amount known as the "notional princi- pal." In the simplest interest-rate swap, at a series of six-month inter- vals, one party pays the current interest rate (such as the six-month LIBOR) on the notional principal while its counterparty pays a preset, or fixed, interest rate on the same principal. The notional principal is never exchanged. By convention, interest rates in a swap are set so that the
swap has a zero market value at initiation. If there are unanticipated changes in interest rates, the market value of a swap will change, becom-
ing an asset for one party and a liability for the counterparty. Valuing an interest-rate swap requires information on when the swap
was initiated (or what the fixed interest rate is), the terms of payment, and the remaining maturity of the swap. Firms are not required to reveal this information, and few firms reveal even market values for their swap portfolios.2 Moreover, it is not the current market value that is most important. The key factor in determining the risk of a swap portfolio is the interest-rate sensitivity of the portfolio. Swap value can be very volatile. If interest rates change slightly, the value of a swap can change dramatically. Thus, monitoring the risks from swaps is difficult. Partially in response to this, proposals for reforming swap reporting require insti- tutions to reveal the interest-rate sensitivity of their swap positions (as well as sensitivities to other factors such as foreign exchange rates). Until institutions are required to report the interest-rate sensitivity of their swap portfolios, swaps are an easy way to quickly and inexpensively alter the risk of a portfolio. Because of insufficient current reporting
2. Starting in 1994, banks are required to report for interest rate, foreign exchange, equity, and commodity derivatives the value of contracts that are liabilities as well as the value of contracts that are assets.
Banks and Derivatives * 301
requirements, swaps can be used to make it more difficult for outsiders to monitor risk.
Difficulty in monitoring risk is especially important when the party entering into a derivative transaction such as a swap is an agent manag- ing money for outside principals. Whenever outside principals cannot
fully monitor, an agent may find it optimal to speculate (Dow and Gorton, 1994). This means that recent reports of losses by Proctor and Gamble, Gibson Greetings, Metallgesellschaft, and Orange County may signal that agents, whether they are corporate treasurers or profes- sional money managers, have been using derivatives to speculate.3 These kinds of losses have direct and indirect impacts. Principals and other stakeholders in an organization hit by losses obviously suffer. There is also a possible indirect effect through signaling. Since deriva- tives are opaque, a realized loss by one organization may be viewed as information about the portfolio positions of other organizations. These effects are the natural result of information release in an agency setting. They hold true for corporations, municipalities, fund managers, and banks. The problems from derivatives transactions thus come from information problems. This points out the need for changes in either accounting rules or investment regulations.
When banks use derivatives, the problems are more severe. There are two issues. First, even knowing more about the derivatives position of a bank may not allow outside stakeholders to determine the overall riski- ness of the bank. Banks invest in many nonderivative instruments that are illiquid and opaque. Thus, even if the value of their derivative posi- tions were known, it would be hard to know how subject to interest-rate and other risks the entire bank would be. This makes them different from most other organizations that invest in derivatives.
Second, bank failures can have external effects. The failure of several
large banks can lead to the breakdown of the payments system and the collapse of credit markets for firms. These problems, known collectively as "systemic risk," are of concern if large banks all take similar positions in derivatives markets or are perceived as taking similar positions. It is clear that if banks have similar positions, the failure of one bank may mean the failure of many. Because derivatives are opaque, even if banks have different positions, outside principals may not be able to determine whether the failure of one bank signals trouble at other banks.
Systemic-risk issues lead us to examine banks. We further focus on interest-rate swaps because interest-rate risk is nondiversifiable and be-
3. The agents in these examples have all claimed that any "speculative" risk they were taking in their derivative positions was unintentional.

302 * GORTON & ROSEN
cause banks naturally are repositories of interest-rate risk. Banks bear interest-rate risk if their assets reprice at different frequencies than their liabilities. Banks may be using interest-rate swaps to hedge-that is, to reduce interest-rate risk-or to speculate.4
To estimate interest-rate sensitivity, the first step in determining whether there is systemic risk, we need to put more structure on the
existing data. The only available data comes from the Call Reports of Income and Condition, where banks report notional values, a number called "replacement cost," and the remaining maturity of interest-rate derivatives (more than one year remaining and less than one year re-
maining). The replacement cost of a bank's interest-rate derivatives is the value of the derivatives that are assets to the bank (not netting out derivatives that are liabilities). These data are insufficient to calculate interest-rate sensitivity, or even market value. We make simple assump- tions that allow us to go from the available data to estimates of market value and interest-rate sensitivity.
Our estimates of interest-rate sensitivity show that the banking sys- tem has a net swap position that falls in value if interest rates rise. This sensitivity is due to the positions of large banks. Small banks tend to have only minor exposure to interest rates in their swap positions. While our estimates show that large banks have interest-rate-sensitive swap positions, this does not mean that the banks' equity positions are interest-rate-sensitive to the same extent. The banks may use swaps to
hedge on-balance-sheet interest-rate risk, or they may use other deriva- tives markets, such as the futures market, to hedge their swap exposure. We investigate whether swap exposure is hedged elsewhere on bank balance sheets. We find that large banks have mostly hedged swap interest-rate risk. This leaves open the very important question of who is
acquiring the interest-rate risk from large banks. The paper proceeds as follows. In Section 2 we provide some back-
ground on interest-rate swaps. In Section 3, the role of banks in the swap market is discussed. We discuss several hypotheses about bank involve- ment in the swap market. Section 4 presents the model that allows us to derive market value and interest-rate sensitivity from published data. Section 5 outlines the procedure for calibrating the model. Estimates of market value and interest-rate sensitivity are given in Section 6. Section 7 addresses the question of whether banks hedge their swap exposure. Conclusions are presented in Section 8.
4. Note that the same questions arise in foreign-currency derivatives, but, unlike with interest-rate derivatives, there is no easy way to know from a bank's currency deriva- tives position whether it is hedging or speculating.
Banks and Derivatives * 303
2. Interest-Rate Swaps: Background 2.1 DEFINITION OF AN INTEREST-RATE SWAP
An interest-rate swap is a contract under which two parties agree to pay each other's interest obligations. The cash flows in a swap are based on a "notional" principal which is used to calculate the cash flow (but is not
exchanged). The two parties are known as "counterparties." Usually, one of the counterparties is a financial intermediary. At a series of stipu- lated dates, one party (the fixed-rate payer) owes a "coupon" payment determined by the fixed interest rate set at contract origination, rN, and, in return, is owed a "coupon" payment based on the relevant floating rate, rt. For most swap contracts, LIBOR is used as the floating rate while the fixed rate is set to make the swap have an initial value of zero.5 The fixed rate can be thought of as a spread over the appropriate-maturity Treasury bond, where the spread can reflect credit risk. So, for example, a five-year swap might set the fixed rate at the five-year Treasury bond rate plus 25 basis points and the floating rate at the six-month LIBOR.
When the swap is entered into, the fixed rate is set at rN, where N is the origination date of the swap. The fixed-rate payer pays rNL, where L is the notional principal. The fixed-rate payer receives rtL, where rt is the interest rate at the last reset date. Notice that the notional principal is never exchanged. At each settlement date t, only the difference in the promised interest payments is exchanged. So the fixed-rate payer re- ceives (or pays) a difference check: (rt - rN)L.
A swap is a zero-sum transaction. While the initial value of a swap is zero, over the life of the swap interest rates may change, causing the swap to become an asset to one party (the fixed-rate payer if rates rise) or a liability (for the fixed-rate payer if rates fall); clearly, one party's gain is the other's loss. For example, if the floating rate rises from rt to rt, then the difference check received by the fixed-rate payer rises from (rt - rN)L to (r; - rN)L.
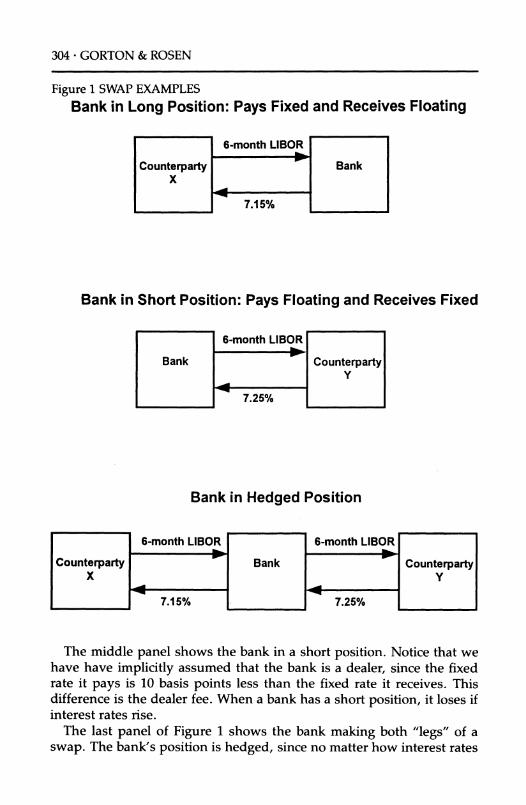
Figure 1 provides examples of a swap. We define a swap participant as "long" if the participant pays a fixed rate and receives a floating rate. The top panel shows a bank with a long position. The bank pays 7.15% to its counterparty and receives the six-month LIBOR rate. So, if the notional principal is $1 million and payments are made every six months, then when LIBOR is 6.5%, the bank pays a net of $3250 to its counterparty [$1 million x (7.15% - 6.5%)/2]. When LIBOR is 7.5%, on the other hand, the bank receives $1750. Thus, the bank gains when interest rates rise.
5. The floating rate typically is reset every six months using the then current six-month rate. Since the floating rate is determined six months prior to settlement, throughout the swap the cash flow at the next settlement date is known six months in advance.
304 * GORTON & ROSEN
Figure 1 SWAP EXAMPLES Bank in Long Position: Pays Fixed and Receives Floating
Bank in Short Position: Pays Floating and Receives Fixed
Bank in Hedged Position
The middle panel shows the bank in a short position. Notice that we have have implicitly assumed that the bank is a dealer, since the fixed rate it pays is 10 basis points less than the fixed rate it receives. This difference is the dealer fee. When a bank has a short position, it loses if interest rates rise.
The last panel of Figure 1 shows the bank making both "legs" of a swap. The bank's position is hedged, since no matter how interest rates
Banks and Derivatives ? 305
move, the bank receives a net of 10 basis points from the swap (assum- ing no default).
2.2 RISKS IN SWAPS
The major risks from swaps include those that are common to all fixed- income securities. Interest-rate risk exists because changes in interest rates affect the value of a swap. Also, credit risk exists because a counter-
party may default. If a swap is a liability, then default by a counterparty is not costly. Also, notional principal is not exchanged in a swap, so the magnitude of credit risk is reduced.
To examine interest-rate risk, we need to be able to value swaps as a function of interest rates. To do this we can view a swap as a combination of loans. The fixed-rate payer can be viewed as borrowing at a fixed rate and simultaneously lending the same amount at a floating rate. For example, from the point of view of the fixed-rate payer, a five-year swap is equivalent to issuing a five-year coupon bond and buying a five-year floating-rate obligation (where the floating rate is set such that the initial value of the exchange is zero). This helps us to value swaps subsequent to their issue. For example, looking forward two years into the five-year swap, the fixed- rate payer will have, in effect, issued a three-year coupon bond at the original five-year rate and will have bought a three-year floating-rate bond. At that point in time, the market value of the swap to the fixed-rate payer is the difference between the value of a three-year bond issued then and the value of the initial five-year bond with three years left to maturity.
To value a swap, let co be the original maturity of the swap, N be the date of origination, and t be the date at which we are valuing the swap. Further, let the value at date t of a one-dollar (of principal) bond (i.e., L = 1) issued at N with original maturity co be FtN. Notice that a floating-rate bond is always priced at par (ignoring the lagged reset). This allows us to represent the value of a swap with $1.00 of notional principal as
Pt, = 1 - rtIN.
Now it is straightforward to see how the value of a swap changes when interest rates change. As interest rates move, the value of the bond, F, changes and the swap value is altered accordingly. Describing the change in interest rates is, however, more complicated, since it requires a model of the term structure of interest rates.
To this point we have ignored default. The effect of default to the holder of a swap depends on whether the swap is an asset or a liability at the time of default. If a counterparty defaults but the swap is a liability to the holder (i.e., the holder is making payments to the counterparty),

306 * GORTON & ROSEN
then the holder continues to make payments and there is no immediate effect. If the swap is an asset, however, then default means that the
counterparty should be making payments, but does not. The loss to the holder is equivalent to the value of the swap at that point. The replace- ment cost of a swap is the loss that would be incurred if the counterparty defaulted. Note that replacement cost is always nonnegative, since de- fault by an asset holder implies a zero loss to its counterparty.
3. Banks and Interest-Rate Swaps 3.1 SWAP POSITIONS OF BANKS
Table 1 presents a list of the top swap firms according to the notional value of interest-rate swap positions. Most of these firms are commercial banks. Five of the top ten firms by notional value are U.S. commercial banks, three are French state-owned banks, one is a British bank, and one is a U.S. securities firm. Moreover, eighteen of the top twenty firms
Table 1 WORLD'S MAJOR INTEREST-RATE-SWAP FIRMS (YEAR END 1992)
Outstandings Rank Firm ($ billions)
1 Chemical Bank $389.7 2 J.P. Morgan 367.7 3 Societe Generale 345.9 4 Compagnie Financiere de Paribus 342.7 5 Credit Lyonnais 272.8 6 Merrill Lynch 265.0 7 Bankers Trust 255.7 8 Barclays Bank 247.4 9 Chase Manhattan 222.2
10 Citicorp 217.0 11 Bank of America 191.1 12 Credit Agricole 181.7 13 Banque Indosuez 174.1 14 Banque Nationale de Paris 160.1 15 Westpac 147.8 16 Salomon Brothers 144.0 17 Caisse des Depots 111.8 18 First Chicago 74.8 19 Bank of Nova Scotia 73.8 20 Banque Bruxelles Lambert 56.6
Total of Top 20 4,241.9
Source: The World's Major Derivative Dealers, Swaps Monitor Publications (1993).

Banks and Derivatives * 307
with the largest swap positions are banks. These firms also tend to have
large positions in other derivatives markets. Within the U.S. banking system, swaps are concentrated in a few large
banks. Table 2 shows the interest-rate swap position of U.S. commercial banks in the last decade. Panel A, covering all commercial banks, shows that fewer than 3% of banks have any swaps at all. Furthermore, al- though roughly 200 banks hold swaps, over 75% of swap notional value is held by seven dealer banks (panel B), and over 90% is held by thirty banks (panels B and C).6
In the empirical work that follows, we restrict attention to banking organizations with total assets greater than $500 million. Banks smaller than this generally do not use swaps, and account for an insignificant portion of the market. Except for the very largest banks, even banks larger than $500 million in assets rarely hold significant amounts of swap notional value (see panels D-F of Table 2). Panels D-F show that swaps account for a tiny fraction of total assets at banks below the top thirty.
Table 2 also shows that the potential risk to the banking system from swaps is much greater now than in the past because of the growth in bank swap positions. Over the period 1985-1993 swap holdings in- creased by 40% per year. The final two columns of panel A show that the growth in swap notional value dwarfs the growth in assets and equity in the banking system. By the end of 1993 swap notional value was over 10 times the total equity in the banking system.
The concentration of swap holdings at a small number of banks is not necessarily a sign that swaps increase risk in the banking system. Swaps may allow interest rates to be transferred between banks in such a way that overall bank failure risk is reduced. Below, we show how banks can manage risk using swaps. Swap positions may be hedged in other deriva- tives markets or swaps may be held to hedge on-balance-sheet positions. Another possibility is that the concentration of swap holdings is linked to the incentives of large banks to engage in risky activities. If this is the case, then swaps may increase systemic risk.
3.2 BANK LOANS AND SWAPS
We explore two hypotheses about why a few banks dominate the swaps market. One possibility is that banks in general dominate the swaps market because they face interest-rate risk as a by-product of their busi- ness. Swaps can be used to manage this risk. The concentration among a few banks may occur because these banks specialize in managing the
6. Dealer banks include Bank of America, Bankers Trust, Chase Manhattan, Chemical Bank, Citicorp, First National Bank of Chicago, and J. P. Morgan.

Table 2 INTEREST-RATE SWAP POSITIONS OF U.S. COMMERCIAL BANKS (YEAR END 1985-1993)
% of Banks Total Swap Ratio of Swap Ratio of Swap Number of Engaged in Notional Value Notional Value to Notional Value to Book
Year Banks Swaps ($ billion) Total Assets (%) Value of Equity (%)
Panel A: All Banks 1985 11,035 1.4 186.15 6.9 111.2 1986 10,516 1.7 366.63 12.6 204.3 1987 10,174 1.8 715.50 24.0 399.3 1988 9,792 1.9 930.41 29.9 477.2 1989 9,521 1.9 1,349.32 41.2 664.8 1990 9,284 2.0 1,716.78 51.1 793.4 1991 9,180 2.2 1,755.85 51.2 765.6 1992 8,833 2.2 2,121.97 61.0 813.3 1993 8,596 2.3 2,946.26 80.2 1,003.0 Panel B: Dealer Banks 1985 7 100 137.31 22.8 424.7 1986 7 100 279.81 43.7 781.0 1987 7 100 559.08 86.9 1787.0 1988 7 100 713.29 110.9 1995.2 1989 7 100 1016.57 155.0 3123.8 1990 7 100 1285.65 198.0 3682.1 1991 7 100 1268.22 195.8 3531.7 1992 7 100 1614.24 251.5 3742.6 1993 7 100 2264.30 318.4 4461.8 Panel C: Top 30 Banks Excluding Dealer Banks 1985 23 100 31.50 3.8 70.2 1986 23 96 61.49 7.0 128.4 1987 23 96 110.17 12.5 232.1 1988 23 96 152.43 17.1 303.7 1989 23 100 233.68 23.7 417.2 1990 23 100 305.42 29.6 496.9 1991 23 100 348.53 34.0 548.6 1992 23 100 364.33 34.9 482.6 1993 23 100 494.06 45.6 591.7
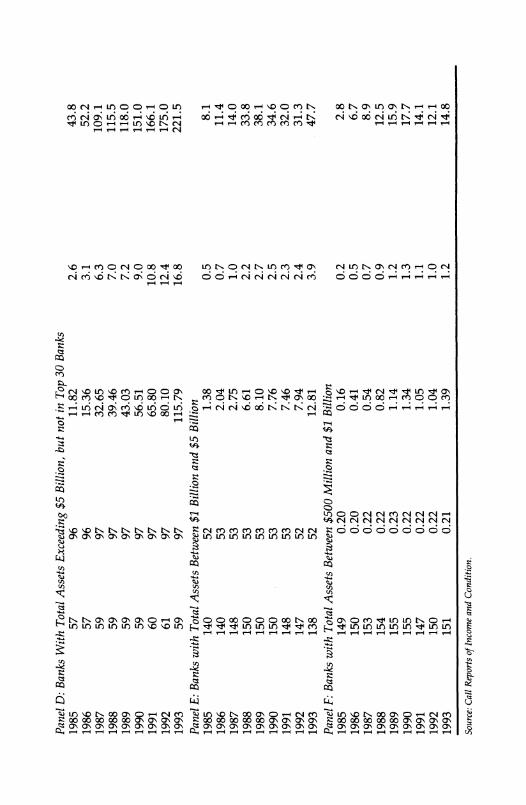
Panel D: Banks With Total Assets Exceeding $5 Billion, but not in Top 30 Banks 1985 57 96 11.82 2.6 43.8 1986 57 96 15.36 3.1 52.2 1987 59 97 32.65 6.3 109.1 1988 59 97 39.46 7.0 115.5 1989 59 97 43.03 7.2 118.0 1990 59 97 56.51 9.0 151.0 1991 60 97 65.80 10.8 166.1 1992 61 97 80.10 12.4 175.0 1993 59 97 115.79 16.8 221.5
Panel E: Banks with Total Assets Between $1 Billion and $5 Billion 1985 140 52 1.38 0.5 8.1 1986 140 53 2.04 0.7 11.4 1987 148 53 2.75 1.0 14.0 1988 150 53 6.61 2.2 33.8 1989 150 53 8.10 2.7 38.1 1990 150 53 7.76 2.5 34.6 1991 148 53 7.46 2.3 32.0 1992 147 52 7.94 2.4 31.3 1993 138 52 12.81 3.9 47.7
Panel F: Banks with Total Assets Between $500 Million and $1 Billion 1985 149 0.20 0.16 0.2 2.8 1986 150 0.20 0.41 0.5 6.7 1987 153 0.22 0.54 0.7 8.9 1988 154 0.22 0.82 0.9 12.5 1989 155 0.23 1.14 1.2 15.9 1990 155 0.22 1.34 1.3 17.7 1991 147 0.22 1.05 1.1 14.1 1992 150 0.22 1.04 1.0 12.1 1993 151 0.21 1.39 1.2 14.8
Source: Call Reports of Income and Condition.

310 * GORTON & ROSEN
interest-rate risk for the entire banking system, which they may hedge in other markets. Another possibility is that regulatory distortions create an incentive for large banks to absorb interest risk from other banks and from nonbank firms, risk which the large banks do not hedge.
Traditionally, banks issued fixed-rate loans because borrowers wanted
certainty of payment.7 A fixed-rate loan involves two risks to the bank. First, the borrower may default (credit risk). Second, bank portfolios contain these loans plus primarily floating-rate (short-term) liabilities. Thus, if interest rates change after a loan contract has been signed, the value of the portfolio changes (interest-rate risk). By holding fixed-rate loans and floating-rate liabilities, the bank bears both credit risk and interest-rate risk.
Swaps allow the credit risk and interest-rate risk to be priced, traded, and held separately. Banks can use swaps to separate credit risk and interest-rate risk in two ways. Either a bank can issue a floating-rate loan to a borrower, who then swaps to fixed with a third party (possibly another bank). In this case, the bank is left with floating-rate loans and
floating-rate liabilities. Or the bank can issue a fixed-rate loan and enter into a pay-fixed, receive-floating swap with a third party, possibly an- other bank. Again, the bank ends up effectively receiving a floating rate on its loans. Notice that in both cases, the third party is entering into a
swap which receives fixed and pays floating. One of the issues we dis- cuss below is whether large banks are the third parties in these swap transactions.
Swaps might allow interest-rate risk to be redistributed among banks, without changing the level of interest-rate risk in banking. Borrowers
might borrow from one set of banks at floating rates but swap with large banks to hedge interest-rate risk. Essentially the same result occurs if borrowers take fixed-rate loans and then these smaller lenders swap with large banks to hedge the small banks' interest-rate risk. With either of these examples, large banks end up holding unhedged swap posi- tions. This would leave the overall risk in the system unchanged, but more highly concentrated.
The interest-rate risk at large banks depends on whether they hedge the risk transferred from the rest of the banking system, and whether they choose to absorb additional interest-rate risk (by speculating). The incentives for large banks to hedge interest-rate risk may be affected by the regulatory system. Roughly coinciding with the existence of the
7. Over the period 1977-1993, approximately 40% (by value) of commercial loans were floating rate (Quarterly Terms of Bank Lending survey, Federal Reserve Board). There are no significant trends in the relative use of floating-rate loans over this period, overall or among banks of different sizes.

Banks and Derivatives * 311
swaps market, large U.S. commercial banks have been (formally or infor-
mally) protected by the policy known as "too big to fail." Under this
policy regulators extended deposit insurance at these banks to cover all
liability holders, large or small. This serves as a subsidy to risktaking by too-big-to-fail banks. This would suggest that big banks, but not small banks, would hold large, unhedged interest-rate swap positions. To ad- dress this issue, we need to know not just the notional positions of banks, but whether the big banks that dominate the market have net
long or net short swap portfolios, and whether they have hedged.
4. Modeling the Market Value of Swaps In this section we discuss the available data and outline our empirical procedure for calculating the market values and interest-rate sensitivities of bank interest-rate swap positions.
4.1 DATA
The data commercial banks are required to report to regulators are insuffi- cient to derive either market values or interest-rate sensitivities without
imposing some assumptions. There are three big problems with the data. First, banks do not report market values; instead they report only notional value, something called "replacement cost," and the fraction of interest- rate derivatives with a remaining maturity of less than one year. Second, notional value is reported separately for interest-rate swaps and other interest-rate-based derivatives, but replacement cost and remaining matu-
rity are reported only for the aggregate of all interest-rate derivatives with credit risk, including swaps, forwards, and options (but excluding fu- tures). Finally, while banks were required to report notional value starting in the second quarter of 1985, they were not required to report replace- ment cost and remaining maturity until the first quarter of 1990. Thus, we have only four years of quarterly observations on replacement cost.
We have defined notional value above. Replacement cost, according to the Call Report instructions to banks, is as follows:
. . . the replacement cost [is] the mark-to-market value, for only those interest rate and foreign exchange rate contracts with a positive replacement cost . .. not those contracts with negative mark-to-market values. The replacement cost is defined as the loss that would be incurred in the event of counterparty default, as measured by the net cost of replacing the contract at current market rates.
Replacement cost includes only the value of those contracts which be- cause of interest-rate movements have become assets. In other words, as

312 * GORTON & ROSEN
we illustrate below, the market value of the bank's net position may be
negative at the same time as replacement cost is positive. This fact does not seem widely understood.8
Table 3 presents quarterly data on notional values, replacement cost, and remaining maturity from 1990 to 1993. Over this period, the no- tional value has more than doubled. Notice that the relationship be- tween notional value and replacement value is not constant. Between the first quarter of 1990 and the fourth quarter of 1991, notional value rose 21% while replacement value doubled. From the fourth quarter of 1991 through the final quarter of 1993, notional value rose 68% while
replacement cost rose by 49%. The third column shows the proportion of interest-rate derivatives with a remaining maturity of less than one
year. Note that the ratio is constant over our sample period. The fourth column shows an estimated ratio for swaps alone. We discuss the deri- vation of these data later. The relationship among notional value, re-
placement cost, and maturity structure depends on interest rates. The effect of a rate movement on replacement value is influenced by both notional value and the maturity structure of swaps. The final column of Table 3 shows that interest rates declined through mid-1992, and then rose a small amount during the rest of our sample period. We return to this issue later.
4.2 REPLACEMENT COST AND MARKET VALUE
The relationship between replacement cost, which banks provide, and market value, which we want, depends on the maturity structure of
swaps and the path of interest rates. We provide some examples to show that it is not possible to infer market value in a straightforward way from
changes in replacement cost.
By convention we assume that a long interest-rate swap contract pays a fixed interest rate and receives a floating interest rate. Let:
LtN be the dollar amount of long interest-rate swap contracts at date t which were originated at date N with original maturity of co, and
S' be the dollar amount of short interest-rate swap contracts at date t which were originated at date N with original maturity of co.
8. Another issue with reported replacement cost concerns whether the number represents the positive value due to favorable interest-rate movements or whether it also incorpo- rates reductions in the credit risk of counterparties. In other words, at the root of the replacement-cost number there is, presumably, a model which the bank uses to value its interest-rate derivatives. Nothing is known about these models. Banks are not required to report their models, so we have no information about how credit risk enters into reported replacement cost.
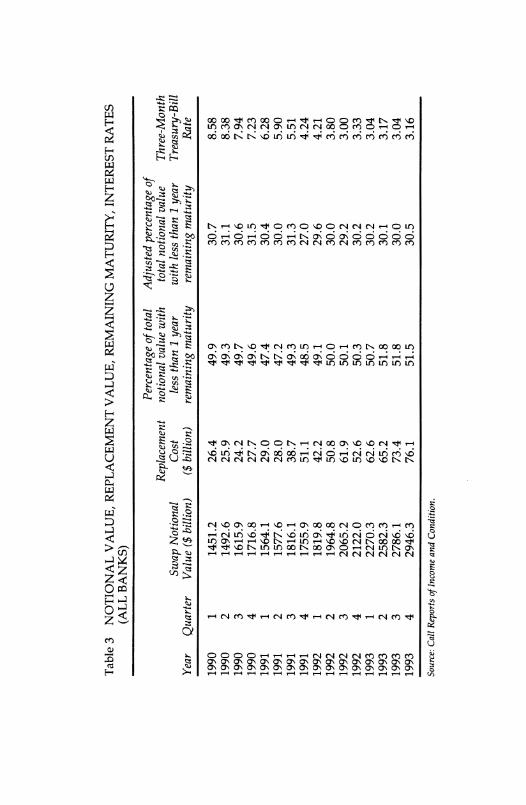
Table 3 NOTIONAL VALUE, REPLACEMENT VALUE, REMAINING MATURITY, INTEREST RATES (ALL BANKS)
Percentage of total Adjusted percentage of Replacement notional value with total notional value Three-Month
Swap Notional Cost less than 1 year with less than 1 year Treasury-Bill Year Quarter Value ($ billion) ($ billion) remaining maturity remaining maturity Rate
1990 1 1451.2 26.4 49.9 30.7 8.58 1990 2 1492.6 25.9 49.3 31.1 8.38 1990 3 1615.9 24.2 49.7 30.6 7.94 1990 4 1716.8 27.7 49.6 31.5 7.23 1991 1 1564.1 29.0 47.4 30.4 6.28 1991 2 1577.6 28.0 47.2 30.0 5.90 1991 3 1816.1 38.7 49.3 31.3 5.51 1991 4 1755.9 51.1 48.5 27.0 4.24 1992 1 1819.8 42.2 49.1 29.6 4.21 1992 2 1964.8 50.8 50.0 30.0 3.80 1992 3 2065.2 61.9 50.1 29.2 3.00 1992 4 2122.0 52.6 50.3 30.2 3.33 1993 1 2270.3 62.6 50.7 30.2 3.04 1993 2 2582.3 65.2 51.8 30.1 3.17 1993 3 2786.1 73.4 51.8 30.0 3.04 1993 4 2946.3 76.1 51.5 30.5 3.16
Source: Call Reports of Income and Condition.

314 * GORTON & ROSEN
Banks report notional value and replacement cost. With the above notation, the notional value of a swap portfolio at time t is given by
NVt - E (LtN +St). (1) w N>t-o
The replacement cost is given by
RCt = E E [Max (LtNPtN, 0) + Max (-St NPt'N, 0)], (2) w N>t-w
where P/' is the value of a $1.00-notional-value swap to the fixed-rate payer written at date N with original maturity w. To understand (2) consider what happens to the value of a swap when interest rates change. If rates rise, then the swap becomes an asset to the fixed-rate payer and a liability to the floating-rate payer. Thus, the value of the swap is included in the "replacement cost" for the fixed-rate payer, but not for the floating-rate payer. On the other hand, if interest rates fall after a swap is made, then the value of the swap is included in "replace- ment cost" only for the floating-rate payer. The replacement cost of a portfolio is the sum of (1) the values of contracts that pay a fixed rate and have a positive value, PAN > 0, and (2) the values of contracts that pay a floating rate and have a positive value, PtN < 0.
The market value of a portfolio of swap contracts is
MVt - E (Lt,N-St,N)Pt,N. (3) w N>t-w
Comparing this equation with (2), notice that market value is the sum of all swap contracts, assets as well as liabilities. Replacement cost ignores liabilities.
To examine the relationship between replacement cost and market value, consider an example. Suppose there are three swaps outstanding in a portfolio, all with one year remaining. Table 4 gives the contract specifications for the swap portfolio. Assume that the floating rate is 6% (panel A of Table 4). The market value is
MVt = ($3 million)(-0.009) - ($1 million)(0.009) - ($1 million)(-0.0019) -$18,868.

Banks and Derivatives * 315
Table 4 NOTIONAL VALUE AND REPLACEMENT VALUE: EXAMPLES
Price Per Long Short $1 of
Notional Contracts Contracts Notional Value Position Fixed Rate ($) ($) Value
Panel A: Floating Rate = 6% $3 million Long 7% $3 million 0 -0.009 $1 million Short 5% 0 $1 million 0.009 $1 million Short 8% 0 $1 million -0.019 Panel B: Floating Rate = 5% $3 million Long 7% $3 million 0 -0.019 $1 million Short 5% 0 $1 million 0.0 $1 million Short 8% 0 $1 million -0.029
Note: Price = 1 - F, where F is the current value of a one-year bond with a coupon rate equal to the fixed rate.
The replacement cost is
RCt = -($1 million)(-0.0019) = $18,868,
since only the last contract is an asset to the bank. So the market value is
negative while the replacement cost (as always) is positive. If the floating rate changes to 5% from 6%, then both the market value
and the replacement cost are different (see panel B of Table 4). In this case:
MVt = ($3 million)(-0.019) - ($1 million)(0) - ($1 million)(-0.0029) = -$28,571
and
RCt = - ($1 million)(-0.0029) = $28,571,
so the market value is lower than in the previous example, but the
replacement cost is higher! Finally, notice that if the long contract in Table 4 has notional value $1
million rather than $3 million, market value and replacement cost both increase when the interest rate falls from 6% to 5%: When the rate is 6%, MVt = 0 and RCt = $18,868, while when the rate is 5%, MVt = $9,524 and
RCt = $28,571. These examples illustrate that there is no systematic relationship between market value and replacement cost.
316 * GORTON & ROSEN
4.3 MODELING MARKET VALUE
We now present a minimal set of assumptions that lead to a relationship between replacement cost and market value. We use the fact that when interest rates change, both replacement cost and market value change. Without further structure, we have seen that we cannot infer the market-value change from the change in interest rates. Under the as-
sumptions that (1) the maturity structure of the contracts written is con- stant and (2) the direction (long or short) of new contracts written is also constant, we can derive market values from replacement cost and no- tional values. Notice that these assumptions are weaker than assuming that we know the direction (long or short) of new contracts written, since we only assume that the direction is constant over time.
To understand the assumptions, we need some definitions. Let f be the fraction of new contracts written in period N that are of maturity c (so EJf = 1). We also want the proportion of new contracts that are long and short. To find this, first define the notional value of new contracts
originated at date N, NCN:
NCN= E (LLN?+SNN). (4)
Then the shares of new contracts in existence at t that were written at date N with original maturity c that are, respectively, long and short are
lN~ NN (5) t,N N ftNCN
and
St -d) - (6) t fNCN (6)
Note that this implies that
,N + SNN = 1. (7)
We assume the following:

Banks and Derivatives * 317
ASSUMPTION 1 For any maturity co and issuance date N, fw = f .
Assumption 1 says that the proportion of contracts written that are of a given maturity is fixed over time. This assumption also says that the
proportion of contracts that are written of a given maturity is the same over time regardless of whether the contract is long or short.
ASSUMPTION 2 For any co, N, and K < N,
or, alternatively stated,
t,N _ t,N-K
f NCN f NCN-K
Assumption 2 says that the fraction of newly written long contracts with maturity w is constant through time. (Assumption 1 said that the sum of long and short contracts of a given maturity written at any time is a constant fraction of the total contracts written at that time.)
Assumption 1 allows us to derive new contracts from notional value. Write the notional value as
^^S S r^ (8) NVt=E E foNCN' (8) (o N>t- w
Equation (8) says that the notional value is the sum of all contracts written in the past (i.e., at dates N) that have not reached maturity (i.e., N > t - to). Given the notional value and the f , the system of equations in (8) has one equation and one unknown for each period. Solving this
system of equations gives new contracts, which we use below. To write the replacement cost, we need to divide previously written
contracts into assets and liabilities. Let {a,} be the set of dates such that
long contracts written on the date of maturity o are assets at date t, i.e., P ? > 0. Similarly, let {b,} be the set of dates such that long contracts written on the date of maturity to are liabilities at date t, i.e., PN < 0. Now, rewrite the replacement cost as:
RC= L Pt E E Sao{Ptw RC,= a E ELP,-, t,b t, b (9)
,w a E {a,} o b {b,}
318 * GORTON & ROSEN
From Assumption 1 we know that
f NCN = LtN S. (10)
Substitute this into RCt:
RCt = > Lt Pt,a - C ( NCb - Lt)PtP
aE{a,f } ,o bE{b,}
or, rewriting,
RC, = Z L PN - f fNCb Pt (11) o N>t-w o be{b,,}
Using Assumption 2, the replacement cost can be written
RCt, = lf 'NCN PtN f NCbPb. (12) o N>t-o w bE{b,}
To estimate the 1l, we rewrite (12). Since the 1W only appear in the first set of summations, bring the terms in (12) that do not depend on 1l together:
RCt + E E f -NCb Ptwb = E E | f NCN Pt N (13) RC,+X SfNC,Pb ~ l' f NCNP?. (13) wo be{b,} w N>t-w
Now, define RCt to be the left-hand side of (13):
RCt = RC t + fNCbPtb, (14) w bE{b,}
and define At to be the known or assumed variables on the right-hand side of (13):
At;- f NCN Pt. (15) N>t-w
Then
Banks and Derivatives * 319
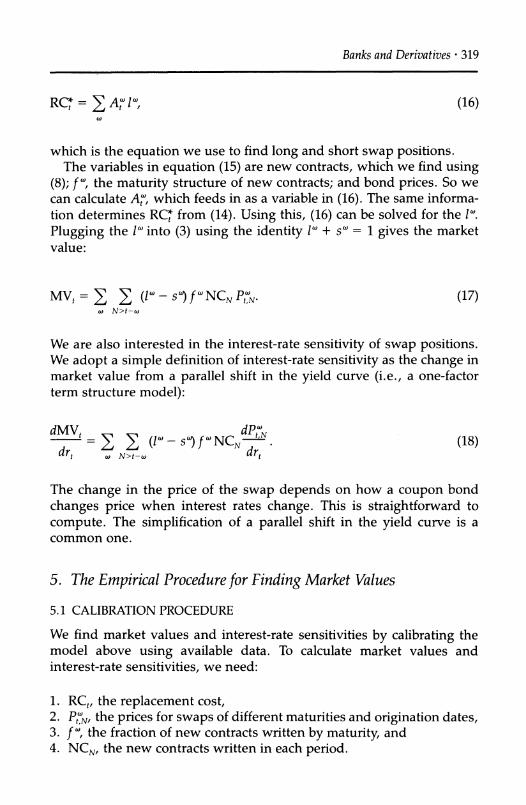
RCt = At l" (16) (o
which is the equation we use to find long and short swap positions. The variables in equation (15) are new contracts, which we find using
(8); f , the maturity structure of new contracts; and bond prices. So we can calculate At, which feeds in as a variable in (16). The same informa- tion determines RC* from (14). Using this, (16) can be solved for the 1W.
Plugging the 1w into (3) using the identity 1w + so = 1 gives the market value:
MVt = E E (l - s) f NC Pt,. (17) w N>t-o
We are also interested in the interest-rate sensitivity of swap positions. We adopt a simple definition of interest-rate sensitivity as the change in market value from a parallel shift in the yield curve (i.e., a one-factor term structure model):
V = E ((A- ) f NCNt (18) drt , N>t-w drt
The change in the price of the swap depends on how a coupon bond
changes price when interest rates change. This is straightforward to
compute. The simplification of a parallel shift in the yield curve is a common one.
5. The Empirical Procedure for Finding Market Values
5.1 CALIBRATION PROCEDURE
We find market values and interest-rate sensitivities by calibrating the model above using available data. To calculate market values and interest-rate sensitivities, we need:
1. RCt, the replacement cost, 2. PtN, the prices for swaps of different maturities and origination dates, 3. f , the fraction of new contracts written by maturity, and 4. NCN, the new contracts written in each period.
320 * GORTON & ROSEN
We have data on replacement cost and prices. The missing piece in the
puzzle is the fraction of new contracts written, the f's. Given the f's, we can find new contracts using data on notional value. Since there are no data on the maturity structure of new contracts, we use indirect means to find the appropriate maturity structure.
We assume that initial swap maturities are between 0 and 5 years.9 Divide swaps into five buckets by initial maturity: 0-1 year (f?), 1-2 years (fl), 2-3 years (f2), 3-4 years (f3), and 4-5 years (f4). We determine the f's by calibration using the one piece of information on maturity structure that banks report. Since 1990 banks have been required to report the notional value of interest-rate derivatives (excluding futures) with re- maining maturities less than 1 year and greater than 1 year. Our strategy is to calibrate the maturity structure of new contracts so that the implied remaining maturities match the reported remaining maturities. Under Assumption 1, the maturity structure of swap contracts is assumed to be constant over time.
The calibration procedure leads us to heavily weight the 0-1-year maturity bucket in order to match the reported data on remaining matu- rity. It is not surprising that banks have a lot of short-term swaps, since banks are not required to hold capital against swaps with a remaining maturity less than one year, but are required to hold capital against longer-term swaps.
Given assumptions on maturity structure, we calculate new contracts using (8). We have quarterly data on notional value from the second quarter of 1985 through the fourth quarter of 1993. Although we only have replacement-cost data starting in 1990, we calculate new contracts from 1985. A contract of 5 years written in the second quarter of 1985 will have a remaining maturity of one quarter in the first quarter of 1990. Thus, our new contracts data match our desire to allow for maturities at least as long as five years.
With our estimates of new contracts, we can use (16) to determine long positions. In (16), we determine five variables, 10, 11, 12, 13, and 14. These correspond to the fractions of contracts in each maturity bucket that are long, so each of the 1 must be between 0 and 1 [see (5)]. To impose these constraints when we calibrate, we use quadratic programming (see Had- ley, 1964). Finally, given the 1", we can derive market value from (17) and interest-rate sensitivity from (18).
9. To the extent that swaps have initial maturities greater than 5 years, we underestimate the interest-rate sensitivity of banks' swap portfolios.
Banks and Derivatives * 321
5.2 PRELIMINARY DATA ADJUSTMENTS
Replacement cost and the remaining maturity data, as mentioned above, are reported for all interest-rate derivatives (excluding futures), whereas we are interested in swaps only. To get the replacement cost of swaps, we need to adjust the reported number to allow for the replacement cost of
nonswap interest-rate derivatives. To determine how to adjust the data, we examined the annual reports of approximately the top 100 bank hold-
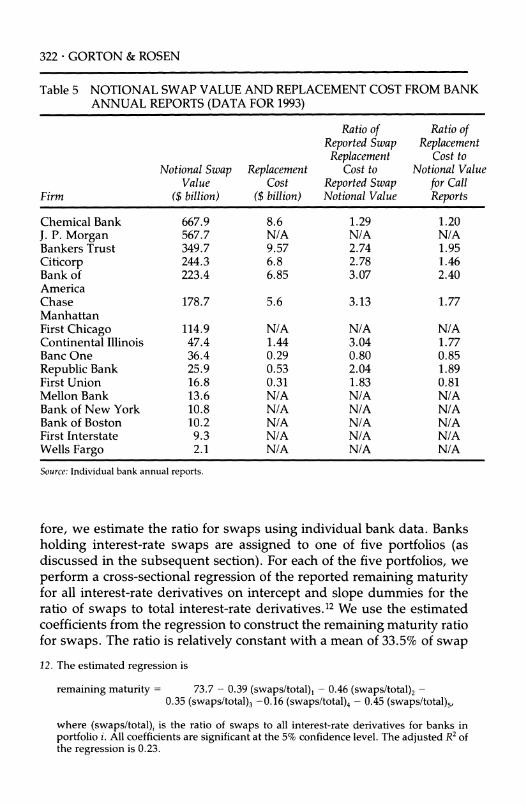
ing companies. Table 5 presents data from the annual reports of the U.S. banks with large swap holdings listed in Table 1, plus several other large banks with significant swap positions. The table shows the data on swaps from bank annual reports: notional value, replacement cost, and the ratio of replacement cost to notional value. Notice that, even in this group, only about half the banks report replacement cost (and fewer report market value).10 Among the banks that report replacement cost, the ratio of re-
placement cost to notional value varies across banks (and over time, though this is not shown in the table). As a comparison, we present data on the ratio of replacement cost to notional value for all nonswap interest- rate derivatives. We get this last series of data by subtracting the annual-
report notional values and replacement costs for swaps from the same data for interest-rate derivatives reported in the Call Reports. The table shows that the ratio is generally higher for swaps than for other interest- rate derivatives. This is expected, since the "other" category includes options, which have a lower interest-rate sensitivity.
Table 5 suggests that the swap ratio is equal to or higher than the ratio for nonswap interest-rate derivatives. Since we rely on Call Report data for most of our empirical work, we adjust reported replacement cost (for all interest-rate derivatives) to get an estimate of replacement cost for interest-rate swaps. The adjustment involves proportionally reducing the reported replacement cost in the Call Reports by the ratio of the notional value of interest-rate swaps to the notional value of all interest- rate derivatives except futures.1 We experimented with other ratios in the range indicated in Table 5, but found that the exact assumption did not affect the qualitative results.
The ratio of remaining maturity less than 1 year to notional value is different for interest-rate swaps than for other interest-rate derivatives. Since we target this ratio in our calibration, we would like to use the ratio for interest-rate swaps, rather than for all interest-rate derivatives. There-
10. Other banks in the group reported replacement cost for all interest-rate derivatives. 11. We exclude the notional value of futures, since futures have a zero replacement cost
because they are marked to market.
322 GORTON & ROSEN
Table 5 NOTIONAL SWAP VALUE AND REPLACEMENT COST FROM BANK ANNUAL REPORTS (DATA FOR 1993)
Ratio of Ratio of Reported Swap Replacement Replacement Cost to
Notional Swap Replacement Cost to Notional Value Value Cost Reported Swap for Call
Firm ($ billion) ($ billion) Notional Value Reports
Chemical Bank 667.9 8.6 1.29 1.20 J. P. Morgan 567.7 N/A N/A N/A Bankers Trust 349.7 9.57 2.74 1.95 Citicorp 244.3 6.8 2.78 1.46 Bank of 223.4 6.85 3.07 2.40 America Chase 178.7 5.6 3.13 1.77 Manhattan First Chicago 114.9 N/A N/A N/A Continental Illinois 47.4 1.44 3.04 1.77 Banc One 36.4 0.29 0.80 0.85 Republic Bank 25.9 0.53 2.04 1.89 First Union 16.8 0.31 1.83 0.81 Mellon Bank 13.6 N/A N/A N/A Bank of New York 10.8 N/A N/A N/A Bank of Boston 10.2 N/A N/A N/A First Interstate 9.3 N/A N/A N/A Wells Fargo 2.1 N/A N/A N/A
Source: Individual bank annual reports.
fore, we estimate the ratio for swaps using individual bank data. Banks
holding interest-rate swaps are assigned to one of five portfolios (as discussed in the subsequent section). For each of the five portfolios, we perform a cross-sectional regression of the reported remaining maturity for all interest-rate derivatives on intercept and slope dummies for the ratio of swaps to total interest-rate derivatives.12 We use the estimated coefficients from the regression to construct the remaining maturity ratio for swaps. The ratio is relatively constant with a mean of 33.5% of swap
12. The estimated regression is
remaining maturity 73.7 - 0.39 (swaps/total)1 - 0.46 (swaps/total)2 - 0.35 (swaps/total)3 -0.16 (swaps/total)4 - 0.45 (swaps/total)5,
where (swaps/total)i is the ratio of swaps to all interest-rate derivatives for banks in portfolio i. All coefficients are significant at the 5% confidence level. The adjusted R2 of the regression is 0.23.

Banks and Derivatives * 323
contracts with a remaining maturity of less than one year (see the col- umn headed "Adjusted percentage" in Table 3).
Prices are calculated using interest rates on U.S. government securi- ties. There are four implicit assumptions in this calculation. First, swap contracts typically are indexed to LIBOR rather than Treasury-bill rates. LIBOR and Treasury rates are highly but not perfectly correlated. Sec- ond, credit risk is not included in our calculation. Third, we assume that all interest-rate swaps are the straightforward "plain vanilla" fixed-for-
floating contracts discussed above. Among the other types of swaps that banks trade are amortizing swaps and exotic swaps. Amortizing swaps have a notional value that declines over the life of the swap, much as the
principal due on an amortizing loan (such as a home mortgage) declines. These swaps are like plain vanilla swaps with a slightly shorter duration. Exotic swaps are small in notional value, but may be highly interest-rate- sensitive.13 Fourth, we assume swaps are held to maturity. Some swap positions are closed out early. To the extent that swaps positions are closed prior to maturity, we underestimate initial maturity. However, our estimates of interest-rate sensitivity are not affected by this.
6. Market Value of the Banking System's Interest-Rate Swap Position
6.1 THE BANKING SYSTEM
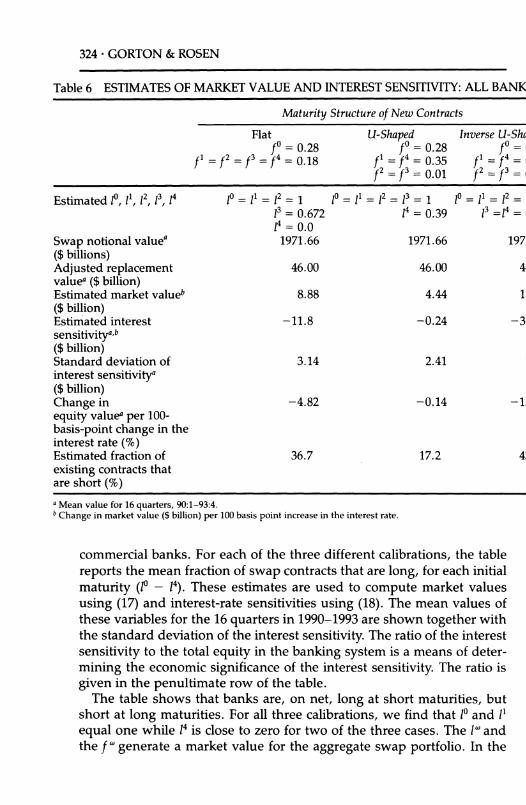
In this subsection, we look at the banking system as a whole. Our calibration technique assumes that the maturity structure of new con- tracts written is constant (Assumption 1). We choose a maturity struc- ture (the f to match the mean reported proportion of swaps with remaining maturity of less than one year. As Table 3 shows, this propor- tion is fairly constant during the 1990s (the only period for which we have data). Moreover, since there is not a unique set of f / consistent with reported remaining maturities, we examine three patterns of f '. We vary the buckets for swaps with initial maturities greater than one year to produce, roughly speaking, flat, U-shaped, and inversely U-shaped ma- turity structures for contracts of over one-year initial maturity. The flat pattern is f = 0.28 and f1 = f2 = f3 = f4 = 0.18; the U-shaped pattern is f0 = 0.28, f1 = f4 = 0.35, and f2 = f3 = 0.01; and the inversely U-shaped pattern is f0 = 0.28, f1 = f4 = 0.01, and f2 = f3 = 0.35.
Table 6 shows the results for the aggregate swap positions of U.S.
13. Estimates suggest that the proportion of exotic swaps is small. An example of an exotic swap is the deal between Bankers Trust and Proctor and Gamble. The value of this swap depended nonlinearly on 5-year and 30-year Treasury-bond interest rates.
324 * GORTON & ROSEN
Table 6 ESTIMATES OF MARKET VALUE AND INTEREST SENSITIVITY: ALL BANKS
Maturity Structure of New Contracts
Flat U-Shaped Inverse U-Shaped f? = 0.28 f? = 0.28 fo = 0.28
f = = f3 = f4 = 0.18 fl =f4 = 0.35 f' =4 = 0.01 f2 = f3 0.01 f2 f3 =0.35
Estimated 10, I1, 12, 13, 4 10 = I1 = 12 = 1 1? = I1 = 12 = 13 = 1 1? = 11 = 2 = 1 13 = 0.672 14 = 0.39 13 =4 = 0.0 l4 = 0.0
Swap notional valuea 1971.66 1971.66 1971.66 ($ billions) Adjusted replacement 46.00 46.00 46.00 valuea ($ billion) Estimated market valueb 8.88 4.44 13.55 ($ billion) Estimated interest -11.8 -0.24 -33.2 sensitivitya,b ($ billion) Standard deviation of 3.14 2.41 7.48 interest sensitivitya ($ billion) Change in -4.82 -0.14 -13.51 equity valuea per 100- basis-point change in the interest rate (%) Estimated fraction of 36.7 17.2 45.0 existing contracts that are short (%) a Mean value for 16 quarters, 90:1-93:4. b
Change in market value ($ billion) per 100 basis point increase in the interest rate.
commercial banks. For each of the three different calibrations, the table
reports the mean fraction of swap contracts that are long, for each initial
maturity (10 - 14). These estimates are used to compute market values using (17) and interest-rate sensitivities using (18). The mean values of these variables for the 16 quarters in 1990-1993 are shown together with the standard deviation of the interest sensitivity. The ratio of the interest
sensitivity to the total equity in the banking system is a means of deter- mining the economic significance of the interest sensitivity. The ratio is given in the penultimate row of the table.
The table shows that banks are, on net, long at short maturities, but short at long maturities. For all three calibrations, we find that 1? and 1'
equal one while 14 is close to zero for two of the three cases. The 1W and the f generate a market value for the aggregate swap portfolio. In the
Banks and Derivatives * 325
three examples, the mean ratio of estimated market value to replacement cost is between 10 and 30%. This is because banks hold swaps that are both assets and liabilities, and replacement cost does not net out the liabilities.
This fact that banks are long in the short maturities means that most of the contracts banks write and most of the contracts they hold at any moment are long. For the U-shaped maturity structure, for example, less than one-quarter of the existing contracts are short (see the last row of Table 6). But this does not tell us how the market value of their position changes with interest rates, since their long contracts are shorter in maturity than their short contracts. The interest-rate sensitivity depends more heavily on the direction of the longer maturities, since the longer maturities are more sensitive to interest-rate changes.
Because the banking system is net short in the longer maturities, an increase in interest rates could seriously erode equity in the banking system. We can directly address this question by calculating interest-rate sensitivity. Even for the U-shaped maturity structure, where over 75% of the contracts are long, interest-rate sensitivity is negative, indicating that the swap portfolio as a whole is effectively net short. For the three calibrations, interest-rate sensitivity ranges from -33 to -0.24. This means that a 100-basis-point increase in interest rates reduces total bank equity by an amount between $240 million and $33 billion. To see how big the reported interest-rate sensitivity is, compare it with the total equity in the banking system. Using the intermediate value for interest- rate sensitivity of -12, a 100-basis-point increase in interest rates reduces bank equity by 5%. Interest rates in 1994 went up by 200-300 basis points, indicating that, looking at swaps in isolation, the banking system could have lost roughly 10-15% of its equity.
The finding that the banks lost significant value on swap holdings does not imply that bank equity fell during 1994. Swap positions may have hedged other bank holdings. Although some banks have taken significant writedowns against equity because of losses on derivatives, system-wide equity has not declined, at least as measured by regulatory accounting rules.14 In Section 7, we explore the extent to which swap positions are hedged.
Notice that we report no "standard errors" in Table 6. This is because we use a calibration on the entire population of banks. There is no sampling error (i.e., we use data on all banks). Any errors in our re- ported values come from errors in our assumptions about the maturity 14. In April 1994, a variety of news reports indicated that the largest dealer banks reported
lower than expected earnings because of derivatives trading losses. More recently, Banc One, Mellon, and other end-user banks have also reported losses on derivatives.

326 * GORTON & ROSEN
structure of new contracts or errors in our adjustments to the data. One
way to assess the robustness of our assumptions is to see how our results change as we vary the assumed maturity structure. The results are qualitatively similar for all three maturity structures. To simplify reporting, henceforth, we show only the flat maturity structure. How- ever, as above, using other maturity structures calibrated on the re-
ported remaining maturity does not qualitatively change our results. One further point concerns interbank swaps. In our aggregation, we
do not net out interbank swaps. Thus, the data we use are not the net
position of the banking system, but rather the total gross activity. This does not introduce any problems into our analysis, because we aggre- gate replacement cost. Viewing the industry as a whole, any contract between two banks has a net zero replacement cost. Our aggregation procedure yields a positive replacement cost while assuming a zero mar- ket value for any interbank swaps.
6.2 THE DISTRIBUTION OF INTEREST-RATE RISK AMONG BANKS
Swap activity is concentrated at a small number of banks. This suggests that these banks may use swaps for different reasons than other banks. For example, swap positions may differ if some large banks specialize in
intermediating interest-rate risk while other banks use swaps for hedg- ing purposes. To examine this, we divide banks into portfolios by size and swap activity.
We form eight portfolios:
1. the seven large dealer banks listed in a House Banking Committee Minority Staff report (1993);15
2. the top thirty banks, by average assets from 1990 to 1993, excluding the dealer banks in portfolio 1;16
3. banks holding swaps with average assets greater than $5 billion, but not in portfolio 1 or 2;
4. banks holding swaps with average assets between $1 billion and $5 billion;
5. banks holding swaps with average assets between $500 million and $1 billion;
15. The Staff report lists eight major dealer banks, but we exclude Continental Bank be- cause it was controlled by regulators during much of this period (see footnote 6 for a list of the seven other banks).
16. Many of the banks in portfolio 2 conduct swap activity both as end users and as dealers (this is indicated by the fact that these banks are members of the International Swap Dealers Association). However, in general, these banks have a smaller propor- tion of dealer activity than banks in portfolio 1 (see, for example, Swaps Monitor, July 4, 1994, p. 2).

Banks and Derivatives * 327
6. banks not holding swaps with average assets greater than $5 billion, but not in portfolio 1 or 2;
7. banks not holding swaps with average assets between $1 billion and $5 billion;
8. banks not holding swaps with average assets between $500 million and $1 billion.
We want to calibrate the swap maturities for the five portfolios that include swaps. To do this, we choose a maturity structure for new con- tracts (for each portfolio) to match reported remaining maturity, as above. The model assumes that a constant proportion of new contracts are written with each maturity. The only information we have to confirm that banks are writing new contracts in constant proportions is the esti- mated ratio of swap contracts with less than 1 year remaining maturity to total swap contracts. Table 7 shows the proportion of contracts with
remaining maturity of less than one year for the 1990-1993 period, by portfolio.17 For portfolios 1-3, the proportion of remaining maturity less than 1 year is relatively stable. It is less so for the portfolios 4-5, but these groups hold few swaps (see Table 2).18
Table 8 presents results for the five portfolios of banks that hold
swaps. Note first that we calibrate the portfolios separately based on the
value-weighted remaining maturities. Portfolios 1 and 2 have approxi- mately the same remaining maturities, so we use the same assumed
maturity structure. The table shows that large banks are long in the short maturities (10, 1',
12, and 13), but short in the longest maturity (14). As the bank size de- creases, this pattern roughly reverses. The portfolio with the smallest banks, portfolio 5, is short in the short maturities (1? and 11) and long in the long maturities (12 and 13). It is important to keep in mind that the smaller banks have little swap activity. Swaps clearly are not the primary mechanism for small banks to hedge interest-rate risk.
Consistent with large banks holding most swaps, the dollar value of interest sensitivity is highest for portfolio 1. A 100-basis-point increase in interest rates reduces the value of dealer banks by $9 billion (prior to any potential gains from hedging). The banks in portfolio 2 would lose only $3 billion from a 100-basis-point increase in rates. The smaller portfolios
17. These columns are just linear transformations of the reported remaining maturity for interest-rate derivatives (see footnote 12 for the adjustment regression).
18. Note that our procedure assumes that the maturity structure of new contracts is con- stant. For individual banks, the proportion of remaining maturity less than 1 year is often not constant. Thus, attempting to calibrate individual bank positions introduces too much noise to derive meaningful additional information. This is one reason we form portfolios rather than calibrating on a bank-by-bank basis.

Table 7 PROPORTION OF SWAPS WITH LESS THAN ONE YEAR REMAINING, BY BANK GROUP (PERCENTAGE)
Portfolio 1 Portfolio 2 Portfolio 3 Portfolio 4 Portfolio 5 Dealer Top 30, Not Total Assets > $5 Total Assets Total Assets
Year Quarter Banks Dealers Bil. and Not 1 or 2 $1-5 Bil. $500 Mil.-$1 Bil.
1990
1991
1 2 3 4 1 2 3 4 1 2 3 4 1 2 3 4
1992
1993
31.6 32.0 31.2 32.4 30.8 30.6 32.4 30.3 30.0 30.2 29.4 30.5 30.5 30.4 30.3 31.0
26.0 26.2 26.3 26.4 27.4 26.7 25.9 18.6 26.8 27.8 27.3 27.9 28.1 27.2 27.1 26.8
31.5 32.5 34.9 34.9 34.6 35.2 34.9 34.6 33.0 34.6 33.3 32.5 32.3 31.8 32.6 34.2
38.9 41.9 45.0 46.8 47.9 49.3 50.0 47.0 41.9 45.3 41.8 42.8 40.1 45.0 45.0 31.1
23.0 25.9 25.6 26.4 11.7 19.0 24.5 21.0 20.6 18.8 19.6 16.6 18.2 18.2 12.3 12.3

Table 8 MARKET VALUE AND INTEREST SENSITIVITIES OF SWAP POSITIONS BY BANK GROUP
Portfolio 3
Portfolio 1 Portfolio 2 Banks with Total Portfolio 4 Portfolio 5 Dealer Top 30, Excluding Assets > $5 Billion, Banks with Total Assets Banks with Total Assets Banks Dealer Banks but Not in Top 30 $1-5 Billion $500 Million-1 Billion
I ..
Calibrated maturity f? = 0.28 structure fl = f2 = = f=
4 = 0.18 f1 Estimated 0, 11, l2, 13, 14 10 = 1 = 12 = 1.0
13 = 0.67 l4 = 0.0
Swap notional valuea ($ billion)
Adjusted replacement value ($ billion)
Estimated market valuea ($ billion)
Estimated interest
sensitivitya,b ($ billion)
Standard deviation of interest sensitivitya ($ billion)
Percent change in
equity valuea per 100-bp change in int. rate (%)
Estimated fraction of
existing contracts that are short (%)
1479.01
21.85
6.71
-8.98
5.62
-22.74
33.92
f0 = 0.28 f0 = 0.38 f0 = 0.78 fo = 0.16 2 = f3= f = 0.18 f = f2 = f3 = f4 = 0.155 fl = f2 = f3 = f4 = 0.055 f = f2 = f3 = f4 = 0.21 10 = 11 =12= 1.0 10= 1 = 1.0 10= 1.0 1 = 0.0
3 = 0.63 12= 0.07 1 = 12 = 13 = 0.0 1 = 0.05 4 = 0.0 13= 0.0 14 = 0.55 12 = 13 = 1.0
14 = 0.55 14 = 0.44 352.17 73.12 8.67 1.26
5.71
1.83
-2.86
8.65
-4.09
33.66
1.35
0.43
-1.25
5.23
-2.94
37.20
0.21
0.04
-0.11
0.83
-0.79
0.01
-0.01
0.03
0.10
1.64
33.80 60.26
aMean value for 16 quarters, 90:1-93:4. bChange in market value ($ billion) per 100-basis-point change in interest rate.

330 * GORTON & ROSEN
would be affected much less by rate changes. However, to assess the effect on banks-and especially the potential for bank failure-the rele- vant measure is the fraction of bank equity lost when rates change. By this measure, the dealer banks in portfolio 1 are much more exposed to rate increases than banks in any of the other portfolios; the dealer banks lose 23% of their equity from each 100-basis-point change in rates, while other portfolios lose less than 5% of their equity (once again, ignoring hedging).
7. Hedging Interest-Rate Risk From Swaps
Our evidence shows that the banks, especially large ones, are exposed to interest-rate risk from their swap portfolios, viewed in isolation. We examine in two ways the degree to which swaps are hedged. First, we examine whether the on-balance-sheet positions of banks are sensitive to interest rates in such a way as to offset the sensitivity induced by the
swap position. This is consistent with banks using swaps to hedge on- balance-sheet risk. Second, we look at the extent to which reported net income varies with interest rates and compare this with our results on the interest-rate sensitivity of swap positions.
7.1 MATURITY GAPS
Banks are exposed to interest-rate risk from their on-balance-sheet activi- ties when their assets do not reprice at the same time as their liabilities. One measure of the interest-rate sensitivity of a bank's balance sheet is its one-year maturity gap. The one-year maturity gap is the difference between the value of assets that reprice within one year and the value of liabilities that reprice within one year, divided by total assets.19 For exam- ple, if a bank has $20 million of assets that reprice within one year and $30 million of liabilities that reprice within one year, then the one-year gap is negative. If interest rates rise, the bank will have to pay higher rates on $30 million of its liabilities and will receive higher rates on only $20 million of assets. Thus, in this example, higher rates imply reduced equity value. We get data on the maturity structure of bank on-balance- sheet portfolios from the Call Reports.
Finding the one-year maturity gap requires assumptions about the repricing frequency of demand deposits and other liabilities held by consumers. Demand deposits can be instantaneously withdrawn, but evidence suggests that banks do not change their interest rates on depos-
19. Floating-rate loans reprice at the frequency that the floating interest rate is recomputed.

Banks and Derivatives - 331
its when market rates change (see Rosen, 1994). Moreover, NOW ac- counts also have effective maturities longer than their stated maturities
(see Hutchison and Pennacchi, 1994). We use two estimates of the one-
year maturity gap. The first (MATGAP) assumes that all assets and liabili- ties have effective maturities equal to their stated maturities. The second (MATGAP*) adjusts demand deposits and NOW accounts to allow for the longer effective maturities of these instruments. We assume that 40% of demand deposits and 40% of NOW accounts do not reprice within one year.20
Table 9 reports our two measures of maturity gap by year and bank size. The striking fact seen in the table is that dealer banks (portfolio 1) have a large positive maturity gap by either gap measure, while smaller banks consistently tend to have negative maturity gaps. This suggests that the short swap positions of dealer banks are offset by the on- balance-sheet portfolio. When interest rates rise, the swap positions lose value while the on-balance-sheet items gain in value. Unfortunately, the
one-year maturity gap is too coarse a measure to determine the net interest-rate sensitivity of dealer banks as a group.
The large nondealer banks (portfolio 2) have relatively small (in magni- tude) maturity gaps. This suggests that an increase in interest rates reduces the value of the swap portfolio, but this is not offset by changes in the value of on-balance-sheet items. Smaller banks tend to have nega- tive maturity gaps, but fairly small swap exposures.
7.2 USING NET INCOME TO ESTIMATE THE EXTENT OF SWAP HEDGING
We can take advantage of accounting identities to derive a more exact measure of the degree to which banks' swap exposures offset exposure elsewhere in the banks' portfolios. Banks report swap activity in two
ways. Banks are allowed by regulators to declare some swaps to be
hedging other bank activities (such as fixed-rate loans or interest-rate futures). Banks use "hedge accounting" to value swaps that are de- clared as hedges. Gains and losses on swaps in the hedge account are
recognized when gains and losses on the instruments that the swaps hedge are recognized. In other words, the reported net income on
hedge-account swaps and the instruments they hedge is zero. Other swaps are considered to be in the bank's trading account. Swaps in the
trading account are reported at market value. When interest rates move, only the change in value of trading-account swaps is reported as net income.
20. This adjustment appears consistent with the "management adjustments" that Banc One uses, as reported in its 1993 annual report.

Table 9 MATURITY GAPS BY BANK GROUP
Portfolio 1 Portfolio 2 Portfolio 3 Portfolio 4 Portfolio5
Year MATGAP MATGAP" MATGAP MATGAP* MATGAP MATGAP* MATGAP MATGAP* MATGAP MATGAP*
1990 23.4 28.7 -8.7 1.2 -7.7 1.9 -12.7 -1.8 -15.7 -3.9 1991 21.6 27.0 -11.7 -1.2 -12.0 -1.6 -17.2 -5.6 -19.5 -6.9 1992 19.7 25.9 -13.2 -1.2 -14.5 -2.3 -19.6 -6.4 -22.7 -8.4 1993 20.4 26.5 -9.9 2.4 -12.4 0.1 -18.9 -5.3 -22.5 -7.8 Mean 21.3 27.0 -10.9 0.31 -11.6 -0.5 -17.1 -4.7 -20.1 -6.7
a MATGAP is the one-year maturity gap assuming that all assets and liabilities have effective maturities equal to their stated maturities. MATGAP* assumes that 40% of demand deposits and 40% of NOW accounts do not reprice within one year. Source: Call Reports of Income and Condition

Banks and Derivatives - 333
This yields the accounting identity:
net income = net income of the unhedged nonswap activities + change in (market) value of unhedged swaps
+ net income of hedged swaps + net income of hedged nonswap activities.
Because of the accounting rules, the last two terms sum to zero. In the
previous section, we calculate the change in market value of bank swap positions when interest rates change. We do not know how the net income of the unhedged nonswap activities varies with interest rates. We assume that the relationship between net income and swap interest- rate sensitivity is given by the regression
dMVt NIt,, =a + dr PArt + it X,, + Et,p, (19)
tdr
where NIt, is the reported net income at date t for portfolio p, Xt,p is a vector of other independent variables that affect reported net income of
unhedged nonswap activities, and Et, is a white-noise error term. The
regression coefficient / measures the proportion of the swap portfolio that is unhedged.
Since banks have nonswap instruments that are affected by interest rates but that may not be hedged by swaps, reported net income can
change with interest rates from factors other than a change in the value of the swap portfolio. To take account of this, we include the change in interest rates as part of Xt,,. Net income is also affected by the default rate on loans. The default rate on loans may be correlated with interest rates (since both depend on macroeconomic factors), so we include loan chargeoffs in Xt,,. All the variables except the change in interest rates are divided by total assets to reduce heteroscedasticity.
Table 10 presents the regression results. We pool the eight portfolios in the regressions in columns 1-3. Notice that the change in interest rates and chargeoffs are both significant, with the expected signs (see columns 1 and 2). The key regression, in column 3, has size dummies for each portfolio and size dummies interacted with the interest-rate sensitivity variable calculated above for the five portfolios with swaps. In this re- gression, we focus on the coefficients on the interaction term. For the dealer banks, the coefficient is 0.09. This means that 9% of the swap exposure is unhedged. This is consistent with their swap position being short and their on-balance-sheet position being long (positive maturity gap). The large, nondealer banks (portfolio 2) have an exposure of 47%. This suggests that a much smaller fraction of their swap portfolio is

Table 10 SENSITIVITY OF NET INCOME TO SWAP POSITIONS
(1) (2) (3) (4)
Independent Estimated Standard Estimated Standard Estimated Standard Estimated Standard Variable Coefficient Error Coefficient Error Coefficient Error Coefficient Error
Intercept AR Charge-offs (dMV1/dR) AR (dMV2/dR) AR (dMV3/dR) AR (dMV4/dR) AR (dMV5/dR) AR Portfolio 1 Portfolio 2 Portfolio 3 Portfolio 4 Portfolio 5 Portfolio 6 Portfolio 7 Portfolio 8
Prob > F Adj. R2
1.02 0.33
0.0001 0.1685
0.036a 1.24 0.065a 0.24
-0.35
0.039a 0.053a 0.041a
0.0001 0.4783
0.33 -0.23
0.09 0.47 0.50 1.62
-0.96 1.17 1.14 1.03 1.08 1.00 1.58 1.15 1.23
0.0001 0.6907
1.14 0.079a 1.14 0.054a
Dependent variable is net income divided by total assets. AR is the change in the 3-month T-bill rate; (dMV/dR,) AR is the interest sensitivity of portfolio i's swap portfolio times the change in the 3-month T-bill rate; Portfolio i is a dummy variable for portfolio i. aSignificant at the 0.01 level. bSignificant at the 0.05 level.
0.43 -0.18
0.10 0.53
0.073a 0.051a 0.033b 0.172b
0.045a 0.043a 0.039b 0.20b 0.358 1.332 0.726 0.076a 0.057a 0.061' 0.057a 0.064a 0.050a 0.055a 0.052a
0.0001 0.6758
Banks and Derivatives * 335
hedged. Once again, this is consistent with recent reports of losses on
swaps by these banks. Examples in the fourth quarter of 1994 include Bank One, which announced losses of $170 million on "interest-rate bets"; Mellon Bank, which took a $130 million charge to cover deriva- tives losses; and KeyCorp, which took a $100 million charge (Wall Street Journal, January 9, 1995, p. A9). The coefficients on the interaction term for portfolios 3-5 are insignificant, possibly because these banks hold few swaps.
To test whether the inclusion of banks with little or no swap activity affects the coefficients for the large banks with swaps, column 4 of Table 10 presents the results of a regression including only portfolios 1 and 2. The coefficients are qualitatively similar to those in column 3. Compar- ing regressions 3 and 4 with regression 2 indicates that the inclusion of the interest-sensitivity variables and the portfolio dummies increases
predictive power by about 22 percentage points. The net exposure of a bank from its swap portfolio to changes in
interest rates depends on the degree to which its swap portfolio is
hedged and the size of its swap portfolio relative to equity. From Table 8, we know that when interest rates rise by 100 basis points, banks in
portfolio 1 lose 23% of their equity value from swaps. Table 10 indicates, however, that this loss is offset by an approximately 21% gain elsewhere in the bank's portfolio, leaving a net loss of 2% of equity, that is, $800 million. Similarly, portfolio 2 loses 47% of 4% of equity, that is, 2% of
equity, that is, $2.0 billion.
7.3 WHOM ARE BANKS TRADING WITH AND HEDGING WITH?
On net, the banking system, and specifically, dealer banks, hold un-
hedged positions in swaps. This raises two issues. First, who takes the other side of the swap trades? And, second, since banks are hedging their swap positions, whom are they hedging with? The answers to these questions would shed important light on why the swap market exists in the form it does.
With respect to the first question, the biggest holders of swaps outside of U.S. banks are foreign banks. As shown in Table 1, many of the largest swap positions are held by non-U.S. banks. We do not have enough information to know whether the non-U.S. banks are net long or short. However, we do know that some other end users of swaps seem likely to prefer long positions in the swap market. Nonfinancial U.S. corporations are said to be candidates to take long positions in swaps (see, for exam- ple, Swaps Monitor, July 4, 1994, p. 3). In addition, U.S. government agencies, including Fannie Mae, Sallie Mae, and the Federal Home Loan Bank of San Francisco, are significant end users. These agencies have

336 - GORTON & ROSEN
long-term fixed-rate assets such as home mortgages, making them likely to be long in swaps. We do not know whether it is these customers that are driving the net short swap positions of banks.
Now we turn to the second question, who is willing to take the interest-rate risk from the swap activity that banks are hedging. Interest- rate risk is nondiversifiable, so if banks are hedging, then the risk which was transferred to banks by customers is somehow being repackaged and possibly sold back to the same customers. If, in fact, the same customers are buying back the risk, via futures market positions, then the reason for the existence of the swap market is economies of scale or
scope. Banks are able to repackage risk in ways that customers prefer to hold.
Another possible counterparty for banks is foreign banks. Some of these banks are state-owned or otherwise protected from failure. This means that risktaking by these foreign banks may be subsidized by their
governments. This would make them a natural repository for any nondiversifiable risk, including interest-rate risk. Since most of the large U.S. bank swap dealers are "too big to fail," it is not clear why foreign banks, but not U.S. banks, should hold the residual interest-rate risk.
A remaining possibility is that banks' swap positions are less hedged than our regression results imply. There are two ways that our results can overestimate hedging. First, if banks underestimate declines in the market value of their swaps, perhaps because they underestimate po- tential credit losses, then we will underestimate the interest-rate sensi- tivity of their swap portfolios (reports of higher-than-expected credit losses on derivatives have recently appeared in the Wall Street Journal). Then, the coefficient on the interest-rate sensitivity term in the regres- sions is underestimated.
A second way that we can overestimate hedging is if net income is smoothed relative to interest rates. It is well known that banks smooth income (see, e.g., Greenwalt and Sinkey, 1988). Smoothing would occur if banks underestimated the unhedged losses and gains on derivatives. If smoothing is a major problem, then again the coefficient on the interest-rate sensitivity term in the regressions is underestimated. Note that if this is a problem, then the recent rise in interest rates might have caused large unreported losses at large banks.
8. Conclusions
Assessing risk requires information. There is very little publicly available information on the swap positions of banks. This means that it is very difficult to estimate the exposure of banks to interest-rate movements.

Banks and Derivatives - 337
Outside investors cannot impose discipline on banks without additional information. The information necessary to better assess the risks is avail- able, but not reported. This forces investors and society as a whole to
rely on bank regulators and examiners. Regulators and examiners have access to the relevant information when they monitor the derivatives
positions of individual banks. Unlike regulation of bank-loan positions, there is no inherent asymmetric information between banks and others about the risk of swap positions (except for concerns about credit qual- ity). This means that if sufficient information were made public, inves- tors could assess risk as accurately as bank insiders and examiners.
How much information should banks be required to report publicly? We do not know. There are two issues. One is permitting investors to
accurately estimate the market value of bank swap positions to make investment decisions. A second issue is to assess systemic risk in addi- tion to individual-institution risk. Systemic risk requires looking at the
banking system as a whole. What we are concerned with is the possibil- ity that a number of banks will suffer large losses on swaps at the same time. At a minimum, releasing the maturity structure of swaps and other derivative positions on a quarterly basis-comparable to what banks
currently release about on-balance-sheet activities-would allow a more detailed estimation of risk at little cost.
In this paper, we are forced to make several assumptions about matu-
rity to look at systemic issues. With our assumptions, we calculate mar- ket values and interest-rate sensitivities of swap positions in the banking industry. We find that the banking system as a whole, and dealer banks in particular, are exposed to interest-rate increases. However, we also find that banks seem to have hedged most of the risk. Our results suggest that there should be little concern about systemic risk from swaps, sub- ject to the limitations of our data.
A risk that we are unable to assess with the publicly available data concerns short-term gambles that banks take. Banks attempt to profit from what they see as short-term aberrations in market price. To profit, banks take short-term speculative positions on specific interest-rate events, such as a widening of the LIBOR-prime spread. Banks plan to close these positions quickly, especially if the market moves against them. Only if information were released on a frequent, perhaps daily, basis could these positions be monitored by outsiders. But it seems less likely that these types of strategies would contribute significantly to systemic risk. If many banks attempt to make the same bet on a specific event, they will quickly move market prices, eliminating the perceived profit opportunity.
One final concern is that our conclusions may be premature. The
338 * GORTON & ROSEN
nature of the swaps market might change, since swaps are a relatively new product. Swaps have been very profitable for dealer banks, which
may have mitigated the incentives for large banks with entrenched man- agements to take on risk (see Gorton and Rosen, 1995). Recent problems at Bankers Trust suggest that the industry may be entering a new, less profitable phase. Since swaps are opaque, regulators and others must carefully monitor banks to insure that once swaps are no longer as profitable, large dealer banks do not begin to use them as vehicles for
adding risk.
REFERENCES
Bank for International Settlements. (1992). Recent developments in international interbank relations. Report prepared by a working group established by the central banks of the Group of Ten countries (the Promisel report). Basle, Swit- zerland, October.
Bank of England. (1987). Potential credit exposure on interest rate and foreign exchange related instruments. March.
.(1993). Derivatives: Report of an internal working group. April. Basle Committee on Banking Supervision. (1993a). The prudential supervision of
netting, market risks, and interest rate risk. Preface to consultative proposal. April.
. (1993b). The supervisory recognition of netting for capital adequacy purposes. Consultative proposal. April.
. (1993c). The supervisory treatment of market risks. Consultative pro- posal. April.
. (1993d). Measurement of banks' exposure to interest rate risk. Con- sultative proposal. April.
Board of Governors of the Federal Reserve System. Quarterly terms of bank lend- ing. Various years.
Board of Governors of the Federal Reserve System, Federal Deposit Insurance Corporation, and Office of the Comptroller of the Currency. (1993). Deriva- tive product activities of commercial banks. Joint study conducted in response to questions posed by Senator Riegle on derivative products. Wash- ington, January 27.
Commodity Futures Trading Commission. (1993). OTC derivative markets and their regulation. Report of the Commodity Futures Trading Commission. Washington, October.
Dow, J., and G. Gorton. (1994). Noise trading, delegated portfolio management, and economic welfare. Working Paper No. 4858. National Bureau of Economic Research.
Federal Financial Institutions Examination Council. Call reports of income and condition. Various years.
Gorton, G., and R. J. Rosen. (1995). Corporate control, portfolio choice, and the decline of banking. Working paper, University of Pennsylvania.
Greenwalt, M. B., and J. F Sinkey. (1988). "Bank loan-loss provisions and the income-smoothing hypothesis: An empirical analysis, 1976-1984. Journal of Financial Services Research 1:301-318.
Comment 339
Group of Thirty, Global Derivatives Study Group. (1993a). Derivatives: Practice and principles. July.
. (1993b). Derivatives: Practices and principles, Appendix I: Working pa- pers. July.
. (1994). Derivatives: Practices and principles, Appendix II: Survey of industry practice. March.
Hadley, G. (1964). Nonlinear and dynamic programming. Addison-Wesley. House Banking Committee Minority Staff (1993). Financial derivatives. Novem-
ber. House Committee on Banking, Finance, and Urban Affairs. (1993). Hearings on
safety and soundness issues relating to bank derivatives activities, 103rd Con- gress, 1st Session (October 28), Serial 103-88.
Hutchison, D. E., and G. Pennacchi. (1994). Measuring rents and interest rate risk in imperfect financial markets: The case of retail bank deposits. Working paper, University of Illinois.
Rosen, R. J. (1994). What goes up must come down? Asymmetries and persis- tence in bank deposit interest rates. Working paper. University of Pennsylva- nia and the Federal Reserve Board.
Swaps Monitor. November 8, 1993. .July 4, 1994.
U.S. Comptroller of the Currency. (1993a). "National bank participation in the financial futures and forward placement market. Banking Circular BC-79 (3rd Rev.). OCC, April 19.
. (1993b). Risk management of financial derivatives. Banking Circular BC- 277. OCC, October 27.
U.S. Government Accounting Office. (1994). Financial derivatives: Action needed to protect the financial system. GAO/GGD-94-133.
The world's major derivative dealers. (1993). New York: Swaps Monitor Publications.
Comment PETER GARBER Brown University
1. Introduction
A standard view among bank regulators is that the presence of derivatives creates a potential for systemic risk that may wipe out a large fraction of
capital in banks. Moreover, such an event would create a distrust of banks that might ripple throughout the payment and credit system and lead to macroeconomic dislocation. Regulators are now searching for methods to boost the capital of banks adequately to cover the potential risks of deriva- tives. The dominant method that has emerged involves examining the derivative book and the overall book and stress-testing them by assuming extreme scenarios for market prices and measuring their impact on bank
capital.
340 * GARBER
Because derivative products potentially create a macroeconomic prob- lem, it is desirable to measure the magnitude of their systemic risks.
Ideally, if we outsiders had the derivative book of the banking system, we could undertake the same stress tests used by the regulators directly. Effectively, that is what Gorton and Rosen wish to do here. Unfortu- nately, we lack the detailed data on proprietary derivative books and bank stress-testing machinery. The data in the call reports are limited:
They give us only notional value of swap positions, replacement costs, and maturity. Nevertheless, employing a strong set of assumptions about maturity structure and positions, Gorton and Rosen have cleverly used these data to estimate the characteristics of the derivative book and stress-test these positions. Then they ask if capital is adequate to cover the movements in interest rates of the size that we have seen recently. They find that the value of the swap book is quite sensitive to such interest-rate jumps but that the banks seem to be taking swap positions that hedge other interest-rate mismatches. Thus, Gorton and Rosen's result is reassuring: No obviously excessive market risks are being taken, even by the too-large-to-fail banks.
This is a valuable contribution, given the informational vacuum in which we outsiders are forced to work. Naturally, it would be preferable if we could get the "real stuff"-for example, if we could get the regula- tors to provide us with time series of off-balance-sheet market positions of the banks, or at least to provide us with data on sensitivities to market price movements generated by their own stress tests. Then we would have a much more accurate picture of the risks in the banking system than can be provided by techniques that must paper over large gaps in data with simplifying assumptions. To protect proprietary information, this could be done at least for some levels of aggregation of the banking system.
In the absence of such information, however, Gorton and Rosen's research is the kind of exercise that we have to do, so I read this paper with great interest. I have a few comments on the technical aspects of the work, but in general these remarks will propose some fine-tuning of their techniques. I will also discuss the implications of Gorton and Rosen's results for various explanations that have been offered for the rapid proliferation of derivative products.
2. The Calibration Technique In this paper, the key to determining the market value of a bank's swap book from data on replacement costs is to compute a set of f "-vectors for each of the sixteen quarterly observations. For each observation, the

Comment 341
elements of the f "-vector represent the fractions of new contracts written in the period for the range of possible maturities. The authors limit the
range to five maturities, with a maximum of 5 years. The calculation of market value from replacement cost also requires knowledge of the frac- tion of new contracts originated at a given date and for a given maturity that are long. Thus the authors need to compute the l"-vector for each
period, with five elements representing the possible maturities. For each of the sixteen periods, there are nine unknowns-the ele-
ments of the fw and 1" vectors-whose values are required to compute the market value of the swap book. But there are only three pieces of data: the notional value of outstanding contracts, replacement cost, and the fraction of notional value represented by contracts with less than one
year until maturity. To circumvent this lack of identifying information, Gorton and Rosen
assume that the f and l" vectors are fixed parameters across observa- tions. This is a strong assumption-that subsets of the banking system always contract a fixed fraction of business at a given maturity and
always take the same long or short position at a given maturity. The authors argue that this assumption is most palatable for the banking sector taken as a whole: If the position and maturity requirements of the end users are relatively unchanging, so will be the characteristics of the
swap product provided by the banking sector. To continue a little further with the construction of the f and 1" vec-
tors, the authors' calibration technique involves starting with an arbi-
trary pattern of the f "-vector, restricted only by the requirement to match the data on the fraction of notional amounts outstanding of less than one year in maturity. Given the f -vector, the authors compute the amounts of new contracts in each period, and then calculate the l"-vector by quadratic programming, minimizing the deviation of RC* from the right side of equation (16) subject to the elements of I/being between zero and one. This procedure is necessary because the assumption that the f W and l" vectors are constant has overidentified the system.
As an alternative methodology, suppose that we choose the pattern of the l"-vector arbitrarily. Then we can back out the f -vector in a similar quadratic programming exercise. For the final calibration of the f W and 1"
vectors, it should not matter that we start with an arbitrary f W or 1W vector. That raises the question: Starting with the /"-vector generated by the authors' technique, would application of quadratic programming yield the arbitrary f -vector with which they started? Alternatively stated, are the f" and 1" vectors produced by Gorton and Rosen a fixed point of
applying these alternative calibration methods in sequence? If not, would applying these two different approaches in sequence converge to

342 * GARBER
a fixed point? Are there multiple fixed points? Finally, and most impor- tantly, will the lack of a fixed point cause us to miscalculate the interest
sensitivity of the banks' swap book?
3. Why Are There So Many Derivatives?
Gorton and Rosen conclude that banks are taking interest-rate risk in their swap book. Nevertheless, because the market value of bank equity did not decline significantly following rises in interest rates, they also conclude that the unbalanced positions in the swap book must be offset by opposite mismatches in on-balance-sheet lending and securities hold- ing. If this conclusion is robust, it adds to the conundrum of why over- the-counter derivatives markets have expanded so rapidly.
To explain the large-scale use of derivatives, we can tell stories about how they permit the rapid reallocation of the risks of market price move- ments, but we lack a convincing explanation of why securities markets cannot do the same job. Particularly problematic is the use of interest- rate swaps. The standard argument is that there are gains from trade between fixed-rate and floating-rate payers that are unexploited by the markets for short-term and long-term securities. This argument can be carried through if we presume that floating-rate payers know more about the market than do other lenders; but because the firms engaged heavily in the use of interest-rate swaps are credit-rated corporates with access to securities markets, this story does not bear up well, even if banks are the principal counterparties.
A more logical alternative is that the market is fostered by too-large-to- fail banks engaged in underpricing risk and avoiding on-balance-sheet
capital requirements while free-riding on the financial safety net. Banks benefit both from the lower capital requirements on off-balance-sheet positions and from the additional opacity that the derivative book lends to their overall position vis-a-vis market risk. However, the authors' conclusion that the too-large-to-fail U.S. banks are well hedged under- mines this explanation.
If banks do not bear market risk, it must be borne by end users who want to carry it in the form of derivative products. Portfolio managers may want to carry yield-enhancing derivatives to get a leg up on the benchmarks while remaining within the restrictions imposed by their prospectuses. Derivatives provide a method for generating increased yield that is opaque to both shareholders and senior management. Re- cent debacles to end users of leveraged derivative products suggest that such obscure forms of yield enhancement have been a major source of demand.

Comment 343
In this regard, it is instructive to consider the losses to the holders of "toxic waste" by-products of mortgage-backed securities. These losses have eliminated the demand for such risky products and thereby de- pressed the market even for the lower-risk securities generated from such pools. This leads to a hypothesis that the toxic-waste components of derivatives are those in demand and those that generate the profits; the low-risk securities produced in the process of generating toxic waste are the by-products of the process. A slight underpricing to dispose of the low-risk by-products would allow them to dominate the standard securities markets. If the demand for toxic waste were to dry up, how- ever, so would the supply of low-risk products, as has recently occurred in the mortgage-backed securities market.
The rise of mutual funds and pension funds-operated by managers compensated on the basis of yield performance relative to a benchmark- provides a growing demand for risk-enhancing devices. Derivative prod- ucts, which are generally not understood by shareholders and senior
management, satisfy this demand. By means of these products, interest- rate risk, which had resided in the on-balance-sheet activities of banks due to the financial safety net, now can be channeled into the pension and mutual funds.
Comment1 GREG DUFFEE Federal Reserve Board
1. Introduction The authors attempt to answer two questions using bank call-report data. First, how exposed to fluctuations in interest rates is the banking sector's interest-rate swap book? Second, to what extent is this swap book hedged by banks? Before discussing these questions in detail, I should note that, owing to a dearth of publicly available data, the task the authors are taking on is very difficult. Indeed, a standard view is that existing public data are wholly inadequate to determine the risk-taking behavior of banks. See, for example, the discussions in the Fisher Report (Euro-currency Standing Committee Working Group, 1994) and Moody's (1994). Hence while I will question the paper's success in answering these questions, this is not a failing of the authors, but rather of the data.
1. The analysis and conclusions in this comment are those of the author and do not indicate concurrence by other members of the research staff, by the Board of Governors, or by the Federal Reserve Banks.
344 DUFFEE
2. How Risky Are Banks' Swap Books?
Given enough assumptions about interest-rate swap replacement costs and maturity structure, as well as the stability of banks' positions in these swaps, the authors are able to construct the interest-rate sensitivity of the banking sector's interest-rate swap book. One interpretation of this effort is that the authors are taking the steps necessary to estimate this sensitivity with call-report data. Another interpretation is that the authors are showing us how much we don't know, but need to know, about banks' trading behavior in order to extract useful information from the data in bank call reports.
This is not to say that the authors do a poor job of estimating the interest
sensitivity of swaps. If I were forced to use call-report data to estimate this
sensitivity, I'd use their approach. Unfortunately, we don't know how confident to be in their estimates, because we don't know the sensitivity of the authors' estimates to variations in most of their assumptions. There are, however, two pieces of evidence that suggest these sensitivities are high. First, their Table 6 reports that changing the assumed maturity structure of new contracts from U-shaped to flat (holding all other assump- tions constant) results in a 50-fold increase in calculated interest sensitiv-
ity. Second, raising the assumed fraction of swaps with less than a year to
maturity from roughly 33% (the mean value used in their paper) to 50% (the value used in an earlier version of this paper) increases the interest
sensitivity by a factor of 3. Two assumptions that are particularly weak, but very hard to relax,
are the assumed stability over time of banks' positions and maturity structure. Swaps Monitor uses annual reports and SEC filings to esti- mate the interest-rate swap positions of end users (i.e., those taking the opposite side of dealer banks' positions). They estimate that in 1991, end users paid fixed, or were long, on 60% of their interest rate swaps; by 1993, this figure had fallen to 38%. In other words, there has been a large shift in end-user positions out of long contracts and into short contracts, suggestive of a corresponding reduction in dealer banks' net short position over time. The average maturity of interest- rate swaps is widely believed to have fallen over time as well, although I am unable to find any recent data that document the strength of this pattern.
However, for the sake of argument, assume that the authors have correctly calculated the interest sensitivity of banks' swap books. The authors then ask whether this sensitivity is hedged elsewhere in banks' books.

Comment 345
3. Are Banks' Interest-Rate Swap Books Hedged?
Depending on how we interpret this question, the answer may or may not be meaningful. Banks do not manage their risks instrument by instru- ment; they focus on the risk of their overall profit or loss. The mix of instruments used by banks to attain their desired risk profile depends on the relative costs of transacting in the instruments.
One relevant question is whether banks use interest-rate swaps as one of the tools to reach their desired sensitivity of net income to interest rates. It is clear from a reading of column 1 in Table 10 that banks do not use interest-rate swaps in this way (although the authors do not point this out). This regression indicates that banks' net income rises when interest rates rise, a relation that is presumably chosen by the banks. This overall relation is opposite the relation that the authors find be- tween banks' swap values and interest rates. The authors' maturity-gap analysis corroborates this evidence. Hence, subject to the caveat that economic income and accounting income can differ, other factors (such as capturing the swap bid-ask spread) are driving banks' positions in the swap market.
The authors are asking a different question with their regression analy- sis. They want to know whether there are specific banking activities that offset the interest-rate swap positions. This question, as formalized by their regressions, is: To what extent is the time variation in the sensitivity of swap income to interest rates matched by time variation in the sensitiv- ity of net income to interest rates?
Note that the sensitivity of banks' swap income to changes in interest rates is not constant over time, largely because the notional principal of interest-rate swap books varies over time. This sensitivity can be calcu- lated given the authors' assumptions about the changing structure of banks' swap books over time. The authors' regressions test whether this calculated sensitivity helps explain variations over time in the sensitivity of net income to interest rates. At one extreme, if there were no explana- tory power, the authors would conclude that banks' swap books must be completely hedged elsewhere in banks' portfolios. At the other extreme, if the sensitivity of net income moved in lockstep with the sensitivity of swap income, the authors would conclude that banks' swap books must be unhedged. They find that overall, banks' swap books are largely hedged.
However, it is not clear what this result tells us about the risks that banks take with interest-rate swaps. Consider a hypothetical bank that desires a large, negative, and constant relation between its net income

346 DUFFEE
and changes in interest rates. This negative relation is achieved with a mixture of swaps and futures, with the mixture varying over time, de-
pending on the relative costs of transacting in the two markets. By the authors' criteria, the bank's interest-rate swap book would be hedged, since the variation over time in the sensitivity of swap income would not be accompanied by any variation over time in the sensitivity of net income. Yet a reasonable interpretation of this hypothetical bank's activi- ties is that it does not hedge its swap positions, but in fact uses them to
speculate.
4. What Do These Results Mean? The authors are primarily interested in systemic-risk issues. In my view, the important issues can be summarized in two questions. First, are banks using derivative instruments to take on excessive risks? Second, if
they are doing so, is there some government policy (perhaps changing the regulation of derivative markets and/or of banks) that would reduce these excessive risks in a cost-effective manner? The biggest problem the authors face in addressing these questions is that they only have data on interest-rate swaps. Banks are involved in other derivative activities that are very sensitive to interest rates, such as interest-rate forwards, caps, floors, and futures. They are also big players in foreign-exchange, com- modity, and equity derivative markets.
Moreover, positions in over-the-counter derivative instruments, such as interest-rate swaps, tend to be driven by customer demand, and therefore tell us little about banks' overall risk profiles. Firms typically adjust their risk profiles in futures markets. For example, commercial banks (trading for their own accounts) are often among the institutions with the largest open positions in interest-rate futures markets.
Even if we abstract from these data problems, "snapshots" of posi- tions and partial derivatives are, by themselves, unlikely to answer the important questions concerning systemic risk. In order to answer these questions, we need to know banks' reaction functions to changing eco- nomic conditions (both their own economic health and the state of the economy at large). The assumption that banks do not adjust their portfo- lios in reaction to new information is both empirically false and theoreti- cally weak. If banks systematically reduce their risks as their net assets fall (perhaps in response to regulatory prodding), risktaking behavior that is large on average need not be excessive. Conversely, if banks systematically increase their risks as their net assets fall, banks are taking excessive risks even if their risktaking is very low on average.
From a policy perspective, even full knowledge of banks' positions

Discussion 347
and reaction functions may be insufficient, because banks will adjust their behavior in response to government policies. Banks choose their desired overall risk profile, but not the risk profile of any particular class of assets. Therefore the contribution of any particular set of financial instruments to the variance of bank profitability is endogenous, and to some extent arbitrary. Hence regulatory restrictions on one type of instru- ment will be ineffective as long as banks can shift their risktaking behav- ior to another type of instrument. For example, banks can take very large bets on interest rates in the repo (cash) market for Treasury securities.
But if the allocation of risks in banks' portfolios is arbitrary, why is there so much attention paid to banks' derivatives activities? The reason is that investors and regulators are concerned that banks may take risks with derivatives that cannot be observed by outsiders until it is too late. In other words, the problem is not that the volatility of banks' derivative
positions is high, but that outsiders don't really know what this volatility is. As the authors point out, if risktaking is unobserved, it may be
optimal for banks to take on risks that are excessive even from the
perspective of stockholders, let alone regulators. This opacity is behind the push by investors and regulators for increased disclosure of banks' market risks.
In response to this push (formalized in accounting standards such as FAS 107 and 119), banks are making public more information about their derivative activities. They are also revealing certain private information to the rating agencies. As the authors mention, additional information is now collected on call reports, although for the dealer banks, on-site bank examinations are a much more important regulatory tool than are call-
report data. Even the enhanced call-report data (let alone those analyzed by the authors) are insufficient, by themselves, to address the important questions concerning systemic risk.
REFERENCES
Euro-currency Standing Committee Working Group. (1994). Public disclosure of market and credit risks by financial intermediaries. Basle: Bank for Interna- tional Settlements, September.
Moody's. (1994). Derivatives activities of US commercial banks. Special Com- ment. October.
Discussion
Gary Gorton responded to Duffee's comment on the value of the Call Reports data. He stressed that the data, though incomplete, do provide Gary Gorton responded to Duffee's comment on the value of the Call Reports data. He stressed that the data, though incomplete, do provide

348 * DISCUSSION
useful information, and that, under the assumption that the swap indus- try is in a steady state, Gorton and Rosen's approach at least provides a first pass at evaluating the systemic risk associated with banks' deriva- tives activity. Richard Rosen added that the important question was whether banks were hedged overall, not whether the banks had big or small swap positions; hence, even if different assumptions led to differ- ent estimates of swap positions, the hedging regression would remain valid. Martin Feldstein agreed that the important question was the net exposure and not just the swap exposure per se.
Feldstein also pointed out that the authors focus solely on interest-rate risk while ignoring counterparty risk. He argued that adding credit risk to their framework would increase the overall level of riskiness of the banks' positions in the derivatives markets. Ben Bernanke noted that in most derivatives markets there were clearing houses to guarantee the counterparty and asked why there were no clearing houses bearing the credit risk of interest-rate swaps. Gorton suggested that, in some scenar- ios, the lack of margin requirements and marking to market in swaps might be the source of their appeal to traders.
Several participants emphasized the need for more disclosure of infor- mation on banks' derivatives positions. Feldstein noted that more infor- mation is currently becoming available and that the new disclosures generally support the authors' finding that the banks are not taking large risks, relative to the size of their assets and capital. Rosen agreed that more data had started to become available recently, but suggested that there was not yet enough information to permit significant improve- ments in their estimates. Bob Hall argued that the real question was what the disclosure requirements ought to be; ideally information re- leased by public corporations (including banks) should facilitate investor decision making. Since banks happen to be insured by the public, they should be required to give the public information on the risks they are taking. Another reason for releasing information about banks' risks, Hall suggested, was to help guarantee a risk-free payments system. Contrary to the claims of several participants, Hall argued that the current pay- ments system is not truly instantaneous, so that the Fed bears some residual credit risk.
Julio Rotemberg asked what position banks had generally taken in the recent instances in which they had lost money in swaps. Rosen answered that in general, regional banks had been in a short position, betting on interest rates either remaining constant or continuing to decline.
Steve Cecchetti stressed the importance to the authors' results of their assumption of a constant term structure of contracts, both in absolute levels and over time. He argued that, in general, banks would want to

Discussion 349
change both the maturities and net positions of their hedges as financial conditions change. Gorton replied that their model was constructed not for an individual bank but for the entire banking industry: While an individual bank may change its positions rapidly, the assumption that the industry as a whole would maintain a constant maturity structure and mix of short and long positions is not so unreasonable. He added that their model allowed them to perform any experiment concerning the interest sensitivity of the market value, given a set of assumptions about the term structure. Duffee suggested that the maturity structure had been shortening over time.
Bob Hall suggested that the volume of swap trade is very difficult to
explain, unless the vast majority of trades are sales of "snake oil." Gor- ton said that when the swap market first developed, people argued that
they created an opportunity for trade among customers of different credit quality. But he noted the likely importance of the agency problem which arises from the performance-linked compensation contracts of
money managers. Martin Feldstein characterized bank risk management as the writing of
a big variance-covariance matrix of potential assets, followed by a com-
putation of the earnings variability associated with different positions. Gorton noted that this approach would help banks project the effects of a 100- or 200-basis-point movement in interest rates. Duffee took issue with this view of risk management. He argued that this static approach was better described as risk measurement, while risk management was
inherently unobservable by accounting mechanisms. Risk management pertains to the banks' reaction functions: How do banks adjust their
portfolios as interest rates begin to move? Do they close their positions very quickly or do they keep them open? Duffee stressed that the Fed worries about both the reaction functions of banks as well as their expo- sure to risk in a more static sense.
Related Documents