How Did Banks Deal with Credit Derivatives during the Financial Crisis? Undergraduate Thesis Presented in fulfillment of requirements for graduation with Distinction from the Fisher College of Business By Shangmin Yu Undergraduate Finance Student The Ohio State University 2012 Thesis Committee: René M. Stulz, Advisor Jack Bao H. Rao Unnava

Welcome message from author
This document is posted to help you gain knowledge. Please leave a comment to let me know what you think about it! Share it to your friends and learn new things together.
Transcript

How Did Banks Deal with Credit Derivatives during the Financial Crisis?
Undergraduate Thesis
Presented in fulfillment of requirements for graduation with Distinction from the Fisher
College of Business
By
Shangmin Yu
Undergraduate Finance Student
The Ohio State University
2012
Thesis Committee:
René M. Stulz, Advisor
Jack Bao
H. Rao Unnava

2
Copyright by
Shangmin Yu
2012
3
Table of Contents
Chapter I: Introduction 4
Chapter II: Literature Review 6
Section 1: Introduction to credit derivatives 6
Section 2: The reasons for banks to use credit derivatives 8
Section 3: The problems related to credit derivatives and their role in the financial crisis 11
Chapter III: Research Data and Methodology 16
Section 1: Sample Description 16
Section 2: Data Source Description 17
Section 3: Research Goals and Methods 18
Chapter IV: Results 22
Section 1: How did credit derivatives positions at banks change during the financial crisis? 22
Section 2: How did the value of credit derivatives change? 28
Section 3: Have the credit derivative positions in the banking sector become more
concentrated? 30
Section 4: What major events happened in the financial crisis and what role did credit
derivatives play in these events? 33
Section 5: Which banks are major users of credit derivatives and what information did they
disclose about their use of credit derivatives? 36
Chapter V: Conclusion 43
References 44
Appendix I: Banks in the Sample 48
Appendix II: Banks Excluded from the Sample and Reasons 50
Appendix III: Tables 52
Appendix IV: Annual Reports Summaries 55
4
Chapter I: Introduction
Many observers argue that credit derivatives played a big role in the recent financial crisis. Alan
S. Blinder, the Gordon S. Rentschler Memorial Professor of Economics and Public Affairs at
Princeton University, regards “wild derivatives” as the first error leading to the financial crisis.1
David Paul, the president of the Fiscal Strategies Group, concludes that without credit default
swaps, AIG would still be in business.2
A credit derivative is just a type of credit risk transfer instrument. It separates credit risk from
the underlying asset and transfers the risk to others who can better bear it. To understand how
credit derivatives works, let's take the bilateral single name credit default swap (CDS), the
simplest and most commonly used type of credit derivative as an example. If bank Alpha has
issued a loan and is afraid of the default risk, it can enter into a CDS contract with bank Beta to
insure the loan. If the loan borrower defaults, bank Alpha would receive a payment from bank
Beta to recover its loss. In return, like an insurance contract, bank alpha has to pay bank beta
premiums over time for the credit protection.
However, Stulz (2010) indicates that there are two differences between a CDS contract and a
typical insurance contract. First, you don't have to actually hold the reference entity3 to buy
credit protection through CDS, which means that you can take a short position on a credit event.
Second, a CDS contract can be traded, while an insurance contract is not tradable.
1 Alan S. Blinder. "Six Errors on the Path to the Financial Crisis."
2 David Paul. "Credit Default Swaps, the Collapse of AIG and Addressing the Crisis of Confidence."
3 Reference entity is the underlying party in a credit derivative contract. It can be a company, government or other
legal entity that issues debt of any kind. The protection buyer transfers the credit risk of the reference entity to the
protection seller through a credit derivative contract.
5
While many studies have analyzed the benefits and risks of credit derivatives and the role they
played during the financial crisis, there is only limited research about how banks dealt with their
credit derivatives during the toughest time of financial crisis. With data collected from the
Consolidated Financial Statements for BHCs (FR Y-9C), I conclude that the notional amounts of
credit derivatives held by banks boomed in 2006 and 2007 but reduced sharply in 2008 and
2009. I believe that the plunge in notional amounts is due to the counterparty credit risk. Then, I
use the Herfindahl–Hirschman Index to calculate the concentration level of credit derivatives
positions in the banking sector, and I find out that the credit derivatives positions were highly
concentrated during the financial crisis. I also briefly review the significant events that happened
in 2008 and summarize the role that credit derivatives played in these events. Finally, I discover
that JP Morgan Chase, Bank of America and Citigroup were the major users of credit derivatives
in 2006-2010. Most of their positions were used for trading, but they did use credit derivatives
for hedging their own portfolios. They largely matched their bought and sold protections and
took the counterparty credit risk into consideration.
The paper is organized as follows. In Chapter II, I review the studies on credit derivatives,
including introduction to credit derivatives, the reasons for banks to use credit derivatives, and
the problems related to credit derivatives and their roles in the financial crisis. In Chapter III, I
describe the research data and methodology, including sample description, data source
description, research goals and methods. In Chapter IV, I examine my hypothesis with data,
review the significant events that happened in 2008, and summarize the important information
about credit derivatives disclosed by major dealers of credit derivatives. Finally, in Chapter V, I
draw my conclusion.
6
Chapter II: Literature Review
Section 1: Introduction to credit derivatives
There are many studies introducing credit derivatives, and most of them are from the industry.
Among them, J.P. Morgan (1999), Lehman Brothers (2003) and Parker (2007) describe the
characters and functions of credit derivatives comprehensively.
J.P. Morgan (1999) defines credit derivatives as “bilateral financial contracts that isolate specific
aspects of credit risk from an underlying instrument and transfer that risk between two parties.”
Credit derivatives are different from other traditional credit instruments because they can
precisely isolate and transfer certain aspects of credit risk rather than their underlying assets. J.P.
Morgan introduces three basic credit derivative structures, which are credit default swaps, total
return swaps and credit options. The credit default swap (CDS) is a bilateral financial contract in
which the protection buyer pays periodic premiums in return for a contingent payment from the
protection seller if a credit event related to the reference entity happens. The credit events
include failure to meet payment obligation when due, bankruptcy, repudiation, material adverse
restructuring of debt, obligation acceleration and obligation default. A total return swap (TR
swap) exchanges the total economic performance of the underlying asset for another cash flow,
regardless of whether a credit event has occurred or not. Specifically, one party of the TR swap,
the total return payer, pays the total return, which includes the sum of interest, fees, and any
change-in-value payments, of the reference obligation to the other party, the total return
receiver. In return, the total return receiver usually pays LIBOR plus a spread to the total return
payer. Credit options can be put or call options on the price of a floating rate security, loan, or
an asset swap package which comprises a credit-risky instrument and a corresponding derivative
that swaps the cash flows of that instrument for a floating rate cash flow stream.

7
Lehman Brothers (2003) says that the primary purpose of credit derivatives is to transfer and
repackage credit risks efficiently. The single name credit default swap was the most used
instrument with 73% of market outstanding notional in 2003. Lehman Brothers believes that
hedging synthetic CDO positions, exploiting capital structure arbitrage opportunities and
shorting credit market are the reasons for the drastic growth of CDS market. It introduces more
exotic structured credit products such as basket default swaps, synthetic CDOs, credit options
and hybrid products. A basket default swap is similar to a CDS, but the difference is that the
trigger is the nth credit event, which may be larger than 1, in a specified basket of reference
entities. A synthetic CDO allows different tranches to take default losses in a portfolio of CDS in
a specific order to redistribute default risk. The strategies of credit options include the repack
trade, put bond stripping, price-based options, spread-based options, covered call strategy,
naked put strategy, payer default swaption, receiver default swaption, callable default swaps,
and credit portfolio options. Hybrid credit derivatives usually combine credit risk with other
market risks such as interest rate or currency risk. Typically, they are linked to the value of a
derivatives payout, such as an interest rate swap or an FX option. Clean and perfect asset swaps
and counterparty risk hybrids are representatives of hybrid credit derivative. Lehman Brothers
points out that credit default swap is the basic building block for more complicated credit
derivatives.
Parker (2007) describes several types of credit default swaps, such as single name credit default
swaps, basket credit default swap, recovery swaps, constant maturity credit default swaps,
credit spread derivatives, and swaptions. A recovery swap allows the buyer to purchase
deliverable obligations whose amount is equal to the credit default swap’s notional amount
from the seller, at a predetermined strike price. Then, the buyer can sell the deliverable
obligations into the market or use them itself as seller in a back-to-back credit derivative
transaction. Constant maturity credit default swaps (CMCDS) are standard credit default swaps
but at the beginning of each fixed-rate payer calculation period, the fixed payment will be reset.
They can be viewed as a series of credit default swaps referencing the same reference entities,
and the length of each credit default swap is the fixed-rate calculation period. Under a credit
spread derivative, a reference entity’s creditworthiness is compared with a risk-free benchmark
such as US Treasury bonds or LIBOR, and any difference between the two yields will be assumed
to be caused by credit risk. Put and call options are most common forms of credit spread
8
derivatives. A swaption combines a swap and an option. It gives the swaption buyer the right,
but not the obligation, to make the swaption seller enter into a credit default swap contract.
Parker also introduces credit indexes. He indicates that iTraxx Europe, iTraxx Europe Crossover
and iTraxx Europe HiVol are the three most actively traded indices for Europe. The iTraxx Europe
index selects reference entities based on their credit default swap trading volume. The iTraxx
Europe Crossover index is composed by the top 40 commonly traded European sub-investment
grade reference entities. The iTraxx Europe HiVol consists of the top 30 highest spread names
from iTraxx Europe. These indices improve market liquidity by enhancing credit derivatives
transaction volumes and decreasing market entry barriers.
J.P. Morgan, Lehman Brother and Parker all categorize credit derivatives as either unfunded or
funded. In an unfunded credit derivative contract, the protection seller makes no upfront
payment to cover its potential future liabilities, and only makes a payment when credit events
happen. On the other hand, in a funded credit derivative contract, the protection seller has to
fund an initial payment for the protection buyer to buy high quality collateral. In return, the
protection seller receives a coupon. At maturity, if no default has occurred, the protection seller
is returned the initial payment; otherwise, the collateral will be sold to cover the loss. This is
exactly how a credit linked note works. All of them also mention that the International Swap and
Derivatives Association (ISDA) has made a standardized ISDA Master Agreement to allow the
parties to specify the precise terms of the transaction from a number of defined alternatives
since 1991.
Section 2: The reasons for banks to use credit derivatives
J.P. Morgan (1999) points out that there are three advantages to use credit derivatives. First, the
reference entity is not a party to, and even not aware of a credit derivative transaction. So, the
user of credit derivatives can manage its credit risks without affecting important customer
relationships. Second, purchasing credit protection with a credit derivative can create a
synthetic short position of a bank loan. The user of credit derivatives is able to pay a small
premium for a possible large gain if credit deterioration happens. Third, most of credit
derivatives are off-balance-sheet instruments, so they provide financial institutions with
9
considerably flexible leverage, such as reducing economic and regulatory capital, keeping
funding-cost at low level, and maintaining borrower and market confidentiality.
Prato (2002) says that the key innovation of credit derivatives is that they allow market
participants to sell credit risk on a claim but still record the claim on the balance sheet. On the
other hand, their counterparties are able to purchase the credit risk without bearing the
financing cost or interest rate risk. By decoupling credit risk from the actual claim, credit
derivatives are able to synthetically transfer a claim, and it makes risk management more
flexible for both risk sellers and risk buyers. Credit derivatives can be used as hedging
instrument, investment instruments and trading instruments.
Effenberger (2003) summarizes the benefits of using credit derivatives. First, they are able to
separate the value of credit funding from the value of credit risk assumption, so they allow
credit risk trading. Credit risk management has been separated from liquidity management,
which fundamentally changes the nature of banks’ risk management. For specialized banks,
whose loan books are highly concentrated in particular regions or sectors, credit derivatives
allow them to defuse concentrations of risk without disrupting client relations and to bring more
diversity into their portfolio. Thus, credit derivatives help the specialized banks exploit their
regional lending potential. Moreover, credit derivatives may create new risk management
strategies for banks. With credit derivatives, banks may focus on a specific customer group more
tightly, and they may transfer the credit risk immediately after the origination of loans. Finally,
the transfer of credit risk can heighten the ceiling for bank lending. If the credit risk is
transferred within the banking sector, the aggregate default risk will decrease because the
probability of the reference credit and the protection seller to default concurrently is relatively
small. If the credit risk is transferred out of the banking sector, the maximum amount of loans
that banks are able to issue can be heightened as long as the net sellers of protection do not
draw money from the banking sector to compensate credit events.
European Central Bank (2004) describes the motivations for banks to use credit risk transfer
(CRT) instruments. The key motivation for banks to purchase credit protection is to hedge their
aggregate risk and single-name concentration risk. The motivations for banks to originate CRT
instruments are capital management, such as regulatory arbitrage and capital relief, and
enhanced access to liquidity through collateral made available by securitization. Moreover, CRT

10
instruments allow banks to reshape their business development strategies, because now they
can establish long-term relationships with company clients without adding exposures. The key
motivations for banks to sell credit protection are to diversify their risks and to generate more
profit. Eventually, to earn fee income, banks start to work as intermediaries for CRT instruments,
a role that is called intermediation. By product innovation, market making and introduction of
new types of investors, intermediation helps banks broaden their services offered to customers.
Finnegan and Mawdsley (2004) argue that there are three reasons for banks to use credit risk
transfer instruments. First, banks can release funding and regulatory capital. Through funded
credit risk transfer techniques, banks are able to sell assets for cash which can be recycled for
further business growth. Moreover, the credit derivative protection seller is typically substituted
for the underlying asset in assigning risk weights. As long as the protection seller has a lower risk
weight than the underlying asset, the protection buyer can free up the corresponding regulatory
capital for other uses. Second, banks can employ CRT instruments to manage their balance
sheets and diversify their risks. They can purchase credit protection to lower their risk
concentration or sell protection to obtain exposures without the direct lending costs. The third
reason is intermediation. Banks work as intermediaries in CRT markets in two ways: matching
risks on their own books or arranging structures and transactions to effect CRT. For the first one,
banks may earn income as fees or as spreads on their positions. For the second one, they may
earn fee income for providing the vehicles underlying the transfer of risk.
Minton, Stulz, and Williamson (2008) show that credit derivatives were not widely used among
banks during 1999-2005, but the amount of credit derivatives held by banks was very large. They
show that most of the gross amount of positions was for dealer activities, not for risk
management. The likelihood of using credit derivatives is positively and significantly related to
bank size, but negatively related to a bank’s equity capital, tier I risk capital, and net interest
margin. They also explain the reasons for the limited use of credit derivatives. Adverse selection
and moral hazard problems make the market for credit derivatives on riskier credits less liquid.
Thus, large investment grade US firms, foreign banks, and large foreign multinational companies
are the most liquid names in the credit default swap market. Larger bank holding companies are
more likely to have exposures to them than the small ones, because the larger banks have less
liquidity costs, transactions costs, and basis risk to use credit derivatives.

11
Section 3: The problems related to credit derivatives and their role in the financial crisis
Kiff, Michaud and Mitchell (2002) identify adverse selection and moral hazard problems about
credit risk transfer (CRT) instruments in two contexts of relationships. These problems are
caused by asymmetric information.
In the borrower-lender relationship, the introduction of CRT markets may actually aggravate
adverse selection problem, because they may decrease the incentive of lender to screen the
borrower if the lender is able to purchase credit protection after the loan is made. It may also
exacerbate the moral hazard problem of borrowers, because the lender may have no incentive
to monitor his borrowers if he has purchased complete protection on its exposure. However,
reputation may be a solution to the problem. A lender may want to develop a good reputation
for not bringing bad loans to the CRT market, so the lender may have incentives to screen
borrowers even if they can transfer credit risk out. Finally, the moral hazard of the lender is a
new problem created by the introduction of CRT markets. The lender may purchase credit
protection against the borrower's wishes or without informing the borrower and it may send a
negative signal about the borrower's quality to the markets. The strength of the signal is
affected by whether the instrument fully transfers the underlying exposure or just hedging, by
whether the lender retains a first loss position, and by whether the purchase of credit
protection is observable. Specifically, banks often prefer using credit default swaps because
borrowers cannot detect them.
In the lender-protection seller relationship, the CRT markets create a lemons problem. Since all
lenders tend to purchase protection for their low-quality assets, the high prices of the
protection may prohibit lenders from purchasing protection for their good-quality assets.
Moreover, in this relationship, non-tradable CRT instruments usually minimize moral hazard of
the lender, because some clauses in the contract require the lender to undertake monitoring
activities. Prematurely triggering a credit event, substituting lower quality assets for maturing
ones in securitized portfolios, and delivering the cheapest assets to the protection seller all
belong to lender moral hazard. On the other hand, the protection seller moral hazard may lead
to delay payment, refuse to pay, or litigate the claim by the protection seller when a credit
event happens.

12
Morrison (2002) believes that the existence of the CRT market may influence funding and
investment decisions in the real sector negatively. In his model, entrepreneurs raise debt to
finance either first-best projects or second-best projects. Without the CRT market, some
entrepreneurs will employ bank debt to signal their intention to run the first best projects,
because banks will monitor the borrowers. Consequently, these borrowers are able to issue
bonds, whose cost is lower, to complement the bank debt. However, with the introduction of a
CRT market, banks' incentive to monitor borrowers may be eliminated. Thus, the signaling value
of bank debt may be destroyed and the entrepreneurs may only issue junk bonds. Meanwhile,
without bank monitoring, the entrepreneurs may run the second-best projects. Finally, overall
welfare may be reduced, although banks are able to hedge their exposures, if no market players,
such as rating agencies, are able to serve as perfect substitutes for bank monitoring.
Rajan (2005) argues that technical change, deregulation, and institutional change allow
individuals to invest in the market indirectly through new types of intermediaries instead of
banks, such as mutual funds, hedge funds and pension funds. The investment managers of these
institutions have incentives to bear more risks than the bank managers of the past, because
their compensation is related to investment return and their performance compared with other
peer managers. Meanwhile, banks are able to move the plain vanilla risks from their own
balance sheets to those of the investment managers through credit risk transfer instruments, so
banks have an incentive to originate more of these risks. However, banks often have to retain
the first loss position of the risks they originate, which is a small but the most volatile part of the
risk they have created. Moreover, they may not be able to provide liquidity to financial markets
during a crisis, because banks now need liquid markets to hedge some of their own risks, too. As
a conclusion, even though risks can be absorbed by far more participants today, in fact the
system risk has become greater.
Fender, Frankel and Gyntelberg (2008) analyze the consequences of Lehman's failure on the
credit default swap market. Since Lehman is a major counterparty and reference entity in the
CDS market, its bankruptcy filing would have two immediate effects. First, it would trigger
default clauses in CDS contracts referencing Lehman. Second, it would terminate the contracts
that the firm had entered into as a counterparty, so operational risk will increase due to netting,
settlement and replacement of the respective positions. Furthermore, at the time of the
bankruptcy, there was no solid public information on the volume of CDS contracts referencing

13
Lehman or the net amounts required to settle the contracts. Therefore, people were not sure if
the already strained money markets had capacity to meet the anticipated corresponding
liquidity needs.
Zingales (2008) argues that the roots of the current financial crisis are bad regulation, lack of
transparency and market complacency brought about by several years of positive returns. The
credit default swap market is such an unregulated market and the level of collateral posted was
very low or non-existent, which generated the possibility of a systemic failure. Although large
commercial banks have hedged their massive exposure to CDS and hence the net exposure is
much smaller, if a major player defaults, all the other ones will find themselves un-hedged,
triggering a run to buy insurance.
Brunnermeier (2009) argues that banks typically created “structured” products, like CDOs, and
issue tranches to offset risks. Investors who purchased a high rating tranche of a CDO combined
with a credit default swap used to believe that the risk of their investment was low because they
thought the CDS counterparty defaulting probability was small. Securitization allowed certain
institutional investors to indirectly hold assets that they were not allowed to hold previously
because of regulatory requirements. However, a large part of the credit risk did not transfer out
of the banking system, because banks were also active buyers of structured products. The
reason for banks doing this was “regulatory and ratings arbitrage”, by which banks could reduce
the amount of capital they required to hold to conform with Basel I regulations. Moreover,
diversification reduced the idiosyncratic risk, so assets issued by SPV rated better than individual
securities. Thus, when the level of subprime mortgage default increased, the whole financial
system was influenced. The bankruptcy or liquidity shortage of major financial institutions, like
Lehman and AIG, created ripple effects in the financial market, because they were
interconnected through the credit derivatives business and had counterparties all over the
world.
European Central Bank (2009) indicates that there are three structural features in the CDS
market have helped to transform counterparty risk into systemic risk. First, most of the CDS
contracts are concentrated in a small group of dealers. A reduced number of counterparties
cause increased concentration risk and greater systemic risk. Second, the interconnected nature
of this dealer-based market can result in large trade replacement costs when a dealer failures.
14
Third, euro area banks seem to be net sellers of standard single-name and index CDS contracts,
which would imply exposure to market risk if there is a general increase in CDS spreads. In
addition, banks seem to have been net sellers of protection for sovereign CDSs, which may in
some cases constitute wrong-way risk. Finally, the low levels of liquidity resulting from the crisis
and the current high levels of concentration in the market have both increased trade
replacement costs and resulted in significant bid-ask spreads for market participants,
particularly for non-dealers.
Soros (2009) believes that credit default swaps are toxic instruments which need to be strictly
regulated. He suggests that only those who actually own the underlying assets can be allowed to
hold CDS. CDS are toxic because it has become a tool of speculation and such speculation can be
self-validating. He argues that financial markets deal with future instead of current reality and
the biased view of the future can affect the underlying reality. This feedback mechanism is
called "reflexivity". He explains the poisonous nature of CDS in three steps. First, the risk/reward
profile of holding long or short positions in the stock market is asymmetric. Since losing on a
long position decreases risk exposure while losing on a short position increases it, the
asymmetry discourages short selling. Second, the risk/reward asymmetry is opposite for the CDS
market, because going short by buying CDS has limited risk but practically giant profit potential.
Moreover, it is reinforced by the fact that CDS are tradable. People buy CDS because they expect
them to appreciate in response to adverse developments. Third, reflexivity works here. The
mispricing of financial instrument can affect the fundamentals that market prices are supposed
to reflect. Since financial institutions do their businesses based on trust, a decline in their stock
and bond can aggravate their financing costs, which means bear raids on financial institutions
can be self-validating.
Duffie (2010) describes the failure mechanics of dealer banks and identifies the role of the over-
the-counter (OTC) derivatives, including credit derivatives, in the mechanics. He argues that
when a dealer bank's capital position has been severely weakened by trading losses, it may bail
out some of its clients to maintain its reputation and to protect its franchise value, which will
further weaken its balance sheet. As time passes, more market participants notice its worsened
liquidity position, and as a result, its OTC derivatives counterparties will try to reduce their
exposures to the dealer. They may borrow from the dealer, draw on prior lines of credit with the
dealer, or enter new derivatives contracts with the dealer to decrease their exposures, which
15
will further reduce the dealer's cash position. Moreover, they may also use "novation", which
means selling the derivative contract to a third party for a fee, to insulate themselves from the
dealer bank's default risk. It is commonly used for credit derivatives, and it may be accompanied
by removal of cash collaterals out of the dealer bank. Furthermore, in this case, other dealers
may refuse these novations, which further signals the dealer bank's credit weakness. Finally,
together with the flight of short-term creditors, the flight of prime brokerage clients, and the
loss of cash settlement privileges, the reactions of its OTC derivative counterparties may cause
the dealer bank to collapse.
Stulz (2010) analyzes the role of credit default swap played in the recent financial crisis and
whether they played a role in the collapse of major financial institutions in detail. He shows that
the credit default swap market worked well during the financial crisis and the losses on CDS
referencing subprime mortgage securitizations were caused by defaults on subprime mortgages
and by illiquidity for such securitizations, not CDS themselves. Then, he examines two
arguments about the counterparty risk of CDS. The first argument is that the derivative
exposures among financial institutions knitted a huge web throughout the financial system. Thus,
the failure of a major financial institution in this web can cause losses of other institutions, such
as the case of Lehman. He argues that the counterparties usually use collateral to protect
themselves, but it is possible that the collateral arrangement is not universal and the amount of
collateral may not be sufficient to cover the loss. The second argument is that the counterparty
default may be triggered by the giant value jump of CDS when credit events happen. He shows
that if a protection buyer insures 10 million dollars of Lehman debt on the last working day
before Lehman's bankruptcy filing, he can earn more than $9 million on settlement. Such a huge
amount could possibly make a protection seller who has large net exposure to default.
Meanwhile, the collateral may not be enough to protect the buyer, and it may lead to additional
failure of other institutions. The sheer size of gross exposures held by dealers is another serious
issue. Even dealers hedge their exposures perfectly, the default of a counterparty who is a major
dealer may still create havoc in the financial market, because it takes time and costs a lot to
replace credit default swaps and the default may make the market less liquid or totally not
functional. However, he argues that CDS is not the proximate cause of Lehman or Bear Stearns's
failure, and it is not the only cause of the failure of AIG.
16
Chapter III: Research Data and Methodology
Section 1: Sample Description
The sample consists of 52 commercial bank holding companies (BHCs) whose total assets on
their balance sheets were greater than 10 billion dollars on December 31, 2005 and which have
complete data on credit derivatives from March 31, 2006 to September 30, 2010. (See Appendix
I) According to the 2005 BHCPR Peer Group Average Report4, there were 69 BHCs having total
assets larger than 10 billion dollars on December 31, 2005, but 17 BHCs are excluded from the
sample because of merger and acquisition, closing, and changing from BHCs to other identities.
(See Appendix II)
I choose 2006-2009 as the sample period because the liquidity crisis was triggered by an
increase in subprime mortgage defaults, which was first noted in February 2007 (Brunnermeier,
2009). The data in 2006 can be used as a benchmark to see how the credit derivatives volume
and fair values changed during the financial crisis.
Table 1 (Appendix III) is the descriptive statistics on banks' use of credit derivatives. Data are
obtained from the Schedule HC-L of banks' FR Y-9C filings. Table 1 shows that as of September
31, 2010, 26 banks, or 50% of the total number of banks in the sample, had credit derivative
positions. 2009 and 2010 are the years in which the largest percentage of banks used credit
derivatives. Credit default swap is the most commonly used instrument. As of September 31,
2010, 17 banks, or 32.69% of the total number of banks in the sample, had CDS positions.
Moreover, the number of net protection buyers usually exceeds the number of net protection
sellers.
4
http://www.ffiec.gov/nicpubweb/content/BHCPRRPT/REPORTS/BHCPR_PEER/Dec2005/PeerGroup_1_December2005

17
Table 2 (Appendix III) gives information about the balance sheet of all the banks in the sample
and of the banks with credit derivative positions. From Table 2, we can see that the banks with
credit derivative positions have most of the assets and loans in the sample, over the whole
sample period. As of September 30, 2010, the banks with credit derivative positions have 91.26%
of the total asset and 86.97% of the total loan in the sample. Another interesting phenomenon
is that the loan-to-asset ratio of the banks with credit derivative positions is always lower than
that of the whole sample.
The average total asset for the banks in the sample was about 146 billion dollars on December
31, 2005, but the median was only close to $40 billion dollars, which means the distribution of
bank sizes at the beginning of sample period was skew. The skewed distribution of bank sizes
lasts for the entire sample period. On September 30, 2010, the average total asset was about
227 billion dollars while the median was only about 52 billion dollars. The distribution of loan
size for the banks in the sample is also skewed. For example, on September 30, 2010, the
average amount of loan for the banks in the sample was about 100 billion dollars, while the
median was about 28 billion dollars.
Section 2: Data Source Description
I construct the sample based on data from the Consolidated Financial Statements for Bank
Holding Companies (FR Y-9C) published by the National Information Center (NIC). NIC provides
"comprehensive information on banks and other institutions for which the Federal Reserve has
a supervisory, regulatory, or research interest including both domestic and foreign banking
organizations operating in the U.S." 5 There are five financial reports available on the NIC public
website, which are Consolidated Financial Statements for Bank Holding Companies (FR Y-9C),
Parent Company Only Financial Statements for Large Bank Holding Companies (FR Y-9LP), Parent
Company Only Financial Statements for Small Bank Holding Companies (FR Y-9SP), Bank Holding
Company Performance Report (BHCPR), and Report of Assets and Liabilities of U.S. Branches and
Agencies of Foreign Banks (FFIEC 002). The FR Y-9C is a comprehensive financial report, which is
5 http://www.ffiec.gov/nicpubweb/content/help/NICFAQ.htm
18
filed quarterly, for bank holding companies with total consolidated assets 500 million dollars or
more.
In Schedule HC-L of the FR Y-9C, Banks are required to report the notional amounts of credit
derivatives by type of instrument, which are credit default swaps, total return swaps, credit
options, and other credit derivatives. They are also required to report the gross positive and
negative fair values of all credit derivatives. For both the notional amounts and gross fair values
of credit derivatives, banks are required to separate the amounts for which the bank is the
guarantor and for which the bank is the beneficiary. As a guarantor in a credit derivative
contract, the bank sells credit risk protection, and as a beneficiary, the bank buys credit risk
protection. Since the FR Y-9C filed on June 30, 2009, banks has been required to report the
notional amounts of credit derivatives by regulatory capital treatment and the notional amounts
of credit derivatives by remaining maturity. They also started to disclose the counterparties, net
current credit exposure, and fair values of collaterals of the over-the-counter derivatives.
Section 3: Research Goals and Methods
1. How did credit derivatives positions at banks change during the financial crisis?
The volume of credit derivatives is represented by notional amounts. The nominal amount is
the value of the underlying assets insured by credit derivatives and it is used to calculate
payments when credit events happen. For example, if you have bought credit protection on
IBM bonds with par value $1 million through credit derivatives, then you are holding $1
million notional amount of credit derivatives as beneficiary, while the protection seller is
holding $1 million notional amount of credit derivatives as guarantor . If IBM defaults on the
bonds, the protection seller will pay you $1 million in exchange for the bonds. The value of
the bonds now depends on recovery and it may be very low.
Let's define "notional amount as guarantor" as the amount of credit protection banks sold,
and "notional amount as beneficiary" as the amount of credit protection banks bought. Let's
further define "total notional amount" as the sum of the notional amount as guarantor and
the notional amount as beneficiary, and "net notional amount" as the difference between
the notional amount as beneficiary and the notional amount as guarantor. I have
19
investigated how the value of these variables changed during the sample period to discover
how the banks dealt with their credit derivative positions during the recent financial crisis.
Many studies have indicated that the credit derivative market was emerging rapidly before
the financial crisis. According to Fitch Rating (2006), the notional amount of outstanding
credit derivatives contracts rose from $5.3 trillion sold at year-end 2004 to nearly $12 trillion
at year-end 2005, an increase of 122%. Since the beginning of the recent financial crisis,
credit derivatives, especially credit default swaps, have generally been to blame for its
counterparty risk. Thus, I hypothesize that the total notional amount of credit derivatives
that banks held would increase before the outbreak of the financial crisis and then drop
during the financial crisis. Moreover, since the possibility of default generally increased
during the financial crisis, I hypothesize that the net notional amount of credit derivatives
held by banks would increase after the outbreak of the financial crisis.
2. How did the fair value of credit derivatives change?
The fair value of credit derivatives is their market value. While the notional amount of a
credit derivative has been decided at the beginning of the contract, the market value of it
does vary with market conditions. For example, at the beginning, the value of the
protection is equal to the present value of the payments the protection buyer will have to
make. Over time, the value of the protection will decrease if default becomes less likely
while it will increase if default becomes more likely. Of course, the value of credit
protection also depends on many other factors.
I have investigated how the fair value of the bought and sold protection changed during the
sample period to explore whether the banks gain or lose money on credit derivatives. I
hypothesize that the fair value of credit derivatives held by banks as guarantor would
decrease while the fair value of credit derivatives held by banks as beneficiary would
increase because the level of default risk generally rose during the financial crisis.
20
3. Have the credit derivative positions in the banking sector become more concentrated?
European Central Bank (2009) indicates that in Europe, "the top ten counterparts of each
surveyed large bank account for 62-72% of its CDS exposures (when measured in terms of
gross market value). In addition, the concentration of the CDS market is now higher than it
was before the crisis, since some major players ... have exited the market." I believe that the
notional amounts of credit derivatives held by banks in the U.S. are also concentrated.
I use the Herfindahl–Hirschman Index (HHI) to assess how concentrated credit derivative
positions are. HHI = ∑ ����
� ,where �� is the share of credit derivatives held by bank i, and
N is the number of banks in the sample. I will calculate the HHI of the notional amount as
guarantor, of the notional amount as beneficiary and of the total notional amount on each
quarter-end over the sample period. The higher the HHI, the more concentrated the
notional amounts. In general, a HHI index below 0.15 indicates that the notional amount is
not concentrated. A HHI index between 0.15 and 0.25 indicates moderate concentration,
and a HHI index above 0.25 indicates high concentration.
Based on European Central Bank (2009), I want to investigate whether the notional
amounts of credit derivatives held by banks in the U.S. are also concentrated. I hypothesize
that all of the HHIs of the notional amount as guarantor, of the notional amount as
beneficiary and of the total notional amount would be high, and the level of the HHIs
should not drop after the outbreak of the financial crisis because there is no incentive for
more commercial banks to participate in the credit derivative market during the financial
crisis due to the counterparty risk.
4. What major events happened in the financial crisis and what role did credit derivatives play
in these events?
Credit derivatives are generally blamed worsening the financial crisis. Thus, I have reviewed
the major events happened in 2008 and summarized the role that credit derivative played
in these events in Section 4 of Chapter IV.
21
5. Which banks are major users of credit derivatives and what information did they disclose
about their use of credit derivatives?
According to Minton, Stulz, and Williamson (2008), during 1999-2005, most credit
derivative contracts were concentrated at several large banks. Most of their credit
derivatives positions were for dealer activities, rather than for risk management. Thus, I
hypothesize that there exist several major dealers of credit derivatives in the sample during
the sample period. I also have summarized the information related to credit derivatives
disclosed in the major users' annual reports at Section 5 in Chapter IV. Detailed information
can be found in Appendix IV.

22
Chapter IV: Results
Section 1: How did credit derivatives positions at banks change during the financial crisis?
Section 1.1: Total Notional Amount
The total notional amount is the sum of the notional amount as guarantor and notional amount
as beneficiary. It measures how actively banks are involved in credit derivatives. For example, if
bank Alpha trades credit derivatives as an intermediary, it may sell credit protection on bonds
whose par value are $1 million and simultaneously, buy credit protection on the same bonds
from other banks. In this case, bank Alpha balances its book perfectly and completely transfer
the default risk to other banks, but its total position, or total notional amount, on these bonds is
equal to $1 million notional amount as guarantor plus $1 million notional amount as beneficiary,
which is $2 million. Since the total notional amount includes both bought and sold positions, it is
a good indicator of how active banks are on credit derivatives.
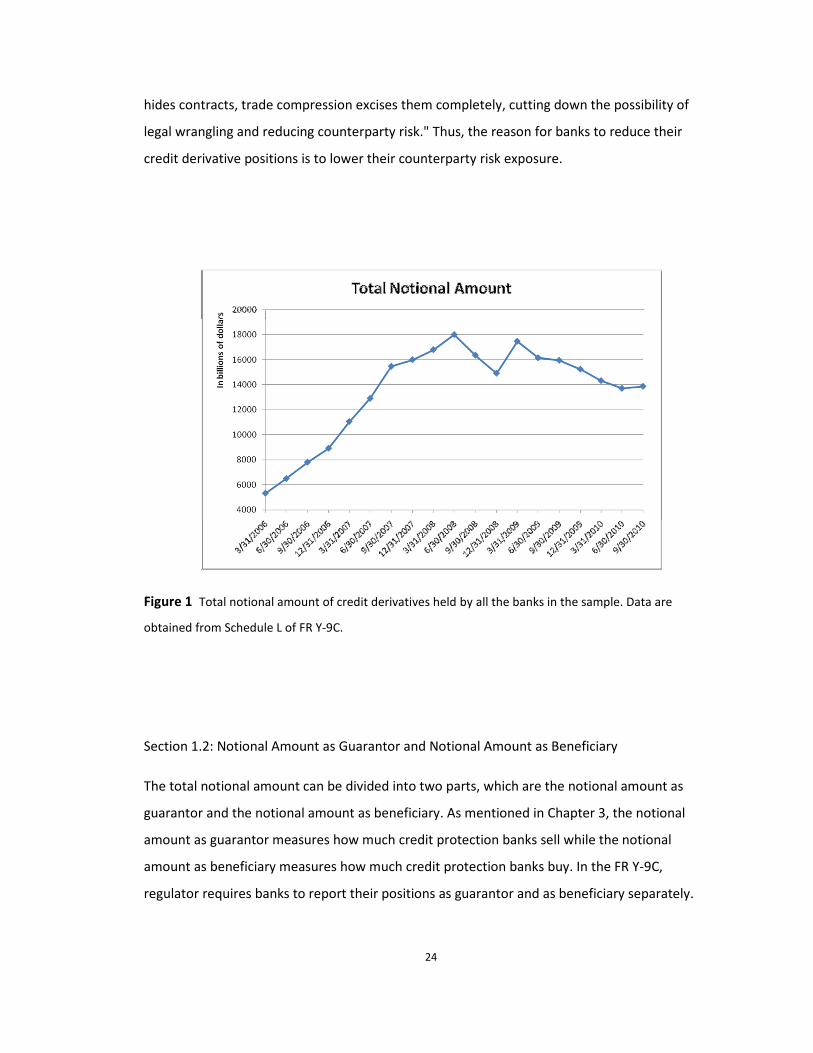
Figure 1 shows the total notional amount of credit derivatives held by banks in the sample on
each quarter-end during the sample period. The total notional amount boomed continuously
until June, 2008, from $5.3 trillion up to $18 trillion. Then, it fluctuated and slid down during the
remaining sample period. In the third and fourth quarters of 2008, the total notional amount
decreased to $15 trillion. Then, it jumped drastically during the first quarter of 2009, up to $17.5
trillion. During the remaining sample period, the total notional amounts decreased gradually,
and finally became $14 trillion on September 30, 2010.
There are two points that we need to pay attention to. First, in March 2008, J.P. Morgan Chase
merged with Bear Stearns. It increased the total notional amount of credit derivatives held by
J.P. Morgan Chase by at least $421 billion.6 Second, in January 2009, Bank of America acquired
6 See JP Morgan Chase 2008 Annual Report, page 101. "At December 31, 2008, the total notional amount of
protection purchased and sold increased $421 billion from year-end 2007. The increase was primarily as a result of
the merger with Bear Stearns, partially offset by the impact of industry efforts to reduce offsetting trade activity."
23
Merrill Lynch and it increased the total notional amount of credit derivatives held by Bank of
America largely.7 Thus, if we exclude the effect of these two events out of the sample, we can
expect that the total notional amount of credit derivatives held by banks would decrease
continuously after March 2008, and the trend of the total notional amount of credit derivatives
in the sample would be like a parabola.
The data support our hypothesis, which is that the total notional amount of credit derivatives
that banks held would increase before the outbreak of the financial crisis and drop during the
financial crisis. Before the explosion of the financial crisis, the banking sector actively added
their credit derivative positions. Nevertheless, since 2008, the banks did not add their positions
as drastically as before, and they even largely reduced their positions during the second half of
2008, when the financial system began to be unstable.
However, there are more issues that we need to take into consideration. First, besides banks
more actively participating in credit derivative trading, the increase in the total notional amount
of credit derivatives during 2006-2007 may be caused by offsetting trade. Offsetting trade
means going into an equal but opposite contract in order to cancel the previous contract. For
example, suppose bank Alpha has bought credit protection through a credit derivative on firm
Delta from bank Beta; if bank Alpha wants to cancel this contract, it can go into an equal but
opposite credit derivative contract. Through this way, the total notional amount of credit
derivatives held by bank Alpha doubles, but bank Alpha has eliminated its credit exposure,
which means that in fact bank Alpha becomes less aggressive in the credit derivative market.
Since banks do not disclose how much of the notional amount of credit derivatives is related to
offsetting trade, further research is required to examine this issue.
Second, the decrease in the total notional amount of credit derivatives held by banks is largely
caused by trade compression. The Economists (2009) discloses that "since August, credit-
derivative dealers have been routinely giving details of their CDS trades to compression vendors.
These companies propose new sets of CDS contracts that keep each of the participating dealers’
net positions the same, but aggregate them into far fewer contracts. Unlike netting, which only
7 See Bank of America 2009 Annual Report, Page 85. "The addition of Merrill Lynch drove the increase in counterparty
credit risk for purchased credit derivatives and the increase in the contract/notional amount." More information is at
Section 4 in this chapter
24
hides contracts, trade compression excises them completely, cutting down the possibility of
legal wrangling and reducing counterparty risk." Thus, the reason for banks to reduce their
credit derivative positions is to lower their counterparty risk exposure.
Figure 1 Total notional amount of credit derivatives held by all the banks in the sample. Data are
obtained from Schedule L of FR Y-9C.
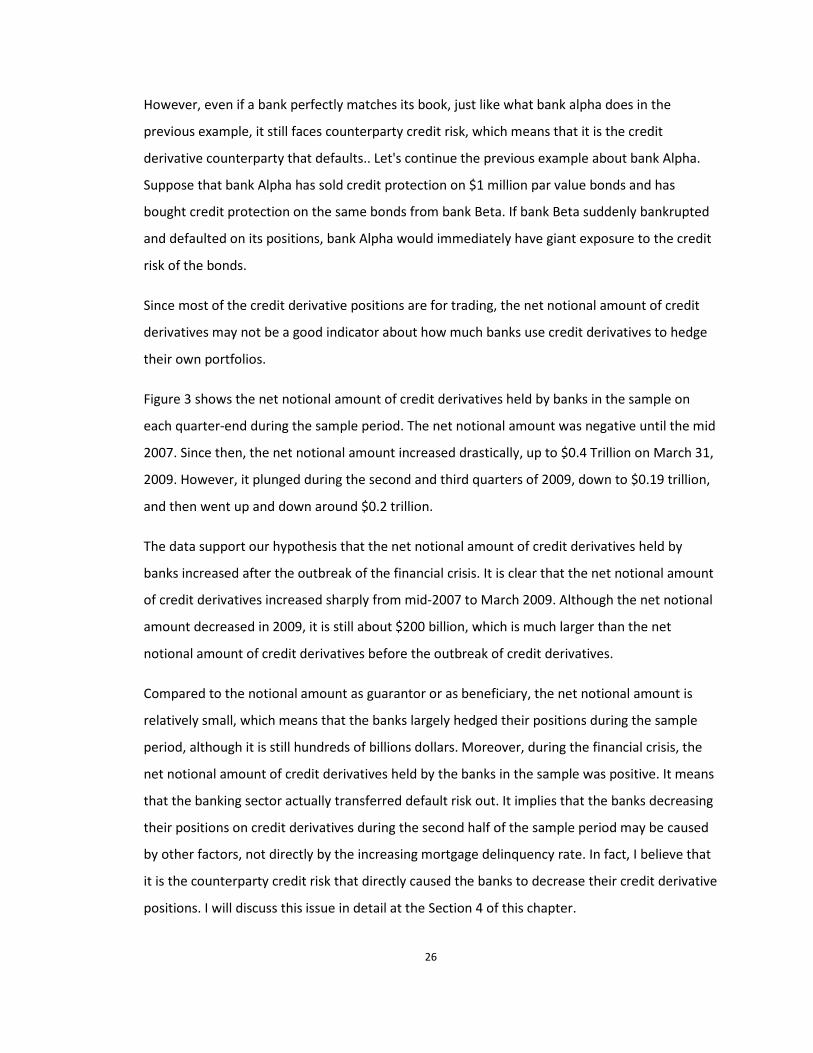
Section 1.2: Notional Amount as Guarantor and Notional Amount as Beneficiary
The total notional amount can be divided into two parts, which are the notional amount as
guarantor and the notional amount as beneficiary. As mentioned in Chapter 3, the notional
amount as guarantor measures how much credit protection banks sell while the notional
amount as beneficiary measures how much credit protection banks buy. In the FR Y-9C,
regulator requires banks to report their positions as guarantor and as beneficiary separately.

25
Figure 2 shows the notional amounts of credit derivatives held by banks in the sample as
guarantor and as beneficiary, respectively, on each quarter-end during the sample period. From
Figure 2, we can see that both of the trends of the notional amounts as guarantor and as
beneficiary are similar to the trend of the total notional amount. The value of the notional
amount as guarantor is always close to the value of the notional amount as beneficiary, which
means the banks hedged their positions well as a whole. Since June 30, 2007, the notional
amount as beneficiary has been always greater than the notional amount as guarantor, which
implies some banks in the sample were net buyers of credit protection during this period.
Similar to the trend of total notional amount, the notional amount as guarantor and as
beneficiary increased dramatically until June 30, 2008, from $2.66 trillion and $2.65 trillion up to
$8.8 trillion and $9.17 trillion, respectively. Then, during the second half of 2008, the notional
amount as guarantor and as beneficiary decreased to $7.3 trillion and $7.64 trillion, respectively.
Then, it increased largely again during the first quarter of 2009, up to $8.5 trillion and $8.93
trillion, respectively. During the remaining sample period, the total notional amounts reduced
gradually, and finally became $6.8 trillion and $7 trillion, respectively, on September 30, 2010.
Banks usually use credit derivatives for two purposes, which are trading for their clients and
hedging their own credit portfolio. According to the annual reports of the major users of credit
derivatives, most of their positions on credit derivatives are for trading.8 Thus, it is not surprising
that they largely match their positions, because as a trader, they usually earn fees and spreads
between bid and ask prices, not premiums for bearing default risks.
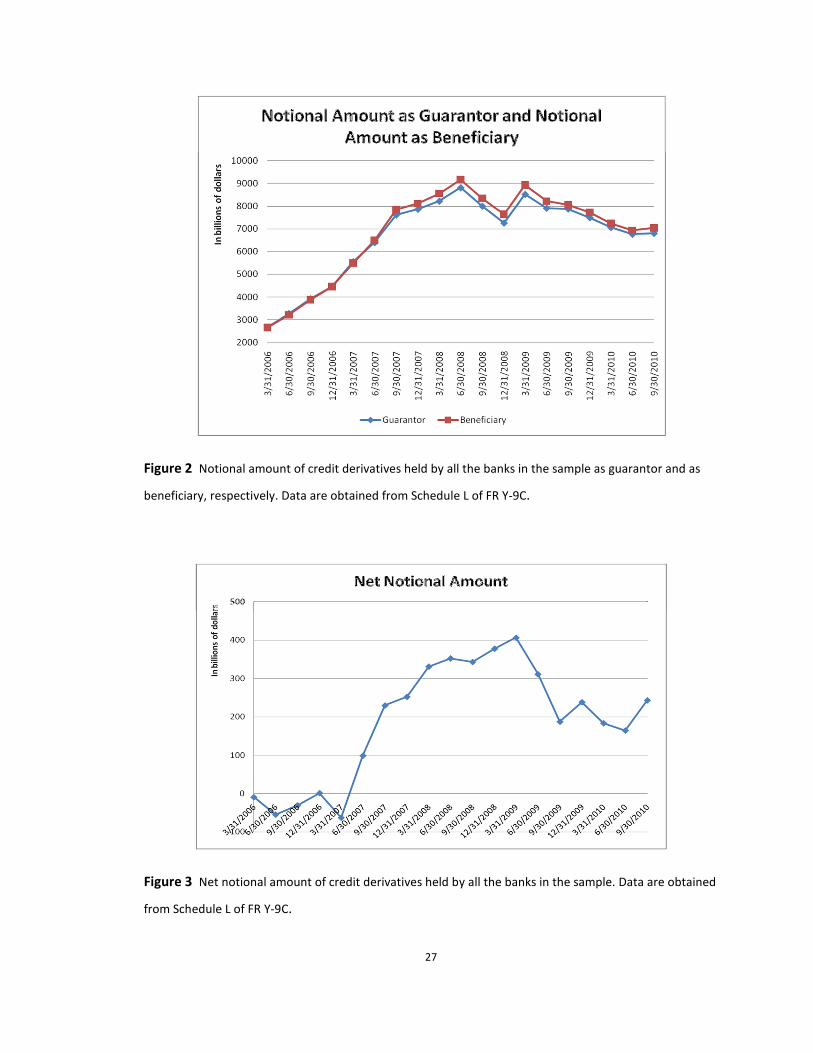
Section 1.3: Net Notional Amount
Net notional amount is the difference between the notional amount as beneficiary and the
notional amount as guarantor. Basically, positive net notional amount means that banks transfer
default risk out, while negative net notional amount means that banks transfer default risk in. It
is an important indicator on how much risk banks expose to.
8 Detailed information can be found at Section 4 in this chapter.
26
However, even if a bank perfectly matches its book, just like what bank alpha does in the
previous example, it still faces counterparty credit risk, which means that it is the credit
derivative counterparty that defaults.. Let's continue the previous example about bank Alpha.
Suppose that bank Alpha has sold credit protection on $1 million par value bonds and has
bought credit protection on the same bonds from bank Beta. If bank Beta suddenly bankrupted
and defaulted on its positions, bank Alpha would immediately have giant exposure to the credit
risk of the bonds.
Since most of the credit derivative positions are for trading, the net notional amount of credit
derivatives may not be a good indicator about how much banks use credit derivatives to hedge
their own portfolios.
Figure 3 shows the net notional amount of credit derivatives held by banks in the sample on
each quarter-end during the sample period. The net notional amount was negative until the mid
2007. Since then, the net notional amount increased drastically, up to $0.4 Trillion on March 31,
2009. However, it plunged during the second and third quarters of 2009, down to $0.19 trillion,
and then went up and down around $0.2 trillion.
The data support our hypothesis that the net notional amount of credit derivatives held by
banks increased after the outbreak of the financial crisis. It is clear that the net notional amount
of credit derivatives increased sharply from mid-2007 to March 2009. Although the net notional
amount decreased in 2009, it is still about $200 billion, which is much larger than the net
notional amount of credit derivatives before the outbreak of credit derivatives.
Compared to the notional amount as guarantor or as beneficiary, the net notional amount is
relatively small, which means that the banks largely hedged their positions during the sample
period, although it is still hundreds of billions dollars. Moreover, during the financial crisis, the
net notional amount of credit derivatives held by the banks in the sample was positive. It means
that the banking sector actually transferred default risk out. It implies that the banks decreasing
their positions on credit derivatives during the second half of the sample period may be caused
by other factors, not directly by the increasing mortgage delinquency rate. In fact, I believe that
it is the counterparty credit risk that directly caused the banks to decrease their credit derivative
positions. I will discuss this issue in detail at the Section 4 of this chapter.
27
Figure 2 Notional amount of credit derivatives held by all the banks in the sample as guarantor and as
beneficiary, respectively. Data are obtained from Schedule L of FR Y-9C.
Figure 3 Net notional amount of credit derivatives held by all the banks in the sample. Data are obtained
from Schedule L of FR Y-9C.

28
Section 2: How did the value of credit derivatives change?
As mentioned before, fair value is the market value of credit derivatives. Although the notional
amount of credit derivatives has been fixed at the beginning of the contract, the market value of
the protection does fluctuate over the contract period. Figure 4 shows the fair value as
guarantor and the fair value as beneficiary of the credit derivatives held by the banks in the
sample on each quarter-end during the sample period. Figure 5 shows the net fair value of the
credit derivatives held by the banks in the sample on each quarter-end during the sample period.
The fair value as guarantor is defined as the difference between the gross positive fair value of
sold protection and the gross negative fair value of sold protection. It is the gain or loss on all
the credit protection that the banks sold. On the other hand, the fair value as beneficiary is
defined as the difference between the gross positive fair value of bought protection and the
gross negative fair value of bought protection. It is the gain or loss on all the credit protection
that the banks bought. The net fair value is the difference between the fair value as beneficiary
and the fair value as guarantor. It is the net gain or loss on all the credit derivative positions that
the banks held.
As Figure 4 shows, the fair value as beneficiary increased sharply during June 30, 2007-March 31,
2009, up to 1.2 trillion dollars, while the fair value as guarantor decreased drastically, down to
negative 1.13 trillion dollars during the same period. Finally, the fair value as beneficiary and as
guarantor both approached back to the level before the outbreak of the financial crisis. On
September 30, 2010, the fair value as beneficiary was $0.17 trillion and the fair value as
guarantor was negative $0.15 trillion. While the notional amount of credit derivatives as
beneficiary decreased during the second half of 2008, the fair value of it increased during this
period. It is not surprising because the default risk on many reference entities largely ascended
during this period. Thus, our hypothesis that the fair value of credit derivatives held by banks as
guarantor would decrease while the fair value of credit derivatives held by banks as beneficiary
would increase after the outbreak of the financial crisis is true.

29
Figure 4 Fair value as guarantor and as beneficiary of credit derivatives held by all the banks in the
sample. Data are obtained from Schedule L of FR Y-9C.
Figure 5 Net fair value of credit derivatives held by all the banks in the sample. Data are obtained from
Schedule L of FR Y-9C.
30
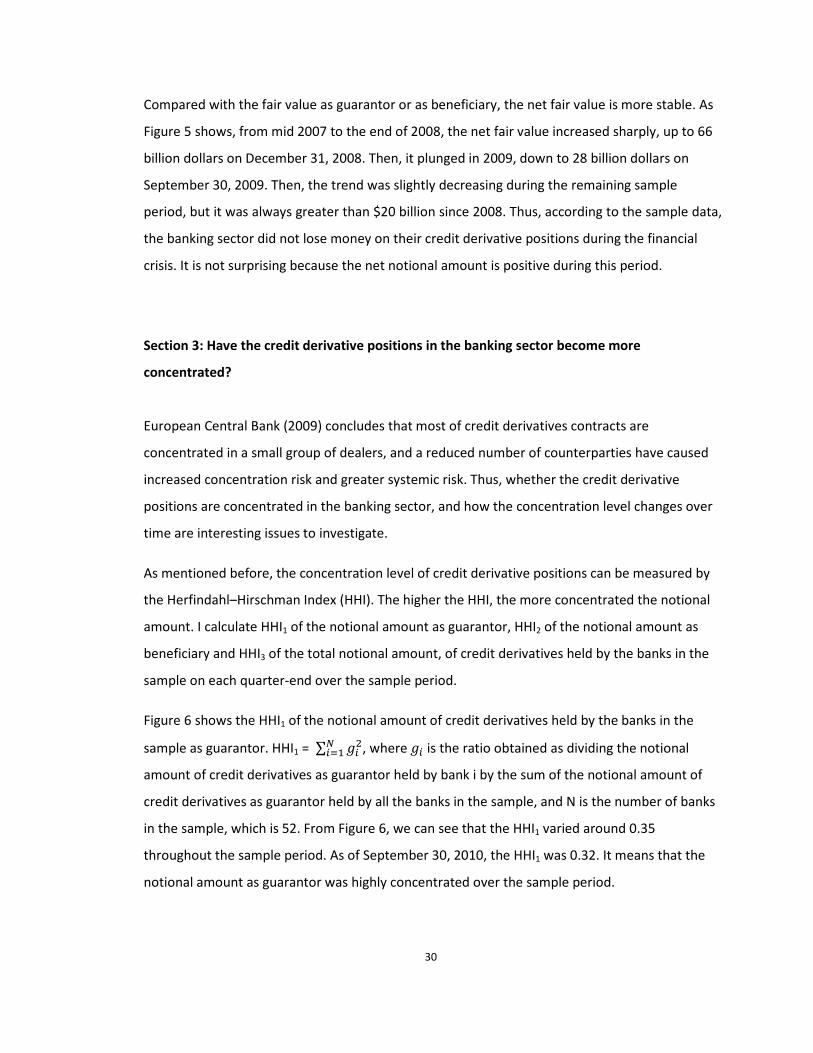
Compared with the fair value as guarantor or as beneficiary, the net fair value is more stable. As
Figure 5 shows, from mid 2007 to the end of 2008, the net fair value increased sharply, up to 66
billion dollars on December 31, 2008. Then, it plunged in 2009, down to 28 billion dollars on
September 30, 2009. Then, the trend was slightly decreasing during the remaining sample
period, but it was always greater than $20 billion since 2008. Thus, according to the sample data,
the banking sector did not lose money on their credit derivative positions during the financial
crisis. It is not surprising because the net notional amount is positive during this period.
Section 3: Have the credit derivative positions in the banking sector become more
concentrated?
European Central Bank (2009) concludes that most of credit derivatives contracts are
concentrated in a small group of dealers, and a reduced number of counterparties have caused
increased concentration risk and greater systemic risk. Thus, whether the credit derivative
positions are concentrated in the banking sector, and how the concentration level changes over
time are interesting issues to investigate.
As mentioned before, the concentration level of credit derivative positions can be measured by
the Herfindahl–Hirschman Index (HHI). The higher the HHI, the more concentrated the notional
amount. I calculate HHI1 of the notional amount as guarantor, HHI2 of the notional amount as
beneficiary and HHI3 of the total notional amount, of credit derivatives held by the banks in the
sample on each quarter-end over the sample period.
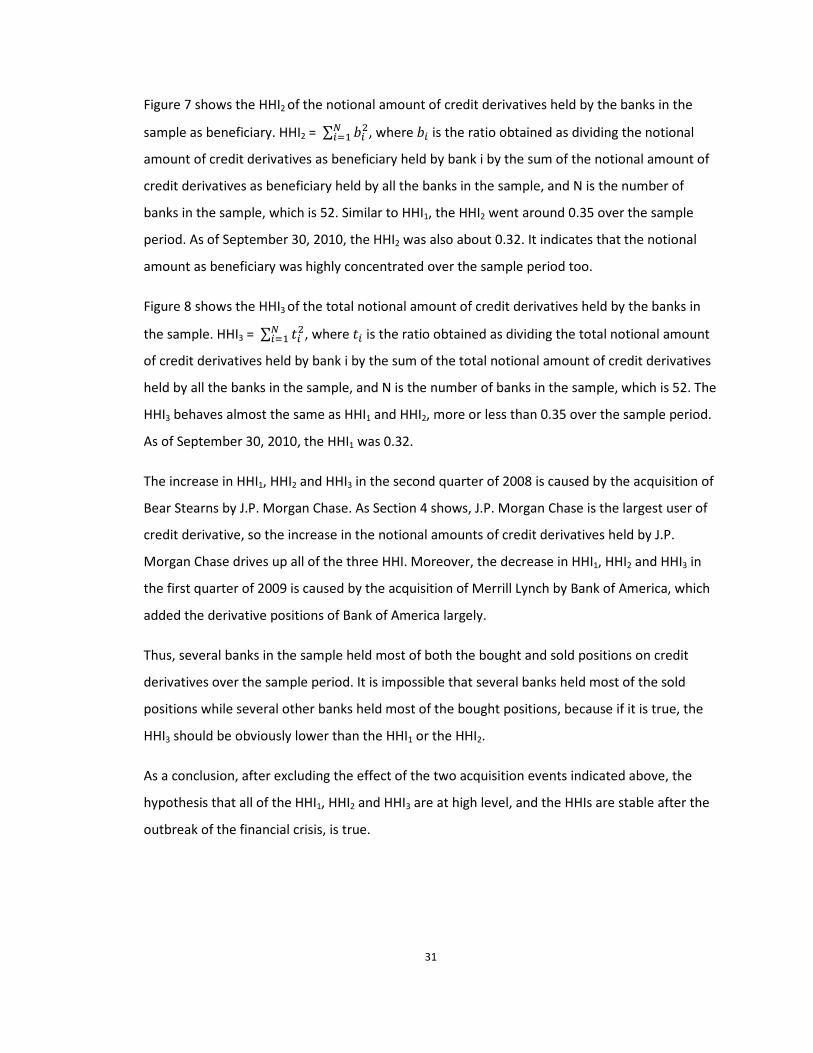
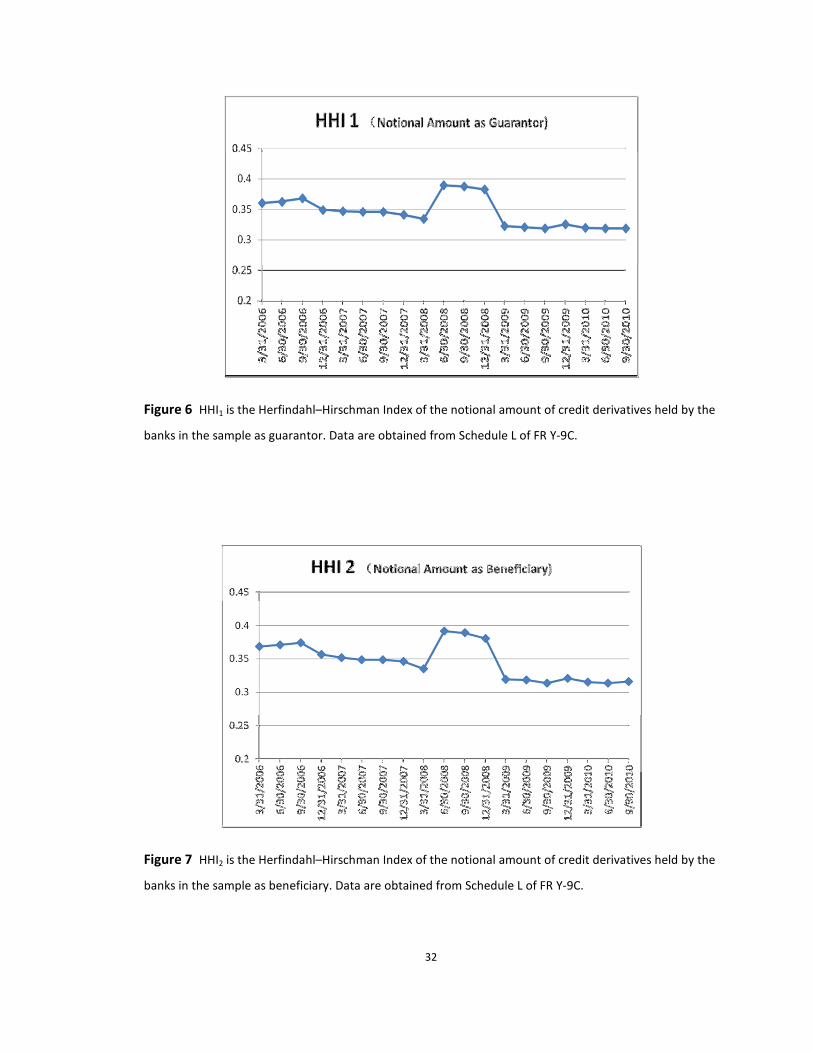
Figure 6 shows the HHI1 of the notional amount of credit derivatives held by the banks in the
sample as guarantor. HHI1 = ∑ ����
� , where �� is the ratio obtained as dividing the notional
amount of credit derivatives as guarantor held by bank i by the sum of the notional amount of
credit derivatives as guarantor held by all the banks in the sample, and N is the number of banks
in the sample, which is 52. From Figure 6, we can see that the HHI1 varied around 0.35
throughout the sample period. As of September 30, 2010, the HHI1 was 0.32. It means that the
notional amount as guarantor was highly concentrated over the sample period.
31
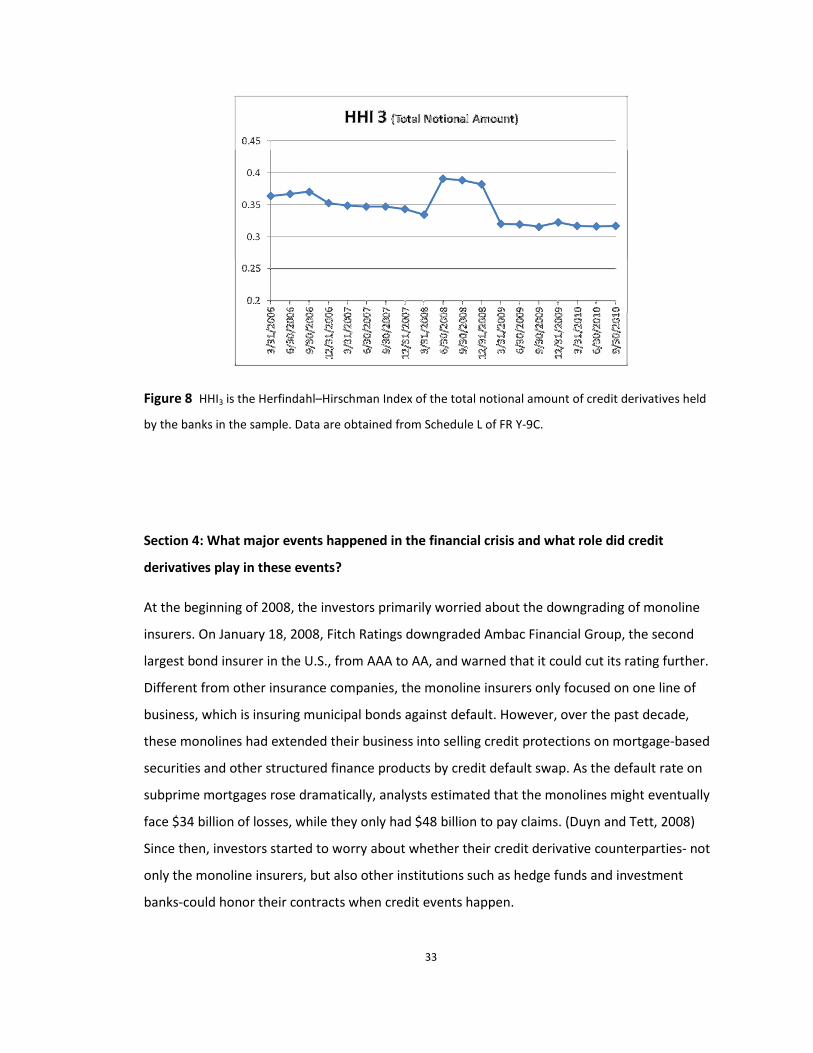
Figure 7 shows the HHI2 of the notional amount of credit derivatives held by the banks in the
sample as beneficiary. HHI2 = ∑ ����
� , where �� is the ratio obtained as dividing the notional
amount of credit derivatives as beneficiary held by bank i by the sum of the notional amount of
credit derivatives as beneficiary held by all the banks in the sample, and N is the number of
banks in the sample, which is 52. Similar to HHI1, the HHI2 went around 0.35 over the sample
period. As of September 30, 2010, the HHI2 was also about 0.32. It indicates that the notional
amount as beneficiary was highly concentrated over the sample period too.
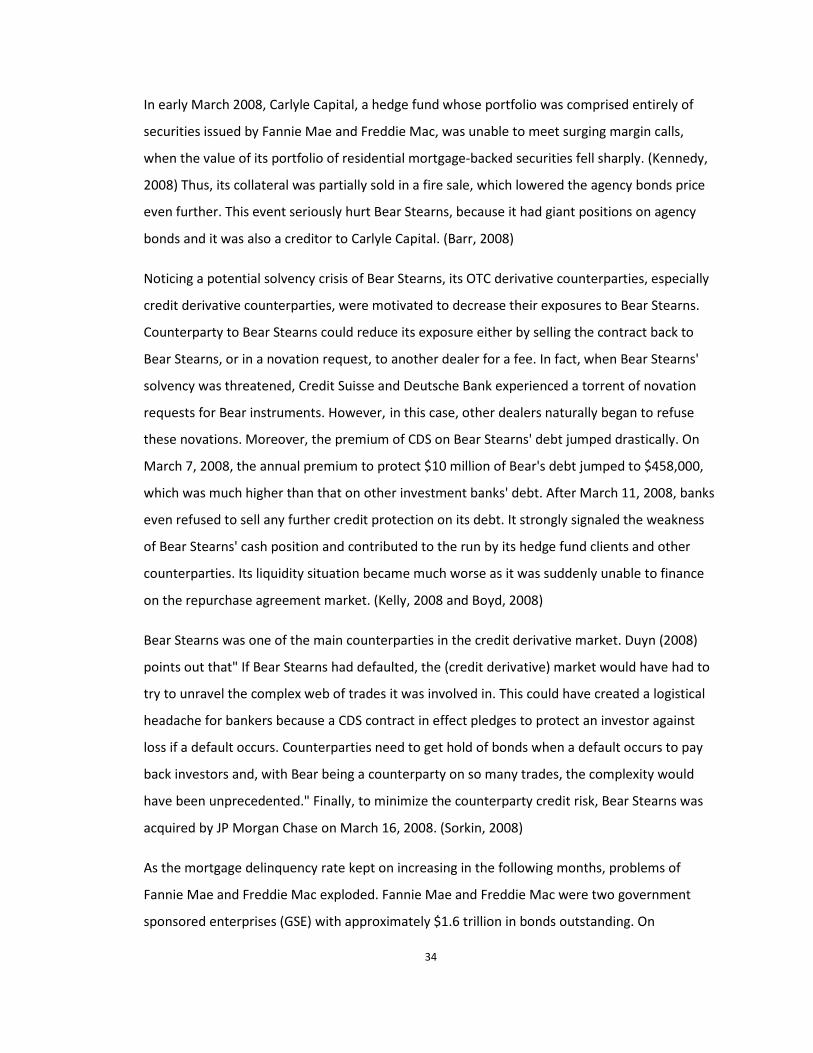
Figure 8 shows the HHI3 of the total notional amount of credit derivatives held by the banks in
the sample. HHI3 = ∑ ���
� , where � is the ratio obtained as dividing the total notional amount
of credit derivatives held by bank i by the sum of the total notional amount of credit derivatives
held by all the banks in the sample, and N is the number of banks in the sample, which is 52. The
HHI3 behaves almost the same as HHI1 and HHI2, more or less than 0.35 over the sample period.
As of September 30, 2010, the HHI1 was 0.32.
The increase in HHI1, HHI2 and HHI3 in the second quarter of 2008 is caused by the acquisition of
Bear Stearns by J.P. Morgan Chase. As Section 4 shows, J.P. Morgan Chase is the largest user of
credit derivative, so the increase in the notional amounts of credit derivatives held by J.P.
Morgan Chase drives up all of the three HHI. Moreover, the decrease in HHI1, HHI2 and HHI3 in
the first quarter of 2009 is caused by the acquisition of Merrill Lynch by Bank of America, which
added the derivative positions of Bank of America largely.
Thus, several banks in the sample held most of both the bought and sold positions on credit
derivatives over the sample period. It is impossible that several banks held most of the sold
positions while several other banks held most of the bought positions, because if it is true, the
HHI3 should be obviously lower than the HHI1 or the HHI2.
As a conclusion, after excluding the effect of the two acquisition events indicated above, the
hypothesis that all of the HHI1, HHI2 and HHI3 are at high level, and the HHIs are stable after the
outbreak of the financial crisis, is true.
32
Figure 6 HHI1 is the Herfindahl–Hirschman Index of the notional amount of credit derivatives held by the
banks in the sample as guarantor. Data are obtained from Schedule L of FR Y-9C.
Figure 7 HHI2 is the Herfindahl–Hirschman Index of the notional amount of credit derivatives held by the
banks in the sample as beneficiary. Data are obtained from Schedule L of FR Y-9C.
33
Figure 8 HHI3 is the Herfindahl–Hirschman Index of the total notional amount of credit derivatives held
by the banks in the sample. Data are obtained from Schedule L of FR Y-9C.
Section 4: What major events happened in the financial crisis and what role did credit
derivatives play in these events?
At the beginning of 2008, the investors primarily worried about the downgrading of monoline
insurers. On January 18, 2008, Fitch Ratings downgraded Ambac Financial Group, the second
largest bond insurer in the U.S., from AAA to AA, and warned that it could cut its rating further.
Different from other insurance companies, the monoline insurers only focused on one line of
business, which is insuring municipal bonds against default. However, over the past decade,
these monolines had extended their business into selling credit protections on mortgage-based
securities and other structured finance products by credit default swap. As the default rate on
subprime mortgages rose dramatically, analysts estimated that the monolines might eventually
face $34 billion of losses, while they only had $48 billion to pay claims. (Duyn and Tett, 2008)
Since then, investors started to worry about whether their credit derivative counterparties- not
only the monoline insurers, but also other institutions such as hedge funds and investment
banks-could honor their contracts when credit events happen.
34
In early March 2008, Carlyle Capital, a hedge fund whose portfolio was comprised entirely of
securities issued by Fannie Mae and Freddie Mac, was unable to meet surging margin calls,
when the value of its portfolio of residential mortgage-backed securities fell sharply. (Kennedy,
2008) Thus, its collateral was partially sold in a fire sale, which lowered the agency bonds price
even further. This event seriously hurt Bear Stearns, because it had giant positions on agency
bonds and it was also a creditor to Carlyle Capital. (Barr, 2008)
Noticing a potential solvency crisis of Bear Stearns, its OTC derivative counterparties, especially
credit derivative counterparties, were motivated to decrease their exposures to Bear Stearns.
Counterparty to Bear Stearns could reduce its exposure either by selling the contract back to
Bear Stearns, or in a novation request, to another dealer for a fee. In fact, when Bear Stearns'
solvency was threatened, Credit Suisse and Deutsche Bank experienced a torrent of novation
requests for Bear instruments. However, in this case, other dealers naturally began to refuse
these novations. Moreover, the premium of CDS on Bear Stearns' debt jumped drastically. On
March 7, 2008, the annual premium to protect $10 million of Bear's debt jumped to $458,000,
which was much higher than that on other investment banks' debt. After March 11, 2008, banks
even refused to sell any further credit protection on its debt. It strongly signaled the weakness
of Bear Stearns' cash position and contributed to the run by its hedge fund clients and other
counterparties. Its liquidity situation became much worse as it was suddenly unable to finance
on the repurchase agreement market. (Kelly, 2008 and Boyd, 2008)
Bear Stearns was one of the main counterparties in the credit derivative market. Duyn (2008)
points out that" If Bear Stearns had defaulted, the (credit derivative) market would have had to
try to unravel the complex web of trades it was involved in. This could have created a logistical
headache for bankers because a CDS contract in effect pledges to protect an investor against
loss if a default occurs. Counterparties need to get hold of bonds when a default occurs to pay
back investors and, with Bear being a counterparty on so many trades, the complexity would
have been unprecedented." Finally, to minimize the counterparty credit risk, Bear Stearns was
acquired by JP Morgan Chase on March 16, 2008. (Sorkin, 2008)
As the mortgage delinquency rate kept on increasing in the following months, problems of
Fannie Mae and Freddie Mac exploded. Fannie Mae and Freddie Mac were two government
sponsored enterprises (GSE) with approximately $1.6 trillion in bonds outstanding. On
35
September 6, 2008, these two GSEs were placed into federal conservatorship. It was a big credit
event for the whole credit derivative market, because CDS contracts written on Fannie Mae and
Freddie Mac's debt were among the most actively traded and it triggered one of the largest ever
payments in the market's decade-long history. (REUTERS,2008 and Biggadike & Harrington, 2008)
On September 8, 2008, the International Swaps and Derivatives Association (ISDA) published an
announcement that "it will launch a protocol to facilitate settlement of credit derivative trades
involving Fannie Mae and Freddie Mac". (ISDA, 2008)
Similar to Bear Stearns, Lehman Brothers had a huge position on lower-rated mortgage-backed
securities tranches and a high degree of leverage. Its asset-to-equity ratio was about 31 in 2007.
(Lehman 2007 Annual Report, P29) As the subprime mortgage market was deteriorating,
Lehman's stock price plunged. After Korea Development Bank, Barclays, and Bank of America
refused to take it over, Lehman Brothers had to declare bankruptcy on September 15, 2008.
With $639 billion in assets and $619 billion in debt, Lehman's bankruptcy filing was the largest in
history. Meanwhile, Merrill Lynch agreed to sell itself to Bank of America for $50 billion. (Sorkin,
2008)
Since Lehman Brothers had a large number of counterparties all over the world, the effect of
Lehman's failure rippled throughout the financial market, especially its credit derivative
counterparties. Market participants were scared of the possibility of systemic default, because
Lehman's counterparties might lose their exposures to Lehman and then default to their
counterparties, which might finally lead to the collapse of the financial system. In fact, the
spreads of CDS contracts against defaults of the remaining banks skyrocketed right after Lehman
bankrupted, because all banks wanted to protect themselves against counterparty credit risk.
(Brunnermeier, 2009) Moreover, the pricing of counterparty credit risk began to be highly
valued by many more CDS dealers after Lehman's failure. (Arora, Gandhi and Longstaff, 2010) It
implied that the significance of counterparty credit risks was largely ignored previously.
Another critical issue is the giant amount of outstanding CDS written on Lehman. When Lehman
bankrupted, there was at least $72 billion CDS total notional amount written on Lehman
Brothers, according to the Depository Trust & Clearing Corporation. (DTCC, 2008) People were
afraid that the protection sellers were unable to honor payments because the value of CDS
skyrockets when a credit event occurs.

36
However, Stulz (2010) indicates that credit derivatives were not the primary cause of Lehman or
Bear Stearns failure, because they largely matched their risk positions and held collaterals. The
credit derivative market also worked "smoothly" to settle the CDS contracts on Lehman's debt,
and the net fund transfer on the $72 billion CDS notional amounts was just $5.2 billion. (DTCC,
2008)
Unfortunately, the exposure to credit derivative did play an important role in the liquidity
shortage of American International Group (AIG). AIG sold giant amount of credit protection on
super senior tranches of securitizations. As of June 30, 2008, the notional exposure of AIG’s
super senior credit default swap portfolio was $441 billion. (AIG 2008 second quarter 10-Q,
P120) As the U.S. housing market were deteriorating, it experienced serious losses. On
September 15, 2008, Moody, Fitch, and Standard &Poor all downgraded the rating of AIG by at
least two notches. (Reuters, 2008) It triggered the AIG liquidity crisis, because the downgrade
event required AIG to post additional collateral as much as $15 billion for its credit derivative
counterparties (Morgenson, 2008), but obviously AIG did not have enough cash to satisfy this
requirement. Paul (2008) points out "This was the explosive event that destroyed AIG. It was not
the market losses on its investments in mortgage-backed securities. It was not payouts on CDS
contracts where default events had actually occurred. It was a collateral call." Because AIG was
too interconnected in the credit derivatives business to fail, the Federal Reserve quickly
organized an $85 billion bailout to enable AIG to meet its obligations to its CDS counterparties,
in exchange for an 80 percent equity stake. (Andrews, de la Merced and Walsh, 2008)
Section 5: Which banks are major users of credit derivatives and what information did they
disclose about their use of credit derivatives?
Section 5.1: The major users of credit derivatives
After investigating the data further, I discover that most of the credit derivative positions were
concentrated at JP Morgan Chase, Bank of America and Citigroup over the entire sample period.
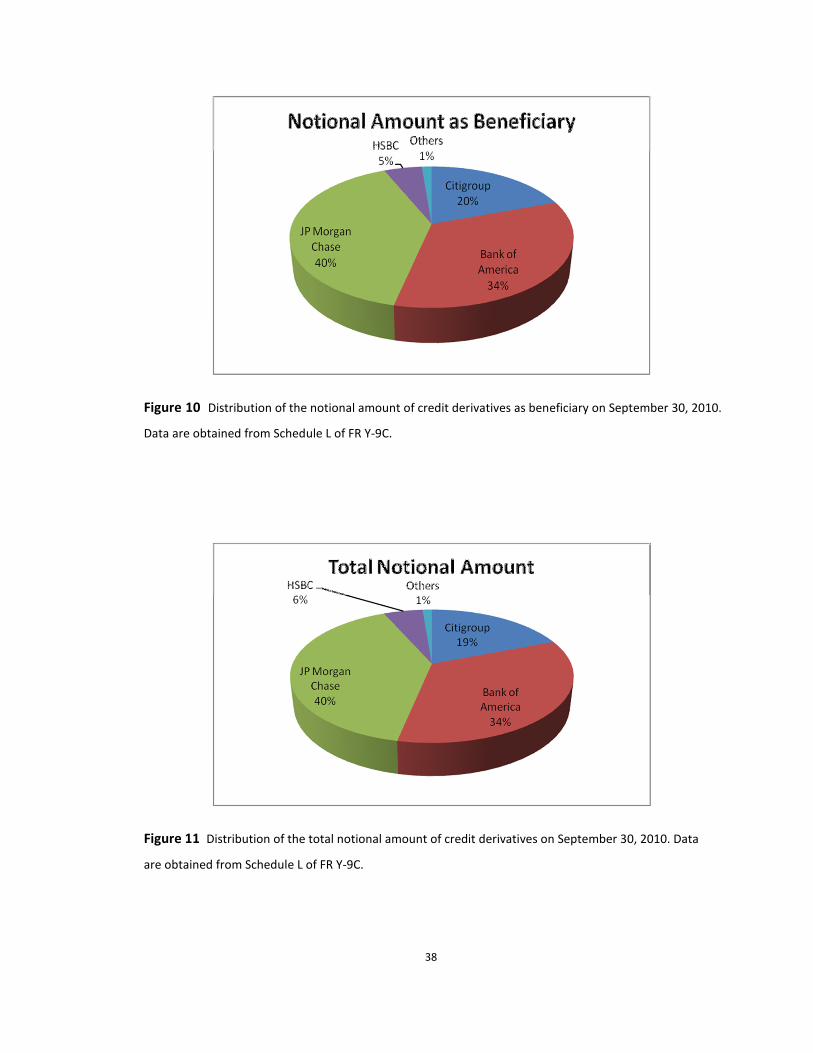
For example, by the end of September 2010, JPMorgan Chase, Bank of America, and Citigroup
held 40%, 34% and 19% of the total notional amount of credit derivatives in the sample,
respectively. Furthermore, the sum of the total notional amounts of credit derivatives held by

37
these three banks is about 93% of the sum of the total notional amounts of credit derivatives
held by all the banks in the sample. The notional amount as guarantor and the notional amount
as beneficiary follow the same distribution. (See Figure 9, 10 and 11)
Over the entire sample period, JPMorgan Chase, Bank of America, and Citigroup together have
more than 90% of both bought and sold positions of credit derivatives in the sample. Thus, the
hypothesis that there exist several major users of credit derivatives in the sample during the
sample period is true.
Since most of the credit derivative notional amounts are held by these three banks, the
fluctuation of positions of credit derivatives held by any one of them can largely affect the
notional amounts of credit derivatives in the entire sample. Figure 12 compares the total
notional amount held by these three banks with the total notional amount held by all the banks
in the sample. During the second quarter of 2008, Bank of America and Citigroup both lowered
their positions, but J.P. Morgan Chase increased its position sharply by $2 trillion, and it drove
the trend of the total notional amount of the sample going upward. It is caused by the
acquisition of Bear Stearns by J.P. Morgan Chase. Moreover, in the first quarter of 2009, the
total notional amount of credit derivatives held by Bank of America skyrocketed by $3.6 trillion,
while the other two banks both decreased their positions. It is caused by the acquisition of
Merrill Lynch by Bank of America.
Figure 9 Distribution of the notional amount of credit derivatives as guarantor on September 30, 2010.
Data are obtained from Schedule L of FR Y-9C.
38
Figure 10 Distribution of the notional amount of credit derivatives as beneficiary on September 30, 2010.
Data are obtained from Schedule L of FR Y-9C.
Figure 11 Distribution of the total notional amount of credit derivatives on September 30, 2010. Data
are obtained from Schedule L of FR Y-9C.

39
Figure 12 The total notional amount of credit derivatives held by JP Morgan Chase, Bank of America,
Citigroup and all the banks in the sample. Data are obtained from Schedule L of FR Y-9C.
Section 5.2: Annual Report Information Summary
To discover why the major users of credit derivatives changed their positions, I review the 2006-
2009 annual reports published by JP Morgan Chase, Bank of America and Citigroup and
summarize the information they disclosed about credit derivatives. They disclose more and
more information about credit derivative positions over time. They did use credit derivatives to
hedge their own portfolios, although most of their credit derivative positions were for trading.
They largely matched their purchased and sold positions and had noticed the counterparty
credit risk. Detailed information is included in Appendix IV.
Table 3 in Appendix III summarizes the notional amounts of credit derivatives held by J.P.
Morgan Chase for trading and for hedging during 2006-2009. Table 4 in Appendix III summarizes

40
the notional amounts of credit derivatives held by Citigroup for trading and for hedging during
2007-2008, because Citigroup does not disclose the exact notional amounts of credit derivatives
for trading and for hedging in 2006 and 2009. Although Bank of America does not disclose the
exact notional amounts of its credit derivatives for hedging and for trading, it reports the net
notional amount of credit derivatives for hedging in 2006-2009. (Please see Table 5 in Appendix
III and Figure 13 below)
Section 5.2.1: JP Morgan Chase
JP Morgan Chase discloses that in addition to the traditional risk management processes, they
also use loan syndication and participations, loan sales, securitizations, credit derivatives,
master netting agreements, collateral and other risk-reduction techniques to management their
credit risks. JPMorgan Chase purchases single-name and portfolio credit derivatives to manage
its wholesale credit exposure. Meanwhile, it sells credit protection to industries or clients where
it has little or no client-related exposure to diversify exposures, but it is not material to JP
Morgan Chase's overall credit exposure. However, the credit derivatives used for credit portfolio
management activities do not qualify for hedge accounting under SFAS 133.
During 2006 and 2007, the booming trade volume in the market caused the total notional
amount of credit derivatives in the dealer/client business increased by $2.4 trillion and $3.3
trillion, respectively. There was a mismatch between the notional amounts of protection as
beneficiary and as guarantor. However, JP Morgan Chase believes that it largely matched the
risk positions when securities used to risk-manage certain derivative positions were taken into
consideration and the notional amounts were adjusted to a duration-based equivalent basis or
to reflect different degrees of subordination in tranched structures.
In 2008 and 2009, JP Morgan Chase's annual report reviews credit risks and indicates that the
failure of some financial institutions affected the function of credit markets, particularly the loan
syndication and asset-backed securitization markets. JP Morgan Chase's credit portfolio was also
affected. One of the credit derivatives that JP Morgan Chase enrolled in was credit default swap.
JP Morgan Chase was cooperating with other market participants to reduce counterparty credit
risk, including cancellation of offsetting trades and using collaterals. Moreover, it discloses the

41
acquisition of Washington Mutual and Bear Stearns in 2008, which added their credit risk
exposure drastically.
Section 5.2.2: Bank of America
Bank of America reports that credit protection was purchased to cover the funded and the
unfunded portion of certain credit exposure. To decrease the cost, they may increase their
credit exposure within an industry, borrower or counterparty group by selling protection. Bank
of America does not disclose its dealer activity on credit derivatives until 2008, and it does not
separate the notional amounts of credit derivatives for hedging from those for trading. Bank of
America trades most of their credit derivatives with "large, international financial institutions" in
the over-the-counter market. Bank of America is subject to settlement risk and counterparty
credit risk. Since the credit derivatives are mark-to-market, Bank of America requires its
counterparties to add more collateral if credit downgrade happens. Moreover, it enters into
"legally enforceable master netting agreements" to reduce risk. In 2008, the significant widening
of credit spreads across nearly all major credit indices drove the counterparty credit risk for
purchased protection up.
Bank of America reports that they had indirect exposure to monolines primarily in the form of
guarantees supporting their loans, investment portfolios, securitizations, credit enhanced
securities as part of their public finance business and other selected products. It purchased
credit protection from monolines to hedge all or a portion of the credit risk on certain credit
exposures including loans and CDOs. If default happens, Bank of America first looks to the
underlying securities and then to recovery on the purchased insurance, but Bank of America did
not hold collateral against the monoline derivative exposures. In 2008, it reports that the
industry is working with the regulator to establish a central clearing house for credit derivatives
to reduce the counterparty credit risk. In 2009, Bank of America merged with Merrill Lynch and
it increased the notional amount of credit derivatives held by Bank of America dramatically.
Section 5.2.3: Citigroup
Citigroup reports that it does use credit derivatives to hedge part of the credit risk in its portfolio,
besides outright asset sales. Since 2007, Citigroup has reported its trading activity of credit
derivatives. It purchases or sells credit derivatives either on a single-name or portfolio basis. To
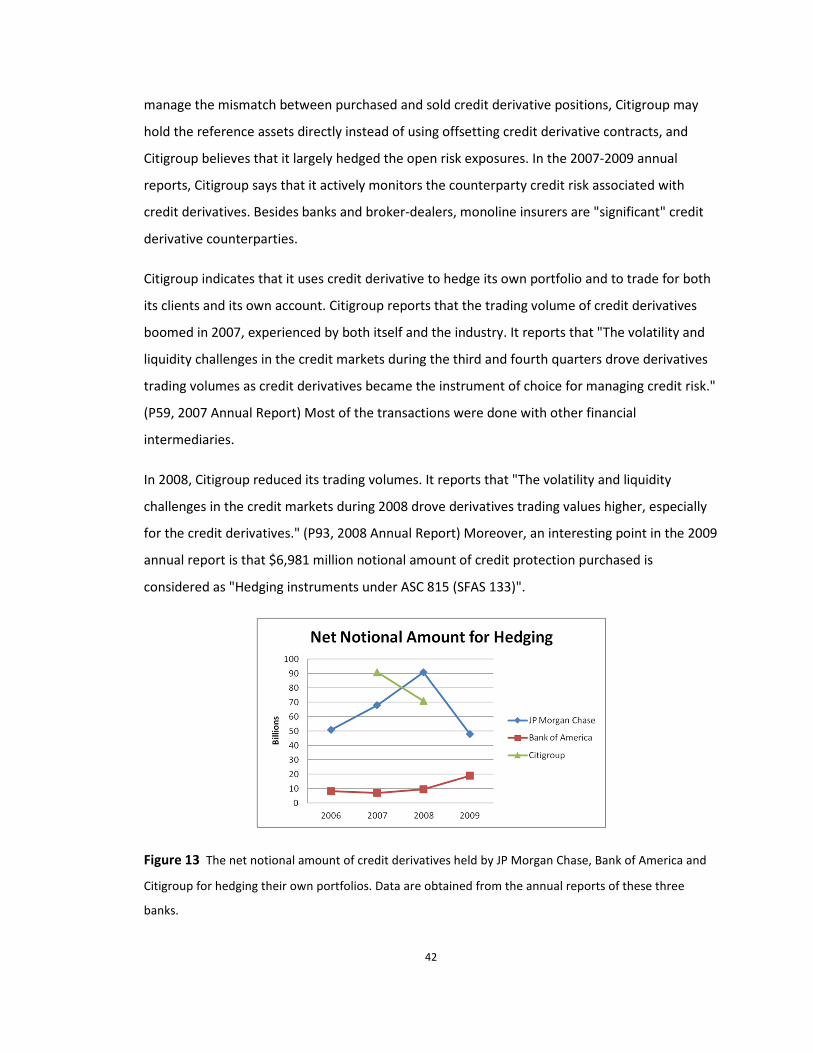
42
manage the mismatch between purchased and sold credit derivative positions, Citigroup may
hold the reference assets directly instead of using offsetting credit derivative contracts, and
Citigroup believes that it largely hedged the open risk exposures. In the 2007-2009 annual
reports, Citigroup says that it actively monitors the counterparty credit risk associated with
credit derivatives. Besides banks and broker-dealers, monoline insurers are "significant" credit
derivative counterparties.
Citigroup indicates that it uses credit derivative to hedge its own portfolio and to trade for both
its clients and its own account. Citigroup reports that the trading volume of credit derivatives
boomed in 2007, experienced by both itself and the industry. It reports that "The volatility and
liquidity challenges in the credit markets during the third and fourth quarters drove derivatives
trading volumes as credit derivatives became the instrument of choice for managing credit risk."
(P59, 2007 Annual Report) Most of the transactions were done with other financial
intermediaries.
In 2008, Citigroup reduced its trading volumes. It reports that "The volatility and liquidity
challenges in the credit markets during 2008 drove derivatives trading values higher, especially
for the credit derivatives." (P93, 2008 Annual Report) Moreover, an interesting point in the 2009
annual report is that $6,981 million notional amount of credit protection purchased is
considered as "Hedging instruments under ASC 815 (SFAS 133)".
Figure 13 The net notional amount of credit derivatives held by JP Morgan Chase, Bank of America and
Citigroup for hedging their own portfolios. Data are obtained from the annual reports of these three
banks.

43
Chapter V: Conclusion
In sum, the banking sector actively involved in credit derivatives during 2006-2010, both for
hedging and for trading. The credit derivative positions the banks held boomed in 2006 and
2007 but decreased in 2008 and 2009. I believe that the decrease in the credit derivative volume
is caused by the concern on counterparty credit risk, through the method of trade compression.
Most of the credit derivative positions in the sample were held by JP Morgan Chase, Bank of
America and Citigroup over the sample period. Most of their credit derivative positions were for
dealing activity, and they largely matched their positions. These banks disclosed more and more
information about credit derivatives over time. They also gave comments on the credit market
situations and the actions of the industry.
Credit derivatives played an important role in the events happened during the financial crisis.
The major effect of credit derivatives is that they are traded over-the-counter, so the failure of a
significant counterparty in this market may harm the entire financial system. Further research
may be done to explore what role offsetting trade played during the booming period of credit
derivatives.
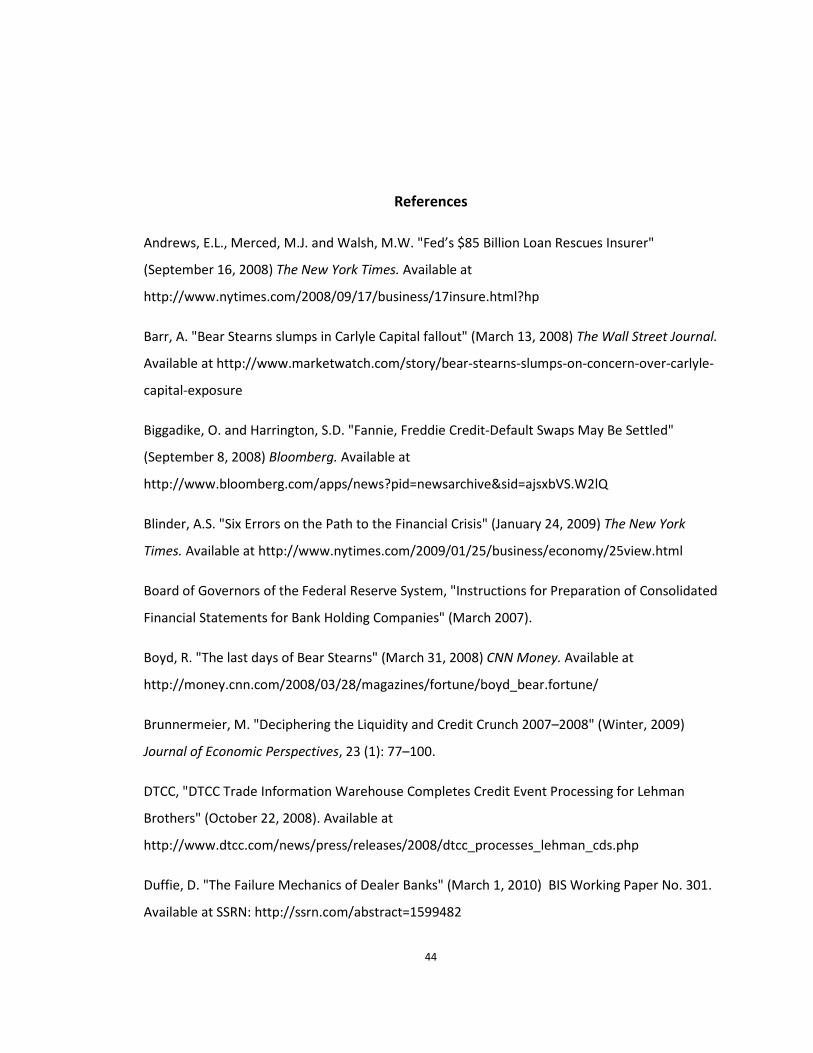
44
References
Andrews, E.L., Merced, M.J. and Walsh, M.W. "Fed’s $85 Billion Loan Rescues Insurer"
(September 16, 2008) The New York Times. Available at
http://www.nytimes.com/2008/09/17/business/17insure.html?hp
Barr, A. "Bear Stearns slumps in Carlyle Capital fallout" (March 13, 2008) The Wall Street Journal.
Available at http://www.marketwatch.com/story/bear-stearns-slumps-on-concern-over-carlyle-
capital-exposure
Biggadike, O. and Harrington, S.D. "Fannie, Freddie Credit-Default Swaps May Be Settled"
(September 8, 2008) Bloomberg. Available at
http://www.bloomberg.com/apps/news?pid=newsarchive&sid=ajsxbVS.W2lQ
Blinder, A.S. "Six Errors on the Path to the Financial Crisis" (January 24, 2009) The New York
Times. Available at http://www.nytimes.com/2009/01/25/business/economy/25view.html
Board of Governors of the Federal Reserve System, "Instructions for Preparation of Consolidated
Financial Statements for Bank Holding Companies" (March 2007).
Boyd, R. "The last days of Bear Stearns" (March 31, 2008) CNN Money. Available at
http://money.cnn.com/2008/03/28/magazines/fortune/boyd_bear.fortune/
Brunnermeier, M. "Deciphering the Liquidity and Credit Crunch 2007–2008" (Winter, 2009)
Journal of Economic Perspectives, 23 (1): 77–100.
DTCC, "DTCC Trade Information Warehouse Completes Credit Event Processing for Lehman
Brothers" (October 22, 2008). Available at
http://www.dtcc.com/news/press/releases/2008/dtcc_processes_lehman_cds.php
Duffie, D. "The Failure Mechanics of Dealer Banks" (March 1, 2010) BIS Working Paper No. 301.
Available at SSRN: http://ssrn.com/abstract=1599482
45
Duyn A. "CDS sector weighs Bear Stearns backlash" (March 17, 2008) Financial Times. Available
at http://www.ft.com/intl/cms/s/0/5f020206-f392-11dc-b6bc-
0000779fd2ac.html#axzz1VdVlmHbB
Duyn, A. and Tett, G. "Markets assess the costs of a monoline meltdown" (Feburary 20, 2008)
Financial Times. Available at http://www.ft.com/intl/cms/s/0/8d715b9e-dfe9-11dc-8073-
0000779fd2ac.html#axzz1VdVlmHbB
Effenberger, D. "Credit derivatives: Implications for credit markets" (July 10, 2003) Deutsche
Bank Research.
European Central Bank. "Credit Risk Transfer By Eu Banks: Activities, Risks And Risk
Management" (May 2004).
European Central Bank. "Credit Default Swaps and Counterparty Risk" (August 2009)
Fender, I., Frankel, A. and Gyntelberg, J. "Three Market Implications of the Lehman Bankruptcy"
(December 2008) BIS Quarterly Review. Page 6-7.
Finnegan, B. and Mawdsley, A. “Credit Risk Transfer – Significance for the Irish Market” (2004)
CBFSAI Financial Stability Report 2004.
Fitch Ratings. "Global Credit Derivatives Survey: Indices Dominate Growth as Banks’ Risk
Position Shifts" (September 21, 2006)
Gandhi, P., Longstaff, F. A. and Arora, N. "Counterparty Credit Risk and the Credit Default Swap
Market" (March 1, 2011) Available at SSRN: http://ssrn.com/abstract=1830321
ISDA, "ISDA to Publish Protocol for Fannie And Freddie" (September 8, 2008). Available at
http://www.isda.org/press/press090808.html
J.P. Morgan. "The J.P. Morgan Guide to Credit Derivatives" (1999) London: Risk Publications.
Kelly, K. "Fear, Rumors Touched Off Fatal Run on Bear Stearns" (May 28, 2008) The Wall Street
Journal, page A1.

46
Kennedy, S. "Carlyle Capital on verge of collapse after talks fail" (March 13, 2008) The Wall
Street Journal. Available at http://www.marketwatch.com/story/carlyle-capital-on-verge-of-
collapse-as-talks-break-down
Kiff, J., Michaud, F.-L. and Mitchell, J. "Instruments of Credit Risk Transfer: Effects on Financial
Contracting and Financial Stability" (December 2002) Available at SSRN:
http://ssrn.com/abstract=374640 or doi:10.2139/ssrn.374640
Minton, B., Stulz, R. M. and Williamson, R. "How Much Do Banks Use Credit Derivatives to Hedge
Loans?" (2009) Journal of Financial Services Research, 35(1): 1-31.
Morgenson, G. "Behind Insurer’s Crisis, Blind Eye to a Web of Risk" (September 27, 2008) The
New York Times. Available at http://www.nytimes.com/2008/09/28/business/28melt.html
Morrison, A.D. "Credit Derivatives, Disintermediation, and Investment Decisions." (March 2005)
The Journal of Business , 78 (2): 621-648. Available at
http://www.jstor.org/stable/10.1086/427641
O’Kane, D. et al. "The Lehman Brothers Guide to Exotic Credit Derivatives" (2003) Risk Waters
Group.
Parker, E. "Credit Derivatives" (2008) Available at
http://www.mayerbrown.com/london/article.asp?id=4234&nid=1575
Paul, D. "Credit Default Swaps, the Collapse of AIG and Addressing the Crisis of Confidence"
(October 11, 2008) The Huffington Post Business. Available at
http://www.huffingtonpost.com/david-paul/credit-default-swaps-the_b_133891.html
Prato, O. "Credit Derivatives: A New Source of Financial Instability?" (2002) Financial Stability
Review, 69-83.
Rajan, R. G. "Has Finance Made the World Riskier?" (2006) European Financial Management,
12: 499–533. doi: 10.1111/j.1468-036X.2006.00330.x
Reuters. "Big Payments Are Expected in Credit Default Swaps" (September 8, 2008) The New
York Times. Available at
http://www.nytimes.com/2008/09/09/business/09credit.html?partner=rssnyt&emc=rss
47
Reuters. "Rating agencies downgrade AIG, more cuts possible" (September 15, 2008) Reuters.
Available at http://www.reuters.com/article/2008/09/16/aig-downgrade-
idUSHKG1540020080916
Sorkin, A.R. "JP Morgan Pays $2 a Share for Bear Stearns" (March 17, 2008) The New York Times.
Available at http://www.nytimes.com/2008/03/17/business/17bear.html?pagewanted=1
Sorkin, A.R. "Lehman Files for Bankruptcy; Merrill Is Sold" (September 14, 2008) The New York
Times. Available at
http://www.nytimes.com/2008/09/15/business/15lehman.html?pagewanted=all
Soros, G. "One Way to Stop Bear Raids" (March 24, 2009) The Wall Street Journal. Available at
http://online.wsj.com/article/SB123785310594719693.html
Stulz, R. M. "Credit Default Swaps and the Credit Crisis" (Winter, 2010) Journal of Economic
Perspectives, American Economic Association, 24(1): 73-92.
Zingales, L. " Causes and Effects of the Lehman Brothers Bankruptcy" (October, 2008)

Appendix I: Banks in the Sample
(Sample is constructed from the 2005 4th quarter peer 1 BHCPR Peer Group Average Reports)
ID_RSSD Assets($000) BHC Name Location and Other Notes
1 1951350 1,494,037,00
0
CITIGROUP INC. NEW YORK, NY
2 1073757 1,294,312,24
1
BANK OF AMERICA CORPORATION CHARLOTTE, NC
3 1039502 1,198,942,00
0
JPMORGAN CHASE & CO. NEW YORK, NY
4 1120754 481,741,000 WELLS FARGO & COMPANY SAN FRANCISCO, CA
5 3232316 404,254,480 HSBC NORTH AMERICA HOLDINGS IN PROSPECT HEIGHTS, IL
6 2816906 364,693,000 TAUNUS CORPORATION NEW YORK, NY
7 1119794 209,465,000 U.S. BANCORP MINNEAPOLIS, MN
8 2914521 206,728,390 BARCLAYS GROUP US INC. WILMINGTON, DE
9 1131787 179,712,841 SUNTRUST BANKS, INC. ATLANTA, GA
10 1132449 155,439,714 CITIZENS FINANCIAL GROUP, INC. PROVIDENCE, RI
11 1074156 109,169,759 BB&T CORPORATION WINSTON-SALEM, NC
12 1070345 105,225,054 FIFTH THIRD BANCORP CINCINNATI, OH
13 1111435 97,995,766 STATE STREET CORPORATION BOSTON, MA
14 1068025 92,844,997 KEYCORP CLEVELAND, OH
15 1069778 91,992,332 PNC FINANCIAL SERVICES GROUP, PITTSBURGH, PA
16 2277860 88,701,411 CAPITAL ONE FINANCIAL CORPORAT MCLEAN, VA
17 3242838 84,786,331 REGIONS FINANCIAL CORPORATION BIRMINGHAM, AL
18 1025608 66,345,204 BANCWEST CORPORATION HONOLULU, HI
19 1037003 55,146,406 M&T BANK CORPORATION BUFFALO, NY
20 1199844 53,682,457 COMERICA INCORPORATED DETROIT, MI
21 1199611 53,413,797 NORTHERN TRUST CORPORATION CHICAGO, IL
22 2307280 51,008,151 UTRECHT-AMERICA HOLDINGS, INC. NEW YORK, NY
23 1245415 50,006,022 HARRIS FINANCIAL CORP. WILMINGTON, DE
24 1378434 49,416,609 UNIONBANCAL CORPORATION SAN FRANCISCO, CA

49
25 1129382 48,624,000 POPULAR, INC. SAN JUAN, PR
26 1027004 42,762,673 ZIONS BANCORPORATION SALT LAKE CITY, UT
27 1094640 36,581,677 FIRST HORIZON NATIONAL CORPORA MEMPHIS, TN
28 1068191 32,758,006 HUNTINGTON BANCSHARES INCORPOR COLUMBUS, OH
29 1249196 32,119,130 TD BANKNORTH INC. PORTLAND, ME
30 1078529 30,858,429 COMPASS BANCSHARES, INC. BIRMINGHAM, AL
31 1078846 27,634,551 SYNOVUS FINANCIAL CORP. COLUMBUS, GA
32 2132932 26,285,042 NEW YORK COMMUNITY BANCORP, IN WESTBURY, NY
33 1199563 22,117,591 ASSOCIATED BANC-CORP GREEN BAY, WI
34 1826056 20,364,063 RBC CENTURA BANKS, INC. ROCKY MOUNT, NC
35 2744894 19,888,691 FIRST BANCORP SAN JUAN, PR
36 1145476 17,839,831 WEBSTER FINANCIAL CORPORATION WATERBURY, CT
37 1883693 16,273,288 BOK FINANCIAL CORPORATION TULSA, OK
38 3212091 14,642,982 NEW YORK PRIVATE BANK & TRUST NEW YORK, NY
39 1075612 14,639,392 FIRST CITIZENS BANCSHARES, INC RALEIGH, NC
40 1027518 14,586,336 CITY NATIONAL CORPORATION BEVERLY HILLS, CA
41 1049341 13,900,459 COMMERCE BANCSHARES, INC. KANSAS CITY, MO
42 2389941 13,484,335 TCF FINANCIAL CORPORATION WAYZATA, MN
43 1020902 12,575,553 FIRST NATIONAL OF NEBRASKA, IN OMAHA, NE
44 1048773 12,434,005 VALLEY NATIONAL BANCORP WAYNE, NJ
45 1117129 12,407,481 FULTON FINANCIAL CORPORATION LANCASTER, PA
46 1102367 11,830,329 CULLEN/FROST BANKERS, INC. SAN ANTONIO, TX
47 1097614 11,782,738 BANCORPSOUTH, INC. TUPELO, MS
48 1104231 10,391,852 INTERNATIONAL BANCSHARES CORPO LAREDO, TX
49 1888193 10,272,262 WILMINGTON TRUST CORPORATION WILMINGTON, DE
50 1025309 10,187,462 BANK OF HAWAII CORPORATION HONOLULU, HI
51 1070804 10,168,441 FIRSTMERIT CORPORATION AKRON, OH
52 1079740 10,111,589 WHITNEY HOLDING CORPORATION NEW ORLEANS, LA Moved
from Peer 2

50
Appendix II: Banks Excluded from the Sample and Reasons
ID_RSSD Assets($000) BHC Name Location and Other Notes
1 1073551 520,755,000 WACHOVIA CORPORATION CHARLOTTE, NC
2 1379552 144,073,691 ABN AMRO NORTH AMERICA HOLDING CHICAGO, IL
3 1069125 142,410,520 NATIONAL CITY CORPORATION CLEVELAND, OH
4 1033470 102,157,000 BANK OF NEW YORK COMPANY, INC. NEW YORK, NY
5 1048429 57,616,871 NORTH FORK BANCORPORATION, INC MELVILLE, NY
6 1078604 52,619,315 AMSOUTH BANCORPORATION BIRMINGHAM, AL
7 1199497 46,295,972 MARSHALL & ILSLEY CORPORATION MILWAUKEE, WI
8 1068762 38,773,216 MELLON FINANCIAL CORPORATION PITTSBURGH, PA
9 1117679 38,496,335 COMMERCE BANCORP, INC. CHERRY HILL, NJ
10 1080465 21,440,300 COLONIAL BANCGROUP, INC., THE MONTGOMERY, AL
11 1072442 16,421,729 MERCANTILE BANKSHARES CORPORAT BALTIMORE, MD
12 2801546 16,149,557 W HOLDING COMPANY, INC. MAYAGUEZ, PR
13 1071203 15,688,573 SKY FINANCIAL GROUP, INC. BOWLING GREEN, OH
14 1141599 14,328,524 SOUTH FINANCIAL GROUP, THE GREENVILLE, SC
15 1130780 13,724,559 FBOP CORPORATION OAK PARK, IL
16 2337045 12,103,390 INVESTORS FINANCIAL SERVICES BOSTON, MA
17 1246702 10,954,414 PEOPLE'S MUTUAL HOLDINGS BRIDGEPORT, CT
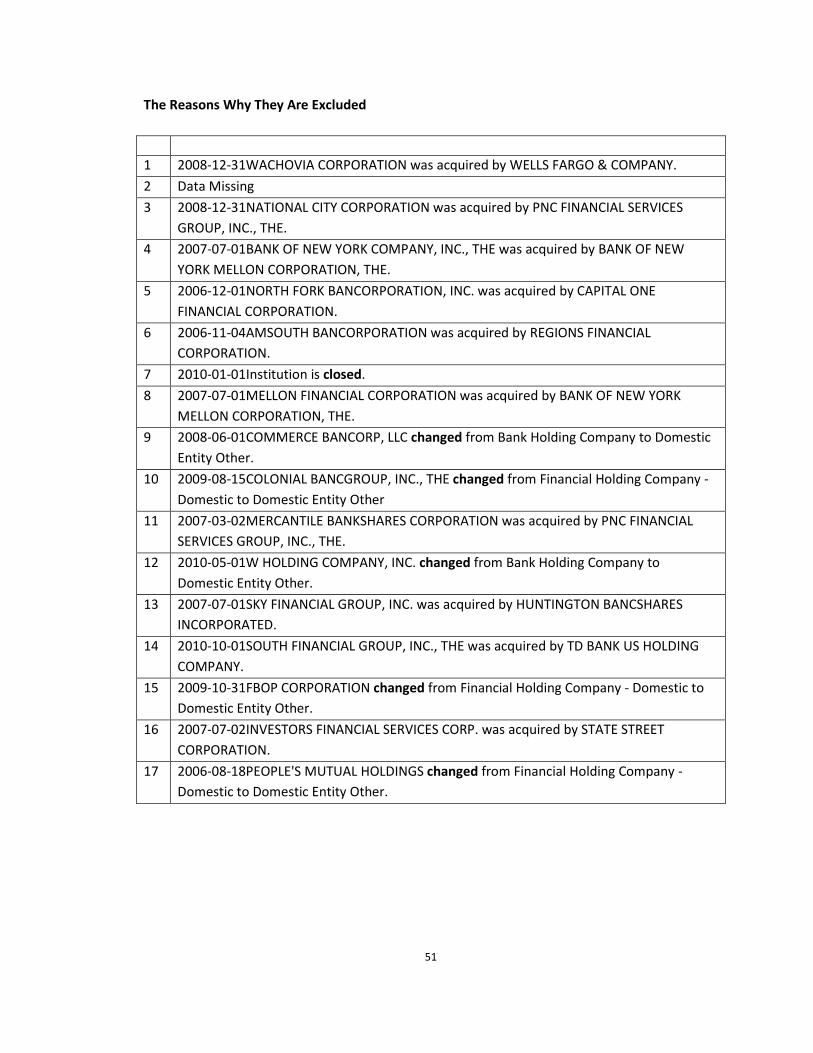
51
The Reasons Why They Are Excluded
1 2008-12-31WACHOVIA CORPORATION was acquired by WELLS FARGO & COMPANY.
2 Data Missing
3 2008-12-31NATIONAL CITY CORPORATION was acquired by PNC FINANCIAL SERVICES
GROUP, INC., THE.
4 2007-07-01BANK OF NEW YORK COMPANY, INC., THE was acquired by BANK OF NEW
YORK MELLON CORPORATION, THE.
5 2006-12-01NORTH FORK BANCORPORATION, INC. was acquired by CAPITAL ONE
FINANCIAL CORPORATION.
6 2006-11-04AMSOUTH BANCORPORATION was acquired by REGIONS FINANCIAL
CORPORATION.
7 2010-01-01Institution is closed.
8 2007-07-01MELLON FINANCIAL CORPORATION was acquired by BANK OF NEW YORK
MELLON CORPORATION, THE.
9 2008-06-01COMMERCE BANCORP, LLC changed from Bank Holding Company to Domestic
Entity Other.
10 2009-08-15COLONIAL BANCGROUP, INC., THE changed from Financial Holding Company -
Domestic to Domestic Entity Other
11 2007-03-02MERCANTILE BANKSHARES CORPORATION was acquired by PNC FINANCIAL
SERVICES GROUP, INC., THE.
12 2010-05-01W HOLDING COMPANY, INC. changed from Bank Holding Company to
Domestic Entity Other.
13 2007-07-01SKY FINANCIAL GROUP, INC. was acquired by HUNTINGTON BANCSHARES
INCORPORATED.
14 2010-10-01SOUTH FINANCIAL GROUP, INC., THE was acquired by TD BANK US HOLDING
COMPANY.
15 2009-10-31FBOP CORPORATION changed from Financial Holding Company - Domestic to
Domestic Entity Other.
16 2007-07-02INVESTORS FINANCIAL SERVICES CORP. was acquired by STATE STREET
CORPORATION.
17 2006-08-18PEOPLE'S MUTUAL HOLDINGS changed from Financial Holding Company -
Domestic to Domestic Entity Other.
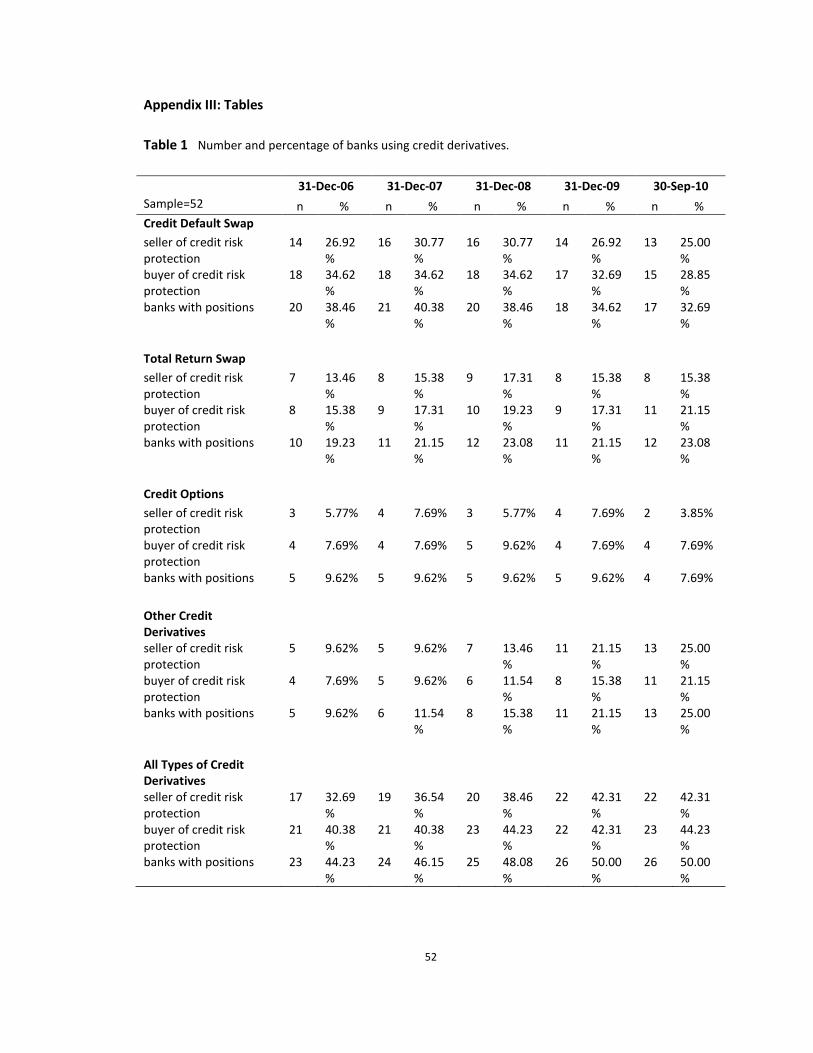
52
Appendix III: Tables
Table 1 Number and percentage of banks using credit derivatives.
31-Dec-06 31-Dec-07 31-Dec-08 31-Dec-09 30-Sep-10
Sample=52 n % n % n % n % n %
Credit Default Swap
seller of credit risk
protection
14 26.92
%
16 30.77
%
16 30.77
%
14 26.92
%
13 25.00
%
buyer of credit risk
protection
18 34.62
%
18 34.62
%
18 34.62
%
17 32.69
%
15 28.85
%
banks with positions 20 38.46
%
21 40.38
%
20 38.46
%
18 34.62
%
17 32.69
%
Total Return Swap
seller of credit risk
protection
7 13.46
%
8 15.38
%
9 17.31
%
8 15.38
%
8 15.38
%
buyer of credit risk
protection
8 15.38
%
9 17.31
%
10 19.23
%
9 17.31
%
11 21.15
%
banks with positions 10 19.23
%
11 21.15
%
12 23.08
%
11 21.15
%
12 23.08
%
Credit Options
seller of credit risk
protection
3 5.77% 4 7.69% 3 5.77% 4 7.69% 2 3.85%
buyer of credit risk
protection
4 7.69% 4 7.69% 5 9.62% 4 7.69% 4 7.69%
banks with positions 5 9.62% 5 9.62% 5 9.62% 5 9.62% 4 7.69%
Other Credit
Derivatives
seller of credit risk
protection
5 9.62% 5 9.62% 7 13.46
%
11 21.15
%
13 25.00
%
buyer of credit risk
protection
4 7.69% 5 9.62% 6 11.54
%
8 15.38
%
11 21.15
%
banks with positions 5 9.62% 6 11.54
%
8 15.38
%
11 21.15
%
13 25.00
%
All Types of Credit
Derivatives
seller of credit risk
protection
17 32.69
%
19 36.54
%
20 38.46
%
22 42.31
%
22 42.31
%
buyer of credit risk
protection
21 40.38
%
21 40.38
%
23 44.23
%
22 42.31
%
23 44.23
%
banks with positions 23 44.23
%
24 46.15
%
25 48.08
%
26 50.00
%
26 50.00
%
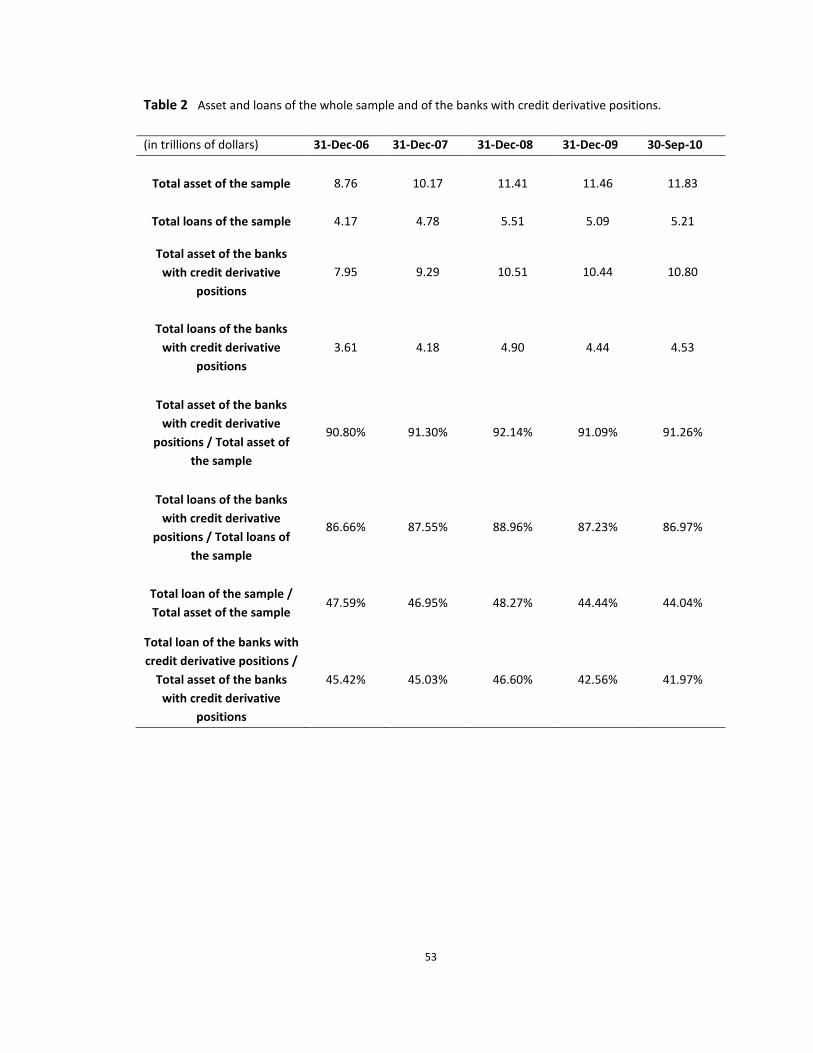
53
Table 2 Asset and loans of the whole sample and of the banks with credit derivative positions.
(in trillions of dollars) 31-Dec-06 31-Dec-07 31-Dec-08 31-Dec-09 30-Sep-10
Total asset of the sample 8.76 10.17 11.41 11.46 11.83
Total loans of the sample 4.17 4.78 5.51 5.09 5.21
Total asset of the banks
with credit derivative
positions
7.95 9.29 10.51 10.44 10.80
Total loans of the banks
with credit derivative
positions
3.61 4.18 4.90 4.44 4.53
Total asset of the banks
with credit derivative
positions / Total asset of
the sample
90.80% 91.30% 92.14% 91.09% 91.26%
Total loans of the banks
with credit derivative
positions / Total loans of
the sample
86.66% 87.55% 88.96% 87.23% 86.97%
Total loan of the sample /
Total asset of the sample 47.59% 46.95% 48.27% 44.44% 44.04%
Total loan of the banks with
credit derivative positions /
Total asset of the banks
with credit derivative
positions
45.42% 45.03% 46.60% 42.56% 41.97%

54
Table 3 Notional amounts of credit derivatives held by J.P. Morgan Chase for hedging and for trading.
JP Morgan Chase
Notional Amounts ($ Billions) 2006 2007 2008 2009
Hedging Bought 52 70 92 49 Sold 1 2 1 1
Trading Bought 2277 3999 4097 2997 Sold 2289 3896 4198 2947
Table 4 Notional amounts of credit derivatives held by Citigroup for hedging and for trading.
Citigroup
Notional Amount (Billions) 2006 2007 2008 2009
Hedging Bought N/A 91 71 N/A Sold N/A 0 0 N/A
Trading Bought N/A 1816 1519 N/A Sold N/A 1768 1443 N/A
Table 5 Net notional amount of credit derivatives held by Bank of America for hedging.
Bank of America
Net Notional Amount for Hedging (Billions)
2006 2007 2008 2009
8.3 7.1 9.7 19
55
Appendix IV: Annual Reports Summaries
JP Morgan Chase
JP Morgan Chase says in its annual reports that in addition to the traditional risk management
processes, they also use loan syndication and participations, loan sales, securitizations, credit
derivatives, master netting agreements, collateral and other risk-reduction techniques to
management their credit risks. JPMorgan Chase purchases single-name and portfolio credit
derivatives to manage its wholesale credit exposure. Meanwhile, it sells credit protection to
industries or clients where it has little or no client-related exposure to diversify exposures, but it
is not material to JP Morgan Chase's overall credit exposure. However, the credit derivatives
used for credit portfolio management activities do not qualify for hedge accounting under SFAS
133.
2006
As of December 31, 2006, JP Morgan Chase's total notional amount of credit derivatives was
$4,619 billion and approximately $5.7 billion derivative receivables, or 10% of total derivative
receivables mark-to-market, associated with credit derivatives before taking liquid securities
collateral into account.
The notional amounts of credit derivatives as guarantor and as beneficiary for hedging its own
credit portfolio were $1 billion and $52 billion, respectively. Of the $52 billion credit protection
purchased, $40.8 billion was for managing loans and lending related commitments, and $11.2
billion was for managing derivative receivables. Furthermore, within the $52 billion credit
protection purchased for hedging, $23 billion was for structured portfolio on which JP Morgan
Chase retained the first loss.
Meanwhile, the notional amounts of credit derivatives as guarantor and as beneficiary for dealer
activity were $2,289 billion and $2,277 billion, respectively. During 2006, the booming trade
volume in the market caused the total notional amount of credit derivatives in the dealer/client
business increased by $2.4 trillion. There was a mismatch between the notional amounts of
protection as beneficiary and as guarantor. However, JP Morgan Chase believes that it largely
matched the risk positions when securities used to risk-manage certain derivative positions
56
were taken into consideration and the notional amounts were adjusted to a duration-based
equivalent basis or to reflect different degrees of subordination in tranched structures.
Moreover, 16% of its credit derivative notional amounts for hedging were less than 1 year
maturity, and 75% were more than 1year but less than 5 years maturity, and 9% were above 5
years maturity. 88% of the underlying assets were at the investment grade.
JP Morgan Chase also discloses its wholesale credit exposure, net credit derivative hedges, and
the amount of collateral held against derivative receivables by industries. As of December 31,
2006, the total wholesale credit exposure was $630,767 million. The net credit derivative hedge
for the credit exposure was totally $50,733 million in notional amount, and the collateral held
against derivative receivables was $6,591 million in total.
2007
JP Morgan Chase's 2007 annual report shows that its total notional amount of credit derivatives
was $7,967 billion and it had $22.1 billion credit derivative receivables, or 29% of the total
derivative receivables MTM, before the benefit of liquid securities collateral as of December 31,
2007. It says that the credit derivatives receivables increased by $16.4 billion because of the
increasing credit spreads and the decline in the U.S. dollar.
The notional amounts of credit derivatives as guarantor and as beneficiary for hedging its own
credit portfolio were $2 billion and $70 billion, respectively. Within the $70 billion credit
protection purchased, $63.6 billion was for managing loans and lending related commitments,
and $6.5 billion was for managing derivative receivables. Different from that in 2006, of the
credit protection purchased for hedging, $31.1 billion was for structured portfolio on which JP
Morgan Chase retained a "minimal" first loss.
The notional amounts of credit derivatives as guarantor and as beneficiary for dealer activity
were $3,896 billion and $3,999 billion, respectively. Similar to 2006, the total notional amount
of credit derivatives in the dealer/client business ascended by $3.3 trillion in 2007, which was
led to by the climbing trade volume in the market. Again, JP Morgan Chase believes that it
largely matched the risk positions when securities and other factors were taken into
consideration.
57
Moreover, 39% of its credit derivative notional amounts for hedging were less than 1 year
maturity, and 56% were more than 1year but less than 5 years maturity, and 5% were above 5
years maturity. 89% of the underlying assets were at the investment grade.
Again, JP Morgan Chase discloses its wholesale credit exposure, net credit derivative hedges,
and the amount of collateral held against derivative receivables by industries. As of December
31, 2007, the total wholesale credit exposure was $736,864 million. The net credit derivative
hedge for the credit exposure was totally $67,999 million in notional amount, and the collateral
held against derivative receivables was $9,824 million in total.
2008
JP Morgan Chase's 2008 annual report gives much more comments than previous ones.
At the "Credit Risk Management" section, it reviews the credit risks in 2008. It reports that
"During 2008, credit markets experienced deterioration and increased defaults and downgrades
reflecting, among other things, reduced liquidity. The liquidity and credit crisis has adversely
affected many financial institutions, resulting in the failure of some in both the U.S. and Europe,
and has impacted the functioning of credit markets, particularly, the loan syndication and asset-
backed securitization markets. The Firm’s credit portfolio was affected by these market
conditions and experienced deteriorating credit quality, especially in the latter part of the year,
generally consistent with the market." (P93) Moreover, at the "Credit Portfolio" section, it
discloses the acquisition of Washington Mutual and Bear Stearns, which added their credit risk
exposure drastically.
As of December 31, 2008, its total notional amount of credit derivatives was $8,388 billion and
the mark-to-market credit derivative receivable was $44,695 million. The total notional amount
of protection had increased by $421 billion since year-end 2007. JP Morgan indicates that "The
increase was primarily as a result of the merger with Bear Stearns, partially offset by the impact
of industry efforts to reduce offsetting trade activity." (P101)
The notional amounts of credit derivatives as guarantor and as beneficiary for its own credit
portfolio were $1 billion and $92 billion, respectively. Within the $92 billion credit protection
purchased, $81.2 billion was for managing loans and lending related commitments, and $10.9

58
billion was for managing derivative receivables. Of the credit protection purchased for hedging,
$34.9 billion was for structured portfolio on which JP Morgan Chase retained a first risk of loss.
The notional amounts of credit derivatives as guarantor and as beneficiary for dealer/client
business were $4,198 billion and $4,097 billion, respectively. JPMorgan Chase actively bought
and sold credit protection, predominantly on corporate debt obligations, to meet client demand
for credit risk protection for their dealer/client business, including single-name, portfolio, and
indexed credit derivatives. They usually hedged their positions by purchasing credit protection
from third party on the same reference entity. Their trading desks were actively managing the
residual default exposure and spread risk.
When classified by years of maturity, 47% of its credit derivative notional amounts for hedging
were less than 1 year, and 47% were more than 1year but less than 5 years, and 6% were above
5 years. 90% of the underlying assets were at the investment grade.
By the end of 2008, the total wholesale credit exposure was $820,682 million. The net credit
derivative hedge for the credit exposure was totally $91,451 million in notional amount, and the
collateral held against derivative receivables was $19,816 million in total.
JP Morgan Chase indicates that credit default swap is a type of credit derivative it enters into. It
reports that "During 2008, the Firm worked with other significant market participants to
develop mechanisms to reduce counterparty credit risk, including the cancellation of offsetting
trades. In 2009, it is anticipated that one or more central counterparties for CDS will be
established and JPMorgan Chase will face these central counterparties, or clearing houses, for
an increasing portion of its CDS business." (P101) It implies that the major dealers of credit
derivatives reduced their positions because of the counterparty credit risk.
2009
Similar to 2008, at the "Credit Risk Management" section, JP Morgan Chase reviews the credit
risks in 2009. It reports that "During 2009, the credit environment experienced further
deterioration compared with 2008, resulting in increased defaults, downgrades and reduced
liquidity. In the first part of the year, the pace of deterioration increased, adversely affecting
many financial institutions and impacting the functioning of credit markets, which remained
weak. The pace of deterioration also gave rise to a high level of uncertainty regarding the

59
ultimate extent of the downturn. The Firm’s credit portfolio was affected by these market
conditions and experienced continued deteriorating credit quality, especially in the first part of
the year, generally consistent with the market."
As of December 31, 2009, the total notional amount of credit derivatives was $5,994 billion, and
the mark-to-market credit derivative receivable was $18,815 million, or 23% of its total
derivative receivables MTM, before counting the liquid security collaterals. The total notional
amount had reduced by $2.4 trillion since year-end 2008, as a result of the industry efforts to
decrease offsetting trade. The plunge of mark-to-market credit derivative receivable was caused
by tightening credit spreads.
Meanwhile, the notional amounts of credit derivatives as guarantor and as beneficiary for its
own credit portfolio were $1 billion and $49 billion, respectively. Within the $49 billion credit
protection purchased, $36.9 billion was for managing loans and lending related commitments,
and $12 billion was for managing derivative receivables. Furthermore, of the credit protection
purchased for hedging, $19.7 billion was for structured portfolio on which JP Morgan Chase
retained a first risk of loss. The notional amounts of credit derivatives as guarantor and as
beneficiary for dealer/client business were $2,947 billion and $2,997 billion, respectively. Again,
JPMorgan Chase actively makes market for its clients and hedge risks by purchasing protection
from thirty parties.
This year, 49% of their credit derivative hedges notional amounts were less than 1 year maturity,
and 42% of their credit derivative hedges notional amounts were more than 1year but less than
5 years maturity, and 9% of their credit derivative hedges notional amounts were over 5 years
maturity. 100% of the underlying assets of the credit derivatives were at the investment grade.
As of December 31, 2009, the total wholesale credit exposure was $650,212 million. The net
credit derivative hedge for the credit exposure was totally $48,376 million in notional amount,
and the collateral held against derivative receivables was $15,519 million in total.
For CDS, it reports that "In 2009, the frequency and size of defaults for both trading
counterparties and the underlying debt referenced in credit derivatives were well above
historical norms. The use of collateral to settle against defaulting counterparties generally
performed as designed in significantly mitigating the Firm’s exposure to these counterparties."
(P111)

60
Bank of America
Bank of America reports that credit protection was purchased to cover the funded and the
unfunded portion of certain credit exposure. To decrease the cost, they may increase their
credit exposure within an industry, borrower or counterparty group by selling protection. Bank
of America does not disclose its dealer activity on credit derivatives until 2008, and it does not
separate the notional amounts of credit derivatives for hedging from those for trading in its
2006-2009 annual reports
2006
Bank of America reports that its total notional amount of credit derivatives was $1,497,869
million and the credit risk amount associated with it was $756 million as of December 31, 2006.
It does not disclose the notional amount as guarantor and as beneficiary separately, and it does
not report the notional amount of credit derivatives for trading, either. Furthermore, it does not
disclose the exact amount of cash collateral for credit derivatives.
By December 31, 2006, they had $8.3 billion net notional credit default protection purchased for
hedging. They reduced their net credit default protection by $6.4 billion in 2006 because of their
view of the underlying risk in their credit portfolio and their near term outlook on the credit
environment. They lost 241 million dollars on the net cost of credit default protection, including
mark-to-market impacts, in 2006. They believed that the losses in 2006 were caused by the
impact of credit spreads tightening across most of our hedge positions.
When classified by maturity profile, 7% of their net credit default protection portfolio was less
than 1year, and 46% was greater than 1year but less than 5 years, and 47% was greater than 5
years. 82.7% of its net credit protection notional amount was at investment grade.
The average Value-at-Risk (VAR) for the credit derivative hedges was $54 million for the twelve
months ended December 31, 2006. Compared with that in 2005, The VAR decreased, because
the average amount of credit protection outstanding reduced during the period. There was a
diversification effect between the credit derivative hedges and the market-based trading
portfolio such that Bank of America's combined average VAR was $57 million for the twelve
months ended December 31, 2006.
61
2007
This year, Bank of America reports that they had indirect exposure to monolines primarily in the
form of guarantees supporting their loans, investment portfolios, securitizations, credit
enhanced securities as part of their public finance business and other selected products. It
purchased credit protection from monolines to hedge all or a portion of the credit risk on
certain credit exposures including loans and CDOs. If default happen, Bank of America first look
to the underlying securities and then to recovery on the purchased insurance.
As of December 31, 2007, the total notional amount of credit derivatives was $3,046,381 million
and the credit risk amounts was $7,493 million. Similar to 2006, it does not disclose the notional
amount as guarantor and as beneficiary separately, nor the notional amount of credit
derivatives for trading. It does not disclose the exact amount of cash collateral for credit
derivatives, either.
By December 31, 2007, it had $7.1 billion net notional credit default protection purchased for
hedging. Its net credit default protection purchased reduced by $1.1 billion to $7.1 billion in
2007 as they continued to reposition the level of purchased protection based on their current
view of the underlying credit risk in their portfolio. Bank of America earned $160 million in 2007
compared to net losses of $241 million in 2006 because of the net mark-to-market impacts and
the cost of credit default protection.
In its net credit default protection portfolio, 2% was less than 1year maturity, and 67% was
greater than 1year but less than 5 years maturity, and 31% was greater than 5 years maturity.
81.8% of its net credit protection notional amount was at investment grade.
The average VAR for the credit derivative hedges was $22 million for the twelve months ended
December 31, 2007. The reduction of the average amount of credit protection outstanding
during the year caused the decreasing of VAR. There was a diversification effect between the
credit derivative hedges and the market-based trading portfolio such that Bank of America's
combined average VAR was $55 million for the twelve months ended December 31, 2007.

62
2008
Bank of America's 2008 annual report gives much more information about credit derivatives
than the previous ones. There are five new points in the 2008 annual report.
First, Bank of America reports its exact exposure to monoline insurers. Compared to the $420
million mark-to-market counterparty derivative credit exposure at December 31, 2007, it was
$2.6 billion at December 31, 2008. It reports that "The increase in the mark-to-market exposure
was due to credit deterioration related to underlying counterparties and spread widening in
both wrapped CDO and structured finance related exposures." (P76) The counterparty credit
valuation adjustment of monoline derivative exposure was $1.0 billion as of December 31, 2008.
It decreased Bank of America's net mark-to-market exposure to $1.6 billion. Unfortunately, Bank
of America did not hold collateral against these derivative exposures. Furthermore, it was
evaluating the impact of one monoline counterparty's business restructuring and credit rating
downgraded in the first quarter of 2009.
Second, it reports the notional amounts of credit derivatives as guarantor and as beneficiary
separately. As of December 31, 2008, the notional amounts of purchased and written protection
were $1,032,451 million and $1,006,237 million, respectively. The credit risk of purchased and
written protection was $13,450 million and $13,450 million, respectively. The credit risk amount
was measured as the net replacement cost if Bank of America's counterparties with contracts in
a gain position fail to perform under the terms of those contracts. Bank of America reduced its
aggregate positions by $1.0 trillion to minimize market and operational risk.
Third, it discloses that besides the net notional credit default protection purchased to cover
their own credit exposures, credit derivatives were used for market-making and trading. It
reports that it trades most of their credit derivatives with "large, international financial
institutions" in the over-the-counter market. Bank of America is subject to settlement risk and
counterparty credit risk. Since the credit derivatives are mark-to-market, Bank of America
requires its counterparties to add more collateral if credit downgrade happens. Moreover, it
enters into "legally enforceable master netting agreements" to reduce risk. In 2008, the
significant widening of credit spreads across nearly all major credit indices drove the
counterparty credit risk for purchased protection up.
63
Fourth, the 2008 annual report adds a new "Counterparty Credit Risk Valuation Adjustments"
section to discuss the counterparty credit risk of credit derivatives. Bank of America assesses the
amount of counterparty credit risk by the value of the derivative contract, collateral, and credit
worthiness of the counterparty. In 2008, within the $3.2 billion valuation adjustments of trading
account losses related to derivative assets for counterparty credit risk, $1.1 billion was related
to insured super senior CDOs and $537 million was related to structured credit trading business.
Bank of America reports that "The losses were driven by increases in the value of the derivative
contracts resulting primarily from spread widening, market volatility and credit deterioration
related to the underlying counterparties." (P79)
Last but not least, it reports that the industry is working with the regulator to establish a central
clearing house for credit derivatives to reduce the counterparty credit risk. Similar information
appears in JP Morgan 2008 annual report.
Bank of America had $9.7 billion net notional credit default protection purchased for hedging by
December 31, 2008. It earned $993 million from the credit derivatives for hedging because of
the mark-to-market impacts. The average VAR for these credit derivative hedges was $24 million.
The increasing of VAR was resulted in by the ascending of the average amount of credit
protection outstanding in 2008. There was a diversification effect between the net credit default
protection hedging its own credit exposure and the related credit exposure such that its
combined average VAR was $22 million in 2008.
In its net credit default protection portfolio, 1% was less than 1year maturity, and 92% was
greater than 1year but less than 5 years maturity, and 7% was greater than 5 years maturity. 80%
of its net credit protection notional amount was at investment grade.
2009
In the 2009 annual report, the most important information I find is that the skyrocketing of the
notional amounts of credit derivatives during the first quarter of 2009 is driven by the
acquisition of Merrill Lynch. As of December 31, 2009, the notional amounts of purchased and
written protection were $2,822,224 million and $2,821,869 million, respectively. The credit risk
of purchased and written protection was $27,704 million and $27,704 million, respectively. Bank
64
of America reports that "The addition of Merrill Lynch drove the increase in counterparty credit
risk for purchased credit derivatives and the increase in the contract/notional amount." (P85)
Bank of America had $19 billion net notional credit default protection purchased for hedging by
December 31, 2009. It reports that the increasing in net notional amount of credit derivatives
was primarily caused by the acquisition of Merrill Lynch. It lost $2.9 billion on the credit
derivatives for hedging in 2009 because of the mark-to-market impacts. The average Value-at-
Risk (VAR) for these credit derivative hedges was $76 million in 2009. The average VAR for the
related credit exposure was $130 million in 2009. The year-over-year increase in VAR was
caused by the combination of the Merrill Lynch and Bank of America businesses in 2009. There
was a diversification effect between the net credit default protection hedging its credit exposure
and the related credit exposure such that the combined average VAR was $89 million in 2009.
When classified by maturity profile, 16% of Bank of America's net credit default protection
portfolio was less than 1year, and 81% of its net credit default protection portfolio was greater
than 1year but less than 5 years, and 3% was greater than 5 years. 84.1% of its net credit
protection notional amount was at investment grade.
Citigroup
Citigroup reports that it does use credit derivatives to hedge part of the credit risk in its portfolio,
besides outright asset sales. Since 2007, Citigroup has reported its trading activity of credit
derivatives. It purchases or sells credit derivatives either on a single-name or portfolio basis. To
manage the mismatch between purchased and sold credit derivative positions, Citigroup may
hold the reference assets directly instead of using offsetting credit derivative contracts, and
Citigroup believes that it largely hedged the open risk exposures. In the 2007-2009 annual
reports, Citigroup says that it actively monitors the counterparty credit risk associated with
credit derivatives. Besides banks and broker-dealers, monoline insurers are "significant" credit
derivative counterparties.

65
2006
The Citigroup 2006 annual report does not disclose much information about credit derivatives.
As of December 31, 2006, Citigroup's total notional amount of credit derivatives was $1,944,980
million. Its credit derivative mark-to-market receivable was $14,069 million and its credit
derivative market -to-market payable was $15,081 million. All of its credit derivative positions
were recorded for trading.
2007
In 2007, Citigroup reported much more information about credit derivatives. The 2007 annual
report discloses the notional amounts as guarantor and as beneficiary by types of instruments,
such as credit default swap, total return swap and credit default options. As of December 31,
2007, the notional amounts of credit derivatives as guarantor and as beneficiary were
$1,767,837 million and $1,906,956 million, respectively. The credit derivative mark-to-market
receivables as guarantor and as beneficiary were $4,967 million and $78,426 million,
respectively. The credit derivative mark-to-market payables as guarantor and as beneficiary
were $73,103 million and $11,191 million, respectively.
A new section, "Credit Derivatives", is added in the 2007 annual report. Citigroup indicates that
it uses credit derivative to hedge its own portfolio and to trade for both its clients and its own
account. As of December 31, 2007, the notional amounts as guarantor and as beneficiary for
hedging were $0 and $91,228 million, respectively, and the notional amount as guarantor and as
beneficiary for trading were $1,767,837 million and $1,815,728 million, respectively. The credit
derivative receivable and payable for hedging were $626 million and $129 million, respectively,
and the credit derivative receivable and payable for trading were $82,767 million and $84,165
million. The counterparty with the largest notional amounts was banks, and the type of credit
derivative with the largest notional amounts was credit default swap.
Citigroup reports that the trading volume of credit derivatives boomed in 2007, experienced by
both itself and the industry. It reports that "The volatility and liquidity challenges in the credit
markets during the third and fourth quarters drove derivatives trading volumes as credit
derivatives became the instrument of choice for managing credit risk." (P59) Most of the
transactions were done with other financial intermediaries. It discloses detailed information
66
about this booming. "During 2007 the total notional amount of protection purchased and sold
increased $906 billion and $824 billion, respectively, and by various market participants. The
total market value increase of $69 billion for each protection purchased and sold was primarily
due to an increase in volume growth of $63 billion and $62 billion, and market spread changes
of $6 billion and $7 billion for protection purchased and sold, respectively. The Company
expects to continue actively operating in the credit derivative markets." (P59)
As of December 31, 2007, 77% of Citigroup's gross receivables were with collateral agreements.
Citigroup may call for additional collateral if its credit derivative counterparty's credit rating is
downgraded. However, the master agreements with the monoline insurance counterparties are
generally not collateralized, and only significant downgrade can terminate the contracts.
2008
As of December 31, 2008, the notional amounts of credit derivatives held by Citigroup as
guarantor and as beneficiary were $1,443,280 million and $1,590,212 million, respectively. The
credit derivative mark-to-market receivables as guarantor and as beneficiary were $5,890
million and $222,461 million, respectively. The credit derivative mark-to-market payables as
guarantor and as beneficiary were $198,233 million and $5,476 million, respectively.
Citigroup discloses the market value and notional amounts by activity, by counterparties, and by
instrument type. As of December 31, 2008, the notional amounts as guarantor and as
beneficiary for hedging were $0 and $71,131 million, respectively. The notional amounts as
guarantor and as beneficiary for trading were $1,443,280 million and $1,519,081 million,
respectively. The credit derivative receivable and payable for hedging were $3,257 million and
$15 million, respectively, and the credit derivative receivable and payable for trading were
$225,094 million and $203,694 million. Similar to 2007, the counterparty with the largest
notional amounts was banks, and the type of credit derivative with the largest notional amounts
was credit default swap.
In 2008, Citigroup reduced its trading volumes. It reports that "The volatility and liquidity
challenges in the credit markets during 2008 drove derivatives trading values higher, especially
for the credit derivatives." (P93) Compared to December 31, 2007, the notional amounts of
purchased and sold protections as of December 31, 2008 decreased by $317 billion and by $325

67
billion, respectively, but the fair value of purchased and sold protections increased by $145
billion and $119 billion, respectively, because of the widened general credit spreads.
As of December 31, 2008, 88% of Citigroup's gross receivables were with collateral agreements.
Citigroup may call for additional collateral if its credit derivative counterparty's credit rating is
downgraded.
2009
In the 2009 annual report, Citigroup moves some information about derivatives from
"Derivative" section to "Note 24". As of December 31, 2009, the notional amounts of credit
derivatives held by Citigroup as guarantor and as beneficiary were $1,214,053 million and
$1,332,962 million, respectively. An interesting point in the 2009 annual report is that $6,981
million notional amount of credit protection purchased is considered as "Hedging instruments
under ASC 815 (SFAS 133)". The credit derivative trading assets as guarantor and as beneficiary
were $24,234 million and $68,558 million, respectively. The credit derivative trading liabilities as
guarantor and as beneficiary were $58,262 million and $24,162 million, respectively.
This time, Citigroup does not separate the notional amounts or the MTM receivable/payable of
credit derivatives for hedging from those for trading. However, it reports that about 50% and 30%
of its credit derivative positions were at investment and non-investment grade, respectively, as
of December 31, 2009. Again, the counterparty with the largest notional amounts was banks,
and the type of credit derivative with the largest notional amounts was credit default swap.
Related Documents