Los Angeles | London | New Delhi | Singapore | Washington DC | Boston Make sure your volume is set appropriately Make sure you have followed the instructions on your keypad properly Make sure everything is plugged in properly to assure your devices are working correctly If you have audio or visual difficulties, please let us know via the Question box and we will be happy to assist you. Please Check Your Settings #SocialScienceLive

When Science and Politics Collide
Jul 21, 2015
Welcome message from author
This document is posted to help you gain knowledge. Please leave a comment to let me know what you think about it! Share it to your friends and learn new things together.
Transcript

Los Angeles | London | New Delhi | Singapore | Washington DC | Boston
Make sure your volume is set appropriately
Make sure you have followed the instructions on your keypad properly
Make sure everything is plugged in properly to assure your devices are working correctly
If you have audio or visual
difficulties, please let us know via
the Question box and we will be happy to assist
you.
Please Check Your Settings
#SocialScienceLive
Los Angeles | London | New Delhi | Singapore | Washington DC | Boston
When Science
and Politics
Collide
#SocialScienceLive
Los Angeles | London | New Delhi | Singapore | Washington DC | Boston
Elizabeth Suhay
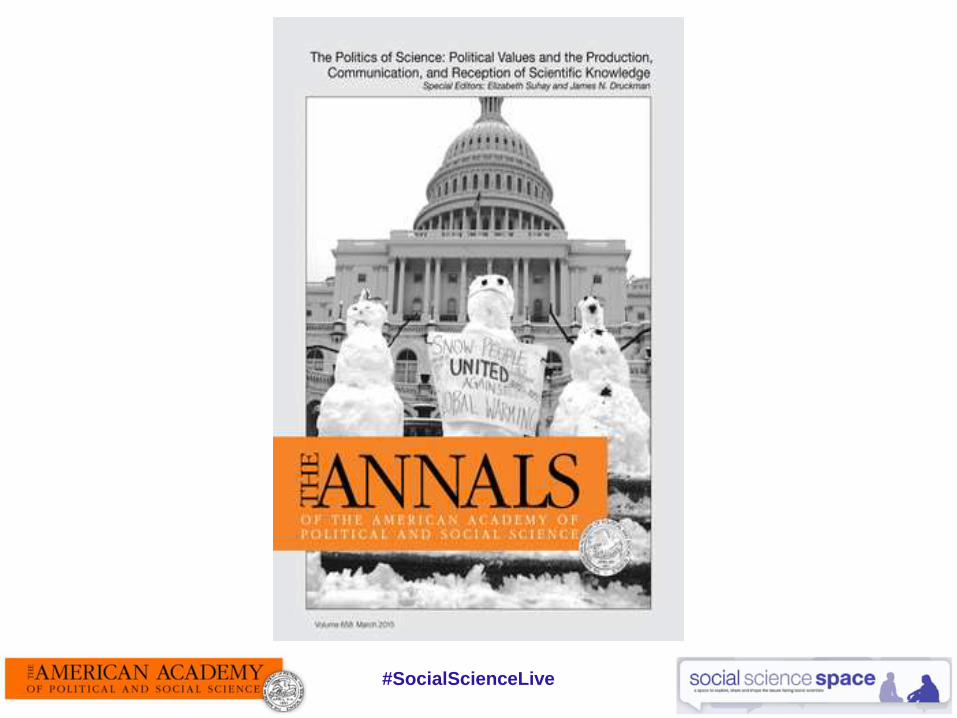
Co-editor of the Politics of Science issue of
ANNALS and Assistant Professor of
Government at the School of Public Affairs,
American University
#SocialScienceLive
Los Angeles | London | New Delhi | Singapore | Washington DC | Boston
While we do our best to answer as many questions as we can, time constraints
may not allow us to answer every question. Thank you for understanding.
Send us your questions!
Send in your questions
via the Question Box on your screen. →
Using Twitter? Use
the hashtag
#SocialScienceLive.
#SocialScienceLive

Los Angeles | London | New Delhi | Singapore | Washington DC | Boston
Dan M. Kahan
Elizabeth K. Dollard Professor of
Law and Professor of Psychology,
Yale Law School
Francis X. Shen
McKnight Land-Grant Professor and Associate Professor of Law,
University of Minnesota
#SocialScienceLive
Los Angeles | London | New Delhi | Singapore | Washington DC | Boston#SocialScienceLive

Los Angeles | London | New Delhi | Singapore | Washington DC | Boston
Science is inevitably political
• Science helps us to understand the world around us,
including …
• What problems we face
• Who is responsible for those problems
• Efficient ways to solve those problems
• For these reasons, science informs public policy and law
#SocialScienceLive
Los Angeles | London | New Delhi | Singapore | Washington DC | Boston
Science is inevitably political
• Because of science’s ability to direct human activity
through policy and law, people fight over it
• Coalitions seek to …
• Discredit science that undermines their values / interests
• Promote science that bolsters their values / interests
• Interpret, frame, spin science (where implications
ambiguous)
• Sometimes conscious, often not
• Let’s make the ubiquity of science bias better known!
#SocialScienceLive
Los Angeles | London | New Delhi | Singapore | Washington DC | Boston
Outline of today’s webinar
• Introduction
• Dan Kahan presentation
• Francis Shen presentation
• Panelist discussion
• Audience Q&A
#SocialScienceLive
Los Angeles | London | New Delhi | Singapore | Washington DC | Boston
Dan M. Kahan
Yale University
& many x 103 others
www.culturalcognition.net
Belief in Climate Change: What We Know
vs. Who We Are
Research Supported by:
National Science Foundation, SES-0922714
Annenberg Center for Public Policy
Skoll Global Threats Fund

Los Angeles | London | New Delhi | Singapore | Washington DC | Boston
What am I talking about?
Los Angeles | London | New Delhi | Singapore | Washington DC | Boston
What am I talking about?
Everything I know about climate science communication:
Los Angeles | London | New Delhi | Singapore | Washington DC | Boston
What am I talking about?
Everything I know about climate science communication:
#SocialScienceLive
Los Angeles | London | New Delhi | Singapore | Washington DC | Boston
What am I talking about?
Everything I know about climate science communication:
What ordinary members of the public “believe” about climate
change
Los Angeles | London | New Delhi | Singapore | Washington DC | Boston
What am I talking about?
Everything I know about climate science communication:
What ordinary members of the public “believe” about climate
change doesn’t reflect what they know;
Los Angeles | London | New Delhi | Singapore | Washington DC | Boston
What am I talking about?
Everything I know about climate science communication:
What ordinary members of the public “believe” about climate
change doesn’t reflect what they know; ; it expresses who they
are.
Los Angeles | London | New Delhi | Singapore | Washington DC | Boston
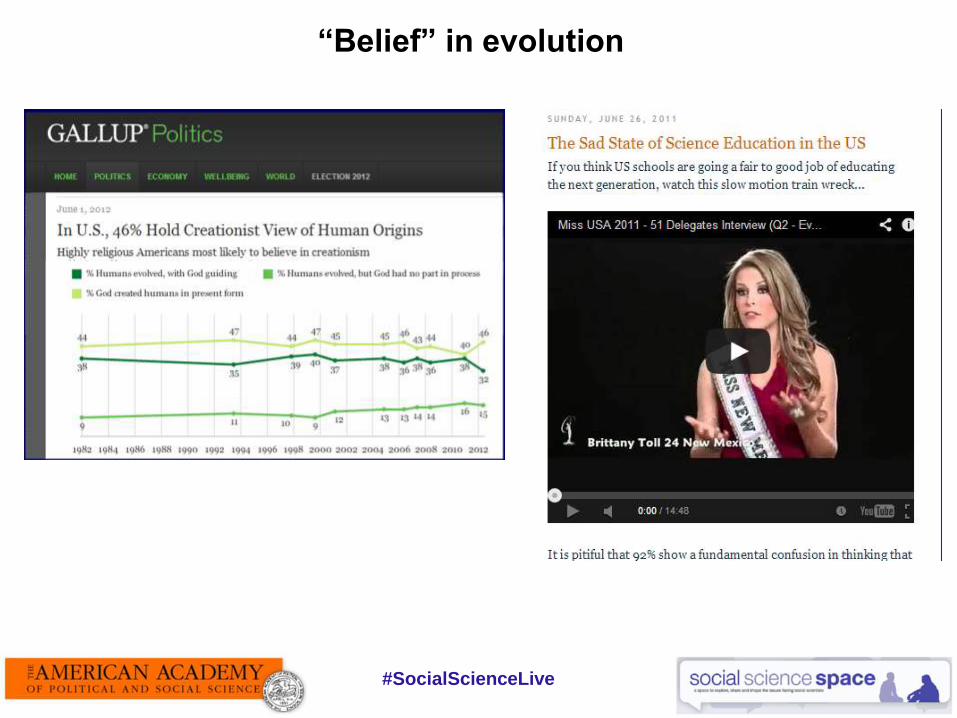
“Belief” in evolution
#SocialScienceLive

Los Angeles | London | New Delhi | Singapore | Washington DC | Boston#SocialScienceLive
“Ordinary Science Intelligence”
Assessment
OSI_1.0 OSI_2.0
Los Angeles | London | New Delhi | Singapore | Washington DC | Boston
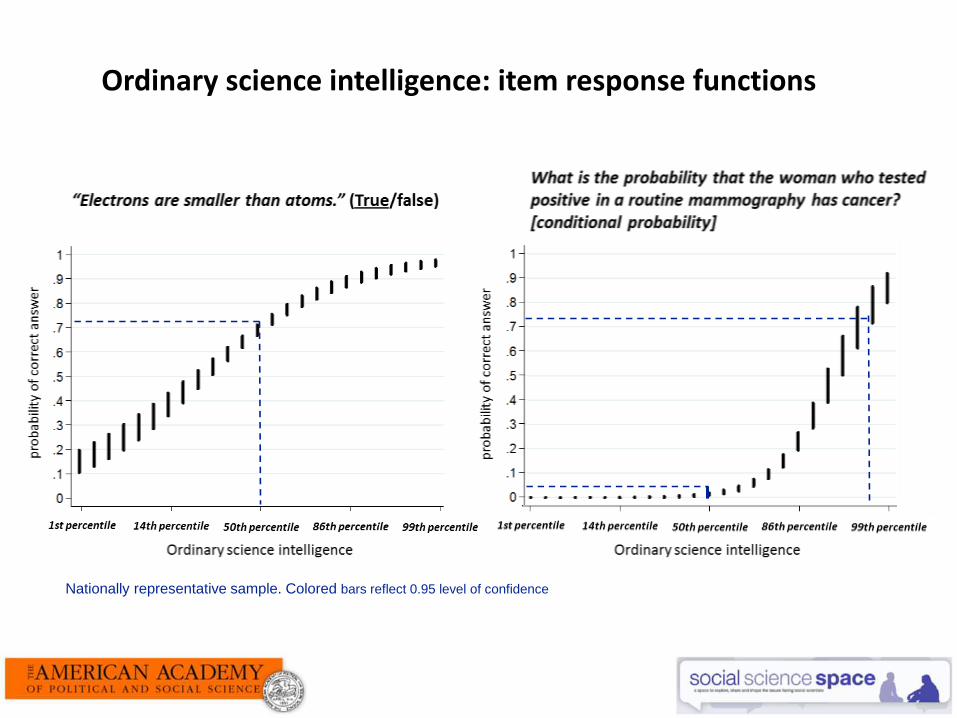
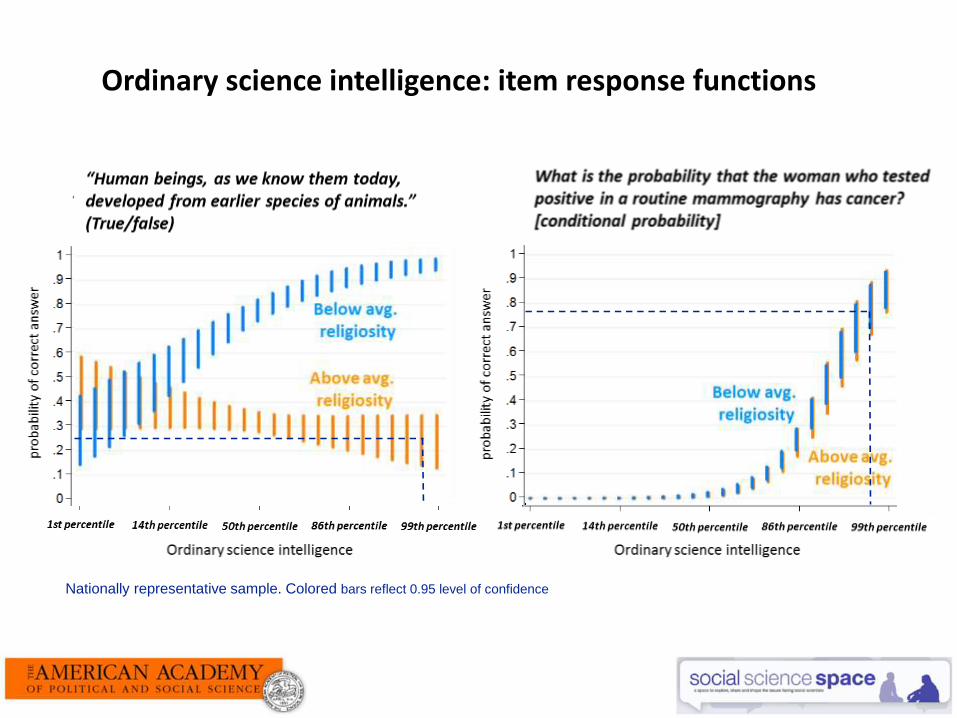
Ordinary science intelligence: item response functions
Nationally representative sample. Colored bars reflect 0.95 level of confidence
Los Angeles | London | New Delhi | Singapore | Washington DC | Boston
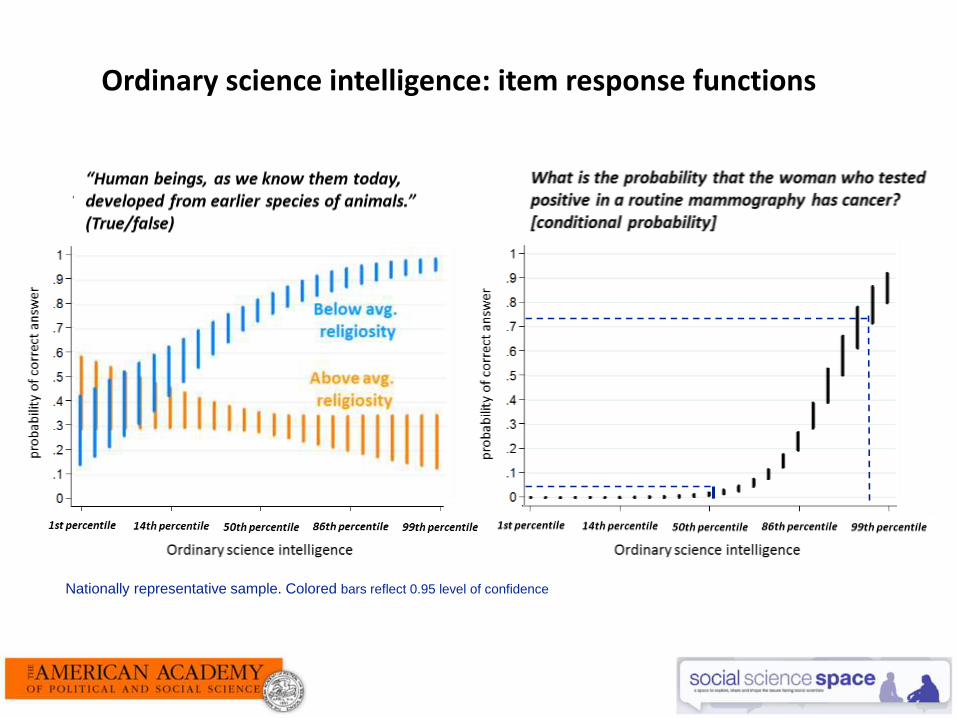
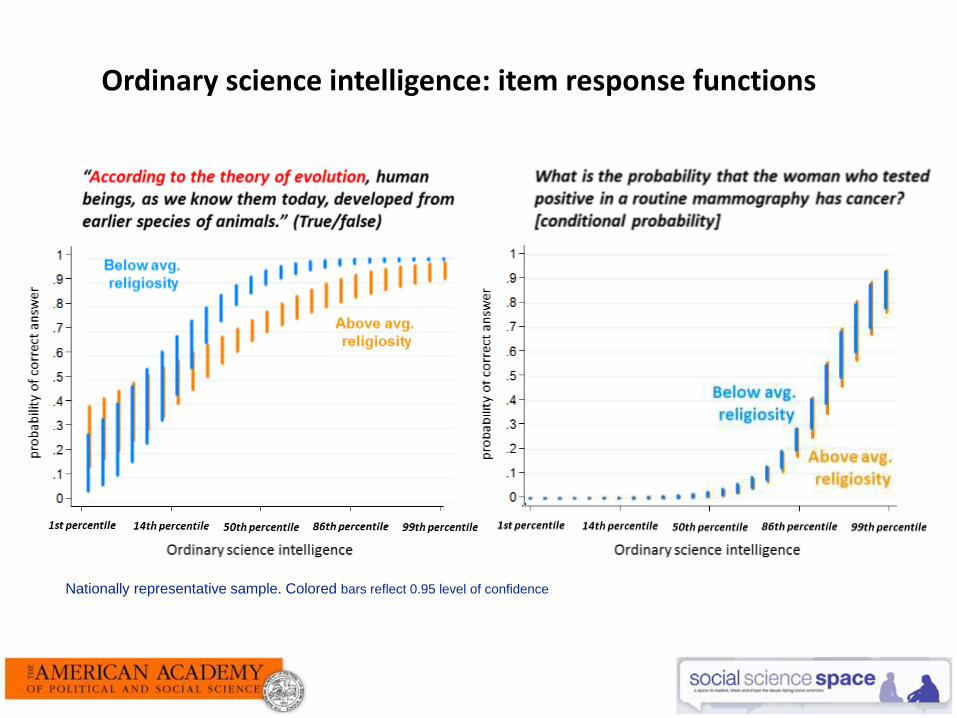
Ordinary science intelligence: item response functions
Nationally representative sample. Colored bars reflect 0.95 level of confidence
Los Angeles | London | New Delhi | Singapore | Washington DC | Boston
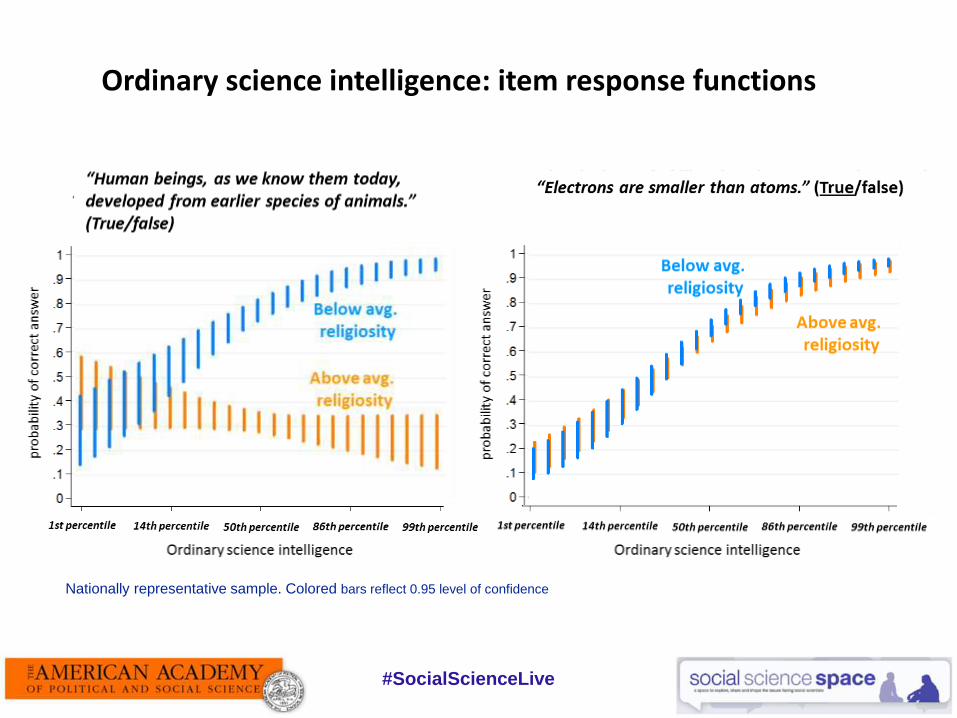
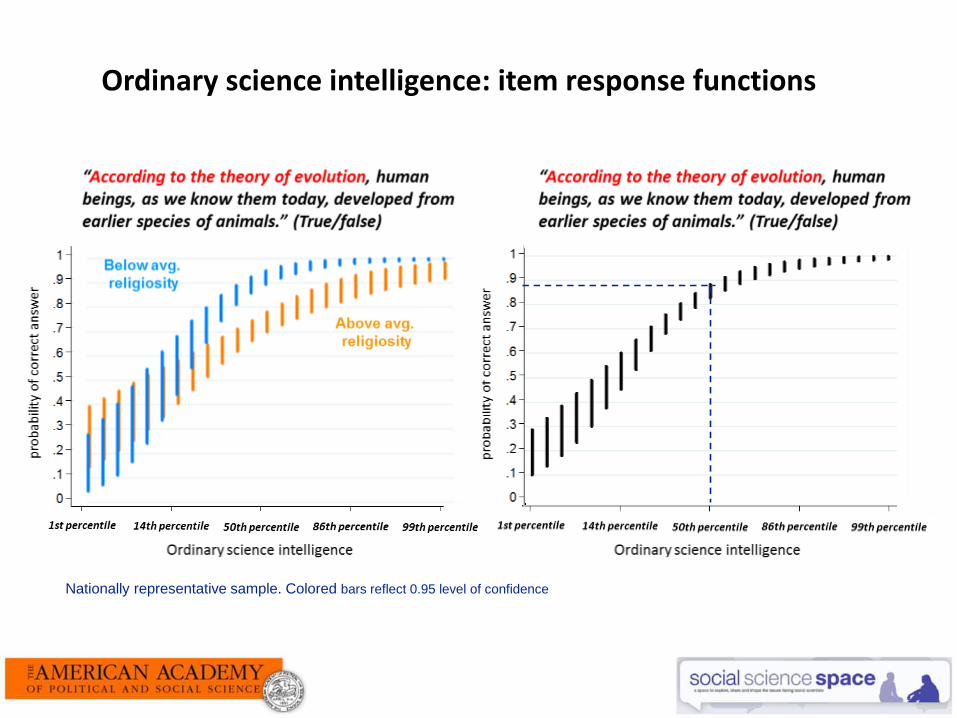
Ordinary science intelligence: item response functions
Nationally representative sample. Colored bars reflect 0.95 level of confidence
#SocialScienceLive

Los Angeles | London | New Delhi | Singapore | Washington DC | Boston
Ordinary science intelligence: item response functions
Nationally representative sample. Colored bars reflect 0.95 level of confidence
Los Angeles | London | New Delhi | Singapore | Washington DC | Boston
Ordinary science intelligence: item response functions
Nationally representative sample. Colored bars reflect 0.95 level of confidence

Los Angeles | London | New Delhi | Singapore | Washington DC | Boston
Ordinary science intelligence: item response functions
Nationally representative sample. Colored bars reflect 0.95 level of confidence
Los Angeles | London | New Delhi | Singapore | Washington DC | Boston
Ordinary science intelligence: item response functions
Nationally representative sample. Colored bars reflect 0.95 level of confidence
Los Angeles | London | New Delhi | Singapore | Washington DC | Boston
Ordinary science intelligence: item response functions
Nationally representative sample. Colored bars reflect 0.95 level of confidence
Los Angeles | London | New Delhi | Singapore | Washington DC | Boston
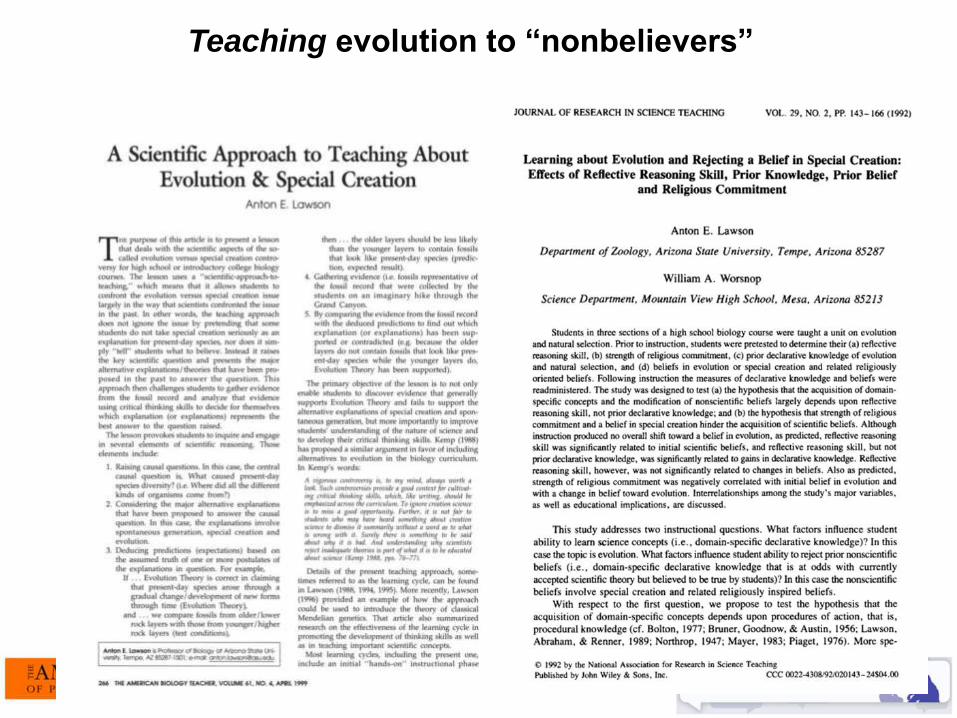
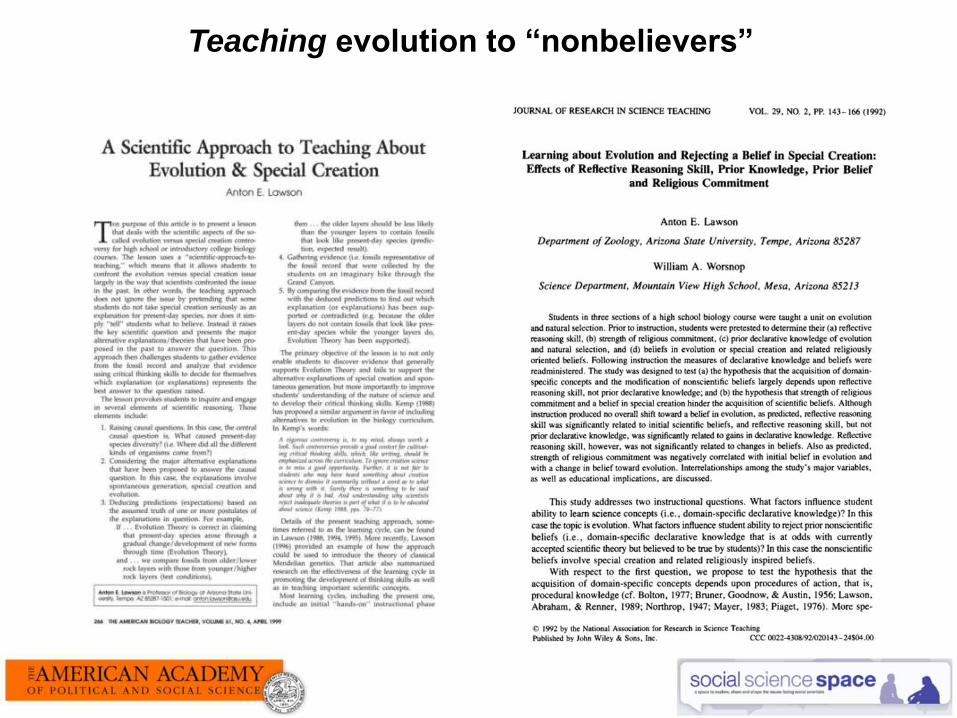
Teaching evolution to “nonbelievers”

Los Angeles | London | New Delhi | Singapore | Washington DC | Boston
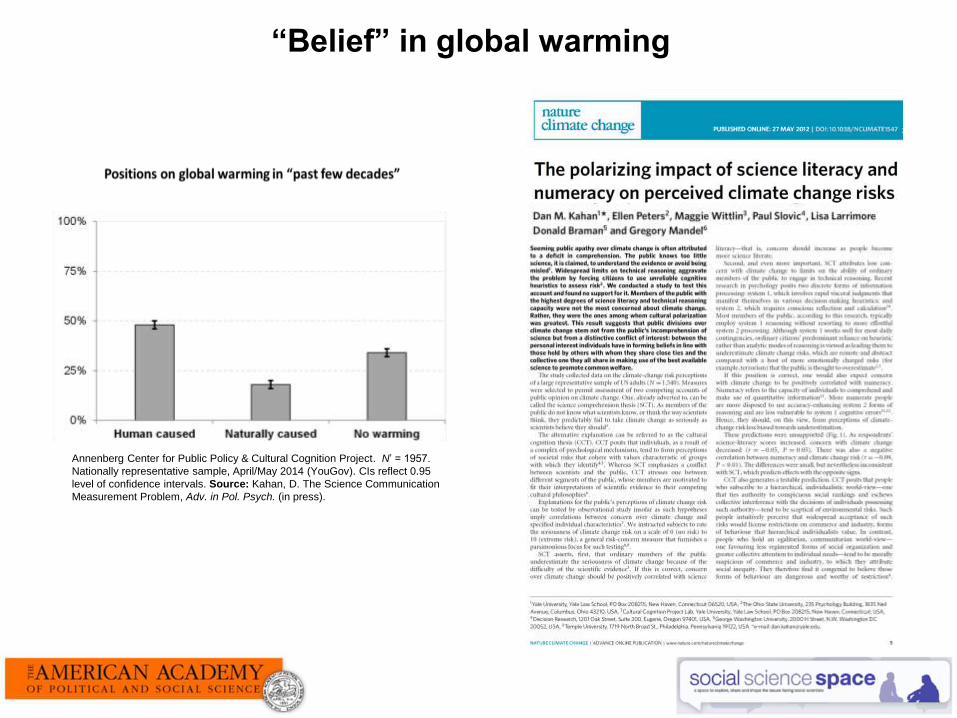
“Belief” in global warming
Annenberg Center for Public Policy & Cultural Cognition Project. N’ = 1957.
Nationally representative sample, April/May 2014 (YouGov). CIs reflect 0.95
level of confidence intervals. Source: Kahan, D. The Science Communication
Measurement Problem, Adv. in Pol. Psych. (in press).
Los Angeles | London | New Delhi | Singapore | Washington DC | Boston
“Belief” in global warming
Annenberg Center for Public Policy & Cultural Cognition Project. N’ = 1957.
Nationally representative sample, April/May 2014 (YouGov). CIs reflect 0.95
level of confidence intervals. Source: Kahan, D. The Science Communication
Measurement Problem, Adv. in Pol. Psych. (in press).

Los Angeles | London | New Delhi | Singapore | Washington DC | Boston
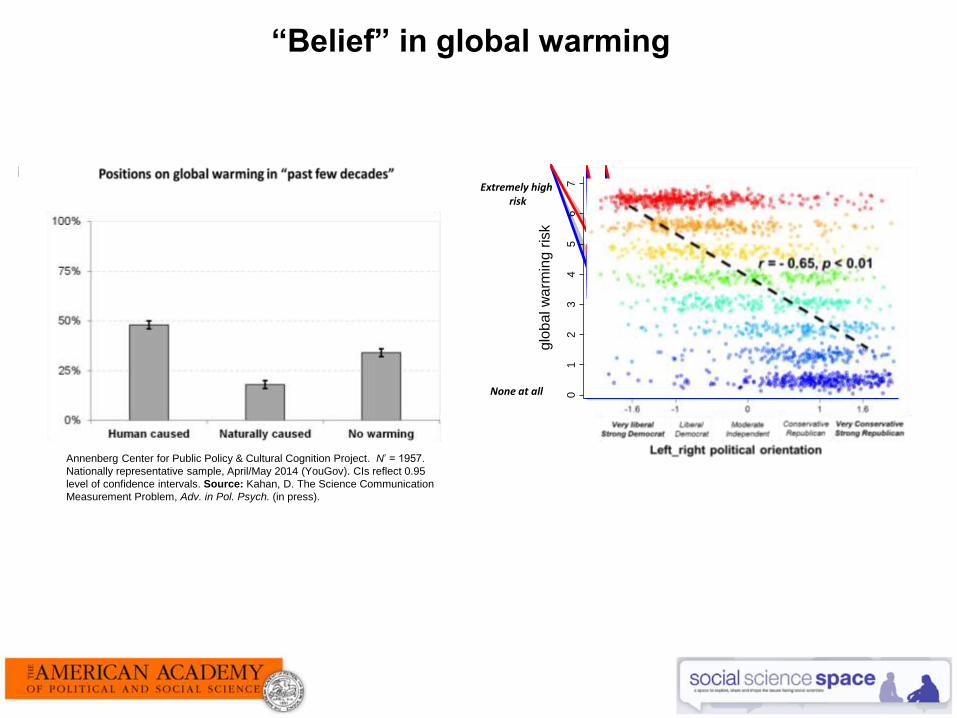
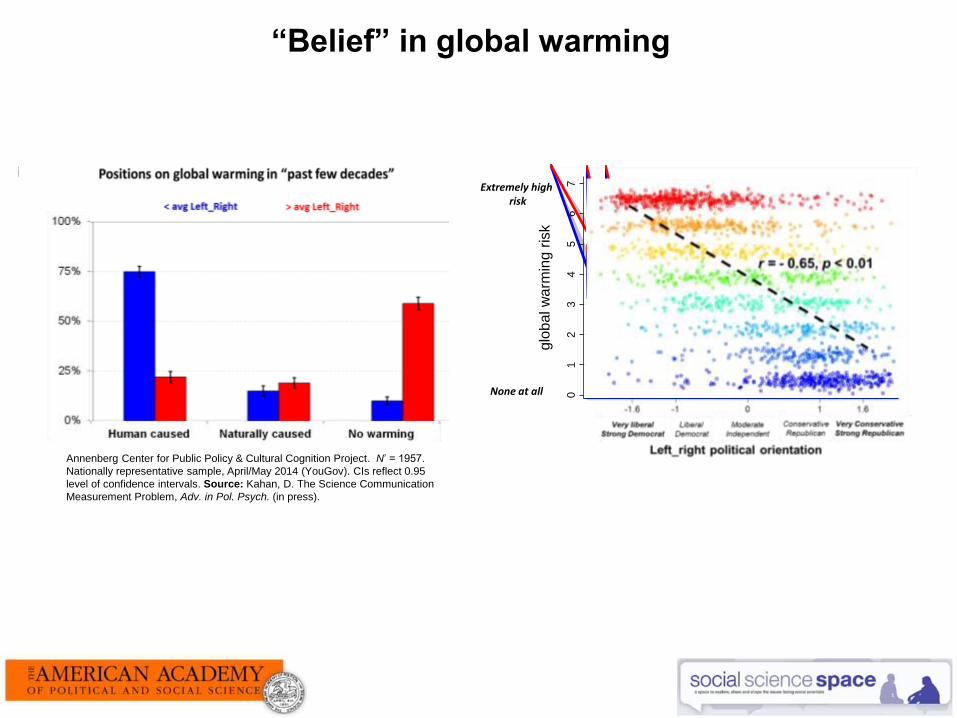
“Belief” in global warming
01
23
45
67
0 3 6 9 12 15 18 21
< avg. Left_right
> avg. Left_right
Science ComprehensionVery low
01
23
45
67
0 3 6 9 12 15 18 21
< avg. Left_right
> avg. Left_right
01
23
45
67
0 3 6 9 12 15 18 21
01
23
45
67
0 3 6 9 12 15 18 21
Very low Very highScience comprehension
None at all
Extremely highrisk
01
23
45
67
0 3 6 9 12 15 18 21
> avg. Left_right
< avg. Left_right
01
23
45
67
0 3 6 9 12 15 18 21
Science ComprehensionVery low Very high
01
23
45
67
0 3 6 9 12 15 18 21
01
23
45
67
0 3 6 9 12 15 18 21
01
23
45
67
0 3 6 9 12 15 18 21
01
23
45
67
0 3 6 9 12 15 18 21
01
23
45
67
0 3 6 9 12 15 18 21Ordinary Science Intelligence
01
23
45
67
0 3 6 9 12 15 18 21
> avg. Left_right
< avg. Left_right
01
23
45
67
0 3 6 9 12 15 18 21
Science ComprehensionVery low Very high
01
23
45
67
0 3 6 9 12 15 18 210
12
34
56
7
0 3 6 9 12 15 18 21
01
23
45
67
0 3 6 9 12 15 18 21
01
23
45
67
0 3 6 9 12 15 18 21
01
23
45
67
0 3 6 9 12 15 18 21
glo
ba
l w
arm
ing r
isk
Annenberg Center for Public Policy & Cultural Cognition Project. N’ = 1957.
Nationally representative sample, April/May 2014 (YouGov). CIs reflect 0.95
level of confidence intervals. Source: Kahan, D. The Science Communication
Measurement Problem, Adv. in Pol. Psych. (in press).
Kahan, D.M., Peters, E., Wittlin, M., Slovic, P., Ouellette, L.L., Braman, D. & Mandel,
G. The polarizing impact of science literacy and numeracy on perceived climate
change risks. Nature Climate Change 2, 732-735 (2012).
Los Angeles | London | New Delhi | Singapore | Washington DC | Boston

Los Angeles | London | New Delhi | Singapore | Washington DC | Boston
r = - 0.65, p < 0.01
Los Angeles | London | New Delhi | Singapore | Washington DC | Boston
“Belief” in global warming
01
23
45
67
0 3 6 9 12 15 18 21
< avg. Left_right
> avg. Left_right
Science ComprehensionVery low
01
23
45
67
0 3 6 9 12 15 18 21
< avg. Left_right
> avg. Left_right
01
23
45
67
0 3 6 9 12 15 18 21
01
23
45
67
0 3 6 9 12 15 18 21
Very low Very highScience comprehension
None at all
Extremely highrisk
glo
ba
l w
arm
ing r
isk
Annenberg Center for Public Policy & Cultural Cognition Project. N’ = 1957.
Nationally representative sample, April/May 2014 (YouGov). CIs reflect 0.95
level of confidence intervals. Source: Kahan, D. The Science Communication
Measurement Problem, Adv. in Pol. Psych. (in press).

Los Angeles | London | New Delhi | Singapore | Washington DC | Boston
“Belief” in global warming
glo
bal w
arm
ing r
isk
0.1
.2.3
.4.5
.6.7
.8.9
1
-3 -2 -1 0 1 2 3
01
23
45
67
0 3 6 9 12 15 18 21
< avg. Left_right
> avg. Left_right
Science ComprehensionVery low
01
23
45
67
0 3 6 9 12 15 18 21
< avg. Left_right
> avg. Left_right
01
23
45
67
0 3 6 9 12 15 18 21
01
23
45
67
0 3 6 9 12 15 18 21
Very low Very highScience comprehension
None at all
Extremely highrisk
01
23
45
67
0 3 6 9 12 15 18 21
> avg. Left_right
< avg. Left_right
01
23
45
67
0 3 6 9 12 15 18 21
Science ComprehensionVery low Very high
01
23
45
67
0 3 6 9 12 15 18 21
01
23
45
67
0 3 6 9 12 15 18 21
01
23
45
67
0 3 6 9 12 15 18 21
01
23
45
67
0 3 6 9 12 15 18 21
01
23
45
67
0 3 6 9 12 15 18 21
glo
ba
l w
arm
ing r
isk
Kahan, D.M., Peters, E., Wittlin, M., Slovic, P., Ouellette, L.L., Braman, D. & Mandel,
G. The polarizing impact of science literacy and numeracy on perceived climate
change risks. Nature Climate Change 2, 732-735 (2012).
Annenberg Center for Public Policy & Cultural Cognition Project. N’ = 1957.
Nationally representative sample, April/May 2014 (YouGov). CIs reflect 0.95
level of confidence intervals. Source: Kahan, D. The Science Communication
Measurement Problem, Adv. in Pol. Psych. (in press).

Los Angeles | London | New Delhi | Singapore | Washington DC | Boston
“Belief” in global warming
0
.1
.2
.3
.4
.5
.6
.7
.8
.9
1
-2.5 -1 0 1 2.599th percentile1st percentile 84th percentile16th percentile 50th percentile
Pro
bab
ility
of
corr
ect
resp
on
se
There is “solid evidence” of recent global warming due “mostly” to “human activity such as burning fossil fuels.”
Ordinary Science Intelligence
LiberalDemocrat
ConservativeRepublican
01
23
45
67
0 3 6 9 12 15 18 21
> avg. Left_right
< avg. Left_right
01
23
45
67
0 3 6 9 12 15 18 21
Science ComprehensionVery low Very high
01
23
45
67
0 3 6 9 12 15 18 21
01
23
45
67
0 3 6 9 12 15 18 210
12
34
56
7
0 3 6 9 12 15 18 21
01
23
45
67
0 3 6 9 12 15 18 21
01
23
45
67
0 3 6 9 12 15 18 21
01
23
45
67
0 3 6 9 12 15 18 21
> avg. Left_right
< avg. Left_right
01
23
45
67
0 3 6 9 12 15 18 21
Science ComprehensionVery low Very high
01
23
45
67
0 3 6 9 12 15 18 21
01
23
45
67
0 3 6 9 12 15 18 21
01
23
45
67
0 3 6 9 12 15 18 21
01
23
45
67
0 3 6 9 12 15 18 210
12
34
56
7
0 3 6 9 12 15 18 21
01
23
45
67
0 3 6 9 12 15 18 21
> avg. Left_right
< avg. Left_right
01
23
45
67
0 3 6 9 12 15 18 21
Science ComprehensionVery low Very high
01
23
45
67
0 3 6 9 12 15 18 21
01
23
45
67
0 3 6 9 12 15 18 21
01
23
45
67
0 3 6 9 12 15 18 21
01
23
45
67
0 3 6 9 12 15 18 21
01
23
45
67
0 3 6 9 12 15 18 21
01
23
45
67
0 3 6 9 12 15 18 21
> avg. Left_right
< avg. Left_right
01
23
45
67
0 3 6 9 12 15 18 21
Science ComprehensionVery low Very high
01
23
45
67
0 3 6 9 12 15 18 21
01
23
45
67
0 3 6 9 12 15 18 21
01
23
45
67
0 3 6 9 12 15 18 210
12
34
56
7
0 3 6 9 12 15 18 21
01
23
45
67
0 3 6 9 12 15 18 21
Annenberg Center for Public Policy & Cultural Cognition Project. N’ = 1957.
Nationally representative sample, April/May 2014 (YouGov). CIs reflect 0.95
level of confidence intervals. Source: Kahan, D. The Science Communication
Measurement Problem, Adv. in Pol. Psych. (in press).

Los Angeles | London | New Delhi | Singapore | Washington DC | Boston
“Belief” in global warming
0
.1
.2
.3
.4
.5
.6
.7
.8
.9
1
-2.5 -1 0 1 2.599th percentile1st percentile 84th percentile16th percentile 50th percentile
Pro
bab
ility
of
corr
ect
resp
on
se
There is “solid evidence” of recent global warming due “mostly” to “human activity such as burning fossil fuels.”
Ordinary Science Intelligence
LiberalDemocrat
ConservativeRepublican
Annenberg Center for Public Policy & Cultural Cognition Project. N’ = 1957.
Nationally representative sample, April/May 2014 (YouGov). CIs reflect 0.95
level of confidence intervals. Source: Kahan, D. The Science Communication
Measurement Problem, Adv. in Pol. Psych. (in press).
Los Angeles | London | New Delhi | Singapore | Washington DC | Boston
Teaching evolution to “nonbelievers”

Los Angeles | London | New Delhi | Singapore | Washington DC | Boston
This measures who we are . . .
Nationally representative sample. Colored bars reflect 0.95 level of confidence

Los Angeles | London | New Delhi | Singapore | Washington DC | Boston
This measures who we are . . . so measure what we know
instead

Los Angeles | London | New Delhi | Singapore | Washington DC | Boston
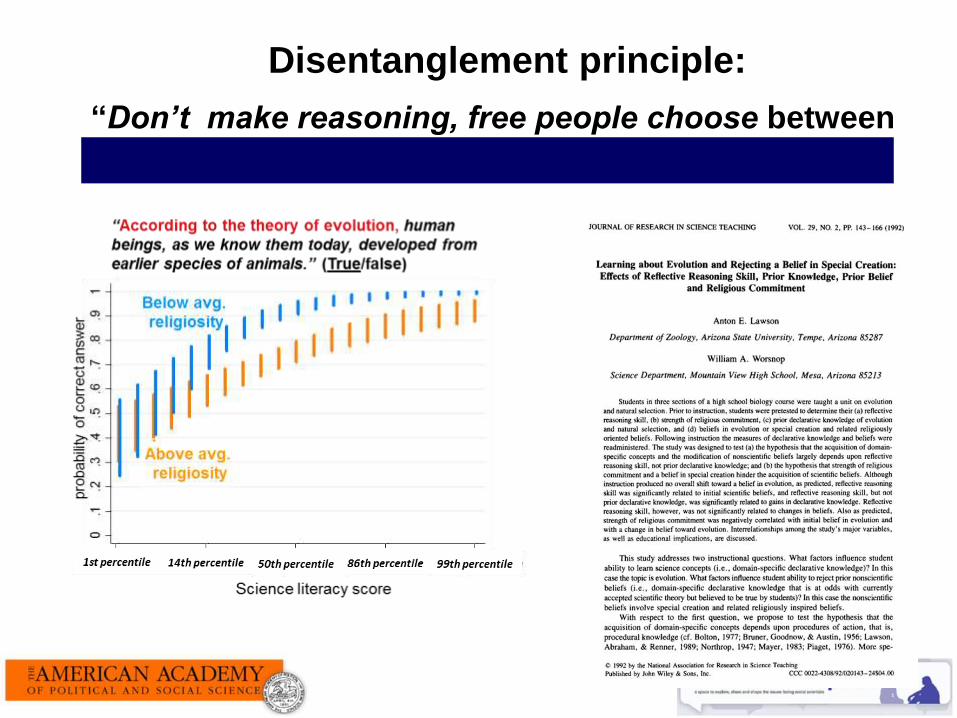
Disentanglement principle:
“Don’t make reasoning, free people choose between
knowing what’s known & being who they are!”
Los Angeles | London | New Delhi | Singapore | Washington DC | Boston
Disentanglement principle:
“Don’t make reasoning, free people choose between
knowing what’s known & being who they are!”

Los Angeles | London | New Delhi | Singapore | Washington DC | Boston
Disentanglement principle:
“Don’t make reasoning, free people choose between
knowing what’s known & being who they are!”

Los Angeles | London | New Delhi | Singapore | Washington DC | Boston
Disentanglement principle:
“Don’t make reasoning, free people choose between
knowing what’s known & being who they are!”

Los Angeles | London | New Delhi | Singapore | Washington DC | Boston
The climate science communication measurement problem:
What we know Who we arevs.

Los Angeles | London | New Delhi | Singapore | Washington DC | Boston
What we know Who we are
How to disentangle
from
The climate science communication measurement problem:
Los Angeles | London | New Delhi | Singapore | Washington DC | Boston
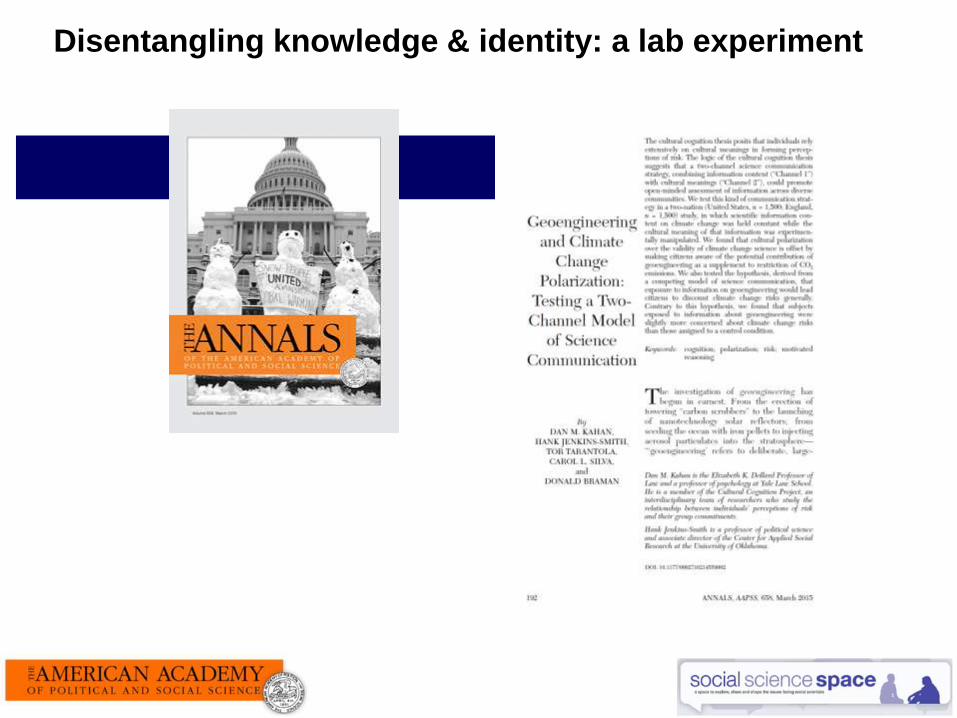
Disentangling knowledge & identity: a lab experiment

Los Angeles | London | New Delhi | Singapore | Washington DC | Boston
Cultural Cognition Project SE Fla. evidence-based science
communication initiative
Disentangling knowledge & identity: field studies

Los Angeles | London | New Delhi | Singapore | Washington DC | Boston
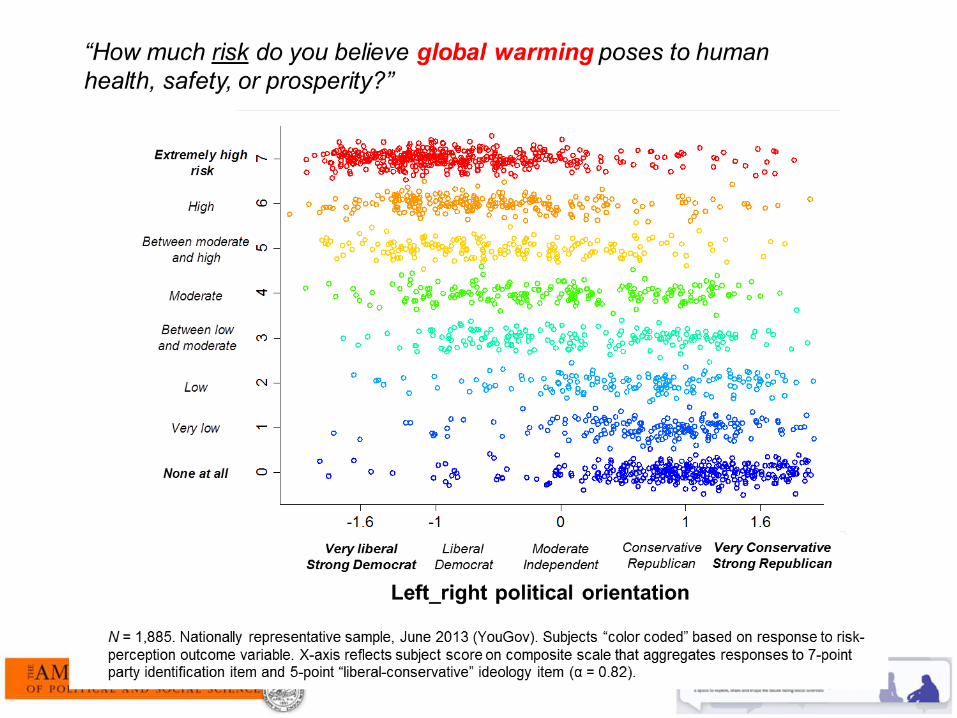
“How much risk do you believe global warming poses to human health,
safety, or prosperity?”
United States as a whole (summer 2013)
Southeast Florida (Fall 2013)
no risk at all
Egalitarian communitarian
Hierarch individualist
A polluted science communication environment . . .
An unpolluted one . . .
no risk at all
01
23
45
67
-1.6 -1 0 1 1.6
None at all
Extremely high
risk
Very low
Low
Between low
and moderate
Moderate
Between moderate
and high
High
Very liberal
Strong Democrat
Very Conservative
Strong Republican
Liberal
Democrat
Conservative
Republican
Moderate
Independent
r = - 0.65, p < 0.01
Left_right
“How much risk do you believe fluoridated water poses to human
health, safety, or prosperity?”
01
23
45
67
-1.6 -1 0 1 1.6
01
23
45
67
-1.6 -1 0 1 1.6
r = 0.07, p < 0.010
12
34
56
7
0 3 6 9 12 15 18 21
“How much risk do you believe medical x-rays poses to human
health, safety, or prosperity?”
None at all
Extremely high
risk
Very low
Low
Between low
and moderate
Moderate
Between moderate
and high
High
Science Comprehension
01
23
45
67
0 3 6 9 12 15 18 21
01
23
45
67
0 3 6 9 12 15 18 21
> avg. Left_right
< avg. Left_right
Extremelyhigh risk
no risk at all
Extremelyhigh riskno risk
at all
01
23
45
67
0 3 6 9 12 15 18 21
None at all
Extremely high
risk
Very low
Low
Between low
and moderate
Moderate
Between moderate
and high
High
Science Comprehension
> avg. Left_right
< avg. Left_right
01
23
45
67
0 3 6 9 12 15 18 210
12
34
56
7
0 3 6 9 12 15 18 21
01
23
45
67
0 1 2 3 4 5 6 7 8 9 10 11
Extremelyhigh risk
“How much risk do you believe global warming poses to human health, safety,
or prosperity?”
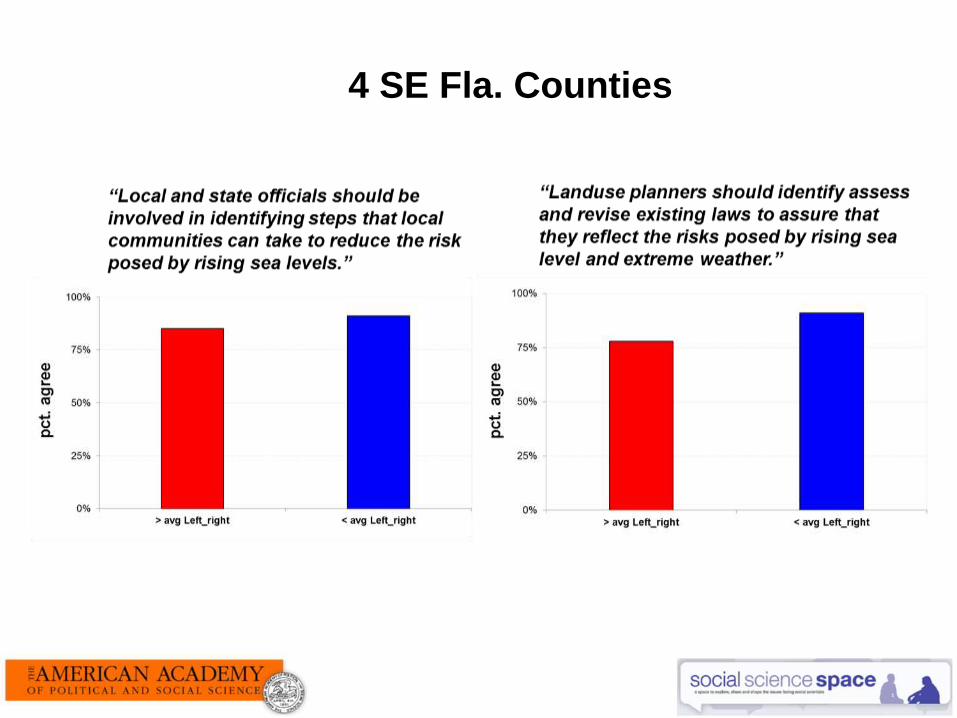
N = 2,306. Monroe, Miami-Dade, Broward & Palm Beach Counties. Sept. 2013. Subjects “color coded” based on response to risk-perception outcome variable. X-axis reflects subject score on NSF “Science indicators” science literacy scale.
4 SE Fla. Counties
01
23
45
67
0 3 6 9 12 15 18 21
01
23
45
67
-1.6 -1 0 1 1.6
None at all
Extremely highrisk
Very liberalStrong Democrat
Very ConservativeStrong Republican
ModerateIndependent
r = 0.07, p < 0.01
< avg. Left_right
> avg. Left_right
Science ComprehensionVery low
01
23
45
67
0 3 6 9 12 15 18 21
< avg. Left_right
> avg. Left_right
01
23
45
67
-1.6 -1 0 1 1.6
r = - 0.65, p < 0.01
Very high
01
23
45
67
0 3 6 9 12 15 18 21
01
23
45
67
0 3 6 9 12 15 18 21
Global warming
01
23
45
67
-1.6 -1 0 1 1.6
Very liberalStrong Democrat
Very ConservativeStrong Republican
LiberalDemocrat
ConservativeRepublican
ModerateIndependent
r = - 0.60, p < 0.01
01
23
45
67
0 3 6 9 12 15 18 21
01
23
45
67
-1.6 -1 0 1 1.6
None at all
Extremely highrisk
Very liberalStrong Democrat
Very ConservativeStrong Republican
ModerateIndependent
r = 0.07, p < 0.01
< avg. Left_right
> avg. Left_right
Science ComprehensionVery low
01
23
45
67
0 3 6 9 12 15 18 21
< avg. Left_right
> avg. Left_right
01
23
45
67
-1.6 -1 0 1 1.6
r = - 0.65, p < 0.01
Very high
01
23
45
67
0 3 6 9 12 15 18 21
01
23
45
67
0 3 6 9 12 15 18 21
Global warming
Los Angeles | London | New Delhi | Singapore | Washington DC | Boston
4 SE Fla. Counties

Los Angeles | London | New Delhi | Singapore | Washington DC | Boston
Disentanglement principle:
“Don’t make reasoning, free people choose between
knowing what’s known & being who they are!”
Los Angeles | London | New Delhi | Singapore | Washington DC | Boston
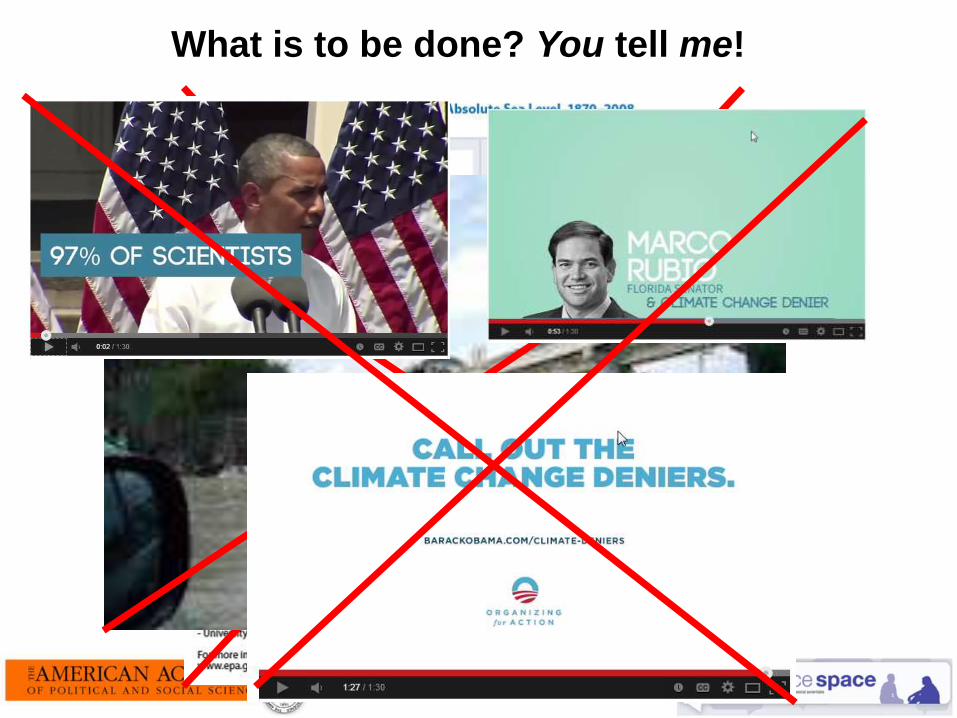
What is to be done? You tell me!
Los Angeles | London | New Delhi | Singapore | Washington DC | Boston
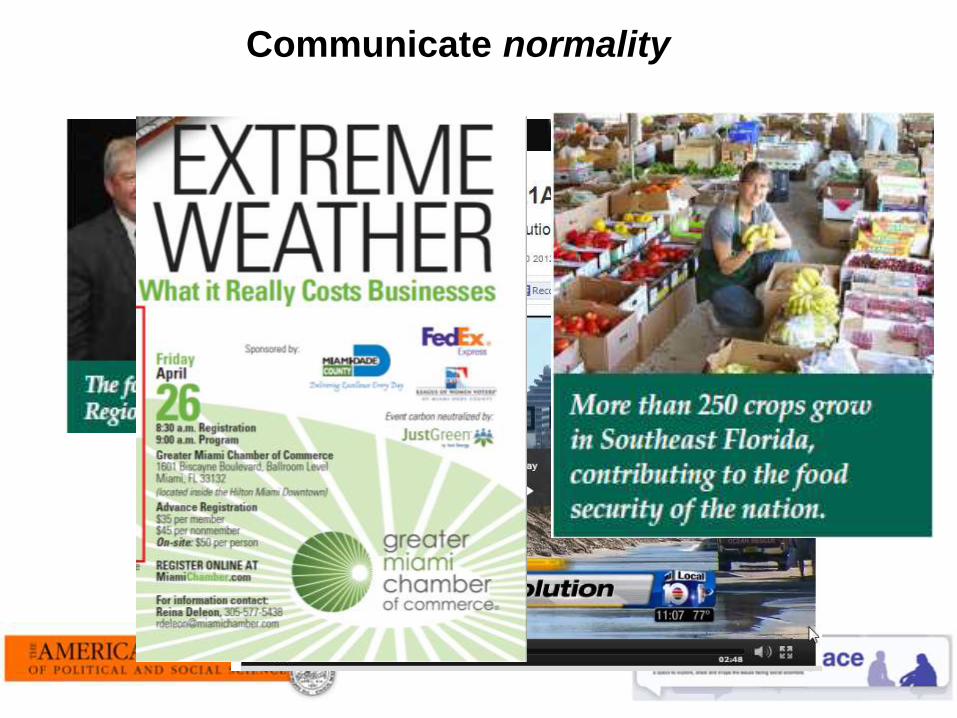
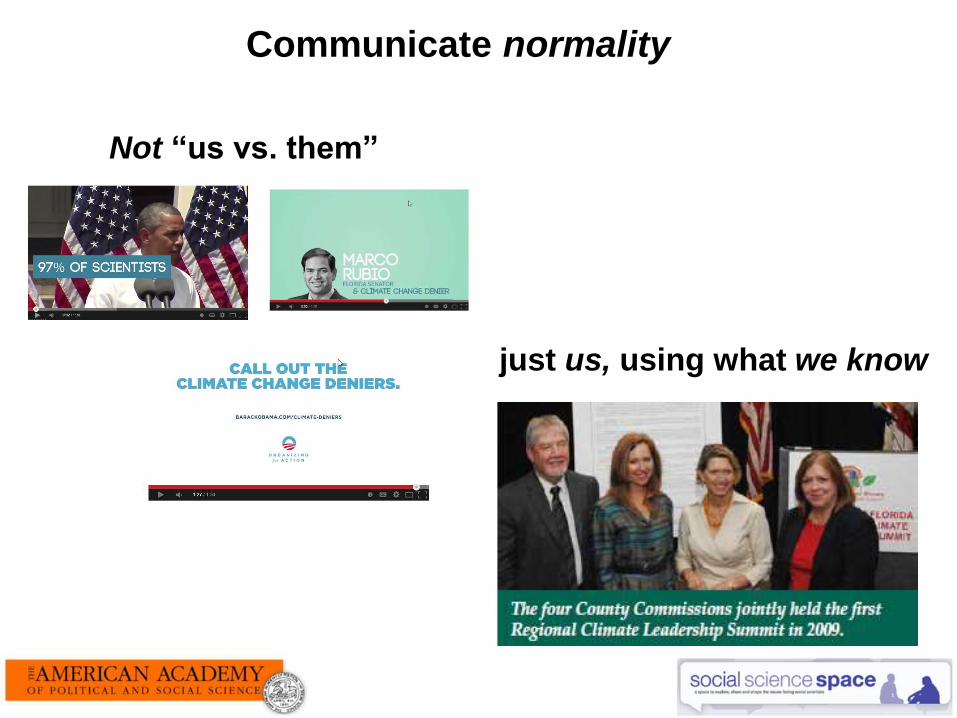
Communicate normality

Los Angeles | London | New Delhi | Singapore | Washington DC | Boston
Not “us vs. them”
just us, using what we know
Communicate normality

Los Angeles | London | New Delhi | Singapore | Washington DC | Boston
Proselytizing the normality of climate science
Los Angeles | London | New Delhi | Singapore | Washington DC | Boston
Not “us vs. them”
just us, using what we know
Communicate normality
Los Angeles | London | New Delhi | Singapore | Washington DC | Boston
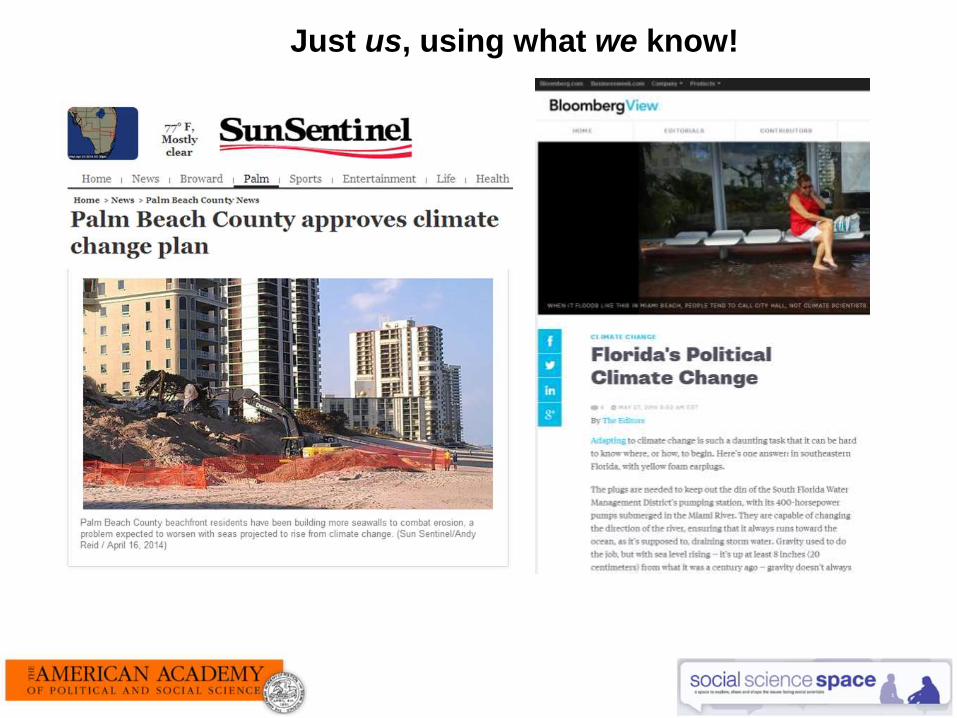
Just us, using what we know!

Los Angeles | London | New Delhi | Singapore | Washington DC | Boston
Just us, using what we know!

Los Angeles | London | New Delhi | Singapore | Washington DC | Boston
Communicate normality

Los Angeles | London | New Delhi | Singapore | Washington DC | Boston
New data: shame & critical reasoning!
www.culturalcognition.net
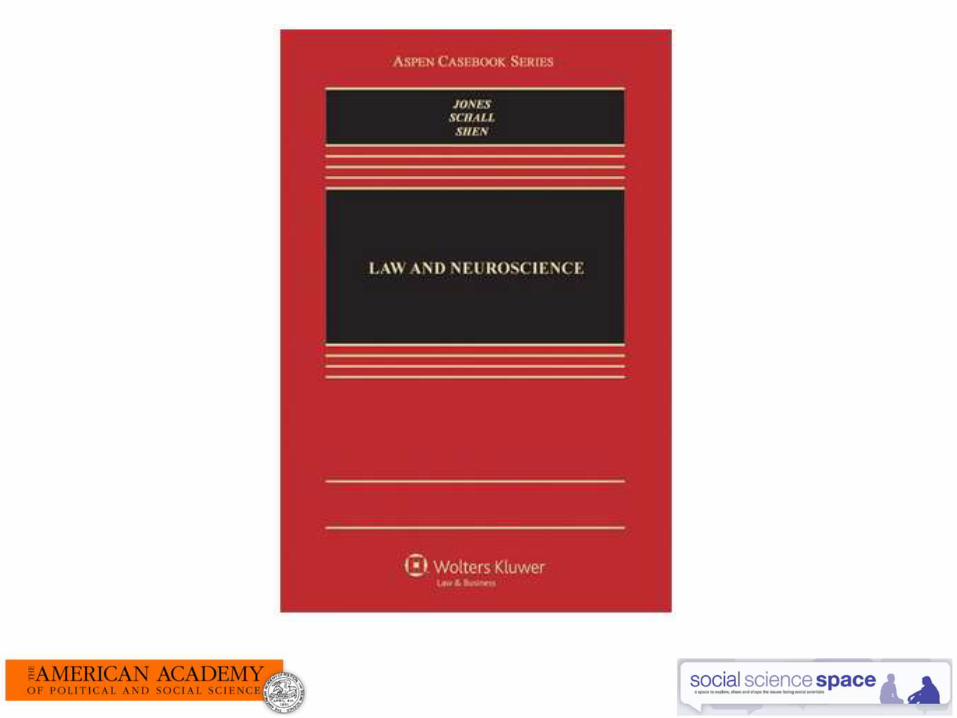
Science Narratives and the Law: The Link from Lab to Legislature
Francis X. Shen
University of Minnesota Law SchoolMacArthur Foundation Research Network on Law & Neuroscience
May 12, 2015


www.lawneuro.org
Politics and the Future of Neuroscience, Law, and Public Policy
Science Narrativesand the Link from Lab to Legislature
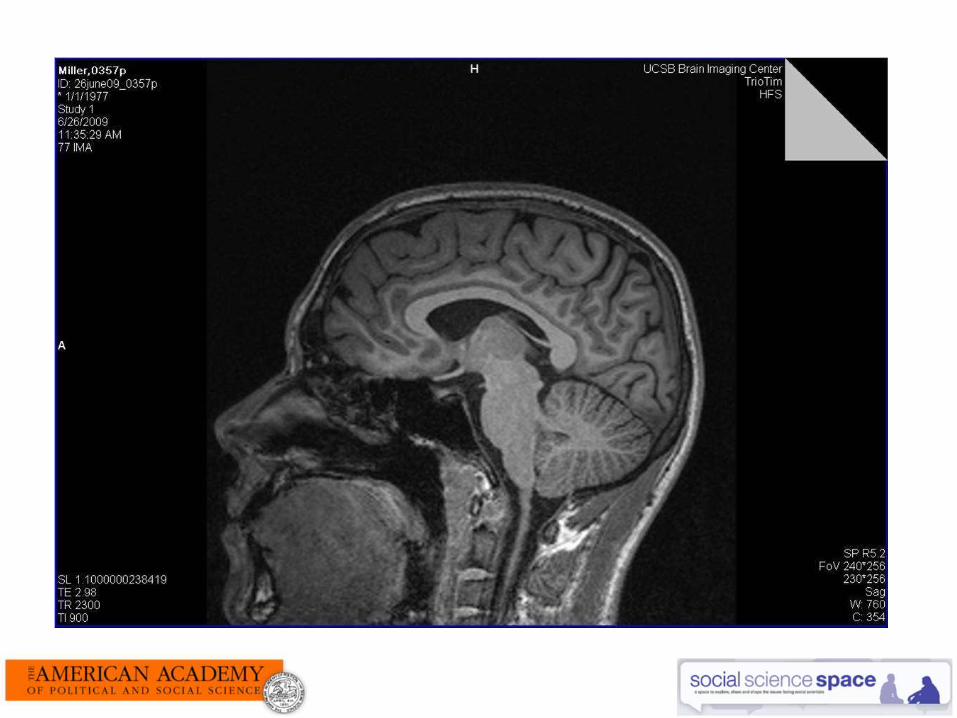
The Brain Takes Center Stage
Politics and the Future of Neuroscience, Law, and Public Policy
Science Narrativesand the Link from Lab to Legislature
The Brain Takes Center Stage


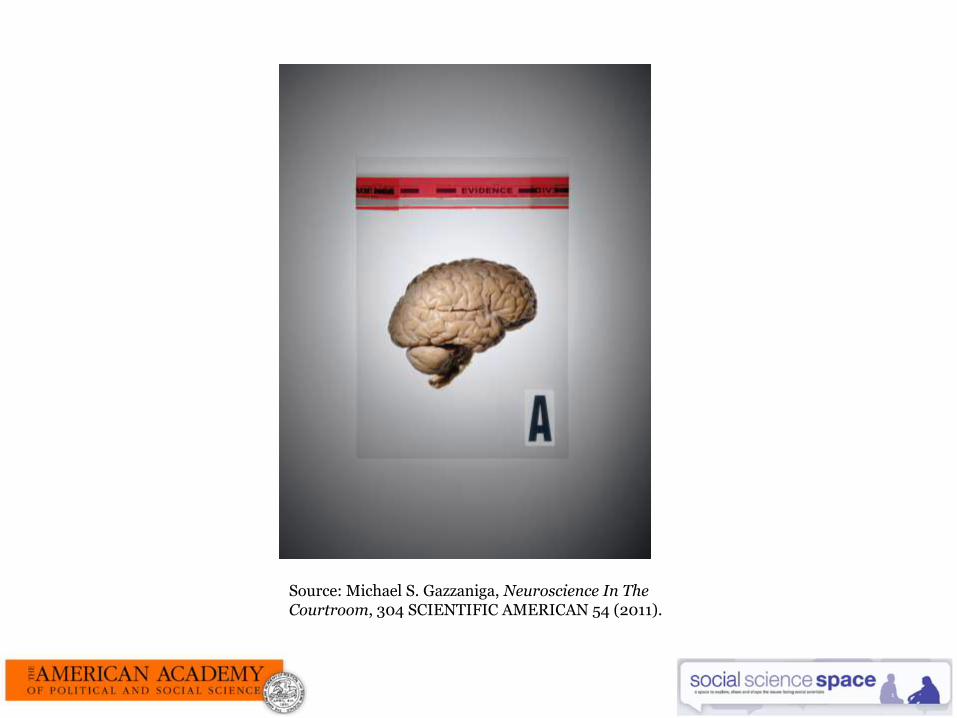
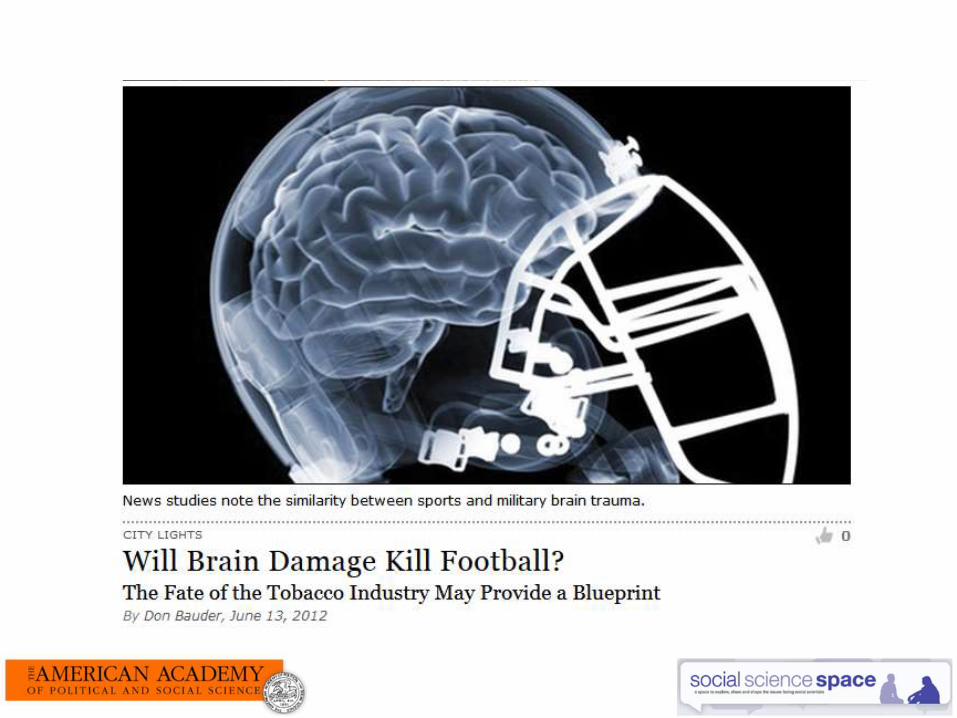
Source: Michael S. Gazzaniga, Neuroscience In The Courtroom, 304 SCIENTIFIC AMERICAN 54 (2011).


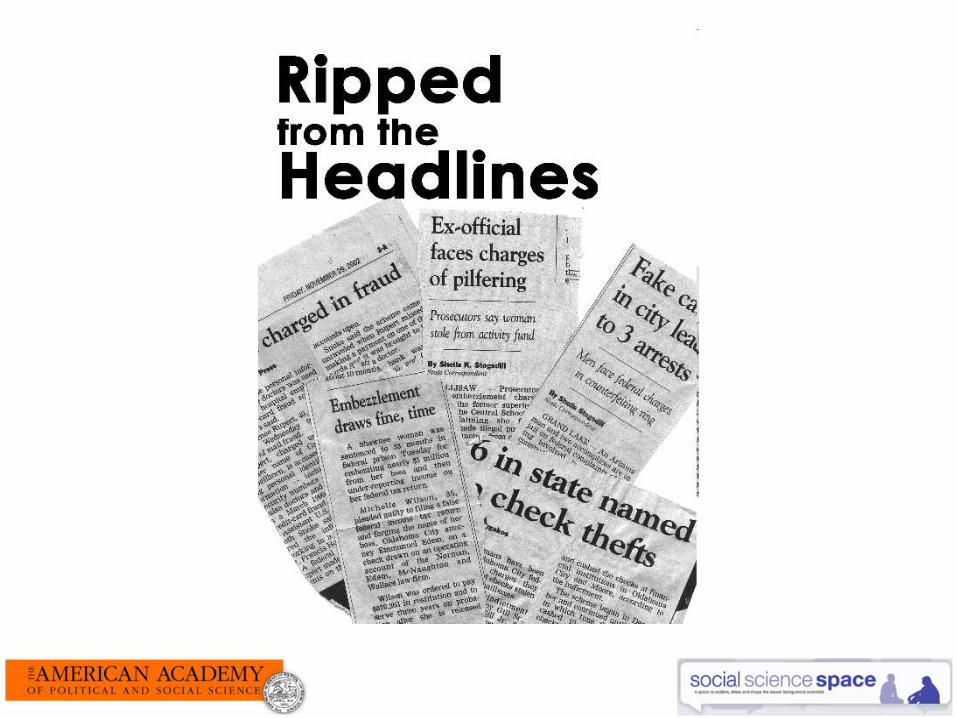
Neuroscientific Evidence In Court
:: Culpability and Mitigation
Politics and the Future of Neuroscience, Law, and Public Policy
Science Narrativesand the Link from Lab to Legislature
The Brain Takes Center Stage
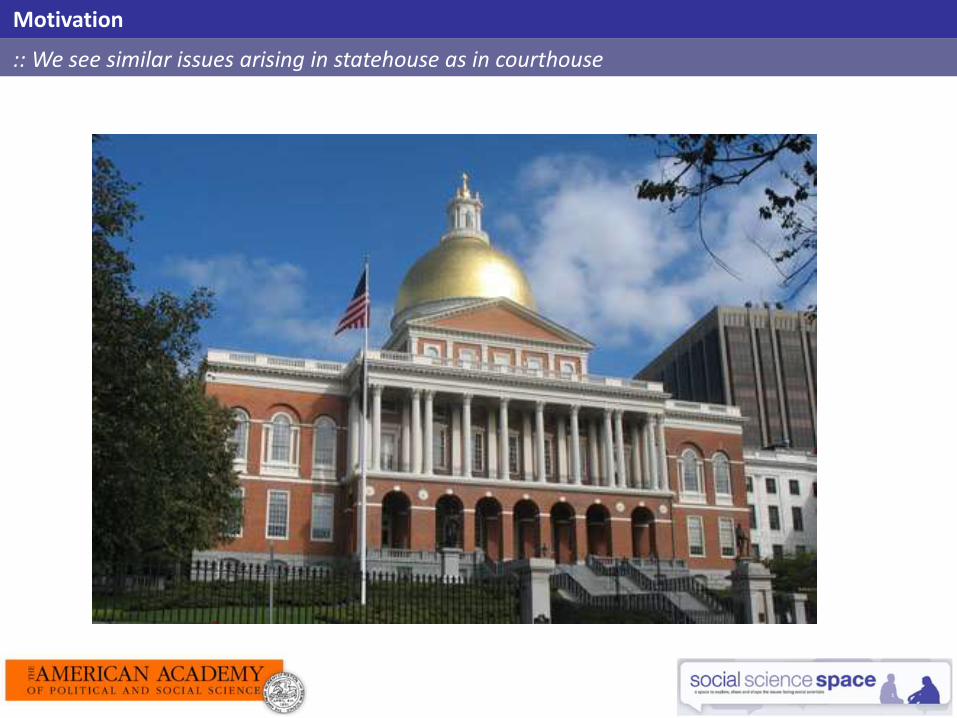
Motivation
:: We see similar issues arising in statehouse as in courthouse

Lab Neuroscience
Law,Legislation
LawyerNeuroscience
LayNeuroscience
LegislatorNeuroscience
LobbyistNeuroscience
Enabling (or hindering) research
Media Schools Outreach
Neuroscience Narratives
:: Constructing a narrative: from lab to legislation

0
20
40
60
80
100
120
140
160
180
1997 1998 1999 2000 2001 2002 2003 2004 2005 2006 2007 2008 2009
Number of Proposed Brain-Related Bills, by Year(All state legislatures, 1997-2009)
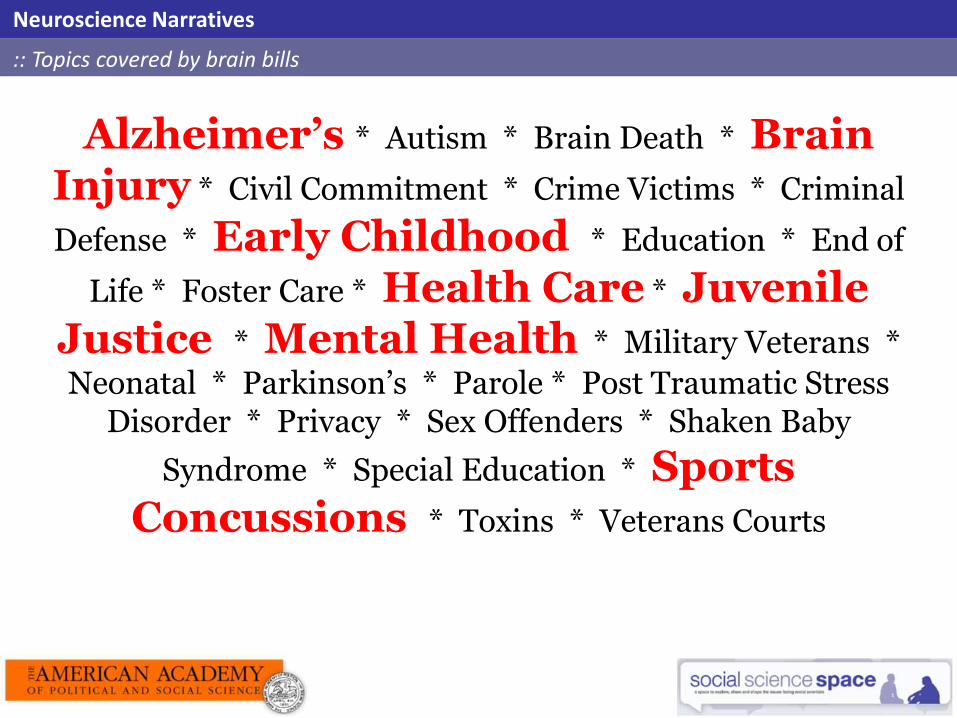
Neuroscience Narratives
:: Topics covered by brain bills
Alzheimer’s * Autism * Brain Death * Brain Injury * Civil Commitment * Crime Victims * Criminal
Defense * Early Childhood * Education * End of
Life * Foster Care * Health Care * Juvenile Justice * Mental Health * Military Veterans *
Neonatal * Parkinson’s * Parole * Post Traumatic Stress Disorder * Privacy * Sex Offenders * Shaken Baby
Syndrome * Special Education * Sports Concussions * Toxins * Veterans Courts

Politics and the Future of Neuroscience, Law, and Public Policy
Science Narrativesand the Link from Lab to Legislature
The Brain Takes Center Stage

The Public
:: Self-reported knowledge in national sample, N = 814
How knowledgeable would you say you are about science?How knowledgeable would you say you are about neuroscience?
2%
6%
11%
34%
24%
14%
8%
19%
25%
23%
17%
10%
5%
0%
0%
5%
10%
15%
20%
25%
30%
35%
40%
Not at all knowledgeable Somewhat knowledgeable Very knowledgeable
Science Knowledgge
Neuro Knowledge
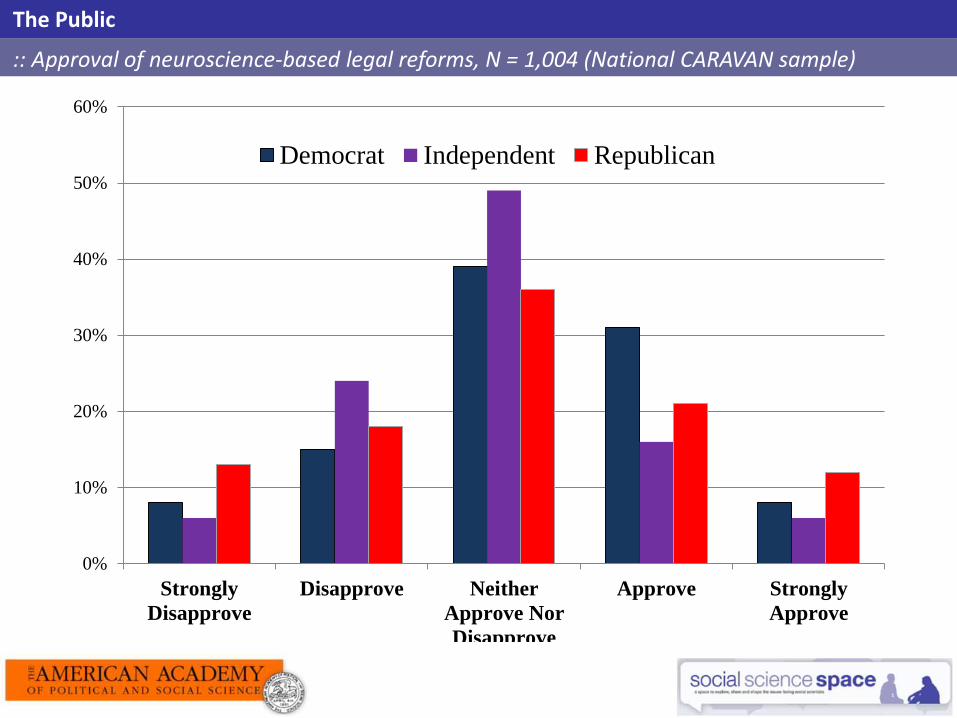
0%
10%
20%
30%
40%
50%
60%
Strongly
Disapprove
Disapprove Neither
Approve Nor
Disapprove
Approve Strongly
Approve
Democrat Independent Republican
The Public
:: Approval of neuroscience-based legal reforms, N = 1,004 (National CARAVAN sample)

1
1.5
2
2.5
3
3.5
4
4.5
5
Democrat Independent Republican
Appro
val
of
Neu
rola
w
(1 =
Str
ongly
Dis
appro
ve,
5 =
Str
ongly
Appro
ve)
Control Prosecution Defense
*** p = .001
*** p < .001
The Public
:: Effect of issue framing, by political party
Los Angeles | London | New Delhi | Singapore | Washington DC | Boston
Panelist Discussion
#SocialScienceLive
Los Angeles | London | New Delhi | Singapore | Washington DC | Boston
While we do our best to answer as many questions as we can, time constraints
may not allow us to answer every question. Thank you for understanding.
Send us your questions!
Send in your questions
via the Question Box on your screen. →
Using Twitter? Use
the hashtag
#SocialScienceLive.
#SocialScienceLive
Los Angeles | London | New Delhi | Singapore | Washington DC | Boston
Webinar recording, slides, and follow-up Q&A will be emailed to you and available on socialsciencespace.com.
Thank you!
Be sure to check our website for updates on our webinar series!
#SocialScienceLive
Related Documents