What Makes Foreign Policy Teams Tick: Explaining Variation in Group Performance At Geopolitical Forecasting 1 Michael Horowitz, Brandon Stewart, Dustin Tingley, Michael Bishop, Laura Resnick, Margaret Roberts, Welton Chang, Barbara Mellers, and Phil Tetlock, 2 This draft: March 22, 2016 1 This research was supported by IARPA. 2 Send comments to: [email protected].

Welcome message from author
This document is posted to help you gain knowledge. Please leave a comment to let me know what you think about it! Share it to your friends and learn new things together.
Transcript

What Makes Foreign Policy Teams Tick:
Explaining Variation in Group Performance
At Geopolitical Forecasting1
Michael Horowitz, Brandon Stewart, Dustin Tingley,Michael Bishop, Laura Resnick, Margaret Roberts, Welton Chang,
Barbara Mellers, and Phil Tetlock,2
This draft: March 22, 2016
1This research was supported by IARPA.2Send comments to: [email protected].

Abstract
How groups make decisions is one of the most fundamental issues in the study of politics.
When do groups—be they countries, administrations, or other organizations—more or
less accurately understand the world around them and assess political choices? There is a
widely held belief that group decision-making processes often fail due to groupthink and
the biases in decision-making it induces. Yet there is wide variation in how groups perform
at processing political information and making accurate forecasts. To advance knowledge
about the intersection of politics and group decision-making, this paper draws on evidence
from the Good Judgment Project, a multi-year geopolitical and economic forecasting tour-
nament with thousands of participants sponsored by the Intelligence Advanced Research
Projects Activity (IARPA). We assess which factors explain groups’ success or failure at
forecasting geopolitical events. We find that, contrary to the predictions of groupthink,
teams outperformed individuals in making accurate geopolitical predictions, with regres-
sion discontinuity analysis demonstrating specific effects from teamwork itself. Moreover,
using structural topic models to assess conversations among different teams of forecast-
ers, we find evidence that more cooperative teams outperformed less cooperative teams.
Teams that more explicitly engaged in probabilistic reasoning also excelled. These results
demonstrate that groupthink is not inevitable when it comes to political decision-making;
rather, teams can and do accurately assess the geopolitical world. Moreover, by delib-
erately cultivating reasoning designed to hedge against cognitive biases and ensuring all
perspectives are heard, groups can be more accurate at understanding politics.

1 Introduction
The role of groups in decision-making is a critical issue for politics. Nearly all decisions
made by governments are the work of groups, not single individuals. Even in strong
presidential systems such as the United States, the president rarely makes decisions alone;
groups decide which issues make it onto the president’s agenda, groups decide how to
present the information to the president, and the core national security decision process
is designed to be carried out by groups. Thus understanding how groups make decisions
is a key goal for the study of politics.1
Strategies that make groups more effective at gathering information, processing it
and accurately comprehending the world around them are especially important (Tetlock,
1999). The failure of groups within the U.S. government to accurately assess the likelihood
of nuclear tests by India and Pakistan in 1998, the threat posed by international terrorist
organizations prior to 9/11, or the state of Iraq’s WMD programs in both 1991 and
2003 stand out as some of the most significant intelligence and policy failures of the last
several decades. These failures occurred despite the work of teams composed of smart,
dedicated individuals who had access to a large amount of information about the world
and resources at their disposal. Why then did they fail so spectacularly to understand
and decisively act on important geopolitical happenings? One potential explanation for
these analytic failures is groupthink, or the rush to conformity of opinion and premature
cutoff of debate due to social pressure. Decision making bodies that are unable to engage
in effective deliberative thinking are more likely to make bad decisions in a variety of
scenarios, especially during foreign policy crises (Janis, 1982).
Although group decision-making is not the most extensively-covered aspect of foreign
policy within political science, it has been explored in the political psychology and group
1Groups are typically defined in the literature as units comprising more than two individuals. Likewise
teams, a kind of group, are similarly numerically composed, although one key distinction is that team
members are generally more familiar with one another than group members, although this is not always
the case. While we use the terms groups and teams interchangeably in this paper, we do recognize that
the two are conceptualized differently in the literature.
1

dynamics literature. Given the utility of accurately understanding the world, strategies
that improve the effectiveness of group decision-making and deliberations are critical.
One of the challenges to optimal group processes is groupthink, or the tendency of some
groups to converge on unanimity without engaging in critical deliberation (’t Hart, 1990).
Groupthink can lead to suboptimal choices when it comes to processing information,
predicting the future, and making decisions. Is groupthink inevitable or are there scope
conditions, especially when it comes to national security decision-making? In other words,
are national security decision-makers doomed by groupthink, or can groupthink be over-
come by best practices for group design and processes that make them more likely to
generate effective decisions and forecasts? This is an especially important question given
the high-stakes involved.
To develop a more theoretically and empirically grounded understanding of group
and team decision-making, within a political context, this paper presents evidence from
the Good Judgment Project (GJP), a geopolitical and economic forecasting tournament
with thousands of participants sponsored by the Intelligence Advanced Research Projects
Activity (IARPA). Participants entered predictions about potential geopolitical and eco-
nomic events, such as whether North Korea would test a nuclear device by a certain date
or whether Greece would leave the Eurozone by a certain date. As part of the tourna-
ment, participants were randomly selected into team and individual conditions, allowing
for a controlled test of the relative effectiveness of teams versus individuals at forecast-
ing geopolitical outcomes. In addition, both teams and individuals were encouraged to
explain the reasoning behind their predictions. By evaluating both the reasoning behind
the forecasts and the forecasts themselves, we can evaluate the accuracy of teams versus
individuals as well as the conditions under which teams are more likely to succeed or fail.
Essentially, the design allows us to identify the situations in which group behaviors such
as groupthink, as well as conditions such as polythink (Mintz and Wayne, 2016a,b), are
more likely versus those situations and conditions that set groups up to succeed.
This approach makes a significant contribution in part because while the groupthink
phenomenon has been subjected to steady investigatory attention, much of the research
2

on group decision-making has been non-experimental. The foundational groupthink re-
search used small-n process-tracing approaches to explore the conditions under which
group dysfunction could be expected (Janis, 1982; Janis and Mann, 1977; Peterson et al.,
1998; Esser, 1998; Tetlock, 1979; Tetlock et al., 1992; Schafer and Crichlow, 2013; ’t Hart,
1990). This approach makes it difficult to control for the impact of specific antecedents.
Experiments on groupthink have typically involved single-iteration laboratory tasks, with-
out the opportunity to learn from previous mistakes. Furthermore, the experimental tasks
were typically undertaken by groups of strangers, a situation that bears little resemblance
to the real-world groups that make decisions (a good summary of laboratory experiment
results can be found in Esser (1998)). Our study uses a purposeful design to advance
knowledge: a large-scale randomized-controlled experiment employing a task that resem-
bles what national-security policymakers might face. This provides the most externally
valid test of previous groupthink results to date.2
The paper proceeds as follows. Section 2 situates our work in the literature on
collective decision-making and “groupthink.” Section 3 describes the Good Judgment
Project in greater detail and puts forth our hypotheses. Sections 4 and 5 present the
empirical results, showing that not only do teams outperform individuals, but teams
featuring broader and deeper engagement are less prone to groupthink-like biases when
it comes to geopolitical forecasting. In these sections a novel application of machine
learning methods to the textual data generated by participants allows us to explain how
and why some groups succeed while others do not. Section 6 concludes by summarizing
our contributions and highlighting areas for future work.
2 Decision-making in International Relations: The
Specter of Groupthink
Both decision-making and forecasting are critical topics in international relations. Coun-
tries and leaders that make better decisions and forecasts are more likely to succeed in
advancing national interests, whether the issue is setting economic policy, designing a
2For more on other experimental approaches to international relations, see Mintz et al. (2011).
3

military strategy, or deciding whether to sign a free trade deal. Throughout governments,
even at very high levels, group processes dominate as the mechanism by which govern-
ments make such decisions. For example, in the United States government, important
foreign policy issues go through multiple levels of group discussions within the Defense
Department, State Department, National Security Council, and elsewhere, as part of what
is called the interagency process, before they reach the president. Allison’s foundational
work on the Cuban Missile Crisis focuses, in part, on this group process and how it shaped
US behavior (Allison, 1969). Even in countries with very small selectorates (De Mesquita
and Smith, 2005), leaders generally make decisions about important topics such as war
and peace within groups.
So, how do groups make decisions? For almost two generations, political psychologists
have studied how group decision-making can go awry and lead to groupthink, resulting
in bad political decision-making. Groupthink is defined as “[A]mode of thinking that
people engage in when they are deeply involved in a cohesive in-group, when the mem-
bers’ strivings for unanimity override their motivation to realistically appraise alternative
courses of action” (Janis, 1982, pg. 9). Janis (1982) argues that group pathology in
foreign policy decision-making can lead individual members of the group to conform to
group norms. Since the price of non-conformity with group norms is often exclusion from
the group, if group norms lead groups towards suboptimal outcomes, groups may actually
lack the diversity of perspectives that should be their strength. Janis (1982) warns that
high group cohesiveness is the single largest hazard that can cause a group to fall victim
to groupthink. More recent research by Sunstein and Hastie (2014) suggests that modern
American bureaucracy is particularly prone to groupthink because organizational incen-
tives to support the group and follow the leader suppress dissent, even when optimism
about a particular path is not warranted.
According to research on groupthink, several characteristics of group decision settings
may make it difficult for groups to avoid mistakes in foreign-policy decision-making. First,
groups seeking consensus on a decision limit their discussions to only some of the relevant
information and thus few courses of action (Janis, 1982; McCauley, 1989; Schulz-Hardt
4
et al., 2000). Second, groups do not adequately examine their favored policy decision in
light of non-obvious risks that might not have been considered during initial discussions
(Janis, 1982; Janis and Mann, 1977). Third, policy decisions that were initially rejected
by the group are never adequately considered (Janis, 1982). Fourth, groups often fail to
consult experts who might be able to make an unbiased evaluation of the policy options at
hand (Janis 1982). Fifth, groups exhibit selection bias when evaluating new information,
ignoring facts that do not support their favored policy proposal (Janis, 1982). Sixth,
groups will often fail to discuss contingency plans for what to do if factors arise that
might hinder the success of their favored plan (Sunstein and Hastie, 2014; Janis, 1982,
see also Janis and Mann 1977, pg. 132).
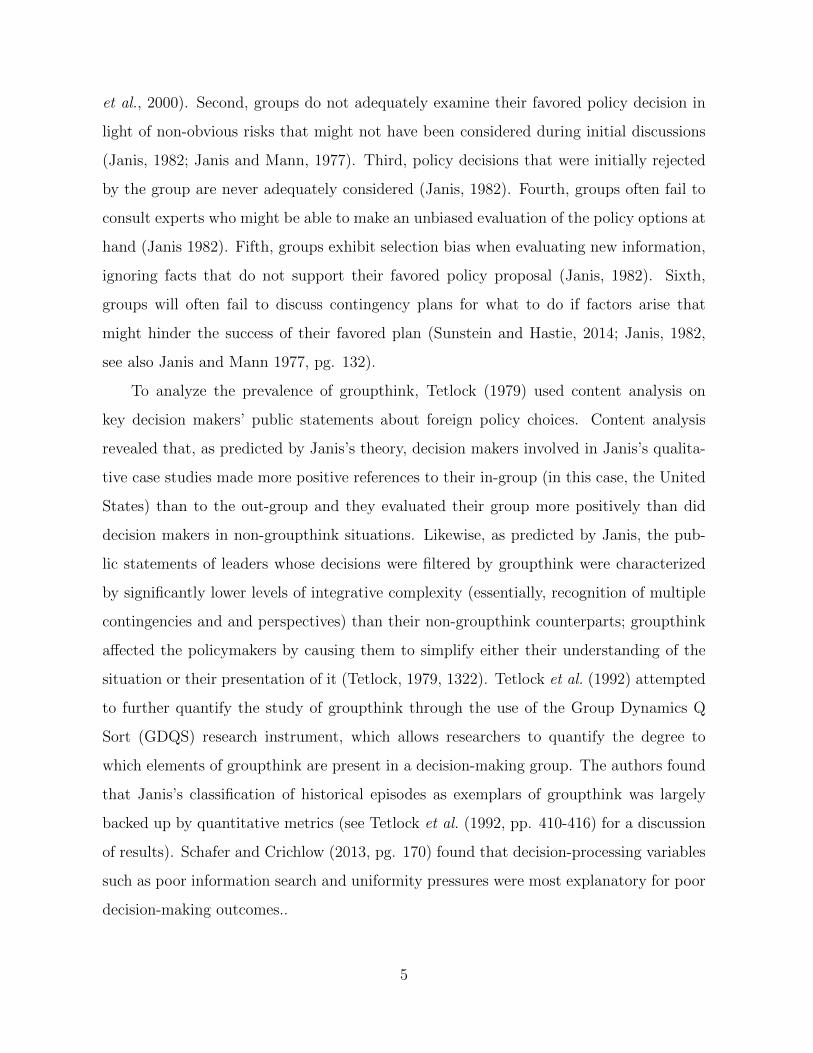
To analyze the prevalence of groupthink, Tetlock (1979) used content analysis on
key decision makers’ public statements about foreign policy choices. Content analysis
revealed that, as predicted by Janis’s theory, decision makers involved in Janis’s qualita-
tive case studies made more positive references to their in-group (in this case, the United
States) than to the out-group and they evaluated their group more positively than did
decision makers in non-groupthink situations. Likewise, as predicted by Janis, the pub-
lic statements of leaders whose decisions were filtered by groupthink were characterized
by significantly lower levels of integrative complexity (essentially, recognition of multiple
contingencies and and perspectives) than their non-groupthink counterparts; groupthink
affected the policymakers by causing them to simplify either their understanding of the
situation or their presentation of it (Tetlock, 1979, 1322). Tetlock et al. (1992) attempted
to further quantify the study of groupthink through the use of the Group Dynamics Q
Sort (GDQS) research instrument, which allows researchers to quantify the degree to
which elements of groupthink are present in a decision-making group. The authors found
that Janis’s classification of historical episodes as exemplars of groupthink was largely
backed up by quantitative metrics (see Tetlock et al. (1992, pp. 410-416) for a discussion
of results). Schafer and Crichlow (2013, pg. 170) found that decision-processing variables
such as poor information search and uniformity pressures were most explanatory for poor
decision-making outcomes..
5
Does this mean groupthink is inevitable, or are there circumstances that mitigate
the risk of groupthink, allowing for more effective group evaluations of politics? This is
an important question with implications well beyond foreign policy, including the study
of decision-making across levels of government, businesses, and other organizations. If
groupthink becomes more or less likely depending on certain conditions, it makes the
question one of scope conditions, with the possibility that organizations can design teams
less likely to fall prey to groupthink. As Raven notes, “the real genius lies in determining
what these circumstances and combinations might be which would lead to deleterious
effects” (Raven, 1998, pg. 355). In a similar vein, Baron (2005) asserts that research has
failed to prove a conclusive link between Janis’s theorized antecedent conditions and the
groupthink phenomenon. Critical to further understanding in this arena is therefore being
able to predict when groupthink will occur based on the presence of specific antecedent
conditions.
In general, there are environments where groups, working together, can produce supe-
rior results to those of individuals. In the military context, for example, units with high
levels of group cohesion generally perform better on the battlefield than those lacking
cohesion (Janowitz, 1960). As another example, Raven (1998) challenges Janis’s essential
notion that groupthink necessarily leads to fiascos, pointing out that the team working
with Nixon to contain the Watergate scandal actually came very close to being successful,
and failed only due to what was essentially happenstance and chance.3
Raven (1998) contends that Janis’s argument that group cohesiveness is one of the
pernicious forces leading to groupthink behavior is too broad. He argues that group co-
hesion can indeed lead to groupthink when it quashes minority opinions and leads to an
excessively positive view of the in-group, but that it can also sometimes be a beneficial
force within groups. He thus seeks to understand what other factors combine with group
cohesion to lead to either perverse or effective decision-making behaviors. Raven pinpoints
what he calls the “runaway norm” as the factor that causes group cohesiveness to turn de-
3Groupthink, which in the Watergate case led to gradually more risky behaviors, might have paid off
if it were not for, as Raven puts it, “some bungling burglars and some observant guards and custodians”
(Raven, 1998, pg. 358).
6
structive. The “runaway norm” is the idea that simply adhering to the norms of the group
is not enough, and that members must actively try to exceed the norm in order to main-
tain membership in the group. When this norm is present, Raven argues, group members
are pushed to not only cohere to the group, but to demonstrate continuing fidelity to the
group by issuing ever stronger statements in favor of a group consensus. Moreover, ’t Hart
(1990) distinguishes between collective avoidance and collective overoptimism (review of
his work is attached). ’t Hart (1990) also notes that group decision-making is useful for
things beyond making good decisions– they are used to adjudicate values disputes and to
push collective and institutional action.
The argument by Janis and others about the deleterious effects of groupthink focuses
on the negative effects of group cohesion and the need to belong, which leads groups
to discard inconvenient information because each individual in the group is incentivized
not to present adverse information for fear of being excluded. But in theory, groups
should be a promising environment for decision-making because individuals can bring
diverse perspectives to the table; the group can then deliberate over the accumulated
information, suss out the potential for bias, and arrive at a reasoned conclusion that is
superior to what a single individual could do (Sunstein and Hastie, 2014). This possibility
raises the question of whether different environments might generate different types of
practices within groups that make them more likely to be susceptible to groupthink or
more likely to embed some of the potentially virtuous practices of groups.
Moreover, extant research paints a picture that is arguably less pessimistic than the
most dire groupthink predictions. Teams have been shown to be more creative (Nijstad
and De Dreu, 2002; Hoegl and Parboteeah, 2007), take better risks (Rockenbach et al.,
2007), and solving complex problems (Laughlin et al., 2006). Hackman (2002) points out
that good teamwork normally results from proper antecedent conditions, the flipside of
Janis focus on the antecedent conditions that lead to groupthink. In addition to being
assigned a task that is appropriate for groups to work on, roles such as decision-making
authority and structuring incentives such as who benefits and advances, are also important
for ensuring harmonious group function. A 2008 review of team effectiveness reiterated
7
the need to better understand how the increasingly virtual nature of teams would impact
team effectiveness (Mathieu et al., 2008). Recently, research on polythink by Mintz and
Wayne (2016a) highlights that flawed group decision-making processes can emerge even
when team members express a plurality of opinions and disagree about the correct policy
actions.
Understanding the overall scope conditions of group decision-making therefore re-
quires not just examining the ability of individuals versus groups to conduct particular
tasks, but whether there are conditions that lead to variation in group performance. The
next section outlines a novel experiment designed, in part, to test the effectiveness of
groups and individuals at forecasting international political events.
3 Project Design and Hypotheses
3.1 Project Overview
This project draws on individual-level forecasts submitted as part of the Good Judg-
ment Project (GJP). GJP was a participant in the Aggregative Contingent Estimation
(ACE) Program, an effort funded by the Intelligence Advanced Research Projects Activity
(IARPA, an organization within the U.S. intelligence community) to better understand
how to create the most accurate geopolitical forecasts possible.4
We use data from 982 individuals who participated in years 2, 3, and 4 of the tour-
nament. Participants were recruited via e-mail lists, online blogs, and other forums.
Participants were required to have a bachelor’s degree or higher. There was an attri-
tion rate of 5% from season to season, so new participants were recruited to ensure that
balanced design objectives were reached.5
During each season, IARPA released forecasting questions at regular intervals (gener-
4The ACE program was designed as a competition between several teams in industry and at different
universities. This article exclusively uses data gathered by the Good Judgment Project. The Good
Judgment Project was run out of UC-Berkeley and the University of Pennsylvania.5On average, 83% of participants were male, 74% were U.S. citizens, and participants had an average
age of 40. While the pool was not made up of international politics experts, it did allow the researchers
to gather longitudinal experimental data on a non-student population (Mintz et al., 2006).
8

ally every few weeks) on geopolitical issues. Forecasting questions were called individual
forecasting problems, or IFPs. Examples of questions included: Will NATO invite any
new countries to join the Membership Action Plan (MAP) before 1 June 2015? Will
Afghanistan sign a Bilateral Security Agreement with the United States before 1 Novem-
ber 2014? For a complete list of questions asked in each season, see Appendix A.
When new questions were released, participants would log onto a website where they
had the option to enter a forecast on each question. For a binary question, such as whether
Afghanistan would sign a Bilateral Security Agreement with the U.S, possible forecasts
ranged between 0 and 100 (0 = absolutely no, 100 = absolutely yes). Some questions
had multiple bins or date ranges where participants would have to enter probabilities in
each bin, with the probabilities summing to 100. Importantly, forecasters could log on to
the website as often as desired to update their forecasts on all open questions, until that
question closed. Any day a forecaster did not log on to update their forecast, their prior
forecast on that question carried over to the next day.
Questions closed either when the event posited in the question happened (e.g., Afghanistan
signed a Bilateral Security Agreement with the United States), or the question expired
without the event occurring. When each question closed, participants received an accu-
racy score for that question using the Brier scoring rule (Brier, 1950). Brier scores are
the sum of the squared deviation between the forecast entered by a participant and the
outcome. They range from 0 (perfectly accurate) to .5 (pure chance, such as a coin flip)
to 2 (perfectly inaccurate).
As an example, consider the Afghanistan question referenced above. Imagine a par-
ticipant entered a forecast of 60% for the question of whether Afghanistan would sign a
Bilateral Security Agreement with the United States by a certain date on the first day
the question was open, and never updated their forecast. The participant would therefore
have .60 probability for “yes” and a .40 probability for “no” for each day the question
was open. A forecaster gets a score for each day the question is open, based on the final
outcome, divided by the number of days the question is open. If Afghanistan did sign a Bi-
lateral Security Agreement with the United States within the time period of the question,
9
therefore, the Brier score for that participant would be (1 − 0.60)2 + (0 − 0.40)2 = 0.32.
Now suppose that forecaster entered a prediction of 60% the first day the question was
open, then updated their prediction to 85% on the 15th day the question was open, and
the question closed as “yes” on the 30th day. In that case, the participant would receive 15
days of (1−0.60)2 +(0−0.40)2 = 0.32 and 15 days of (1−0.85)2 +(0−0.15)2 = 0.045, for
an overall Brier score on that question of 0.1825. Thus, the faster participants get to the
right answer, the better (lower) their Brier score.6 Participants then received an overall
score that was the average of all closed questions, with the top participants arranged, in
order, on a leaderboard. Thus, participants could see not only their own scores, but also
how their scores compared to the scores of other participants.
3.2 Group types
GJP’s experimental design included both individual and groups, providing a robust en-
vironment for understanding the influence of group size on forecasting accuracy. Some
participants were randomly assigned into a condition where they made forecasts on their
own while others were randomly assigned into teams of 12-15 members. Individual par-
ticipants could see a leaderboard of the most accurate forecasters in their experimental
condition.7 Team members communicated through a custom-designed online forum which
enabled them to discuss questions and forecast rationales.
Group members entered individual forecasts, with each team receiving a “group”
score for each question that was the average of the score of individual members. Group
members could also see each other’s individual accuracy scores on each question. Thus,
if an individual on a team disagreed with the way other team members described their
forecasts in the online forum, an individual on a team could “defect” from most of the
forecasters on their team, enter a different prediction, and then all would be able to judge
who was right after the question closed. For participants on teams, the analogue to the
6This is necessary since otherwise, for questions where the potential outcome is not likely to occur,
the forecaster could just update their forecast on the last day it closed to the correct forecast and receive
the same score as someone who got to the right answer weeks earlier.7Other experimental manipulations included training and in year four, accountability system types)
10
leaderboard for participants in the individual experimental condition was a leaderboard
featuring the aggregated scores of each team in their experimental condition.
3.3 Hypotheses
When should we expect groups to outperform individuals? Group outperformance of
individuals is typically seen as task-dependent. Hackman and Katz (2010), in their broad
overview of when groups can outperform individuals, point out that compensatory tasks,
when the average of the individual inputs is used as the group output, can mitigate the
impact of individual biases, resulting in a superior product. Taking the average of the
individual inputs also obviates the need to arrive at a forced consensus, thus neutralizing
one of the detrimental antecedent conditions of groupthink (Janis, 1982). 8
Additionally, several studies have demonstrated that virtual teams can perform well
because they typically bring to bear a more diverse and knowledgeable group to work
on a tough problem (Martins et al., 2004; Powell et al., 2004). Virtual teams also help
to overcome the typically debilitating impacts of groupthink by reducing the corrosive
effects of social pressures to conformity which enables individuals to speak up and raise
their own opinions. Groups were self-organized without assigned leaders who could drive
the process. Group members also did not use real names (unless they chose to reveal
them, which most did not), instead communicating under usernames. The lack of formal
leadership and the ability to operate under a pseudonym reduced the risk that status
hierarchies and other related issues could bias group discussion (Sunstein and Hastie,
2014). Additionally, as Janis pointed out, groups with a higher level of cohesiveness—
“soft” groups that exhibit a great degree of amiability and esprit de corps—are most at risk
of groupthink, and therefore at greatest risk of making poor and inaccurate decisions and
forecasts. By cooperating virtually and most operating under pseudonyms, the forecasting
groups might be less susceptible to groupthink.
Lastly, groups were incentivized to raise the group’s overall accuracy because that
8Moreover, given that the forecasting questions were deliberately small, objectively falsifiable, prob-
lems, they could also provide a way to overcome the fractious discussions that can lead to polythink
(Mintz and Wayne, 2016b). This is a potential avenue for future research.
11

score was what ”counted” within the context of the tournament. Group members could
see the accuracy score of each groupmate on each question and the overall accuracy
of their team (an average of the scores of each member of the team on each question)
compared to other teams in their experimental condition. This is the kind of condition
that Sunstein and Hastie argue mitigates the effects of groupthink. Teams therefore were
incentivized to listen to and follow those team members who had a demonstrated history
as most likely to be accurate. By creating status hierarchies based on accuracy, rather
than other attributes, forecasting groups were set up in a way to theoretically combat some
of the factors that lead to groupthink and maximize those factors likely to make teams
more effective at information sharing and processing. If these strategies for combatting
groupthink are effective, we would expect groups, on average, to outperform participants
working alone.
From this, we derive the following hypothesis:
Hypothesis 1: Group forecasters will make more accurate predictions than individual
forecasters.
Even if groups are more accurate than individuals the questions of what sets better
performing groups apart from poorer performing groups remains. The question of “why”
can help set the scope conditions in which teams are more or less likely to be subject to
groupthink.
Moreover, given the is correct, successful groups should be those that engender en-
gagement by a broad set of teammates, rather than following a traditional, vertical hier-
archical group process (Sunstein and Hastie, 2014). As previously noted, a tendency to-
wards centralization through the presence of positional and institutional leadership tends
to precede groupthink. Additionally, extant literature on group performance shows that
decentralized communications and broader group participation leads to improved group
performance relative to more centralized and restrictive information flows (Balkundi and
Harrison, 2006; Yang and Tang, 2004; Rulke and Galaskiewicz, 2000; Gloor et al., 2008;
Leenders et al., 2003).
Hypothesis 2: Better performing teams have decentralized conversational norms.
12
The research team provided some of its forecasting teams with training in cognitive
de-biasing and probability judgments (Mellers et al., 2014). This training included general
training to recognize and overcome biases, along with specific encouragement to engage
in red teaming and seek out dissenting viewpoints (one of the best practices the literature
cited above suggests could lead to more accurate group decisions). All teams received
training on how to prevent social dysfunction on teams, based on findings from past
research. In general, the training could be viewed of as a way of priming teams to conduct
more metacognition (self-aware thinking about how to think) and complex thinking about
how the group itself was making forecasts. Higher levels of self-awareness within groups
has been shown to lead to better group performance (Cohen et al., 1996; Kozlowski, 1998;
Lord and Emrich, 2001).
Hypothesis 3: Better performing teams employ metacognition and exhibit higher
levels of self-awareness.
4 Do Teams Matter?
The data analysis below draws on years 2 and 3 of the GJP project. As described above,
these years of the project featured individual forecasters as well as forecasters placed in
teams. During these years, randomly selected teams and individuals received additional
training that focused on cognitive de-biasing as well as how to conduct quantitative prob-
ability assessments and study geopolitical issues, the focus of the forecasting tournament.
The training programs are described at length elsewhere (Tetlock and Gardner, 2015).
In addition to teams and individuals, the experimental design also included a small set
of so-called “super teams.” Super teams selected from the top two percent of forecasters
in the preceding year, and all super teams received training in cognitive de-biasing and
probability judgments.9
To test hypothesis 1 that team performance exceeds individual performance, Sec-
tion 4.1 analyzes initial forecasting accuracy across experimental conditions. Section 4.2
9Note that this training, as we explain below, cannot alone explain the variation in the performance
of super teams, since other teams also received training. We also explain more about the selection and
function of super teams below.
13
●
0.0 0.1 0.2 0.3 0.4 0.5 0.6
Average Accuracy
Con
ditio
n
Individuals
● Team
●Super Team
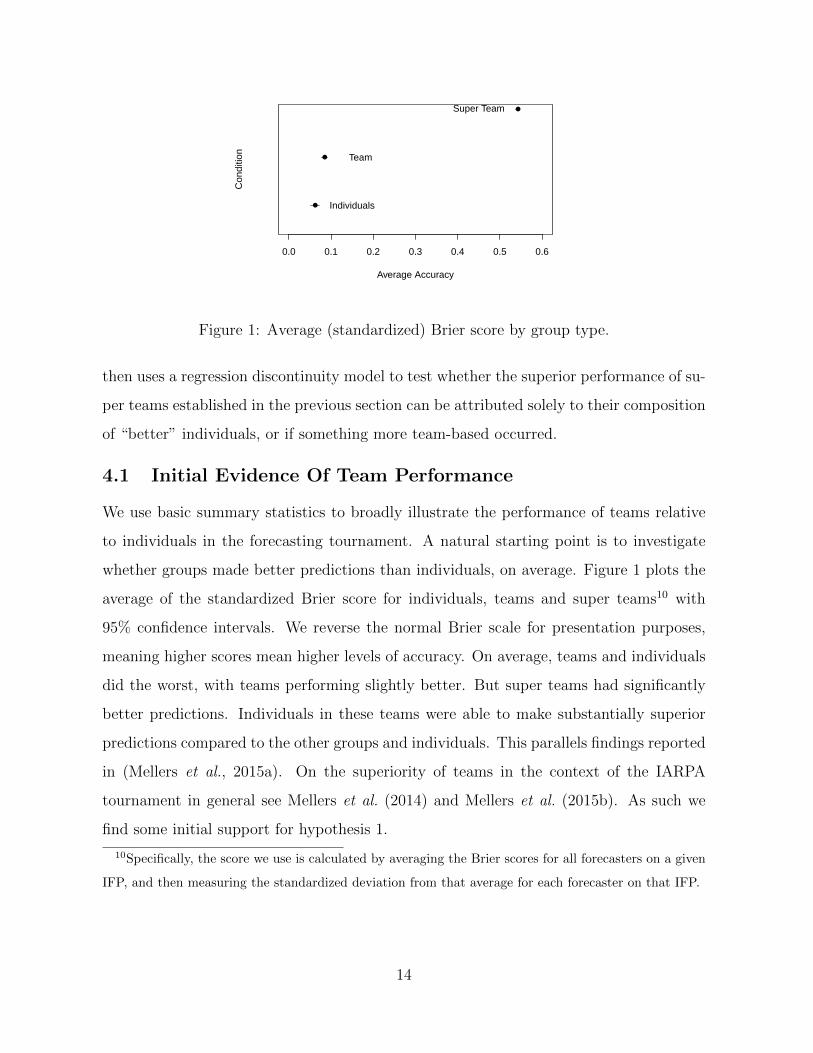
Figure 1: Average (standardized) Brier score by group type.
then uses a regression discontinuity model to test whether the superior performance of su-
per teams established in the previous section can be attributed solely to their composition
of “better” individuals, or if something more team-based occurred.
4.1 Initial Evidence Of Team Performance
We use basic summary statistics to broadly illustrate the performance of teams relative
to individuals in the forecasting tournament. A natural starting point is to investigate
whether groups made better predictions than individuals, on average. Figure 1 plots the
average of the standardized Brier score for individuals, teams and super teams10 with
95% confidence intervals. We reverse the normal Brier scale for presentation purposes,
meaning higher scores mean higher levels of accuracy. On average, teams and individuals
did the worst, with teams performing slightly better. But super teams had significantly
better predictions. Individuals in these teams were able to make substantially superior
predictions compared to the other groups and individuals. This parallels findings reported
in (Mellers et al., 2015a). On the superiority of teams in the context of the IARPA
tournament in general see Mellers et al. (2014) and Mellers et al. (2015b). As such we
find some initial support for hypothesis 1.
10Specifically, the score we use is calculated by averaging the Brier scores for all forecasters on a given
IFP, and then measuring the standardized deviation from that average for each forecaster on that IFP.
14
4.2 Super Teams Are More Than Super Individuals on the Same
Team
The results above do raise the question of whether super teams, which excelled on the
metrics above, succeed simply because they are the sum of high-performing parts. Alter-
natively, is there something in particular about being on a team that improves forecasting
accuracy? One way to assess this is to use a regression discontinuity model comparing
super team forecasters to nearly identical individuals not on a super team. This allows
us to estimate how the exogenous “shock” of joining a super team influences forecasting
accuracy for comparable individuals.
As described above, super teams are composed of forecasters who were the most accu-
rate in their condition the year before they were invited to join a super team. Forecasters
who barely miss the cutoff are essentially equivalent to forecasters who barely make the
cutoff; this is why a regression discontinuity design approximates a true experiment in
which half of the forecasters near the cutoff were randomly assigned to the treatment,
where the treatment is an invitation to join a super team for subsequent years.
Promotion to a super team initially occurred in year 2 on the basis of year 1 perfor-
mance. Forecasters who made a prediction on at least 45 unique questions and scored in
the top 2% of their experimental condition were given an invitation to join a super team
in year 2. If the forecaster turned down the invitation, the next most accurate forecaster
who met the 45-question threshold was offered their spot. The regression discontinuity
analysis is restricted to forecasters who participated in year 1 and year 2, answering at
least 45 questions in year 1 and 30 questions in year 2.
Here, we statistically replicate how GJP chose superforecasters to generate a clear
discontinuity we can exploit to test the effect of being placed on a super team. Replicat-
ing GJP, we used mean imputed Brier score as the promotion decision criterion, because
this was the measure of accuracy that forecasters were incentivized to achieve. The mean
imputed Brier score for each individual is a mean across IFPs/question scores with an
imputed score for the questions a forecaster skipped. In contrast, for assessing year 2
performance, the outcome in our regression, we use the measure that best captures fore-
15
casting accuracy: mean standardized Brier score of the questions the individual actually
forecast. The standardization is performed at the IFP/question level (i.e., the scores for
each question have a mean of zero and standard deviation of one). In both cases, a higher
score denotes greater accuracy, because we reverse the normal Brier Score scale for pre-
sentation purposes. The promotion decision score criterion (mean imputed Brier score)
is a noisier measure of skill than the Brier score, since it includes imputed scores, e.g.
participants were assigned the average score for an IFP if they did not enter a forecast
themselves. This actually strengthens our regression discontinuity design because it as-
sures us that there truly are forecasters on both sides of the cutoff with equal forecasting
skill before some were assigned to super teams.
For ease of interpretation, we center the promotion decision score so those with a
score of less than or equal to zero were given an invitation to join a super team. All
regression specifications include a centered decision score and a dummy variable indicating
whether a forecaster received an invitation to join a super team for year 2. If the dummy
variable instead indicated whether the forecaster actually joined a super team in year 2,
there would be a threat of selection bias: that the more motivated forecasters accepted
the nominations. Our approach, an intent-to-treat analysis, is more conservative, and
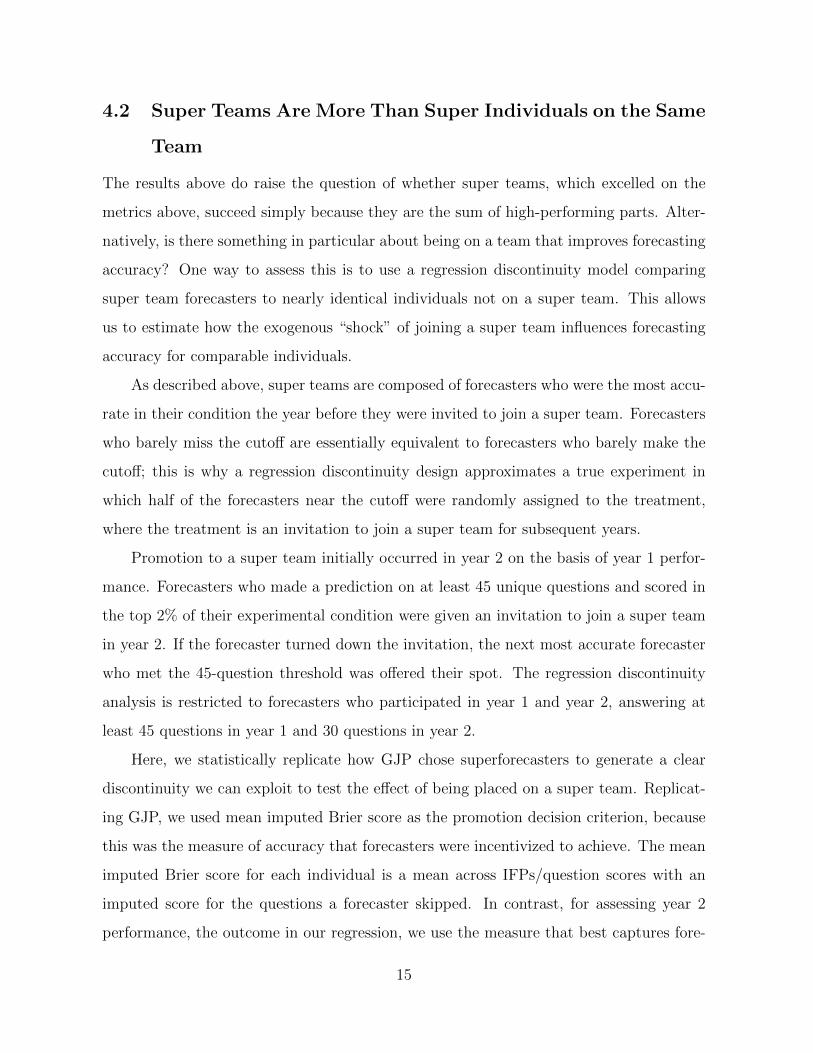
therefore likely understates the effect of the treatment on the treated. The coefficient
on the dummy variable is an unbiased estimate of the causal effect on accuracy of being
assigned to a super team and it is large (β = 0.265, S.E. = 0.035). This means that
those selected to participate on super teams relatively improved in subsequent years for
reasons related to being on the team, not just because the teams are made up of smart
individuals. Graphically, the results can be seen in Figure 2. Here, we fit a loess line to
data on each side of the discontinuity. We plot individuals that accepted the super team
invitation as open circles. 11
Sensitivity analyses demonstrate the estimated effect is essentially unchanged even
if we include additional measures of accuracy from year 1 and participation in years 1
and 2 (the number of IFPs answered). Furthermore, the result is robust to interacting
11This also means the solid red dots are forecasters in the individual and team conditions that did not
qualify to receive a superforecaster invitation.
16

●
●
●
●
●
●
●
●
●
●
●
●
●
●●●
●
●
●
●
●
●
●
●
● ●
●
●
●
●
●
●
●
●
●
●
●●
●
●
●
●
●
●●
●
●
●
●
●●
●
●
●
●
●
●
●●
●
●
● ●
●
●
●
●
●
●
●
●
●
●
●
●
●
●
●
●
●
●
●
●
●
●
●
●
●
●
●●
●
●
●
●
●
●
●
●
●
●
●
●
●
●
●
●
●
●
●
●
●
●
●●
●
●
●
●
●
●
●
●
●
●
●
●
●
●
●●
●
●
●
●
●
●
●
●
●
●
●
●
●●
●
●
●
●
●
●
●
●
●
●
●
●
●
●
●
●
●●
●
●
● ●
●
●●
●
●
●
●
●
●
●
●
●
●
● ●
●
●
●
●
●
●
●
●
●
●
●
●
●
●
●
●
●
●
●
●
●●
●●
●
●
●
●
●
●
●
●
●
●
●
●●
●
●
●
●
●
●
●●
●
●
●
●
●
●
●
●
●
●
●
●
●
●
●
●
●
●
●
●●
●
●
●
●
●
●
●
●
●
●
●●
●
●
●
●
●
●
●
●
●
●●
●
● ●
●
●
●
●
●
●
●
●●
●
●
●
●
●
●
●
●
● ●
●●
●
●
●
●
●
●
●
●
●
●●
●
●
●
●
●
●
●
●●
●●
●●
●
●
●
●
●
●
●
●
●
●●
●
●
●
●
●
●
●
●
●
●
●
●
●
●
●●
●
●
●
●
●
●
●
●
●
●
●
●
●
●●
●●
●
●
●
●
●
●●
●● ●
●
●
●
● ●
●
●
●
●
●
●
●
●
●
●
●
●
●
●
●
●
●
●
●
●
●
●
● ●
●
●
●●
●
● ●
●
●
●
●
●
●
●
●
●
●
●
●
●
●●
●
●
●
●
●
●
●
●
●
●
●
●
●●
●
●●
●
●●
●
●
●
●
●
●
●●
●
●●
●
●
●
●
●
●
●
●
●●
●
●
●
−0.4
0.0
0.4
0.8
−0.2 −0.1 0.0Year 1 Accuracy (Centered Decision Score)
Year
2 A
ccur
acy
(Mea
n S
td. S
core
)
●
●
Qualified, Declined InvitationSuperforecaster (accepted invitation)
Treatment
●
●
Did Not Qualify for Super−Team InvitationQualified/Received Super−Team Invitation
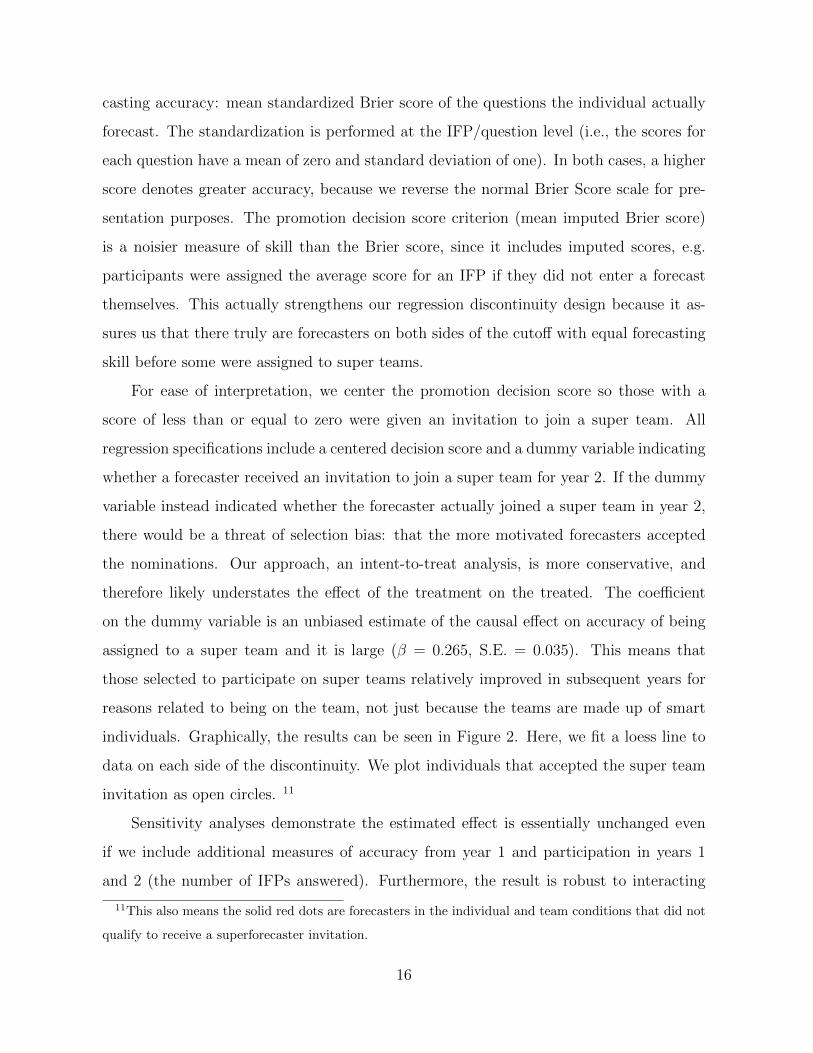
Figure 2: Regression Discontinuity
the promotion decision score and the super team dummy, which represents the possibility
that the slope on the decision score could vary above and below the cut score. These
findings further suggest that team dynamics play a significant role in driving super team
performance, beyond these teams being an aggregation of talented individuals. This
provides especially strong evidence in favor of hypothesis 1.
5 What Kinds of Teams Succeed? Modelling Team
Communication
The results above raise the question of why some teams succeed. To test hypothesis 2
and hypothesis 3 concerning what explains variation in the ability of groups to forecast,
we focus on the content of forecast explanations. In particular, we examine explanations
given by individuals in the team conditions. By understanding how different kinds of
teams (trained teams, untrained teams, and super teams) use explanations, we can begin
unpacking what makes teams more or less effective. We find several patterns in the content
of explanations that help to explain super team success.
When making their predictions, participants —whether in the individual or team
condition—could also choose to provide an explanation for their forecast. There was a
comment box underneath the place where individuals entered their forecasts and partici-
17

pants were encouraged to leave a comment that included an explanation for their forecast.
For participants in an individual experimental condition, only the researchers would see
those explanations. For participants in a team experimental condition, however, their
teammates would be able to see their explanation/comment. These explanations therefore
potentially provide useful information to help identify what leads to forecasting accuracy,
giving us a way to test hypotheses 2 and 3.
5.1 The Conversational Norms Of Successful Geopolitical Fore-
casting Groups
An obvious starting point is to ask whether, on average, individuals differ in how exten-
sively they made explanations (i.e., how many comments per IFP) and how intensively
(i.e., how long were the comments). Both of these metrics give us a sense of forecaster
engagement - since those that explain their predictions are likely more engaged than those
that do not. We do this by contrasting behavior by whether a forecaster was on a team or
not, whether they were on a team that got training, or not, and whether they were on a
super team. Below, we switch from focusing on the extent of engagement to the intensity
of engagement, when it occurs.
To calculate the degree of extensive engagement, for each individual we first calculated
the total number of explanations made per IFP for which the individual made at least one
explanation. Then for each individual we calculated their average number of comments
per IFP, averaging over all of the forecasting questions they answered. Thus, for any
person we know the average number of explanations they will give for an prediction task.
Figure 3 plots the resulting distribution of this value for each group (individuals,
untrained teams, trained teams, and super teams). The x-axis is scaled along a base
10 log for each individual’s score because this distribution is heavily skewed. The log
transformation reduces the presentational influence of extreme outliers in this distribution.
Each group is presented as a different density plot, with the height of the plot giving a
relative estimate of how many observations were at the particular value of the x-axis.12
12We use a kernel density function to make the plots.
18

0
3
6
9
12
1 10 100Average Number of Responses per Active IFP
dens
ity
ConditionIndividualTeam No TrainTeam TrainSuperTeam
Figure 3: Extensive engagement: number of responses by IFP.
We observe that both individuals and untrained teams have relatively low levels of average
responses per IFP. Trained teams and particularly super teams have considerably higher
average responses per IFP.
Next we calculate how intensively individuals engage with explaining their prediction.
For each individual we calculated the median length of their first explanation of an IFP. We
use the first explanation for a variety of reasons. First, as seen in Figure 3, individuals that
were not on a team, or were in untrained teams, rarely made more than one explanation
per IFP. Second, we are most interested in individuals providing information and analysis
to others on their team. Someone’s first explanation is an important first step in doing
this. Figure 4 shows the distribution for the four conditions. We see that individuals
who are in super teams are clearly engaging in more intensive explanation compared to
individuals in other conditions.
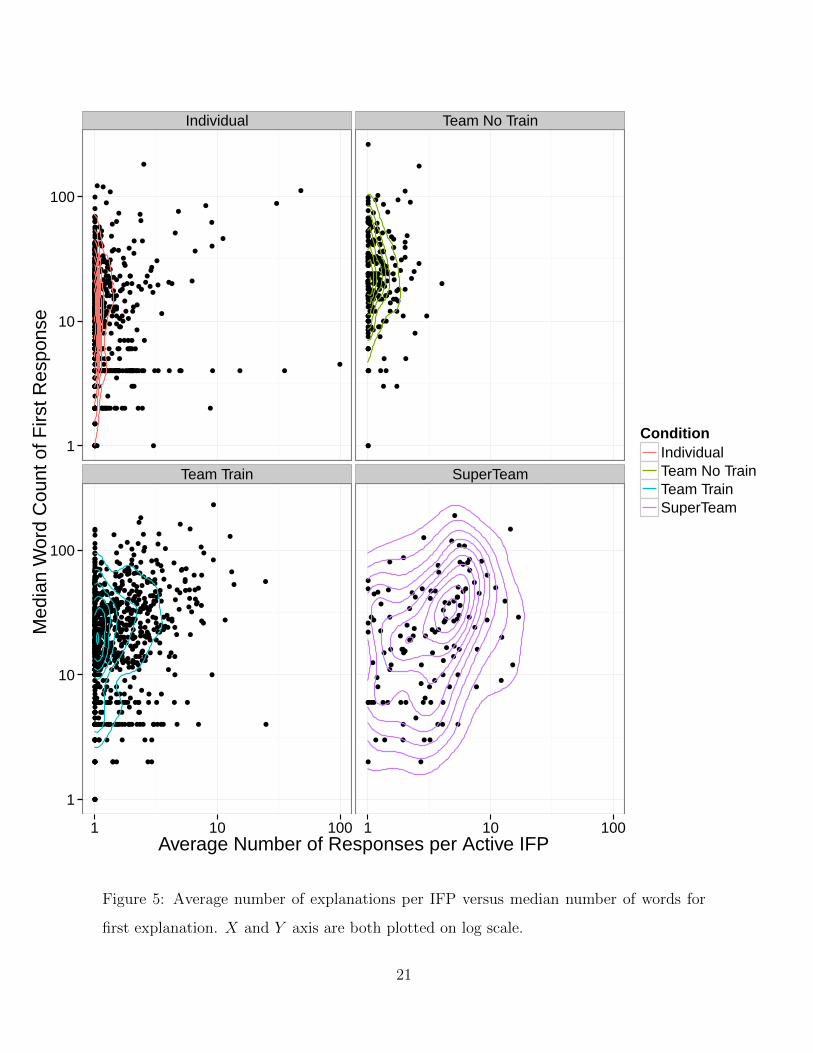
Next, we combine Figures 3 and 4 and plot each individual’s value of their extensive
engagement and intensive engagement in Figure 5. Here we separate out the plots by
each of our groups and overlay a contour plot to give a sense of the distribution of data
19

0.0
0.5
1.0
1 10 100Median Word Count of First Response
dens
ity
ConditionIndividualTeam No TrainTeam TrainSuperTeam
Figure 4: Median number of words used by individuals in their first response to an IFP.
in this space. As expected, we observe that super teams tend to have more individuals
who are engaging both more extensively per IFP and more intensively. On the other
hand, while people not on teams on occasion would provide multiple explanations per
IFP, most did not. Teams with and without training had individuals who provided more
lengthy explanations, but these teams do not have individuals who both supplied multiple
responses to an IFP and began their engagement with an IFP with a lengthy explanation
(which could then be read by other participants on their team).
20
●
●
●●●
●
●
●
●
●
●
●
●
●
●
●
●
●
●●
●
●●
●
●
●
●
●
●
●
●
●
●
●
●
●
●
●
●
●●
●
●
●
●
●
●
●
●
●
●
●
●
●
●
●
●
●
●
●
●
●
●
●
●
●
●
●
●
●
●
●
●
●
●
●
●
●
●
●
●
●
●●
●
●
●
●
● ●
●
●
●
●
●
●
●
●●
●
●
●
●
●
●
●
●
●
●
●
●
●
●
●
●
●
●
●
●
●
●
●
●
●
●
●
●
●
●●
●
●●
●
●●
●
●
●●
●
●
●
●
●
●
●
●
●
●
●
●
●
●
● ●
●
●
●
●
●●
●
●
●
●
●
●
●
●
●
●
●●
●
●
●
●
●
●
●
●
●
●
●
●
●
●
●
●
●
●
●
●
●●
●
●
●
●
●
●
●
●
●
●
●
●
●
●
●
●
●
●
●
●
●
●
●
●
●
●
●
●
●●
●
●
●
●
●
●
●
●
●
●
●
●
●
●
●
●
●
●
●
●
●
●
●
●
●
●
●
●●
●
●
●
●
●
●
●
●
●●
●
●
●
●
●
●
●
●
●
●
●
●
●
●
●●
●
●
●
●
●
●
●
●
●
●
●
●
●
●●
●
●
●
●
●
●
●
●
●
●
●
●
●
●
●
●
●
●
●
●
●
●●
●
●
●
●
●
●
●
●
●
●●
●
●
●
●●
●
●
●
●
●
●
●
●
●
●
●
●
●
●
●
●●
●
●
●
●
●
●
●
●
●
●●
●
●
●
●
●●
●
●
●
●
●
●
●
●
●
●
●
●
●
●
●
● ●
●
●●
●
●
●
●
●
●
●
●
● ●
●
●
●
●
●
●●
●
●
●
●
●
●
●
●
●
● ●
●
●
●
●
●
●
●
●
●
●
●
●
●
●
●
●
●
●
●
●
●
● ●
●
●●
●
●
●
●
●
●
●
●
●
●
●
●
●
●
●
●●
●●
●
●
●●
●
●
●
●
●
●
●
●
●
●
●●
●●
●
●
●
●
●
●
●
●
●
●
●
●
●
●
●
●
●
●
●
●
●
●
●
●
●
●
●
●
●
●
●
●
● ●
●●
●
●
●
●
●
● ●●●
●
●
●
●
●
●
●
●
●●
●
●
●
●
●
●
●
●
●●●
●
●
●
●
●
●●
●
●
●
●
●
● ●
●
●
●
●
●
●
●
●●
●
●
●
●
●
●
●
●
●
●
●
●
●
●●
●
●
●
●
●
●
●
●
●
●
●
●
●●
●
●
●
●
●
●
●
●●
●
●
●
●
●
●
●
●
●
●
●●●
●
● ●
●
●
●
●
●
●●
●
●
●
●
●
●●
●
●
●
●
●
●
●●
●
●
●
●
● ●
●
●
●
●
●
●
●
●
●
●
●
●
●
●
●
●
●
●
●
●●
●
●
●
●●
●
●
●
●
●
●
●●
●
●●
●
●●
● ●
●
●
●
●
●
● ●
●
●
●
●
●
●
●
●
●
●
●
●
●
●
●
●
●
●● ●
●
●
●
●
●
●
●
●
●
●
●
●●
●
●
●
●
●
●
●
●
●●
●
●
●
●
●
●
●
●
●
●
●
●
●
●
●●
●
●
●
●
●●
●
●
●
●
●
●
●
●
●
●●
●
●
●
●
●
●
●
●
●
●
●
●
●●●
●
●
●
●
●
●
●
●
●
●
●
●
●
●
●
●
●
●
●
●
●
●
●
●
●
●
●
●
●
●
●
●
●
● ●
●
●
●
●
●
●
●●
●
●
●
●
●
●
●
●
●
●
●
●
●●
●
●
●
●●
●
●
●
●
●
●
●
●
●
●
●
●
●
●
●
●
●
●
●
●
●
●
●
●
●
●●
●
●
●
●
●
●
●
●
●
●
●
●●
●
●
●
●
●
●
●
●
●
●
●
●
●●
●
●
●●
●
●
●
●●
●
●●
● ●
● ●
●
●
●
●
●●●
●
●●
●
●●
●
●
●
●
●
●
●
●
●
●
●
●
●
●
●
●●
●
● ●
●
●
●
●
●
●
●
●
●
●
●
●
●
●
●
●
●
●
●
●
●●
●
●
●
●
●
●
●
●
●
●
●
●●
●
●
●
●
●
●
●
●
●●
●
●
●
●
●
●●
●
●
●
●
●
●
●
●
●
●
●
●
●
●
●
●
●
●
●
●●●
●
●
●
●
●
●
●
●
●
●
●●
●
●
●
●
●
●
●
●
●
●
●
●
●
●●
●
●
●
●
● ●
●
●
●
●
●
●
●
●
●
●
●
●
●
●●
●
●
●
●
●
●
●
●
●●
●
●●
●
●
●
●
●
●
●
●
●
●
●
●
●
●
●
●
●
●
●
●●
●
●
●●
●
●
●
●
●
●
●
●
●
●
●
●
●
●
●
●
●
●
●
●
●
●
●●
●
●
●
●
●
●
● ●
●
●
●
●
●
●
●
●
●
●
●
●
●
●●
●●
●
●
●
●
●
●
●
●
●
●
●
●
●
●
●
●
●
●
●●
●
●
●
●
●
● ●●
●
●
●
●
●●
●
●
●
●
●
●
●
●
●
●
●
●
●
●
●
●
●
●
● ●
●
●
●
●
●●
●
●
●
●
●
●
●
●
●
●●
●●
●
●
●
●
●
●
●
●
●
●
●
●
●
●
●
●
●
●
●
●
●
●
●
●
●
●
●
●
●
●
●
●●
●
●
●
●
●
●
●
●
●
●
●
●
●
●
●
●
●
●
●
●●●
●
●
●
●
●
●
●
●
●
●
●
●
●
●● ●●
●
●
●
●
●
●
●
●
●
●●
●
●
●
●
●
●
●
●
●
●
●●
●
●
●
●
●
●
●
●
●
●
●
●
●
●
●
●
●
●
●
●
●
●●
●
●
●
●
●
●
●
●
●
●
●
●
●
●
●
●
●
●
●
●
●
●
●
●
●
●
●
●
●
●
●
●
●
●
●
●
●
●
●
●
●
●
●
●
●
●
●
●
●
●
●
●
● ●
●
●
●●
●
●
●
●
●
●
●
●
●
●
●
●
●
●
●●
●
●
●●
●
●
●
●●
●
●
●
●
●
●
●
●
●
●●
●
●
●
●
●
● ●
●
●●●
●
●
●●● ●
●
●
●
●
●
●
●
●
●●
●
●
●
●
●
●
●
●
●
●
●
●
●
●
●
●
●
●
●
●
●
●
●
●
●
●
●
●● ●
●
●
●●
●
●
●
●
●
●
●
●
●
●
●
●
●
●
●
●
●
●
●
●
●
●
●
●
●
●
●
●
●
●
●
●
●
●
●
●
●
●
●
●
●
●
●
●
●
●
●
●
●
●
●
●
●
●
●
●
●
●
●
●
●
●
●
●
●
●
●
●
●
●
●
●
●
●
●
● ●
●
●
●
●
●
●
●
●
●
●
●
●
●●
●
●
●
●●
●
●●●
●
●
●
●
●●● ●●
●
●
●
●
●
●
●
●
●
●
●
● ●
●
●●
●
●
●
●
●
●
●
●
●●●
●
●
●
●
●
●
●
●
●
●
●
●
●
●●
●
●●
●
●
●
●
●
●
●
●
●●
●
●
●
●
●
●
● ●●
●
●
●
●
●
●
●
●
●
●
●
●●
●
●
●
●
●
●
●
●
●
●
●
●
●
●
●
●
●
●
● ●
●
●
●
●
●
●
●
●
●
●
●
●
●
●
●
●
●
●
● ●
●
●
●
●
●
●
●
●
●
●
●
Individual Team No Train
Team Train SuperTeam
1
10
100
1
10
100
1 10 100 1 10 100Average Number of Responses per Active IFP
Med
ian
Wor
d C
ount
of F
irst R
espo
nse
ConditionIndividualTeam No TrainTeam TrainSuperTeam
Figure 5: Average number of explanations per IFP versus median number of words for
first explanation. X and Y axis are both plotted on log scale.
21

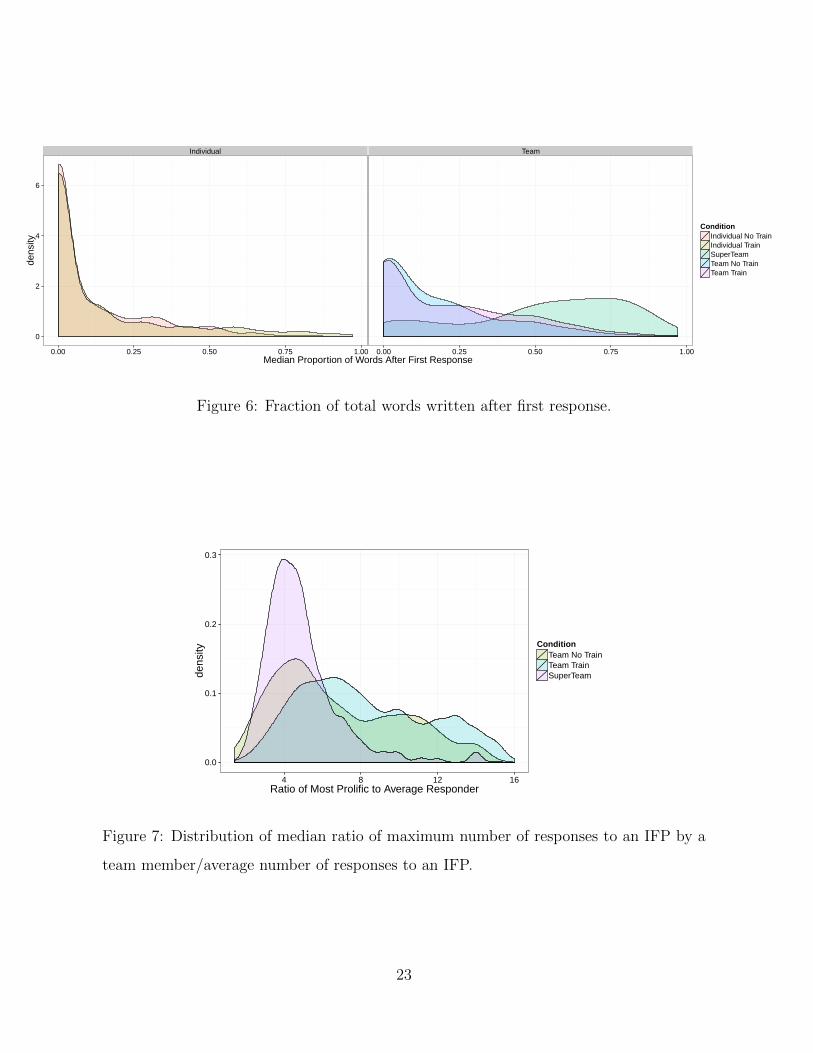
We also examined other metrics of intensive engagement. Figure 6 plots the fraction
of total words in explanations that came after the first response.13 The plot shows a low
proportion of total words coming after the very first explanation from individuals. Teams
did better, with more intensive engagement after the first explanation by trained teams
and super teams.
Figure 7 investigates the degree to which explanations are generated by a single
member of a team or a broader discussion amongst multiple participants. To measure
this we calculate for each IFP, in each team, the total number of explanations of the
most prolific responder. We then divided this by the average number of responses within
the team to that IFP to generate a score for each team/IFP combination. We then
calculated the median value of this statistic for each team and plot the results in Figure 7.
This shows a distinct pattern illustrating strong effects for one particular type of team
- super teams. Prolific posters for super teams posted four times as much as the rest
of their team. But for non-super teams, the relative contribution of the most prolific
posters was significantly higher. Essentially, in non-super teams, a smaller number of
people dominated the conversation more completely, while super teams featured broader
conversations among more team members.14
13More specifically we calculate this by taking number of words in the first response to an IFP divided
by the total number of words in all responses to the IFP. We then subtract that quantity from 1 and take
the median for a user across IFPs.14Appendix B looks at whether there are differences in the readability of the explanations. We found
no substantive differences across the conditions.
22
Individual Team
0
2
4
6
0.00 0.25 0.50 0.75 1.00 0.00 0.25 0.50 0.75 1.00Median Proportion of Words After First Response
dens
ity
ConditionIndividual No TrainIndividual TrainSuperTeamTeam No TrainTeam Train
Figure 6: Fraction of total words written after first response.
0.0
0.1
0.2
0.3
4 8 12 16Ratio of Most Prolific to Average Responder
dens
ity
ConditionTeam No TrainTeam TrainSuperTeam
Figure 7: Distribution of median ratio of maximum number of responses to an IFP by a
team member/average number of responses to an IFP.
23

That teams, and especially super teams, display a substantial difference in how they
engaged with each other provides some evidence for hypothesis 2, because it shows that
super teams engaged in both more extensive and intensive engagement, and on average
these types of engagement were linked to superior performance through their conversa-
tional norms.
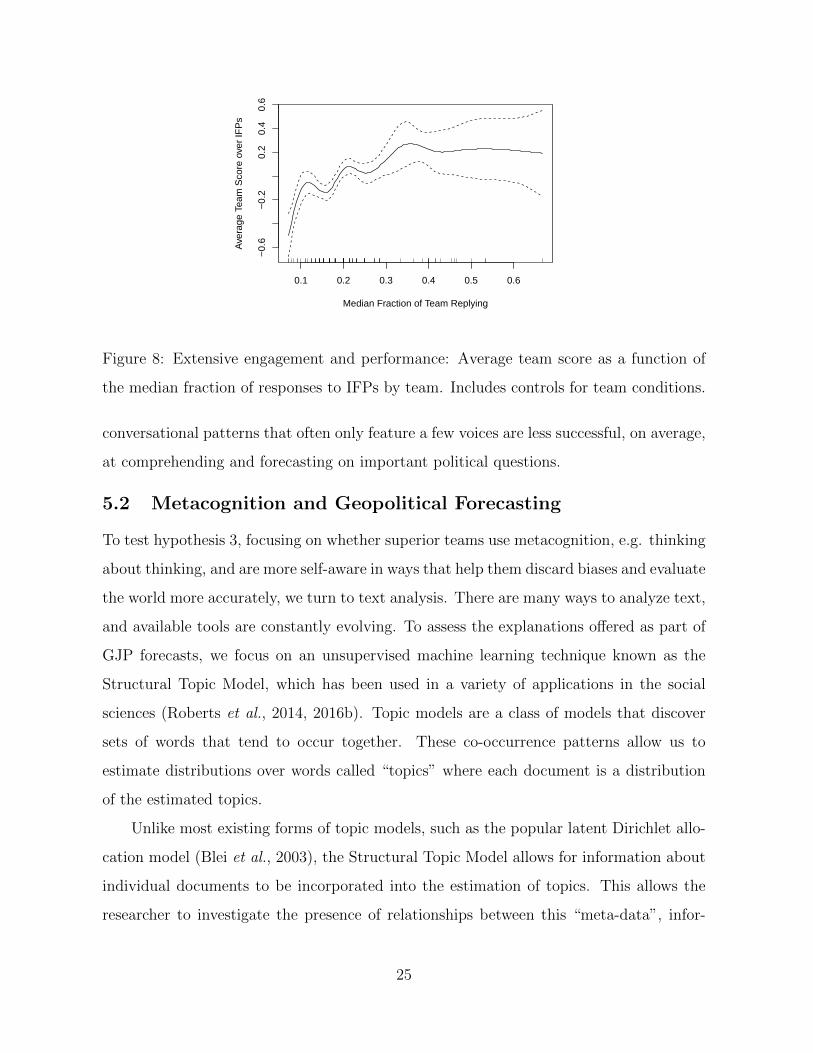
Figure 8 then shows that these different conversational norms actually produced su-
perior geopolitical forecasting accuracy. Here, we test hypothesis 2 by evaluating whether
that higher degree of engagement on the part of super teams is responsible, in part, for
their superior forecasting performance. To do this, we first calculate, for each team, on
each IFP, the proportion of the team replying (entering a comment on that IFP) and
the average of the team’s standardized score. We then aggregate over the team-IFP level
to the level of the team by taking the median fraction of the team replying (for IFPs in
which they participated) and the average score for the team across IFPs. This gives us a
sense of the types of team behaviors that lead to better performance overall.
Finally we regressed the measures of accuracy on our team-level extensive engagement
score. To allow for any potential non-linear relationships we used a generalized additive
model with cubic-regression basis function, and we plot the 95% confidence intervals.15
We also control for the effect of condition (team with no training, team with training,
and super team).
The results in Figure 8 show an unambiguous positive relationship between extensive
engagement within a team and accuracy across IFPs This provides some support for
hypothesis 2, which postulated that incorporating the perspective of multiple individuals
will improve performance on a team. However, we do see that by the time we reach 40% of
a team responding, the relationship flattens out. This flattening is primarily because the
teams who have a median response rate beyond 40% are super teams whose positive effect
on team accuracy we control for. When not controlling for condition, accuracy continues
to increase essentially linearly up to 50% at which point the benefit of additional voices in
the conversation declines. This shows, however, that the extremely hierarchical, top-down
15Implemented in the mgcv package with option bs="cs" (Wood, 2011).
24
0.1 0.2 0.3 0.4 0.5 0.6
−0.
6−
0.2
0.2
0.4
0.6
Median Fraction of Team Replying
Ave
rage
Tea
m S
core
ove
r IF
Ps
Figure 8: Extensive engagement and performance: Average team score as a function of
the median fraction of responses to IFPs by team. Includes controls for team conditions.
conversational patterns that often only feature a few voices are less successful, on average,
at comprehending and forecasting on important political questions.
5.2 Metacognition and Geopolitical Forecasting
To test hypothesis 3, focusing on whether superior teams use metacognition, e.g. thinking
about thinking, and are more self-aware in ways that help them discard biases and evaluate
the world more accurately, we turn to text analysis. There are many ways to analyze text,
and available tools are constantly evolving. To assess the explanations offered as part of
GJP forecasts, we focus on an unsupervised machine learning technique known as the
Structural Topic Model, which has been used in a variety of applications in the social
sciences (Roberts et al., 2014, 2016b). Topic models are a class of models that discover
sets of words that tend to occur together. These co-occurrence patterns allow us to
estimate distributions over words called “topics” where each document is a distribution
of the estimated topics.
Unlike most existing forms of topic models, such as the popular latent Dirichlet allo-
cation model (Blei et al., 2003), the Structural Topic Model allows for information about
individual documents to be incorporated into the estimation of topics. This allows the
researcher to investigate the presence of relationships between this “meta-data”, infor-
25

mation about the documents, and topics of interest.16 In the current application we use
information about whether an explanation came from an individual who was on an un-
trained team, a trained team, or a super team. We also include indicator variables for
each IFP in the analysis that help to pick up domain specific-language.
5.2.1 Sample and Preprocessing
Given our interest in what makes teams most effective, we subset our data to focus only
on teams and drop individuals not on teams. We also include only an individual’s first
response to an IFP because, as discussed before, there is considerable variation across
conditions in terms of how frequently individuals would post explanations per IFP. This
does not mean someone would post an explanation only after having seen posts from
other teammates. Indeed, as we discuss below, we frequently saw individuals engaging
with explanations posted by other teammates.
We also pre-processed the data in several ways. First, we only included words that
appeared in a minimum of 20 documents. This eases estimation of the model by reduc-
ing the total number of words that can be associated with topics. In order to capture
linguistics patterns that are common across IFPs rather than specific to the content of
the questions, we only included words that appeared in explanations at least twice for at
least 10 different IFPs. We also conducted standard processing of textual data such as
stemming (processing words that reflect the same concept to a single root) and stopword
(of, the, etc.) removal.17
5.2.2 Results
To estimate the STM we need to set the number of topics ahead of time. A larger number
of topics permits a more granular view whereas a smaller number of topics produces a
broader view of the corpus being analyzed. We estimated a structural topic model in
which we set the number of topics at 40. This allows for a relatively granularly view
while not overwhelming the analyst. Estimation with similar numbers of topics generally
16Importantly, and as discussed at length in Roberts et al. (2014), this approach does not force there
to be relationships.17See Grimmer and Stewart (2013) for additional discussion.
26

produced similar results.18
We begin by displaying the estimated proportion of the corpus belonging to each
topic in Figure 9. The topic that consumes the highest proportion of the corpus, Topic
23, consists of vague language and terms reflecting uncertainty. This is because we use
only first predictions and thus individuals do not feel certain about their forecasts. Topic
37, which was also relatively common, picks up on individuals providing justifications
based on some sort of weblink. Topics 2 dealt with teamwork, the focus of the current
paper. It was estimated to comprise around 3% of the corpus. Explanations highly related
to Topic 2 often utilized a pre-set message indicating that the individual was “following
teammates”, after which they could provide further explanation.19
18We used an initialization based on the spectral method of moments estimator of Arora et al. (2012)
to bypass mulimodality issues that naturally arise in topic models Roberts et al. (2016a).19This pre-set message was only available in year 3 but was added by the platform due to similar
conventions established in earlier years.
27
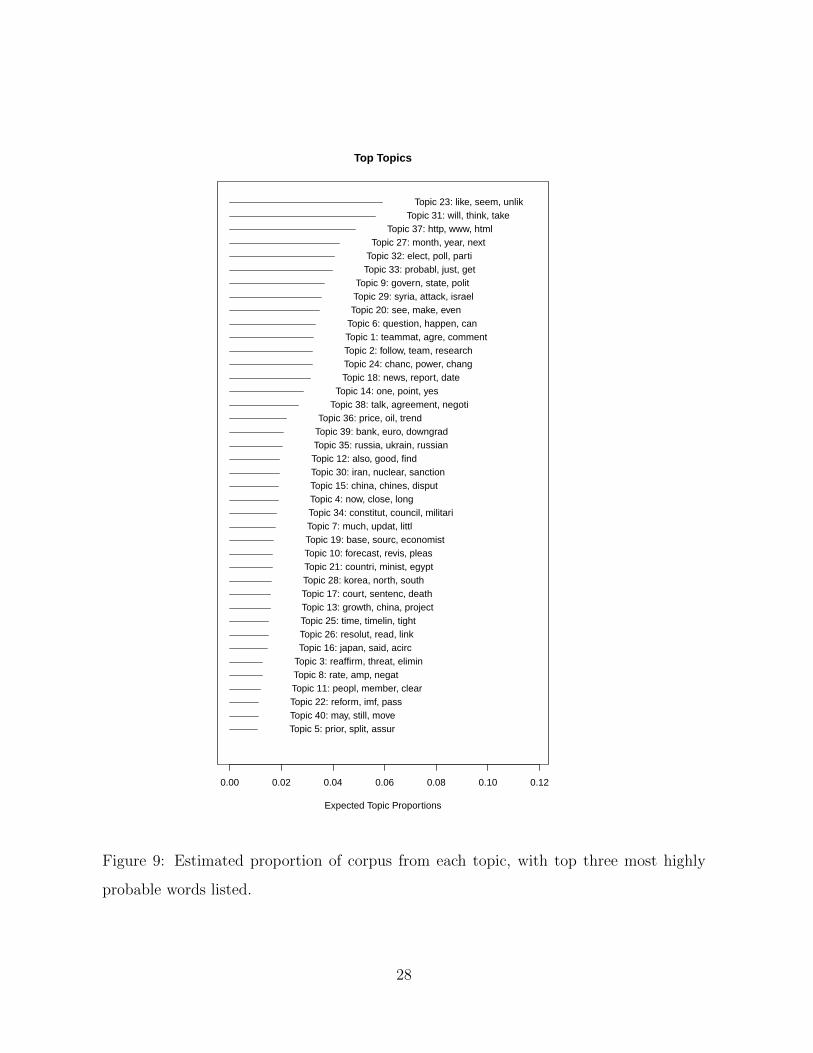
0.00 0.02 0.04 0.06 0.08 0.10 0.12
Top Topics
Expected Topic Proportions
Topic 5: prior, split, assurTopic 40: may, still, moveTopic 22: reform, imf, passTopic 11: peopl, member, clearTopic 8: rate, amp, negatTopic 3: reaffirm, threat, eliminTopic 16: japan, said, acircTopic 26: resolut, read, linkTopic 25: time, timelin, tightTopic 13: growth, china, projectTopic 17: court, sentenc, deathTopic 28: korea, north, southTopic 21: countri, minist, egyptTopic 10: forecast, revis, pleasTopic 19: base, sourc, economistTopic 7: much, updat, littlTopic 34: constitut, council, militariTopic 4: now, close, longTopic 15: china, chines, disputTopic 30: iran, nuclear, sanctionTopic 12: also, good, findTopic 35: russia, ukrain, russianTopic 39: bank, euro, downgradTopic 36: price, oil, trend
Topic 38: talk, agreement, negotiTopic 14: one, point, yes
Topic 18: news, report, dateTopic 24: chanc, power, changTopic 2: follow, team, researchTopic 1: teammat, agre, commentTopic 6: question, happen, canTopic 20: see, make, evenTopic 29: syria, attack, israelTopic 9: govern, state, polit
Topic 33: probabl, just, getTopic 32: elect, poll, partiTopic 27: month, year, next
Topic 37: http, www, htmlTopic 31: will, think, take
Topic 23: like, seem, unlik
Figure 9: Estimated proportion of corpus from each topic, with top three most highly
probable words listed.
28

Next we investigate several of the topics in greater detail. The top row in Figure 10
gives the top words associated with a teammate topic (Topic 2) as well as two additional
topics that we refer to as “analysis” topics, Topics 12 and 33. For each topic we present
a “word cloud” representation, where larger words were more highly associated with the
topic. The interpretation of the teamwork topic is straightforward. Explanations using
this topic had people mentioning that they were were following their teammates and
learning from them. In doing so, they would explain that they were benefiting from the
research done by their teammates. On occasion they would thank specific individuals by
name.
The analysis topics pick up on individuals explaining their arguments in more detail,
often using the type of logical and probabilistic reasoning tools that previous research
suggests lead to better predictions (Mellers et al., 2014). Topic 12 picks up on individuals
sharing information. While the words displayed in Figure 10 help to convey this, it is
always useful when using topic models to also look at example documents that are heavily
associated with a topic. This can be seen in Figure 11, which provides several examples
of teammates giving information they found or discussing information found by others.
Topic 33 contains a number of words associated with probabilistic reasoning. Earlier
research suggests that predictions that do not admit uncertainty one way or the other are
likely driven by biases that are unhelpful for ultimate prediction performance. Figure 12
provides one such example, which in this case included an elaboration across a number of
relevant outcomes.
Interestingly, in both Figures 11 and 12 we see examples of individuals providing
analysis but also engaging with teammates. In Figure 11 this comes in the form of the
person noting that they are “following teammates” and in Figure 12 in the form of an
individual inquiry about the probability predictions of their teammates. This illustrates
how the model allows for any explanation to be a mixture of topics. But it also suggests
that perhaps teamwork might be particularly effective if it is combined with analysis,
illustrating the use of metacognition.20
20For example, the following two entries were highly connected to both topic 2 and 33. “[name omitted]
I agree with your assessment. I’m not going stronger to the yes side because these talks with decentralized
29

cautioushedg
brierscore
weltoncamp
other
logic
argument
rational forum
spread
follow
teambringbobgreat
niceproxi
pluslead
discuss
devyn
thankbenoptim
trend
consensuspatternjohn
averag
everyon
link tim
weigh
assess
paul
researchju
dgem
ent
per
safe
lotarticl
topic
work
home
foun
d
findreturn
tab
gooddefinitsay
cautious
due
who
le
insight
stuf
f
availold
sandi
specif
cite
detail
informnote
men
tion
came
rememb
piec
though
info other
iarpa
give
great
guy
alsopage
chec
k
surearound
easili
just
guessanyon
actu
al
knowbestuse
might
got
initimayb
zero
first
bit
betterprobabl
pretti
assu
m
look
smalloveral
predict
get
som
eon
low
kind
put
els
ever
start
basic
anoth
anywaysort
sinc
confid
pull
●
0.02 0.04 0.06 0.08
Topic 2: Teamwork
●
●
●
●
0.014 0.018 0.022
Topic 12: Analysis
●Team No Train
●Team Train
●Super Team
●
0.030 0.035 0.040 0.045
Topic 33: Analysis
●
●
●
Figure 10: Top words for three topics from 40 topic STM model (top row). Marginal
effect of treatment conditions on topic prevalence (bottom row).
Topic 12
Following teammates br/ WOW thanks CoH 108 pages with good stuff pgs67 69 I don't think politics can suppress findings or the editiorsmisinterpret the findings am following you and upping the ante
Wasn't able to find a lot of information on this one but an informalpoll site gave me the 65/35 number so I'll go with it until I get
more info
Figure 11: Example explanations for topic 12.
30

Topic 33
The statistics of it First Ahn Moon will decide who will run I giveAhn a probability A and Moon 1 A Then one of them will fight Park and
win with probability B For simplicity B may be same for Ahn as forMoon Hence Ahn wins with probability A B Moon with 1 A B and Park
with 1 B br/ br/ My beliefs are A 55 B 48 so I predict 52 22 26 0Putting a little bit of hedge into it to account for the scoring rule
I make it 45 26 29 0 br/ br/ If Ahn and Moon had different chances ofdefeating Park as of now I have no idea we could distinguish
probabilities B1 B2 Then Ahn would win with probability A B1 Moonwith 1 A B2 and Park with A 1 B1 1 A 1 B2 For example if my beliefs
were A 55 B1 45 B2 50 I would predict 52 23 25 0 and hedge maybe 4627 27 0 br/ br/ It would be great to know yall's A B1 B2
Figure 12: Example explanations for topic 33.
What is the relationship between the explanation an individual gives for their pre-
dictions and their forecasting accuracy on a particular forecasting question? This can
provide additional evidence to test hypothesis 3 because it shows what types of teamwork
lead to more accurate decision-making. We therefore investigate whether individuals who
engage with their teammates and utilize source information and probabilistic reasoning
in their analysis perform better on predictions. To measure performance on a prediction
task, we use an individual’s final prediction score standardize by prediction task. We
scale this measure such that higher scores are more accurate. We regress this dependent
variable on teamwork topic 2, one of the analysis topics, an interaction between the two,
and a set of control variables. In particular, we control for the number of days since the
prediction was first posted, a dummy variable for whether the prediction came from year
2 or 3, the overall length of the explanation, and fixed-effects for each prediction task.
Results produced for each of the analysis topics demonstrates how super teams use
rebel groups types of questions are fuzzy for me and I don’t have enough expertise on this to be seen as
leading the way higher and maybe instilling false confidence in others on the team. But if I see others on
the team assess this and move their prediction higher I’ll probably do the same.” “Following teammates
Assuming 63 probability we’ll know with 95 certainty on 9 10 that the 9 24 elections are on and applying
early closing optimization as if there were a 9 10 event that could close the question early with probability
95 gives 71 as the optimal current forecast. I think those assumptions are conservative.”
31
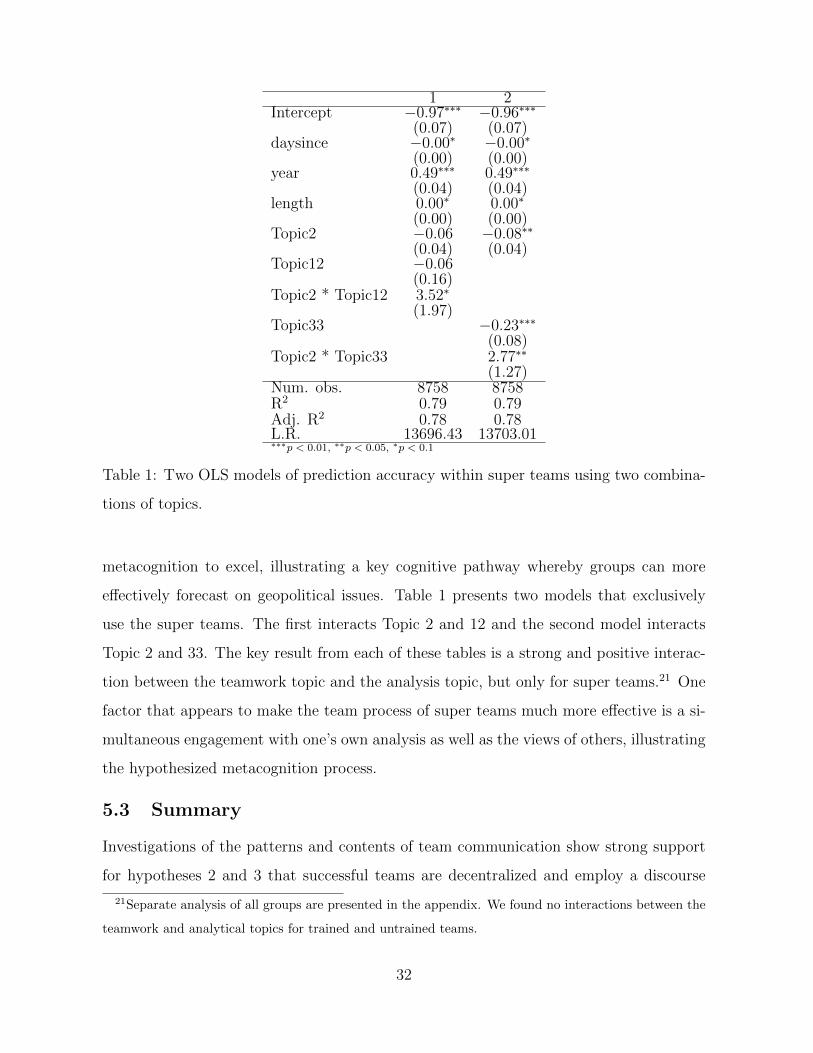
1 2Intercept −0.97∗∗∗ −0.96∗∗∗
(0.07) (0.07)daysince −0.00∗ −0.00∗
(0.00) (0.00)year 0.49∗∗∗ 0.49∗∗∗
(0.04) (0.04)length 0.00∗ 0.00∗
(0.00) (0.00)Topic2 −0.06 −0.08∗∗
(0.04) (0.04)Topic12 −0.06
(0.16)Topic2 * Topic12 3.52∗
(1.97)Topic33 −0.23∗∗∗
(0.08)Topic2 * Topic33 2.77∗∗
(1.27)Num. obs. 8758 8758R2 0.79 0.79Adj. R2 0.78 0.78L.R. 13696.43 13703.01∗∗∗p < 0.01, ∗∗p < 0.05, ∗p < 0.1
Table 1: Two OLS models of prediction accuracy within super teams using two combina-
tions of topics.
metacognition to excel, illustrating a key cognitive pathway whereby groups can more
effectively forecast on geopolitical issues. Table 1 presents two models that exclusively
use the super teams. The first interacts Topic 2 and 12 and the second model interacts
Topic 2 and 33. The key result from each of these tables is a strong and positive interac-
tion between the teamwork topic and the analysis topic, but only for super teams.21 One
factor that appears to make the team process of super teams much more effective is a si-
multaneous engagement with one’s own analysis as well as the views of others, illustrating
the hypothesized metacognition process.
5.3 Summary
Investigations of the patterns and contents of team communication show strong support
for hypotheses 2 and 3 that successful teams are decentralized and employ a discourse
21Separate analysis of all groups are presented in the appendix. We found no interactions between the
teamwork and analytical topics for trained and untrained teams.
32

including metacognition. Successful teams have members who engage more intensively
(length of response) and extensively (number of explanations). Particularly distinctive of
the highly successful super teams is continued engagement after the first explanation.
Importantly for super teams these discussions are actually team efforts; the most
prolific responder typically gives 3-6 times as many explanations as the average member
of their team. By contrast, around half of IFPs for other teams (trained and untrained
alike) have the most prolific responder contributing 8 or more times the team average.
These team dynamics translate directly into accuracy. Teams with a greater fraction of
their members responding to IFPs have better forecasting scores even when controlling
for super team membership and training.
We’ve also shown that it is not just the patterns of engagement but the content of that
engagement which lead to higher accuracy. For super teams, a combination of discourse
on teamwork and analysis is a strong predictor of high forecast accuracy. This suggests
that more than teamwork alone, a key predictor of group success in forecasting on national
security issues is the combination of that teamwork with discussion and contribution of
new analysis of the problem at hand.
6 Conclusion
Whether groups can accurately assess the world and make good decisions is a vital question
in the study of politics. In this paper, we use data from the Good Judgment Project, a
multi-year geopolitical forecasting effort featuring thousands of forecasters—some working
as individuals, some as teams—making hundreds of thousands of predictions. In contrast
to the gloomy expectations of some of the literature on group decision-making, including
groupthink, we find that forecasting teams far outperformed individuals at accurately
predicting diverse geopolitical events, including whether North Korea would test a nuclear
weapon by a certain date and who would win elections in countries around the world.
Simple statistical analysis shows that teams outperform individuals, suggesting that
there are ways to overcome groupthink. We further illustrate that group success is not
simply due to putting high-performing individuals together with a regression discontinuity
33

design that demonstrates how, for forecasters of relatively similar ability, being placed on
a team led to more forecasting success.
The results also demonstrate why some groups succeed while others fail. More suc-
cessful teams were more engaged—with members making more comments per person and
with more members of the team commenting. In some ways, this may reflect familiar
patterns from politics and business. Hierarchical teams where only a few people speak,
dominating the conversation, are, on average, less successful than teams that accept input
from a broader representation of team members. Moreover, teams that more effectively
employed training on cognitive de-biasing and probability judgments, demonstrated with
topic models, were more accurate than those that did not. More accurate groups not only
feature individual analysis, though, but genuine teamwork where individuals react to, and
update their beliefs, in response to the arguments made by their teammates.
Given that nearly all major government decisions occur through a group process (even
when the president makes the final call at the end of the day), these results are striking
and important. Theoretically, these results suggest new pathways for case studies on
effective versus ineffective government decision-making. They also suggest that, rather
than framing questions in terms of whether groups succeed or fail, research should focus
on scope conditions. Finally, these results also offer potential lessons for how to improve
the ability of groups within the government to understand and anticipate world events,
certainly including but not necessarily limited to geopolitical forecasting.
34

References
Allison, G. T. (1969). Conceptual models and the cuban missile crisis. The American
Political Science Review , 63(3), 689–718.
Arora, S., Ge, R., Halpern, Y., Mimno, D., Moitra, A., Sontag, D., Wu, Y., and Zhu,
M. (2012). A practical algorithm for topic modeling with provable guarantees. arXiv
preprint arXiv:1212.4777 .
Balkundi, P. and Harrison, D. A. (2006). Ties, leaders, and time in teams: Strong
inference about network structures effects on team viability and performance. Academy
of Management Journal , 49(1), 49–68.
Baron, R. S. (2005). So right it’s wrong: groupthink and the ubiquitous nature of polarized
group decision making. Advances in Experimental Social Psychology , 37, 219–253.
Blei, D. M., Ng, A. Y., and Jordan, M. I. (2003). Latent dirichlet allocation. The Journal
of machine Learning research, 3, 993–1022.
Brier, G. W. (1950). Verification of forecasts expressed in terms of probability. Monthly
Weather Review , 78(1), 1–3.
Cohen, M. S., Freeman, J. T., and Wolf, S. (1996). Metarecognition in time-stressed
decision making: Recognizing, critiquing, and correcting. Human Factors: The Journal
of the Human Factors and Ergonomics Society , 38(2), 206–219.
De Mesquita, B. B. and Smith, A. (2005). The logic of political survival . MIT press.
Esser, J. K. (1998). Alive and well after 25 years: A review of groupthink research.
Organizational behavior and human decision processes , 73(2), 116–141.
Gloor, P. A., Paasivaara, M., Schoder, D., and Willems, P. (2008). Finding collaborative
innovation networks through correlating performance with social network structure.
International Journal of Production Research, 46(5), 1357–1371.
35
Grimmer, J. and Stewart, B. M. (2013). Text as data: The promise and pitfalls of
automatic content analysis methods for political texts. Political Analysis , 21(3), 267–
297.
Hackman, J. (2002). Why teams dont work. Theory and Research on Small Groups ,
pages 245–267.
Hackman, J. R. and Katz, N. (2010). Group behavior and performance. Handbook of
social psychology .
Hoegl, M. and Parboteeah, K. P. (2007). Creativity in innovative projects: How teamwork
matters. Journal of Engineering and Technology Management , 24(1), 148–166.
Janis, I. L. (1982). Groupthink: Psychological studies of policy decisions and fiascoes .
Houghton Mifflin Boston.
Janis, I. L. and Mann, L. (1977). Decision making: A psychological analysis of conflict,
choice, and commitment. Free Press.
Janowitz, M. (1960). The Professional Soldier . Free Press.
Kozlowski, S. W. (1998). Training and developing adaptive teams: Theory, principles,
and research. In J. A. Cannon-Bowers and E. Salas, editors, Decision making under
stress: Implications for training and simulation, pages 115–153. APA Books.
Laughlin, P. R., Hatch, E. C., Silver, J. S., and Boh, L. (2006). Groups perform better
than the best individuals on letters-to-numbers problems: effects of group size. Journal
of Personality and social Psychology , 90(4), 644.
Leenders, R. T. A., Van Engelen, J. M., and Kratzer, J. (2003). Virtuality, communication,
and new product team creativity: a social network perspective. Journal of Engineering
and Technology Management , 20(1), 69–92.
Lord, R. G. and Emrich, C. G. (2001). Thinking outside the box by looking inside the box:
Extending the cognitive revolution in leadership research. The Leadership Quarterly ,
11(4), 551–579.
36
Martins, L. L., Gilson, L. L., and Maynard, M. T. (2004). Virtual teams: What do we
know and where do we go from here? Journal of management , 30(6), 805–835.
Mathieu, J., Maynard, M. T., Rapp, T., and Gilson, L. (2008). Team effectiveness 1997-
2007: A review of recent advancements and a glimpse into the future. Journal of
management , 34(3), 410–476.
McCauley, C. (1989). The nature of social influence in groupthink: Compliance and
internalization. Journal of Personality and Social Psychology , 57(2), 250.
Mellers, B., Ungar, L., Baron, J., Ramos, J., Gurcay, B., Fincher, K., Scott, S. E., Moore,
D., Atanasov, P., Swift, S. A., et al. (2014). Psychological strategies for winning a
geopolitical forecasting tournament. Psychological science, 25(5), 1106–1115.
Mellers, B., Stone, E., Murray, T., Minster, A., Rohrbaugh, N., Bishop, M., Chen, E.,
Baker, J., Hou, Y., Horowitz, M., et al. (2015a). Identifying and cultivating superfore-
casters as a method of improving probabilistic predictions. Perspectives on Psychological
Science, 10(3), 267–281.
Mellers, B., Stone, E., Atanasov, P., Rohrbaugh, N., Metz, S. E., Ungar, L., Bishop,
M. M., Horowitz, M., Merkle, E., and Tetlock, P. (2015b). The psychology of intelligence
analysis: Drivers of prediction accuracy in world politics. Journal of experimental
psychology: applied , 21(1), 1.
Mintz, A. and Wayne, C. (2016a). The polythink syndrome and elite group decision-
making. Political Psychology , 37(S1), 3–21.
Mintz, A. and Wayne, C. (2016b). Polythink Syndrome: U.S. Foreign Policy Decisions
On 9/11, Afghanistan, Iraq, Iran, Syria, and ISIS . Stanford University Press.
Mintz, A., Redd, S. B., and Vedlitz, A. (2006). Can we generalize from student experi-
ments to the real world in military affairs, political science and international relations?
Journal of Conflict Resolution, 50(5), 757–776.
37
Mintz, A., Yang, Y., and McDermott, R. (2011). Experimental approaches to international
relations. International Studies Quarterly , 55(2), 493–511.
Nijstad, B. A. and De Dreu, C. K. (2002). Creativity and group innovation. Applied
Psychology , 51(3), 400–406.
Peterson, R. S., Owens, P. D., Tetlock, P. E., Fan, E. T., and Martorana, P. (1998). Group
dynamics in top management teams: Groupthink, vigilance, and alternative models of
organizational failure and success. Organizational behavior and human decision pro-
cesses , 73(2), 272–305.
Powell, A., Piccoli, G., and Ives, B. (2004). Virtual teams: a review of current literature
and directions for future research. ACM Sigmis Database, 35(1), 6–36.
Raven, B. H. (1998). Groupthink, bay of pigs, and watergate reconsidered. Organizational
Behavior and Human Decision Processes , 73(2), 352–361.
Roberts, M., Stewart, B., and Tingley, D. (2016a). Navigating the local modes of big
data: The case of topic models. In R. M. Alvarez, editor, Computational Social Science:
Discovery and Prediction, pages 51–97. Cambridge University Press, New York.
Roberts, M. E., Stewart, B. M., Tingley, D., Lucas, C., Leder-Luis, J., Gadarian, S.,
Albertson, B., and Rand, D. (2014). Structural topic models for open-ended survey
responses. American Journal of Political Science.
Roberts, M. E., Stewart, B. M., and Tingley, D. (2016b). stm: R Package for Structural
Topic Models . R package version 1.1.3.
Rockenbach, B., Sadrieh, A., and Mathauschek, B. (2007). Teams take the better risks.
Journal of Economic Behavior & Organization, 63(3), 412–422.
Rulke, D. L. and Galaskiewicz, J. (2000). Distribution of knowledge, group network
structure, and group performance. Management Science, 46(5), 612–625.
Schafer, M. and Crichlow, S. (2013). Groupthink versus high-quality decision making in
international relations . Columbia University Press.
38
Schulz-Hardt, S., Frey, D., Luthgens, C., and Moscovici, S. (2000). Biased information
search in group decision making. Journal of personality and social psychology , 78(4),
655.
Sunstein, C. R. and Hastie, R. (2014). Wiser: Getting beyond groupthink to make groups
smarter . Harvard Business Press.
’t Hart, P. (1990). Groupthink in government: a study of small groups and policy failure.
Swets and Zeitlinger.
Tetlock, P. E. (1979). Identifying victims of groupthink from public statements of decision
makers. Journal of Personality and Social Psychology , 37(8), 1314.
Tetlock, P. E. (1999). Theory-driven reasoning about plausible pasts and probable futures
in world politics: are we prisoners of our preconceptions? American Journal of Political
Science, pages 335–366.
Tetlock, P. E. and Gardner, D. (2015). Superforecasting: The art and science of prediction.
Crown.
Tetlock, P. E., Peterson, R. S., McGuire, C., Chang, S.-j., and Feld, P. (1992). Assessing
political group dynamics: a test of the groupthink model. Journal of personality and
social psychology , 63(3), 403.
Wood, S. N. (2011). Fast stable restricted maximum likelihood and marginal likelihood
estimation of semiparametric generalized linear models. Journal of the Royal Statistical
Society: Series B (Statistical Methodology), 73(1), 3–36.
Yang, H.-L. and Tang, J.-H. (2004). Team structure and team performance in is develop-
ment: a social network perspective. Information & Management , 41(3), 335–349.
A GJP Questions
The list below are all forecasting questions released in years 2 and 3 of the IARPA forecast-
ing tournament. The first question launched on June 18, 2012, and the last was launched
39

on April 6, 2014. Questions with an * refer to additional definitional information avail-
able to forecasters. We exclude that detail for convenience sake, but it is available upon
request.
• Will 1 Euro buy less than $1.20 US dollars at any point before 1 January 2013?
• Will Aleksandr Lukashenko remain president of Belarus through 30 June 2012?
• Will a foreign or multinational military force fire on, invade, or enter Iran before 1 September
2012?
• Will Syria’s Arab League membership be reinstated* by 31 December 2012?
• By 31 December 2012, will the UK officially announce its intention* to withdraw from the EU?
• Will Iran successfully detonate a nuclear device, either atmospherically, underground, or under-
water before 1 January 2013?
• Who will win Venezuela’s 2012 presidential election?
• Will a foreign or multinational military force fire on, invade, or enter Syria between 6 March 2012
and 31 December 2012?
• Will the Nigerian government and Boko Haram commence official talks before 31 December 2012?
• Will there be a significant* lethal confrontation involving government forces in the South China
Sea or East China Sea between 23 January 2012 and 31 December 2012?
• Will Mario Monti resign, lose re-election/confidence vote, or vacate the office of Prime Minister of
Italy before 1 January 2013?
• Will at least one Taliban representative be appointed to serve as a minister in the Afghan govern-
ment before 1 January 2013?
• Will Zimbabwe commence a presidential election before 1 January 2013?
• Will there be a significant* outbreak of H5N1 in China in 2012?
• Will the Colombian government and FARC commence official talks before 1 January 2013?
• Will the Russian military deploy* additional Iskander missiles before 1 February 2013?
• Will the Republic of Macedonia* be a NATO member before 1 April 2013?
• Will Kim Jong-un resign or otherwise vacate the office of Supreme Leader of North Korea before
1 April 2013?
• Will any country officially announce its intention to withdraw* from the Eurozone before 1 April
2013?
• Will Standard and Poor’s downgrade the United Kingdom’s Foreign Long Term credit rating at
any point between 18 June 2012 and 1 April 2013?
• When will Japan officially become a member of the Trans-Pacific Partnership?
• When will an Egyptian Referendum vote approve a new constitution?
• When will North Korea successfully detonate a nuclear device, either atmospherically, under-
40
ground, or underwater?
• When will the UN announce that Iran has signed an official nuclear monitoring deal with the UN?
• When will Bashar al-Assad resign or otherwise vacate the office of President of Syria?
• Will Libya commence legislative elections before 8 July 2012?
• Will the UN Security Council pass a new resolution before 1 April 2013 that supports military
intervention* in Mali?
• Will Fayez al-Tarawneh resign or otherwise vacate the office of Prime Minister of Jordan before 1
January 2013?
• When will Viktor Orban resign or otherwise vacate the office of Prime Minister of Hungary?
• Who will win Sierra Leone’s next Presidential election?
• Will Raja Pervez Ashraf resign or otherwise vacate the office of Prime Minister of Pakistan before
1 April 2013?
• When will South Korea and Japan sign a new military intelligence pact*?
• Will the Romanian people approve the removal of Traian Basescu from the office of President of
Romania in a referendum vote before 1 August 2012?
• Will Spanish government generic 10-year bond yields equal or exceed 7% at any point before 1
September 2012?
• When will Nouri al-Maliki resign, lose confidence vote, or vacate the office of Prime Minister of
Iraq?
• Will Israel officially announce that it recognizes the Armenian genocide before 1 April 2013?
• Will the Palestinian group Islamic Jihad significantly violate its cease-fire with Israel before 30
September 2012?
• When will Libya name a new prime minister?
• Will Moody’s issue a new downgrade on the long-term ratings for any of the eight major French
banks between 30 July 2012 and 31 December 2012?
• Will Syria use chemical or biological weapons before 1 January 2013?
• Will Victor Ponta resign or vacate the office of Prime Minister of Romania before 1 November
2012?
• Will Moody’s issue a new downgrade of the long term debt rating of the Government of Germany
between 30 July 2012 and 31 March 2013?
• Will al-Shabaab commence official talks with the Somali government before 1 January 2013?
• When will the Free Syrian Army gain control of the city of Aleppo?
• Will the United Kingdom’s Liberal Democrats and Conservatives remain in a coalition through 1
April 2013?
• Will Kuwait commence parliamentary elections before 1 October 2012?
41
• Will the number of registered Syrian conflict refugees reported by the UNHCR exceed 250,000 at
any point before 1 April 2013?
• Will Israel officially establish a date for early elections before 6 November 2012?
• Will the Democratic People’s Republic of Korea (North Korea) and the Republic of Korea (South
Korea) commence official bilateral talks before 1 August 2013?
• Will a foreign or multinational military force invade, enter or significantly* fire on Iran before 21
January 2013?
• Will at least one individual be convicted of the July 2011 killing of Iranian nuclear physicist
Darioush Rezaeinejad by an Iranian court of law before 1 January 2013?
• Will any government force gain control of the Somali town of Kismayo before 1 November 2012?
• Who will win Ghana’s next Presidential election?
• Will the IMF officially announce before 1 January 2013 that an agreement has been reached to
lend Egypt at least 4 billion USD?
• Will the sentence of any of the three members of the band Pussy Riot who were convicted of
hooliganism be reduced, nullified, or suspended before 1 December 2012?
• What change will the European Union Council (”EUC”) make with respect to Bulgaria and Ro-
mania’s inclusion in the Schengen area* before 1 February 2013?
• Will Mariano Rajoy resign or otherwise vacate the office of Prime Minister of Spain before 1
February 2013?
• Will the Yuan to Dollar exchange rate on 31 December 2012 be more than 5% different than the
31 August 2012 exchange rate?
• Before 1 April 2013, will the Egyptian government officially announce it has started construction
of a nuclear power plant at Dabaa?
• What change will occur in the FAO Food Price index during September 2012?
• Will the Vice President of Iraq, Tariq al-Hashimi’s, death sentence be overturned before 1 Novem-
ber 2012?
• Before 1 December 2012, will Joseph Kony be *captured by a Ugandan, foreign or multinational
military/law enforcement force?
• Will Japan and North Korea announce an agreement to establish formal diplomatic relations before
1 April 2013?
• Will Sudan and South Sudan sign a border security agreement before 1 December 2012?
• Before 1 April 2013 will the North Korean government officially announce it has invited UN nuclear
inspectors to visit the country?
• Will a significant* Turkish military force invade or enter Syria between 9 October 2012 and 30
November 2012?
42
• Will the Malian government and Ansar Dine commence official talks before 1 April 2013?
• Will the new leader of Japan’s Liberal Democratic Party (LDP) Shinzo Abe be declared Prime
Minister of Japan before 1 October 2013?
• Which political parties will be a part of the next Lithuanian coalition government?
• What will the number of registered Syrian conflict refugees reported by the UNHCR be as of 1
December 2012?
• Will Liu Yandong be selected as a member of the next Politburo Standing Committee of the
Communist Party of China?
• Will the IMF officially announce sanctions on Argentina before 1 February 2013 if the International
Monetary Fund (IMF) officially announces that Argentina has failed to provide the IMF with
sufficient growth and inflation data before 20 December 2012?
• Will Iran and the U.S. commence official nuclear program talks* before 1 April 2013?
• Will the Canadian consulate in Tehran officially re-open at any time before 1 April 2013?
• Will Israel launch an airstrike against Sudan between 5 November 2012 and 31 December 2012?
• Who will win the next South Korean presidential election?
• Will the sentence of any of the seven Italian experts convicted of manslaughter for failing to
”adequately warn” about the L’Aquila earthquake be reduced, nullified, or suspended before 1
April 2013?
• Will SandP downgrade India’s credit rating between 5 November 2012 and 31 January 2013?
• Will a banking union be approved in the EU council before 1 March 2013?
• Will the Chinese consumer confidence score for the month of November 2012 drop below 99?
• Will the trial of Ahmed Shafik begin before 1 January 2013?
• Will a *significant Israeli military force invade or enter the Gaza strip between 19 November and
30 November 2012?
• Will the Turkish government release imprisoned Kurdish rebel leader Abdullah Ocalan before 1
April 2013?
• Will the Taliban and the Afghan government commence official peace talks before 1 September
2013?
• Will Mohammed Morsi cease to be President of Egypt before 1 April 2013?
• Will opposition forces in Syria seize control of the Syrian city of Aleppo by 30 April 2013?
• Will Benjamin Netanyahu resign or otherwise vacate the office of Prime Minister of Israel before
1 April 2013?
• Will a significant* foreign or multinational military force invade or enter Iran between 17 December
2012 and 31 March 2013?
• Will Mahmoud Ahmadinejad resign or otherwise vacate the office of President of Iran before 1
43

April 2013?
• Will the United Nations Security Council pass a new resolution directly concerning Iran between
17 December 2012 and 31 March 2013?
• Will Iran sign an IAEA Structured Approach document before 1 April 2013?
• Before 1 April 2013, will substantial* evidence emerge that Iran has enriched any uranium above
27
• Will M23 seize, recapture, or otherwise occupy the city of Goma at any time before 1 April 2013?
• Who will be the next president of Cyprus?
• Will North Korea attempt launch of a multistage rocket between 7 January 2013 and 1 September
2013?
• Will there be a substantial* lethal confrontation involving Iraqi government forces and Kurdish
fighters before 1 April 2013?
• What will the number of registered Malian conflict refugees reported by the UNHCR be as of 1
March 2013?
• Will the official US Dollar to Venezuelan Bolivar exchange rate exceed 4.35 at any point before 1
April 2013?
• Will Uhuru Kenyatta be found guilty of any charges by the International Criminal Court before 1
September 2013?
• Will Italian ten-year government bond yields be below 4% as of 31 March 2013?
• Will any foreign or multinational military force significantly* attack North Korea before 1 April
2013?
• Will a measurable* Israeli military force invade or enter Syria between 4 February 2013 and 1
April 2013?
• Will Egypt lift the state of emergency in Port Said, Suez, and Ismailiya before 25 February 2013?
• Will a measurable* Syrian military force invade or enter Israel between 4 February 2013 and 1
April 2013?
• Will Hamadi Jebali cease to be Prime Minister of Tunisia before 1 April 2013?
• Will Mali commence presidential elections before 1 January 2014?
• When will Mariano Rajoy vacate the office of Prime Minister of Spain?
• Will the Malian government and National Movement for the Liberation of Azawad (MNLA) begin
official talks before 1 April 2013?
• Who will be the next Pope?
• Will Egypt commence parliamentary elections before 23 April 2013?
• Will a Zimbabwean referendum vote approve a new constitution before 1 April 2013?
• Will Standard and Poor’s improve Tunisia’s sovereign credit rating or outlook before 10 April
44
2013?
• Will France withdraw at least 500 troops from Mali before 10 April 2013?
• When will Italy next form a new government?
• Will the Liberal Democratic Party (LDP) hold a relative majority of seats in the Japanese Parlia-
ment’s upper house following the next elections?
• Will the Syrian government commence official talks with Syrian opposition forces before 1 Septem-
ber 2013?
• Will Euro buy less than $1.27 at any point before 10 April 2013?
• Will Standard and Poor’s improve Cyprus’ sovereign credit rating or outlook before 10 April 2013?
• When will South Korean workers resume work at the Kaesong Industrial Complex in North Korea?
• What will China’s official quarterly GDP growth rate for Q3 2013 be?
• Before 1 May 2014, will Chinese armed forces or maritime law enforcement forces attempt to
interdict or make physical contact with at least one U.S. government naval vessel or airplane or
Japanese government naval vessel or airplane that it claims is in its territorial waters or airspace?
• Will Iran blockade the Strait of Hormuz before 1 January 2014?
• When will the International Monetary Fund announce that it has ratified a change to the voting
shares for its member countries?
• Will Libya complete elections for a Constitutional Commission before 1 October 2013?
• Will a significant North Korean military force violate the Military Demarcation Line (MDL) of
the Korean Demilitarized Zone (DMZ) before 1 October 2013?
• Will Turkey ratify a new constitution before 1 February 2014?
• Will Angela Merkel win the next election for Chancellor of Germany?
• Before 1 January 2014, will the government of Afghanistan sign a Status of Forces Agreement
(SOFA) permitting U.S. troops to remain in Afghanistan?
• Will a foreign state or multinational coalition officially announce a no-fly zone over Syria before 1
January 2014?
• Will there be a significant lethal confrontation in the East China Sea region between Japan and
China before 1 January 2014?
• Before 1 January 2014, will the government of Bolivia invite the U.S. Agency for International
Development (USAID) to resume work in Bolivia?
• Will the World Trade Organization (WTO) rule in favor of the rare earth metals complaint filed
by the European Union against China before 31 December 2013?
• Will either the French or Swiss inquiries find elevated levels* of polonium in the remains of Yasser
Arafat’s body?
• What percentage of countries worldwide will Freedom House identify as ”electoral democracies”
45
in its 2014 Freedom in the World Report?
• When will a U.N.-sponsored international conference on Syria convene with official representatives
of both the Syrian government and the Syrian National Coalition in attendance?
• Will six-party talks with North Korea resume before 1 January 2014?
• Which of these events will occur before 1 May 2014?
• Before 1 May 2014, will Joseph Kony be *captured or *incapacitated by a Ugandan, foreign or
multinational military/law enforcement force?
• Will Guinea commence legislative elections before 1 October 2013?
• Before 1 December 2013, will Egypt impose a constitutional ban on political parties based on
*religion?
• Before 1 May 2014, will Nicolas Maduro vacate the office of President of Venezuela?
• Before 1 April 2014, will the International Atomic Energy Agency (IAEA) inspect the Parchin
Military Complex?
• Before 1 May 2014, will Iran *test a ballistic missile with a reported range greater than 2,500 km?
• Before 1 February 2014, will either India or Pakistan recall its High Commissioner from the other
country?
• How much will *world economic output grow in 2013?
• Who will become the next Prime Minister of Australia?
• Will Syria attack Israel between 28 August 2013 and 31 December 2013?
• What will the outcome of Bo Xilai’s trial be?
• When will the official Chinese renminbi-to-U.S. dollar exchange rate exceed 0.17?
• Will Prince Khalifa bin Salman Al Khalifa be Prime Minister of Bahrain on 1 February 2014?
• Will China deploy any armed unmanned aerial vehicles (UAVs) over the territory of another
country before 1 May 2014?
• Before 1 May 2014, will Iran abolish the office of President of the Islamic Republic?
• Between 11 September and 1 December 2013, what will be the highest daily close for the U.S.
dollar-Japanese yen exchange rate?
• Will Nawaz Sharif vacate the office of Prime Minister of Pakistan before 1 May 2014?
• What will be Moody’s next action on the credit rating of the Government of Ireland between 11
September and 1 November 2013?
• Who will win the next presidential election to be held in Honduras?
• When will the United Nations Security Council next pass a new resolution directly concerning
Syria’s chemical weapons?
• Will the Organization for the Prohibition of Chemical Weapons (OPCW) complete its initial on-
site inspections of Syria’s declared chemical weapons sites before 1 December 2013?
46

• Who will be the head of government of Saudi Arabia as of 1 May 2014?
• When will the Leadership Council of the Islamic Emirate of Afghanistan announce that it accepts
the constitution of the Republic of Afghanistan?
• Before 1 March 2014, will North Korea conduct another successful nuclear detonation?
• Before 1 March 2014, will Gazprom announce that it has unilaterally reduced natural-gas exports
to Ukraine?
• Who will win the next presidential election in Georgia?
• Will China seize control* of the Second Thomas Shoal before 1 January 2014?
• Between 25 September 2013 and 31 March 2014, will any members or alternate members of the
18th Central Committee of the Communist Party of China be arrested on charges of bribery,
embezzlement, or abuse of power?
• Will the *M-PESA system have a failure that results in at least 100,000 subscribers losing all
ability to send and receive money from their accounts for at least 48 hours before 31 December
2013?
• Before or during its next plenary meeting, will the Central Committee of the Communist Party of
China announce that it plans to reform the hukou system nationwide by 2015?
• Before 1 May 2014, will Russia sign an agreement with the de facto government of South Ossetia
delineating the border between the two?
• Will defense expenditures in Japan’s initial draft budget for fiscal year 2014 exceed 1 percent of
projected gross domestic product (GDP)?
• Before 1 May 2014, will the government of Colombia and the FARC sign a formal peace agreement?
• Before 1 May 2014, will any U.N. member state offer diplomatic recognition to the government of
a new state on what is now territory of Syria, Turkey, or Iraq?
• Before 1 December 2013, will the government of Pakistan and Tehrik-i-Taliban Pakistan announce
that they have agreed to engage in direct talks with one another?
• Before 1 May 2014, will construction begin on the Lamu oil pipeline?
• What will be the lowest end-of-day price of Brent Crude Oil between 16 October 2013 and 1
February 2014?
• Will the president of Brazil come to the United States for an official State Visit before 1 February
2014?
• Will the United Kingdom’s Tehran embassy *officially reopen before 31 December 2013?
• Before 1 January 2014, how many cases of the Middle East respiratory syndrome coronavirus
(MERS-CoV) occurring among pilgrims who attended the 2013 Hajj will be *reported?
• Will the INC (India National Congress) win more seats than any other party in the Lok Sabha in
the 2014 General Elections in India?
47
• Will Facebook and/or Twitter be available in China’s Shanghai Free Trade Zone before 31 March
2014?
• Between 6 November 2013 and 1 April 2014, how many violent attacks will be reported on the
Arab Gas Pipeline?
• Before 1 February 2014, will Iran officially announce that it has agreed to *significantly limit its
uranium enrichment process?
• Before 1 May 2014, will Russia rescind its law barring US citizens from adopting Russian children?
• At the opening session of the 2014 UN Security Council, what country will sit in the non-permanent
seat to which Saudi Arabia was elected in 2013?
• What will be the outcome of Chile’s next legislative elections?
• As of 31 March 2014, what will be the last total value of cumulative pledges to the Least Developed
Countries Fund (LDCF) reported by the Global Environmental Facility (GEF)?
• Before 1 January 2014, will the Prime Minister of Japan visit the Yasukuni Shrine?
• What will be the projected real GDP growth for the world in 2014 in the International Monetary
Fund’s April 2014 World Economic Outlook Report?
• Before 1 April 2014, will the government of Syria and the Syrian Supreme Military Command
announce that they have agreed to a cease-fire?
• Which of the following will occur in the next municipal elections in Venezuela?
• Before 1 April 2014, will one or more countries impose a new requirement on travelers to show
proof of a polio vaccination before entering the country?
• Between 13 November 2013 and 1 March 2014, what will be the peak value of the BofA Merrill
Lynch Euro High Yield Index Option-Adjusted Spread?
• Before 1 May 2014, will any non-U.S. actor use, in a lethal confrontation, either a firearm containing
a critical part made with 3D printing technology or a lethal explosive device containing a critical
part made with 3D printing technology?
• Will Russia file a formal World Trade Organization (WTO) anti-dumping dispute against the
European Union (EU) before 31 March 2014?
• Will South Korea and Japan sign a *new military intelligence pact before 1 March 2014?
• Before 1 May 2014, will China arrest Wang Zheng on charges of incitement to subvert state power
and/or subversion of state power and/or incite separatism?
• Will North Kosovo experience any *election-related violence before 31 December 2013?
• Before 1 March 2014, will the U.S. and E.U. *officially announce that they have reached at least
partial agreement on the terms of a Transatlantic Trade and Investment Partnership (TTIP)?
• Will the general elections in Guinea-Bissau commence on 16 March 2014 as planned?
• Before 1 May 2014, will the government of any country other than Armenia, Belarus, Kazakhstan,
48

Kyrgyzstan, Russia or Tajikistan announce its intention to join the Eurasian Customs Union?
• Between 4 December 2013 and 1 March 2014, will the European Commission *officially state that
Italy is eligible for the investment clause?
• Before 1 March 2014, will the International Atomic Energy Agency (IAEA) announce that it has
visited the Gchine uranium mine site in Iran?
• Before 1 March 2014, will the European Commission (EC) announce that Turkey is permitted to
open a *new chapter of accession negotiations?
• Will the six-party talks with North Korea resume before 1 May 2014?
• What will be the number of registered Syrian refugees reported by the UNHCR as of 1 April 2014?
• Will Israel release all of the 104 Palestinian prisoners from its jails before 1 May 2014?
• Will Thailand *commence parliamentary elections on or before 2 February 2014?
• Before 1 May 2014, will Myanmar *officially announce that construction of the Myitsone Dam will
resume?
• How many countries will *officially ban WhatsApp before 1 May 2014?
• Before 1 May 2014, will the U.S. and the European Union reach an agreement on a plan to protect
individuals’ data privacy?
• Will inflation in Japan reach 2 percent at any point before 1 April 2014?
• Before 31 March 2014, will the Slovenian government *officially announce that it will seek a loan
from either the European Union bailout facilities or the IMF?
• How many Japanese nuclear reactors will be operational as of 31 March 2014?
• Will there be a *lethal confrontation between national military forces from China and Japan before
1 May 2014?
• Before 1 May 2014, will General Abdel Fattah al-Sisi announce that he plans to stand as a candidate
in Egypt’s next presidential election?
• Before 1 May 2014, will Iran install any new *centrifuges?
• Before 1 May 2014, will China confiscate the catch or equipment of any foreign fishing vessels in
the South China Sea for failing to obtain prior permission to enter those waters?
• Before 1 May 2014, will official representatives of the Syrian government and the Syrian opposition
formally agree on a *political plan for Syria?
• Before 31 March 2014, will either Peru or India announce their intention to formally launch nego-
tiations on a preferential trade agreement (PTA) with each other?
• Will the U.N. Security Council approve a U.N. peacekeeping operation for the Central African
Republic before 1 April 2014?
• What will be the highest reported monthly average of Mexican oil exports to the United States
between 5 February 2014 and 1 April 2014?
49

• Which of the following will occur first with regard to the state of emergency declared by the
government of Thailand on 21 January 2014?
• Will Ukraine *officially declare a state of emergency before 10 May 2014?
• Before 1 April 2014, will the government of Venezuela *officially announce a reduction in govern-
ment subsidies for gasoline prices?
• Will Viktor Yanukovich vacate the office of President of Ukraine before 10 May 2014?
• Before 1 May 2014, will Kenneth Bae leave North Korea?
• Will family reunions between South and North Korea begin on or before 25 February 2014?
• Before 1 May 2014, will China *attempt to seize control of Zhongye Island?
• Will the European Central Bank (ECB) *officially announce a plan to charge a *negative interest
rate on funds parked overnight at the ECB before 31 March 2014?
• Before 1 May 2014, will North Korea conduct a new *multistage rocket or missile *launch?
• Which party will win the largest number of seats in the next elections for Colombia’s Chamber of
Representatives?
• Before 1 March 2014, will Russia purchase any *additional Ukrainian government bonds?
• Will the European Union and/or the U.S. impose new *sanctions on Viktor Yanukovich and/or
members of his government before 10 May 2014?
• Will Argentina, Brazil, India, Indonesia, Turkey, and/or South Africa impose *currency or capital
controls before 1 May 2014?
• How many *additional countries will announce *restrictions on financial institutions and/or busi-
nesses converting Bitcoin to conventional currencies between 19 February 2014 and 30 April 2014?
• Will Syria’s *mustard agent and key binary chemical weapon components be destroyed on or
before the 31 March 2014 deadline established by the Executive Council of the Organization for
the Prohibition of Chemical Weapons (OPCW)?
• How many people in the Central African Republic will be estimated as internally displaced by the
U.N. High Commissioner for Refugees (UNHCR) as of 1 May 2014?
• Will the U.N. Human Rights Council (UNHRC) adopt a resolution *directly concerning Sri Lanka
during its 25th regular session in March 2014?
• Will negotiations on the TransPacific Partnership (TPP) *officially conclude before 1 May 2014?
• Will *Russian armed forces invade or enter Kharkiv and/or Donetsk before 1 May 2014?
• Will there be a *significant lethal confrontation between armed forces from Russia and Ukraine in
Crimea before 1 April 2014?
• Will Recep Tayyip Erdogan vacate the office of Prime Minister of Turkey before 10 May 2014?
• Will the Israeli-Palestinian peace talks be extended beyond 29 April 2014?
• Will Pakistan and the TTP reach a peace agreement before 10 May 2014?
50

• What will be the highest daily close for the U.S. dollar-Ukrainian hryvnia exchange rate between
5 March 2014 and 1 May 2014?
• Will there be a *significant attack on *Israeli territory before 10 May 2014?
• Will Bahrain, Egypt, Saudi Arabia, or the United Arab Emirates return their ambassadors to
Qatar before 10 May 2014?
• When will Yingluck Shinawatra vacate the office of Prime Minister of Thailand?
• Before 10 May 2014, will Russia agree to conduct a joint naval exercise with Iran?
• Will the Bank of Japan (BoJ) *officially announce an *enhancement of its quantitative and qual-
itative monetary easing (QQE) policy before 10 May 2014?
• Between 29 May 2011 and 3 May 2014, how many fatalities in Nigeria will be attributed to Boko
Haram?
• Will Parti Quebecois hold a majority of seats in the Quebec legislature after the 2014 provincial
election?
• Before 1 May 2014, will the government of Myanmar sign a nationwide ceasefire agreement with
the Nationwide Ceasefire Coordination Team (NCCT)?
• Will China’s *official annual GDP growth rate be less than 7.5 percent in Q1 2014?
• Between 2 April 2014 and 10 May 2014, will Russia *officially *annex any *additional Ukrainian
territory?
• Will Iran and the P5+1 countries *officially announce an agreement regarding the Arak reactor
before 10 May 2014?
• How many *additional countries will report *cases of the Ebola virus as of 9 May 2014?
• Will Iran and Russia *officially sign an agreement regarding the exchange of oil for *goods and
services before 10 May 2014?
• Will Nouri al-Maliki’s State of Law bloc win more seats than any other entity in the 2014 parlia-
mentary elections in Iraq?
B Accessibility
While super teams and to a lesser extent trained teams had greater extensive and in-
tensive engagement, were they also communicating in ways that are also accessible? Put
differently, what can say about how easily others would be able to read their explanations.
One (of many) such approach is to focus in on the number of syllables in words that the
forecasters write. In particular, we calculated the ratio of syllables to number of words
51

All SuperTeam TeamTrain TeamNoTrainIntercept −0.96∗∗∗ −0.97∗∗∗ −1.12∗∗∗ −0.08∗∗
(0.07) (0.07) (0.13) (0.03)Topic2 0.01 −0.06 0.20∗∗∗ −0.43
(0.04) (0.04) (0.08) (0.83)Topic12 0.21 −0.06 0.26 0.70
(0.18) (0.16) (0.28) (0.76)daysince −0.00∗∗∗ −0.00∗ −0.00∗∗∗ 0.00
(0.00) (0.00) (0.00) (0.00)Condition=Team No Train −0.16∗∗∗
(0.01)Condition=Team Train −0.13∗∗∗
(0.01)year 0.55∗∗∗ 0.49∗∗∗ 0.56∗∗∗
(0.03) (0.04) (0.06)length 0.00∗∗∗ 0.00∗ 0.00 0.00
(0.00) (0.00) (0.00) (0.00)Topic2 * Topic12 4.14∗∗ 3.52∗ −2.69 18.73
(1.96) (1.97) (4.66) (38.90)Num. obs. 31280 8758 18344 4178R2 0.50 0.79 0.45 0.42Adj. R2 0.49 0.78 0.44 0.40L.R. 21624.77 13696.43 10811.45 2264.96∗∗∗p < 0.01, ∗∗p < 0.05, ∗p < 0.1
Table 2: OLS models of Topics 2, 12 and accuracy
for every document and then took the average of this ratio for each of our groups.22 Fig-
ure 13 presents the results, with average scores for each group plotted alongside a density
description of the entire data set. While super teams had statistically higher scores, these
differences were tiny.
C Additional Meta-Cognition Models
22At times forecasters will embed weblinks whose number of syllables will be calculated to be very high
(e.g., in the 1000’s). To deal with this problem, we thresholded our syllabus algorithm to remove words
with five or greater syllables. We obtain similar results with other thresholds. Thus our score ranges
from 1 to 4, with 4 taken as less accessible explanation. This approach, which is related to Flesch-Kincaid
scores, avoids the problem that related metrics utilize sentence level measures that for many explanations
are unavailable due to not using punctuation.
52

●
1.0 1.2 1.4 1.6 1.8 2.0
Average Syllables / Words
Con
ditio
n
Individual
●Untrained Team
●Trained Team
●Super Team
Figure 13: Average ratio of syllables to words in explanation.
53

All SuperTeam TeamTrain TeamNoTrainIntercept −0.96∗∗∗ −0.96∗∗∗ −1.13∗∗∗ −0.09∗∗∗
(0.06) (0.07) (0.13) (0.03)Topic2 0.02 −0.08∗∗ 0.13∗ −1.46
(0.04) (0.04) (0.07) (1.11)Topic33 0.03 −0.23∗∗∗ 0.14 0.25
(0.08) (0.08) (0.14) (0.31)daysince −0.00∗∗∗ −0.00∗ −0.00∗∗∗ 0.00
(0.00) (0.00) (0.00) (0.00)Condition=Team No Train −0.16∗∗∗
(0.01)Condition=Team Train −0.13∗∗∗
(0.01)year 0.55∗∗∗ 0.49∗∗∗ 0.56∗∗∗
(0.03) (0.04) (0.06)length 0.00∗∗∗ 0.00∗ 0.00 0.00
(0.00) (0.00) (0.00) (0.00)Topic2 * Topic33 2.40∗ 2.77∗∗ 1.14 40.19
(1.37) (1.27) (2.89) (27.84)Num. obs. 31280 8758 18344 4178R2 0.50 0.79 0.45 0.42Adj. R2 0.49 0.78 0.44 0.40L.R. 21621.39 13703.01 10812.53 2271.81∗∗∗p < 0.01, ∗∗p < 0.05, ∗p < 0.1
Table 3: OLS models of Topics 2, 33 and accuracy
54
Related Documents