Modelling the effect of temperature variation on the seasonal dynamics of Ixodes ricinus tick populations Penelope A. Hancock a,1,⇑ , Robert Brackley a , Stephen C.F. Palmer b a Centre for Population Biology, Imperial College London, Silwood Park Campus, Ascot, Berkshire SL5 7PY, UK b Institute of Biological and Environmental Sciences, University of Aberdeen, Zoology Building, Tillydrone Avenue, Aberdeen AB24 2TZ, UK article info Article history: Received 9 October 2010 Received in revised form 3 December 2010 Accepted 5 December 2010 Available online 2 February 2011 Keywords: Ixodes ricinus Tick Age-structured model Population dynamics Vector-borne disease Temperature-dependent development Global warming abstract Seasonal variation in temperature is known to drive annual patterns of tick activity and can influence the dynamics of tick-borne diseases. An age-structured model of the dynamics of Ixodes ricinus populations was developed to explore how changes in average temperature and different levels of temperature var- iability affect seasonal patterns of tick activity and the transmission of tick-borne diseases. The model produced seasonal patterns of tick emergence that are consistent with those observed throughout Great Britain. Varying average temperature across a continuous spectrum produced a systematic pattern in the times of peak emergence of questing ticks which depends on cumulative temperature over the year. Examination of the effects of between-year stochastic temperature variation on this pattern indicated that peak emergence times are more strongly affected by temperature stochasticity at certain levels of average temperature. Finally the model was extended to give a simple representation of the dynamics of a tick-borne disease. A threshold level of annual cumulative temperature was identified at which dis- ease persistence is sensitive to stochastic temperature variation. In conclusion, the effect of changing pat- terns of temperature variation on the dynamics of I. ricinus ticks and the diseases they transmit may depend on the cumulative temperature over the year and will therefore vary across different locations. The results also indicate that diapause mechanisms have an important influence on seasonal patterns of tick activity and require further study. Ó 2011 Australian Society for Parasitology Inc. Published by Elsevier Ltd. All rights reserved. 1. Introduction The epidemiology of vector-borne diseases is sensitive to pat- terns of temperature and temperature variation (Pascual et al., 2006; Ogden et al., 2007; Estrada-Peña, 2009; Lafferty, 2009; Paaijmans et al., 2009). Tick-borne disease dynamics are particu- larly influenced by changing environmental conditions, especially variation in temperature (Randolph and Rogers, 2000; Ogden et al., 2007, 2008), because ticks have a long lifecycle and develop through multiple stages at a rate that is temperature dependent (MacLeod, 1932). Therefore, spatial and temporal variation in the abundance of tick populations shows a strong association with temperature, as well as vegetation type, humidity and soil water content (Randolph, 1997; Walker, 2001; Cadenas et al., 2007; Schwarz et al., 2009). The dynamics of temperate tick populations such as Ixodes ricinus and Ixodes scapularis are highly seasonal, because temperatures are too low during the colder months of the year to allow interstadial development and questing activity (Randolph, 2004; Ogden et al., 2005). For example, the annual abundance distribution of questing tick populations in Europe and North America is typically concentrated in a small number of strong peaks that occur during the warmer part of the year (Gray, 1982; Walker, 2001; Randolph et al., 2002; Estrada-Peña et al., 2004; Ogden et al., 2005; Cadenas et al., 2007; Schwarz et al., 2009). The timing of the peaks varies between the different lifecy- cle stages, and the abundance of questing I. ricinus nymphs and adults often peaks in spring and autumn but not in summer (the warmest part of the year), while larvae are more likely to show a single mid-year peak in questing activity (Gray, 1982; Randolph et al., 2002; Estrada-Peña et al., 2004; Jouda et al., 2004; Schwarz et al., 2009). Tick-borne diseases such as tick-borne encephalitis, Lyme bor- reliosis, louping ill and tick pyaemia persist due to transmission of the pathogen between tick lifecycle stages, whereby larvae and nymphs contract the disease by feeding on infectious hosts and then transmit the disease to susceptible hosts during subse- quent blood meals as nymphs or adults. The temporal dynamics of different tick lifecycle stages, and how they depend on the cli- matic conditions to which the population is exposed, are therefore critical determinants of the patterns of disease outbreak. In partic- ular, disease transmission is more likely to persist in environments 0020-7519/$36.00 Ó 2011 Australian Society for Parasitology Inc. Published by Elsevier Ltd. All rights reserved. doi:10.1016/j.ijpara.2010.12.012 ⇑ Corresponding author. Tel.: +44 (0) 1865 281 987. E-mail address: [email protected] (P.A. Hancock). 1 Present address: Department of Zoology, University of Oxford, South Parks Road, Oxford OX1 3PS, UK International Journal for Parasitology 41 (2011) 513–522 Contents lists available at ScienceDirect International Journal for Parasitology journal homepage: www.elsevier.com/locate/ijpara

Welcome message from author
This document is posted to help you gain knowledge. Please leave a comment to let me know what you think about it! Share it to your friends and learn new things together.
Transcript
International Journal for Parasitology 41 (2011) 513–522
Contents lists available at ScienceDirect
International Journal for Parasitology
journal homepage: www.elsevier .com/locate / i jpara
Modelling the effect of temperature variation on the seasonal dynamics ofIxodes ricinus tick populations
Penelope A. Hancock a,1,⇑, Robert Brackley a, Stephen C.F. Palmer b
a Centre for Population Biology, Imperial College London, Silwood Park Campus, Ascot, Berkshire SL5 7PY, UKb Institute of Biological and Environmental Sciences, University of Aberdeen, Zoology Building, Tillydrone Avenue, Aberdeen AB24 2TZ, UK
a r t i c l e i n f o a b s t r a c t
Article history:Received 9 October 2010Received in revised form 3 December 2010Accepted 5 December 2010Available online 2 February 2011
Keywords:Ixodes ricinusTickAge-structured modelPopulation dynamicsVector-borne diseaseTemperature-dependent developmentGlobal warming
0020-7519/$36.00 � 2011 Australian Society for Paradoi:10.1016/j.ijpara.2010.12.012
⇑ Corresponding author. Tel.: +44 (0) 1865 281 987E-mail address: [email protected] (P
1 Present address: Department of Zoology, UniversityOxford OX1 3PS, UK
Seasonal variation in temperature is known to drive annual patterns of tick activity and can influence thedynamics of tick-borne diseases. An age-structured model of the dynamics of Ixodes ricinus populationswas developed to explore how changes in average temperature and different levels of temperature var-iability affect seasonal patterns of tick activity and the transmission of tick-borne diseases. The modelproduced seasonal patterns of tick emergence that are consistent with those observed throughout GreatBritain. Varying average temperature across a continuous spectrum produced a systematic pattern in thetimes of peak emergence of questing ticks which depends on cumulative temperature over the year.Examination of the effects of between-year stochastic temperature variation on this pattern indicatedthat peak emergence times are more strongly affected by temperature stochasticity at certain levels ofaverage temperature. Finally the model was extended to give a simple representation of the dynamicsof a tick-borne disease. A threshold level of annual cumulative temperature was identified at which dis-ease persistence is sensitive to stochastic temperature variation. In conclusion, the effect of changing pat-terns of temperature variation on the dynamics of I. ricinus ticks and the diseases they transmit maydepend on the cumulative temperature over the year and will therefore vary across different locations.The results also indicate that diapause mechanisms have an important influence on seasonal patternsof tick activity and require further study.
� 2011 Australian Society for Parasitology Inc. Published by Elsevier Ltd. All rights reserved.
1. Introduction
The epidemiology of vector-borne diseases is sensitive to pat-terns of temperature and temperature variation (Pascual et al.,2006; Ogden et al., 2007; Estrada-Peña, 2009; Lafferty, 2009;Paaijmans et al., 2009). Tick-borne disease dynamics are particu-larly influenced by changing environmental conditions, especiallyvariation in temperature (Randolph and Rogers, 2000; Ogdenet al., 2007, 2008), because ticks have a long lifecycle and developthrough multiple stages at a rate that is temperature dependent(MacLeod, 1932). Therefore, spatial and temporal variation in theabundance of tick populations shows a strong association withtemperature, as well as vegetation type, humidity and soil watercontent (Randolph, 1997; Walker, 2001; Cadenas et al., 2007;Schwarz et al., 2009). The dynamics of temperate tick populationssuch as Ixodes ricinus and Ixodes scapularis are highly seasonal,because temperatures are too low during the colder months ofthe year to allow interstadial development and questing activity
sitology Inc. Published by Elsevier
..A. Hancock).
of Oxford, South Parks Road,
(Randolph, 2004; Ogden et al., 2005). For example, the annualabundance distribution of questing tick populations in Europeand North America is typically concentrated in a small number ofstrong peaks that occur during the warmer part of the year (Gray,1982; Walker, 2001; Randolph et al., 2002; Estrada-Peña et al.,2004; Ogden et al., 2005; Cadenas et al., 2007; Schwarz et al.,2009). The timing of the peaks varies between the different lifecy-cle stages, and the abundance of questing I. ricinus nymphs andadults often peaks in spring and autumn but not in summer (thewarmest part of the year), while larvae are more likely to show asingle mid-year peak in questing activity (Gray, 1982; Randolphet al., 2002; Estrada-Peña et al., 2004; Jouda et al., 2004; Schwarzet al., 2009).
Tick-borne diseases such as tick-borne encephalitis, Lyme bor-reliosis, louping ill and tick pyaemia persist due to transmissionof the pathogen between tick lifecycle stages, whereby larvaeand nymphs contract the disease by feeding on infectious hostsand then transmit the disease to susceptible hosts during subse-quent blood meals as nymphs or adults. The temporal dynamicsof different tick lifecycle stages, and how they depend on the cli-matic conditions to which the population is exposed, are thereforecritical determinants of the patterns of disease outbreak. In partic-ular, disease transmission is more likely to persist in environments
Ltd. All rights reserved.
514 P.A. Hancock et al. / International Journal for Parasitology 41 (2011) 513–522
in which the dynamics of the different active lifecycle stages arehighly synchronous, especially for diseases that cause a brief peri-od of host infectivity (Randolph et al., 2000; Laurenson et al., 2003;Ogden et al., 2008). The availability of susceptible hosts that arecapable of transmitting the pathogen is also important to diseasepersistence, and the epidemiology of tick-borne diseases is typi-cally complex and dependent on multiple host species (LoGiudiceet al., 2003; Brunner and Ostfeld, 2008; Keesing et al., 2009).
Models of the seasonal dynamics of tick populations have beendeveloped for a number of tick species in tropical and temperateenvironments (Gardiner et al., 1983; Randolph, 1997; Ogdenet al., 2005). To represent observed seasonal patterns accurately,the tick lifecycle must be modelled in considerable detail, dividingthe population into stages of eggs, larvae, nymphs and adults, andallowing the rate at which ticks develop from one stage to the nextto depend on temperature. Important determinants of the seasonalpatterns generated include the rate of temperature-dependentdevelopment, the assumptions made about density-dependentand density-independent mortality occurring in each lifecyclestage, the rate at which questing ticks find hosts, and the extentto which tick development and activity are delayed as a result ofdiapause (Gardiner et al., 1983; Randolph, 1997; Ogden et al.,2005).
Several studies suggest that that a process known as morphoge-netic diapause (Belozerov and Naumov, 2002), whereby the inter-stadial development of tick lifecycle stages that become engorgedrelatively late in the year is delayed until the following year whentemperatures start to increase, plays a large role in determining theseasonal patterns of questing tick abundance (Gardiner et al.,1983; Walker, 2001; Randolph, 2004; Sonenshine, 2005; Gray,2008). Similarly, behavioural diapause, whereby there is a delaybetween emergence and questing activity (Gray, 1982; Belozerovand Naumov, 2002; Randolph et al., 2002) is also thought to havea significant influence on seasonal tick dynamics (Walker, 2001;Randolph, 2004; Gray, 2008). Both models and field observationsshow that there is generally a greater degree of temporal overlapin the questing and feeding times of larvae, nymphs and adultsof temperate tick populations than in those of tropical populations(Randolph et al., 2002; Randolph, 2004). In temperate environ-ments, temperatures are not usually warm enough to allow pro-gression through more than one lifecycle stage in a given year,and diapause acts to synchronise the onset of interstadial develop-ment and the time of emergence across the different lifecyclestages (Randolph, 2004). However the process of diapause, includ-ing its timing of onset, how long it lasts, and how it varies betweendifferent lifecycle stages and in different environments, is not wellunderstood (Randolph and Rogers, 1997; Estrada-Peña et al., 2004;Randolph, 2004; Gray, 2008).
Warmer temperatures allow shorter interstadial developmenttimes and this can give rise to higher tick population abundance(Jouda et al., 2004; Schwarz et al., 2009; Gilbert, 2010). On theother hand conditions may be less favourable when temperaturesare warmer leading to higher tick mortality, particularly as ticksare highly sensitive to desiccation (Cadenas et al., 2007). Moreover,whether higher temperature is associated with an increase in therisk of tick-borne disease depends on how increases in tempera-ture affect the seasonal patterns of tick abundance and the degreeof overlap in the times at which the different lifecycle stages areactive (Randolph and Rogers, 2000; Ogden et al., 2008).
In this study an age-structured model of tick populationdynamics was developed to explore the seasonal dynamics of I. ric-inus populations over a range of temperature conditions. As a casestudy, a pattern of annual temperature variation similar to that ob-served in north-eastern Scotland was modelled. The model wasused to explore how seasonal patterns in the abundance of differ-ent tick active life stages vary with differences in mean tempera-
ture and temperature variability. Finally, a simple susceptible-infectious-recovered (SIR) model of the dynamics of a tick-bornedisease in a single host population was applied to explore theimplications of temperature-driven changes in I. ricinus activitypatterns for disease persistence.
2. Materials and methods
The model represented the I. ricinus lifecycle using a similar ap-proach to that developed for other tick species by Randolph andRogers (1997) and Ogden et al. (2005) (see SupplementaryFig. S1). All stages of the lifecycle were considered, namely eggs,larvae, nymphs and adults, as well as the progression of an individ-ual within each of these stages, for example questing, feeding andinterstadial development. The rate of interstadial development wasassumed to depend on temperature (Randolph, 2004). The follow-ing sections describe firstly the model of temperature-dependentdevelopment which demonstrates how the time taken for intersta-dial development can vary for tick stages that complete develop-ment and emerge at different times of year. Secondly thepopulation dynamic model used to estimate how the abundanceof the cohorts of each life stage varies with time is presented. Final-ly, the model was extended to give a simple representation of thetransmission of a tick-borne disease. All model parameters are gi-ven in Table 1.
2.1. Modelling temperature-dependent development
The durations of the lifecycle stages during which the develop-ment rate is temperature-dependent, including eggs developinginto larvae, engorged larvae developing into nymphs, engorgednymphs developing into adults and engorged adults producingeggs (see Supplementary Fig. S1) were estimated using the de-gree-week accumulation model (Tuljapurkar and Caswell, 1997).This approximates the development rate of each life stage by anincreasing function of temperature, and the total developmenttime is determined by the cumulative temperature to which ticksare exposed during the development period. For each developmen-tal stage, the weekly development rate, f(T), was represented as afunction of the mean temperature in a given week, T, by multiply-ing by 7 the daily development rate functions given in Randolphet al. (2002) which were fitted to data on Scottish I. ricinus ticks(Campbell (1948). The life history and development of the sheeptick I. ricinus in Scotland, under natural and controlled conditions.Ph.D., University of Edinburgh, UK). These functions are of the formf ðTÞ ¼ aT2 þ bT þ c where a, b and c are constants (Table 1). The va-lue of f(T) is the proportion of the total development of the lifecyclestage that occurs in a given week. Following Randolph et al. (2002),it was assumed that the development rate is independent of thetime of year that the tick life stage begins development and thatdevelopment stops below a certain threshold temperature T0, sothat f ðT 6 T0Þ ¼ 0 (Table 1). For a tick life stage that completesdevelopment and emerges at week wi, the time at which it begandevelopment, wj, is given by solving
Xwj
w¼wj
f ðTwÞ ¼ 1 ð1Þ
where Tw is the mean temperature for week w and the duration ofinterstadial development is wi � wj.
2.2. Temperature data for study locations
Patterns of annual variation in weekly temperature similar tothose observed in Braemar, north-eastern Scotland (57� 00 N, 3�240 W) were used to estimate tick development rates. This site

Table 1Parameters used in the model of the effect of temperature variation on the seasonal dynamics of Ixodes Ricinus.
Symbol Definition Value
a, b, c, T0 Parameters determining the form of the temperature-dependent development rate function f ðTÞ (see text)Eggs developing into larvae �0.00001, 0.002, �0.019, 8.4Larvae developing into nymphs 0.00003, 0.00073, �0.007, 7.4Nymphs developing into adults �0.000008, 0.0019, �0.016, 8.7Engorged adults producing eggs 0.0001, 0.01, -0.062, 8.7
tE Duration of the oviposition period 1 (week)tHL, tHN, tHA Duration of the larval, nymphal and adult hardening periods 3 (week)tFL, tFN, tFA Duration of larval, nymphal and adult feeding periods 1 (week)tQL, tQN, tQA Maximum duration of larval, nymphal and adult questing periods 8, 12, 16 (week)sI Weekly survival probability during interstadial development
Eggs developing into larvae 0.98Larvae developing into nymphs 0.98Nymphs developing into adults 0.99Engorged adults producing eggs 0.99
sHL, sHN, sHA Weekly survival probability during larval, nymphal and adult hardening 0.96sQL, sQN, sQA Weekly survival probability of questing larvae, nymphs and adults 0.9, 0.8, 0.8a, b Parameters determining the form of density-dependent mortality of feeding tick life-stages (see text) 0.5, 0.049k0, aF, bF Parameters determining the form of density-dependent fecundity of egg-laying adults (see text) 3000, 0.01, 0.04pL, pN, pA Weekly host-finding probability for questing larvae, nymphs and adults 0.03, 0.3, 0.3q Proportion of ticks that feed after July that undergo diapause 0.8Tq Temperature below which questing ticks are not active 7 (�C)H Number of hosts 30TI Duration of host infectivity 0.5 (week)
0
0.02
0.04
0.06
0.08
0.1
Wee
kly
deve
lopm
ent r
ate
Time of yearJ F M A J J A S O N DM
Fig. 1. Weekly development rate for engorged Ixodes ricinus larvae at differenttimes of year at Braemar, north-eastern Scotland. The solid line shows thedevelopment rates calculated using 49 year mean weekly temperature and thedashed line shows the development rates calculated from weekly temperaturesgenerated from normal random variation about the 49 year weekly mean with astandard deviation of 2 �C.
0
20
40
60
80
100
120
Dev
elop
men
t tim
e (w
eeks
)
Time of emergence
EL
N
EA
J F M A J J A S O N DM
Fig. 2. Development time for Ixodes ricinus life stages that complete development atdifferent times of year, where weekly temperatures are equal to the long-termweekly mean for Braemar, north-east Scotland. Lines show the temperature-dependent development stages, E = eggs developing into larvae, L = engorged larvaedeveloping into nymphs, N = engorged nymphs developing into adults, EA = en-gorged adults producing eggs. Dashed lines show times of year at which nodevelopment takes place.
P.A. Hancock et al. / International Journal for Parasitology 41 (2011) 513–522 515
was chosen owing to its proximity to areas that experience fre-quent outbreaks of louping ill, a viral disease transmitted by I. ric-inus, which causes high mortality in hill-farmed sheep populationsand in red grouse, Lagopus lagopus scoticus, an economically impor-tant game species (Laurenson et al., 2003). Weekly mean air tem-perature estimates for Braemar were obtained by cubic splineinterpolation of the 49 year monthly mean air temperature dataobtained from the UK Meteorological Office (http://www.metoffice.gov.uk).
For the purpose of validating the model, an average annualweekly mean temperature profile similar to that observed inCwmystwyth, Wales (52� 40 N, 3� 500 W) was used, again by inter-polating the long-term monthly mean data obtained from the UKMeteorological Office. This location is 30 km from the field siteused by Randolph et al. (2002), and in the results section we com-pare seasonal patterns of tick activity generated for the Cwmyst-wyth temperatures with those observed by Randolph et al. (2002).
For the Braemar study site, Fig. 1 shows the weekly develop-ment rate of engorged larvae at different times of year. The devel-opment rate profile is bell-shaped, rising to a peak at the warmesttime of year, and dropping to zero in the coldest times when tem-peratures are too low to allow development. Note that these devel-opment rate estimates may be higher than those obtained if soiltemperature measurements had been used (Randolph, 2004). Theeffect of incrementing the mean temperature on tick populationdynamics was examined by shifting the Braemar temperature pro-file, assuming that in each week of the year the mean temperaturechanged by an amount DT �C which was the same for all weeks.Normal random variation was also added to the weekly mean tem-perature, which generated considerable variation in the weeklydevelopment rates (Fig. 1), and the effect of such stochasticity ontick population dynamics was examined, as discussed inSection 2.3.3.
516 P.A. Hancock et al. / International Journal for Parasitology 41 (2011) 513–522
Fig. 2 shows the duration of interstadial development as a func-tion of the time of year that the stage completes development andemerges given the weekly mean temperature profile for Braemar.For each life stage, ticks that emerge earlier in the year have takena considerably longer time to develop than those that emerge later,when the development period is shorter by at least half a year(Fig. 2). This is because the ticks that emerge earlier in the yearspent an extra winter in development, during which temperatures,and therefore tick development rates, are very low. At a certainpoint in the warmer part of the year there is a sharp drop in devel-opment times for a given tick life-stage (Fig. 2). At this point en-ough degree days have accumulated to allow all ticks with longerdevelopment periods to complete development and emerge, andticks that emerge later in the year have completed shorter develop-ment periods. However this shorter development cycle may not berealised due to the onset of diapause causing a delay in the start ofinterstadial development, as discussed in Section 2.3.2.
2.3. Modelling tick population dynamics
To predict the number of ticks of a given life stage present ateach week of the year, an age-structured matrix model that tracksthe survival and development of each weekly cohort of ticksthrough the lifecycle stages was developed (see SupplementaryFig. S1). The model is similar to those developed for North Ameri-can I. scapularis by Ogden et al. (2005) and for African Rhipicephalusappendiculatus by Randolph and Rogers (1997). As explained inSection 2.3.3, the model can track interannual stochastic variationin weekly temperature, allowing every cohort of ticks to experi-ence different temperature conditions throughout their lifetime.
Parameter values for the model were obtained using data fromthe literature on the demographic rates and host-finding probabil-ities of I. ricinus, where available (Table 1; see SupplementaryTable S1 for the data sources used). Throughout the periods ofinterstadial development, including eggs developing into larvae,engorged larvae developing into nymphs, engorged nymphs devel-oping into adults and engorged adults producing eggs, the weeklysurvival probability was assumed to be constant. Therefore the to-tal survival for each interstadial period depends on the develop-ment time, which is a function of the cumulative temperature asdefined above. Each subsequent hardening phase was assumed tobe of fixed duration, throughout which the survival probabilitywas set to a constant value. Questing ticks were assigned a weeklyprobability of surviving and either finding a host or not finding ahost. The amount of time individual ticks spend questing is there-fore variable, but for each questing life-stage (larvae, nymphs,adults) there was assumed to be a maximum amount of time thatquesting could last before energy reserves became exhausted andthe tick died. An effect of temperature on the weekly host findingprobability was also incorporated, in accordance with observationsof I. ricinus for which questing activity ceases in colder tempera-tures (Randolph, 2004; Gilbert, 2010). Following Ogden et al.(2005) and Randolph et al. (2002), if the temperature for a givenweek fell below a certain threshold, questing ticks had zero prob-ability of finding a host.
2.3.1. Density-dependent mortalityTick survival has been shown to be strongly related to tick den-
sity (Randolph, 1994a, b). Density-dependent tick mortality mayoccur when ticks are feeding on the host, owing to acquired hostresistance (Randolph, 1994b) and grooming by the host (Ogdenet al., 2005). This may also result in a density-dependent reductionin fecundity (Ogden et al., 2005). The model of Ogden et al. (2005)was used to estimate density-dependent mortality and fecundityof feeding ticks. For example, the weekly probability of mortalityof feeding larvae in week w;lw
LF , is given by
lwLF ¼ aþ b ln ð1:01þ zw
LFÞ=H� �
ð2Þ
where H is the number of hosts, zwLF is the number of feeding larvae
in week w and a and b are constants (Table 1). Mortalities of feedingnymphs and adults were calculated in a similar way. The fecundityof egg-laying adults, k, was reduced by a factor that depended ondensity, and is given by
k ¼ k0 1� aF þ bF lnðð1:01þ zwELAÞ=HÞ
� �� �ð3Þ
where zwELA is the number of egg-laying adults in week w and k0, aF
and bF are constants (Table 1).
2.3.2. DiapauseThere is evidence that, in order to adapt to the seasonal varia-
tion of temperate climates, ticks regularly undergo periods of dia-pause, during which their rate of development is greatly reduced(Belozerov and Naumov, 2002; Randolph et al., 2002; Randolph,2004; Ogden et al., 2005; Sonenshine, 2005). Diapause is thoughtto be triggered by shortening day length experienced during thequesting stage. Ticks that feed later than July have been observedto delay the onset of interstadial development until temperaturesreach freezing point, ensuring that any significant developmentdoes not begin until the following year. This condition was incor-porated into the model by specifying that a certain fraction, q, ofquesting larvae, nymphs and adults that obtain a blood meal inthe months August–December delay the onset of interstadialdevelopment until the first day of the following year (Table 1).
2.3.3. Stochastic temperature variationBased on the life-history processes detailed above, the model
used to estimate the weekly abundance of ticks in each life stageis of the form
zwþ1 ¼ Awzw w ¼ 1; . . . ;W ð4Þ
where zw is a vector containing the number of ticks in each age classin week w, and there are W weeks in the total time period of thesimulation. The weekly transition matrix Aw is N � 1 by N, whereN is the total number of age classes. This matrix consists of ele-ments Aw
n;nþk, which are the probabilities of ticks moving fromage-class n to age-class n + k in week w. For example, ticks in age-class n that survive and remain in the same life cycle stage moveto class n + 1 in a weekly transition, whereas those that completethe current life cycle stage move to the first age class of the nextstage. In contrast to previous age-structured models of tick popula-tion abundance (Randolph et al., 2002; Ogden et al., 2005), the tran-sition matrix Aw for a given week of the year differs for each yeardue to interannual stochastic temperature variation, applied as nor-mal random variation about the long-term weekly mean tempera-ture with standard deviation r. The model keeps track of thedevelopment time lags over a series of years to generate seasonalpatterns in tick abundance that reflect interannual temperaturevariation.
2.4. The effect of temperature variation on disease persistence
Ixodes ricinus transmits a number of medically and economi-cally important diseases including tick-borne encephalitis, Lymeborreliosis and louping ill. A generic SIR model of the diseasedynamics in the host population was incorporated, which is repre-sentative of the basic transmission process of a range of tick-bornediseases. The effect of varying patterns in the annual distribution ofquesting tick abundance, resulting from changes in mean temper-ature and temperature variability, on the persistence the diseasewas explored.
The host population was divided into categories of susceptibleindividuals that can become infected once bitten by an infectious
0.05
0
0.04
0.03
0.02
0.01
0.08
0.06
0.04
0.02
0
0.25
0
0.2
0.15
0.1
0.05
J F M A J J A S O N DM J F M A J J A S O N DM
J F M A J J A S O N DM J F M A J J A S O N DM
J F M A J J A S O N DM J F M A J J A S O N DMMonth
Rel
ativ
e ab
unda
nce
of q
uest
ing
stag
e
A
B
C
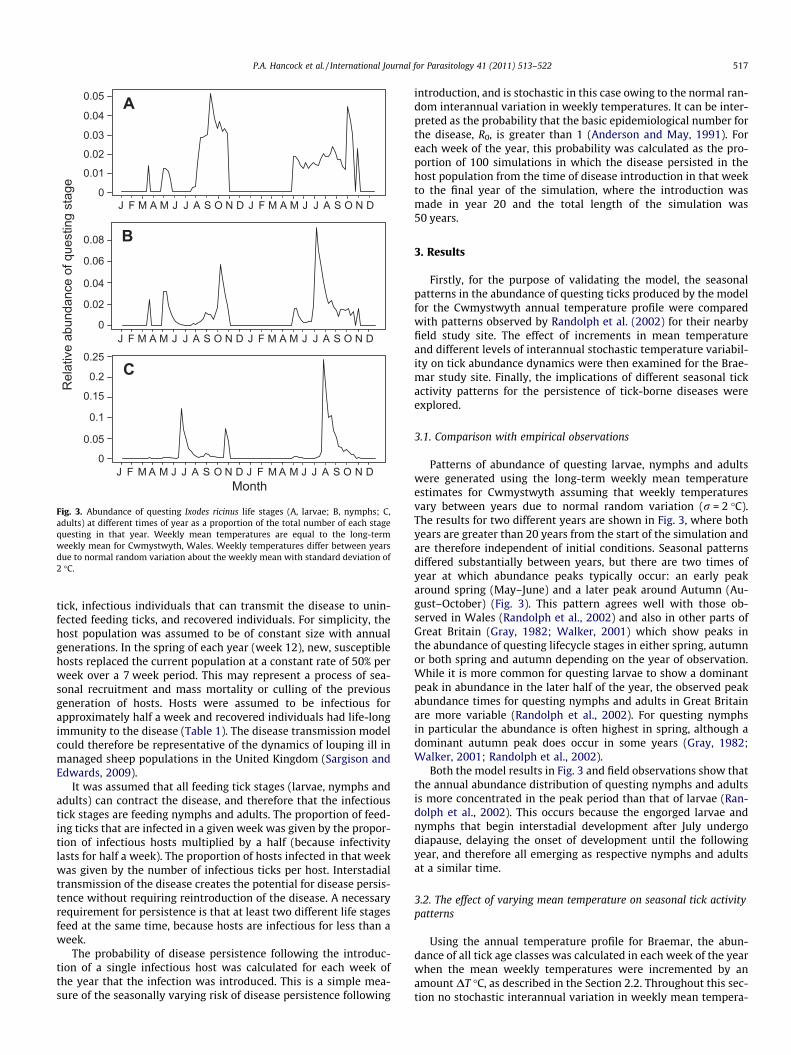
Fig. 3. Abundance of questing Ixodes ricinus life stages (A, larvae; B, nymphs; C,adults) at different times of year as a proportion of the total number of each stagequesting in that year. Weekly mean temperatures are equal to the long-termweekly mean for Cwmystwyth, Wales. Weekly temperatures differ between yearsdue to normal random variation about the weekly mean with standard deviation of2 �C.
P.A. Hancock et al. / International Journal for Parasitology 41 (2011) 513–522 517
tick, infectious individuals that can transmit the disease to unin-fected feeding ticks, and recovered individuals. For simplicity, thehost population was assumed to be of constant size with annualgenerations. In the spring of each year (week 12), new, susceptiblehosts replaced the current population at a constant rate of 50% perweek over a 7 week period. This may represent a process of sea-sonal recruitment and mass mortality or culling of the previousgeneration of hosts. Hosts were assumed to be infectious forapproximately half a week and recovered individuals had life-longimmunity to the disease (Table 1). The disease transmission modelcould therefore be representative of the dynamics of louping ill inmanaged sheep populations in the United Kingdom (Sargison andEdwards, 2009).
It was assumed that all feeding tick stages (larvae, nymphs andadults) can contract the disease, and therefore that the infectioustick stages are feeding nymphs and adults. The proportion of feed-ing ticks that are infected in a given week was given by the propor-tion of infectious hosts multiplied by a half (because infectivitylasts for half a week). The proportion of hosts infected in that weekwas given by the number of infectious ticks per host. Interstadialtransmission of the disease creates the potential for disease persis-tence without requiring reintroduction of the disease. A necessaryrequirement for persistence is that at least two different life stagesfeed at the same time, because hosts are infectious for less than aweek.
The probability of disease persistence following the introduc-tion of a single infectious host was calculated for each week ofthe year that the infection was introduced. This is a simple mea-sure of the seasonally varying risk of disease persistence following
introduction, and is stochastic in this case owing to the normal ran-dom interannual variation in weekly temperatures. It can be inter-preted as the probability that the basic epidemiological number forthe disease, R0, is greater than 1 (Anderson and May, 1991). Foreach week of the year, this probability was calculated as the pro-portion of 100 simulations in which the disease persisted in thehost population from the time of disease introduction in that weekto the final year of the simulation, where the introduction wasmade in year 20 and the total length of the simulation was50 years.
3. Results
Firstly, for the purpose of validating the model, the seasonalpatterns in the abundance of questing ticks produced by the modelfor the Cwmystwyth annual temperature profile were comparedwith patterns observed by Randolph et al. (2002) for their nearbyfield study site. The effect of increments in mean temperatureand different levels of interannual stochastic temperature variabil-ity on tick abundance dynamics were then examined for the Brae-mar study site. Finally, the implications of different seasonal tickactivity patterns for the persistence of tick-borne diseases wereexplored.
3.1. Comparison with empirical observations
Patterns of abundance of questing larvae, nymphs and adultswere generated using the long-term weekly mean temperatureestimates for Cwmystwyth assuming that weekly temperaturesvary between years due to normal random variation (r = 2 �C).The results for two different years are shown in Fig. 3, where bothyears are greater than 20 years from the start of the simulation andare therefore independent of initial conditions. Seasonal patternsdiffered substantially between years, but there are two times ofyear at which abundance peaks typically occur: an early peakaround spring (May–June) and a later peak around Autumn (Au-gust–October) (Fig. 3). This pattern agrees well with those ob-served in Wales (Randolph et al., 2002) and also in other parts ofGreat Britain (Gray, 1982; Walker, 2001) which show peaks inthe abundance of questing lifecycle stages in either spring, autumnor both spring and autumn depending on the year of observation.While it is more common for questing larvae to show a dominantpeak in abundance in the later half of the year, the observed peakabundance times for questing nymphs and adults in Great Britainare more variable (Randolph et al., 2002). For questing nymphsin particular the abundance is often highest in spring, although adominant autumn peak does occur in some years (Gray, 1982;Walker, 2001; Randolph et al., 2002).
Both the model results in Fig. 3 and field observations show thatthe annual abundance distribution of questing nymphs and adultsis more concentrated in the peak period than that of larvae (Ran-dolph et al., 2002). This occurs because the engorged larvae andnymphs that begin interstadial development after July undergodiapause, delaying the onset of development until the followingyear, and therefore all emerging as respective nymphs and adultsat a similar time.
3.2. The effect of varying mean temperature on seasonal tick activitypatterns
Using the annual temperature profile for Braemar, the abun-dance of all tick age classes was calculated in each week of the yearwhen the mean weekly temperatures were incremented by anamount DT �C, as described in the Section 2.2. Throughout this sec-tion no stochastic interannual variation in weekly mean tempera-

0.05
0.1
0.15
0.2
0.25
0.3
-1
0
1
2
3
4
5
Diff
eren
ce b
etw
een
mea
n te
mpe
ratu
re a
nd th
e Br
aem
ar m
ean
(deg
rees
/wee
k)
J F M A J J A S O N DMTime of year
Proportionalabundance
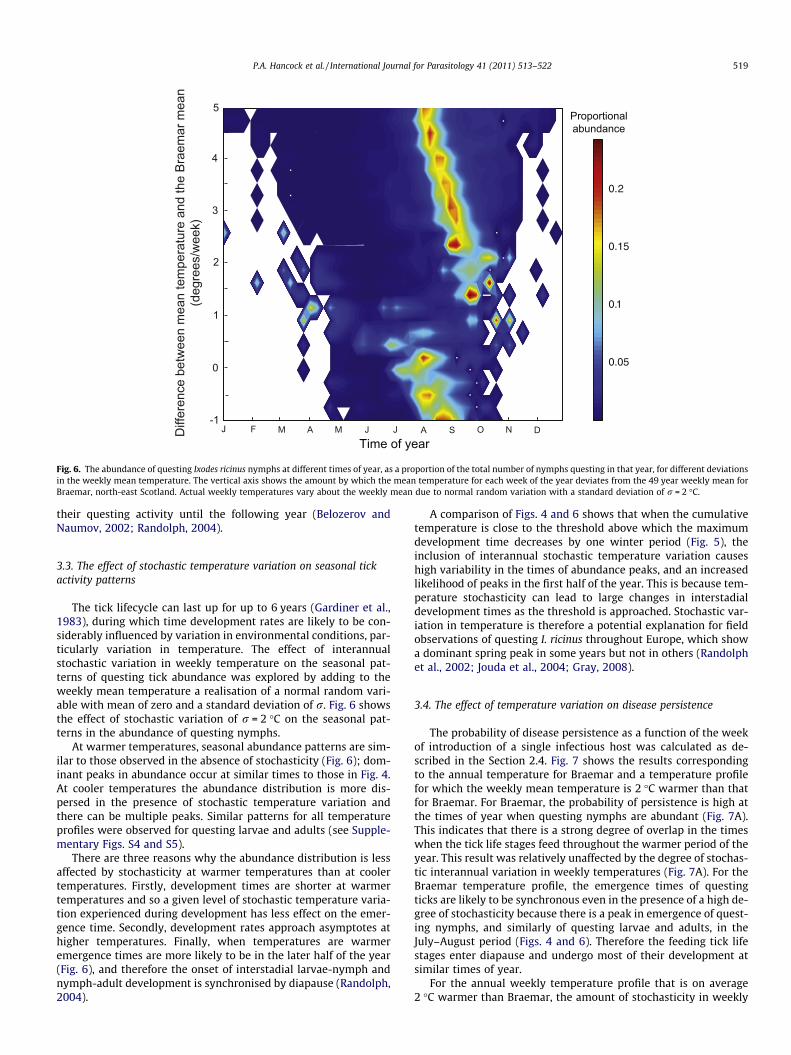
Fig. 4. The abundance of questing Ixodes ricinus nymphs at different times of year, as a proportion of the total number of nymphs questing in that year, for different deviationsin the weekly mean temperature. The vertical axis shows the amount by which the temperature for each week of the year deviates from the 49 year weekly mean for Braemar,north-east Scotland.
0
20
40
60
80
100
120
Time of emergence
Dev
elop
men
t tim
e (w
eeks
)
-1
-0.50
+0.5
+1+1.5
+2+2.5
+5. . .. . .
J F M A J J A S O N DM
Fig. 5. Time for engorged Ixodes ricinus larvae to complete development andemerge as nymphs at different times of year, for different deviations in the weeklymean temperature. Line labels indicate the amount by which the temperature foreach week of the year differs from the 49 year weekly mean for Braemar, north-eastScotland. Dashed lines show times of year at which no development takes place.
518 P.A. Hancock et al. / International Journal for Parasitology 41 (2011) 513–522
ture was applied (r = 0). Fig. 4 shows the seasonal pattern of theabundance of questing nymphs generated by allowing the modelto converge to its equilibrium. At each temperature profile acrossa 6 �C range there is a dominant peak in abundance at a certaintime of year. This agrees with empirical evidence that a single co-hort of each life stage of I. ricinus is recruited each year (Randolphet al., 2002). As the mean temperature increases, the time of year atwhich this peak occurs varies in a systematic way, ranging fromthe earliest peak in April to the latest in November (Fig. 4). Similarpatterns were produced for the abundances of questing larvae andadults (see Supplementary Figs. S2 and S3). This is because the pre-dicted development times for ticks emerging from interstadialdevelopment at any given time of year are similar for emerging lar-vae, nymphs and adults (Fig. 2).
The variation in the timing of the abundance peak can be ex-plained by the annual pattern of interstadial development times(for engorged larvae developing into nymphs) for the differenttemperature profiles (Fig. 5). For a given mean temperature profile,the position of the abundance peak corresponds to the time of yearthat development times switch from the longer cycle to the shortercycle (Fig. 5). At this time, all developing nymphs that are on thelonger cycle of development complete their development andemerge. As the mean temperature increases, development timesbecome shorter and ticks on the longer development cycle emergeearlier in the year. This general pattern is consistent with observa-tions of questing nymphs (and adults) in western Great Britain,which show that newly emerged questing ticks appeared some-time around autumn (August–October), and that they appearedearlier in the year at a warmer, southern site compared with acooler site further north (Randolph et al., 2002).
When mean temperature rises above a certain threshold, thereare enough degree days in a given year to shorten the maximumdevelopment time by one over-winter period (Fig. 5). The time ofthe peak in abundance of questing nymphs switches from early
in the year (April–May) to late in the year (September–October)as this threshold is exceeded (Fig. 4). For all temperature profiles,there is a subsidiary peak in abundance early in the warm part ofthe year, occurring around May for cooler temperatures and inMarch for warmer temperatures. This corresponds to the time ofyear at which temperatures become warm enough for unfed,questing ticks to become active. Field observations indicate thatthe abundance at this time is often higher than the abundance peakthat occurs at the time that the ticks emerge, especially for quest-ing nymphs and adults. This may be because ticks that emerge inthe later part of the year undergo behavioural diapause, delaying
0.05
0.1
0.15
0.2
-1
0
1
2
3
4
5
Diff
eren
ce b
etw
een
mea
n te
mpe
ratu
re a
nd th
e Br
aem
ar m
ean
(deg
rees
/wee
k)
J F M A J J A S O N DMTime of year
Proportionalabundance
Fig. 6. The abundance of questing Ixodes ricinus nymphs at different times of year, as a proportion of the total number of nymphs questing in that year, for different deviationsin the weekly mean temperature. The vertical axis shows the amount by which the mean temperature for each week of the year deviates from the 49 year weekly mean forBraemar, north-east Scotland. Actual weekly temperatures vary about the weekly mean due to normal random variation with a standard deviation of r = 2 �C.
P.A. Hancock et al. / International Journal for Parasitology 41 (2011) 513–522 519
their questing activity until the following year (Belozerov andNaumov, 2002; Randolph, 2004).
3.3. The effect of stochastic temperature variation on seasonal tickactivity patterns
The tick lifecycle can last up for up to 6 years (Gardiner et al.,1983), during which time development rates are likely to be con-siderably influenced by variation in environmental conditions, par-ticularly variation in temperature. The effect of interannualstochastic variation in weekly temperature on the seasonal pat-terns of questing tick abundance was explored by adding to theweekly mean temperature a realisation of a normal random vari-able with mean of zero and a standard deviation of r. Fig. 6 showsthe effect of stochastic variation of r = 2 �C on the seasonal pat-terns in the abundance of questing nymphs.
At warmer temperatures, seasonal abundance patterns are sim-ilar to those observed in the absence of stochasticity (Fig. 6); dom-inant peaks in abundance occur at similar times to those in Fig. 4.At cooler temperatures the abundance distribution is more dis-persed in the presence of stochastic temperature variation andthere can be multiple peaks. Similar patterns for all temperatureprofiles were observed for questing larvae and adults (see Supple-mentary Figs. S4 and S5).
There are three reasons why the abundance distribution is lessaffected by stochasticity at warmer temperatures than at coolertemperatures. Firstly, development times are shorter at warmertemperatures and so a given level of stochastic temperature varia-tion experienced during development has less effect on the emer-gence time. Secondly, development rates approach asymptotes athigher temperatures. Finally, when temperatures are warmeremergence times are more likely to be in the later half of the year(Fig. 6), and therefore the onset of interstadial larvae-nymph andnymph-adult development is synchronised by diapause (Randolph,2004).
A comparison of Figs. 4 and 6 shows that when the cumulativetemperature is close to the threshold above which the maximumdevelopment time decreases by one winter period (Fig. 5), theinclusion of interannual stochastic temperature variation causeshigh variability in the times of abundance peaks, and an increasedlikelihood of peaks in the first half of the year. This is because tem-perature stochasticity can lead to large changes in interstadialdevelopment times as the threshold is approached. Stochastic var-iation in temperature is therefore a potential explanation for fieldobservations of questing I. ricinus throughout Europe, which showa dominant spring peak in some years but not in others (Randolphet al., 2002; Jouda et al., 2004; Gray, 2008).
3.4. The effect of temperature variation on disease persistence
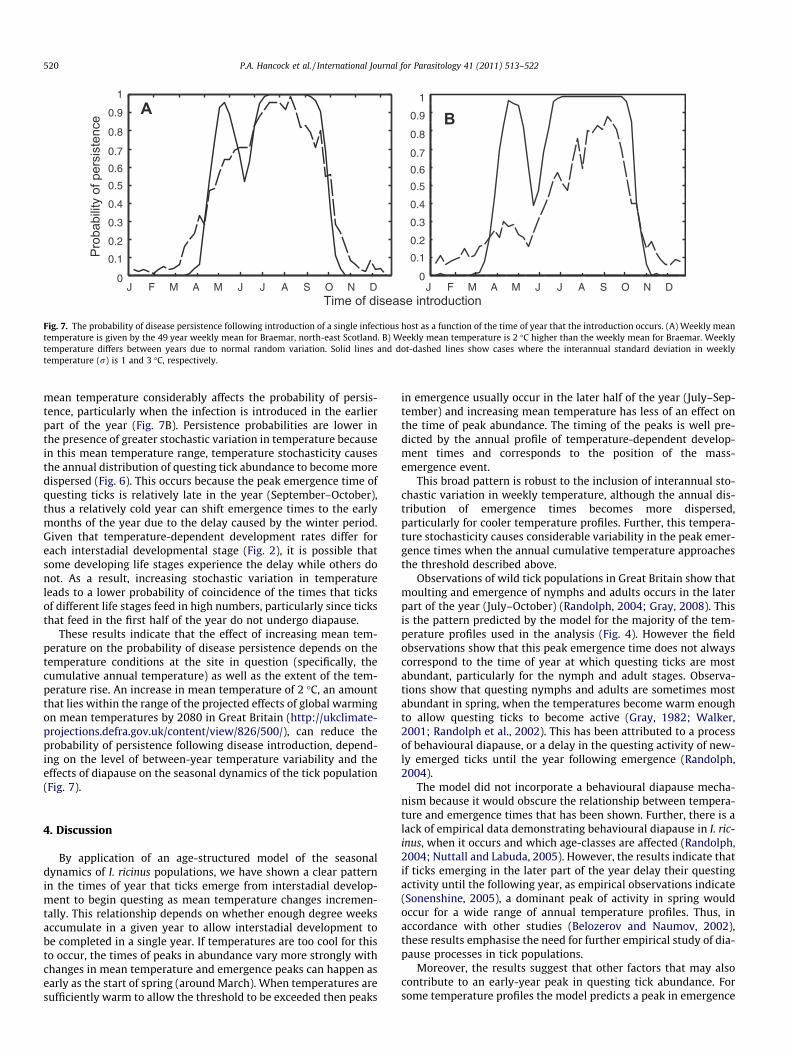
The probability of disease persistence as a function of the weekof introduction of a single infectious host was calculated as de-scribed in the Section 2.4. Fig. 7 shows the results correspondingto the annual temperature for Braemar and a temperature profilefor which the weekly mean temperature is 2 �C warmer than thatfor Braemar. For Braemar, the probability of persistence is high atthe times of year when questing nymphs are abundant (Fig. 7A).This indicates that there is a strong degree of overlap in the timeswhen the tick life stages feed throughout the warmer period of theyear. This result was relatively unaffected by the degree of stochas-tic interannual variation in weekly temperatures (Fig. 7A). For theBraemar temperature profile, the emergence times of questingticks are likely to be synchronous even in the presence of a high de-gree of stochasticity because there is a peak in emergence of quest-ing nymphs, and similarly of questing larvae and adults, in theJuly–August period (Figs. 4 and 6). Therefore the feeding tick lifestages enter diapause and undergo most of their development atsimilar times of year.
For the annual weekly temperature profile that is on average2 �C warmer than Braemar, the amount of stochasticity in weekly
0
0.1
0.2
0.3
0.4
0.5
0.6
0.7
0.8
0.9
1
F M A J J A S O N DMJ0
0.1
0.2
0.3
0.4
0.5
0.6
0.7
0.8
0.9
1
F M A J J A S O N DMJ
Prob
abilit
y of
per
sist
ence
Time of disease introduction
A B
Fig. 7. The probability of disease persistence following introduction of a single infectious host as a function of the time of year that the introduction occurs. (A) Weekly meantemperature is given by the 49 year weekly mean for Braemar, north-east Scotland. B) Weekly mean temperature is 2 �C higher than the weekly mean for Braemar. Weeklytemperature differs between years due to normal random variation. Solid lines and dot-dashed lines show cases where the interannual standard deviation in weeklytemperature (r) is 1 and 3 �C, respectively.
520 P.A. Hancock et al. / International Journal for Parasitology 41 (2011) 513–522
mean temperature considerably affects the probability of persis-tence, particularly when the infection is introduced in the earlierpart of the year (Fig. 7B). Persistence probabilities are lower inthe presence of greater stochastic variation in temperature becausein this mean temperature range, temperature stochasticity causesthe annual distribution of questing tick abundance to become moredispersed (Fig. 6). This occurs because the peak emergence time ofquesting ticks is relatively late in the year (September–October),thus a relatively cold year can shift emergence times to the earlymonths of the year due to the delay caused by the winter period.Given that temperature-dependent development rates differ foreach interstadial developmental stage (Fig. 2), it is possible thatsome developing life stages experience the delay while others donot. As a result, increasing stochastic variation in temperatureleads to a lower probability of coincidence of the times that ticksof different life stages feed in high numbers, particularly since ticksthat feed in the first half of the year do not undergo diapause.
These results indicate that the effect of increasing mean tem-perature on the probability of disease persistence depends on thetemperature conditions at the site in question (specifically, thecumulative annual temperature) as well as the extent of the tem-perature rise. An increase in mean temperature of 2 �C, an amountthat lies within the range of the projected effects of global warmingon mean temperatures by 2080 in Great Britain (http://ukclimate-projections.defra.gov.uk/content/view/826/500/), can reduce theprobability of persistence following disease introduction, depend-ing on the level of between-year temperature variability and theeffects of diapause on the seasonal dynamics of the tick population(Fig. 7).
4. Discussion
By application of an age-structured model of the seasonaldynamics of I. ricinus populations, we have shown a clear patternin the times of year that ticks emerge from interstadial develop-ment to begin questing as mean temperature changes incremen-tally. This relationship depends on whether enough degree weeksaccumulate in a given year to allow interstadial development tobe completed in a single year. If temperatures are too cool for thisto occur, the times of peaks in abundance vary more strongly withchanges in mean temperature and emergence peaks can happen asearly as the start of spring (around March). When temperatures aresufficiently warm to allow the threshold to be exceeded then peaks
in emergence usually occur in the later half of the year (July–Sep-tember) and increasing mean temperature has less of an effect onthe time of peak abundance. The timing of the peaks is well pre-dicted by the annual profile of temperature-dependent develop-ment times and corresponds to the position of the mass-emergence event.
This broad pattern is robust to the inclusion of interannual sto-chastic variation in weekly temperature, although the annual dis-tribution of emergence times becomes more dispersed,particularly for cooler temperature profiles. Further, this tempera-ture stochasticity causes considerable variability in the peak emer-gence times when the annual cumulative temperature approachesthe threshold described above.
Observations of wild tick populations in Great Britain show thatmoulting and emergence of nymphs and adults occurs in the laterpart of the year (July–October) (Randolph, 2004; Gray, 2008). Thisis the pattern predicted by the model for the majority of the tem-perature profiles used in the analysis (Fig. 4). However the fieldobservations show that this peak emergence time does not alwayscorrespond to the time of year at which questing ticks are mostabundant, particularly for the nymph and adult stages. Observa-tions show that questing nymphs and adults are sometimes mostabundant in spring, when the temperatures become warm enoughto allow questing ticks to become active (Gray, 1982; Walker,2001; Randolph et al., 2002). This has been attributed to a processof behavioural diapause, or a delay in the questing activity of new-ly emerged ticks until the year following emergence (Randolph,2004).
The model did not incorporate a behavioural diapause mecha-nism because it would obscure the relationship between tempera-ture and emergence times that has been shown. Further, there is alack of empirical data demonstrating behavioural diapause in I. ric-inus, when it occurs and which age-classes are affected (Randolph,2004; Nuttall and Labuda, 2005). However, the results indicate thatif ticks emerging in the later part of the year delay their questingactivity until the following year, as empirical observations indicate(Sonenshine, 2005), a dominant peak of activity in spring wouldoccur for a wide range of annual temperature profiles. Thus, inaccordance with other studies (Belozerov and Naumov, 2002),these results emphasise the need for further empirical study of dia-pause processes in tick populations.
Moreover, the results suggest that other factors that may alsocontribute to an early-year peak in questing tick abundance. Forsome temperature profiles the model predicts a peak in emergence
P.A. Hancock et al. / International Journal for Parasitology 41 (2011) 513–522 521
of questing ticks in the first half of the year (spring or early sum-mer). As temperatures vary from year to year, it is possible that alocation which has an autumn peak under average temperatureconditions experiences a spring peak if recent temperatures arecooler than average. This is supported by the analysis of the effectof stochastic temperature variation on peak activity times, whichalso shows that early and late year peaks can occur in the sameyear because not all questing ticks can find hosts before tempera-tures drop below the questing activity threshold over the winter.
The association between changes in temperature and thedynamics of tick-borne diseases is potentially complex, becausedisease persistence depends on the times at which the differenttick lifecycle stages feed and the availability of host species thatcan facilitate interstadial transmission (Randolph et al., 2000; Gray,2008; Ogden et al., 2008). Disease transmission is inefficient whenthere is a long delay between the time that a tick contracts theinfection and the time that the infection is transmitted to other tickgenerations, which is one explanation for the lower prevalence ofLyme disease in southern areas of the United States compared withhigher latitude, cooler locations (Ogden et al., 2008). The model re-sults show that for some average annual temperature patterns, dis-ease persistence is more robust to temperature variation, whereasfor other patterns disease transmission is more easily disrupted bytemperature variability. For the later ‘sensitive’ annual tempera-ture profiles, the cumulative annual temperature is close to thethreshold required for interstadial development to occur in a singleyear. Therefore, if temperatures are colder than average, some ticklife stages may not complete development until spring of the fol-lowing year. If this occurs, then the peak in questing activity isshifted to a period of the year when diapause does not take placeand the dynamics of the different active stages become lesssynchronous.
In our exploration of the effect of changes in mean temperatureon tick population dynamics, it was assumed for simplicity thatmean temperature changes by the same amount in each week ofthe year. In reality changes in average temperature across GreatBritain that occur spatially, or due to the effects of global warmingon a particular location, are likely to vary seasonally (http://ukcli-mateprojections.defra.gov.uk/content/view/826/500/). For exam-ple, most scenarios of the effects of global warming ontemperatures in the British Isles predict that average summer tem-peratures will increase by more than average winter temperatures.However, our conclusions depend primarily on changes in thecumulative temperature over the year, and will be qualitativelysimilar when the difference in average weekly temperature is sea-sonally dependent.
The model also simplifies tick population dynamics and theprocess of tick-borne disease transmission by considering a singlehost population of constant abundance on which all tick lifecyclestages can feed. However tick burdens experienced by hosts arerelated to the density of different host species (Brunner and Ost-feld, 2008). Most tick-borne diseases can be transmitted by multi-ple host species, most of which are hosts for some but not all ofthree feeding life stages (larvae, nymphs and adults), and whichdiffer in their capacity to transmit pathogens (LoGiudice et al.,2003; Keesing et al., 2009). This has been shown to have animportant effect on disease dynamics and prevalence (Randolphet al., 2000; Gilbert et al., 2001; Laurenson et al., 2003; LoGiudiceet al., 2003; Norman et al., 2004; Ogden et al., 2008). For example,the local absence of deer at the times of year when ticks quest inhigh numbers can lead to increased feeding on rodents, which in-creases the prevalence of tick-borne encephalitis because rodentsare susceptible to the disease whereas deer are not, and thereforethe deer function as ‘dilution hosts’ (LoGiudice et al., 2003; Per-kins et al., 2006). This also emphasises the importance of the spa-tial dynamics of the host population to tick-borne disease
dynamics (Watts et al., 2009), an aspect which has hitherto re-ceived little attention.
In conclusion, this model highlights trends in the seasonal pat-terns of tick activity as mean temperatures vary across a continu-ous spectrum and demonstrates the effect of different degrees ofinterannual stochastic temperature variation. There is considerableuncertainty associated with many of the parameters of the age-structured tick population dynamic model (Randolph, 2004), andwe do not aim to predict the dynamics of ticks and tick-borne dis-eases accurately for a particular place and time. Nonetheless, themodel produces times of peak emergence of questing ticks thatare consistent with observations of natural populations of I. ricinusthroughout Great Britain. The results are therefore useful in under-standing the role of different patterns of temperature variation inthe dynamics of tick-borne disease systems. The results alsoemphasis that, in order to understand the effects of changing cli-mate on the dynamics and prevalence of tick-borne diseases, de-tailed location-specific knowledge of tick population demographyand its dependence on climatic conditions is necessary.
Acknowledgements
This work resulted from a pump-priming project sponsored bythe National Environment Research Council (NERC), Centre forPopulation Biology (CPB) and the UK Population Biology Network(UKPopNet) and was funded by the NERC (Agreements R8-H12-04 and R8-H12-01) and Natural England. We are grateful to SarahRandolph and two anonymous reviewers for providing commentsleading to improvement of the manuscript.
Appendix A. Supplementary data
Supplementary data associated with this article can be found, inthe online version, at doi:10.1016/j.ijpara.2010.12.012.
References
Anderson, R.M., May, R.M., 1991. Infectious Diseases of Humans: Dynamics andControl. Oxford University Press, Oxford.
Belozerov, V.N., Naumov, R.L., 2002. Nymphal diapause and its photoperiodiccontrol in the tick Ixodes scapularis (Acari: Ixodidae). Folia Parasitol. 49, 314–318.
Brunner, J.L., Ostfeld, R.S., 2008. Multiple causes of variable tick burdens on small-mammal hosts. Ecology 89, 2259–2272.
Cadenas, F.M., Rais, O., Jouda, F., Douet, V., Humair, P.F., Moret, J., Gern, L., 2007.Phenology of Ixodes ricinus and infection with Borrelia burgdorferi sensu latoalong a North- and South-facing altitudinal gradient on Chaumont Mountain.Switzerland J. Med. Entomol. 44, 683–693.
Estrada-Peña, A., Martinez, J.M., Acedo, C.S., Quilez, J., Cacho, E.D., 2004. Phenologyof the tick, Ixodes ricinus, in its southern distribution range (central Spain). Med.Vet. Entomol. 18, 387–397.
Estrada-Peña, A., 2009. Tick-borne pathogens, transmission rates and climatechange. Front. Biosci. 14, 2674–2780.
Gardiner, W.P., Gettinby, G., Gray, J.S., 1983. A weather-based prediction model forthe life-cycle of the sheep tick, Ixodes ricinus L.. Vet. Parasitol. 13, 77–84.
Gilbert, L., Norman, R., Laurenson, K.M., Reid, H.W., Hudson, P.J., 2001. Diseasepersistence and apparent competition in a three-host community: an empiricaland analytical study of large-scale, wild populations. J. Anim. Ecol. 70, 1053.
Gilbert, L., 2010. Altitudinal patterns of tick and host abundance: a potential role forclimate change in regulating tick-borne diseases? Oecologia 162, 217–225.
Gray, J.S., 1982. The development and questing activity of Ixodes ricinus (L.) (Acari:Ixodidae) under field conditions in Ireland. Bull. Ent. Res. 72, 263–270.
Gray, J.S., 2008. Ixodes ricinus seasonal activity: implications of global warmingindicated by revisiting tick and weather data. Int. J. Med. Microbiol. 298, 19–24.
Jouda, F., Perret, J.L., Gern, L., 2004. Ixodes ricinus density, and distribution andprevalence of Borrelia burgdorferi sensu lato infection along an altitudinalgradient. J. Med. Entomol. 41, 162–169.
Keesing, F., Brunner, J., Duerr, S., Killilea, M., LoGiudice, K., Schmidt, K., Vuong, H.,Ostfeld, R.S., 2009. Hosts as ecological traps for the vector of Lyme disease. Proc.R. Soc. Lond. B 276, 3911–3919.
Lafferty, K.D., 2009. The ecology of climate change and infectious diseases. Ecology90, 888–900.
522 P.A. Hancock et al. / International Journal for Parasitology 41 (2011) 513–522
Laurenson, M.K., Norman, R., Gilbert, L., Reid, H.W., Hudson, P.J., 2003. Identifyingdisease reservoirs in complex systems: mountain hares as reservoirs of ticksand louping-ill virus, pathogens of red grouse. J. Anim. Ecol. 72, 177.
LoGiudice, K., Ostfield, R.S., Schmidt, K.A., Keesing, F., 2003. The ecology of infectiousdisease: effects of host diversity and community composition on Lyme diseaserisk. Proc. Natl. Acad. Sci. 100, 567.
MacLeod, L., 1932. The binomics of Ixodes ricinus L., the sheep tick of Scotland.Parasitology 24, 382–400.
Norman, R., Ross, D., Laurenson, K.M., Hudson, P.J., 2004. The role of non-viraemictransmission on the persistence and dynamics of a tick borne virus–Louping illin red grouse (Lagopus lagopus scoticus) and mountain hares (Lepus timidus). J.Math. Biol. 48, 119.
Nuttall, P.A., Labuda, M., 2005. Tick-borne encephalitis. In: Goodman, J.L., Dennis,D.T., Sonenshine, D.E. (Eds.), Tick-borne Diseases of Humans. American Societyfor Microbiology, Washington, pp. 150–163.
Ogden, N.H., Bigras-Poulin, M., O’Callaghan, C.J., Barker, I.K., Lindsay, L.R., Maarouf,A., Smoyer-Tomic, K.E., Waltner-Toews, D., Charron, D., 2005. A dynamicpopulation model to investigate effects of climate on geographic range andseasonality of the tick Ixodes scapularis. Int. J. Parasitol. 35, 375.
Ogden, N.H., Bigras-Poulin, M., O’Callaghan, C.J., Barker, I.K., Kurtenbach, K., Lindsay,L.R., Charron, D.F., 2007. Vector seasonality, host infection dynamics and fitnessof pathogens transmitted by the tick Ixodes scapularis. Parasitology 134, 209.
Ogden, N.H., Bigras-Poulin, M., Hanincová, K., Maarouf, A., O’Callaghan, C.J.,Kurtenbach, K., 2008. Projected effects of climate change on tick phenologyand fitness of pathogens transmitted by the North American tick Ixodesscapularis. J. Theor. Biol. 254, 621–632.
Paaijmans, K.P., Read, A.F., Thomas, M.B., 2009. Understanding the link betweenmalaria risk and climate. Proc. Natl. Acad. Sci. 106, 13844–13849.
Pascual, M., Ahumada, J.A., Chaves, L.F., Rodo, X., Bouma, M., 2006. Malariaresurgence in the East African highlands: temperature trends revisited. Proc.Natl. Acad. Sci. 103, 5829–5834.
Perkins, S.E., Cattadori, I.M., Tagliapietra, V., Rizzoli, A.P., Hudson, P.J., 2006.Localized deer absence leads to tick amplification. Ecology 87, 1981–1986.
Randolph, S.E., 1994a. Population dynamics and density-dependent seasonalmortality indexes of the tick Rhipicephalus appendiculatus in eastern andsouthern Africa. Med. Vet. Entomol. 8, 351–368.
Randolph, S.E., 1994b. Density dependent acquired resistance to ticks in naturalhosts, independent of concurrent infection with Babesia microti. Parasitology108, 413–419.
Randolph, S.E., 1997. Abiotic and biotic determinants of the seasonal dynamics ofthe tick Rhipicephalus appendiculatus in South Africa. Med. Vet. Entomol. 11, 25–37.
Randolph, S.E., Rogers, D.J., 1997. A generic population model for the African tickRhipicephalus appendiculatus. Parasitology 115, 265.
Randolph, S.E., Green, R.M., Peacey, M.F., Rogers, D.J., 2000. Seasonal synchrony: thekey to tick-borne encephalitis foci identified by satellite data. Parasitology 121,15.
Randolph, S.E., Rogers, D.J., 2000. Fragile transmission cycles of tick-borneencephalitis virus may be disrupted by predicted climate change. Proc. R. Soc.Lond. B 267, 1741.
Randolph, S.E., Green, R.M., Hoodless, A.N., Peacey, M.F., 2002. An empiricalquantitative framework for the seasonal population dynamics of the tick Ixodesricinus. Int. J. Parasitol. 32, 979.
Randolph, S.E., 2004. Tick ecology: processes and patterns behind theepidemiological risk posed by ixodid ticks as vectors. Parasitology 129, S37–S65.
Sargison, N., Edwards, G., 2009. Tick infestations in sheep in the UK. In Practice 31,58–65.
Schwarz, A., Maier, W.A., Kistemann, T., Kampen, H., 2009. Analysis of thedistribution of the tick Ixodes ricinus L. (Acari: Ixodidae) in a nature reserve ofwestern Germany using Geographic Information Systems. Int. J. Hyg. Environ.Health 212, 87–96.
Sonenshine, D.E., 2005. The biology of tick vectors of human disease. In: Goodman,J.L., Dennis, D.T., Sonenshine, D.E. (Eds.), Tick-borne Diseases of Humans.American Society for Microbiology, Washington, pp. 12–36.
Tuljapurkar, S., Caswell, H., 1997. Structured-population models in marine,terrestrial and freshwater systems. Chapman and Hall, New York.
Walker, A.R., 2001. Age structure of a population of Ixodes ricinus (Acari: Ixodidae)in relation to its seasonal questing. Bull. Ent. Res. 91, 69–78.
Watts, E.J., Palmer, S.C.F., Bowman, A.S., Irvine, R.J., Smith, A., Travis, J.M.J., 2009. Theeffect of host movement on viral transmission dynamics in a vector-bornedisease system. Parasitology 136, 1221–1234.
Related Documents


![Diverse tick-borne microorganisms identified in free ... · bacteria and protozoan parasites [5–7]. Also, the bites of I. ricinus by themselves can cause meat allergy [8]. Ixodes](https://static.cupdf.com/doc/110x72/5e3fe9de6bb8ab0c1724bc46/diverse-tick-borne-microorganisms-identified-in-free-bacteria-and-protozoan.jpg)


