WELL DATA, SURFACE-WATER DISCHARGES, AND NITRATE CONCENTRATIONS, FEBRUARY 1986 - SEPTEMBER 1987, IN PARTS OF THE PASCO BASIN, WASHINGTON By B. W. Drost, K. M. Schurr, G. P. Ruppert, and S. E. Cox U.S. GEOLOGICAL SURVEY Open-File Report 89-38 Prepared in cooperation with the STATE OF WASHINGTON DEPARTMENT OF ECOLOGY Tacoma, Washington 1989

Welcome message from author
This document is posted to help you gain knowledge. Please leave a comment to let me know what you think about it! Share it to your friends and learn new things together.
Transcript

WELL DATA, SURFACE-WATER DISCHARGES, AND NITRATE CONCENTRATIONS, FEBRUARY 1986 - SEPTEMBER 1987, IN PARTS OF THE PASCO BASIN, WASHINGTON
By B. W. Drost, K. M. Schurr, G. P. Ruppert, and S. E. Cox
U.S. GEOLOGICAL SURVEY
Open-File Report 89-38
Prepared in cooperation with the
STATE OF WASHINGTON DEPARTMENT OF ECOLOGY
Tacoma, Washington 1989
DEPARTMENT OF THE INTERIOR
MANUEL LUJAN, JR., Secretary
U.S. GEOLOGICAL SURVEY
Dallas L. Peck, Director
For additional information write to:
District ChiefU.S. Geological Survey1201 Pacific Avenue - Suite 600Tacoma, Washington 98402
Copies of this report can be purchased from:
U.S. Geological SurveyBooks and Open-File ReportsBox 25425, Federal Center, Bldg. 810Denver, Colorado 80225
CONTENTS
Page
Abstract------------------------------------------------------------- 1Introduction--------------------------------------------------------- 2
Purpose and scope------------------------------------------------ 2Well-numbering system-------------------------------------------- 4Acknowledgments -------------------------------------------------- 4
Methods of data collection------------------------------------------- 5Ground-water data------------------------------------------------ 5
Well selection----------------------------------------------- 5Well-location data------------------------------------------- 5Well-construction data--------------------------------------- 6Water levels------------------------------------------------- 6
Surface-water data----------------------------------------------- 8Site selection----------------------------------------------- 8Station identification numbers------------------------------- 8Discharge calculations --------------------------------------- nData presentation-------------------------------------------- 11
Water-quality data----------------------------------------------- 12References cited----------------------------------------------------- 12
ILLUSTRATIONS
Figure 1. Map showing location of Pasco basin and study area-------- 32. Hydrographs of wells with continuous recorders------------ 73. Schematic diagram of surface-water sites in South Columbia
Basin and Franklin County Irrigation Districts---------- 94. Schematic diagram of surface-water sites in Kennewick and
Columbia Irrigation Districts--------------------------- 10
TABLES
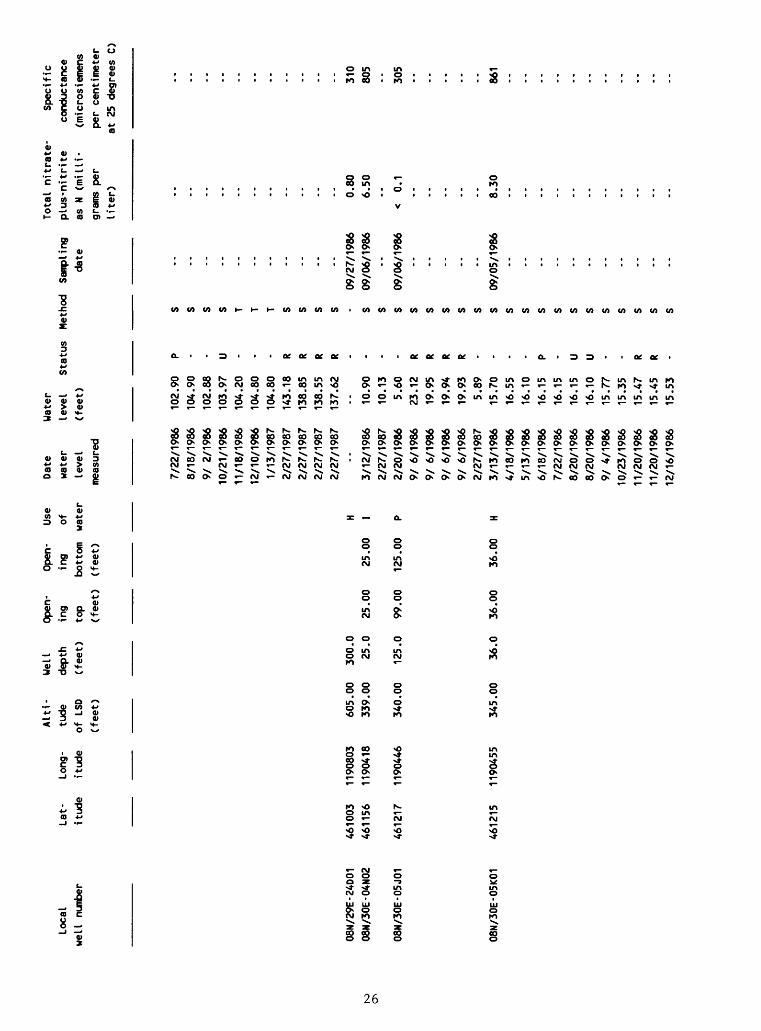
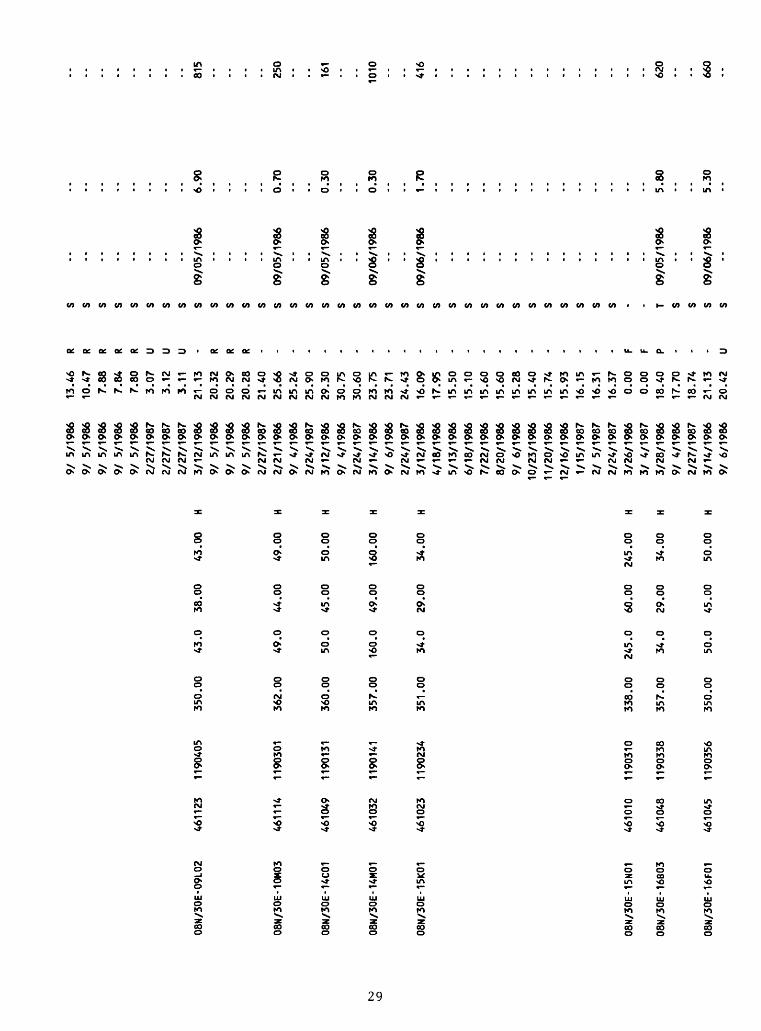
Table 1. Well records, water levels, nitrate-plus-nitriteconcentrations, and specific-conductance values inwells composing the water-level network------------------ 13
2. Records of surface-water sites with daily discharges orstages --------------------------------------------------- 88
3. Discharge measurements at miscellaneous sites-------------- 1284. Water-quality data from surface-water sites---------------- 131
iii

CONVERSION FACTORS
For the convenience of readers who may prefer to use metric units rather than the inch-pound units used in this report, values may be converted by using the following factors:
Multiply inch-pound unit
foot (ft)
acre-foot (acre-ft)
3 cubic foot per second (ft /s)
milligrams per liter (mg/L)
By To obtain metric unit
0.3048 meter (m)3
1233 cubic meter (m )3 0.001233 cubic hectometers (hm )
3 0.02832 cubic meter per second (m /s)28.32 liters per second (L/s) 0.00136 tons per acre-foot (tons/acre-ft)
Sea level; In this report "sea level" refers to the National Geodetic Vertical Datum of 1929 (NGVD of 1929)--a geodetic datum derived from a general adjustment of the first-order level nets of both the United States and Canada, formerly called Sea Level Datum of 1929.
IV

WELL DATA, SURFACE-WATER DISCHARGES, AND NITRATE CONCENTRATIONS,FEBRUARY 1986 - SEPTEMBER 1987, IN PARTS OF THE
PASCO BASIN, WASHINGTON
By B. W. Drost, K. M. Schurr, G. P. Ruppert, and S. E. Cox
ABSTRACT
The U.S. Geological Survey, in cooperation with the State of Washington Department of Ecology, initiated a study in 1986 of parts of the Pasco basin, Washington, to determine: (1) the effects of dams, irrigation, canal seepage, and ground-water pumping on ground-water levels; (2) the quality of ground water, with emphasis on probable sources of large concentrations of nitrate; (3) whether pesticides are present in the ground-water system; (4) directions and general rates of movement of undesirable chemicals and (or) chemical concentrations in the ground-water system; and (5) the possible results of various management alternatives for dealing with high ground-water levels and large concentrations of nitrate in ground water.
This report contains selected basic data collected from the start of the project (February 1986) through September 1987. The ground-water-level network consisted of about 500 wells that were measured in February 1986, September 1986, and February 1987. Water levels were measured monthly in about 70 wells, and 5 wells were monitored with continuous recorders during the same period.
A surface-water-flow gaging network was operated from February 1986 through July 1987. All major flows into and out of the project area were gaged for at least one full year. Miscellaneous measurements were taken at additional locations.
Ground- and surface-water samples were collected and analyzed for nitrate concentrations and specific conductance. Most of the water-level network wells and selected surface-water sites were sampled in September 1986. Selected wells were sampled periodically from September 1986 through September 1987.

INTRODUCTION
The Pasco basin (fig. 1) includes approximately 2,000 square miles of south-central Washington. The basin has a diverse economy ranging from dryland and irrigated agriculture to the U.S. Department of Energy's Hanford site. The climate is arid to semiarid, and essentially the entire basin receives less than 10 inches of precipitation annually. Over the last 40 years, much of the basin has been changing from rangeland and dryland farming into one of the major irrigated agricultural areas of the Northwest. Signifi cant volumes of water have been diverted from the river systems into this area for irrigation. There have also been significant increases in ground-water pumping.
A variety of water problems have resulted, both directly and indirectly, from the significant increase in irrigation in the basin. The use of surface water for irrigation has been linked to significant rises in ground-water levels in many areas (through percolation of surface water applied on crops and (or) seepage from canals and laterals). Ground-water levels have also risen due to higher river levels, caused by dams on the Columbia and Snake Rivers. Rising ground-water levels in some areas reportedly have resulted in septic system failures, damage to roads, and loss of agricultural land because of ponding. Rising ground-water levels have been suggested as a cause of landslides along the Columbia River. Pumping of ground water has lowered water levels in some areas, causing concern over the future avail ability (and cost) of ground water for irrigation. Large concentrations of nitrate observed in water from some wells have been linked to application of fertilizers and (or) failure of septic systems. There is concern also that pesticides, which have been used in the area for many years, may have contam inated drinking water supplies, or may do so in the future.
Purpose and Scope
The U.S. Geological Survey, in cooperation with the State of Washington Department of Ecology, initiated a study in 1986 in parts of the Pasco basin (fig. 1) to determine:
1) The separate effects of dams, irrigation, canal seepage, and ground- water pumping on ground-water levels;
2) The quality of the ground water, with emphasis on probable sources of large concentrations of nitrate;
3) Whether pesticides are present in ground water in selected areas that have experienced long-term pesticide use.
4) The directions and general rates of movement of undesirable chemicals and (or) chemical concentrations in the ground-water system;
5) The possible results of various management alternatives for dealingwith high ground-water levels and large concentrations of nitrate in ground water.
The purpose of this report is to make available selected data collected during the early stages of the study, from February 1986 through September 1987. The geologic units tapped by wells are not indicated in this report; the determination of geologic units is an interpretive process that will continue throughout analysis and modeling of the ground-water system.

120° 119°
46 45' -
46"15'-
,S, Department t>f Energy} '
£\ /; WALLA WEXPLANATION
Boundary of Pasco basin
Boundary of study area
Base from U.S. Geological Survey State base map, 1:500,000 10 20 MILES
10 20 KILOMETERS
Figure 1 .--Location of Pasco basin and study area.

Well-Numbering System
The well numbers used in this report give the location of wells according to the official rectangular public-land survey. For example, in well number 08N/30E-14M01, the part preceding the hyphen indicates successively the township and range (T.08 N. , R.30 E.) north and east of the Willamette base line and meridian, respectively. The number following the hyphen indicates the section (sec. 14), and the letter (M) indicates the 40-acre subdivision of the section as shown in the sketch below. Last is a sequence number used to distinguish wells in the same 40-acre tract. Thus, well 08N/30E-14M01 is in the NWk of the SWH of sec. 14, T.08 N. , R.30 E. A "D" following the sequence number indicates a well which has undergone changes in construction (generally deepening). The number following the "D" is a sequence number to distinguish multiple construction changes in the same well.
R. 30 E.
8/30-14M1
T.
\-
N.
D
E
. M
N
C
F
L
P
B
G
K
Q
A
H
J
R
Section 14
Acknowle dgment s
This study is being conducted in cooperation with the State of Washington Department of Ecology. The cooperation and assistance provided by the Columbia Irrigation District, the Franklin County Irrigation District, the Kennewick Irrigation District, and the South Columbia Basin Irrigation District are gratefully acknowledged. The irrigation districts allowed access to canals for installation and monitoring of gaging stations and, in some instances, provided daily staff-gage readings. Personnel at the State Fish Hatchery at Ringold Springs provided staff-gage readings. The U.S. Bureau of Reclamation provided access to wells and piezometers. The cities of Richland and West Richland provided access to their wells. Many local residents were especially helpful by providing access to their wells for water-level measure ments and water-quality sampling.

METHODS OF DATA COLLECTION
Ground-Water Data
Well Selection
Wells were selected for the ground-water-level network primarily to achieve a good areal distribution of wells tapping each aquifer. Using information contained in drillers' logs, wells were selected that appeared to draw water from only a single aquifer. Some wells were included in the network because they had historical water-level records.
In areas where high ground-water levels and (or) large nitrate concen trations were reported, the desired observation-well density was one well per aquifer per one-sixteenth of a section; and in other areas, the desired density was one well per aquifer per one-quarter of a section. The well selection in each area was limited by the availability of wells, permission to measure, and the ability to obtain measurements and samples. Water levels and well records for the wells comprising the ground-water-level network are contained in table 1 (end of report).
Well-Location Data
In the field, well owners were contacted and data on the drillers' well logs were cross-checked (driller's name, well depth, year drilled, casing diameter, and well location) in order to match the drillers' well logs with the proper wells. The owners were asked also about any construction changes that might have been made to their wells.
Sketch maps, made in the field, included the distance from each well to a known point on a topographic map (generally road intersections). Most distance measurements were made with vehicle odometers. Well locations were plotted on 1:24,000-scale topographic maps in the field and then were checked against the sketch maps in the office.
Local numbers were assigned from plots on the topographic maps accord ing to the well-numbering system described previously. On subsequent visits, locations were rechecked from the sketch maps and topographic plots, and, in some cases, were checked against aerial photographs.
Latitudes and longitudes were determined from the topographic map plots and are generally accurate to within 2 seconds. In rare cases, they may be accurate only to within 10 seconds.
Altitudes were assigned from the topographic maps and are generally accu rate to within 10 feet. In steep terrain, or where the precise location is in doubt, the error may be as great as 40 feet. A few wells were checked with altimeters (accurate to within 5 feet) and a few had been surveyed (accurate to within 1 foot) for other projects.
Well-Construction Data
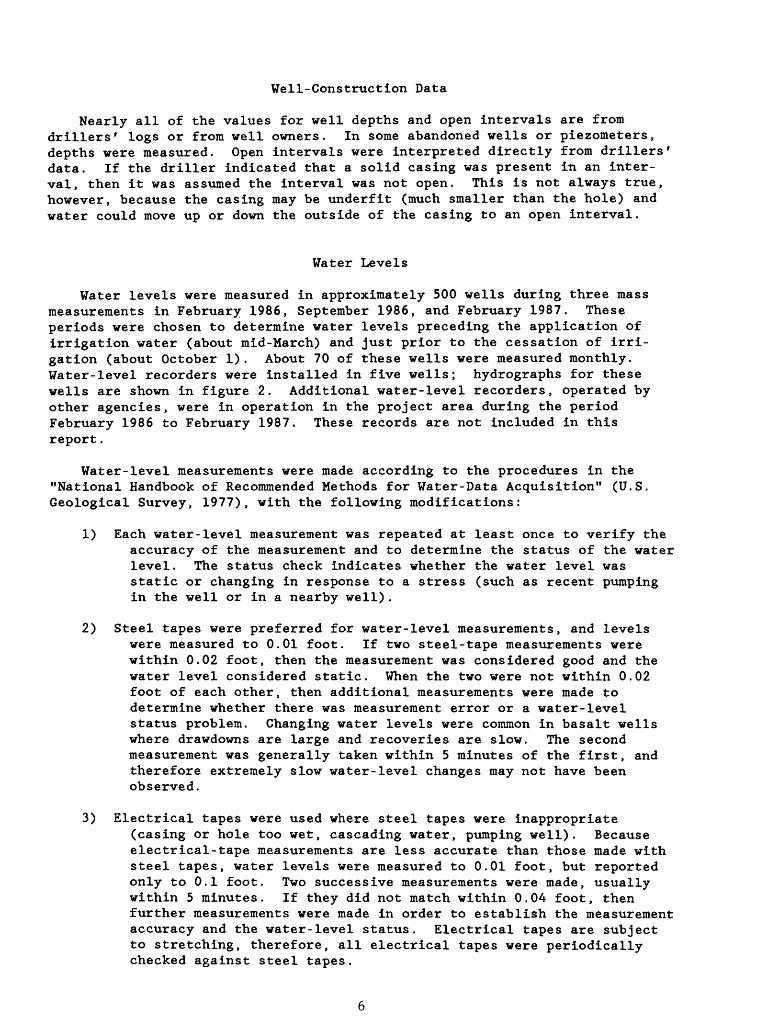
Nearly all of the values for well depths and open intervals are from drillers' logs or from well owners. In some abandoned wells or piezometers, depths were measured. Open intervals were interpreted directly from drillers' data. If the driller indicated that a solid casing was present in an inter val, then it was assumed the interval was not open. This is not always true, however, because the casing may be underfit (much smaller than the hole) and water could move up or down the outside of the casing to an open interval.
Water Levels
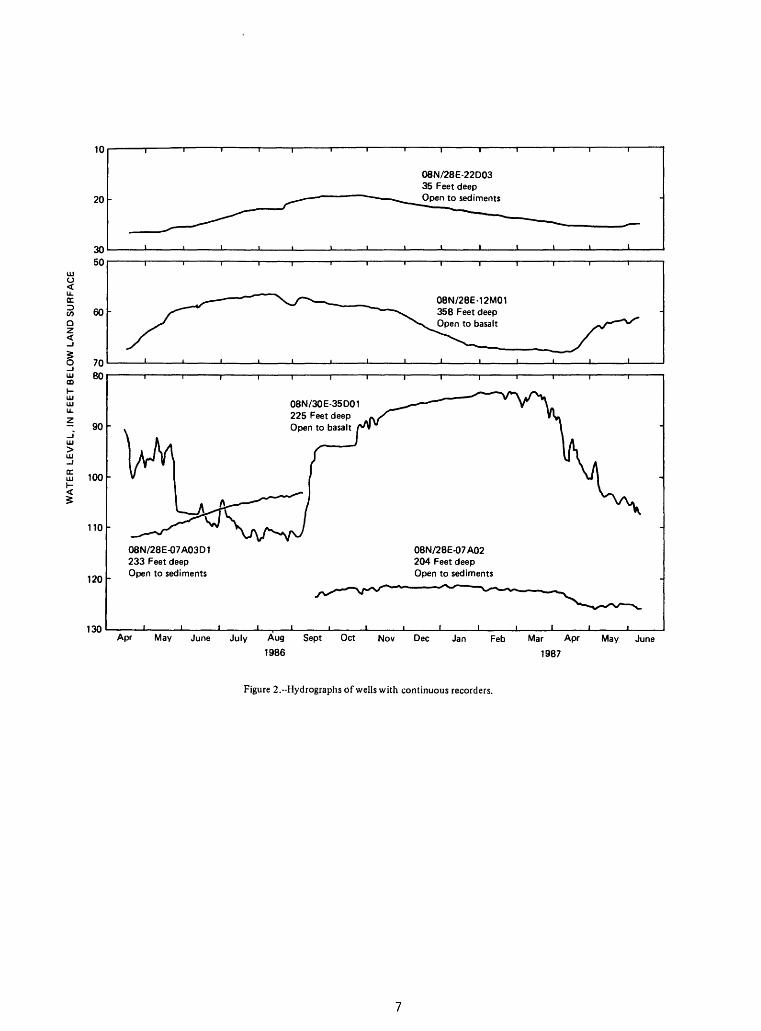
Water levels were measured in approximately 500 wells during three mass measurements in February 1986, September 1986, and February 1987. These periods were chosen to determine water levels preceding the application of irrigation water (about mid-March) and just prior to the cessation of irri gation (about October 1). About 70 of these wells were measured monthly. Water-level recorders were installed in five wells; hydrographs for these wells are shown in figure 2. Additional water-level recorders, operated by other agencies, were in operation in the project area during the period February 1986 to February 1987. These records are not included in this report.
Water-level measurements were made according to the procedures in the "National Handbook of Recommended Methods for Water-Data Acquisition" (U.S. Geological Survey, 1977), with the following modifications:
1) Each water-level measurement was repeated at least once to verify the accuracy of the measurement and to determine the status of the water level. The status check indicates whether the water level was static or changing in response to a stress (such as recent pumping in the well or in a nearby well).
2) Steel tapes were preferred for water-level measurements, and levels were measured to 0.01 foot. If two steel-tape measurements were within 0.02 foot, then the measurement was considered good and the water level considered static. When the two were not within 0.02 foot of each other, then additional measurements were made to determine whether there was measurement error or a water-level status problem. Changing water levels were common in basalt wells where drawdowns are large and recoveries are slow. The second measurement was generally taken within 5 minutes of the first, and therefore extremely slow water-level changes may not have been observed.
3) Electrical tapes were used where steel tapes were inappropriate(casing or hole too wet, cascading water, pumping well). Because electrical-tape measurements are less accurate than those made with steel tapes, water levels were measured to 0.01 foot, but reported only to 0.1 foot. Two successive measurements were made, usually within 5 minutes. If they did not match within 0.04 foot, then further measurements were made in order to establish the measurement accuracy and the water-level status. Electrical tapes are subject to stretching, therefore, all electrical tapes were periodically checked against steel tapes.
10
20
08N/28E-22D03 35 Feet deep Open to sediments
30'
50
60
7080
90
100
110
120
08N/28E-07A03D1 233 Feet deep Open to sediments
08N/30E-35D01 225 Feet deep Open to basalt
08N/28E-12M01 358 Feet deep Open to basalt
08N/28E-07A02 204 Feet deep Open to sediments
130Apr May June July Aug Sept
1986
Oct Nov Dec Jan Feb Mar Apr
1987
May June
Figure 2.--Hydrographs of wells with continuous recorders.
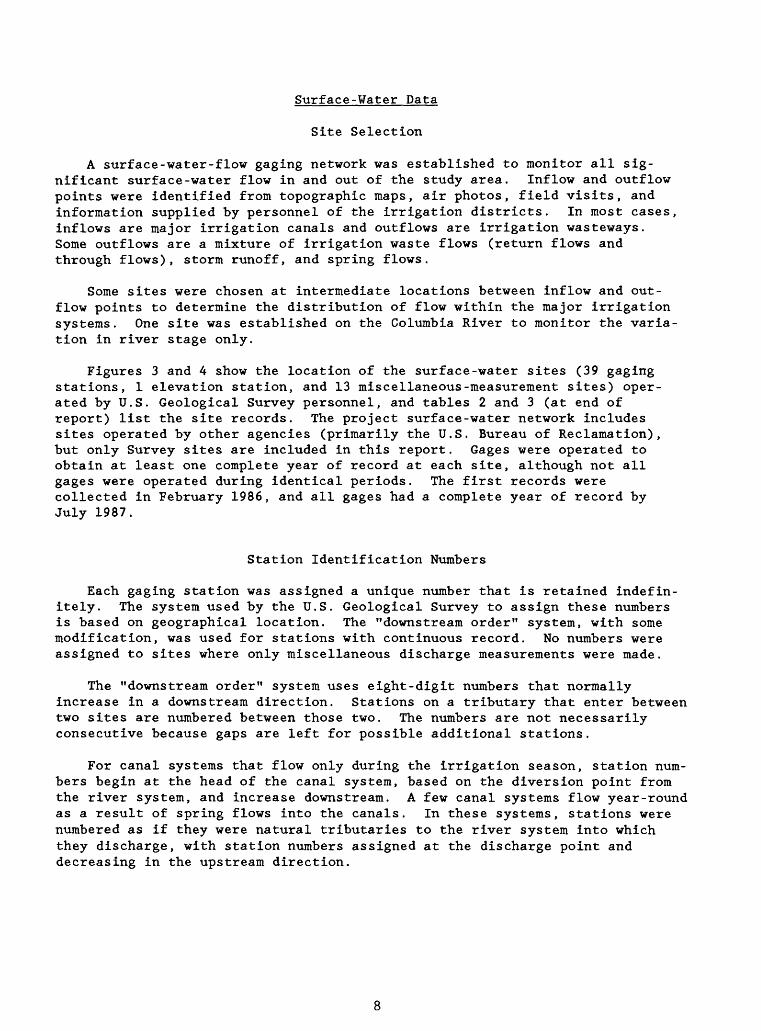
Surface-Water Data
Site Selection
A surface-water-flow gaging network was established to monitor all sig nificant surface-water flow in and out of the study area. Inflow and outflow points were identified from topographic maps, air photos, field visits, and information supplied by personnel of the irrigation districts. In most cases, inflows are major irrigation canals and outflows are irrigation wasteways. Some outflows are a mixture of irrigation waste flows (return flows and through flows), storm runoff, and spring flows.
Some sites were chosen at intermediate locations between inflow and out flow points to determine the distribution of flow within the major irrigation systems. One site was established on the Columbia River to monitor the varia tion in river stage only.
Figures 3 and 4 show the location of the surface-water sites (39 gaging stations, 1 elevation station, and 13 miscellaneous-measurement sites) oper ated by U.S. Geological Survey personnel, and tables 2 and 3 (at end of report) list the site records. The project surface-water network includes sites operated by other agencies (primarily the U.S. Bureau of Reclamation), but only Survey sites are included in this report. Gages were operated to obtain at least one complete year of record at each site, although not all gages were operated during identical periods. The first records were collected in February 1986, and all gages had a complete year of record by July 1987.
Station Identification Numbers
Each gaging station was assigned a unique number that is retained indefin itely. The system used by the U.S. Geological Survey to assign these numbers is based on geographical location. The "downstream order" system, with some modification, was used for stations with continuous record. No numbers were assigned to sites where only miscellaneous discharge measurements were made.
The "downstream order" system uses eight-digit numbers that normally increase in a downstream direction. Stations on a tributary that enter between two sites are numbered between those two. The numbers are not necessarily consecutive because gaps are left for possible additional stations.
For canal systems that flow only during the irrigation season, station num bers begin at the head of the canal system, based on the diversion point from the river system, and increase downstream. A few canal systems flow year-round as a result of spring flows into the canals. In these systems, stations were numbered as if they were natural tributaries to the river system into which they discharge, with station numbers assigned at the discharge point and decreasing in the upstream direction.

1251
3000
1247
1?g
P
riet
tRap
ids
12
47
17
22
^12
4717
1Q
VE
agle
Lak
e
1247
3506
MIS
C-3
1247
3504
1247
3508
12
4735
12
MIS
C-5
1247
1724
1247
3880
MIS
C-2
1247
3760
EX
PL
AN
AT
ION
Gag
ing
stat
ion
and
num
ber
Sta
ff-ga
ge s
ite a
nd n
umbe
r
Mis
cella
neou
s-m
easu
rem
ent
site
and
num
ber
Wat
er-q
ualit
y si
te a
nd n
umbe
r
Figu
re 3
.-L
ocat
ion
of s
urfa
ce-w
ater
site
s in
Sou
th C
olum
bia
Bas
in a
nd F
rank
lin C
ount
y Ir
riga
tion
Dis
trict
s.

1250
9600
1250
9620
EX
PL
AN
AT
ION
A 1
2509
638
Gag
ing
stat
ion
and
num
ber
A 1
2509
62°
Sta
ff-g
age
site
and
num
ber
A M
ISC
-8
Mis
cella
neou
s-m
easu
rem
ent
site
and
num
ber
y 1
2509
600
Wat
er.q
ua|it
y Sj
te a
nd n
umbe
r
1251
103
J251
1038 14
0060
00
Figu
re 4
.--L
ocat
ion
of s
urfa
ce-w
ater
site
s in
Ken
new
ick
and
Col
umbi
a Ir
riga
tion
Dis
tric
ts.
Discharge Calculations
Records of stage were obtained either from automatic recording devices, which usually recorded once every 30 minutes, or from readings, usually once- daily, of staff gages. For some stations, there were periods when either no gage-height record was obtained or the record was unusable.
Discharge was computed from direct measurements and stage records using the standard methods outlined in "Measurement and Computation of Streamflow" (Rantz and others, 1982).
Data Presentation
The data for each gaging station (table 2) consist of two parts--the manuscript or station description, and the data table. The manuscript provides, under various headings, descriptive information as follows:
LOCATION.--Information on location was obtained from the most accurate maps available. Latitude and longitude were determined to the nearest second. The location of the gage with respect to the cultural and physical features in the vicinity and with respect to the reference place mentioned in the station name is given.
GAGE.--The type of gage used, either recording or staff, is given. Altitudes were assigned from topographic maps and are generally accurate to within 10 feet.
REMARKS.--All periods of estimated daily discharge are identified.A statement on the accuracy of the records follows. The accuracy
depends primarily on: (1) The stability of the stage-discharge relation, (2) the accuracy and completeness of stage record and discharge measure ments, and (3) interpretation of records. "Excellent" means that about 95 percent of the daily discharges are within 5 percent of the true values; "good," within 10 percent; and "fair," within 15 percent. Records that do not meet these criteria are rated "poor." Different accuracies may be attributed to different parts of a given record. No accuracy was assigned to elevation record.
For stations on canal systems, the initial point of diversion into the system is identified.
EXTREMES.--Maximum discharge, unless otherwise qualified, corresponds to the highest stage that was recorded or observed. For stations that had flow only during irrigation season, no minimum was noted. For stations that flowed continuously, the minimum was identified in the same manner as the maximum.
The daily table for a gaging station gives the mean discharge in cubic feet per second for each day, and is followed by monthly summaries. Discharges are reported to the nearest hundredth of a cubic foot per second for values less than 1, to the nearest tenth between 1 and 9.9, and in whole numbers between 10 and 1,000. The number of significant figures used is based solely on the magnitude of the discharge value. Elevations are reported to 0.1 foot.
11
Records published for each miscellaneous site (table 3) consist of the site name, the stream or irrigation system to which it is tributary, site location, and measurement date and discharge. Location data were derived, and discharges measured, using the same methods described for gaging stations
Water-Quality Data
During the September 1986 water-level mass measurement, water samples were collected from most of the wells in the ground-water-level network. These samples were analyzed for nitrate-plus-nitrite concentrations and specific conductance. Sample analyses will be used to estimate the gener al magnitude of the reported nitrate problem, and provide information in designing more detailed water-quality investigations planned for later stages of the project. Followup samples were collected from some wells between September 1986 and September 1987 to observe seasonal changes in nitrate concentrations. All ground-water-quality data collected through December 1986 are included in table 1 (at end of report).
Samples for water-quality analysis were also collected from selected sur face-water sites in September 1986 (table 4). Seepage from the irrigation systems is a source of recharge to the ground-water system and, therefore, a potential source of nitrates in the ground-water system. The surface-water samples were collected for comparison with the ground-water samples.
REFERENCES CITED
Rantz, S.E., and others, 1982, Measurement and computation of streamflow:Volume 2, Computation of discharge: U.S. Geological Survey Water-Supply Paper 2175, 631 p.
U.S. Geological Survey, 1977, National handbook of recommended methods for water-data acquisition: Office of Water-Data Coordination, chapter 2.
12

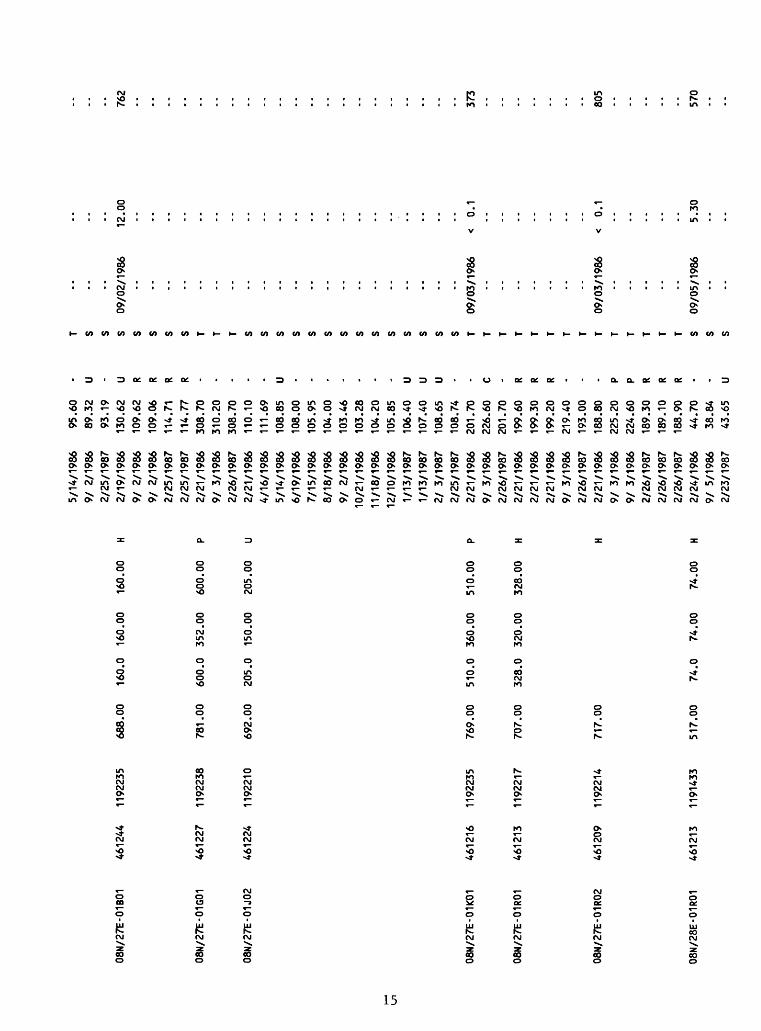
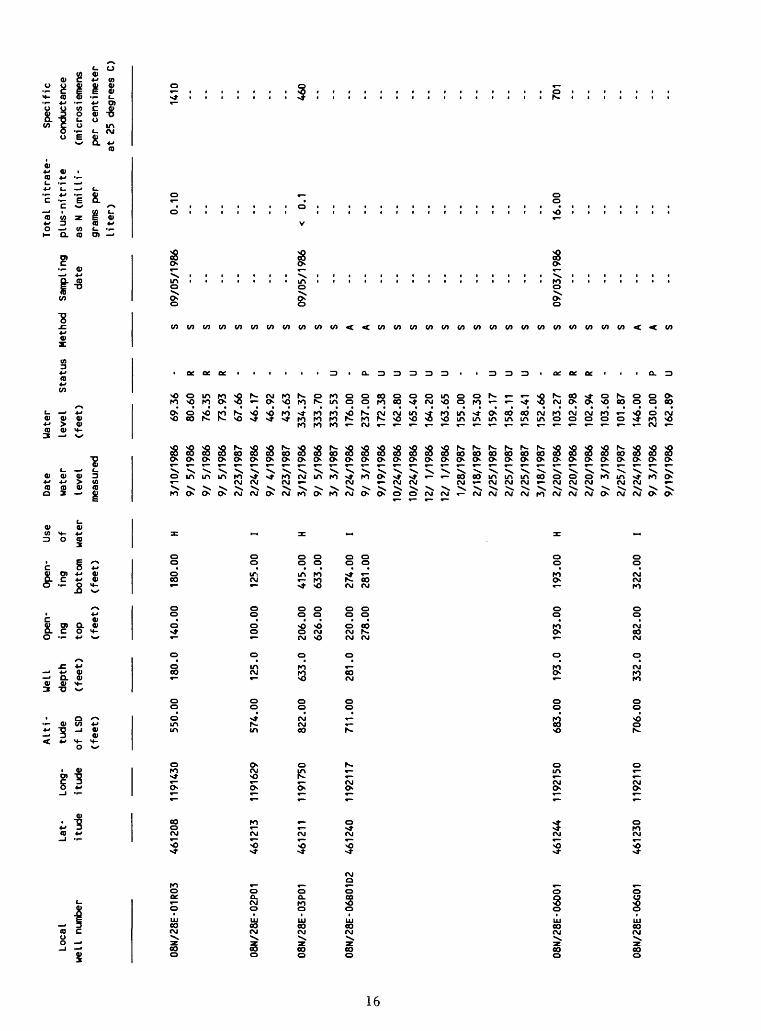
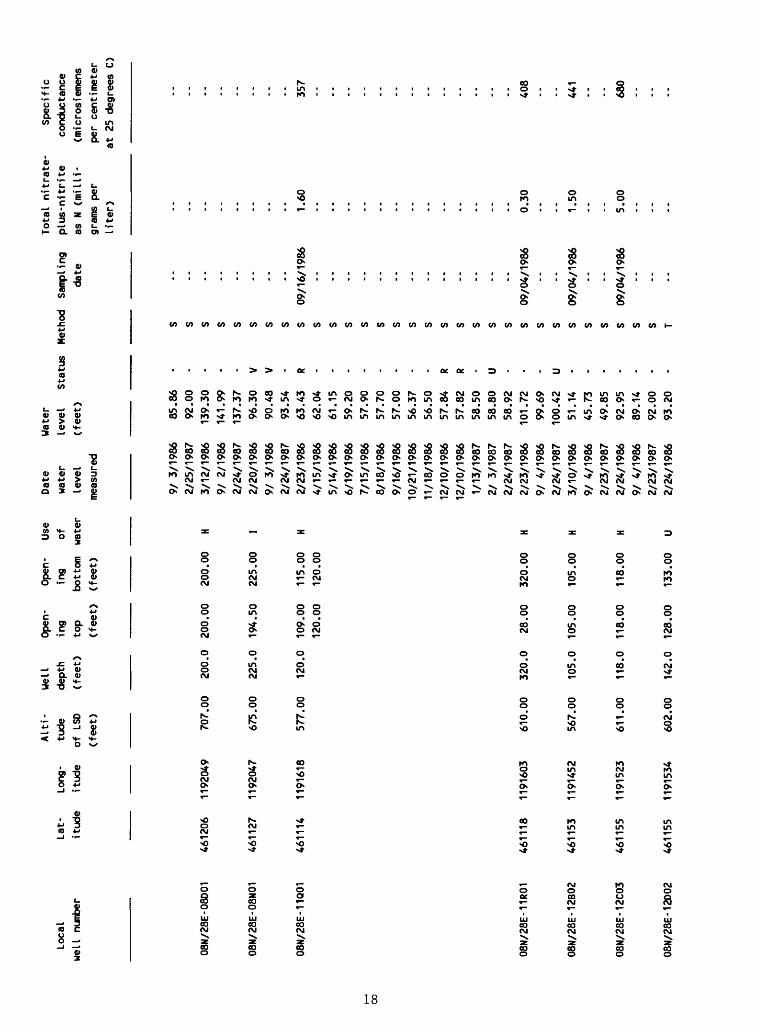
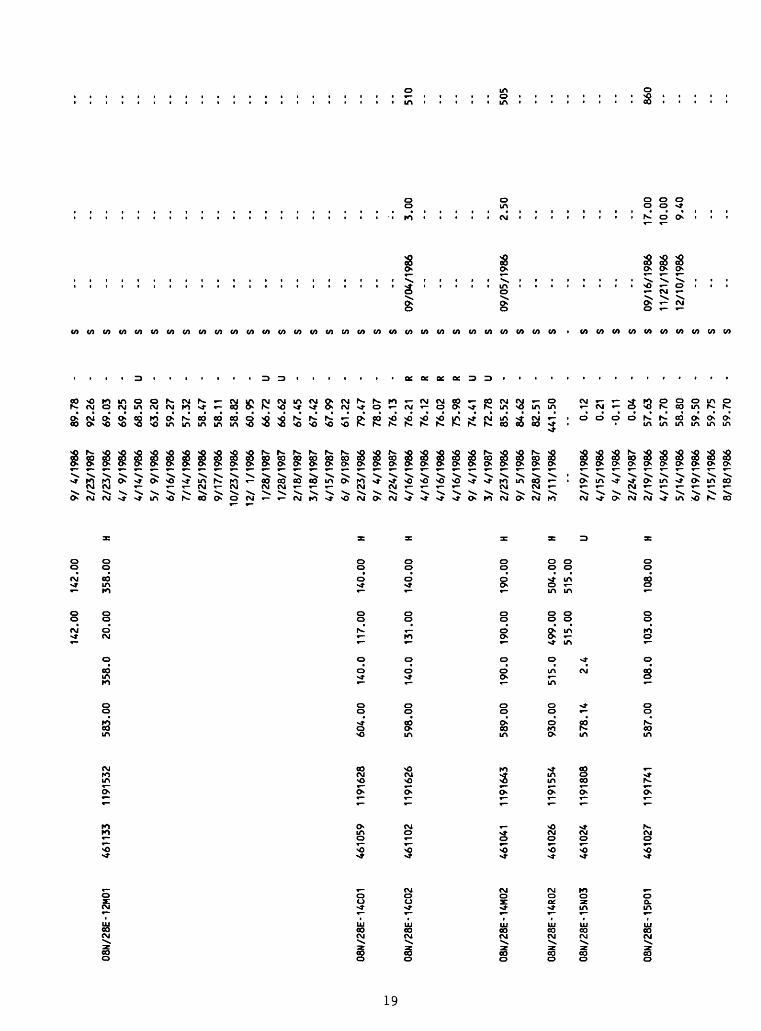
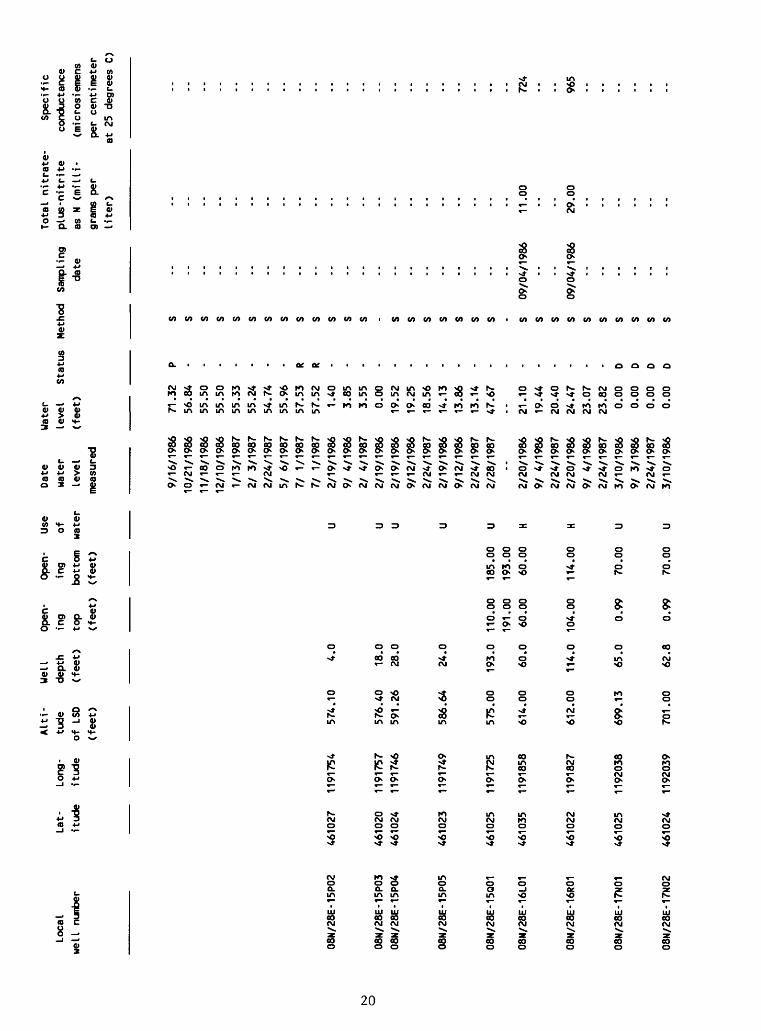
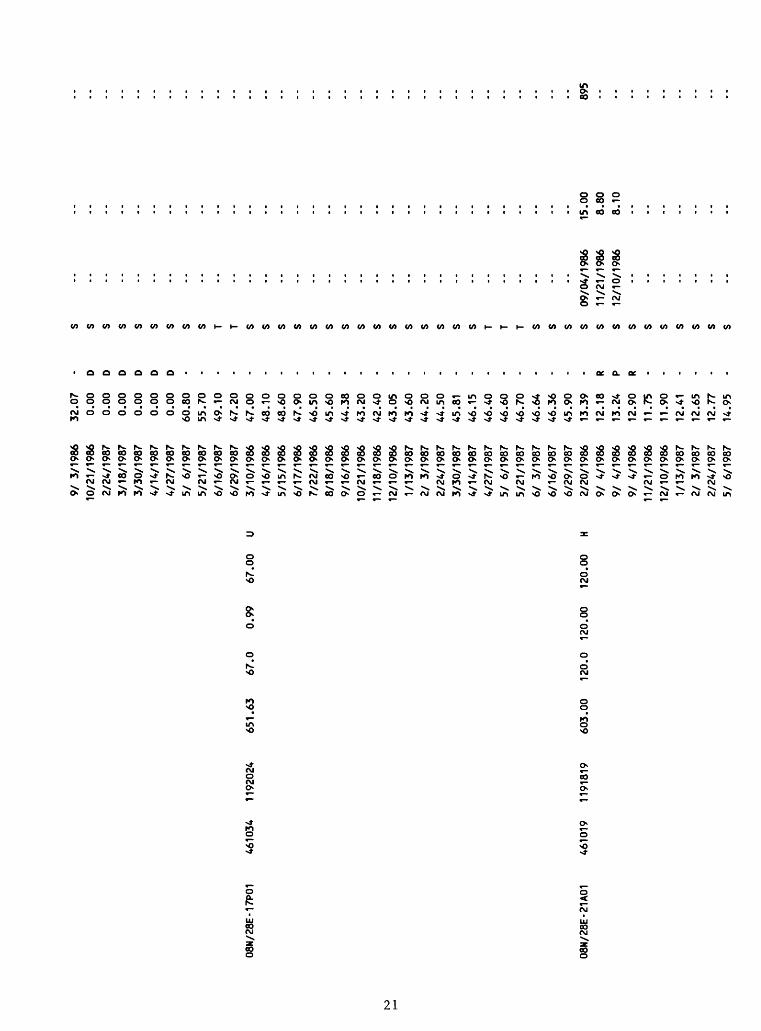
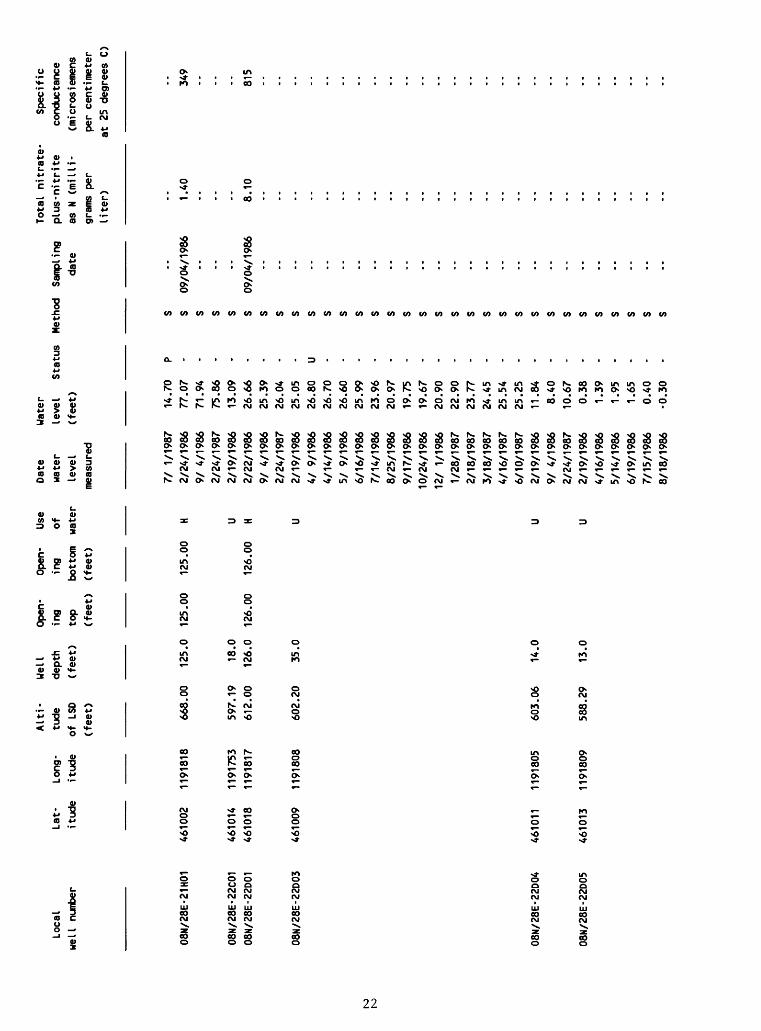
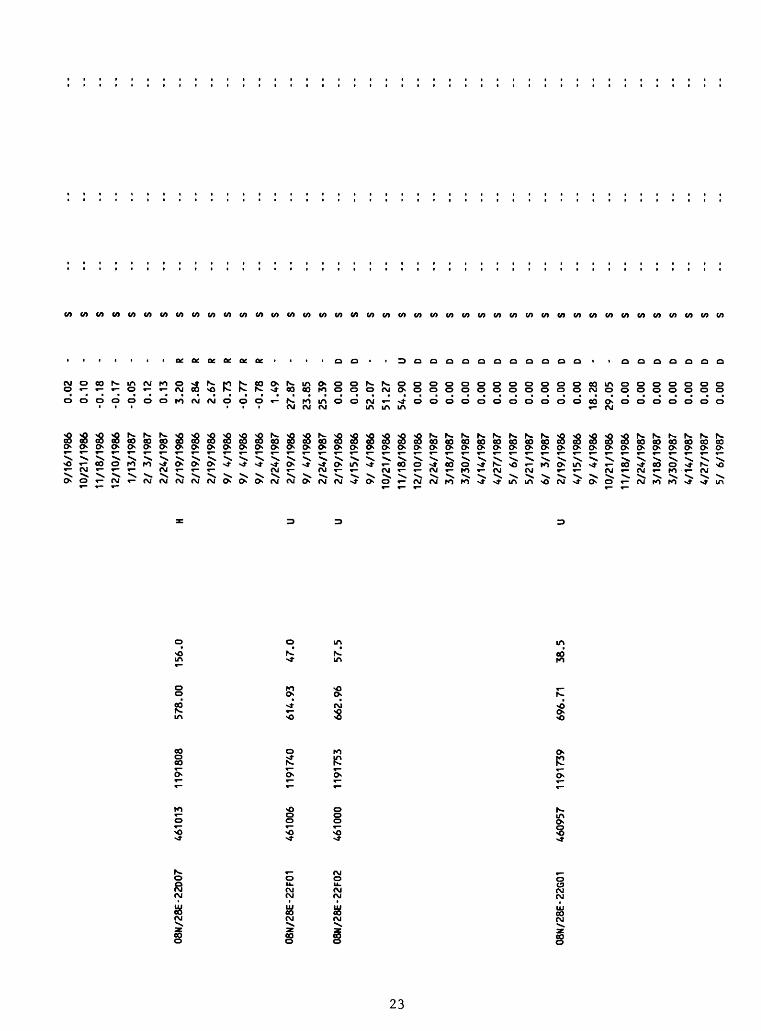
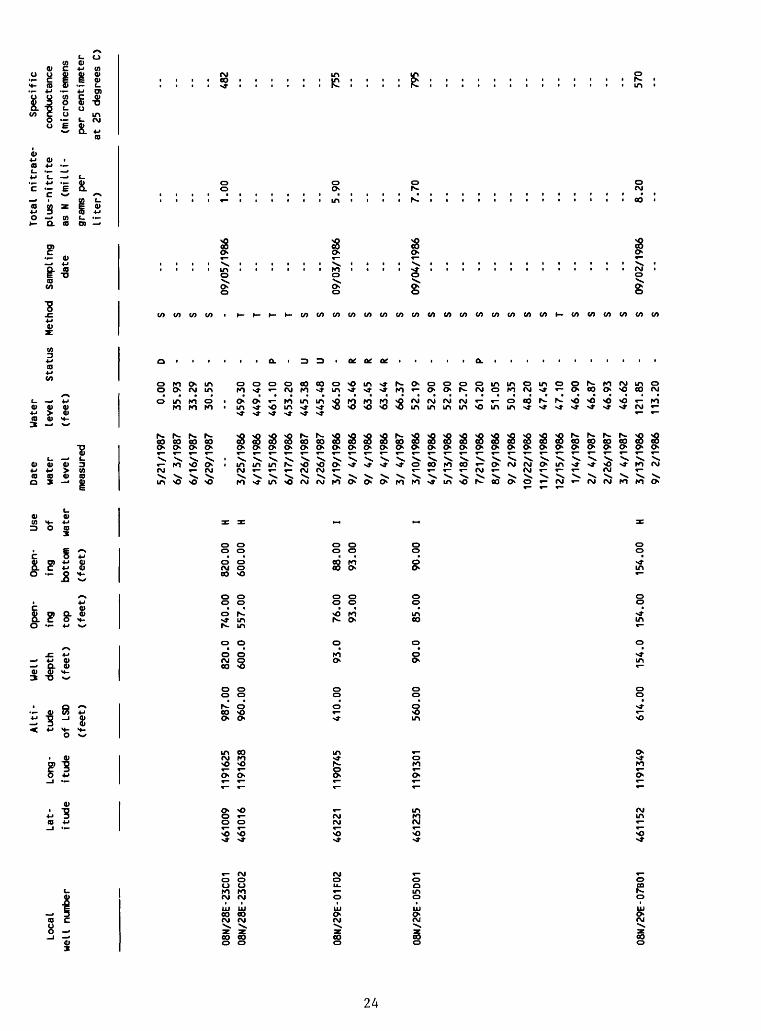
Table l.--Well records, water levels, nitrate-plus-nitrite concentra
tions, and specific-conductance values in wells composing
the water-level network
Altitude of LSD: Altitude of land surface at well head.
Opening data: Refers to interval (in feet below land surface) where well is
open to aquifer. This is generally the screened or perforated section of
a well completed in sediments and the open-hole section of a well
completed in basalt. Where opening top equals opening bottom, well has
only an open-ended casing.
Use of -water: A, air conditioning; H, domestic; I, irrigation; N,
industrial; P, public supply; R, recreation; S, stock; U, unused; Z,
other.
Water levels: Where multiple water levels are shown for the same day in a
well, the water levels were generally taken a few minutes apart and are
presented in the order taken. A negative level indicates a level above
land surface.
Status (of water level): C, cascading; D, dry; F, flowing; I, injector
site; P, pumping; R, recently pumped; S, nearby well pumping; T, nearby
well recently pumped; U, unknown; V, foreign substance on water surface
(oil from turbine pump lubricators, and usually only a few feet thick with
resultant minor effect on water-level mesurement); Z, other.
Method (of water-level measurement): A, airline; G, pressure gage; S, steel
tape; T, electric tape.
13

Loca
l we
lI number
07N/
30E-
01P0
2
-P-
07N/
30E-
01P0
3
07N/
30E-
01Q0
2
07N/
31E-
06N0
1
07N/
31E-
07D0
1
08N/
27E-
01A0
2
08N/
27E-
01A0
3
Alti
- We
ll
Open-
Open
- Use
Lat-
Lo
ng-
tude
depth
ing
ing
ofitude
itude
of LSD
(feet)
top
bott
om
wate
r(f
eet)
(feet)
(fee
t)
4606
37
1190012
550.00
178.0
95.00
178.
00
H
460637
1190
008
543.00
200.
0 11
5.00
200.00
HS
4606
37
1185956
510.00
175.0
175.
00
175.
00
H
4606
41
1185
920
400.00
250.
0 25
.00
250.00
H
460628
1185922
480.00
220.
0 12
2.00
220.00
H
461240
1192
214
674.00
170.0
170.
00
170.00
H
461243
1192212
668.00
140.
0 14
0.00
14
0.00
H
Date
wate
rle
vel
measured
3/11
/198
63/11/1986
3/11/1986
3/11/1986
3/11
/198
63/ 3
/198
73/
3/1987
3/11
/198
63/11/1986
3/28/1986
9/ 8
/1986
2/26
/198
72/20/1986
9/ 8
/198
62/26/1987
2/20/1986
4/18/1986
5/13/1986
6/18/1986
7/22/1986
8/20
/198
69/
11/1
986
10/23/1986
11/20/1986
12/16/1986
2/ 5/1987
2/26
/198
72/22/1986
9/ 2/1986
2/25/1987
2/21/1986
2/21/1986
4/16
/198
6
Water
level
(fee
t) 50.33
51.72
51.7
551
.40
51.1
252.01
51.3
352.57
54.1
481.70
93.80
85.20
57.83
80.7
557
.85
95.2
010
2.20
108.
30117.97
116.
0211
8.70
117.
1010
5.60
101.
1010
5.70
106.
5010
1.80
101.
1295
.07
99.94
94.11
94.1
095.68
Status U U U U U R R U R - - - U U - - R R - - - R - - - - - - - - U U -
Status
Meth
od
Samp
ling
da
te
Total
nitr
ate-
pl
us-n
itri
te
as N
(milli
gram
s per
liter)
Spec
i f i
cco
nduc
tanc
e(m
icro
siem
ens
per
cent
imet
erat 25
deg
rees
C)
09/0
8/19
86
09/0
8/19
86
09/1
1/19
86
3.00
2.30
1.70
620
575
550
09/0
2/19
869.
5096
0
08N/
27E-
01B0
1 461244
1192235
688.
00
160.
0 16
0.00
16
0.00
H
08N/
27E-
01G0
1 46
1227
11
9223
8 781.00
600.0
352.00
600.00
P
08N/
27E-
01J0
2 46
1224
11
9221
0 69
2.00
20
5.0
150.
00
205.00
U
08N/
27E-
01K0
1 46
1216
11
9223
5 769.00
510.0
360.00
510.00
P
08N/
27E-
01R0
1 46
1213
1192217
707.00
328.0
320.00
328.00
H
08N/
27E-
01R0
2 46
1209
11
9221
4 717.00
08N/
28E-
01R0
1 46
1213
11
9143
3 51
7.00
74.0
74.00
74.0
0 H
5/14
/198
69/
2/1986
2/25/1987
2/19/1986
9/ 2/1986
9/ 2/1986
2/25
/198
72/
25/1
987
2/21
/198
69/
3/1
986
2/26/1987
2/21
/198
64/
16/1
986
5/14
/198
66/19/1986
7/15/1986
8/18/1986
9/ 2/1986
10/21/1986
11/1
8/19
8612/10/1986
1/13/1987
1/13/1987
2/ 3
/198
72/
25/1
987
2/21
/198
69/
3/1
986
2/26
/198
72/
21/1
986
2/21
/198
62/21/1986
9/ 3
/1986
2/26
/198
72/
21/1
986
9/ 3
/198
69/
3/1
986
2/26
/198
72/26/1987
2/26
/198
72/
24/1
986
9/ 5/1986
2/23/1987
95.60
89.32
93.19
130.
6210
9.62
109.
06114.71
114.77
308.70
310.20
308.70
110.
1011
1.69
108.
8510
8.00
105.
9510
4.00
103.
4610
3.28
104.
2010
5.85
106.
4010
7.40
108.
6510
8.74
201.70
226.60
201.70
199.
6019
9.30
199.
20219.40
193.
0018
8.80
225.20
224.60
189.
3018
9.10
188.
9044.70
38.8
443
.65
- U - U R R R R - - - - - U - - - - - - - U U U - - c - R R R - - - P P R R R - - U
T S S S S S S S T T T S S S S S S S S S S S S S S T T T T T T T T T T T T T T S S S
09/0
2/19
8612
.00
762
09/0
3/19
860.
137
3
09/0
3/19
860.
180
5
09/0
5/19
865.30
570
Alti
- We
ll
Open-
Open-
Use
Local
Lat-
Long
- tude
depth
ing
ing
ofwe
ll number
itud
e itude
of LS
D (f
eet)
to
p bo
ttom
wa
ter
(fee
t)
(fee
t)
(fee
t)
08N/28E-01R03
4612
08
1191
430
550.00
180.
0 140.00
180.
00
H
08N/
28E-
02P0
1 46
1213
11
9162
9 574.00
125.
0 100.00
125.
00
I
08N/
28E-
03P0
1 46
1211
11
9175
0 822.00
633.0
206.00
415.00
H626.00
633.00
08N/28E-06B01D2
461240
1192
117
711.00
281.0
220.00
274.00
I278.00
281.00
08N/
28E-
06D0
1 46
1244
11
9215
0 683.00
193.
0 19
3.00
19
3.00
H
08N/
28E-
06G0
1 46
1230
11
9211
0 706.00
332.0
282.00
322.00
I
Date
wate
rlevel
measured
3/10/1986
9/ 5
/1986
9/ 5
/1986
9/ 5/1986
2/23
/198
72/
24/1
986
9/ 4
/198
62/23/1987
3/12
/198
69/
5/1986
3/ 3
/198
72/24/1986
9/ 3
/198
69/19/1986
10/24/1986
10/24/1986
12/
1/1986
12/
1/1986
1/28/1987
2/18
/198
72/25/1987
2/25/1987
2/25
/198
73/
18/1
987
2/20
/198
62/20/1986
2/20
/198
69/
3/1
986
2/25
/198
72/
24/1
986
9/ 3/1
986
9/19
/198
6
Water
leve
l(f
eet) 69.36
80.60
76.3
573
.93
67.66
46.1
746
.92
43.63
334.
37333.70
333.
5317
6.00
237.00
172.38
162.
8016
5.40
164.
2016
3.65
155.
0015
4.30
159.17
158.11
158.41
152.66
103.27
102.98
102.
9410
3.60
101.87
146.
00230.00
162.89
Status R R R - - - - - U P U U U U U - - U U U - R R R - - - P U
date
09/0
5/19
86
Total
nitrate-
plus
-nit
rite
as N
(mil
li
grams
per
liter) 0.
10
Spec
ific
conductance
(mic
rosi
emen
spe
r ce
ntim
eter
at 25 d
egrees C)
1410
09/05/1986
0.1
460
09/0
3/19
8616.00
701

08N/
28E-
07A0
2 461207
1192102
699.00
204.0
200.00
204.00
U
08N/
28E-
07A0
3 461154
1192102
691.00
225.0
195.00
225.00
U
08N/
28E-
07A0
3D1
461154
1192102
691.00
233.
0 213.00
233.00
I
08N/28E-07B01D2
461205
1192125
08N/
28E-
07D0
1 46
1156
11
9214
8
08N/
28E-
07K0
1 46
1137
1192124
680.00
220.0
HS
693.00
260.
0 70.00
260.00
H
677.00
9/19
/198
610/24/1986
10/24/1986
12/
1/1986
12/
1/1986
1/28/1987
2/18
/198
72/
25/1
987
3/18
/198
72/20/1986
8/25/1986
9/ 3
/198
69/
19/1
986
10/24/1986
12/
1/1986
1/28
/198
71/28/1987
2/18
/198
73/
18/1
987
4/16
/198
76/11/1987
2/20/1986
4/ 9
/198
64/
14/1
986
5/ 9
/198
66/
16/1
986
7/14
/198
68/
25/1
986
10/2
4/19
8612/
1/1986
1/28
/198
72/
18/1
987
2/24
/198
73/18/1987
4/16
/198
73/
10/1
986
9/ 3
/198
62/
25/1
987
3/11
/198
69/ 3
/198
62/
25/1
987
3/11
/198
6
162.87
156.46
156.
30153.23
153.
3014
9.30
149.
9014
8.38
147.38
124.08
125.
10125.01
123.
60122.07
121.96
121.73
121.
4012
2.70
122.48
123.
94126.29
109.
2511
6.00
111.
30111.20
107.81
105.68
104.21
102.
6010
3.85
105.
6310
6.72
106.
54107.10
108.
1096.68
89.03
94.79
108.
4095.81
106.11
94.20
U U U U U - - - - - - - - - - U U - - - - - U - - U - - U - - - - - - - - R - - -
s s s s s s s s s s s s s s s s s s s s s s s s s s s s s s s s s s s s s s T s s s
09/03/1986
09/0
3/19
86
3.60
2.80
564
403
08N/
28E-
08D0
1
08N/28E-08N01
08N/28E-11Q01
00
08N/28E-11R01
08N/28E-12B02
08N/
28E-12C03
08N/28E-12D02
Alti-
Well
Open
- Open-
Use
Lat-
Lo
ng-
tude
de
pth
ing
ing
ofitude
itud
e of LS
D (feet)
top
bott
om
wate
r(f
eet)
(feet)
(feet)
461206
1192049
707.
00
200.0
200.
00
200.
00
H
461127
1192047
675.
00
225.0
194.
50
225.
00
I
4611
14
1191618
577.
00
120.0
109.
00
115.00
H
120.
00
120.00
461118
1191603
610.
00
320.
0 28.00
320.
00
H
4611
53
1191452
567.
00
105.0
105.
00
105.00
H
4611
55
1191523
611.
00
118.0
118.
00
118.
00
H
4611
55
1191534
602.
00
142.0
128.00
133.
00
U
Date
wate
rlevel
meas
ured
9/ 3
/198
62/
25/1
987
3/12
/198
6
9/ 2/
1986
2/24
/198
7
2/20/1986
9/ 3/
1986
2/24
/198
7
2/23/1986
4/15
/198
6
5/14/1986
6/19
/198
6
7/15
/198
6
8/18/1986
9/16
/198
6
10/2
1/19
86
11/1
8/19
86
12/1
0/19
86
12/1
0/19
86
1/13
/198
7
2/ 3
/1987
2/24/1987
2/23
/198
6
9/ 4/
1986
2/24
/198
7
3/10/1986
9/ 4/1986
2/23
/198
7
2/24/1986
9/ 4
/198
62/23/1987
2/24/1986
Wate
r
leve
l
(feet) 85.8
6
92.0
0
139.
30
141.
99
137.
37
96.3
0
90.4
8
93.5
4
63.4
3
62.04
61.1
559
.20
57.9
0
57.70
57.00
56.3
7
56.5
0
57.84
57.8
2
58.5
0
58.8
0
58.92
101.72
99.6
9
100.42
51.1
4
45.7
3
49.85
92.95
89.14
92.0
0
93.2
0
Stat
us - - - - V V - R - - - - - - - - R R - U - - - U - - - - - - -
09/1
6/19
861.
60357
09/04/1986
09/0
4/19
86
09/0
4/19
86
0.30
1.50
5.00
408
441
680
08N/
28E-
12M0
1
142.00
142.00
4611
33
1191
532
583.00
358.0
20.0
0 35
8.00
H
08N/
28E-
14C0
1
08N/
28E-
14C0
2
4610
59
1191628
604.
00
140.
0 11
7.00
140.00
H
461102
1191
626
598.00
140.
0 13
1.00
140.00
H
08N/
28E-
14M0
2
08N/
28E-
14R0
2
08N/
28E-
15N0
3
08N/
28E-
15P0
1
4610
41
1191
643
589.00
190.
0 19
0.00
190.00
H
4610
26
1191554
930.00
515.0
499.00
504.
00
H515.00
515.00
4610
24
1191808
578.14
2.4
U
4610
27
1191741
587.
00
108.
0 103.00
108.00
H
9/ 4
/1986
2/23/1987
2/23/1986
4/ 9/1986
4/14/1986
5/ 9/1986
6/16
/198
67/14/1986
8/25/1986
9/17
/198
610/23/1986
12/
1/19
861/28/1987
1/28/1987
2/18
/198
73/
18/1
987
4/15/1987
6/ 9/1987
2/23
/198
69/
4/1986
2/24
/198
74/
16/1
986
4/16
/198
64/
16/1
986
4/16/1986
9/ 4/1986
3/ 4
/198
72/23/1986
9/ 5/1986
2/28/1987
3/11/1986
2/19
/198
64/
15/1
986
9/ 4/1986
2/24/1987
2/19
/198
64/
15/1
986
5/14
/198
66/
19/1
986
7/15
/198
68/
18/1
986
89.78
-92.26
-69.03
-69
.25
-68.50
U63.20
-59.27
-57
.32
-58.47
-58
.11
-58
.82
-60
.95
-66.72
U66.62
U67.45
-67.42
-67.99
-61.22
-79.47
-78.07
-76.13
-76.21
R76.12
R76
.02
R75.98
R74.41
U72.78
U85.52
-84.62
-82
.51
-441.50
-
0.12
-
0.21
-0.1
1 -
0.04
-
57.63
-57.70
-58.80
-59
.50
-59
.75
-59
.70
-
S S S s s s s s s s s s s s s s s s s s s S 09/04/1986
S s s s s S 09/05/1986
S S s s s s s S 09/16/1986
S 11/21/1986
S 12/10/1986
S S s
-- -- -- -- -- -- -- -- -- -- -- - -- -- -- -- -- -- -- -- -- 3.00
-- -- -- -- -- 2.50
-- - -- -- - -- 17.0
010
.00
9.40
-- -- --
510
505
860
ro
o
08N/
28E-
15P0
2
08N/
28E-
15P0
3 08
N/28
E-15
P04
08N/
28E-
15P0
5
08N/
28E-
15Q0
1
08N/
28E-
16L0
1
08N/
28E-
16R0
1
08N/
28E-
17N0
1
08N/
28E-
17N0
2
Alti
- We
ll
Open-
Open
- Us
eLat-
Long-
tude
depth
ing
ing
ofitude
itud
e of
LS
D (feet)
top
bott
om water
(fee
t)
(feet)
(feet)
4610
27
1191
754
574.
10
4.0
U
4610
20
1191757
576.40
18.0
U
461024
1191
746
591.
26
28.0
U
4610
23
1191
749
586.64
24.0
U
461025
1191725
575.00
193.
0 110.00
185.00
U19
1.00
193.00
461035
1191858
614.
00
60.0
60
.00
60.00
H
4610
22
1191827
612.
00
114.
0 10
4.00
114.00
H
4610
25
1192038
699.
13
65.0
0.
99
70.00
U
4610
24
1192
039
701.00
62.8
0.99
70.00
U
Date
water
leve
lme
asur
ed
9/16
/198
610/21/1986
11/18/1986
12/10/1986
1/13
/198
72/ 3/
1987
2/24/1987
5/ 6/
1987
7/ 1/1987
7/ 1/1987
2/19
/198
69/ 4/
1986
2/ 4/
1987
2/19/1986
2/19/1986
9/12/1986
2/24
/198
72/19/1986
9/12/1986
2/24/1987
2/28
/198
7--
2/20/1986
9/ 4/
1986
2/24
/198
72/20/1986
9/ 4/
1986
2/24/1987
3/10
/198
69/ 3/
1986
2/24
/198
73/
10/1
986
Water
leve
l(f
eet) 71.3
256
.84
55.5
055
.50
55.33
55.2
454
.74
55.96
57.5
357.52
1.40
3.85
3.55
0.00
19.5
219.25
18.5
614.13
13.8
613.14
47.6
7-- 21.10
19.44
20.40
24.47
23.07
23.82
0.00
0.00
0.00
0.00
Status P - - - - - - - R R - - - - - - - - - - - - - - - - - D D D D
09/04/1986
09/0
4/19
86
11.0
0
29.00
724
965
08N
/28E
-17P
01461034
1192
024
651.
63
67.0
0.99
67.0
0 U
08N/
28E-
21A0
146
1019
11
9181
960
3.00
12
0.0
120.
00
120.00
H
9/ 3
/198
610/21/1986
2/24
/198
73/18/1987
3/30/1987
4/14/1987
4/27
/198
75/
6/1
987
5/21/1987
6/16
/198
76/
29/1
987
3/10
/198
64/
16/1
986
5/15
/198
66/
17/1
986
7/22/1986
8/18
/198
69/
16/1
986
10/2
1/19
8611/18/1986
12/1
0/19
861/13/1987
21 3
/198
72/24/1987
3/30
/198
74/
14/1
987
4/27
/198
75/
6/1
987
5/21
/198
76/
3/1
987
6/16
/198
76/29/1987
2/20/1986
9/ 4
/1986
9/ 4
/1986
9/ 4
/1986
11/21/1986
12/10/1986
1/13/1987
21 3
/198
72/
24/1
987
5/ 6
/198
7
32.07
0.00
0.00
0.00
0.00
0.00
0.00
60.80
55.70
49.10
47.20
47.00
48.10
48.60
47.90
46.50
45.60
44.38
43.20
42.40
43.05
43.60
44.20
44.50
45.81
46.15
46.40
46.60
46.70
46.64
46.3
645.90
13.3
912
.18
13.2
412
.90
11.7
511
.90
12.41
12.6
512.77
14.95
- D D D D D D - - - - - - - - - - - - - - - - - - - - - - - - - - R P R - - - - - -
s s s s s s s s s T T s s s s s s s s s s s s s s s T T T s s s S 09/04/1986
15.0
0S
11/21/1986
8.80
S 12/10/1986
8.10
s s s s s s s
895
Local
well
number
08N/
28E-
21H0
1
08N/
28E-
22C0
1 08
N/28
E-22
D01
08N/
28E-
22D0
3
N3
08N/
28E-
22D0
4
08N/
28E-
22D0
5
Alti-
Well
Open-
Open-
Use
Lat-
Long-
tude
de
pth
ing
ing
ofit
ude
i tilde
of L
SD
(fee
t)
top
bottom
wate
r(feet)
(feet)
(feet)
4610
02
1191
818
668.00
125.
0 12
5.00
125.00
H
461014
1191
753
597.
19
18.0
U
4610
18
1191
817
612.00
126.
0 12
6.00
12
6.00
H
4610
09
1191808
602.20
35.0
U
4610
11
1191805
603.06
14.0
U
461013
1191
809
588.29
13.0
U
Date
water
level
measured
7/ 1/1987
2/24/1986
9/ 4
/198
62/
24/1
987
2/19
/198
62/
22/1
986
9/ 4/
1986
2/24
/198
72/19/1986
4/ 9/
1986
4/14
/198
65/
9/1
986
6/16
/198
67/14/1986
8/25
/198
69/
17/1
986
10/2
4/19
8612/
1/1986
1/28
/198
72/
18/1
987
3/18
/198
74/
16/1
987
6/10
/198
72/
19/1
986
9/ 4/
1986
2/24
/198
72/
19/1
986
4/16
/198
65/14/1986
6/19
/198
67/15/1986
8/18
/198
6
Wate
rlevel
Status
(feet) 14.70
77.07
71.94
75.86
13.0
926.66
25.39
26.0
425
.05
26.8
026.70
26.6
025.99
23.96
20.9
719.75
19.67
20.90
22.90
23.77
24.4
525
.54
25.2
511.84
8.40
10.6
70.38
1.39
1.95
1.65
0.40
-0.30
P - - - - - - - - U - - - - - - - - - - - - - - - - - - - - - -
Method
Sampling
date
s S 09
/04/
1986
S S s S 09
/04/
1986
S S S S S S S S S S s s s s s s s s s s s s s s s s
Total
nitrate-
Spec
ific
plus-nitrite
conductance
as N
(mi Hi-
(mic
rosi
emen
sgr
ams
per
per
centimeter
lite
r)
at 2
5 de
gree
s C)
1 .40
349
-- .. -- 8.10
81
5-- -- -- .. -- .. .. -- .. -- .. -- -- -- -- .. -- .. -- .. -- -- -- -- .. ..
08N
/28E
-22D
07
4610
13
1191
808
57
8.0
0
156.
0
08N/
28E-
22F0
1 46
1006
1191740
614.
93
47.0
08N
/28E
-22F
02
4610
00
1191
753
66
2.9
6
57.5
N5
08N
/28E
-22G
01
4609
57
1191
739
696.
71
38.5
9/16/1986
10/21/1986
11/1
8/19
8612/10/1986
1/13/1987
2/ 3
/198
72/
24/1
987
2/19/1986
2/19/1986
2/19/1986
9/ 4/1
986
9/ 4
/1986
9/ 4
/198
62/
24/1
987
2/19/1986
9/ 4
/198
62/24/1987
2/19
/198
64/
15/1
986
9/ 4/1
986
10/21/1986
11/1
8/19
8612
/10/
1986
2/24
/198
73/
18/1
987
3/30/1987
4/14
/198
74/
27/1
987
5/ 6
/198
75/
21/1
987
6/ 3
/198
72/19/1986
4/15/1986
9/ 4/1
986
10/2
1/19
8611/18/1986
2/24
/198
73/18/1987
3/30
/198
74/
14/1
987
4/27
/198
75/ 6
/198
7
0.02
0.10
-0.1
8-0
.17
-0.05
0.12
0.13
3.20
2.84
2.67
-0.7
3-0.77
-0.78
1.49
27.87
23.8
525
.39
0.00
0.00
52.07
51.27
54.90
0.00
0.00
0.00
0.00
0.00
0.00
0.00
0.00
0.00
0.00
0.00
18.2
829.05
0.00
0.00
0.00
0.00
0.00
0.00
0.00
- - - - - - R R R R R R - - - D D - U D D D D D D D D D D D - - D D D D D D D
S S S S S S S S S S S S S S S S S S S S S S S S S S S S S S S S S S S S S S S S S S
Local
well
number
08N/
28E-
23C0
108
N/28
E-23
C02
08N/
29E-
01F0
2
08N/29E-05D01
08N/
29E-
07B0
1
Alti
- Well
Open
- Op
en-
Use
Date
Lat-
Lo
ng-
tude
depth
ing
ing
of
water
itud
e itude
of LS
D (f
eet)
to
p bo
ttom
wa
ter
leve
l(f
eet)
(f
eet)
(f
eet)
me
asur
ed
5/21
/198
76/ 3
/198
76/16/1987
6/29
/198
746
1009
11
9162
5 98
7.00
820.0
740.00
820.00
H46
1016
11
9163
8 960.00
600.
0 557.00
600.00
H 3/25/1986
4/15
/198
65/
15/1
986
6/17
/198
62/
26/1
987
2/26/1987
461221
1190
745
410.
00
93.0
76.00
88.00
I 3/
19/1
986
93.00
93.00
9/ 4
/198
69/
4/1
986
9/ 4
/198
63/
4/1987
461235
1191
301
560.00
90.0
85.00
90.00
I 3/
10/1
986
4/18
/198
65/
13/1
986
6/18
/198
67/
21/1
986
8/19/1986
9/ 2
/198
610/22/1986
11/19/1986
12/15/1986
1/14/1987
2/ 4
/198
72/
26/1
987
3/ 4
/1987
4611
52
1191349
614.
00
154.0
154.00
154.00
H 3/
13/1
986
9/ 2/1986
Wate
rlevel
Status
(fee
t) 0.00
D35.93
-33.29
-30.55
---
459.30
-44
9.40
-
461.10
P45
3.20
-
445.
38
U44
5.48
U
66.5
0 -
63.46
R63.45
R63.44
R66.37
-52
.19
-52.90
-52.90
-52.70
-61.20
P51
.05
-50.35
-48.20
-47
.45
-47.10
-46.90
-46
.87
-46
.93
-46.62
-121.85
-11
3.20
-
Meth
od
Sampling
date
S S S S - 09
/05/
1986
T T T T S S S 09/03/1986
S S S S S 09
/04/
1986
S S S S S S S S T S S S S S 09
/02/
1986
S
Tota
l ni
trat
e-
Spec
ific
pi us -n
it rite
conductance
as N
(m
i Hi
- (m
icro
siem
ens
grams
per
per
cent
imet
erliter)
at 25 degrees
C)
-- -- -- 1.00
48
2-- -- -- -- -- -- 5.90
755
-- .. .. -- 7.70
795
-- -- -- .. -- .. .. -- -- -- -- -- -- 8.20
570
--

08N/
29E-
10C0
1
08N/
29E-
12B0
1
08N/
29E-
12G0
1
08N/
29E-
12H0
1
08N/
29E-
13A0
1
4611
50
1191
012
4611
42
1190
732
461135
1190
720
4611
39
1190
704
4611
01
1190711
554.
00
90.0
85.00
90.00
H
388.
00
64.0
52.6
0 64.00
I
383.
00
61.0
61.00
61.00
U
380.
00
125.
0 58.00
62.00
I62.00
125.00
430.
00
160.
0 75
.00
160.
00
H
Ln
08N/
29E-
16H0
146
1050
1191048
709.00
388.0
0.99
0.99
HI
08N/29E-17G02
08N/
29E-
17L0
1
4610
40
1191
230
4610
37
1191
242
759.
00
245.0
18.0
0 245.00
H
812.
00
352.0
112.00
132.
00
H 33
2.00
352.00
2/25/1987
3/14
/198
69/ 3
/1986
2/26/1987
3/11
/198
69/
3/1986
2/25/1987
3/11
/198
69/
3/1986
2/25/1987
2/21/1986
9/ 3
/198
62/
25/1
987
2/19/1986
4/18/1986
5/13/1986
6/18
/198
67/22/1986
8/20/1986
9/11
/198
610
/23/
1986
11/20/1986
12/1
6/19
861/15/1987
2/ 5/
1987
2/26/1987
5/ 7/
1987
7/ 1/1987
3/10
/198
69/ 2/1986
9/ 2/1986
9/ 2/1986
2/25
/198
73/
10/1
986
9/16/1986
2/25/1987
3/13/1986
3/13
/198
63/13/1986
4/18/1986
5/13
/198
66/
18/1
986
118.33
-65.57
-58
.65
-64.56
-38.33
-36.66
-38.23
-40.46
-37.24
-40.33
-35.17
-30.89
-35
.21
-39.38
-38.68
37.53
-38.00
-38.20
-37.10
-35.70
-34.60
-33.00
-33.20
-33.20
-32.20
-32.81
38.52
-34.22
-154.99
-168.07
R167.97
R16
7.95
R
154.
40
-71.20
-64.00
-75
.00
-10
3.55
R
103.
54
R10
3.53
R
103.
90
-10
3.15
-
103.
45
S s S s s s s s s s s s s s s s T T T T T T T T T S S S s s s s s T T T S S S S S s
.. .. -- --09
/03/
1986
7.
90-- ..
09/03/1986
5.00
-- ..
09/04/1986
1.70
-- ..
09/1
1/19
86
< 0.1
12/16/1986
< 0.
1.. -- .. -- .. .. .. .. -- .. .. -- .. -- .. .. -- ..
09/0
2/19
86
2.60
09/16/1986
2.50
--
09/02/1986
3.20
-- .. .. .. ..
-- - -- -- 838
-- -- 855
-- -- 625
-- -- 345
-- -- -- -- -- -- -- -- -- -- -- -- -- -- -- -- -- -- -- 752
752
-- 466
-- -- -- -- --
08N/29E-24D01
08N/30E-04N02
08N/30E-05J01
08N/30E-05K01
Alti
- Well
Open
- Open-
Use
Lat-
Lo
ng-
tude
depth
ing
ing
ofitude
itud
e of LS
D (feet)
top
bott
om
water
(fee
t)
(feet)
(feet)
4610
03
1190803
605.
00
300.
0 H
4611
56
1190
418
339.
00
25.0
25.00
25.0
0 I
4612
17
1190
446
340.
00
125.
0 99.00
125.00
P
461215
1190
455
345.
00
36.0
36.00
36.00
H
Date
wate
rle
vel
meas
ured
7/22
/198
68/18/1986
9/ 2/1986
10/21/1986
11/18/1986
12/10/1986
1/13/1987
2/27
/198
72/27/1987
2/27
/198
72/
27/1
987
--
3/12/1986
2/27
/198
72/
20/1
986
9/ 6
/198
69/ 6
/198
69/
6/1
986
9/ 6
/198
62/
27/1
987
3/13
/198
64/
18/1
986
5/13
/198
66/18/1986
7/22/1986
8/20
/198
68/
20/1
986
9/ 4
/198
610/23/1986
11/20/1986
11/20/1986
12/16/1986
Water
level
(fee
t)
102.90
104.90
102.88
103.97
104.20
104.80
104.
80143.18
138.
8513
8.55
137.
62-- 10.9
010
.13
5.60
23.12
19.95
19.9
419
.93
5.89
15.7
016.55
16.1
016.15
16.15
16.15
16.1
015
.77
15.35
15.4
715.45
15.5
3
Stat
us P - - u - - - R R R R - - - - R R R R - - - - P - U U - - R R -
Method
Samp
ling
date
S S S S T T T S S S S - 09
/27/
1986
S 09
/06/
1986
S S 09
/06/
1986
S S S S S S 09
/05/
1986
S S S S S S S S S S S
Total
nitr
ate-
Specific
plus
-nit
rite
conductance
as N
(mi Hi-
(mic
rosi
emen
sgrams
per
per
centimeter
liter)
at 2
5 de
gree
s C)
.. -- .. .. .. .. .. .. -- -- 0.80
310
6.50
80
5..
< 0.1
305
-- .. -- .. .. 8.30
861
-- .. -- .. .. .. .. -- .. -- ..

08N/
30E-
05K0
2 46
1208
1190455
343.
00
32.0
32.0
0 32
.00
HI
08N/
30E-
07E0
2 46
1137
11
9064
9
08N/
30E-
07G0
2 46
1128
1190612
08N/
30E-
07G0
3 46
1129
1190604
08N/
30E-
07J0
2 46
1127
11
9054
9
380.
00
55.0
55.00
55.00
H
376.
00
105.
0 76.00
105.00
H
371.
00
39.0
39.0
0 39.00
H
365.
00
45.0
45.0
0 45.00
H
08N/
30E-
07L0
1 46
1119
1190635
368.
00
39.0
34.0
0 39.00
H
1/15/1987
2/ 5/1987
2/27
/198
72/20/1986
4/18/1986
5/13/1986
5/13/1986
6/18/1986
7/22
/198
68/20/1986
9/ 5
/1986
10/2
3/19
8611/20/1986
12/16/1986
1/15/1987
2/ 5
/1987
2/27/1987
2/20/1986
9/ 3
/198
62/24/1987
2/19/1986
9/ 3
/198
62/26/1987
2/19/1986
9/ 3
/198
62/26/1987
2/19/1986
4/18
/198
65/13/1986
6/18/1986
7/22/1986
8/20/1986
9/ 4
/198
610/23/1986
11/2
0/19
8612
/16/
1986
1/15/1987
2/ 5
/1987
2/26/1987
2/19/1986
2/19/1986
9/ 4
/198
6
15.70
15.7
115.70
16.3
717
.18
16.7
816.73
16.9
816
.88
16.8
816
.37
16.1
816.13
16.1
916
.38
16.3
816.42
34.79
30.7
534
.75
37.11
34.32
37.05
33.13
28.8
233.07
28.40
28.7
027.70
26.5
025
.80
25.30
24.8
025
.34
26.29
27.00
27.6
528
.05
28.38
21.10
21.06
16.34
- - - - - U U P P P R P - - - - R - - - - U - - - - - - - - - - - - - - - - - U U -
s s s s s s s s s s s s s s s s s s s s s s s s s s s s s s s s s s s s s s s s s s
09/05/1986
6.00
769
09/0
3/19
865.
00675
09/0
3/19
86
09/0
4/19
86
1.60
3.70
396
593
09/04/1986
6.40
739

Local
well number
08N/
30E-
07L0
2
08N/
30E-
07L0
3
08N/
30E-
07N0
2
00
08N/
30E-
07P0
2
08N/
30E-
07Q0
4
08N/
30E-
08E0
1
08N/
30E-
09C0
1
08N/
30E-
09C0
2
Alti
- We
ll
Open
- Open-
Use
Lat-
Long
- tude
depth
ing
ing
ofit
ude
itud
e of
LSD
(fee
t)
top
bott
om
water
(fee
t)
(feet)
(fee
t)
461124
1190636
381.
00
48.6
43
.60
48.60
H
4611
16
1190
637
370.
00
48.0
48.0
0 48.00
H
4611
11
1190
648
380.
00
55.0
45.0
0 55.00
H
4611
03
1190
624
361.00
43.0
39.0
0 43.00
H
461102
1190606
362.00
38.0
38.0
0 38.00
H
4611
28
1190
541
362.
00
74.0
74.0
0 74.00
H
4611
41
1190
404
343.00
182.
0 85
.00
182.
00
H
4611
51
1190406
335.00
94.0
74.5
0 94.00
U
Date
water
level
meas
ured
2/26
/198
72/18/1986
9/ 3
/1986
2/26/1987
2/19
/198
69/
4/1986
2/26
/198
72/20/1986
9/ 4
/1986
2/24
/198
72/
24/1
987
2/24
/198
73/
14/1
986
9/ 4
/1986
2/24
/198
73/
12/1
986
9/ 4
/1986
9/ 4
/1986
9/ 4
/1986
9/ 4
/1986
2/24/1987
3/12/1986
9/11/1986
2/24/1987
2/21
/198
69/
5/1986
9/ 5
/1986
9/ 5/1986
9/ 5/1986
9/ 5
/1986
2/27/1987
3/12/1986
Water
level
(fee
t) 21.1
531.83
27.3
331.88
26.7
022.10
26.73
32.39
28.7
032
.40
32.3
932.38
17.9
813.90
17.50
18.20
14.0
814.10
14.0
614
.05
17.6
831.50
28.2
031.31
5.07
18.9
617.32
16.9
016
.58
16.4
35.78
0.48
Status - - - - - - - - U U U - - - - U U U U - - - - - R R R R R - -
Meth
od S S S S S S S S S S S S S S S S S S S S S S S S S S S S S S S S
Samp
ling
date
09/03/1986
-- --
09/0
4/19
86-- --
09/0
4/19
86-- -- -- -- -- -- --
09/04/1986
-- -- -- -- --
09/1
1/19
86-- --
09/05/1986
-- -- -- -- -- --
09/0
5/19
86
Total
nitr
ate-
plus-nitrite
as N
(milli
grams
per
liter) 3.
90 - -- 4.00
-- -- 4.60
-- -- -- -- -- -- -- 9.20
-- -- -- -- -- 5.50
-- --
< 0.1
-- -- -- -- -- -- 1.90
Specific
conductance
(mic
rosi
emen
spe
r ce
ntim
eter
at 2
5 de
gree
s C)
579
-- -- 610
-- -- 685
-- -- -- -- -- -- -- 928
-- -- -- -- -- 726
-- -- 402
-- -- -- -- -- -- 737
08N/30E-09L02
461123
1190405
350.
00
43.0
38.00
43.0
0 H
1X3
08N/30E-10M03
461114
1190301
362.
00
49.0
44.00
49.00
H
08N/
30E-
14C0
1 461049
1190131
360.
00
50.0
45.00
50.00
H
08N/
30E-
14M0
1 461032
1190
141
357.
00
160.
0 49.00
160.00
H
08N/
30E-
15K0
1 461023
1190
234
351.
00
34.0
29.00
34.00
H
08N/
30E-
15N0
1 461010
1190
310
338.
00
245.0
60.00
245.00
H
08N/30E-16B03
461048
1190338
357.
00
34.0
29.0
0 34.00
H
08N/
30E-
16F0
1 461045
1190356
350.
00
50.0
45.00
50.00
H
9/ 5/
1986
9/ 5/
1986
9/ 5/
1986
9/ 5/
1986
9/ 5/
1986
2/27
/198
72/
27/1
987
2/27
/198
73/12/1986
9/ 5/
1986
9/ 5/
1986
9/ 5/
1986
2/27
/198
72/
21/1
986
9/ 4
/198
62/
24/1
987
3/12
/198
69/
4/
1986
2/24
/198
73/
14/1
986
9/ 6
/198
62/
24/1
987
3/12
/198
64/18/1986
5/13
/198
66/
18/1
986
7/22
/198
68/
20/1
986
9/ 6
/1986
10/23/1986
11/20/1986
12/16/1986
1/15
/198
72/
5/1
987
2/24
/198
73/
26/1
986
3/ 4
/1987
3/28
/198
69/
4/1
986
2/27
/198
73/
14/1
986
9/ 6
/198
6
13.4
610.47
7.88
7.84
7.80
3.07
3.12
3.11
21.13
20.32
20.29
20.28
21.40
25.66
25.24
25.90
29.30
30.75
30.6
023
.75
23.71
24.43
16.09
17.95
15.5
015
.10
15.6
015
.60
15.2
815
.40
15.74
15.9
316.15
16.31
16.3
70.00
0.00
18.4
017
.70
18.7
421
.13
20.42
R R R R R U U U - R R R - - - - - - - - - - - - - - - - - - - - - - - F f P U
s s s s s s s s s s s s s s s s s s s s s s s s s s s s s s s s s s s - - T s s s s
-- -- -- -- -- -- -- --09
/05/
1986
-- -- -- --
09/05/1986
-- --
09/0
5/19
86-- -
09/0
6/19
86-- --
09/0
6/19
86 - -- -- -- -- -- -- -- -- -- -- -- -- --
09/0
5/19
86-- --
09/0
6/19
86--
6.90
815
0.70
0.30
0.30
1.70
250
161
1010 416
5.80
5.30
620
660

Local
well
nu
mber
08N/30E-16N02
08N/
30E-
17C0
1
08N
/30E
-17D
04
08N/30E-17F05
08N/30E-17F06
08N/
30E-
17L0
1
08N/30E-17R01
08N/30E-20A01
08N/
30E-
20G0
1
Alti
- Well
Open
- Open-
Use
Lat-
Long
- tu
de
depth
ing
ing
ofitude
itude
of LS
D (f
eet)
to
p bo
ttom
wa
ter
(fee
t)
(feet)
(feet)
461013
1190415
350.00
254.0
143.00
206.
00
P20
6.00
25
4.00
461100
1190
513
421.00
10
7.0
100.00
107.
00
H
461056
1190
527
422.00
97
.5
92.50
97.50
H
461043
1190
517
423.00
10
0.0
90.0
0 10
0.00
HI
461045
1190
523
408.
00
155.
0 83
.00
155.
00
H
4610
29
1190
516
380.00
51
.0
H
4610
11
1190
438
355.00
40
.5
40.5
0 40
.50
H
4609
56
1190
444
361.00
15
5.0
139.
00
155.
00
H
460944
1190505
450.00
32
5.0
109.00
325.
00
H
Date
wate
rlevel
measured
9/ 6
/198
69/ 6
/198
69/ 6
/198
62/
24/1
987
3/ 3
/198
7-
2/21
/198
69/ 4
/198
62/
24/1
987
3/28
/198
69/ 4
/198
62/
24/1
987
3/ 4
/198
73/
12/1
986
9/ 4
/198
62/
24/1
987
3/11
/198
69/
4/1
986
2/24
/198
73/ 4
/198
73/
11/1
986
9/ 6
/198
62/
24/1
987
3/14
/198
69/ 4
/198
62/
24/1
987
2/20
/198
62/
20/1
986
2/20
/198
69/ 3
/198
62/
24/1
987
2/20
/198
6
Water
leve
l St
atus
(feet) 20.45
20.6
420.44
21.35
24.66
-- 85.8
783
.45
85.88
82.70
77.34
80.12
79.2
585.88
83.1
385
.61
66.8
163.50
66.5
366.70
33.00
30.19
33.6
821.10
18.3
021
.14
17.1
015
.10
13.5
021.80
14.55
42.8
6
U R R - R - - - - - - - - - - - - - - - - P - - R R R - - R
date
09/0
4/19
86
09/0
4/19
86
09/0
4/19
86
09/0
6/19
86
09/0
4/19
86
09/0
3/19
86
Total
nitr
ate-
pl
us-n
itri
te
as N
(m
illi
gr
ams
per
liter) 4.50
5.80 0.1
8.50
12.0
0
0.1
Spec
ific
conductance
(microsiemens
per
centimeter
at 2
5 degrees
C)
835
910
527
1110 931
821
09/0
3/19
863.
1051
0
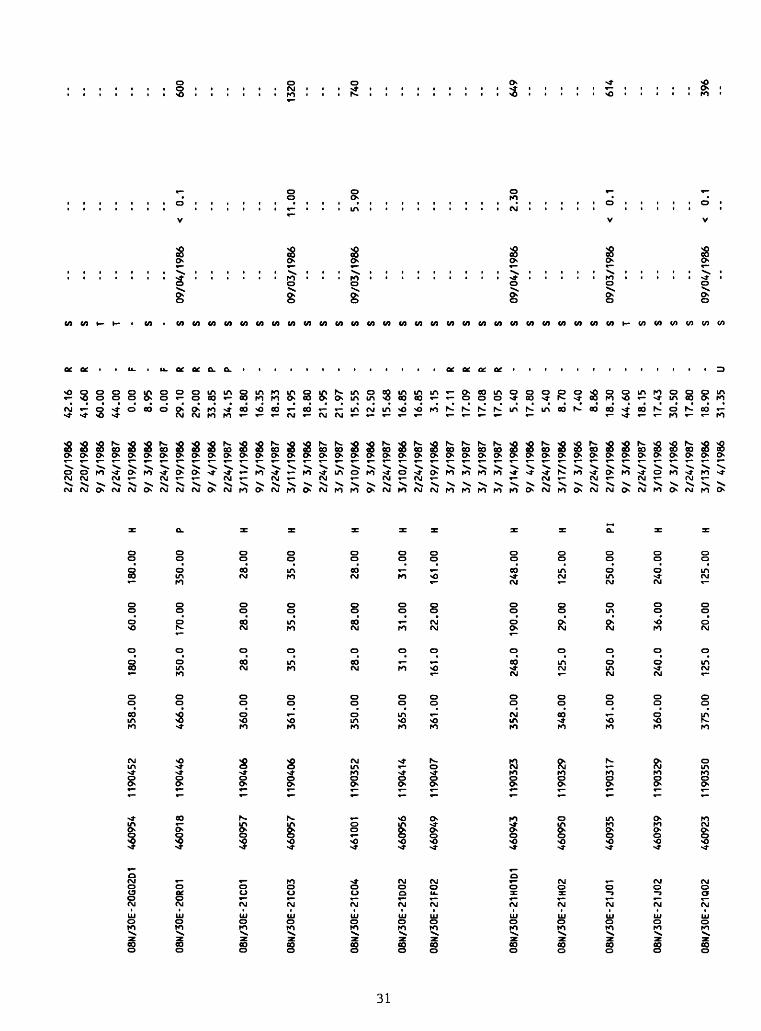
08N/
30E-
20G0
2D1
460954
1190
452
358.
00
180.
0 60.00
180.
00
H
08N/
30E-
20R0
1 460918
1190446
466.
00
350.0
170.
00
350.
00
P
08N/
30E-
21C0
1 46
0957
1190406
360.00
28.0
28
.00
28.0
0 H
08N/30E-21C03
4609
57
1190406
361.00
35.0
35.00
35.0
0 H
08N/
30E-
21C0
4 46
1001
11
9035
2 35
0.00
28.0
28.0
0 28.00
H
08N/
30E-
21D0
2 460956
1190
414
365.
00
31.0
31.00
31.00
H
08N/
30E-
21F0
2 460949
1190
407
361.
00
161.
0 22
.00
161.00
H
08N/
30E-
21H0
1D1
460943
1190
323
352.00
248.0
190.00
248.00
H
08N/
30E-
21H0
2 460950
1190
329
348.
00
125.
0 29
.00
125.
00
H
08N/
30E-
21J0
1 460935
1190
317
361.
00
250.0
29.50
250.00
PI
08N/
30E-
21J0
2 460939
1190
329
360.
00
240.0
36.00
240.00
H
08N/
30E-
21Q0
2 460923
1190
350
375.00
125.
0 20.00
125.
00
H
2/20
/198
62/
20/1
986
9/ 3
/198
62/24/1987
2/19
/198
69/
3/1
986
2/24
/198
72/
19/1
986
2/19
/198
69/
4/1
986
2/24
/198
73/
11/1
986
9/ 3
/198
62/24/1987
3/11/1986
9/ 3
/198
62/
24/1
987
3/ 5/1987
3/10
/198
69/ 3
/198
62/24/1987
3/10/1986
2/24/1987
2/19
/198
63/ 3
/198
73/ 3
/198
73/ 3
/198
73/ 3
/198
73/
14/1
986
9/ 4
/1986
2/24/1987
3/17
/198
69/ 3
/1986
2/24
/198
72/19/1986
9/ 3
/198
62/24/1987
3/10
/198
69/
3/1986
2/24
/198
73/
13/1
986
9/ 4
/1986
42.16
41.60
60.00
44.00
0.00
8.95
0.00
29.10
29.0
033
.85
34.1
518
.80
16.3
518.33
21.9
518
.80
21.9
521.97
15.5
512
.50
15.6
816
.85
16.8
53.
1517.11
17.0
917
.08
17.05
5.40
17.80
5.40
8.70
7.40
8.86
18.30
44.60
18.15
17.43
30.50
17.8
018.90
31.3
5
R R - F - F R R P P - - - - - - - - - - - - R R R R - - - - - - - - - - - - - U
s s T T - S - S s s s s s s s s s s s s s s s s s s s s s s s s s s s T s s s s s s
09/0
4/19
860.1
600
09/0
3/19
86
09/0
3/19
86
11.0
0
5.90
1320 740
09/04/1986
2.30
649
09/0
3/19
860.1
614
09/0
4/19
860.1
396
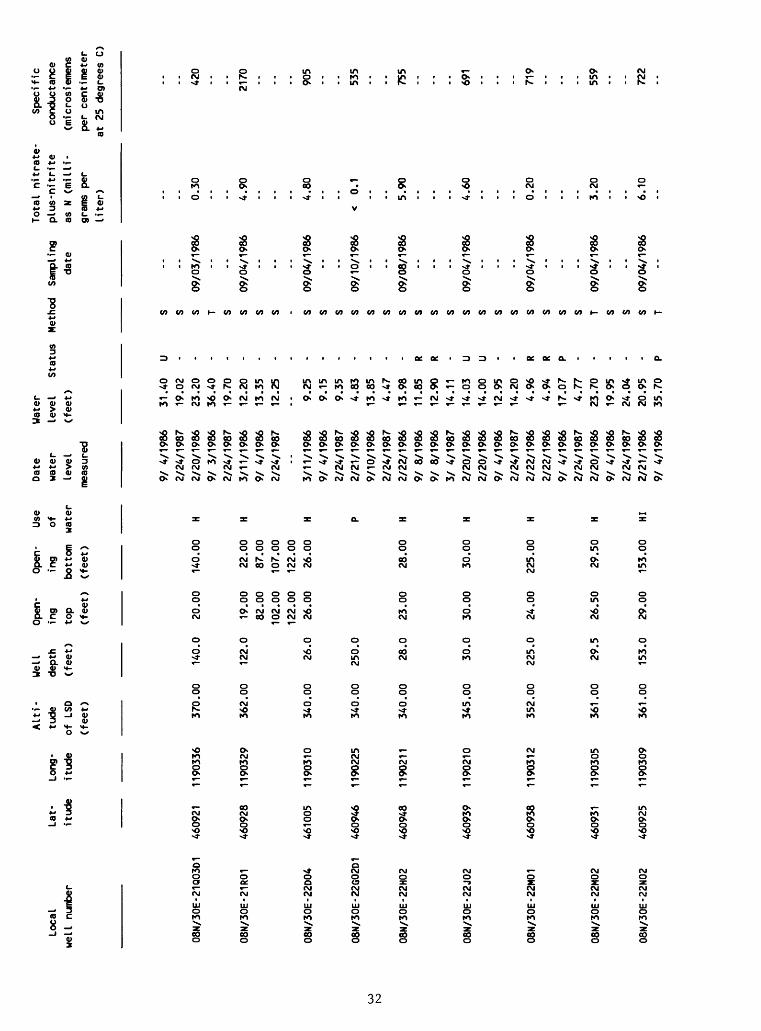
Local
well
nu
mber
08N/30E-21Q03D1
08N/
30E-
21R0
1
08N/
30E-
22D0
4
08N/30E-22G02D1
08N/30E-22H02
08N/30E-22J02
08N/
30E-
22M0
1
08N/
30E-
22M0
2
08N/30E-22N02
Alti
- We
ll
Open-
Lat-
Long
- tu
de
dept
h ing
itude
itud
e of
LS
D (f
eet)
top
(fee
t)
(fee
t)
4609
21
1190
336
370.
00
140.
0 20.00
460928
1190
329
362.
00
122.
0 19
.00
82.00
102.00
122.00
461005
1190310
340.
00
26.0
26.00
460946
1190
225
340.
00
250.0
460948
1190
211
340.
00
28.0
23.00
460939
1190210
345.
00
30.0
30.00
460938
1190312
352.
00
225.
0 24.00
4609
31
1190
305
361.
00
29.5
26.50
460925
1190
309
361.
00
153.0
29.0
0
Open-
Use
ing
ofbo
ttom
water
(fee
t)
140.
00
H
22.0
0 H
87.00
107.
0012
2.00
26.0
0 H P
28.00
H
30.00
H
225.00
H
29.50
H
153.
00
HI
Date
water
level
measured
9/ 4
/198
62/
24/1
987
2/20/1986
9/ 3
/198
62/24/1987
3/11
/198
69/
4/1
986
2/24/1987
--
3/11
/198
69/
4/1
986
2/24/1987
2/21/1986
9/10
/198
62/24/1987
2/22/1986
9/ 8
/198
69/ 8
/198
63/ 4
/198
72/20/1986
2/20/1986
9/ 4
/198
62/
24/1
987
2/22/1986
2/22/1986
9/ 4
/198
62/24/1987
2/20
/198
69/
4/1
986
2/24
/198
72/
21/1
986
9/ 4
/198
6
Water
level
(fee
t) 31.40
19.0
223.20
36.40
19.7
012
.20
13.35
12.2
5-- 9.
259.15
9.35
4.83
13.85
4.47
13.9
811.85
12.9
014
.11
14.0
314
.00
12.95
14.2
04.
964.94
17.0
74.
7723.70
19.95
24.04
20.9
535.70
Status U - - - - - - - - - - - - - - R R U U - - R R P - - - - - P
Stat
us
Meth
od
Sampling
date
Total
nitr
ate-
pl
us-n
itri
te
as N
(milli
gram
s pe
r li
ter)
Spec
ific
conductance
(mic
rosi
emen
spe
r centimeter
at 2
5 de
gree
s C)
09/03/1986
09/04/1986
09/04/1986
09/10/1986
09/0
8/19
86
09/04/1986
09/04/1986
09/04/1986
09/04/1986
0.30
4.90
4.80 0.1
5.90
4.60
0.20
3.20
6.10
420
2170 905
535
755
691
719
559
722

08N/30E-22P01
460923
1190250
365.
00
35.0
35.0
0 35
.00
U
U)
OJ
08N/30E-22Q0
2
08N/30E-22R04
08N/30E-23A03
460926
1190227
349.
00
52.0
31
.00
52.0
0 H
4609
22
1190212
4609
53
1190057
352.00
52.0
23.00
25.0
0 H
26.00
52.00
361.
00
53.5
U
08N/30E-23D01
08N/30E-23D0
2
08N/30E-23E03
461002
1190154
355.
00
105.
0 27.00
105.00
H
461001
1190156
345.
00
20.5
20.0
0 20
.50
H
4609
45
1190146
343.
00
47.0
33.0
0 47.00
H
2/24
/198
74/
9/1
986
4/ 9
/198
64/
14/1
986
5/ 9
/198
66/
16/1
986
8/25
/198
69/
17/1
986
10/23/1986
12/
1/1986
1/28
/198
71/28/1987
3/18
/198
74/
15/1
987
6/10/1987
3/11
/198
69/
4/1
986
2/24
/198
73/
11/1
986
9/ 4
/198
62/
25/1
987
4/18
/198
65/
13/1
986
6/18
/198
67/
22/1
986
8/20
/198
69/
11/1
986
10/23/1986
11/20/1986
12/16/1986
1/15/1987
2/ 5/
1987
2/25
/198
73/
18/1
986
9/ 9
/198
62/
25/1
987
3/13
/198
69/
4/1
986
2/25
/198
72/
21/1
986
2/21
/198
69/
4/1
986
20.08
27.2
027.40
27.20
24.3
022.18
20.98
21.1
122
.65
24.36
26.17
27.07
27.26
27.2
323.82
13.5
011
.90
13.63
9.30
8.00
9.70
17.6
017
.80
17.5
017
.90
18.2
018
.32
18.1
617
.70
18.50
18.6
018.85
19.00
14.7
014
.70
15.20
9.89
9.13
10.0
89.
159.
139.
05
- U U U - - - - - - U U - - - - - - - - - - - - - - - U - U - - - - - - - - - R R U
s s s s s s s s s s s s s s s s s s s s s s s s s s s s s s s s s s s s s s s s s s
09/04/1986
4.50
09/0
4/19
86
3.50
985
09/0
9/19
86
1.40
09/04/1986
1.80
09/0
4/19
86
< 0.1
415
431
445
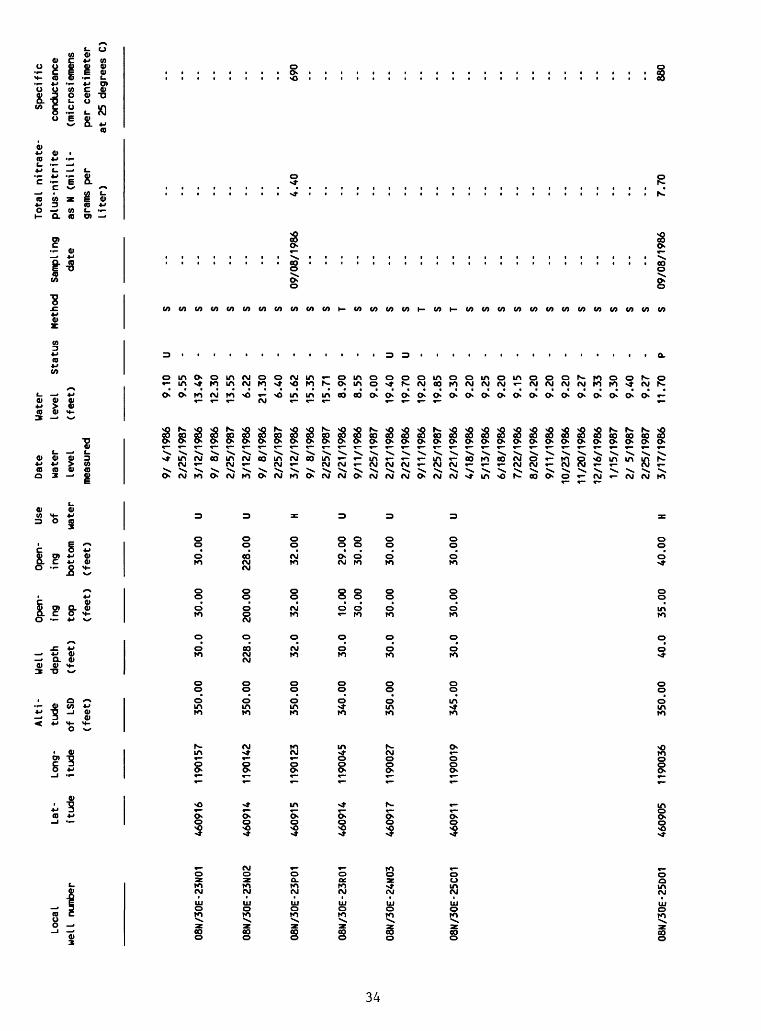
Loca
l well number
LO
08N/
30E-
23N0
1
08N/
30E-
23N0
2
08N/
30E-
23P0
1
08N/
30E-
23R0
1
08N/30E-24N03
08N/
30E-
25C0
1
08N/
30E-
25D0
1
Alti-
Well
Open-
Open
- Us
eLat-
Long
- tude
depth
ing
ing
ofit
ude
itud
e of LS
D (f
eet)
top
bott
om
wate
r(feet)
(fee
t)
(fee
t)
4609
16
1190157
350.
00
30.0
30.00
30.00
U
4609
14
1190
142
350.
00
228.0
200.00
228.
00
U
460915
1190123
350.
00
32.0
32.00
32.00
H
4609
14
1190
045
340.
00
30.0
10.0
0 29.00
U30.00
30.0
0
4609
17
1190027
350.
00
30.0
30.00
30.00
U
4609
11
1190019
345.
00
30.0
30.00
30.00
U
460905
1190036
350.
00
40.0
35.00
40.0
0 H
Date
water
level
measured
9/ 4
/198
62/
25/1
987
3/12
/198
69/
8/1
986
2/25
/198
73/
12/1
986
9/ 8
/198
62/
25/1
987
3/12
/198
69/
8/1
986
2/25
/198
72/
21/1
986
9/11
/198
62/
25/1
987
2/21
/198
62/21/1986
9/11
/198
62/
25/1
987
2/21
/198
64/
18/1
986
5/13
/198
66/
18/1
986
7/22
/198
68/
20/1
986
9/11
/198
610/23/1986
11/2
0/19
8612/16/1986
1/15
/198
72/
5/1
987
2/25
/198
73/
17/1
986
Water
level
Status
(fee
t) 9.10
9.55
13.49
12.3
013
.55
6.22
21.30
6.40
15.6
215
.35
15.7
18.90
8.55
9.00
19.4
019
.70
19.2
019
.85
9.30
9.20
9.25
9.20
9.15
9.20
9.20
9.20
9.27
9.33
9.30
9.40
9.27
11.7
0
U - - - - - - - - - - - U U - - - - - - - - - - - - - - p
date
Total
nitr
ate-
pl
us-n
itri
te
as N
(m
illi
gr
ams
per
liter)
Specific
cond
ucta
nce
(mic
rosi
emen
spe
r ce
ntim
eter
at 25 d
egre
es C
)
09/0
8/19
864.
40690
09/0
8/19
867.70
880
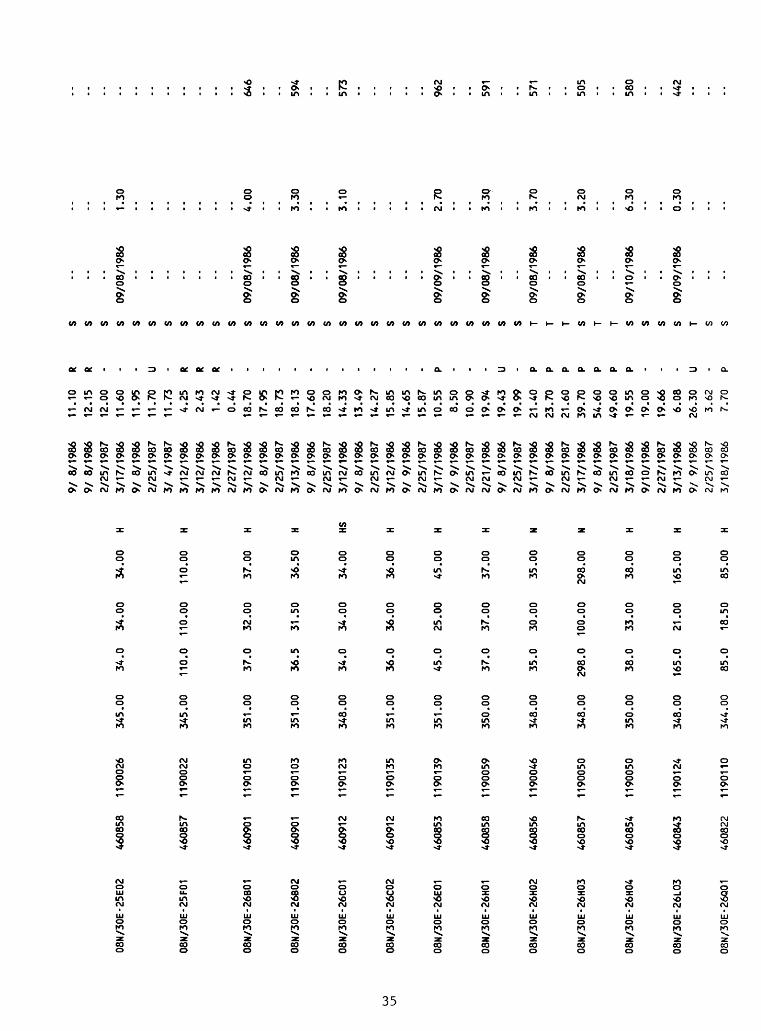
08N/
30E-
25E0
2 46
0858
1190026
345.00
34.0
34.00
34.00
H
08N/
30E-
25F0
1 46
0857
1190022
345.00
110.
0 110.00
110.
00
H
08N/
30E-
26B0
1 46
0901
11
9010
5 351.00
37.0
32.00
37.00
H
08N/
30E-
26B0
2 46
0901
1190103
351.00
36.5
31.50
36.50
H
08N/
30E-
26C0
1 460912
1190123
348.00
34.0
34.00
34.00
HS
08N/
30E-
26C0
2 460912
1190
135
351.00
36.0
36.00
36.00
H
08N/
30E-
26E0
1 460853
1190139
351.00
45.0
25.00
45.00
H
08N/
30E-
26H0
1 46
0858
11
9005
9 350.00
37.0
37.00
37.00
H
08N/
30E-
26H0
2 46
0856
11
9004
6 348.00
35.0
30.00
35.00
N
08N/
30E-
26H0
3 46
0857
11
9005
0 348.00
298.0
100.00
298.00
N
08N/
30E-
26H0
4 460854
1190050
350.00
38.0
33.00
38.00
H
08N/
30E-
26L0
3 460843
1190124
348.00
165.
0 21
.00
165.
00
H
08N/
30E-
26Q0
1 460822
1190110
344.00
85.0
18.5
0 85.00
H
9/ 8
/1986
9/ 8
/198
62/25/1987
3/17
/198
69/
8/1986
2/25
/198
73/
4/1
987
3/12
/198
63/12/1986
3/12
/198
62/
27/1
987
3/12
/198
69/
8/1986
2/25
/198
73/13/1986
9/ 8
/1986
2/25
/198
73/
12/1
986
9/ 8
/198
62/
25/1
987
3/12
/198
69/
9/1986
2/25
/198
73/17/1986
9/ 9
/1986
2/25
/198
72/21/1986
9/ 8
/198
62/
25/1
987
3/17/1986
9/ 8
/198
62/
25/1
987
3/17
/198
69/
8/1986
2/25/1987
3/18/1986
9/10/1986
2/27/1987
3/13/1986
9/ 9/1986
2/25/1987
3/18/1986
11.1
012.15
12.00
11.60
11.95
11.70
11.7
34.
252.
431.
420.
4418
.70
17.95
18.7
318
.13
17.6
018.20
14.3
313
.49
14.2
715.85
14.65
15.8
710.55
8.50
10.90
19.94
19.4
319
.99
21.40
23.7
021
.60
39.70
54.60
49.60
19.55
19.00
19.6
66.08
26.3
03.
627.
70
R R - - - U - R R R - - - - - - - - - - - - - P - - - U - P P P P P P P - - - U - P
s s s s s s s s s s s s s s s s s s s s s s s s s s s s s T T T S T T S S s s T S S
-- - --
09/08/1986
-- -- -- -- -- -- --
09/08/1986
- --
09/0
8/19
86-- --
09/0
8/19
86-- -- -- -- --
09/0
9/19
86-- --
09/0
8/19
86-- --
09/0
8/19
86-- --
09/0
8/19
86-- --
09/10/1986
-- --
09/09/1986
-- -- --
1.30
4.00
3.30
3.10
2.70
3.30
3.70
3.20
6.30
0.30
646
594
573
962
591
571
505
580
442
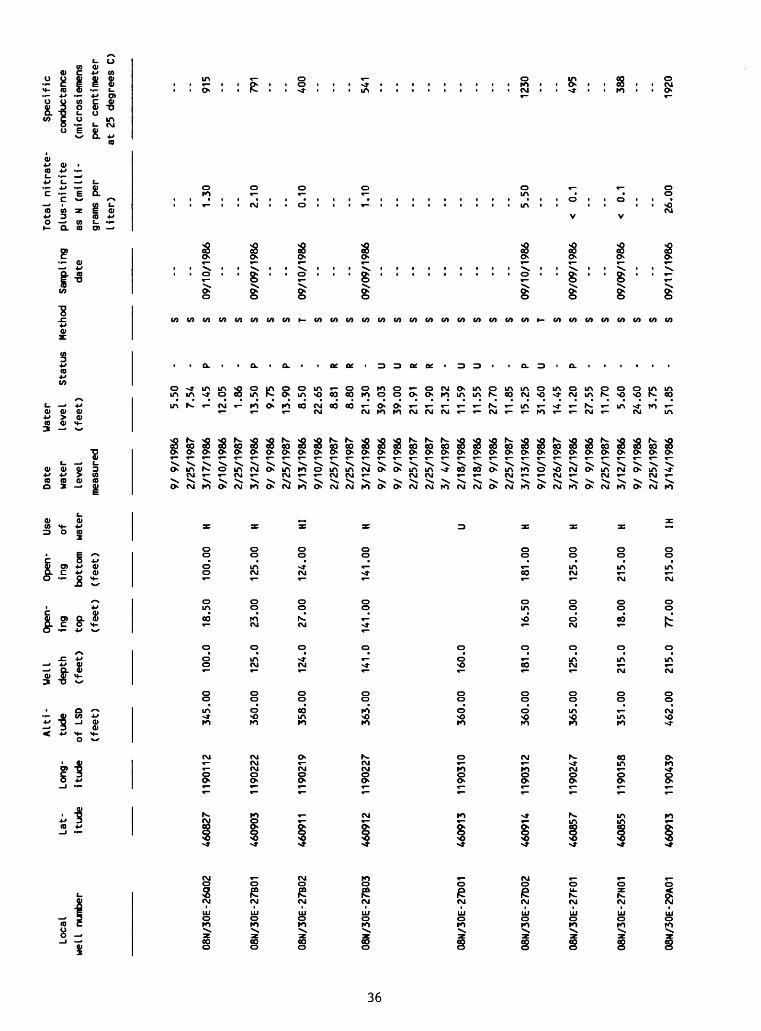
Loca
l we
ll nu
mber
U)
08N/30E-26Q02
08N/30E-27B01
08N
/30E
-27B
02
08N
/30E
-27B
03
08N
/30E
-27D
01
08N
/30E
-27D
02
08N/
30E-
27F0
1
08N/
30E-
27H0
1
08N/
30E-
29A0
1
Alti
- Well
Open-
Open
- Us
eLat-
Long-
tude
de
pth
ing
ing
ofitude
itude
of L
SD
(feet)
top
bott
om
wate
r(f
eet)
(feet)
(fee
t)
4608
27
1190
112
345.00
100.
0 18
.50
100.
00
H
460903
1190
222
360.00
125.
0 23.00
125.
00
H
4609
11
1190
219
358.00
124.
0 27
.00
124.
00
HI
460912
1190
227
363.00
141.
0 14
1.00
14
1.00
H
460913
1190
310
360.00
160.
0 U
460914
1190
312
360.00
181.
0 16.50
181.
00
H
4608
57
1190
247
365.
00
125.
0 20
.00
125.
00
H
460855
1190
158
351.00
215.
0 18.00
215.
00
H
460913
1190
439
462.00
215.
0 77
.00
215.
00
IH
Date
wate
rlevel
meas
ured
9/ 9
/198
62/
25/1
987
3/17
/198
69/
10/1
986
2/25
/198
73/
12/1
986
9/ 9
/198
62/
25/1
987
3/13/1986
9/10
/198
62/
25/1
987
2/25
/198
73/
12/1
986
9/ 9
/198
69/
9/1
986
2/25
/198
72/
25/1
987
3/ 4
/198
72/
18/1
986
2/18
/198
69/
9/1
986
2/25
/198
73/
13/1
986
9/10
/198
62/
26/1
987
3/12
/198
69/
9/1
986
2/25
/198
73/
12/1
986
9/ 9
/198
62/
25/1
987
3/14
/198
6
Water
leve
l(feet) 5.
507.
541.45
12.05
1.86
13.50
9.75
13.90
8.50
22.65
8.81
8.80
21.30
39.03
39.00
21.91
21.9
021
.32
11.59
11.55
27.7
011
.85
15.25
31.60
14.4
511
.20
27.55
11.7
05.
6024
.60
3.75
51.85St
atus - P - - P - P - - R R - U U R R - U U - - P U - P - - - - - -
Meth
od S S S S S S S S T S S S S S S S S S S S S S S T S S S S S S S S
Sampling
date --
09/10/1986
-- --
09/09/1986
-- --
09/1
0/19
86-- -- --
09/0
9/19
86-- -- -- -- -- -- -- -- --
09/1
0/19
86-- --
09/0
9/19
86-- --
09/0
9/19
86-- --
09/11/1986
Total
nitr
ate-
plus-nitrite
as N
(milli
grams
per
liter) -- 1.
30-- -- 2.10
-- 0.10
-- -- -- 1.10
-- -- -- -- -- -- -- -- -- 5.50
-- --
< 0.
1-- --
< 0.
1-- -- 26.0
0
Spec
ific
cond
ucta
nce
(microsiemens
per
centimeter
at 2
5 de
gree
s C)
-- 915
- -- 791
-- -- 400
-- -- -- 541
-- -- -- -- -- -- -- -- 1230 -- -- 495
-- -- 388
-- -- 1920
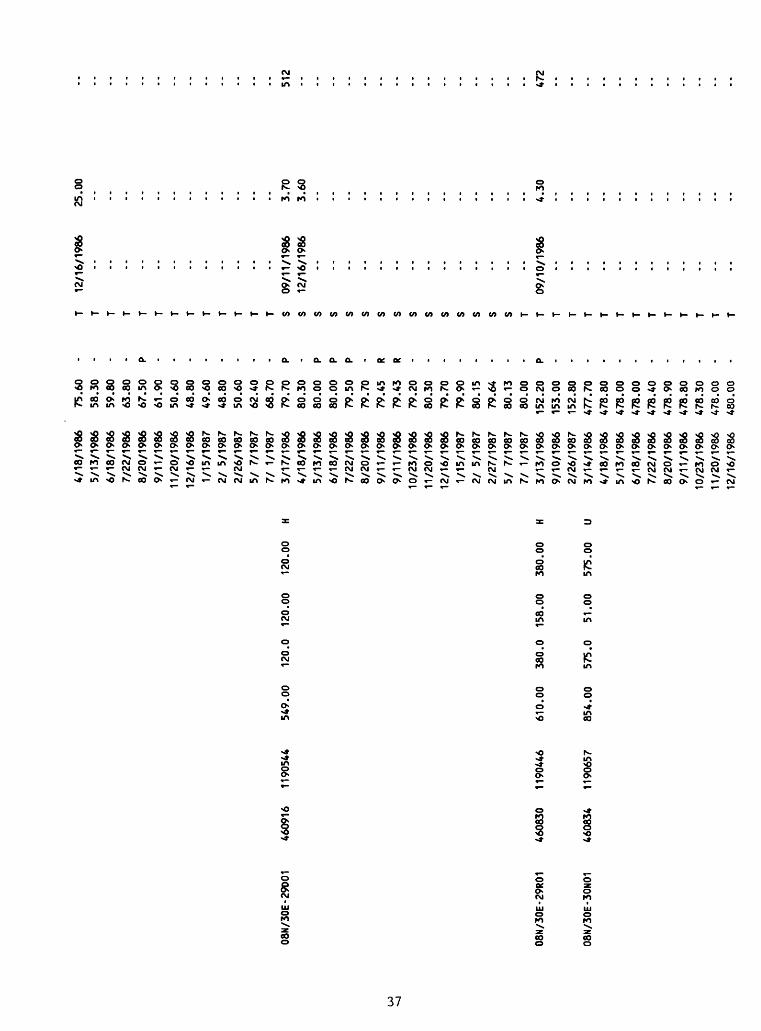
08N/30E-29D01
4609
16
1190544
549.
00
120.
0 120.00
120.00
H
08N/30E-29R01
08N/30E-30N01
4608
30
1190446
610.
00
380.0
158.00
380.
00
H
4608
34
1190657
854.
00
575.
0 51.00
575.
00
U
4/18
/198
65/
13/1
986
6/18
/198
67/
22/1
986
8/20
/198
69/
11/1
986
11/20/1986
12/1
6/19
861/
15/1
987
21 5
/198
72/
26/1
987
5/ 7/
1987
7/ 1/1987
3/17
/198
64/
18/1
986
5/13
/198
66/
18/1
986
7/22/1986
8/20
/198
69/
11/1
986
9/11
/198
610/23/1986
11/2
0/19
8612/16/1986
1/15
/198
721 5/
1987
2/27
/198
75/
7/
1987
7/ 1/1987
3/13
/198
69/
10/1
986
2/26
/198
73/
14/1
986
4/18
/198
65/
13/1
986
6/18
/198
67/22/1986
8/20
/198
69/
11/1
986
10/2
3/19
8611/20/1986
12/16/1986
75.60
58.30
59.80
63.80
67.50
61.90
50.60
48.8
049.60
48.8
050.60
62.40
68.70
79.7
080.30
80.00
80.00
79.5
079
.70
79.4
579.43
79.2
080.30
79.7
079
.90
80.1
579
.64
80.13
80.0
015
2.20
153.
0015
2.80
477.70
478.80
478.00
478.00
478.40
478.90
478.80
478.30
478.
00480.00
- - - - P - - - - - - - - P - P P P - R R - - - - - - - P - - - - - - - - - -
T 12/16/1986
T T T T T T T T T T T T S 09
/11/
1986
S 12
/16/
1986
S S S S S S S S S S S S S T T 09
/10/
1986
T T T T T T T T T T T T
25.0
0-- -- -- -- -- -- -- -- - -- -- 3.70
3.60
-- - - -- -- -- - -- -- -- - - -- -- 4.30
-- -- -- - -- -- - -- -- --
512
472

00
Loca
lwe
ll nu
mber
08N/
30E-
34B0
1D1
08N/30E-34B02
08N/30E-34G01
08N/30E-34G02D1
08N/30E-34J01
08N/30E-34J02
08N/30E-34K01
08N/30E-34Q01
Alti-
Well
Op
en-
Open
- Us
e Da
teLat-
Long
- tu
de
depth
ing
ing
of
water
itude
itud
e of
LSD
(f
eet)
to
p bo
ttom
wa
ter
leve
l(f
eet)
(feet)
(feet)
measured
1/15
/198
72/ 5
/198
72/26/1987
4608
13
1190226
454.
00
59.0
36.0
0 47.00
H 3/11/1986
56.0
0 59
.00
3/21
/198
7
4608
18
1190229
450.
00
56.0
56.00
56.0
0 H
3/11/1986
9/ 9
/1986
2/26/1987
460756
1190233
510.
00
105.
0 87
.00
105.00
H 3/
11/1
986
9/ 9
/1986
2/26/1987
460758
1190231
490.
00
71.0
46.0
0 56
.00
U 3/11/1986
71.0
0 71
.00
9/ 9/1986
2/26/1987
460747
1190200
477.
00
260.
0 76.00
260.00
I 3/12/1986
9/10/1986
3/ 3
/1987
4607
52
1190209
480.
00
80.0
80
.00
80.00
H 3/14/1986
460752
1190219
490.
00
60.0
50
.00
60.0
0 H
3/13/1986
9/ 9/1986
2/26/1987
4607
30
1190236
639.
00
155.
0 13
9.00
155.00
H 3/13/1986
4/18/1986
5/13/1986
6/18/1986
7/22/1986
8/20/1986
9/11/1986
10/23/1986
11/20/1986
12/16/1986
1/15
/198
7
Water
level
(feet)
480.
2047
9.70
478.
9030.60
31.75
22.70
33.75
24.1
067.60
70.60
67.3
521
.77
24.70
21.7
816
8.70
161.
6013
2.00
52.5
030.10
35.10
30.3
012
5.00
125.
8012
5.40
126.
0012
5.40
125.
1012
5.30
125.
0012
4.70
125.
7012
6.00
Stat
us - - - - P - - - - - - - - P P R P P P P - - - P - - - - -
Meth
od
Samp
ling
date
T T T S s S 09
/09/
1986
S S S 09
/09/
1986
S S s s s S 09
/10/
1986
S T S S 09
/09/
1986
S S T T T T T T T T T T T
Tota
l ni
trat
e-
Specific
plus
-nit
rite
co
nduc
tanc
eas N
(mi Hi-
(mic
rosi
emen
sgrams
per
per
centimeter
liter)
at 2
5 degrees
C)
-- .. -- -- 12.0
0 1390
-- -- 2.40
427
-- -- - -- --
< 0.1
380
-- -- .. 5.10
572
-- -- .. -- -- -- .. -- .. .. .. .. ..
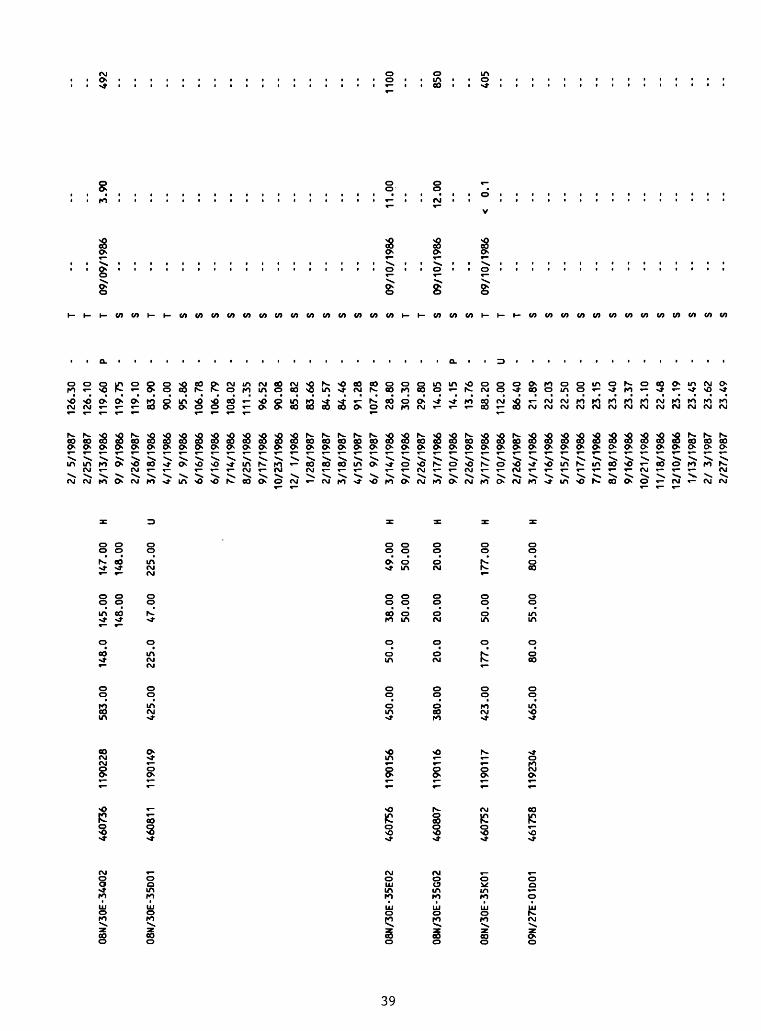
08N/
30E-
34Q0
2 46
0736
1190228
583.00
148.
0 14
5.00
14
7.00
H
148.00
148.00
08N/
30E-
35D0
1 46
0811
1190149
425.
00
225.0
47.00
225.00
U
OJ08
N/30
E-35
E02
4607
56
1190
156
450.00
50.0
38.00
49.00
H50.00
50.0
0
08N/
30E-
35G0
2 46
0807
11
9011
6 38
0.00
20.0
20.00
20.00
H
08N/30E-35K01
460752
1190
117
423.
00
177.
0 50.00
177.
00
H
09N/
27E-
01D0
1 46
1758
11
9230
4 465.00
80.0
55.00
80.00
H
21 5
/1987
2/25
/198
73/13/1986
9/ 9
/198
62/
26/1
987
3/18/1986
4/14/1986
5/ 9
/1986
6/16/1986
6/16/1986
7/14
/198
68/25/1986
9/17
/198
610/23/1986
12/
1/19
861/28/1987
2/18
/198
73/
18/1
987
4/15
/198
76/
9/1
987
3/14
/198
69/10/1986
2/26/1987
3/17
/198
69/10/1986
2/26/1987
3/17/1986
9/10
/198
62/26/1987
3/14/1986
4/16/1986
5/15/1986
6/17/1986
7/15/1986
8/18
/198
69/16/1986
10/21/1986
11/18/1986
12/1
0/19
861/13/1987
2/ 3
/198
72/27/1987
126.
30
-126.10
-11
9.60
P
119.
75
-11
9.10
83.90
-90.00
-95.86
-106.78
-106.79
-10
8.02
-
111.
35
-96.52
-90
.08
-85.82
83.66
-84
.57
-84.46
91
.28
-107.78
-28.80
30.30
-29
.80
-14.05
-14.15
P13
.76
-88.20
-11
2.00
U
86.40
-21
.89
-22
.03
-22
.50
-23
.00
-23
.15
-23.40
-23.37
-23
.10
-22.48
-23.19
-23
.45
-23
.62
-23.49
-
T T T S S T T S S S S S S S S S S S S S S T T S S S T T T S S S S S S S S S S S S S
09/0
9/19
863.
9049
2
09/10/1986
09/10/1986
09/10/1986
11.0
0
12.0
0
0.1
1100 850
405
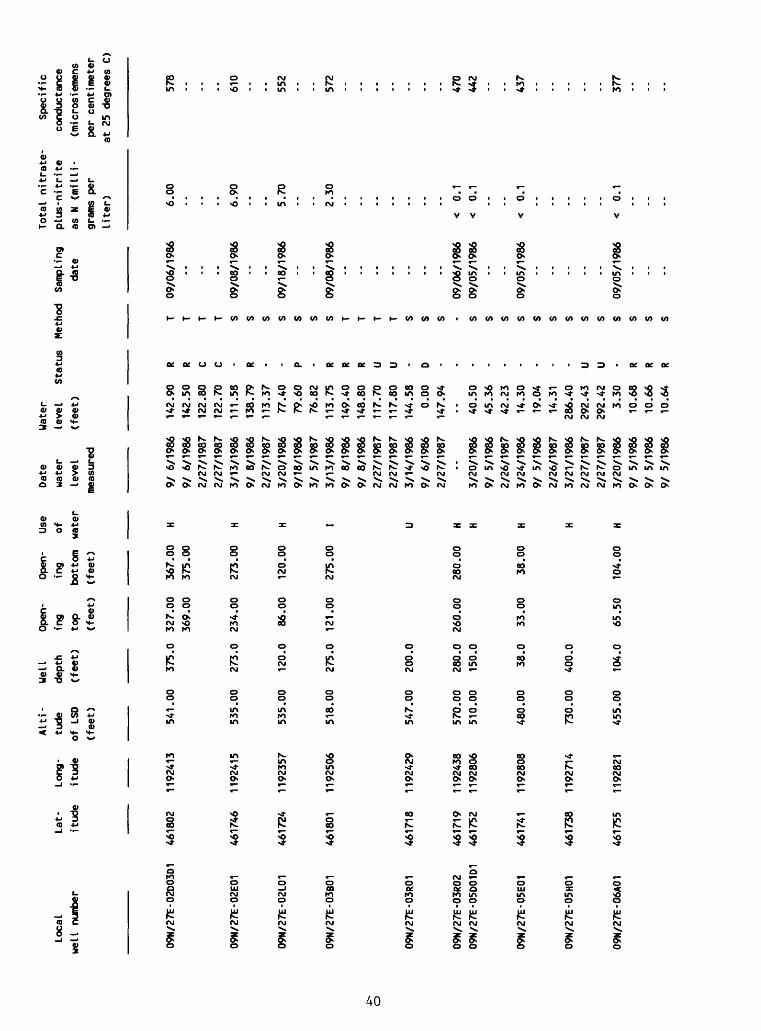
.p-
o
Local
well number
09N/27E-02D03D1
09N/
27E-
02E0
1
09N/
27E-
02L0
1
09N/
27E-
03B0
1
09N/
27E-
03R0
1
09N/
27E-
03R0
209N/27E-05D01D1
09N/
27E-
05E0
1
09N/
27E-
05H0
1
09N/
27E-
06A0
1
Alti
- We
ll
Open
- Open-
Use
Date
Lat-
Long-
tude
depth
ing
ing
of
water
itud
e itude
of LS
D (f
eet)
to
p bo
ttom
wa
ter
level
(fee
t)
(fee
t)
(fee
t)
measured
461802
1192413
541.
00
375.0
327.
00
367.
00
H 9/6/1986
369.
00
375.00
9/ 6
/1986
2/27/1987
2/27
/198
746
1746
1192415
535.
00
273.0
234.00
273.00
H 3/
13/1
986
9/ 8
/1986
2/27/1987
461724
1192
357
535.00
120.
0 86
.00
120.00
H 3/
20/1
986
9/18
/198
63/
5/1987
4618
01
1192
506
518.
00
275.
0 121.00
275.00
I 3/
13/1
986
9/ 8/1986
9/ 8
/1986
2/27
/198
72/27/1987
4617
18
1192429
547.
00
200.0
U 3/14/1986
9/ 6
/1986
2/27
/198
746
1719
1192438
570.
00
280.0
260.
00
280.00
H461752
1192806
510.00
150.0
H 3/
20/1
986
9/ 5/1986
2/26/1987
4617
41
1192808
480.
00
38.0
33.00
38.00
H 3/
24/1
986
9/ 5
/1986
2/26
/198
746
1738
1192714
730.00
400.0
H 3/
21/1
986
2/27/1987
2/27/1987
461755
1192821
455.
00
104.
0 65.50
104.00
H 3/20/1986
9/ 5/1986
9/ 5/1986
9/ 5
/1986
Water
level
Status
(fee
t)
142.90
142.50
122.
80122.70
111.58
138.79
113.
3777.40
79.60
76.82
113.75
149.40
148.80
117.70
117.80
144.58
0.00
147.94
-- 40.50
45.3
642.23
14.3
019
.04
14.3
1286.40
292.43
292.42
3.30
10.6
810.66
10.6
4
R R C C - R - - P - R R R U U - D - - - - - - - - - U U - R R R
Method T T T T S S S S S S S T T T T S S S - S S S S S S S S S S S S S
Samp
ling
date
09/06/1986
-- -- --
09/0
8/19
86-- --
09/1
8/19
86-- --
09/0
8/19
86-- -- -- -- -- -- --
09/06/1986
09/0
5/19
86-- --
09/0
5/19
86-- -- -- - -
09/05/1986
-- -- --
Total
nitr
ate-
Specific
plus
-nit
rite
conductance
as N
(mi Hi-
(mic
rosi
emen
sgrams
per
per
centimeter
liter)
at 2
5 de
gree
s C)
6.00
578
-- .. .. 6.90
61
0.. -- 5.70
552
-- .. 2.30
572
-- -- -- -- -- -- --
< 0.1
470
< 0.
1 44
2-- --
< 0.
1 43
7-- -- -- -- --
< 0.1
377
-- -- --
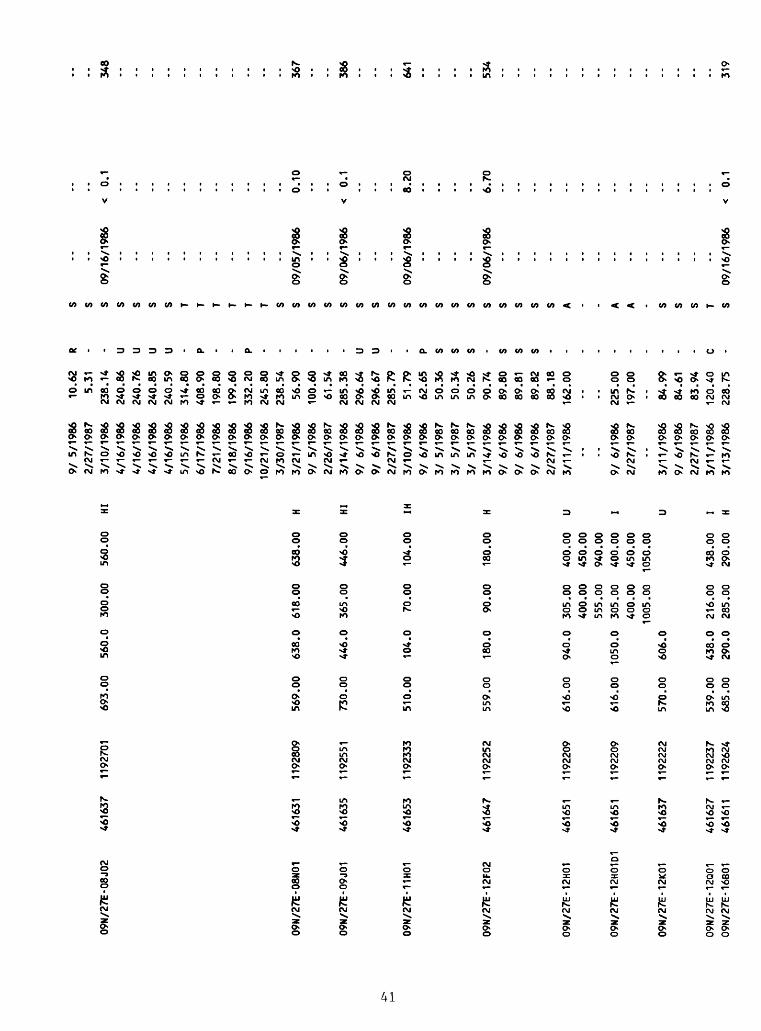
09N
/27E
-08J
02
4616
37
1192
701
09N/
27E-
08N0
1 46
1631
11
9280
9
09N
/27E
-09J
01
4616
35
1192
551
09N/
27E-
11H0
1 461653
1192
333
09N/27E-12F02
4616
47
1192
252
09N/
27E-
12H0
1 46
1651
11
9220
9
09N/27E-12H01D
1 46
1651
1192209
09N/
27E-
12K0
1 46
1637
1192222
09N/
27E-
12Q0
1 46
1627
11
9223
7 09
N/27
E-16
B01
4616
11
1192
624
693.
00
560.0
300.
00
560.00
HI
569.
00
638.
0 61
8.00
638.00
H
730.00
446.
0 365.00
446.00
HI
510.
00
104.
0 70.00
104.00
IH
559.00
180.
0 90.00
180.
00
H
616.
00
940.0
305.00
400.00
U40
0.00
45
0.00
555.00
940.00
616.
00
1050.0
305.00
400.
00
I40
0.00
45
0.00
1005
.00
1050
.00
570.00
606.
0 U
539.00
438.
0 216.00
438.00
I 68
5.00
290.0
285.00
290.00
H
9/ 5
/198
62/
27/1
987
3/10
/198
64/
16/1
986
4/16/1986
4/16
/198
64/
16/1
986
5/15
/198
66/
17/1
986
7/21/1986
8/18/1986
9/16
/198
610/21/1986
3/30
/198
73/
21/1
986
9/ 5/1986
2/26
/198
73/14/1986
9/ 6
/198
69/
6/1
986
2/27
/198
73/10/1986
9/ 6
/198
63/
5/1
987
3/ 5/
1987
3/ 5/
1987
3/14/1986
9/ 6
/198
69/
6/1
986
9/ 6
/198
62/
27/1
987
3/11
/198
6
9/ 6
/198
62/
27/1
987
3/11
/198
69/
6/1
986
2/27
/198
73/
11/1
986
3/13
/198
6
10.6
25.31
238.14
240.86
240.
76240.85
240.
59314.80
408.90
198.
80199.60
332.20
245.80
238.54
56.9
010
0.60
61.54
285.38
296.64
296.
67285.79
51.79
62.65
50.36
50.34
50.26
90.74
89.80
89.81
89.82
88.18
162.
00
225.00
197.
00
84.99
84.6
183.94
120.
40228.75
R - - U U U U - p - - p - - - - - - U U - - p s s s - s s s - . . - . - - c -
s s s s s s s T T T T T T S S S S S S S S S S S S S S S S S S A A A S S S T S
09/1
6/19
860.1
348
09/0
5/19
86
09/0
6/19
86
09/0
6/19
86
0.10 0.1
8.20
367
386
641
09/0
6/19
866.70
534
09/1
6/19
860.
1319
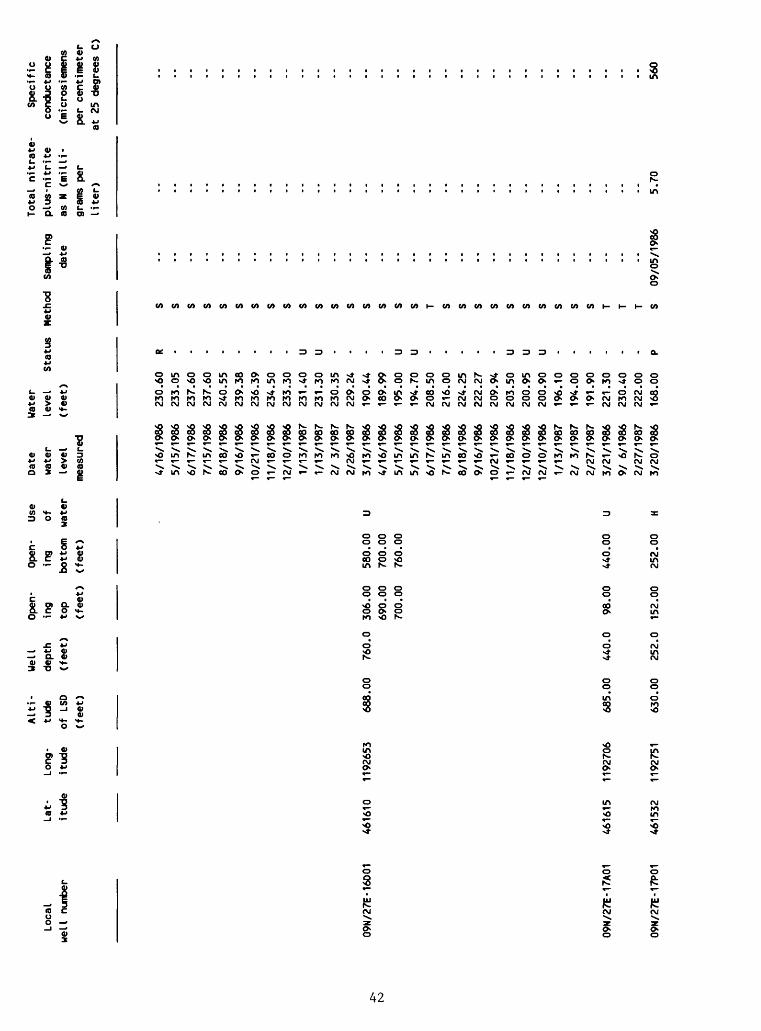
09N
/27E
-16D
01
09N
/27E
-17A
01
09N
/27E
-17P
01
Alti-
Well
Open-
Open
- Us
eLat-
Long
- tude
depth
ing
ing
ofit
ude
itude
of LS
D (feet)
top
bott
om
water
(fee
t)
(feet)
(feet)
4616
10
1192653
688.
00
760.0
306.
00
580.
00
U690.00
700.00
700.00
760.00
4616
15
1192706
685.
00
440.0
98.00
440.
00
U
461532
1192751
630.00
252.
0 15
2.00
252.00
H
Date
wate
rle
vel
measured
4/16/1986
5/15/1986
6/17/1986
7/15/1986
8/18
/198
69/
16/1
986
10/21/1986
11/18/1986
12/10/1986
1/13/1987
1/13/1987
2/ 3
/198
72/
26/1
987
3/13/1986
4/16
/198
65/15/1986
5/15/1986
6/17
/198
67/15/1986
8/18
/198
69/
16/1
986
10/21/1986
11/18/1986
12/10/1986
12/10/1986
1/13/1987
2/ 3
/198
72/
27/1
987
3/21/1986
9/ 6
/1986
2/27
/198
73/20/1986
Water
level
Status
(fee
t)
230.
60233.05
237.60
237.60
240.55
239.
3823
6.39
234.50
233.30
231.40
231.30
230.35
229.24
190.44
189.99
195.00
194.70
208.50
216.00
224.25
222.
27209.94
203.50
200.95
200.90
196.10
194.00
191.90
221.30
230.40
222.00
168.00
R - - - - - - - - U U - - - - U U - - - - - U U U - - - - - - p09/05/1986
5.70
560

09N/
27E-
17P0
2
09N/
27E-
18A0
1
461534
1192
746
461613
1192
822
645.
00
324.0
162.
00
324.00
H
480.
00
115.
0 18
.00
115.
00
HI
09
N/2
7E
-19
J01
461453
1192830
539.
00
113.
0 111.50
113.
00
H
09N/
27E-
19K0
1
09N/
27E-
19K0
2
461454
1192847
461454
1192846
548.
00
143.
0 110.00
115.00
H 11
5.00
14
3.00
540.
00
100.
0 10
0.00
10
0.00
HI
09N/
27E-
19P0
1461440
1192
910
720.
00
438.
0 181.00
438.00
H
9/ 5
/198
69/ 5
/198
69/
5/1
986
2/27
/198
73/
20/1
986
9/ 6
/198
62/
27/1
987
3/24
/198
63/
24/1
986
9/ 5
/198
62/
26/1
987
2/26
/198
72/
24/1
986
4/16
/198
65/
15/1
986
6/17
/198
66/
17/1
986
7/15/1986
8/18
/198
69/
2/1
986
9/16
/198
610/21/1986
11/18/1986
12/10/1986
1/13/1987
2/ 3
/198
72/
26/1
987
2/19
/198
62/
19/1
986
9/ 2
/198
62/
26/1
987
2/19/1986
4/16/1986
5/15/1986
7/15/1986
8/18
/198
69/
5/1
986
9/ 5
/198
69/
5/1
986
2/26
/198
72/
22/1
986
4/16
/198
6
172.37
172.
4217
2.43
169.01
190.
1019
4.96
191.
3313.55
13.5
025.99
14.45
14.50
75.4
374
.91
75.50
75.75
75.8
075
.90
76.1
075.98
75.58
74.8
374
.70
75.40
75.9
075
.80
75.6
091.36
91.3
591.30
91.29
72.66
72.2
472.90
73.0
072
.95
72.6
472.67
72.68
72.66
250.73
250.67
U U U - - - - U U U U U - - - U U - - - - - - - - - - R R - - - - - - - U U U - - -
s s s s s s s s s s s s s s s s s s s s s s s T T T T S s s s s s s s s s s s s s s
-- -- .. ..09
/06/
1986
6.
00.. --
09/0
5/19
86
< 0.
1-- -- .. --
09/0
2/19
86
2.90
09/1
6/19
86
2.80
-- .. -- -- -- .. .. .. .. -- .. -- ..
09/0
2/19
86
8.00
-- .. ..
09/0
5/19
86
9.50
.. .. .. .. .. .. .. ..
09/02/1986
0.00
09/1
6/19
86
0.70
-- -- -- -- 541
-- -- 256
-- -- -- -- 615
615
-- -- -- -- -- -- -- -- - -- -- - 800
-- -- -- 759
-- -- -- - -- - -- -- -- 350

Local
well
number
09N/
27E-
21C0
1
09N/
27E-
25E0
1
09N/
27E-
29D0
109
N/27
E-29
J01
Alti
- We
ll
Open-
Open
- Us
e Date
Lat-
Long
- tude
depth
ing
ing
of
wate
rit
ude
itud
e of
LS
D (f
eet)
top
bott
om
water
level
(fee
t)
(feet)
(fee
t)
measured
5/15
/198
66/17/1986
7/15/1986
8/18
/198
69/
2/1986
9/16
/198
610/21/1986
11/18/1986
12/10/1986
2/ 3
/198
72/
26/1
987
2/26
/198
75/
6/1
987
11 1/1987
4615
24
1192644
725.00
405.0
370.00
405.
00
P 3/
21/1
986
9/ 6
/198
62/28/1987
4614
09
1192317
864.
00
1098
.0
650.00
780.00
I 4/
17/1
986
880.00
1098.00
9/ 6
/198
62/28/1987
4614
27
1192
819
652.
00
162.
0 16
2.00
16
2.00
H
2/22/1986
461405
1192
711
552.00
67.0
67.00
67.0
0 H
2/18
/198
69/
2/1986
9/ 2/1986
9/ 2
/1986
9/ 2
/1986
2/26
/198
72/26/1987
2/26
/198
72/
26/1
987
2/26/1987
2/26
/198
7
Water
level
(fee
t)
253.
00248.85
247.75
247.05
246.
21245.94
245.
9924
7.10
248.60
250.
40250.75
250.
7825
1.20
248.
88270.40
278.
07269.35
317.
6337
1.00
312.
00142.29
23.93
24.2
824.11
24.04
23.9
924.80
24.44
24.32
24.23
24.20
24.1
7
Status U U U - - U U U U U U U - U - - - V P - - R R R R R R R R R R R
Total
nitrate-
Spec
ific
Method
Samp
ling
pl
us-n
itri
te
conductance
date
as N
(mi Hi-
(mic
rosi
emen
sgrams
per
per
centimeter
lite
r)
at 2
5 de
gree
s C)
s s s s s s s s s s s s s s T 09
/06/
1986
4.20
425
s s s A A s S 09
/02/
1986
5.40
732
s s s s s s s s s s

09N/
27E-
29J0
2
09N/
27E-
29J0
3
09N/
27E-
35E0
1
461400
1192716
4613
58
1192712
4613
19
1192424
580.00
100.
0 10
0.00
10
0.00
U
588.00
98.0
96.00
98.00
H
665.
00
160.0
160.
00
160.
00
HI
09N
/27E
-36R
02
09N
/28E
-02G
01
09N
/28E
-02G
02
4612
49
1192
218
4617
41
1191
619
4617
38
1191
610
661.
00
153.0
153.
00
153.
00
U
359.
00
31.0
31.00
31.00
I
360.00
75.0
45.0
0 75.00
ZI
2/22/1986
9/ 2/1986
2/26
/198
72/18/1986
9/ 2/1986
2/26/1987
2/19/1986
4/16
/198
64/
16/1
986
4/16
/198
64/
16/1
986
5/15
/198
66/
17/1
986
7/15
/198
68/18/1986
9/ 2/1986
10/21/1986
11/18/1986
12/10/1986
1/13/1987
2/ 3
/198
72/
26/1
987
2/21/1986
9/ 2
/1986
2/26/1987
2/20/1986
9/ 5/1986
2/26
/198
73/
10/1
986
4/21
/198
65/
14/1
986
6/19
/198
67/
21/1
986
8/19
/198
69/
17/1
986
10/2
2/19
8611
/19/
1986
12/1
5/19
861/
14/1
987
2/ 3
/198
72/
27/1
987
2/27/1987
46.90
-46.43
-46.80
-59.96
-59.36
-59
.83
-10
4.90
-
107.
22
R10
7.20
R
107.18
R107.16
R10
7.25
-
107.
10
-12
2.75
P
125.
10
-10
5.54
-
108.
40
-10
3.90
-
105.
40
-10
6.00
-
106.
10
-10
5.53
-
82.4
6 -
78.27
-81
.69
-11.82
-12
.58
-13.07
-21.06
-20.78
-21.13
-20.68
-24.98
U25.48
-21
.36
-21
.83
-
22.28
-24
.80
-23
.10
-24
.50
-22
.53
R22.46
R
S S S S S S S S S S S S S S S S T S T T T S S S S S S S S S S S S S S S S T T T S S
09/0
2/19
86
09/02/1986
13.0
0
1.70
1140 401
09/0
5/19
867.
80830
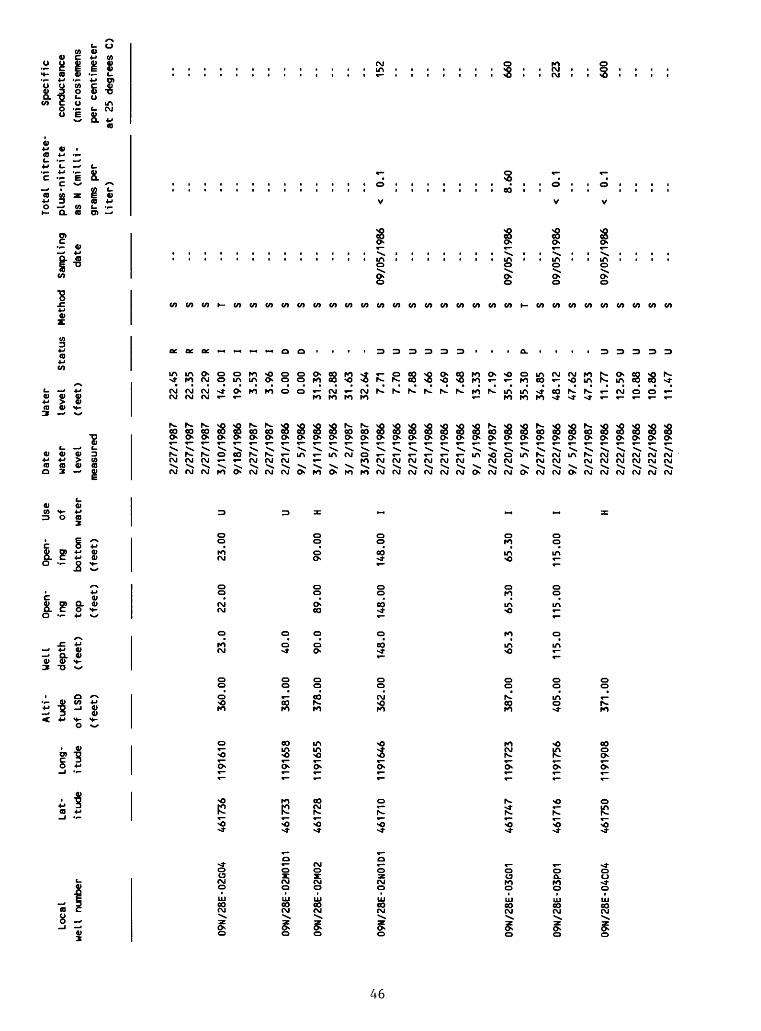
Loca
lwe
ll number
09N/28E-02G04
09N/28E-02M01D1
09N/28E-02M02
09N/
28E-
02N0
1D1
09N/28E-03G01
09N/28E-03P01
09N/28E-04C04
Alti
- Well
Open-
Open
- Us
e Date
Lat-
Lo
ng-
tude
depth
ing
ing
of
wate
rit
ude
itude
of LS
D (feet)
top
bott
om
wate
r le
vel
(feet)
(feet)
(feet)
meas
ured
2/27
/198
72/
27/1
987
2/27
/198
7461736
1191
610
360.
00
23.0
22.00
23.0
0 U
3/10
/198
69/
18/1
986
2/27
/198
72/
27/1
987
461733
1191
658
381.
00
40.0
U
2/21
/198
69/
5/1
986
4617
28
1191
655
378.00
90
.0
89.00
90.0
0 H
3/11
/198
69/
5/1
986
3/ 2
/198
73/
30/1
987
461710
1191
646
362.
00
148.0
148.
00
148.00
I 2/
21/1
986
2/21
/198
62/
21/1
986
2/21
/198
62/
21/1
986
2/21
/198
69/
5/1
986
2/26
/198
746
1747
11
9172
3 387.
00
65.3
65.30
65.30
I 2/
20/1
986
9/ 5
/198
62/
27/1
987
4617
16
1191
756
405.00
115.0
115.
00
115.00
I 2/
22/1
986
9/ 5
/198
62/
27/1
987
461750
1191
908
371.00
H
2/22
/198
62/
22/1
986
2/22
/198
62/
22/1
986
2/22
/198
6
Water
level
(feet) 22.45
22.3
522
.29
14.00
19.50
3.53
3.96
0.00
0.00
31.39
32.8
831
.63
32.64
7.71
7.70
7.88
7.66
7.69
7.68
13.33
7.19
35.16
35.3
034
.85
48.12
47.6
247
.53
11.77
12.5
910
.88
10.8
611.47St
atus R R R I I I I D D - - - - U U U U U U - - - p - - U U U U U
date
Total
nitr
ate-
pl
us-n
itri
te
as N
(m
illi
grams
per
lite
r)
Specific
conductance
(microsiemens
per
centimeter
at 2
5 de
gree
s C)
09/05/1986
0.1
152
09/0
5/19
86
09/05/1986
09/05/1986
8.60 0.1
0.1
660
223
600
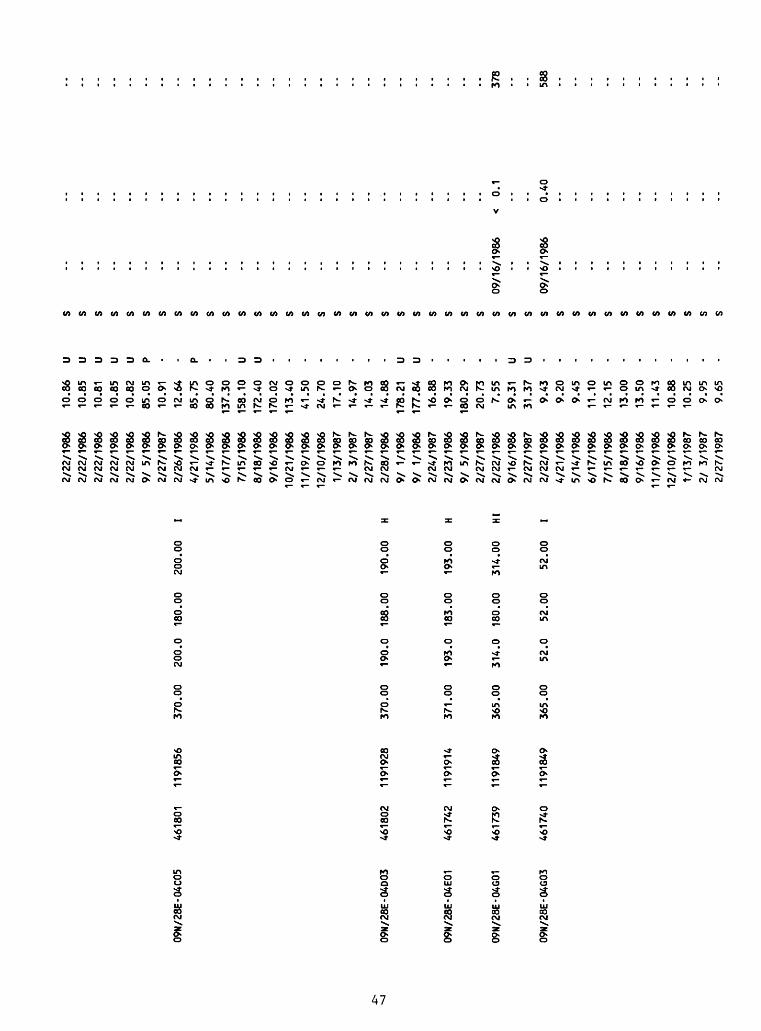
09N/
28E-
04C0
5 461801
1191856
370.00
200.0
180.00
200.00
I
09N/
28E-
04D0
3 46
1802
1191928
09N/28E-04E01
4617
42
1191
914
09N/28E-04G01
4617
39
1191849
09N/
28E-
04G0
3 46
1740
1191849
370.00
190.
0 188.00
190.
00
H
371.00
193.
0 18
3.00
19
3.00
H
365.00
314.0
180.
00
314.00
HI
365.00
52.0
52.00
52.00
I
2/22/1986
2/22/1986
2/22/1986
2/22/1986
2/22/1986
9/ 5
/198
62/27/1987
2/26/1986
4/21/1986
5/14/1986
6/17/1986
7/15/1986
8/18/1986
9/16/1986
10/21/1986
11/1
9/19
8612
/10/
1986
1/13/1987
2/ 3
/1987
2/27
/198
72/28/1986
9/ 1/
1986
9/ 1/
1986
2/24
/198
72/23/1986
9/ 5
/1986
2/27/1987
2/22/1986
9/16
/198
62/
27/1
987
2/22/1986
4/21
/198
65/14/1986
6/17
/198
67/15/1986
8/18
/198
69/16/1986
11/19/1986
12/10/1986
t/13/1987
2/ 3/
1987
2/27
/198
7
10.8
610.85
10.81
10.85
10.82
85.05
10.91
12.64
85.7
580.40
137.
30158.10
172.
4017
0.02
113.
4041.50
24.70
17.1
014
.97
14.03
14.8
8178.21
177.
8416
.88
19.33
180.29
20.7
37.
5559
.31
31.37
9.43
9.20
9.45
11.10
12.15
13.0
013
.50
11.43
10.8
810
.25
9.95
9.65
U U U U U P - - P - - U U - - - - - - U U - - - - U U - - - - - - - - - - - -
s s s s s s s s s s s s s s s s s s s s s s s s s s s s s s s s s s s s s s s s s s
09/1
6/19
86
09/1
6/19
86
0.1
0.40
378
588
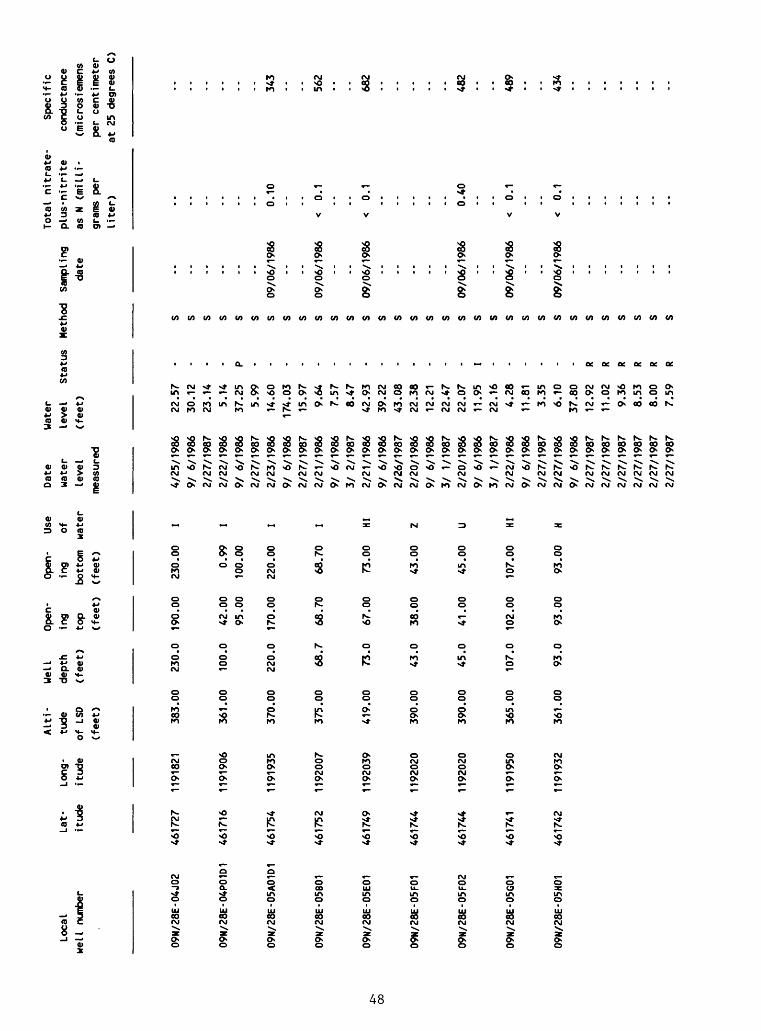
00
Local
well
nu
mber
09N/28E-04J02
09N/
28E-
04P0
1D1
09N/28E-05A01D1
09N/28E-05B01
09N/
28E-
05E0
1
09N/
28E-
05F0
1
09N/28E-05F02
09N/
28E-
05G0
1
09N/28E-05H01
Alti-
Well
Open-
Open-
Use
Date
Lat-
Long
- tude
dept
h ing
ing
of
wate
r
itude
itud
e of LS
D (feet)
top
bott
om water
leve
l
(fee
t)
(feet)
(feet)
meas
ured
461727
1191821
383.
00
230.0
190.
00
230.00
I 4/
25/1
986
9/ 6/
1986
2/27
/198
7
461716
1191906
361.
00
100.
0 42
.00
0.99
I 2/22/1986
95.0
0 100.00
9/ 6/1986
2/27
/198
7
4617
54
1191935
370.
00
220.
0 170.00
220.00
I 2/23/1986
9/ 6/
1986
2/27
/198
7
4617
52
1192
007
375.
00
68.7
68
.70
68.7
0 I
2/21/1986
9/ 6/
1986
3/ 2/
1987
4617
49
1192039
419.
00
73.0
67.00
73.00
HI
2/21
/198
6
9/ 6/
1986
2/26/1987
4617
44
1192020
390.
00
43.0
38.00
43.00
Z 2/
20/1
986
9/ 6/
1986
3/ 1/
1987
4617
44
1192020
390.
00
45.0
41
.00
45.00
U 2/20/1986
9/ 6/
1986
3/ 1/
1987
461741
1191950
365.
00
107.0
102.00
107.00
HI
2/22
/198
6
9/ 6/
1986
2/27
/198
7
4617
42
1191932
361.
00
93.0
93
.00
93.00
H 2/
27/1
986
9/ 6/
1986
2/27
/198
7
2/27/1987
2/27/1987
2/27/1987
2/27/1987
2/27
/198
7
Wate
r
leve
l St
atus
(feet) 22.57
30.1
2
23.14
5.14
37.2
5
5.99
14.6
0
174.03
15.9
7
9.64
7.57
8.47
42.9
3
39.2
2
43.0
8
22.3
8
12.2
1
22.4
7
22.0
7
11.9
5
22.1
6
4.28
11.8
1
3.35
6.10
37.8
0
12.9
2
11.0
2
9.36
8.53
8.00
7.59
- - - P - - - - - - - - - - - - - - I - - - - - - R R R R R R
date
Total
nitr
ate-
pl
us-n
itri
te
as N
(milli
grams
per
liter)
09/06/1986
09/06/1986
09/06/1986
09/06/1986
09/06/1986
09/0
6/19
86
0.10 0.1
0.1
0.40 0.1
0.1
Spec
i f i
cco
nduc
tanc
e(microsiemens
per
centimeter
at 25 degrees
C)
343
562
682
482
489
434
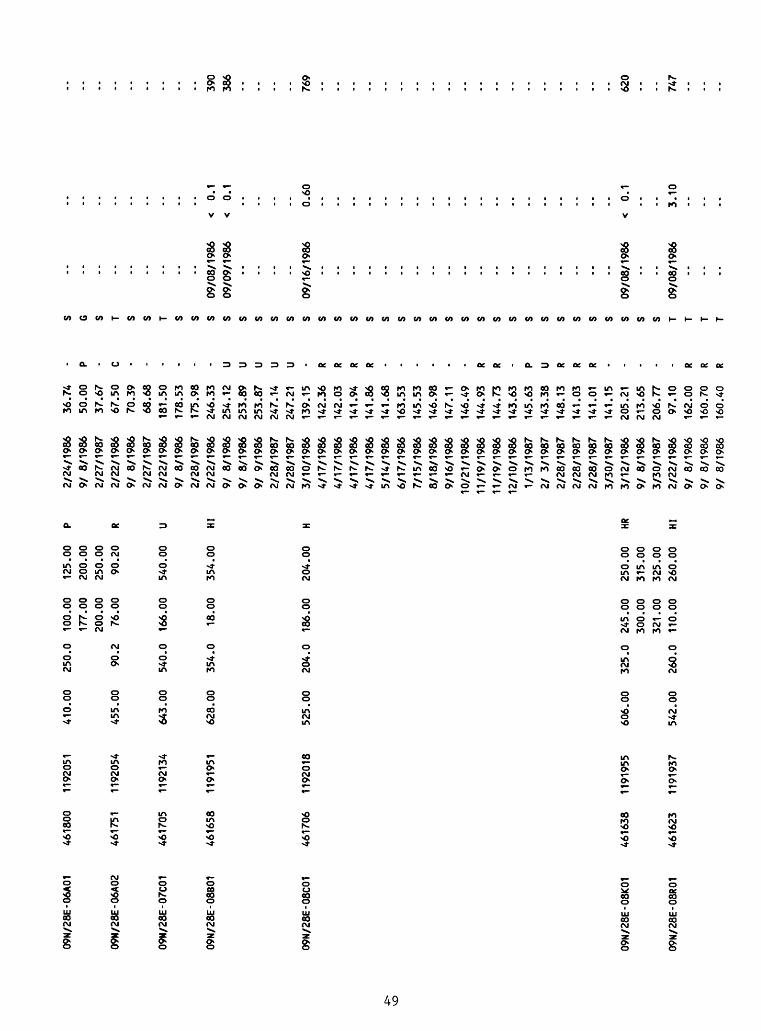
09N/28E-06A01
09N/28E-06A02
09N/28E-07C01
09N/28E-08B01
4618
00
1192
051
461751
1192054
4617
05
1192134
461658
1191951
410.
00
250.
0 100.00
125.00
P
177.00
200.
00
200.
00
250.
00
455.
00
90.2
76.0
0 90
.20
R
643.
00
540.
0 166.00
540.
00
U
628.
00
354.0
18.00
354.
00
HI
09N/
28E-
08C0
1461706
1192018
525.
00
204.
0 186.00
204.
00
H
09N/28E-08K01
09N/28E-08R01
461638
1191955
4616
23
1191937
606.
00
325.0
245.
00
250.
00
HR
300.
00
315.
00
321.
00
325.
00
542.
00
260.
0 110.00
260.
00
HI
2/24
/198
69/ 8
/198
62/
27/1
987
2/22/1986
9/ 8
/198
62/
27/1
987
2/22/1986
9/ 8
/198
62/
28/1
987
2/22
/198
69/
8/1
986
9/ 8
/198
69/ 9/
1986
2/28
/198
72/
28/1
987
3/10
/198
64/17/1986
4/17/1986
4/17/1986
4/17
/198
65/14/1986
6/17/1986
7/15/1986
8/18/1986
9/16
/198
610/21/1986
11/19/1986
11/19/1986
12/10/1986
1/13/1987
2/ 3/
1987
2/28
/198
72/
28/1
987
2/28
/198
73/
30/1
987
3/12/1986
9/ 8
/198
63/
30/1
987
2/22
/198
69/ 8/
1986
9/ 8/
1986
9/ 8
/198
6
36.74
50.00
37.67
67.50
70.39
68.6
818
1.50
178.
53175.98
246.33
254.12
253.
89253.87
247.14
247.
2113
9.15
142.36
142.
0314
1.94
141.86
141.68
163.
5314
5.53
146.98
147.11
146.49
144.
9314
4.73
143.
6314
5.63
143.38
148.
1314
1.03
141.01
141.
1520
5.21
213.65
206.
7797.10
162.
0016
0.70
160.40
- P - C - - - - - - U U U U U R R R R - - - - - R R - P U R R R - - - - R R R
s G s T s s T s s S 09
/08/
1986
<
0.1
S 09
/09/
1986
<
0.1
s s s s S 09
/16/
1986
0.60
s s s s s s s s s s s s s s s s s s s S 09
/08/
1986
<
0.1
s s T 09
/08/
1986
3.
10T T T
- -- -- -- -- -- -- - -- 390
386
-- -- -- -- 769
-- -- -- -- -- -- -- -- -- -- -- -- -- -- -- -- -- -- -- 620
-- -- 747
-- -- --
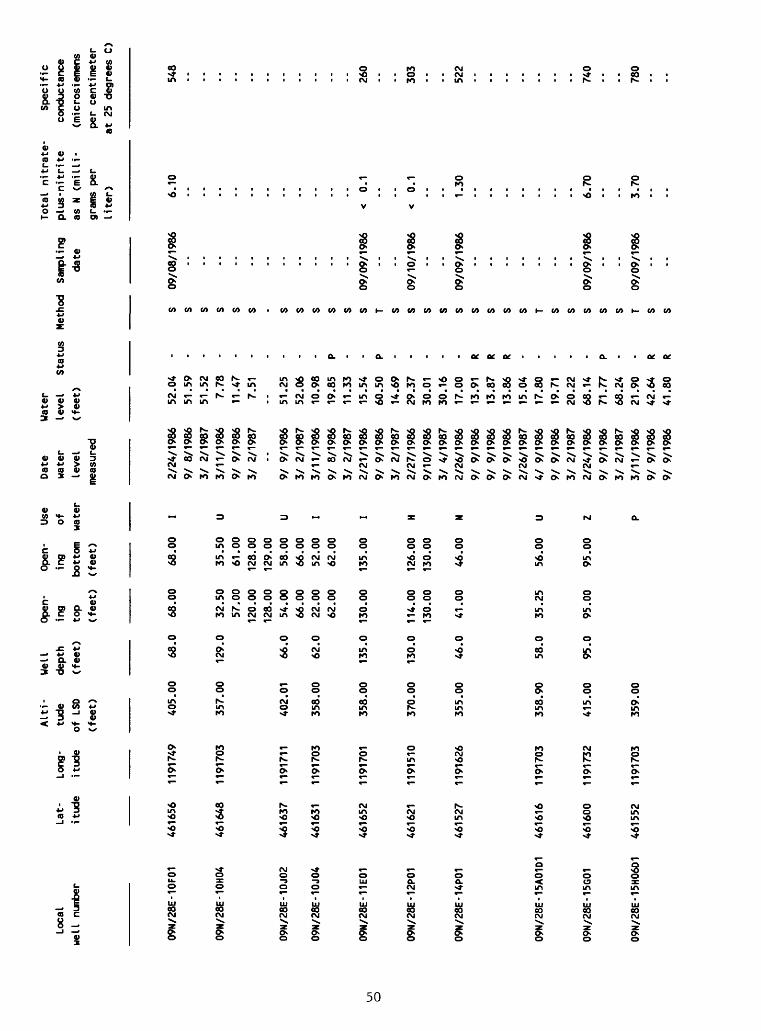
Loca
lwe
ll n
umbe
r
09N/
28E-
10F0
1
09N/
28E-
10H0
4
09N/
28E-
10J0
2
09N/
28E-
10J0
4
09N/
28E-
11E0
1
09N/
28E-
12P0
1
09N/
28E-
14P0
1
09N/28E-15A01D1
09N/
28E-
15G0
1
09N/
28E-
15H0
6D1
Alti-
Well
Open-
Lat-
Long-
tude
depth
ing
itud
e itude
of L
SD
(fee
t)
top
(feet)
(feet)
4616
56
1191749
405.00
68.0
68.00
4616
48
1191703
357.00
129.
0 32.50
57.00
120.
0012
8.00
461637
1191
711
402.
01
66.0
54.0
066.00
461631
1191703
358.00
62.0
22.0
062.00
4616
52
1191
701
358.00
135.
0 13
0.00
461621
1191510
370.00
130.
0 11
4.00
130.
00
4615
27
1191
626
355.00
46.0
41.00
4616
16
1191
703
358.90
58.0
35.25
4616
00
1191732
415.00
95.0
95.00
4615
52
1191
703
359.00
Open
- Us
eing
ofbo
ttom
water
(fee
t)
68.00
I
35.50
U61
.00
128.
0012
9.00
58.00
U66.00
52.00
I62.00
135.
00
I
126.
00
H13
0.00
46.00
N
56.00
U
95.00
Z P
Date
water
level
meas
ured
2/24/1986
9/ 8/
1986
3/ 2/
1987
3/11
/198
69/
9/1
986
3/ 2/
1987
--
9/ 9/
1986
3/ 2/
1987
3/11
/198
69/
8/
1986
3/ 2/
1987
2/21/1986
9/ 9/
1986
3/ 2/
1987
2/27/1986
9/10
/198
63/
4/1
987
2/26/1986
9/ 9/
1986
9/ 9/
1986
9/ 9/
1986
2/26
/198
74/
9/
1986
9/ 9
/198
63/
2/
1987
2/24/1986
9/ 9/
1986
3/ 2/
1987
3/11
/198
69/
9/
1986
9/ 9/
1986
Water
level
(fee
t) 52.04
51.59
51.52
7.78
11.47
7.51
-- 51.2
552.06
10.9
819.85
11.3
315
.54
60.50
14.6
929.37
30.01
30.16
17.00
13.9
113.87
13.8
615
.04
17.8
019
.71
20.22
68.14
71.7
768.24
21.90
42.64
41.80
Status - - - - - - - - - P - - P - - - - - R R R - - - - - P - - R R
Status
Meth
od
Samp
ling
da
te
09/0
8/19
86
Total
nitr
ate-
plus-nitrite
as N
(milli
gram
s pe
r liter) 6.10
09/0
9/19
86
09/1
0/19
86
09/0
9/19
86
09/0
9/19
86
09/0
9/19
86
0.1
0.1
1.30
6.70
3.70
Spec
ific
cond
ucta
nce
(mic
rosi
emen
spe
r ce
ntim
eter
at 25
degrees C
)
548
260
303
522
740
780

09N/28E-15H07D1
4616
01
1191703
09N/
28E-
15J0
1 461543
1191
704
09N
/28E
-17N
01
4615
35
1192
047
09N/
28E-
18H0
1 461553
1192055
09N/
28E-
18L0
1 461550
1192127
359.
00
P
359.
00
68.7
46.00
68.00
P
597.00
270.0
123.
70
270.00
HI
552.
00
308.0
200.00
220.00
H227.00
308.00
583.00
100.
0 19
.00
100.
00
HI
3/ 2/
1987
3/11/1986
9/ 9/1986
3/ 2/
1987
3/11/1986
4/21/1986
5/13/1986
6/19/1986
7/21
/198
68/
19/1
986
9/17
/198
610/22/1986
11/19/1986
12/15/1986
1/14/1987
2/ 4
/198
73/
2/
1987
2/25/1986
9/ 9
/198
69/
9/1
986
9/ 9
/198
69/
9/1
986
9/ 9/
1986
3/ 2
/198
73/12/1986
3/12/1986
3/12
/198
63/
12/1
986
9/ 9
/198
69/
9/1
986
9/ 9
/198
63/
2/
1987
3/ 2/
1987
3/ 2/
1987
3/ 2/
1987
3/14
/198
64/
17/1
986
5/14
/198
66/
19/1
986
6/19
/198
67/
21/1
986
8/19
/198
6
26.8
621
.60
27.2
225.98
20.8
420
.54
21.29
21.8
427
.54
32.5
433.57
23.6
021
.64
21.4
434
.04
44.5
425
.86
50.4
350
.82
49.99
49.7
249.56
49.46
49.93
133.28
133.25
133.
2313
3.22
167.
8916
7.68
167.
33136.51
136.31
135.
9613
5.98
38.19
38.3
734.70
33.30
33.50
32.6
532.50
- - - - - - - P P - U - - P P - - R R R R R - R R R R R R R R R R U - - U U U U -
s s s s s s s s s s s s s s s s s s s s s s s s s s s s s s s s s s s s s s s s s s
09/0
9/19
86
09/17/1986
3.00
1.90
740
674
09/09/1986
13.00
821
09/0
9/19
86
41.00
1370
09/1
7/1
986
13.0
076
2
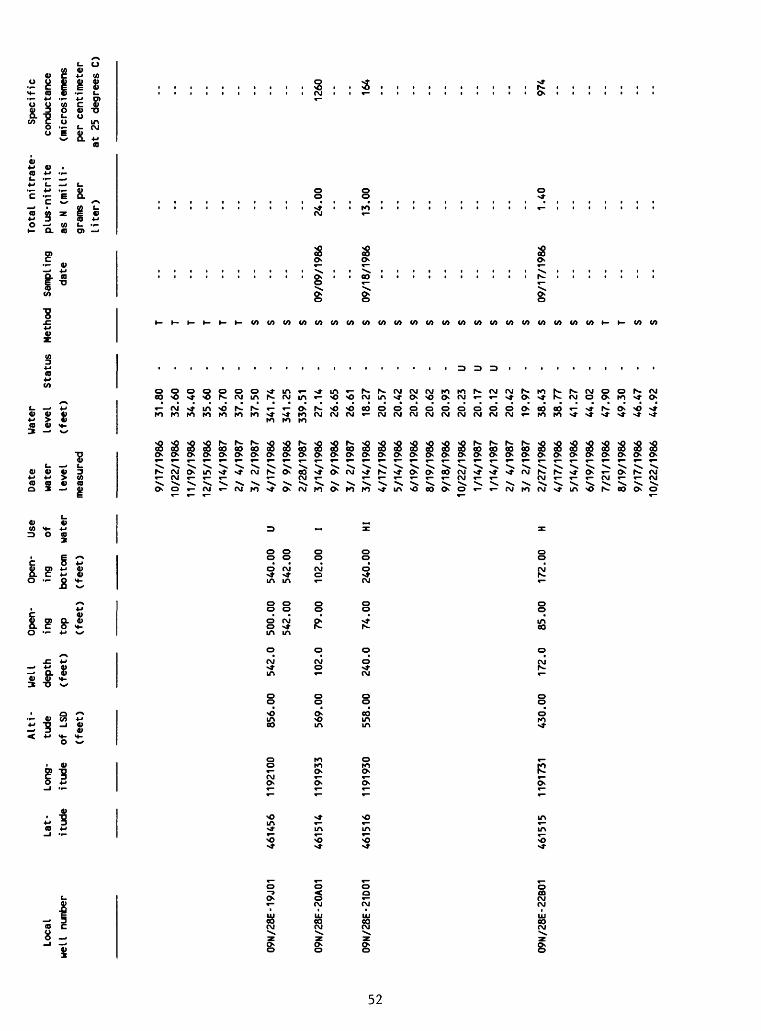
Ln
fO
09N/
28E-
19J0
1
09N/28E-20A01
09N
/28E
-21D
01
09N/
28E-
22B0
1
Alti-
Well
Open
- Open-
Use
Let-
Long
- tu
de
depth
ing
ing
ofit
ude
itude
of LSD
(feet)
top
bott
om
water
(fee
t)
(feet)
(feet)
4614
56
1192
100
856.00
542.0
500.00
540.00
U542.00
542.00
4615
14
1191
933
569.00
102.
0 79
.00
102.
00
I
4615
16
1191930
558.00
240.0
74.00
240.00
HI
461515
1191
731
430.00
172.
0 85.00
172.
00
H
Date
wate
rlevel
meas
ured
9/17
/198
610
/22/
1986
11/19/1986
12/15/1986
1/14/1987
2/ 4
/198
73/
2/1
987
4/17
/198
69/
9/1986
2/28/1987
3/14/1986
9/ 9
/198
63/
2/1
987
3/14
/198
64/
17/1
986
5/14/1986
6/19/1986
8/19/1986
9/18/1986
10/22/1986
1/14/1987
1/14/1987
2/ 4
/198
73/
2/
1987
2/27/1986
4/17
/198
65/
14/1
986
6/19/1986
7/21/1986
8/19
/198
69/
17/1
986
10/22/1986
Wate
rlevel
Stat
us(feet) 31.8
032.60
34.40
35.60
36.70
37.20
37.50
341.74
341.25
339.
5127
.14
26.6
526
.61
18.2
720.57
20.42
20.92
20.6
220
.93
20.2
320.17
20.1
220
.42
19.97
38.43
38.7
741
.27
44.02
47.90
49.30
46.4
744.92
- - - - - - - - - - - - - - - - - - U U U - - - - - - - - - -
09/09/1986
09/18/1986
24.00
13.0
0
1260 164
09/17/1986
1.40
974
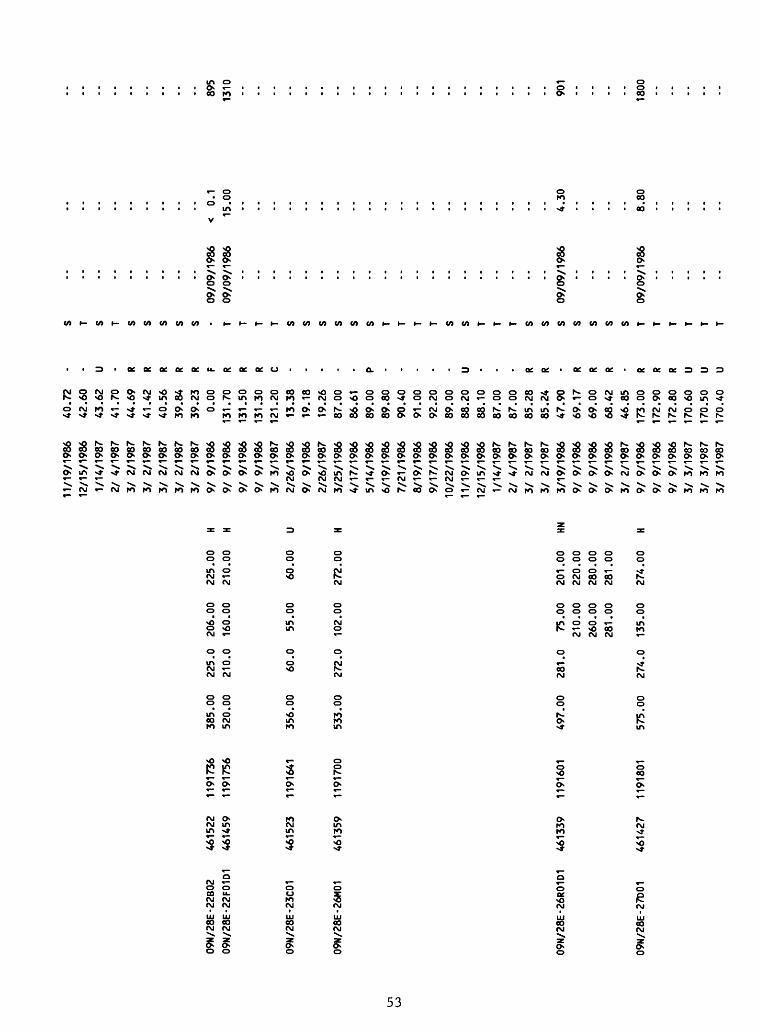
09N/
28E-
22B0
2 461522
1191
736
09N/28E-22F01D1
4614
59
1191756
09N/
28E-
23C0
1 461523
1191
641
09N/
28E-
26M0
1 46
1359
11
9170
0
385.00
225.0
206.00
225.
00
H 520.00
210.0
160.
00
210.
00
H
356.00
60.0
55.0
0 60
.00
U
533.00
272.
0 10
2.00
27
2.00
H
09N/28E-26R01D1
4613
39
1191
601
09N/
28E-
27D0
1 46
1427
11
9180
1
497.
00
281.0
75.00
201.
00
HN210.00
220.
00260.00
280.
00281.00
281.
00
575.00
274.0
135.00
274.
00
H
11/19/1986
12/15/1986
1/14/1987
2/ 4
/198
73/ 2/
1987
3/ 2/
1987
3/ 2
/198
73/ 2/
1987
3/ 2/
1987
9/ 9
/198
69/
9/1
986
9/ 9
/198
69/ 9
/198
63/ 3
/198
72/
26/1
986
9/ 9
/198
62/
26/1
987
3/25
/198
64/
17/1
986
5/14/1986
6/19/1986
7/21/1986
8/19
/198
69/
17/1
986
10/22/1986
11/19/1986
12/15/1986
1/14/1987
21 4
/198
73/
2/
1987
3/ 2/
1987
3/19
/198
69/
9/1
986
9/ 9
/198
69/ 9
/198
63/
2/1
987
9/ 9
/198
69/ 9
/198
69/
9/1
986
3/ 3
/198
73/ 3/
1987
3/ 3
/198
7
40.72
42.60
43.62
41.70
44.69
41.42
40.56
39.84
39.23
0.00
131.
70131.50
131.
30121.20
13.3
819
.18
19.2
687.00
86.61
89.00
89.80
90.40
91.00
92.20
89.00
88.20
88.10
87.00
87.00
85.2
885.24
47.9
069.17
69.00
68.42
46.85
173.
00172.90
172.80
170.
60170.50
170.40
- - U - R R R R R F R R R C - - - - - P - - - - - U - - - R R - R R R - R R R U U U
S T S T S S S S S - T T T T S S S S S S T T T T S S T T T S S S S S S S T T T T T T
09/09/1986
< 0.1
09/09/1986
15.00
895
1310
09/0
9/19
864.30
901
09/0
9/19
868.
8018
00
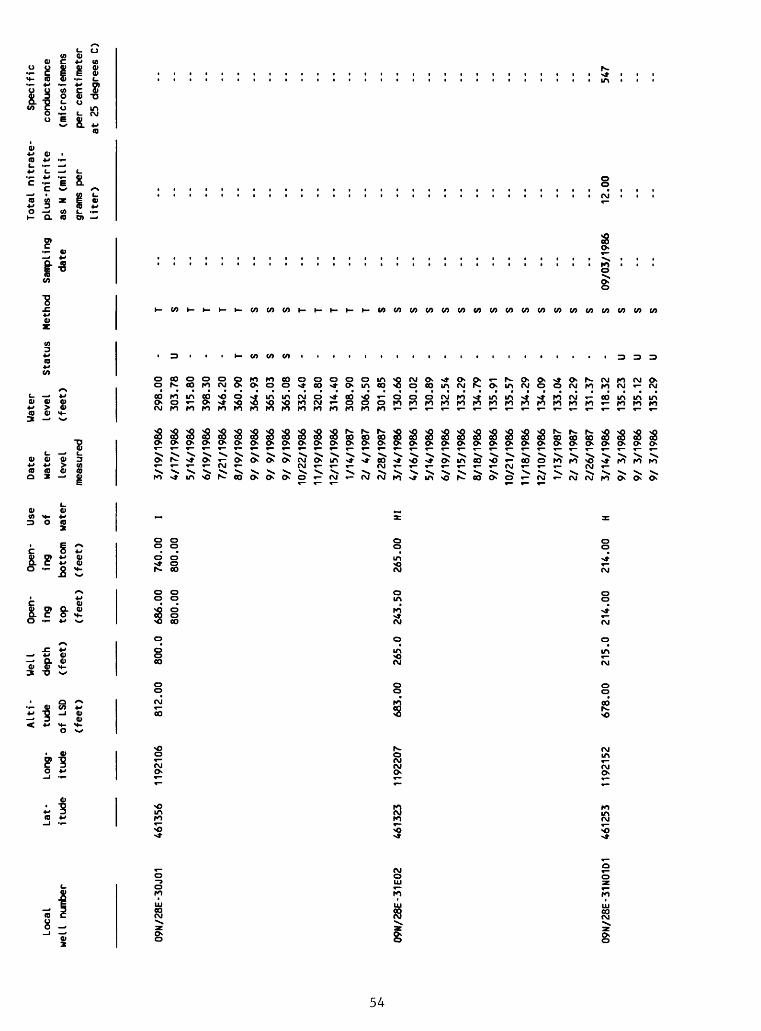
Alti
- We
ll
Open-
Open
- Us
e Date
Local
Lat-
Long
- tude
depth
ing
ing
of
water
well
number
itud
e it
ude
of LS
D (f
eet)
top
bott
om
water
leve
l(f
eet)
(f
eet)
(feet)
meas
ured
09N/
28E-
30J0
1 46
1356
1192106
812.
00
800.0
686.
00
740.
00
I 3/19/1986
800.
00
800.
00
4/17/1986
5/14
/198
66/
19/1
986
7/21/1986
8/19
/198
69/
9/1
986
9/ 9
/198
69/
9/1
986
10/22/1986
11/19/1986
12/15/1986
1/14/1987
2/ 4
/198
72/28/1987
09N/
28E-
31E0
2 46
1323
11
9220
7 68
3.00
265.0
243.
50
265.
00
HI
3/14
/198
64/16/1986
5/14
/198
66/
19/1
986
7/15/1986
8/18
/198
69/16/1986
10/21/1986
11/18/1986
12/10/1986
1/13
/198
72/ 3
/198
72/26/1987
09N/
28E-
31N0
1D1
4612
53
1192
152
678.
00
215.0
214.00
214.00
H 3/
14/1
986
9/ 3
/198
69/
3/1
986
9/ 3
/198
6
Water
leve
l Status
(fee
t)
298.
00
-30
3.78
U
315.
80
-39
8.30
-
346.
20
-36
0.90
T
364.
93
S36
5.03
S
365.
08
S33
2.40
-
320.
80
-31
4.40
-
308.
90
-30
6.50
-
301.85
-130.66
-130.02
-130.89
-132.54
-133.29
-134.79
-135.91
135.57
-134.29
-134.09
-133.04
132.29
-131.37
-118.32
-135.23
U135.12
U135.29
U
Tota
l ni
trat
e-
Spec
ific
Meth
od
Samp
ling
pl
us-n
itri
te
cond
ucta
nce
date
as N
(mi Hi-
(mic
rosi
emen
sgrams
per
per
cent
imet
erli
ter)
at 2
5 degrees
C)
T S T T T T S S S T T T T T s S s s s s s s s s s s s s S 09/03/1986
12.0
0 547
s s s
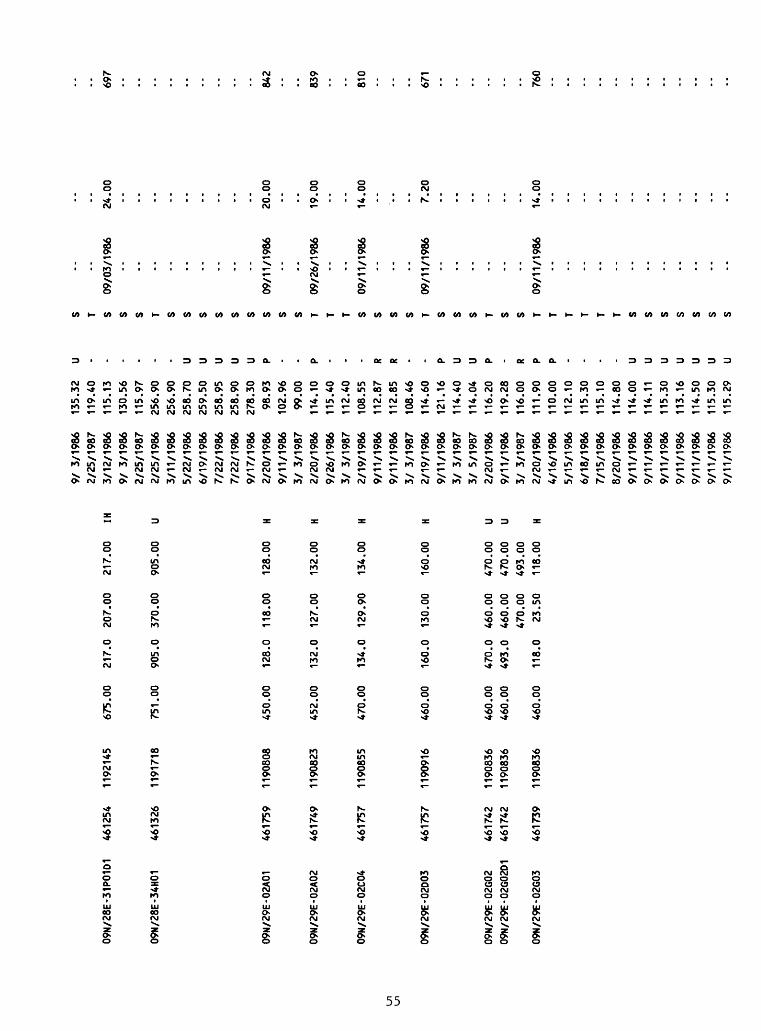
09N/28E-31P01D1
4612
54
1192145
675.00
217.0
207.
00
217.00
IH
09N/
28E-
34H0
1 46
1326
11
9171
8 751.00
905.0
370.
00
905.00
U
09N/29E-02A01
4617
59
1190
808
450.00
128.
0 118.00
128.00
H
09N/
29E-
02A0
2 46
1749
1190823
452.00
132.0
127.00
132.00
H
09N/
29E-
02C0
4 46
1757
11
9085
5 470.00
134.
0 129.90
134.
00
H
09N/
29E-
02D0
3 46
1757
11
9091
6 460.00
160.
0 130.00
160.
00
H
09N/
29E-
02G0
2 46
1742
11
9083
609N/29E-02G02D1
4617
42
1190
836
09N/
29E-
02G0
3 46
1739
1190836
460.00
470.0
460.
00
470.
00
U460.00
493.0
460.
00
470.00
U47
0.00
493.00
460.00
118.
0 23.50
118.00
H
9/ 3/
1986
2/25/1987
3/12/1986
9/ 3
/198
62/
25/1
987
2/25
/198
63/11/1986
5/22
/198
66/
19/1
986
7/22/1986
7/22/1986
9/17
/198
62/
20/1
986
9/11
/198
63/
3/1
987
2/20
/198
69/
26/1
986
3/ 3
/198
72/19/1986
9/11
/198
69/
11/1
986
3/ 3
/198
72/19/1986
9/11
/198
63/ 3
/198
73/
5/1
987
2/20
/198
69/
11/1
986
3/ 3
/198
72/20/1986
4/16
/198
65/15/1986
6/18
/198
67/15/1986
8/20
/198
69/
11/1
986
9/11
/198
69/
11/1
986
9/11/1986
9/11
/198
69/
11/1
986
9/11
/198
6
135.32
119.
4011
5.13
130.56
115.97
256.90
256.90
258.70
259.50
258.95
258.90
278.30
98.93
102.96
99.00
114.10
115.40
112.
4010
8.55
112.87
112.
8510
8.46
114.60
121.16
114.40
114.
0411
6.20
119.28
116.
0011
1.90
110.00
112.
1011
5.30
115.10
114.80
114.
00114.11
115.30
113.16
114.
5011
5.30
115.
29
U - - - - - - U U U U U p - - p - - - R R - - P U U p - R P P - - - - U U U U U U U
s T S S S T S s s s s s s s s T T T S S S s T S s s T S s T T T T T T S S S S S S S
09/03/1986
24.00
697
09/11/1986
09/26/1986
09/11/1986
09/11/1986
20.00
19.0
0
14.00
7.20
842
839
810
671
09/11/1986
14.0
076
0
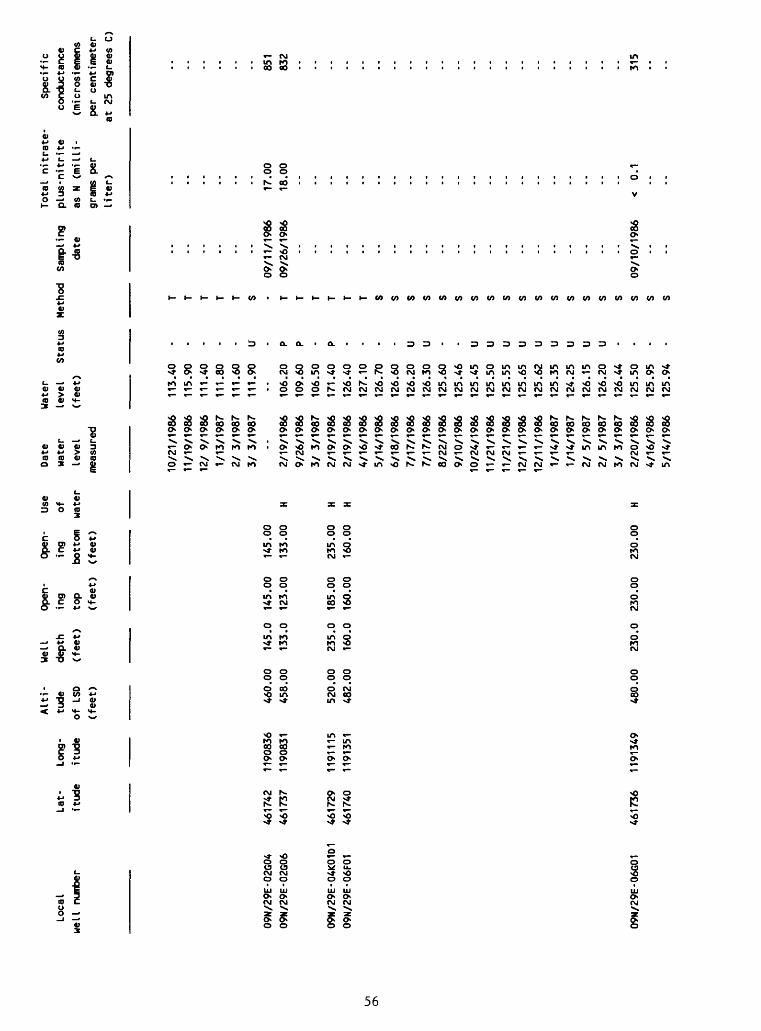
Local
well number
09N/
29E-
02G0
409
N/29
E-02
G06
09N/
29E-
04K0
1D1
09N/
29E-
06F0
1
09N/
29E-
06G0
1
Alti-
Well
Open-
Open-
Use
Date
Lat-
Long
- tu
de
depth
ing
ing
of
wate
ritude
itude
of LS
D (f
eet)
top
bott
om
wate
r le
vel
(fee
t)
(fee
t)
(fee
t)
meas
ured
10/21/1986
11/19/1986
12/ 9/
1986
1/13/1987
2/ 3
/198
73/
3/1
987
4617
42
1190836
460.
00
145.
0 145.00
145.
0046
1737
11
9083
1 458.00
133.
0 12
3.00
13
3.00
H
2/19
/198
69/
26/1
986
3/ 3
/198
746
1729
11
9111
5 520.00
235.0
185.
00
235.00
H 2/19/1986
461740
1191
351
482.00
160.
0 16
0.00
16
0.00
H
2/19
/198
64/
16/1
986
5/14/1986
6/18
/198
67/17/1986
7/17
/198
68/
22/1
986
9/10
/198
610/24/1986
11/21/1986
11/21/1986
12/11/1986
12/11/1986
1/14/1987
1/14/1987
2/ 5
/198
72/
5/1
987
3/ 3
/198
746
1736
1191349
480.00
230.
0 230.00
230.00
H 2/20/1986
4/16
/198
65/14/1986
Wate
rlevel
(fee
t)
113.
4011
5.90
1 1 1 .4
01 1
1 .8
011
1.60
111.
90-- 106.
2010
9.60
106.
5017
1.40
126.
4012
7.10
126.
7012
6.60
126.
2012
6.30
125.
60125.46
125.
4512
5.50
125.
5512
5.65
125.
6212
5.35
124.
2512
6.15
126.
2012
6.44
125.
5012
5.95
125.94
Stat
us - - - - U - P P - P - - - - U U - - U U U U U U U U U - - - -
Total
nitr
ate-
Sp
ecif
icMe
thod
Sa
mpli
ng
plus
-ni
trit
e co
nduc
tanc
eda
te
as N
(mi Hi
- (m
icro
siem
ens
grams
per
per
centimeter
liter)
at 25 d
egrees C
)
T T T T T s - 09
/11/
1986
17
.00
851
T 09
/26/
1986
18
.00
832
T T T T T s s s s s s s s s s s s s s s s S 09
/10/
1986
<
0.1
315
s s

09N/
29E-
06J0
1 461733
1191314
495.
00
207.
0
09N/
29E-
1080
1 461703
1190
948
515.
00
200.
0 200.00
200.00
H
09N/
29E-
10C0
1 461703
1191
015
515.
00
135.0
H 09
N/29
E-16
R01
461533
1191044
445.
00
301.0
286.60
301.
00
H
09N/
29E-
17L0
1 461545
1191240
390.
00
260.
0 0.99
0.00
H
09N/29E-21R01D1
461440
1191047
361.
00
59.0
54.00
58.00
H
6/18
/198
67/
17/1
986
8/22
/198
68/
22/1
986
9/10
/198
610
/24/
1986
10/2
4/19
8611
/21/
1986
12/11/1986
1/14/1987
1/14
/198
721 5/
1987
3/ 3/
1987
2/19
/198
69/
9/
1986
3/ 3/
1987
3/ 3/
1987
2/20
/198
69/
12/1
986
3/ 3
/198
7
2/22
/198
69/
12/1
986
9/12
/198
63/
3/
1987
2/21
/198
64/
16/1
986
5/15/1986
6/18
/198
67/
18/1
986
8/22
/198
69/
10/1
986
10/2
4/19
8610/24/1986
11/21/1986
11/21/1986
12/11/1986
1/13
/198
72/ 3
/198
73/
3/
1987
2/21
/198
69/
10/1
986
126.
1212
5.90
126.
3012
6.10
125.
6512
4.90
124.97
124.
8212
5.20
125.
4012
5.35
125.
70125.71
140.
5813
9.60
140.
1014
0.13
168.
80171 .9
016
8.28
116.
5012
9.42
129.
30115.65
46.80
50.0
050
.40
53.6
056
.60
52.8
052.89
48.7
048
.80
48.1
048
.20
47.80
47.0
046
.60
46.4
012.30
11.0
7
- U u U - u u u - u u - - p - u u - - - p u u - - - - p u - - u u u u - - u - - -
s s s s s s s s s s s s s s s s s T s s T s s s T T T T T T S T T T T T T T S T S
09/1
2/19
86
13.00
09/0
3/19
86
5.80
728
703
09/10/1986
< 0.1
378
09/10/1986
6.60
620

Loca
l we
ll number
00
09N/
29E-
22D0
1
09N/
29E-
25L0
4
09N/
29E-
25N0
1
09N/29E-26J02
09N/
29E-
26L0
2
09N/
29E-
31L0
1
09N/29E-33M01
Alti-
Well
Op
en-
Open
- Use
Lat-
Lo
ng-
tude
depth
ing
ing
ofitude
itude
of L
SD
(fee
t)
top
bottom
wate
r(feet)
(feet)
(feet)
4615
12
1191029
395.00
86.0
86.00
86.00
H
4613
56
1190752
348.00
49.0
45.00
49.00
I
4613
49
1190
814
353.00
30.0
30.00
30.00
H
4614
00
1190823
355.00
40.0
35.00
40.00
I
4614
00
1190
910
361.00
35.0
35.00
35.00
H
4613
02
1191402
545.00
100.
0 90.00
95.00
I95.00
100.
00
461305
1191202
508.00
292.0
181.
00
292.
00
I
Date
water
leve
lme
asur
ed
3/ 3
/198
72/
21/1
986
3/21
/198
73/
5/
1986
9/10
/198
69/
10/1
986
3/ 2/1987
3/ 6
/198
69/
6/1
986
3/ 3
/198
72/
25/1
986
9/ 6
/198
63/
3/1
987
2/24
/198
69/
10/1
986
3/ 3
/198
72/
21/1
986
9/ 3
/198
62/
26/1
987
3/11
/198
64/
18/1
986
5/13
/198
66/
18/1
986
7/22
/198
68/
19/1
986
9/ 3
/198
610/22/1986
11/19/1986
12/13/1986
1/14
/198
72/
4/1
987
2/26
/198
7
Water
leve
l(feet) 12.3
952
.00
52.7
413.30
13.3
813
.36
13.40
8.75
8.90
8.90
15.8
015
.72
15.7
821
.70
20.86
21.2
057
.83
56.2
356.08
136.
5413
7.05
135.
6513
2.75
131.
2513
0.90
131.
0813
1.15
132.
7513
3.85
134.
8513
5.55
135.
90
Status - U - R R - - - P - - P - - - - - - - - - - - U - - - -
Status
Meth
od
Samp
ling
da
te
Total
nitrate-
plus
-nit
rite
as
N (m
illi
grams
per
liter)
Spec
ific
conductance
(mic
rosi
emen
spe
r centimeter
at 25 degrees
C)
09/0
6/19
86
09/1
0/19
86
09/0
3/19
86
09/1
7/19
86
9.70
9.50
0.40
1.60
629
661
849
449

09N/
29E-
36N0
2 46
1254
11
9075
7 36
2.00
41.0
39.00
41.0
0 H
09N/30E-02R01
4617
12
1190041
515.00
211.0
177.
50
211.00
H
09N/30E-06L01
4617
27
1190630
432.00
93.0
93.00
93.0
0 H
09N/30E-06Q01D1
4617
11
1190608
435.00
154.
0 14
9.00
15
4.00
H
09N/
30E-
08A0
2 46
1704
1190429
543.00
600.0
222.00
600.00
U
09N/30E-08B02D1
4617
03
1190457
475.00
135.
0HI
09N/
30E-
13E0
2 46
1556
11
9002
8 44
3.00
87.0
87.00
87.0
0 U
09N/
30E-
14A0
2 46
1612
11
9004
4 49
5.00
157.5
147.
00
157.
50
H
09N/30E-17K01D1
461545
1190501
428.00
105.
0 97.00
105.
00
A
09N/
30E-
17Q0
1 46
1532
1190458
425.00
109.5
99.5
0 10
9.50
I
09N/
30E-
20L0
1 46
1458
1190505
430.00
105.
0 98.00
105.
00
I
09N/
30E-
22K0
1 46
1439
1190216
420.00
138.
0 13
3.00
13
8.00
H
3/11
/198
69/
4/1
986
3/ 2/1987
3/ 2
/198
72/21/1986
9/ 9
/198
63/
3/1
987
3/ 3
/198
69/
11/1
986
2/27/1987
2/27
/198
73/
4/1
987
2/21/1986
9/11
/198
62/
27/1
987
2/21
/198
69/
9/1
986
2/27/1987
2/21/1986
9/ 9
/198
69/
9/1
986
9/ 9
/198
69/
9/1
986
2/27
/198
72/24/1986
2/24/1986
2/24/1986
9/10
/198
63/ 6
/198
72/25/1986
9/ 9
/198
62/
27/1
987
2/22/1986
9/11
/198
62/
27/1
987
2/22/1986
9/26/1986
9/26
/198
62/27/1987
2/24/1986
4/17/1986
5/15
/198
6
26.9
423.69
26.8
226.79
114.
2011
9.19
114.07
70.2
573.50
70.48
70.4
570
.32
80.35
83.04
80.48
174.
40176.21
174.
3011
2.20
118.67
115.
03119.57
115.
0011
1.73
59.6
559
.70
112.78
118.21
113.
7280
.95
82.50
80.96
83.80
85.17
83.99
77.04
77.1
078
.11
77.2
512
3.20
122.
3012
2.00
- - U u - - u - - u u - - - - - - - - u u u u - u u - - - - p - - - - u u u - u p -
s s s s T s s s s s s s s s s s s s T s s s s s s s s s s s s s T s s s s s s T T T
09/0
6/19
86
09/09/1986
3.50
4.60
592
573
09/1
1/19
8615
.00
750
09
/09
/19
86
12.00
660
09/10/1986
4.40
585
09/1
1/19
8613
.00
730
09/1
0/19
865.
00601
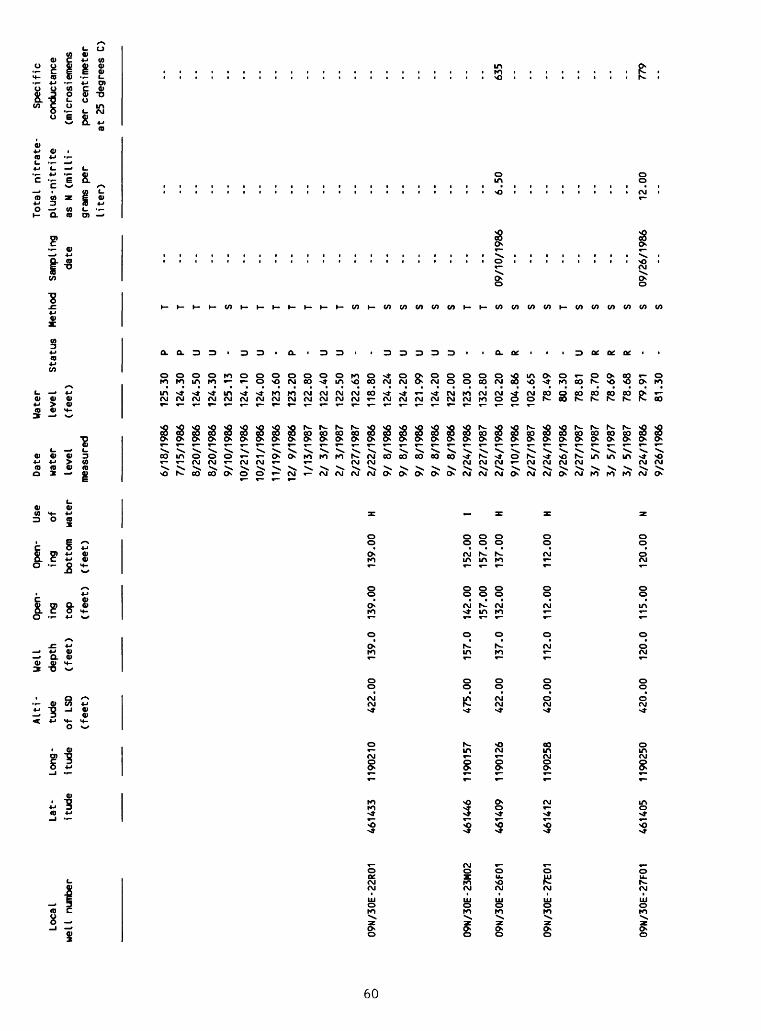
o09N/30E-22R01
09N/30E-23M02
09N/30E-26F01
09N/30E-27E01
09N/
30E-
27F0
1
Alti
- We
ll
Open
- Op
en-
Use
Lat-
Long-
tude
dept
h ing
ing
of
itud
e it
ude
of LSD
(feet)
top
bott
om
water
(feet)
(feet)
(feet)
4614
33
1190210
422.00
139.0
139.00
139.00
H
4614
46
1190157
475.00
157.0
142.00
152.00
I
157.00
157.
00
4614
09
1190126
422.00
137.
0 132.00
137.
00
H
4614
12
1190258
420.00
112.0
112.00
112.00
H
461405
1190250
420.00
120.0
115.00
120.00
N
Date
wate
r
leve
l
measured
6/18
/198
6
7/15
/198
6
8/20/1986
8/20
/198
6
9/10
/198
6
10/21/1986
10/2
1/19
86
11/19/1986
12/
9/1986
1/13
/198
7
2/ 3/
1987
2/ 3
/1987
2/27
/198
7
2/22/1986
9/ 8/
1986
9/ 8/
1986
9/ 8/
1986
9/ 8/
1986
9/ 8
/1986
2/24/1986
2/27
/198
7
2/24
/198
6
9/10
/198
6
2/27
/198
7
2/24/1986
9/26
/198
6
2/27
/198
7
3/ 5/
1987
3/ 5/
1987
3/ 5/
1987
2/24/1986
9/26
/198
6
Wate
r
leve
l
(feet)
125.30
124.
30
124.50
124.30
125.13
124.10
124.00
123.60
123.
20
122.80
122.40
122.
50
122.63
118.80
124.24
124.20
121.
99
124.
20
122.
00
123.00
132.80
102.20
104.
86
102.65
78.49
80.3
0
78.8
1
78.7
0
78.6
9
78.6
8
79.9
1
81.3
0
Stat
us P P U U - U U - P - U U - - U U U U U - - P R - - - U R R R - -
09/1
0/19
866.50
635
09/2
6/19
8612.00
779

09N/
30E-
27H0
1 46
1407
11
9021
6 41
5.00
93.0
88.0
0 93.00
H
09N/
30E-
27H0
2 46
1407
1190218
420.
00
119.
0 11
9.00
11
9.00
H
09N/
30E-
27L0
1 461352
1190
242
420.
00
121.
0 116.00
121.
00
U
09N/
30E-
27P0
1 461347
1190244
422.
00
135.
0 125.00
135.
00
H
09N/
30E-
28H0
1 461408
1190327
420.
00
97.0
92.00
97.00
U
09N/
30E-
34D0
1 46
1335
11
9031
1 41
8.00
10
0.0
99.00
100.
00
H
09N/
31E-
07Q0
2 461620
1185838
570.00
400.0
173.00
400.00
H
09N/
31E-
07Q0
3 461620
1185843
572.
00
425.0
196.00
425.00
H
09N/
31E-
14G0
1 46
1546
1185349
618.
00
355.0
131.
00
355.00
H 09
N/31
E-19
G01
461500
1185848
500.00
558.0
158.00
558.00
H
09N/
31E-
20C0
1 461513
1185
746
542.
00
500.0
133.00
500.00
H
09N/
31E-
23A0
2 46
1516
11
8532
1 50
0.00
320.0
162.
00
320.00
I
10N/27E-11L01
462149
1192
400
440.
00
62.0
57.00
62.00
HI
2/27/1987
2/24/1986
2/27/1987
-- --
2/27/1986
9/26
/198
62/27/1987
2/24/1986
2/27/1987
2/27/1986
9/ 8/
1986
2/27
/198
72/25/1986
9/ 8
/198
63/
2/
1987
2/25/1986
3/ 5/
1987
2/25/1986
9/24
/198
63/
5/
1987
3/ 1/1986
2/25/1986
9/24
/198
63/
4/1
987
3/ 4
/198
73/
4/1
987
3/ 4
/198
69/
24/1
986
3/ 4
/198
73/
4/1
987
3/ 4
/198
73/ 4/
1987
3/ 4
/198
73/
5/
1986
9/24
/198
63/ 4/
1987
2/27/1986
4/17
/198
65/15/1986
6/17
/198
67/
15/1
986
80.11
77.70
78.20
-- -- 84.90
86.37
85.15
85.35
85.6
772.30
73.50
72.52
76.80
77.99
76.9
6247.35
254.24
253.50
269.54
275.
81255.60
134.90
165.
05181.50
183.80
181.30
163.00
182.26
160.
9516
1.85
161.81
161.77
161.74
143.
1514
4.75
144.
5044
.62
42.0
644.05
44.10
40.6
5
- - - - - - - - P - - - P - - P - P U U P P U U U U P - U U U U U - - - - - P P -
s T T - 09
/08/
1986
8.20
- 09
/10/
1986
10.00
s s s s s s s s S 09
/08/
1986
9.60
s s s s S 09
/24/
1986
<
0.1
s s S 09
/12/
1986
6.30
S 09
/24/
1986
<
0.1
s T T T s s s s s s s s s s s s s s s
-- -- 671
671
-- -- -- -- -- -- -- -- 750
-- -- -- -- 558
-- -- 470
433
-- -- -- -- -- -- -- -- -- - -- -- -- -- -- -- -- -- --
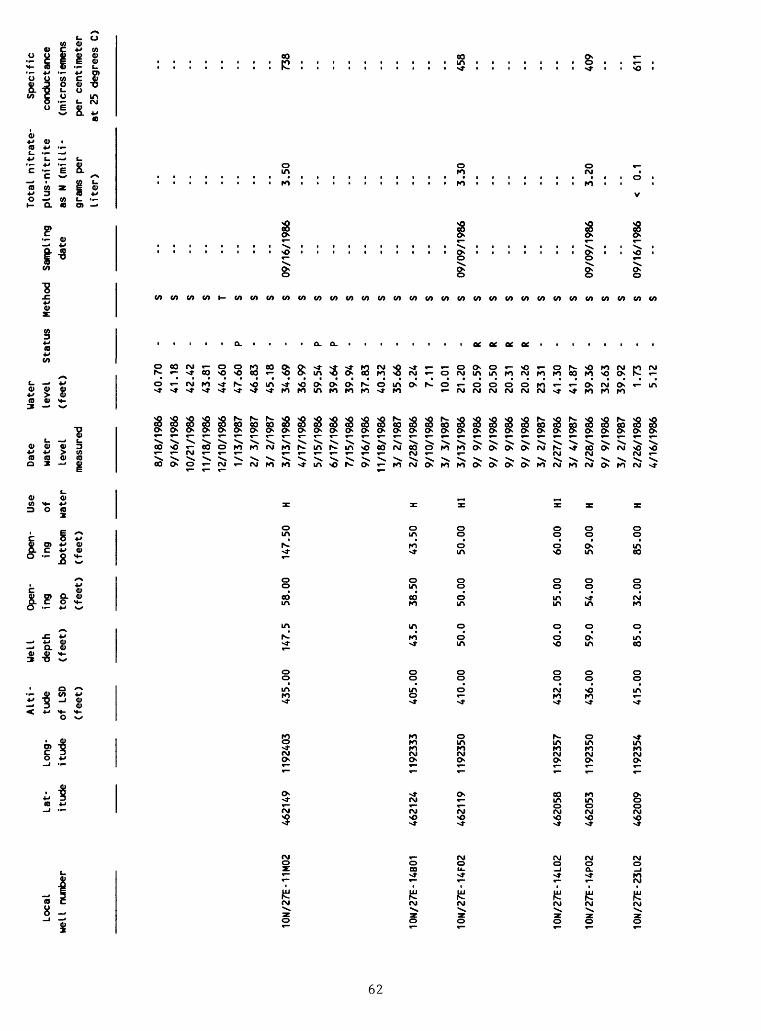
10N
/27E
-11M
02
10N
/27E
-14B
01
10
N/2
7E
-14
F0
2
10N
/27E
-14L02
10N
/27E
-14P
02
10N
/27E
-23L02
Alti
- We
ll
Open
- Open-
Use
Lat-
Lo
ng-
tude
depth
ing
ing
ofitude
itude
of LS
D (feet)
top
bott
om
wate
r(f
eet)
(feet)
(feet)
4621
49
1192
403
435.00
147.5
58.0
0 147.50
H
462124
1192
333
405.
00
43.5
38.50
43.50
H
4621
19
1192350
410.
00
50.0
50.0
0 50.00
HI
4620
58
1192357
432.
00
60.0
55.0
0 60.00
HI
4620
53
1192
350
436.
00
59.0
54.0
0 59.00
H
4620
09
1192
354
415.
00
85.0
32.0
0 85
.00
H
Date
wate
rle
vel
measured
8/18/1986
9/16
/198
610
/21/
1986
11/1
8/19
8612
/10/
1986
1/13/1987
2/ 3
/198
73/
2/1987
3/13
/198
64/17/1986
5/15/1986
6/17
/198
67/15/1986
9/16/1986
11/1
8/19
863/
2/1
987
2/28/1986
9/10
/198
63/
3/1
987
3/13/1986
9/ 9
/1986
9/ 9
/1986
9/ 9
/1986
9/ 9
/1986
3/ 2
/198
72/27/1986
3/ 4
/198
72/28/1986
9/ 9
/1986
3/ 2/1987
2/26/1986
4/16/1986
Water
leve
l(f
eet) 40.7
041.18
42.42
43.8
144.60
47.60
46.83
45.1
834.69
36.9
959
.54
39.64
39.94
37.8
340.32
35.6
69.24
7.11
10.01
21.20
20.59
20.50
20.31
20.26
23.31
41.30
41.87
39.36
32.63
39.9
21.
735.12
Status - - - - P - - - - P P - - - - - - - - R R R R - - - - - - - -
09/1
6/1
986
3.5
073
8
09
/09
/19
86
3
.30
458
09/09/1986
3.20
09/16/1986
< 0.
1
409
611

10N/
27E-
25R0
2 461900
1192159
395.
00
30.0
30.00
30.00
I
10N/
27E-
25R0
3 461856
1192208
10N/
27E-
30F0
1 46
1927
1192859
10N/27E-32N01
4618
11
1192
817
10N
/27E
-33B
01
4618
54
1192
622
10N/
27E-
36J0
1 46
1817
1192158
425.00
80.0
80.00
80.00
HI
520.00
260.
0 10
7.00
260.00
H
510.
00
187.
0 89.00
187.
00
H
575.00
250.0
223.00
244.00
HI246.00
250.00
450.
00
570.0
65.00
570.00
P
5/15/1986
6/17
/198
67/15/1986
8/18
/198
69/
16/1
986
10/2
1/19
8611
/18/
1986
12/1
0/19
861/13/1987
2/ 3
/1987
3/ 2
/1987
2/27/1986
4/16/1986
5/14/1986
6/17
/198
67/21/1986
8/18/1986
9/16
/198
69/
16/1
986
10/2
1/19
8611
/18/
1986
12/1
0/19
861/13/1987
2/ 3
/198
73/
3/1
987
3/11/1986
9/ 9
/1986
3/ 2
/1987
3/12/1986
4/16/1986
5/15/1986
3/20
/198
69/
10/1
986
2/27/1987
3/12
/198
69/
10/1
986
2/27/1987
2/25/1986
9/10/1986
9/10/1986
9/10/1986
3/ 2/1987
6.45
5.50
1.35
1.95
0.14
0.13
0.65
1.39
1.70
1.91
2.17
9.61
8.93
6.87
9.82
4.57
4.27
4.53
4.48
5.46
7.34
8.25
9.37
9.73
10.05
42.9
636
.49
43.60
88.60
89.4
590
.27
66.80
60.90
60.2
715
0.84
168.11
155.
3047.20
64.2
764.22
64.1
647.73
P - - - - - - - - - - - - - P - - U U - - - - - - - - - - - - U - - - - R - R R R -
S S S S S S S S S S S S S S S S S S S S S S S S S S S S S S S T S S S S T T S S S S
09/09/1986
4.70
591
09/10/1986
09/10/1986
09/1
0/19
86
1.70
4.90
1.40
792
802
443
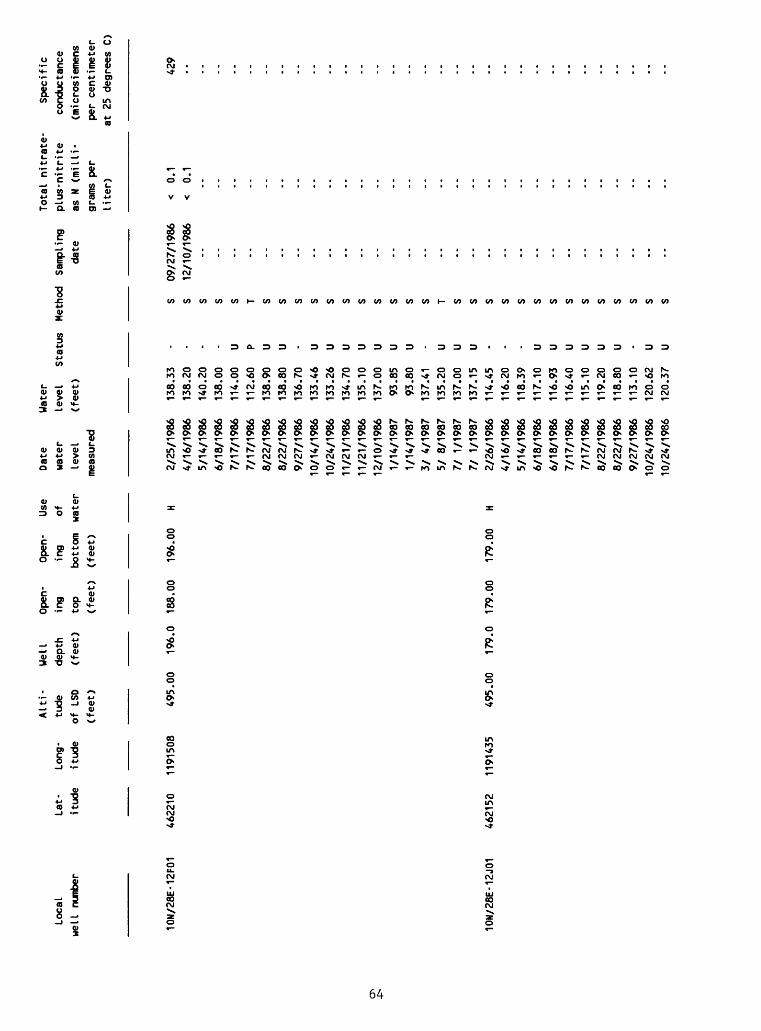
Alti
- We
ll
Open
- Op
en-
Use
Date
Local
Lat-
Lo
ng-
tude
de
pth
ing
ing
of
water
well
number
itude
itud
e of
LSD
(fee
t)
top
bott
om water
leve
l(f
eet)
(f
eet)
(f
eet)
measured
10M/28E-12F01
462210
1191508
495.00
196.
0 18
8.00
196.00
H 2/
25/1
986
4/16
/198
65/
14/1
986
6/18
/198
67/
17/1
986
7/17/1986
8/22
/198
68/
22/1
986
9/27
/198
610
/14/
1986
10/2
4/19
8611
/21/
1986
11/2
1/19
8612
/10/
1986
1/14
/198
71/
14/1
987
3/ 4
/198
75/ 8
/198
77/
1/1987
7/ 1/1987
10M/
28E-
12J0
1 46
2152
11
9143
5 495.00
179.
0 17
9.00
17
9.00
H
2/26
/198
64/
16/1
986
5/14
/198
66/
18/1
986
6/18
/198
67/
17/1
986
7/17/1986
8/22
/198
68/
22/1
986
9/27
/198
610
/24/
1986
10/2
4/19
86
Water
leve
l(f
eet)
138.
3313
8.20
140.
2013
8.00
114.
0011
2.60
138.
9013
8.80
136.
70133.46
133.26
134.
7013
5.10
137.
0093
.85
93.80
137.41
135.
2013
7.00
137.
1511
4.45
116.
2011
8.39
117.
1011
6.93
116.
4011
5.10
119.
2011
8.80
113.
1012
0.62
120.37
Stat
us - - - u p u u - u u u u u u u - u u u - - u u u u u u - u u
Total
nitrate-
Spec
ific
Meth
od
Samp
ling
pl
us-n
itri
te
cond
ucta
nce
date
as N
(mi Hi
- (m
icro
siem
ens
gram
s pe
r pe
r ce
ntim
eter
liter)
at 25 d
egrees C
)
S 09
/27/
1986
<
0.1
429
S 12
/10/
1986
<
0.1
s s s T s s s s s s s s s s s T s s s s s s s s s s s s s s
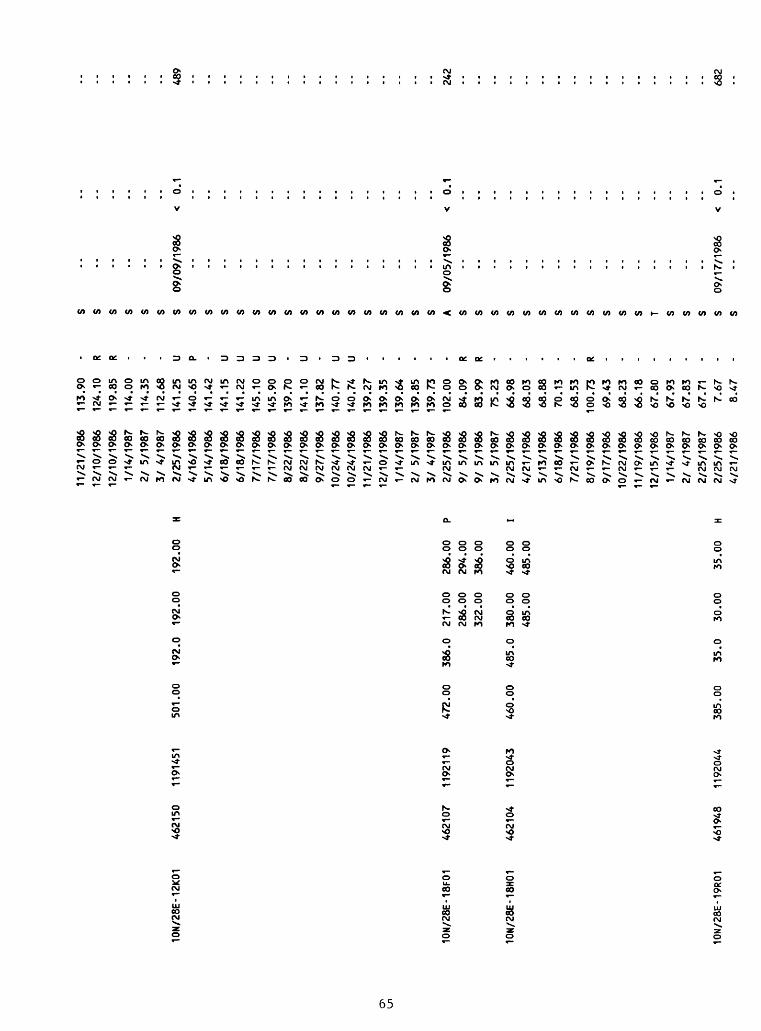
10N/
28E-
12K0
146
2150
11
9145
1
10N/
28E-
18F0
1
10N/
28E-
18H0
1
4621
07
1192
119
4621
04
1192
043
10N/
28E-
19R0
146
1948
11
9204
4
501.00
192.
0 192.00
192.00
H
472.00
386.0
217.00
286.00
P286.00
294.00
322.
00
386.00
460.00
485.0
380.
00
460.00
I485.00
485.00
385.00
35.0
30.00
35.00
H
11/21/1986
12/10/1986
12/1
0/19
861/
14/1
987
2/ 5/
1987
3/ 4
/198
72/25/1986
4/16
/198
65/14/1986
6/18/1986
6/18
/198
67/17/1986
7/17
/198
68/
22/1
986
8/22
/198
69/
27/1
986
10/24/1986
10/24/1986
11/21/1986
12/10/1986
1/14/1987
2/ 5
/198
73/
4/1
987
2/25
/198
69/
5/1986
9/ 5/1986
3/ 5/
1987
2/25/1986
4/21
/198
65/
13/1
986
6/18
/198
67/
21/1
986
8/19
/198
69/
17/1
986
10/22/1986
11/19/1986
12/15/1986
1/14
/198
721 4
/198
72/
25/1
987
2/25
/198
64/
21/1
986
113.
9012
4.10
119.
8511
4.00
114.
35112.68
141.
2514
0.65
141.42
141.
15141.22
145.
1014
5.90
139.
70141.10
137.82
140.77
140.74
139.27
139.
3513
9.64
139.85
139.
7310
2.00
84.09
83.99
75.2
366
.98
68.03
68.88
70.1
368.53
100.73
69.43
68.23
66.1
867.80
67.93
67.83
67.71
7.67
8.47
R R - - - U P U U U U - U - U U - - - - - - R R - - - - - - R - - - - - - - - -
S S S S S S S S S S S S S S S S S S S S S S S A S S S S S S S S S S S S T S S S S S
09/0
9/19
860.1
489
09/0
5/19
860.1
242
09/1
7/19
860.1
682
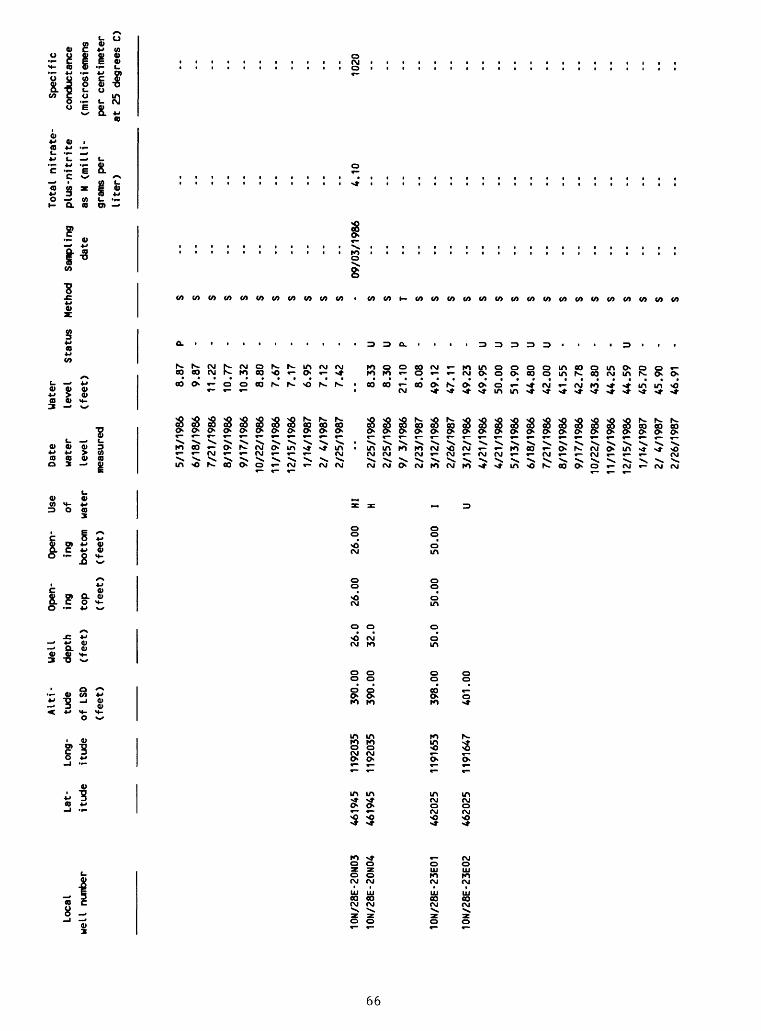
10N/28E-20N03
10N/28E-20N04
10N/
28E-
23E0
1
10N/28E-23E02
Alti-
Well
Open-
Open-
Use
Lat-
Long
- tu
de
dept
h ing
ing
ofit
ude
itude
of L
SD
(fee
t)
top
bott
om
wate
r(feet)
(fee
t)
(fee
t)
4619
45
1192035
390.
00
26.0
26
.00
26.0
0 HI
4619
45
1192035
390.
00
32.0
H
4620
25
1191653
398.
00
50.0
50.0
0 50
.00
I
4620
25
1191647
401.
00
U
Date
wate
rlevel
measured
5/13/1986
6/18
/198
67/
21/1
986
8/19
/198
6
9/17
/198
6
10/2
2/19
86
11/1
9/19
86
12/1
5/19
86
1/14
/198
7
2/ 4/
1987
2/25
/198
7--
2/25
/198
6
2/25
/198
6
9/ 3
/198
6
2/23
/198
7
3/12
/198
6
2/26/1987
3/12
/198
6
4/21
/198
6
4/21/1986
5/13
/198
6
6/18
/198
6
7/21
/198
6
8/19
/198
6
9/17
/198
6
10/2
2/19
86
11/1
9/19
86
12/1
5/19
86
1/14
/198
7
2/ 4
/198
7
2/26
/198
7
Wate
r
leve
l
(feet) 8.87
9.87
11.2
2
10.77
10.3
2
8.80
7.67
7.17
6.95
7.12
7.42
-- 8.33
8.30
21.1
0
8.08
49.1
2
47.1
1
49.2
3
49.9
5
50.0
0
51.90
44.8
0
42.0
0
41.5
5
42.7
8
43.8
0
44.2
5
44.5
9
45.7
0
45.9
0
46.91
Stat
us P - - - - - - - - - - - U U P - - - - U U U U U - - - - U - - -
09/0
3/19
864.
101020
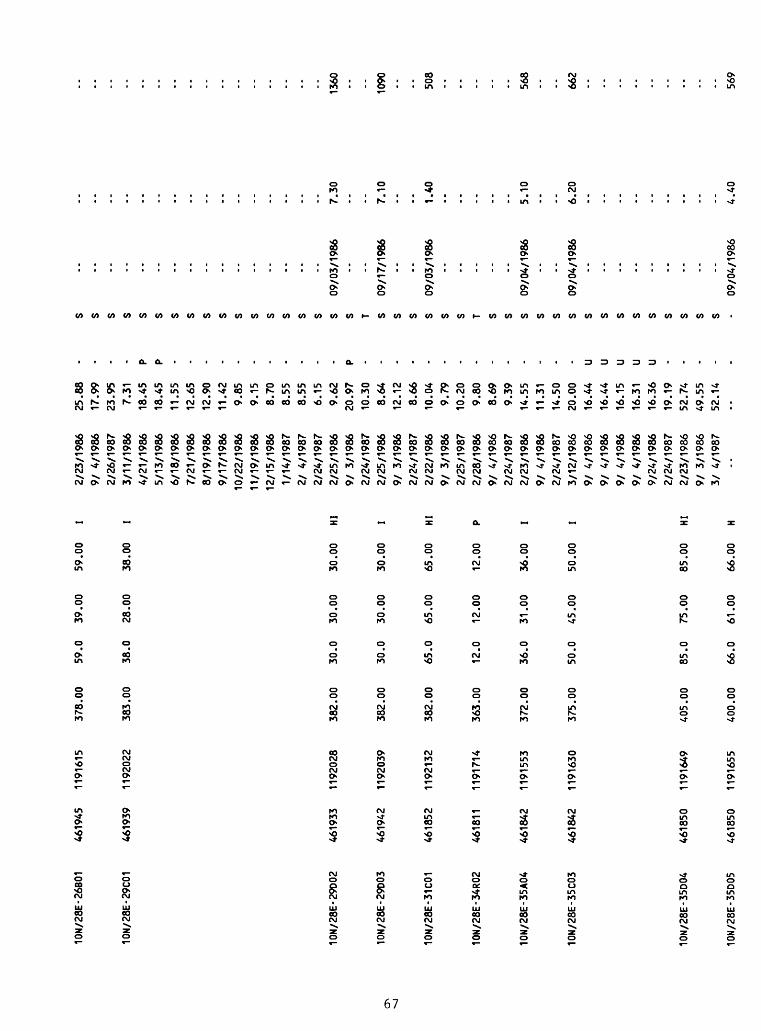
10N/
28E-
26B0
1
10N/
28E-
29C0
1
10N/
28E-
2900
2
10N/
28E-
29D0
3
10N/28E-31C01
10N/
28E-
34R0
2
10N/
28E-
35A0
4
10N/
28E-
35C0
3
10N/
28E-
35D0
4
10N/
28E-
35D0
5
461945
1191615
461939
1192022
461933
1192
028
461942
1192039
461852
1192132
4618
11
1191714
461842
1191
553
461842
1191
630
461850
1191649
461850
1191
655
378.00
59.0
39.00
59.0
0 I
383.00
38.0
28.00
38.0
0 I
382.00
30.0
30.00
30.0
0 HI
382.00
30.0
30.00
30.0
0 I
382.00
65.0
65.00
65.0
0 HI
363.00
12.0
12
.00
12.00
P
372.00
36.0
31.00
36.0
0 I
375.00
50.0
45.00
50.0
0 I
405.00
85.0
75.00
85.00
HI
400.00
66.0
61.00
66.00
H
2/23
/198
69/
4/1
986
2/26/1987
3/11/1986
4/21
/198
65/13/1986
6/18/1986
7/21
/198
68/19/1986
9/17/1986
10/22/1986
11/19/1986
12/15/1986
1/14/1987
2/ 4
/198
72/24/1987
2/25
/198
69/
3/1
986
2/24
/198
72/
25/1
986
9/ 3
/198
62/
24/1
987
2/22
/198
69/
3/1
986
2/25/1987
2/28/1986
9/ 4
/198
62/
24/1
987
2/23/1986
9/ 4
/198
62/
24/1
987
3/12
/198
69/ 4
/198
69/
4/1
986
9/ 4
/198
69/
4/1
986
9/24/1986
2/24/1987
2/23
/198
69/
3/1
986
3/ 4
/198
7
25.88
-17
.99
-23
.95
-7.31
18.45
P18
.45
P11
.55
12.6
512.90
-11.42
-9.
859.
15
-8.
70
-8.
55
-8.
55
-6.
15
-9.62
-20.97
P10.30
-8.64
-12.12
-8.66
-10
.04
-9.79
-10.20
-9.
80
-8.69
-9.39
-14
.55
11.3
1 -
14.50
-20
.00
-16
.44
U16
.44
U16.15
U16
.31
U16
.36
U19
.19
-52
.74
-49
.55
-52
.14
-
S S S S S S S S S S S S S S S S S S T S S S S S S T S S S S S S S S S S S S S S S
09/0
3/19
86
09/1
7/19
86
09/0
3/19
86
7.30
7.10
1.40
1360
1090 508
09/0
4/19
86
09/0
4/19
86
5.10
6.20
568
662
09/0
4/19
864.40
569
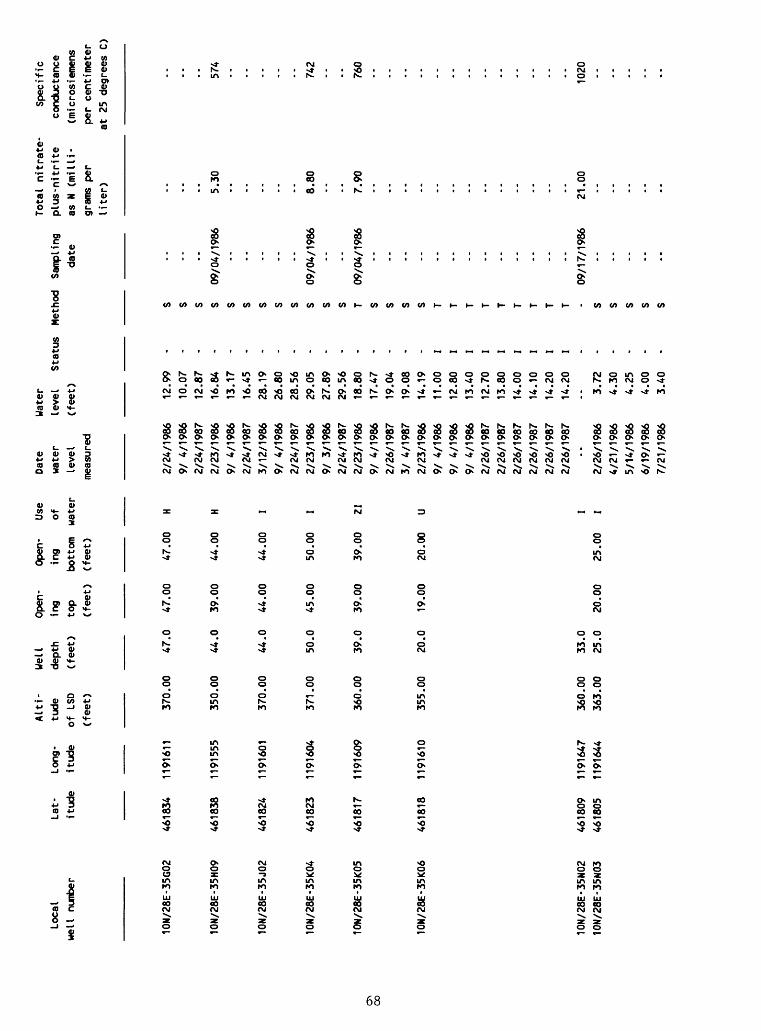
Local
well
nu
mber
CO
10N/28E-35G02
10N/28E-35H09
10N/28E-35J02
10N/28E-35K04
10N/28E-35K05
10N/28E-35K06
10N/28E-35N02
10N/28E-35N03
Alti-
Well
Open
- Op
en-
Use
Lat-
Long
- tu
de
dept
h ing
ing
of
itud
e it
ude
of LS
D (feet)
top
bott
om
wate
r
(feet)
(feet)
(feet)
4618
34
1191
611
370.
00
47.0
47.0
0 47.00
H
4618
38
1191555
350.
00
44.0
39.00
44.00
H
4618
24
1191
601
370.
00
44.0
44.0
0 44.00
I
4618
23
1191604
371.
00
50.0
45.0
0 50
.00
I
461817
1191609
360.
00
39.0
39.0
0 39.00
ZI
4618
18
1191610
355.
00
20.0
19.00
20.0
0 U
4618
09
1191647
360.
00
33.0
I
4618
05
1191644
363.
00
25.0
20.00
25.0
0 I
Date
wate
r
leve
l
measured
2/24/1986
9/ 4
/198
6
2/24
/198
7
2/23
/198
6
9/ 4
/198
6
2/24
/198
7
3/12
/198
6
9/ 4
/198
6
2/24
/198
7
2/23/1986
9/ 3
/198
6
2/24
/198
7
2/23
/198
6
9/ 4
/198
6
2/26
/198
7
3/ 4
/198
7
2/23/1986
9/ 4
/198
6
9/ 4
/198
6
9/ 4
/198
6
2/26
/198
7
2/26
/198
7
2/26
/198
7
2/26
/198
7
2/26
/198
7
2/26/1987
--
2/26
/198
6
4/21
/198
6
5/14
/198
6
6/19
/198
6
7/21
/198
6
Water
leve
l Si
(feet) 12.99
10.07
12.8
7
16.8
4
13.1
7
16.4
5
28.1
9
26.80
28.5
6
29.0
5
27.89
29.5
6
18.80
17.4
7
19.0
4
19.0
8
14.1
9
11.00
12.8
0
13.4
0
12.7
0
13.8
0
14.00
14.1
0
14.20
14.2
0-- 3.
72
4.30
4.25
4.00
3.40
tatus
- - - - - - - - - - - - - - - - I - - - - - -
date
Tota
l ni
t ra
te-
plus-nitrite
as N
(m
illi
grams
per
liter)
Specific
conductance
(mic
rosi
emen
spe
r centimeter
at 2
5 de
gree
s C)
09/04/1986
5.30
574
09/04/1986
09/04/1986
8.80
7.90
742
760
09/17/1986
21.0
01020
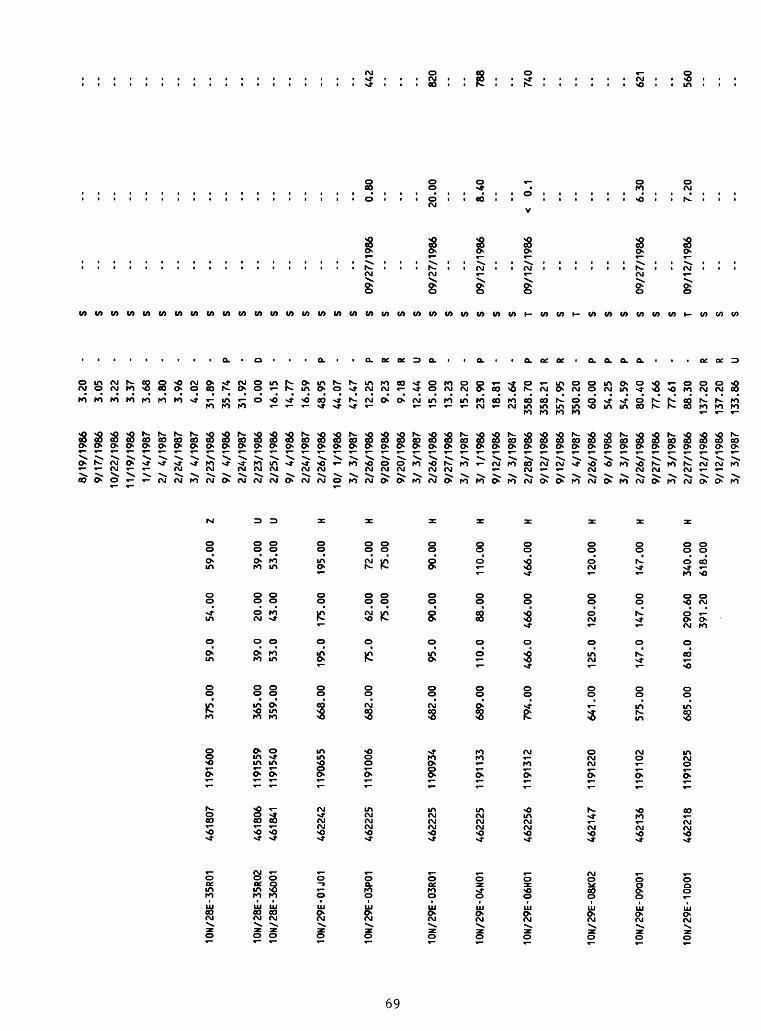
10N/28E-35R01
4618
07
1191600
375.00
59.0
54.00
59.00
Z
10N/
28E-
35R0
2 46
1806
1191559
365.
00
39.0
20.00
39.00
U 10N/28E-36D01
4618
41
1191540
359.
00
53.0
43.00
53.00
U
10N/29E-01J01
462242
1190
655
668.00
195.
0 175.00
195.
00
H
10N/29E-03P01
462225
1191006
682.
00
75.0
62.00
72.0
0 H
75.00
75.00
10N/29E-03R01
462225
1190934
682.
00
95.0
90.00
90.00
H
10N/29E-04N01
462225
1191133
689.
00
110.
0 88.00
110.
00
H
10N/
29E-
06H0
1 46
2256
1191312
794.00
466.
0 46
6.00
466.00
H
10N/
29E-
08K0
2 46
2147
1191220
641.
00
125.
0 120.00
120.
00
H
10N/
29E-
09Q0
1 46
2136
1191102
575.
00
147.
0 147.00
147.
00
H
10N/
29E-
1000
1 46
2218
11
9102
5 68
5.00
618.0
290.60
340.00
H39
1.20
618.00
8/19/1986
9/17/1986
10/22/1986
11/1
9/19
861/14/1987
21 4/
1987
2/24
/198
73/ 4/
1987
2/23
/198
69/ 4/
1986
2/24/1987
2/23
/198
62/
25/1
986
9/ 4/
1986
2/24
/198
72/
26/1
986
10/
1/1986
3/ 3/
1987
2/26
/198
69/
20/1
986
9/20
/198
63/ 3/
1987
2/26
/198
69/
27/1
986
3/ 3/
1987
3/ 1/1986
9/12
/198
63/ 3/
1987
2/28/1986
9/12
/198
69/
12/1
986
3/ 4/
1987
2/26/1986
9/ 6/
1986
3/ 3/
1987
2/26
/198
69/
27/1
986
3/ 3/
1987
2/27/1986
9/12
/198
69/
12/1
986
3/ 3/
1987
3.20
3.05
3.22
3.37
3.68
3.80
3.96
4.02
31.89
35.74
31.92
0.00
16.15
14.7
716
.59
48.9
544
.07
47.4
712.25
9.23
9.18
12.4
415
.00
13.2
315
.20
23.9
018.81
23.6
4358.70
358.
21357.95
350.20
60.00
54.2
554.59
80.40
77.66
77.6
188.30
137.
20137.20
133.86
- - - - - - - - - P - D - - - P - - P R R U P - - P - - P R R - P P P P - - - R R U
S s S s s s s s s s s s s s s s s s s s s s s s s s s s T s s T s s s s s s T s s s
09/2
7/19
86
09/2
7/19
86
09/1
2/19
86
09/1
2/19
86
0.80
20.0
0
8.40 0.1
442
820
788
740
09/2
7/19
86
09/1
2/19
86
6.30
7.20
621
560
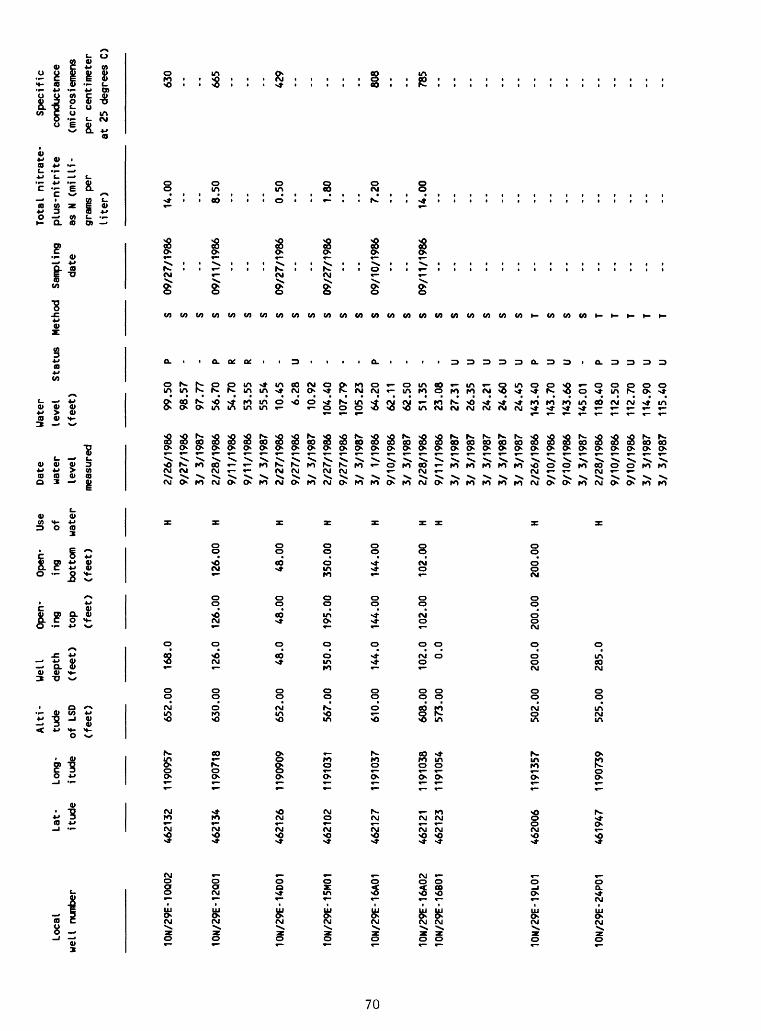
Local
well
nu
mber
10N/29E-10Q02
10N/29E-12Q01
10N/29E-14D01
10N/
29E-
15M0
1
10N
/29E
-16A
01
10N/29E-16A02
10N/29E-16B01
10N/
29E-
19L0
1
10N/29E-24P01
ALti-
Well
Open-
Open-
Use
Lat-
Long-
tude
depth
ing
ing
ofitude
itud
e of L
SD
(fee
t)
top
bott
om
wate
r(f
eet)
(feet)
(feet)
462132
1190
957
652.00
16
8.0
H
462134
1190
718
630.00
12
6.0
126.
00
126.
00
H
4621
26
1190
909
652.00
48
.0
48.00
48.00
H
4621
02
1191031
567.00
350.0
195.
00
350.
00
H
4621
27
1191
037
610.00
144.0
144.
00
144.
00
H
462121
1191
038
608.00
10
2.0
102.
00
102.
00
H46
2123
11
9105
4 573.00
0.
0 H
4620
06
1191
357
502.00
20
0.0
200.
00
200.
00
H
4619
47
1190
739
525.00
28
5.0
H
Date
water
leve
lmeasured
2/26
/198
69/
27/1
986
3/ 3
/198
72/
28/1
986
9/11
/198
69/
11/1
986
3/ 3
/198
72/
27/1
986
9/27
/198
63/
3/1
987
2/27
/198
69/
27/1
986
3/ 3
/198
73/ 1/
1986
9/10
/198
63/ 3
/198
72/
28/1
986
9/11
/198
63/ 3
/198
73/ 3
/198
73/
3/1
987
3/ 3
/198
73/
3/1
987
2/26
/198
69/
10/1
986
9/10
/198
63/ 3
/198
72/
28/1
986
9/10
/198
69/
10/1
986
3/ 3
/198
73/
3/1
987
Water
leve
l Status
(feet) 99.5
098
.57
97.7
756
.70
54.70
53.5
555
.54
10.4
56.
2810
.92
104.
4010
7.79
105.
2364.20
62.11
62.50
51.3
523.08
27.3
126
.35
24.2
124
.60
24.4
514
3.40
143.70
143.
66145.01
118.
4011
2.50
112.70
114.90
115.40
P - - P R R - - U - - - - P - - - - U U U U U P U U - P U U U U
Method
Sampling
date
S 09/27/1986
S S S 09/11/1986
S S S S 09/27/1986
S S S 09
/27/
1986
S S S 09/10/1986
S S S 09/11/1986
S S S S S S T S S S T T T T T
Total
nitr
ate-
plus-nitrite
as N
(m
illi
grams
per
liter) 14.0
0-- -- 8.50
-- -- -- 0.50
-- -- 1.80
-- -- 7.20
-- -- 14.0
0-- -- -- -- -- -- -- -- -- -- -- -- -- -- --
Spec
ific
conductance
(mic
rosi
emen
spe
r centimeter
at 25
deg
rees
C)
630
-- -- 665
-- -- -- 429
-- -- -- -- -- 808
-- -- 785
-- -- -- -- -- -- -- -- -- -- -- -- -- -- --
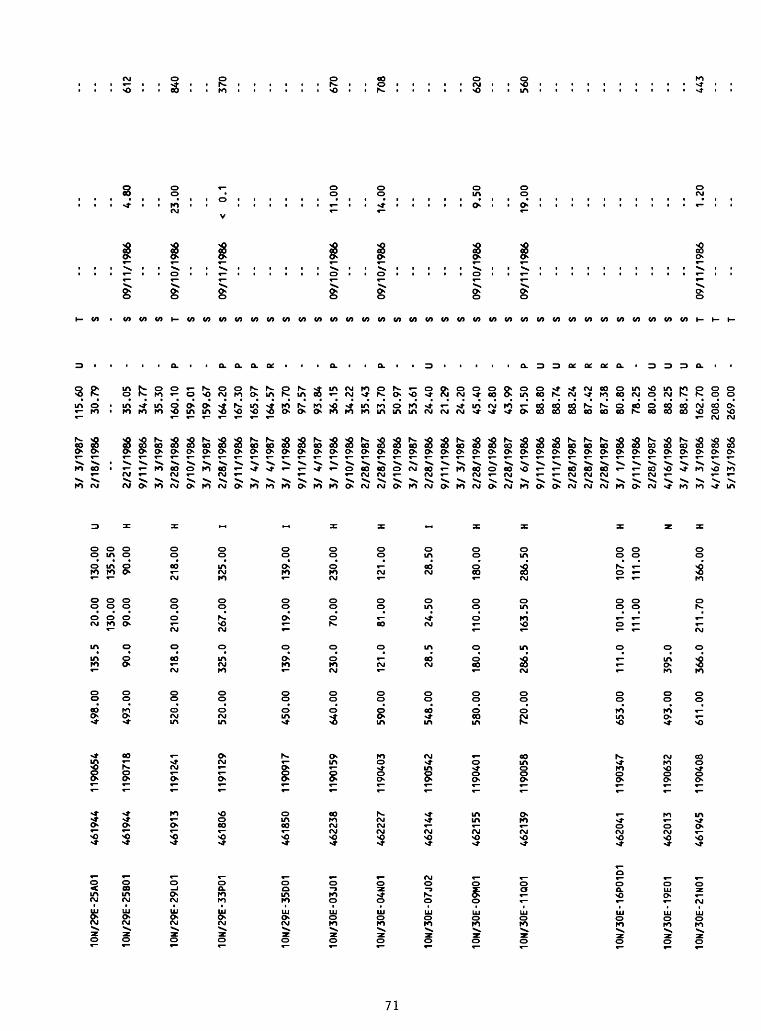
10N/
29E-
25A0
1 46
1944
11
9065
4 498.00
135.
5 20.00
130.
00
U13
0.00
13
5.50
10N/
29E-
25B0
1 461944
1190
718
493.00
90.0
90.00
90.00
H
10N/29E-29L01
4619
13
1191
241
520.00
218.0
210.00
218.00
H
10N/
29E-
33P0
1 46
1806
11
9112
9 520.00
325.0
267.00
325.00
I
10N/29E-35D01
461850
1190917
450.00
139.
0 11
9.00
13
9.00
I
10N/30E-03J01
4622
38
1190
159
640.00
230.0
70.00
230.00
H
10N/30E-04N01
4622
27
1190
403
590.00
121.
0 81.00
121.
00
H
10N/
30E-
07J0
2 46
2144
11
9054
2 548.00
28.5
24.50
28.5
0 I
10N/
30E-
09M0
1 46
2155
11
9040
1 580.00
180.
0 11
0.00
18
0.00
H
10N/30E-11Q01
4621
39
1190
058
720.00
286.5
163.
50
286.50
H
10N/30E-16P01D1
4620
41
1190347
10N/30E-19E01
462013
1190
632
10N/30E-21N01
461945
1190
408
653.00
111.
0 10
1.00
10
7.00
H
111.
00
111.
00
493.00
395.0
N
611.00
366.0
211.70
366.00
H
3/ 3
/198
72/18/1986
2/21
/198
69/11/1986
3/ 3
/198
72/
28/1
986
9/10
/198
63/
3/1
987
2/28/1986
9/11
/198
63/
4/1
987
3/ 4
/198
73/
1/1986
9/11
/198
63/
4/1
987
3/ 1/1986
9/10
/198
62/28/1987
2/28/1986
9/10
/198
63/
2/
1987
2/28
/198
69/
11/1
986
3/ 3
/198
72/28/1986
9/10
/198
62/28/1987
3/ 6
/198
69/
11/1
986
9/11
/198
62/
28/1
987
2/28/1987
2/28/1987
3/ 1/1986
9/11
/198
62/28/1987
4/16/1986
3/ 4/
1987
3/ 3
/198
64/
16/1
986
5/13
/198
6
115.
6030.79
35.0
534.77
35.3
016
0.10
159.01
159.
6716
4.20
167.
30165.97
164.57
93.70
97.5
793.84
36.1
534.22
35.43
53.7
050.97
53.6
124
.40
21.29
24.2
045
.40
42.8
043.99
91.5
088
.80
88.74
88.24
87.42
87.38
80.80
78.2
580.06
88.2
588.73
162.
70208.00
269.00
U . - - P - - P P P R - P - - P - - U - - - - - P U U R R R P - U U U P - -
T s s s s T S s s s s s s s s s s s s s s s s s s s s s s s s s s s s s s s T T T
09/1
1/19
86
09/10/1986
09/11/1986
4.80
23.0
0
0.1
612
840
370
09/10/1986
09/1
0/19
86
11.0
0
14.0
0
670
708
09/10/1986
09/11/1986
9.50
19.0
0
620
560
09/1
1/19
861.
20443
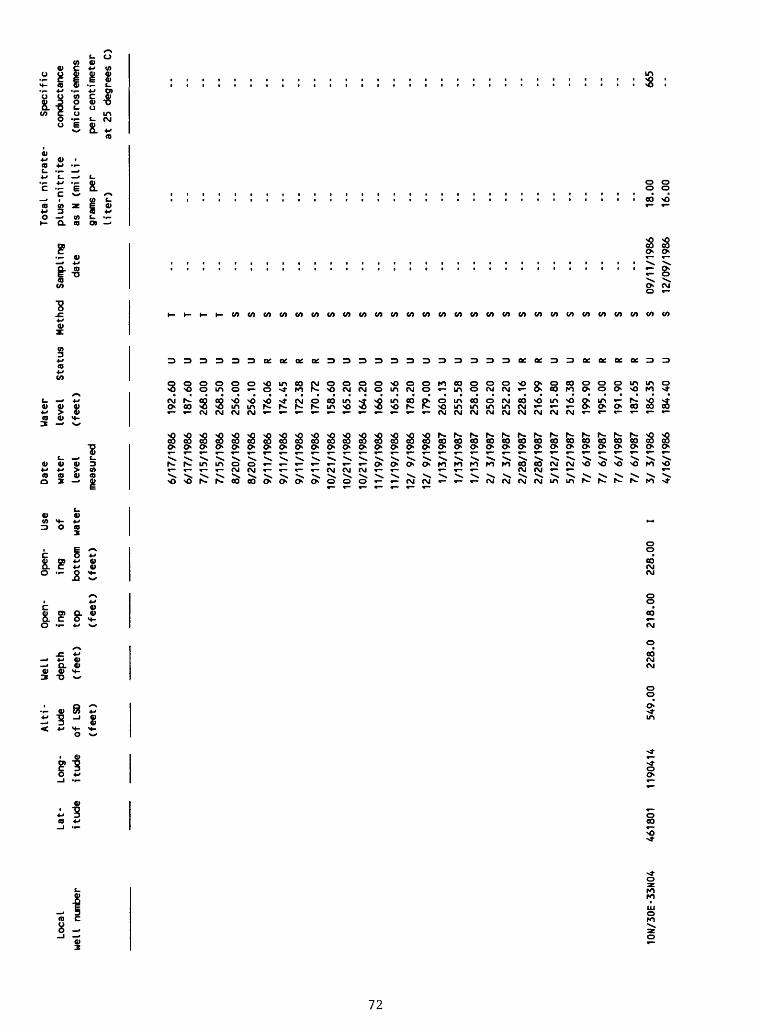
10N
/30E
-33N
04
Alti-
Well
Op
en-
Open-
Use
Date
Lat-
Lo
ng-
tude
depth
ing
ing
of
wate
rit
ude
itud
e of
LSD
(fee
t)
top
bott
om
wate
r le
vel
(feet)
(fee
t)
(fee
t)
measured
6/17/1986
6/17
/198
67/15/1986
7/15/1986
8/20/1986
8/20/1986
9/11
/198
69/11/1986
9/11/1986
9/11/1986
10/21/1986
10/21/1986
10/21/1986
11/19/1986
11/19/1986
12/ 9/
1986
12/ 9/
1986
1/13/1987
1/13/1987
1/13/1987
2/ 3
/198
72/ 3
/198
72/
28/1
987
2/28
/198
75/12/1987
5/12/1987
7/ 6
/198
771 6
/198
711 6
/198
77/ 6
/198
7.1
801
1190
414
549.00
228.
0 218.00
228.00
I 3/
3/1
986
4/16
/198
6
Water
level
Status
(fee
t)
192.
60187.60
268.00
268.50
256.00
256.10
176.06
174.
45172.38
170.
7215
8.60
165.20
164.20
166.
00165.56
178.20
179.
00260.13
255.58
258.00
250.20
252.20
228.16
216.99
215.80
216.38
199.
9019
5.00
191.
9018
7.65
186.
3518
4.40
U U U U U U R R R R U U U U U U U U U U U U R R U U R R R R U U
09
/11
/19
86
12
/09
/19
86
18.0
0
16
.00
665
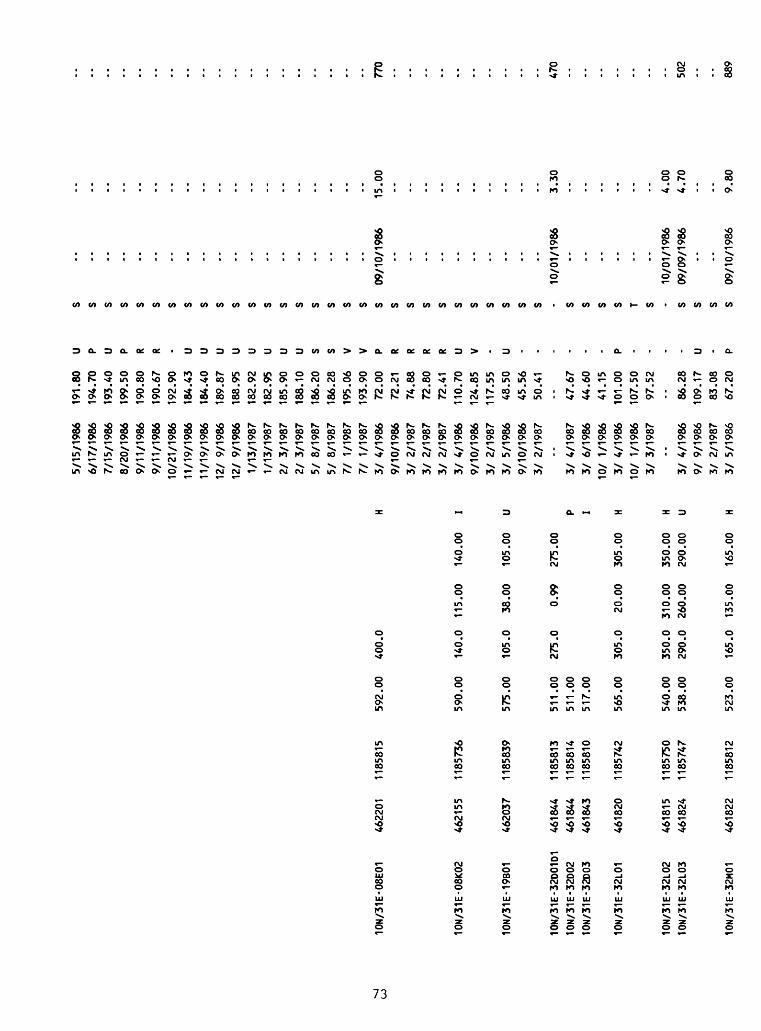
10N/31E-08E01
4622
01
1185
815
592.
00
400.0
10N/
31E-
08K0
2 462155
1185
736
590.
00
140.
0 11
5.00
14
0.00
I
10N/
31E-
19B0
1 46
2037
1185839
575.
00
105.
0 38.00
105.
00
U
10N/31E-32D01D
1 461844
1185
813
10N/
31E-
32D0
2 461844
1185814
10N/
31E-
32D0
3 46
1843
1185810
10N/31E-32L01
4618
20
1185
742
511.
00
275.0
0.99
275.00
511.
00
P51
7.00
I
565.
00
305.0
20.00
305.00
H
10N/
31E-
32L0
2 461815
1185750
540.
00
350.
0 31
0.00
350.00
H 10
N/31
E-32
L03
461824
1185747
538.
00
290.0
260.00
290.00
U
10N/
31E-
32M0
1 461822
1185
812
523.00
165.
0 13
5.00
16
5.00
H
5/15
/198
66/17/1986
7/15/1986
8/20
/198
69/
11/1
986
9/11
/198
610/21/1986
11/1
9/19
8611
/19/
1986
12/
9/1986
12/ 9/
1986
1/13/1987
1/13/1987
21 3
/198
721 3
/198
75/
8/1
987
5/ 8
/198
711
1/1987
7/ 1/1987
3/ 4
/198
69/10/1986
3/ 2
/1987
3/ 2
/1987
3/ 2/1987
3/ 4
/198
69/10/1986
3/ 2/1987
3/ 5
/198
69/
10/1
986
3/ 2/1987
--
3/ 4
/198
73/
6/1986
10/
1/1986
3/ 4
/198
610/
1/1986
3/ 3
/198
7 -
3/ 4
/198
69/
9/1
986
3/ 2/
1987
3/ 5
/1986
191.80
194.
7019
3.40
199.
5019
0.80
190.67
192.
9018
4.43
184.
40189.87
188.
9518
2.92
182.
9518
5.90
188.
1018
6.20
186.
28195.06
193.
9072.00
72.2
174
.88
72.80
72.41
110.
7012
4.85
117.
5548
.50
45.5
650
.41
-- 47.67
44.60
41.1
510
1.00
107.
5097.52
-- 86.28
109.17
83.08
67.20
U P U P R R - U U U U U U U U s s V V P R R R R U V - U - - - - - - P - - - - U - P
s s s s s s s s s s s s s s s s s s s S 09/10/1986
S s s s s s s s s s10
/01/
1986
S s s s T S - 10/01/1986
S 09
/09/
1986
S S S 09
/10/
1986
-- -- - -- -- -- -- -- -- -- -- -- -- -- -- - -- -- -- 15.0
0-- - -- -- - -- -- - -- -- 3.30
-- -- - -- -- -- 4.00
4.70
-- -- 9.80
770
470
502
889
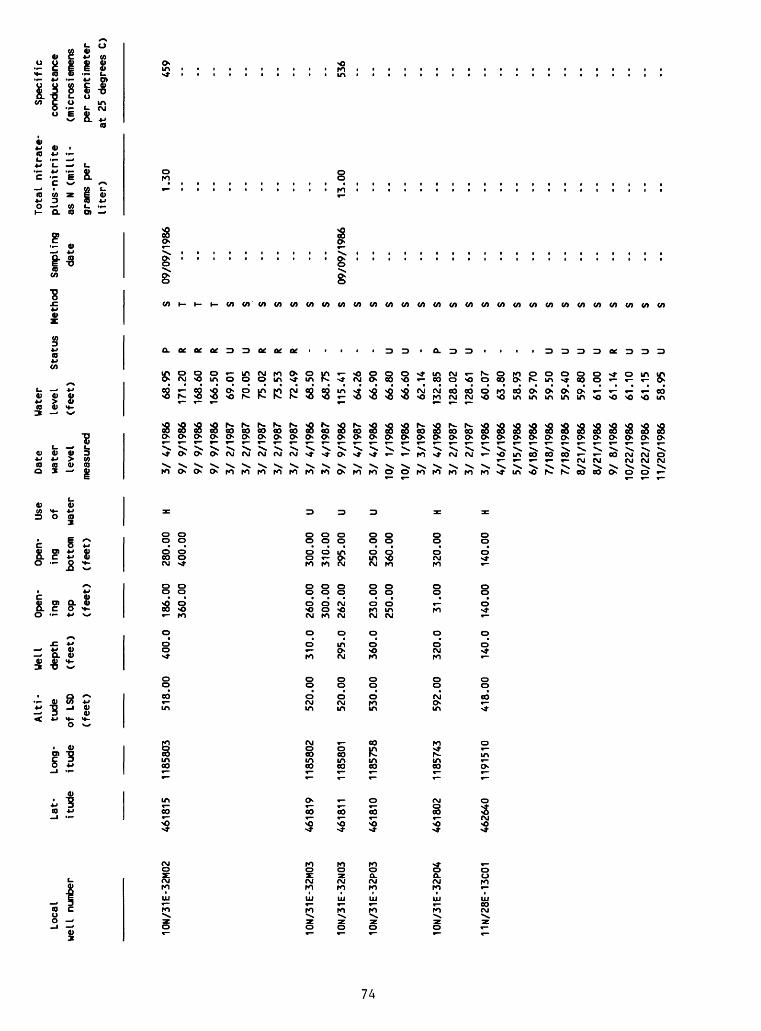
Loca
l we
ll number
10N/
31E-
32M0
2
10N/
31E-
32M0
3
10N/
31E-
32N0
3
10N/
31E-
32P0
3
10N/
31E-
32P0
4
11N/28E-13C01
Alti
- We
ll
Open
- Open-
Use
Lat-
Long-
tude
depth
ing
ing
ofit
ude
itud
e of LSD
(fee
t)
top
bott
om
wate
r(f
eet)
(f
eet)
(f
eet)
461815
1185803
518.00
400.0
186.00
280.00
H36
0.00
40
0.00
4618
19
1185802
520.00
310.0
260.
00
300.00
U30
0.00
31
0.00
4618
11
1185
801
520.00
295.0
262.00
295.00
U
461810
1185758
530.00
360.
0 23
0.00
250.00
U25
0.00
36
0.00
4618
02
1185743
592.00
320.0
31.00
320.00
H
4626
40
1191
510
418.
00
140.
0 140.00
140.00
H
Date
water
leve
lme
asur
ed
3/ 4
/198
69/ 9
/198
69/ 9
/198
69/
9/1
986
3/ 2/
1987
3/ 2/
1987
3/ 2/
1987
3/ 2/
1987
3/ 2/
1987
3/ 4
/198
63/
4/1987
9/ 9
/198
63/ 4
/198
73/ 4
/198
610/
1/1986
10/
1/1986
3/ 3
/198
73/
4/1
986
3/ 2/
1987
3/ 2/
1987
3/ 1/1986
4/16
/198
65/
15/1
986
6/18
/198
67/
18/1
986
7/18
/198
68/
21/1
986
8/21
/198
69/
8/1
986
10/22/1986
10/2
2/19
8611/20/1986
Water
level
(fee
t) 68.95
171.20
168.60
166.50
69.01
70.0
575.02
73.53
72.49
68.50
68.75
115.41
64.2
666
.90
66.80
66.60
62.14
132.
8512
8.02
128.61
60.0
763.80
58.93
59.70
59.50
59.4
059.80
61.0
061.14
61.1
061.15
58.95
Status P R R R U U R R R - - - - - U U - P U U - - - - U U U U R U U U
Tota
l ni
trat
e-
Spec
ific
date
09/09/1986
plus-nitrite
as N
(milli
grams
per
liter) 1.
30
cond
ucta
nce
(microsiemens
per
centimeter
at 25 de
gree
s C)
459
09/09/1986
13.00
536
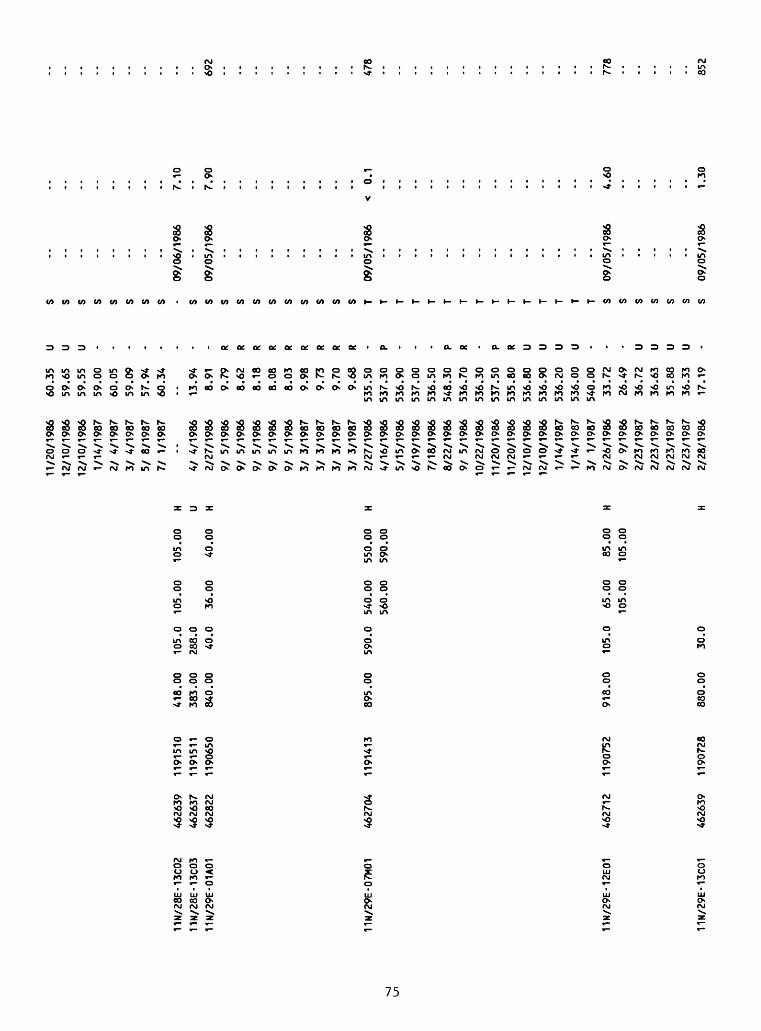
11N/
28E-
13C0
211
N/28
E-13
C03
11N/29E-01A01
11N/
29E-
07M0
1
11N/
29E-
12E0
1
11N/29E-13C01
11/20/1986
12/10/1986
12/10/1986
1/14/1987
2/ 4
/198
73/
4/1
987
5/ 8
/198
77/ 1/1987
462639
1191510
418.
00
105.
0 105.00
105.
00
H462637
1191
511
383.
00
288.
0 U
4/ 4
/1986
462822
1190650
840.
00
40.0
36.00
40.00
H 2/
27/1
986
9/ 5
/1986
9/ 5
/198
69/ 5
/1986
9/ 5/1986
9/ 5
/198
63/ 3
/198
73/
3/1
987
3/ 3
/198
73/
3/1
987
462704
1191
413
895.
00
590.
0 540.00
550.00
H 2/
27/1
986
560.
00
590.00
4/16/1986
5/15/1986
6/19/1986
7/18/1986
8/22/1986
9/ 5
/1986
10/2
2/19
8611/20/1986
11/2
0/19
8612/10/1986
12/1
0/19
861/14/1987
1/14/1987
3/ 1/1987
462712
1190752
918.00
105.
0 65.00
85.00
H 2/26/1986
105.00
105.
00
9/ 9
/1986
2/23
/198
72/23/1987
2/23
/198
72/
23/1
987
462639
1190728
880.
00
30.0
H 2/28/1986
60.35
59.65
59.55
59.00
60.05
59.09
57.94
60.34
13.9
48.
919.
798.62
8.18
8.08
8.03
9.98
9.73
9.70
9.68
535.50
537.
3053
6.90
537.
00536.50
548.30
536.70
536.30
537.
50535.80
536.
8053
6.90
536.20
536.00
540.00
33.72
26.49
36.7
236.63
35.88
36.33
17.1
9
U U U - - - - - - - - R R R R R R R R R - P - - - P R - P R U U U U - - - U U U U -
s s s s s s s s - s s s s s s s s s s s T T T T T T T T T T T T T T T S S S S S S SS S S S S S S S - S s s s s s s s s s s T T T T T T T T T T T T T T T S S S S S S S
- -- -- -- -- -- --
09/0
6/19
86--
09/0
5/19
86-- -- -- - - -- -- -- --
09/0
5/19
86-- -- - -- -- -- -- -- -- -- -- -- -
09/05/1986
-- -- -- --
09/0
5/19
86
7.1
0
7.9
069
2
0.1
478
4.6
077
8
1.30
852
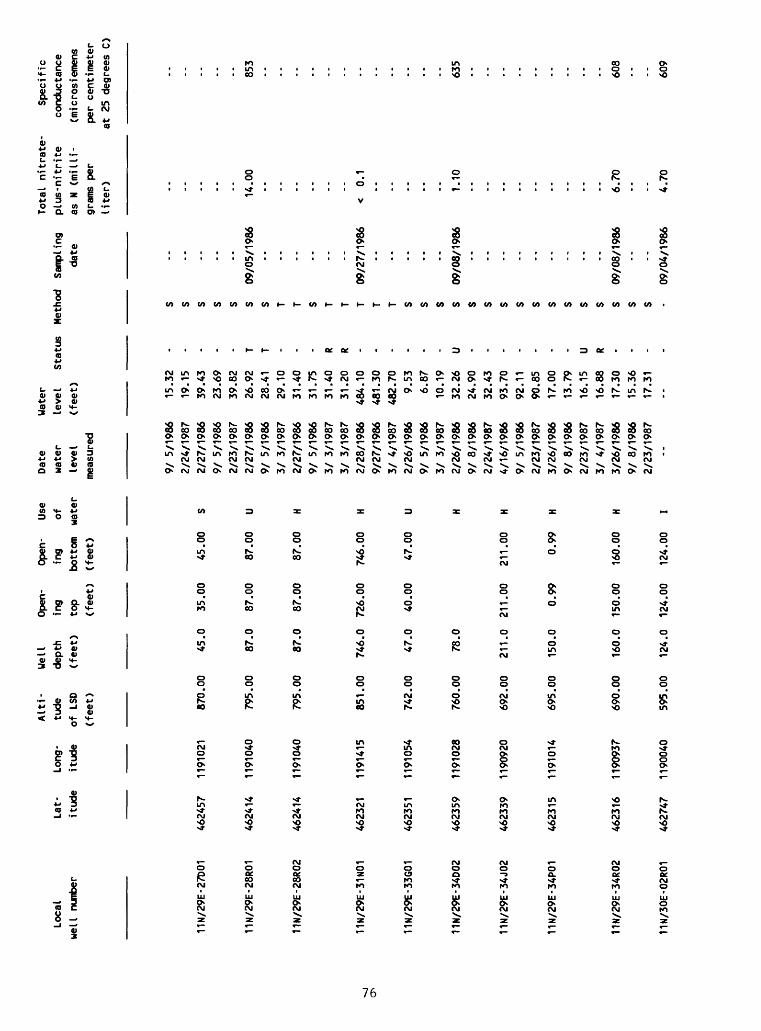
Loca
l we
ll nu
mber
11N
/29E
-27D
01
11N/29E-28R01
11N/
29E-
28R0
2
11N/29E-31N01
11N/29E-33G01
11N/
29E-
34D0
2
11N/
29E-
34J0
2
11N/
29E-
34P0
1
11N/
29E-
34R0
2
11N/
30E-
02R0
1
Alti
- We
ll
Open-
Open-
Use
Lat-
Long
- tude
dept
h ing
ing
ofitude
itude
of LS
D (feet)
top
bott
om
wate
r(f
eet)
(feet)
(feet)
4624
57
1191
021
870.
00
45.0
35
.00
45.0
0 S
462414
1191
040
795.
00
87.0
87
.00
87.0
0 U
462414
1191
040
795.
00
87.0
87.00
87.00
H
4623
21
1191415
851.
00
746.0
726.
00
746.
00
H
4623
51
1191054
742.
00
47.0
40.00
47.0
0 U
4623
59
1191
028
760.00
78
.0
H
4623
39
1190
920
692.
00
211.0
211.
00
211.
00
H
462315
1191
014
695.
00
150.
0 0.
99
0.99
H
4623
16
1190
937
690.00
160.0
150.
00
160.
00
H
Date
water
leve
lme
asur
ed
9/ 5
/198
62/
24/1
987
2/27
/198
69/
5/1
986
2/23
/198
72/
27/1
986
9/ 5
/198
63/
3/1
987
2/27
/198
69/ 5
/198
63/
3/1
987
3/ 3
/198
72/
28/1
986
9/27
/198
63/ 4
/198
72/
26/1
986
9/ 5
/198
63/ 3
/198
72/
26/1
986
9/ 8
/198
62/
24/1
987
4/16
/198
69/
5/1
986
2/23
/198
73/
26/1
986
9/ 8
/198
62/
23/1
987
3/ 4
/198
73/
26/1
986
9/ 8
/198
62/
23/1
987
Wate
rle
vel
(feet) 15.3
219
.15
39.43
23.69
39.8
226
.92
28.4
129
.10
31.40
31.7
531.40
31.2
048
4.10
481.
3048
2.70
9.53
6.87
10.1
932
.26
24.9
032
.43
93.70
92.11
90.85
17.0
013
.79
16.1
516
.88
17.3
015
.36
17.3
1
Stat
us - - - - T T - - - R R - - - - - - U - - - - - - - U R - - -
Method Sa
mpli
ng
date
Tota
l ni
trat
e-
plus-nitrite
as N
(milli
grams
per
lite
r)
Specific
cond
ucta
nce
(mic
rosi
emen
spe
r centimeter
at 2
5 de
gree
s C)
09/05/1986
14.0
085
3
09/27/1986
0.1
09/0
8/19
861.
1063
5
4627
47
1190
040
595.00
12
4.0
124.
00
124.00
I
09/0
8/19
86
09/0
4/19
86
6.70
4.70
608
609

11N/
30E-
02R0
2 46
2747
11
9004
1
11N/
30E-
03G0
1 462814
1190212
11N/
30E-
03L0
1 462754
1190233
11N/
30E-
05B0
1 462830
1190
438
11N/
30E
05N0
1 46
2737
1190524
11N/
30E-
05N0
2 46
2737
1190524
11N/
30E-
08C0
1 462734
1190
454
11N/30E-10B01
462734
1190208
11N/30E-11A01
4627
27
1190
029
11N/
30E-
14K0
1 46
2615
11
9005
4
594.
00
114.
0 104.00
114.
00
I
798.00
113.
0 4.00
113.00
U
765.00
105.
0 45
.00
105.
00
H
753.
00
109.
0 29.00
109.
00
H
708.00
57.0
57.00
57.00
U
708.
00
79.5
54.50
79.50
HI70
8.00
52.0
23.70
52.00
N
765.
00
115.
0 20.00
115.
00
HS
665.
00
290.0
20.00
290.00
HI
575.
00
265.
0 22
5.00
26
5.00
H
2/28
/198
69/
4/1
986
2/25/1987
2/27
/198
69/
4/1
986
2/27/1986
4/17
/198
65/
14/1
986
6/17
/198
67/
16/1
986
8/20
/198
68/
20/1
986
9/ 4
/198
610/21/1986
11/19/1986
12/ 9/
1986
1/13/1987
2/ 3
/198
72/
25/1
987
4/17
/198
69/
6/1
986
2/27/1987
2/27/1987
2/27/1987
2/27/1987
2/27
/198
72/27/1987
2/26
/198
69/
4/1
986
2/25/1987
2/26/1986
3/26
/198
72/
27/1
986
9/ 6
/198
69/
6/1
986
2/24/1987
2/28
/198
69/
4/1
986
2/25
/198
73/
1/1986
9/ 4
/198
6
84.22
84.8
086
.36
73.66
50.8
745.50
46.40
40.3
036.60
36.40
36.10
35.50
35.30
37.60
40.0
041.60
43.30
44.40
45.30
34.10
32.27
36.82
36.55
36.13
34.94
34.85
34.5
810
.76
9.29
10.8
8
8.45
9.70
56.02
40.9
840.90
55.09
161.
30166.08
163.59
76.20
78.6
7
Z Z T - U - P - U P P R R P P P P P - P - R R R R R R - - - - - U U - - - - U
s s s s s T T T T T T T T T S T T T T T S S S S S S S S S S S s s s s s s s s s s
09/04/1986
7.60
723
09/0
4/19
86
09/06/1986
09/0
4/19
86
09/0
5/19
86
50.00
5.40
8.60
8.30
1420 582
833
800
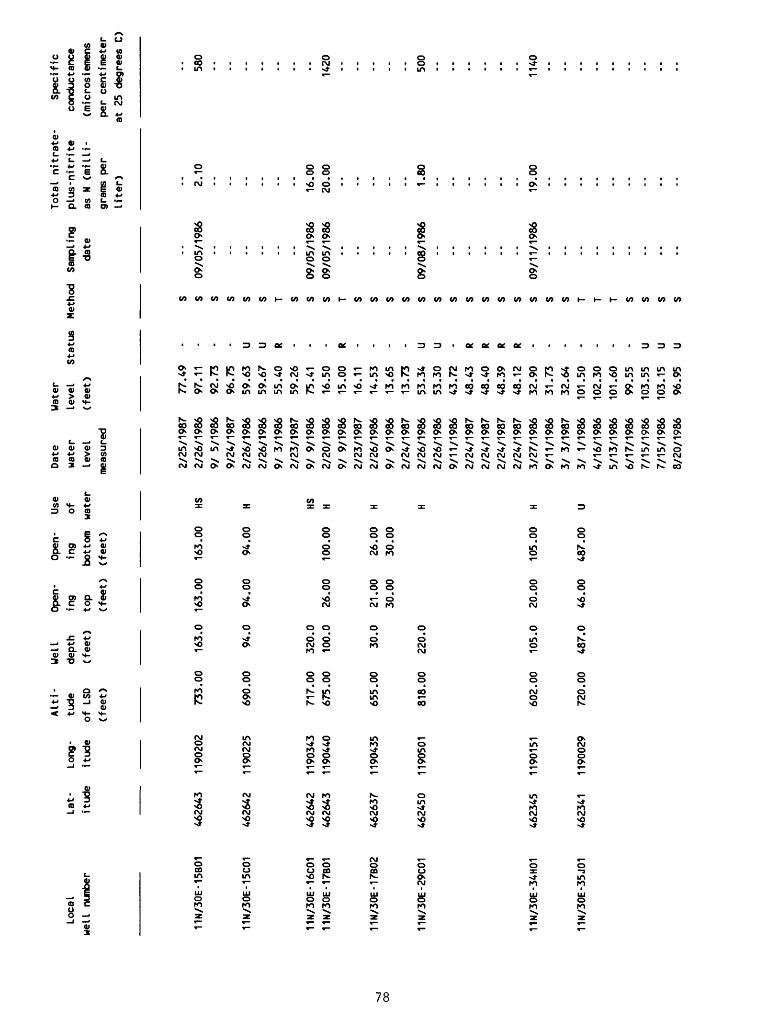
Local
well
number
00
11N/30E-15B01
11N/30E-15C01
11N/30E-16C01
11N/
30E-
17B0
1
11N/30E-17B02
11N/30E-29C01
11N/30E-34H01
11N/
30E-
35J0
1
Alti
- We
ll
Open
- Op
en-
Use
Lat-
Long
- tude
depth
ing
ing
ofitude
itud
e of
LS
D (f
eet)
top
bott
om
wate
r(f
eet)
(f
eet)
(f
eet)
4626
43
1190
202
733.00
163.
0 16
3.00
163.00
HS
4626
42
1190225
690.
00
94.0
94.00
94.00
H
4626
42
1190
343
717.00
320.0
HS46
2643
11
9044
0 67
5.00
10
0.0
26.00
100.00
H
4626
37
1190435
655.
00
30.0
21.00
26.00
H30.00
30.00
4624
50
1190
501
818.
00
220.0
H
462345
1190
151
602.
00
105.
0 20.00
105.00
H
462341
1190029
720.00
487.0
46.00
487.
00
U
Date
wate
rlevel
meas
ured
2/25
/198
72/26/1986
9/ 5/
1986
9/24
/198
72/26/1986
2/26/1986
9/ 3
/198
62/23/1987
9/ 9/
1986
2/20
/198
69/ 9/
1986
2/23
/198
72/26/1986
9/ 9
/198
62/
24/1
987
2/26/1986
2/26/1986
9/11/1986
2/24
/198
72/
24/1
987
2/24/1987
2/24
/198
73/27/1986
9/11/1986
3/ 3
/198
73/
1/1986
4/16/1986
5/13
/198
66/17/1986
7/15/1986
7/15/1986
8/20/1986
Water
leve
l(f
eet) 77.49
97.1
192.73
96.75
59.63
59.67
55.40
59.26
75.41
16.5
015
.00
16.11
14.5
313.65
13.7
353.34
53.30
43.7
248.43
48.40
48.3
948.12
32.90
31.73
32.6
410
1.50
102.30
101.
6099.55
103.
5510
3.15
96.95
Status - - - U U R - - - R - - - - U U - R R R R - - - - - - - U U U
Meth
od
Sampling
date
S S 09
/05/
1986
S S S S T S S 09
/05/
1986
S 09
/05/
1986
T S S S S S 09
/08/
1986
S S S S S S S 09
/11/
1986
S S T T T S S S S
Total
nitr
ate-
Specific
plus
-nit
rite
co
nduc
tanc
eas N
(mi Hi
- (m
icro
siem
ens
grams
per
per
cent
imet
erliter)
at 25 degrees
C)
2.10
580
- -- -- -- -- .. 16.0
020
.00
1420
.. .. .. -- .. 1 .80
500
.. .. .. -- .. .. 19.00
1140
.. .. -- .. .. .. -- -- ..
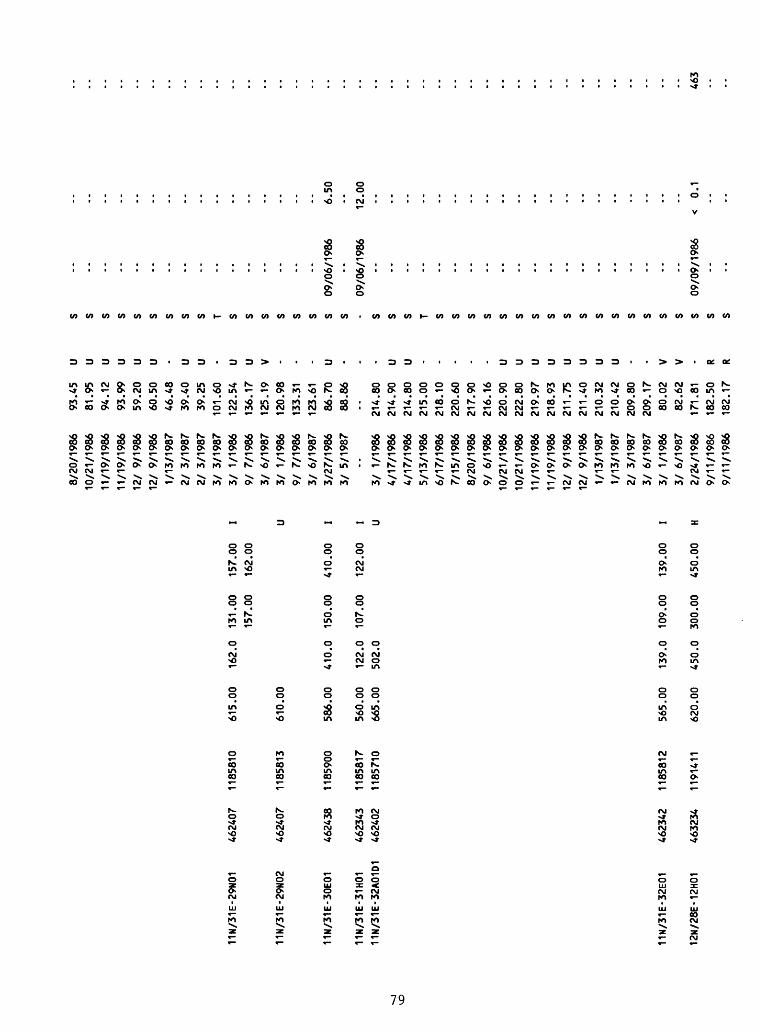
11N/31E-29N01
462407
1185810
615.
00
162.
0 13
1.00
15
7.00
I
157.
00
162.
00
11N/
31E-
29N0
2 46
2407
1185813
610.
00
U
11N/31E-30E01
462438
1185
900
586.00
410.0
150.
00
410.00
I
11N/
31E-
31H0
1 462343
1185817
560.00
122.
0 10
7.00
122.00
I11
N/31
E-32
A01D
1 462402
1185710
665.
00
502.0
U
11N/31E-32E01
462342
1185812
565.00
139.
0 10
9.00
139.00
I
12N/28E-12H01
463234
1191
411
620.
00
450.
0 300.00
450.
00
H
8/20/1986
10/21/1986
11/19/1986
11/19/1986
12/
9/19
8612/ 9/
1986
1/13/1987
2/ 3
/198
72/
3/1
987
3/ 3
/198
73/
1/1986
9/ 7
/198
63/
6/1
987
3/ 1/1986
9/ 7
/198
63/
6/1
987
3/27
/198
63/
5/
1987
--
3/ 1/1986
4/17/1986
4/17/1986
5/13
/198
66/
17/1
986
7/15/1986
8/20
/198
69/
6/1
986
10/21/1986
10/21/1986
11/19/1986
11/19/1986
12/
9/19
8612/ 9/
1986
1/13/1987
1/13/1987
2/ 3
/198
73/
6/1
987
3/ 1/1986
3/ 6
/198
72/24/1986
9/11/1986
9/11
/198
6
93.45
81.95
94.12
93.9
959.20
60.50
46.48
39.40
39.25
101.
6012
2.54
136.17
125.
19120.98
133.31
123.61
86.70
88.86
--
214.80
214.90
214.80
215.00
218.10
220.60
217.90
216.16
220.90
222.80
219.
97218.93
211.75
211.40
210.32
210.42
209.80
209.
1780.02
82.62
171.81
182.
50182.17
U U U U U U - U U - U U V - - - U - - - U U - - - - - U U U U U U U U - - V V - R R
s s s s s s s s s T S s s s s s s s - s s s T s s s s s s s s s s s s s s s s s s s
09/0
6/19
86
09/0
6/19
86
6.50
12.0
0
09/09/1986
0.1
463
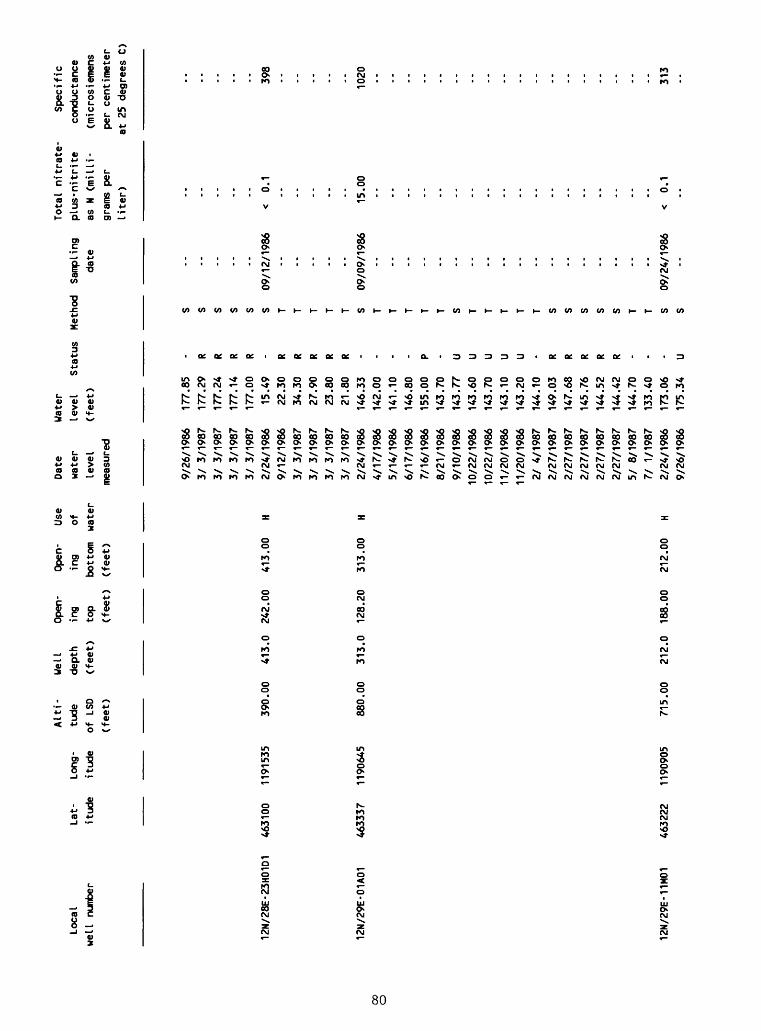
12N
/29E
-01A
0100 o
12N
/29E
-11M
01
Alti
- We
ll
Open
- Open-
Use
Lat-
Lo
ng-
tude
de
pth
ing
ing
ofitude
itude
of LSD
(feet)
top
bottom
water
(fee
t)
(feet)
(feet)
463100
1191
535
390.00
413.0
242.00
413.00
H
4633
37
1190
645
880.
00
313.0
128.
20
313.00
H
463222
1190
905
715.00
212.
0 18
8.00
212.00
H
Date
wate
rlevel
measured
9/26/1986
3/ 3
/198
73/
3/1
987
3/ 3/
1987
3/ 3
/198
72/24/1986
9/12
/198
63/
3/1
987
3/ 3/
1987
3/ 3
/198
73/
3/1
987
2/24/1986
4/17
/198
65/14/1986
6/17
/198
67/16/1986
8/21
/198
69/
10/1
986
10/2
2/19
8610
/22/
1986
11/2
0/19
8611/20/1986
2/ 4
/198
72/27/1987
2/27/1987
2/27
/198
72/27/1987
2/27/1987
5/ 8/
1987
7/ 1/1987
2/24/1986
9/26
/198
6
Water
level
(fee
t)
177.
8517
7.29
177.24
177.14
177.
0015
.49
22.3
034.30
27.90
23.8
021
.80
146.
33142.00
141.
1014
6.80
155.
0014
3.70
143.77
143.
6014
3.70
143.10
143.
20144.10
149.
03147.68
145.76
144.52
144.42
144.
7013
3.40
173.06
175.
34
Status R R R R - R R R R R - - - - P U U U U U - R R R R R - - - U
09
/12
/19
86
0.1
398
09/0
9/19
8615.00
1020
09/2
4/19
860.
1313

12N/29E-28F01
4629
55
1191110
914.
00
699.
8 45
5.50
69
9.80
U
00
12N
/29E
-34K
014
62
85
9
1190
943
90
9.0
0
97
1.0
4
17
.00
9
71
.00
H
12N/30E-04D01
4633
38
1190
357
880.00
290.0
63.00
290.00
H
9/26
/198
69/
26/1
986
9/26
/198
69/
26/1
986
3/ 3/
1987
3/ 3/
1987
3/ 3/
1987
3/ 3/
1987
3/ 3/
1987
3/ 3/
1987
2/26
/198
64/
17/1
986
5/14
/198
66/
18/1
986
7/15
/198
67/
15/1
986
8/20
/198
69/
21/1
986
10/2
2/19
8610
/22/
1986
11/2
0/19
8611/20/1986
12/1
0/19
861/
14/1
987
1/14
/198
72/ 4/
1987
21 4/
1987
3/ 3/
1987
4/ 4
/198
64/ 4/
1986
4/ 4/
1986
9/12
/198
69/
12/1
986
3/ 4/
1987
3/ 4/
1987
3/ 4/
1987
3/ 4/
1987
3/ 4
/198
72/
24/1
986
9/10
/198
69/10/1986
2/27
/198
7
175.29
175.
7517
6.36
175.
12174.51
173.33
173.
1317
3.10
173.
0517
2.95
495.
13496.80
495.30
511.00
499.80
499.70
494.50
497.
37496.30
496.00
495.50
495.30
496.10
496.10
496.00
496.00
495.90
494.
61519.40
519.20
518.90
617.80
596.00
535.90
535.30
534.70
534.00
533.10
48.30
39.76
39.6
153
.65
U U U U R R R R R R - - - U U U - U U U U - U U U U - R R R R R R R R R R - R R R
S s S s s s s s s s s T T T S S T S T T T T T T T T T S T T T T T T T T T T S S S s
09/2
6/19
860.1
382
09/2
6/19
8612.00
1110
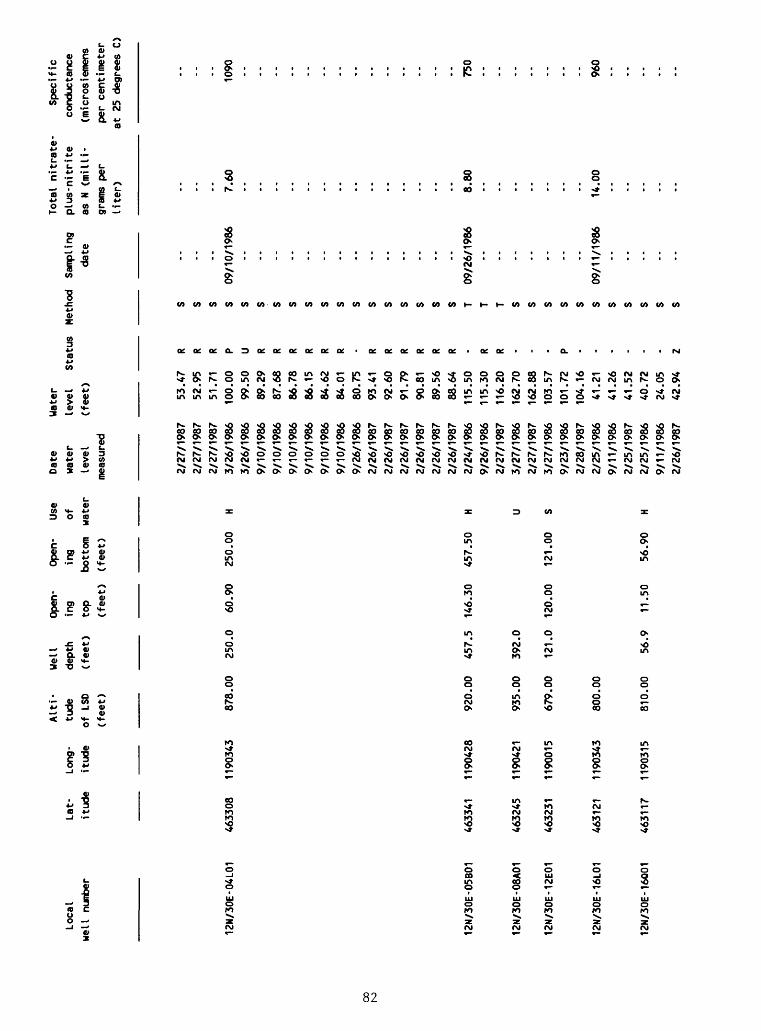
12N/
30E-
04L0
1
00
12N/30E-05B01
12N/30E-08A01
12N/30E-12E01
12N/
30E-
16L0
1
12N/
30E-
160.
01
Alti
- We
ll
Open-
Open-
Use
Lat-
Lo
ng-
tude
de
pth
ing
ing
ofit
ude
itude
of L
SD
(feet)
top
bottom
wate
r(feet)
(feet)
(feet)
4633
08
1190343
878.
00
250.0
60.90
250.
00
H
4633
41
1190
428
920.
00
457.
5 14
6.30
45
7.50
H
463245
1190
421
935.
00
392.0
U
4632
31
1190
015
679.
00
121.
0 12
0.00
121.00
S
463121
1190
343
800.
00
4631
17
1190
315
810.
00
56.9
11.5
0 56.90
H
Date
wate
rle
vel
meas
ured
2/27
/198
72/
27/1
987
2/27
/198
73/
26/1
986
3/26/1986
9/10/1986
9/10/1986
9/10/1986
9/10/1986
9/10/1986
9/10/1986
9/26
/198
62/
26/1
987
2/26
/198
72/
26/1
987
2/26
/198
72/
26/1
987
2/26/1987
2/24/1986
9/26/1986
2/27
/198
73/27/1986
2/27
/198
73/27/1986
9/23/1986
2/28
/198
72/
25/1
986
9/11/1986
2/25
/198
72/25/1986
9/11/1986
2/26
/198
7
Water
level
(fee
t) 53.47
52.9
551.71
100.00
99.50
89.2
987.68
86.7
886.15
84.62
84.01
80.75
93.41
92.60
91.79
90.81
89.5
688.64
115.50
115.30
116.20
162.70
162.88
103.57
101.
72104.16
41.2
141
.26
41.52
40.72
24.0
542.94
Status R R R P U R R R R R R - R R R R R R - R R - - - P - - - - - - Z
Method
Samp
ling
date
S S S S 09
/10/
1986
S S S S S S S S S S S S S S T 09
/26/
1986
T T S S S S S S 09
/11/
1986
S S S S S
Total
nitr
ate-
Sp
ecif
icpl
us-n
itri
te
conductance
as N
(mi Hi-
(mic
rosi
emen
sgrams
per
per
centimeter
liter)
at 2
5 de
gree
s C)
- -- 7.60
10
90- -- -- -- -- .. - - -- -- .. -- - -- 8.80
750
-- -- -- - -- -- - 14.0
0 96
0-- -- -- -- ..
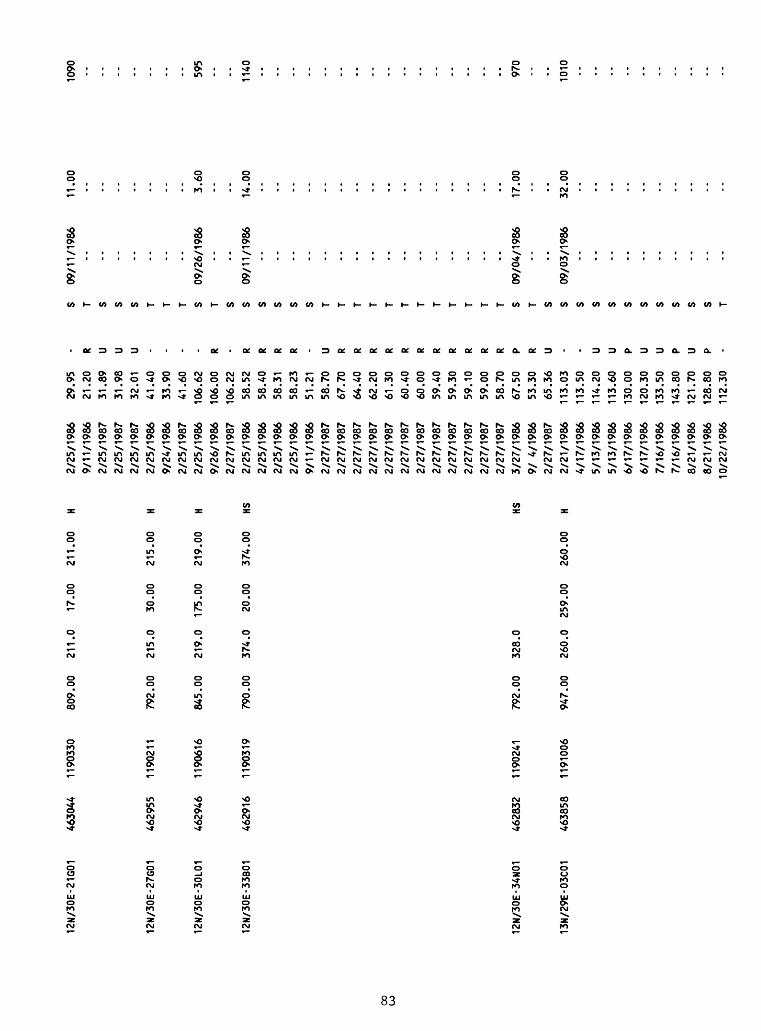
12N/30E-21G01
463044
1190330
809.
00
21
1.0
17
.00
211.
00
H
12N/
30E-
27G0
1
12N/
30E-
30L0
1
12N/
30E-
33B0
1
462955
1190211
4629
46
1190616
4629
16
1190319
792.00
215.
0 30.00
215.00
H
845.00
219.
0 17
5.00
219.00
H
790.00
374.0
20.0
0 374.00
HS
00
12N/30E-34N01
13N/29E-03C01
462832
1190241
4638
58
1191006
792.00
328.0
HS
947.00
260.
0 259.00
260.00
H
2/25/1986
9/11
/198
62/25/1987
2/25
/198
72/
25/1
987
2/25/1986
9/24
/198
62/25/1987
2/25
/198
69/26/1986
2/27
/198
72/
25/1
986
2/25/1986
2/25/1986
2/25
/198
69/
11/1
986
2/27/1987
2/27/1987
2/27/1987
2/27/1987
2/27
/198
72/27/1987
2/27
/198
72/
27/1
987
2/27
/198
72/27/1987
2/27/1987
2/27
/198
73/
27/1
986
9/ 4
/198
62/
27/1
987
2/21
/198
64/17/1986
5/13
/198
65/13/1986
6/17
/198
66/
17/1
986
7/16/1986
7/16/1986
8/21/1986
8/21
/198
610/22/1986
29.95
21.2
031.89
31.98
32.01
41.4
033.90
41.6
010
6.62
106.
0010
6.22
58.5
258
.40
58.31
58.2
351.21
58.7
067
.70
64.4
062
.20
61.3
060
.40
60.0
059
.40
59.3
059
.10
59.0
058
.70
67.5
053
.30
65.36
113.
0311
3.50
114.
2011
3.60
130.
0012
0.30
133.
5014
3.80
121.
7012
8.80
112.
30
R U U U - - - - R - R R R R - U R R R R R R R R R R R P R U - - U U P U U P U P -
s T S S S T T T S T S S S s s s T T T T T T T T T T T T S T S S S S S S S S S S S T
09/1
1/19
8611.00
1090
09/2
6/19
86
09/1
1/19
86
3.60
14.0
0
595
1140
09/04/1986
09/03/1986
17.0
0
32.0
0
970
1010
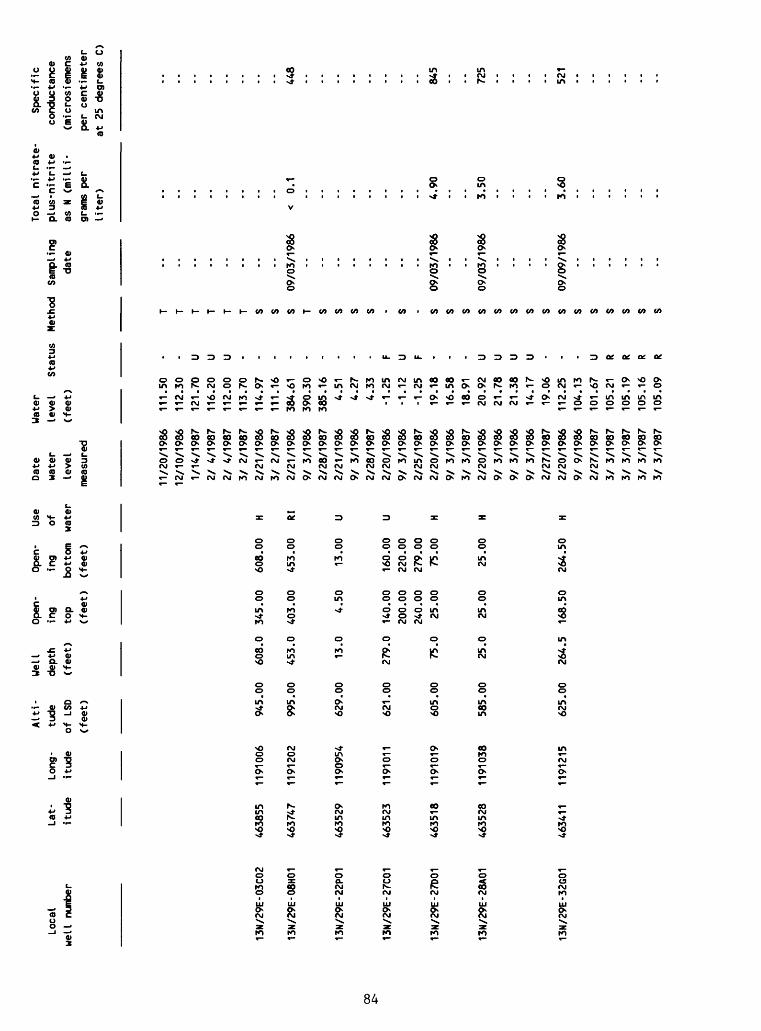
oo .£-
13M/29E-03C02
13N/
29E-
08H0
1
13N/29E-22P01
13M/29E-27C01
13N/29E-27D01
13N/29E-28A01
13N/29E-32G01
Alti-
Well
Open-
Open-
Use
Lat-
Long-
tude
de
pth
ing
ing
ofit
ude
itude
of LSD
(feet)
top
bott
om
water
(fee
t)
(feet)
(feet)
463855
1191
006
945.00
60
8.0
345.
00
608.
00
H
4637
47
1191
202
995.00
453.0
403.
00
453.
00
RI
463529
1190
954
629.00
13.0
4.50
13.00
U
463523
1191011
621.00
27
9.0
140.00
160.
00
U20
0.00
22
0.00
240.
00
279.
0046
3518
11
9101
9 605.00
75
.0
25.0
0 75.00
H
463528
1191
038
585.00
25.0
25.00
25.00
H
4634
11
1191
215
625.00
26
4.5
168.
50
264.
50
H
Date
water
level
meas
ured
11/2
0/19
8612
/10/
1986
1/14
/198
72/ 4
/198
721 4
/198
73/ 2
/198
72/
21/1
986
3/ 2
/198
72/
21/1
986
9/ 3
/198
62/
28/1
987
2/21
/198
69/ 3
/198
62/
28/1
987
2/20
/198
69/ 3
/198
62/
25/1
987
2/20
/198
69/ 3
/198
63/ 3
/198
72/
20/1
986
9/ 3
/198
69/ 3
/198
69/ 3
/198
62/
27/1
987
2/20
/198
69/ 9
/198
62/
27/1
987
3/ 3
/198
73/
3/1
987
3/ 3
/198
73/ 3
/198
7
Water
leve
l St
atus
(feet)
111.50
112.
3012
1.70
116.
2011
2.00
113.
7011
4.97
111.
16384.61
390.
3038
5.16
4.51
4.27
4.33
-1.2
5-1
.12
-1.2
519.18
16.58
18.91
20.92
21.7
821.38
14.17
19.0
611
2.25
104.
1310
1.67
105.21
105.
1910
5.16
105.
09
U U U - - - - - - - - - F U F - - - U U U U - - - U R R R R
09/0
3/19
860.
1448
09/03/1986
09/03/1986
4.90
3.50
845
725
09/0
9/19
863.60
521
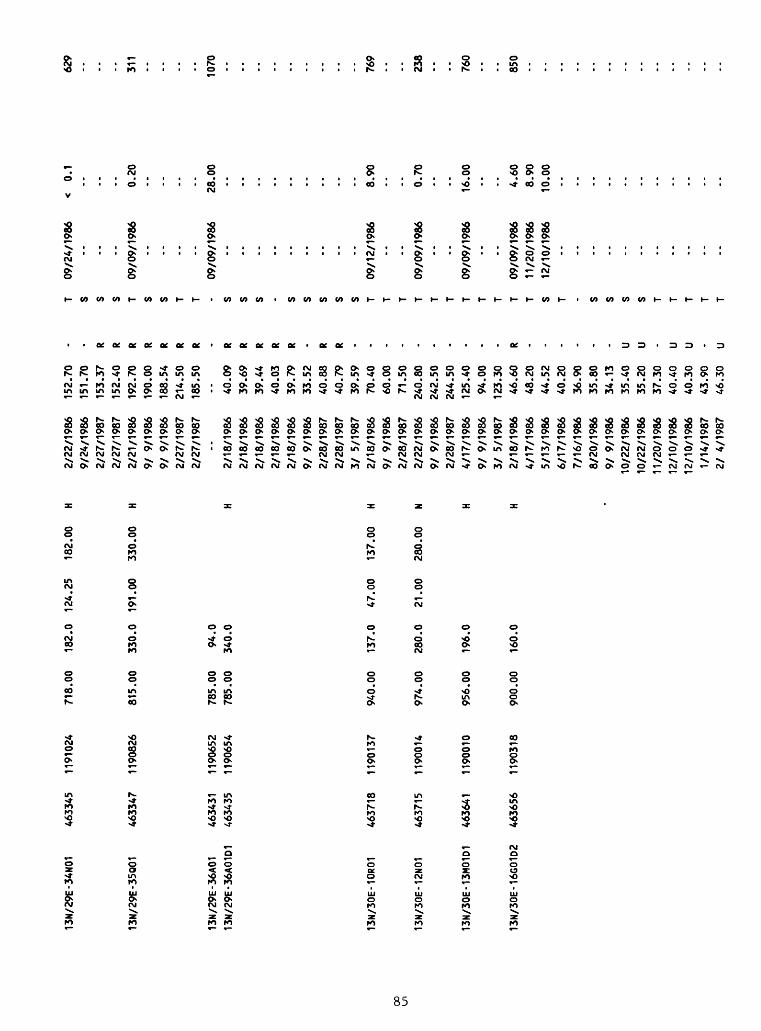
13N/
29E-
3AN0
1 463345
1191
024
718.00
182.
0 12
4.25
18
2.00
H
13N/
29E-
35Q0
1 46
3347
1190826
815.
00
330.0
191.
00
330.
00
H
13N/
29E-
36A0
1 46
3431
11
9065
2 785.00
94.0
13
N/29
E-36
A01D
1 463435
1190
654
785.00
340.0
oo
13N/
30E-
10R0
1 46
3718
1190137
940.
00
137.
0 47.00
137.00
H
13N/30E-12N01
463715
1190
014
974.
00
280.0
21.00
280.00
N
13N/
30E-
13M0
1D1
4636
41
1190
010
956.
00
196.
0
13N/30E-16G01D2
4636
56
1190
318
900.
00
160.
0
2/22/1986
9/24
/198
62/
27/1
987
2/27/1987
2/21/1986
9/ 9
/198
69/ 9
/198
62/
27/1
987
2/27
/198
7--
2/18
/198
62/18/1986
2/18/1986
2/18
/198
62/18/1986
9/ 9
/198
62/
28/1
987
2/28/1987
3/ 5/
1987
2/18/1986
9/ 9
/198
62/
28/1
987
2/22
/198
69/ 9
/198
62/
28/1
987
4/17/1986
9/ 9
/198
63/
5/1
987
2/18
/198
64/
17/1
986
5/13/1986
6/17
/198
67/
16/1
986
8/20
/198
69/
9/1
986
10/22/1986
10/22/1986
11/20/1986
12/10/1986
12/10/1986
1/14/1987
2/ 4
/198
7
152.
7015
1.70
153.37
152.
4019
2.70
190.
0018
8.54
214.50
185.
50-- 40.09
39.69
39.4
440.03
39.79
33.52
40.88
40.79
39.59
70.4
060.00
71.5
0240.80
242.50
244.50
125.
4094.00
123.
3046.60
48.20
44.52
40.20
36.90
35.80
34.13
35.40
35.20
37.30
40.40
40.30
43.90
46.30
- - R R R R R R R - R R R R R - R R - - - - - - - - - R - - - - - - U U - U U - U
T S S S T S S T T - S S S - S S S S S T T T T T T T T T T T S T - S S S S T T T T T
09/2
4/19
86-- --
09/0
9/19
86-- - --
09/0
9/19
86-- -- -- -- -- -- -- -
09/1
2/19
86-
09/0
9/19
86-- --
09/0
9/19
86 -
09/0
9/19
8611
/20/
1986
12/1
0/19
86 - -- -- -- -- - -- -- --
< 0.
1-- -- -- 0.20
-- -- --
28.0
0 - -- - -- - -- -- -- 8.90
- -- 0.70
-- -- 16.0
0 - 4.60
8.90
10.0
0-- -- -- -- -- -- -- --
629
311
1070 769
238
760
850

Loca
l we
ll nu
mber
13N/
30E-
22N0
1
00
13N/30E-26G01
13N/
30E-
27J0
1
13N/
30E-
31D0
1
14N/
29E-
05A0
1
14N/
29E-
05M0
1
14N/29E-09B02
Alti
- Well
Open
- Op
en-
Use
Lat-
Lo
ng-
tude
de
pth
ing
ing
ofitude
itud
e of
LSD
(fee
t)
top
bott
om
wate
r(f
eet)
(feet)
(feet)
463529
1190
236
910.
00
154.
0 60.00
154.
00
H
463505
1190
040
674.
00
36.8
U
463458
1190
140
875.
00
56.0
56.00
56.00
H
463433
1190
635
755.00
50
.0
43.00
50.00
U
464412
1191
157
1100
.00
305.0
165.00
305.
00
H
4643
42
1191
258
1212
.00
550.
0 44
0.00
55
0.00
H
4643
16
1191
052
1260
.00
725.
0 H
Date
water
level
meas
ured
2/28
/198
75/ 8
/198
77/
1/
1987
2/19
/198
62/
19/1
986
2/19
/198
69/
9/1
986
2/28
/198
72/
19/1
986
9/10
/198
62/
28/1
987
2/19
/198
69/
9/1
986
2/21
/198
69/ 9
/198
62/
27/1
987
3/27
/198
69/
24/1
986
3/ 2
/198
73/ 2
/198
73/ 2/
1987
3/ 4
/198
73/
27/1
986
3/27
/198
69/
24/1
986
2/18
/198
62/
18/1
986
2/18
/198
62/
18/1
986
4/17
/198
65/
14/1
986
6/17
/198
6
Wate
rlevel
(feet) 48.23
47.2
538.20
34.64
35.59
34.00
21.4
134.41
4.87
4.20
4.95
8.11
3.91
3.43
3.22
3.82
245.
8024
2.60
256.
8725
2.43
251.
7324
4.19
278.
2527
8.30
273.
28353.31
354.
2735
4.43
353.
7935
6.50
357.
5037
0.50
Stat
us - - U U U - - - - - - - - - - - - R R R - U U - U U U U U - p
Meth
od
Sampling
date
s s T S 09/09/1986
S S s s s s s S 09/09/1986
S S s s T 09/24/1986
S S s s s S 09
/25/
1986
S S S 12/10/1986
S S s s s s
Total
nitr
ate-
Specific
plus
- ni
t ri
te
cond
ucta
nce
as N
(m
illi
- (microsiemens
gram
s pe
r pe
r centimeter
liter)
at 2
5 de
gree
s C)
.. .. 12.0
0 66
5.. .. .. .. .. -- .. 8.60
521
.. .. .. .. 5.00
.. .. -- .. .. 9.50
850
-- .. 3.40
-- .. .. .. .. ..
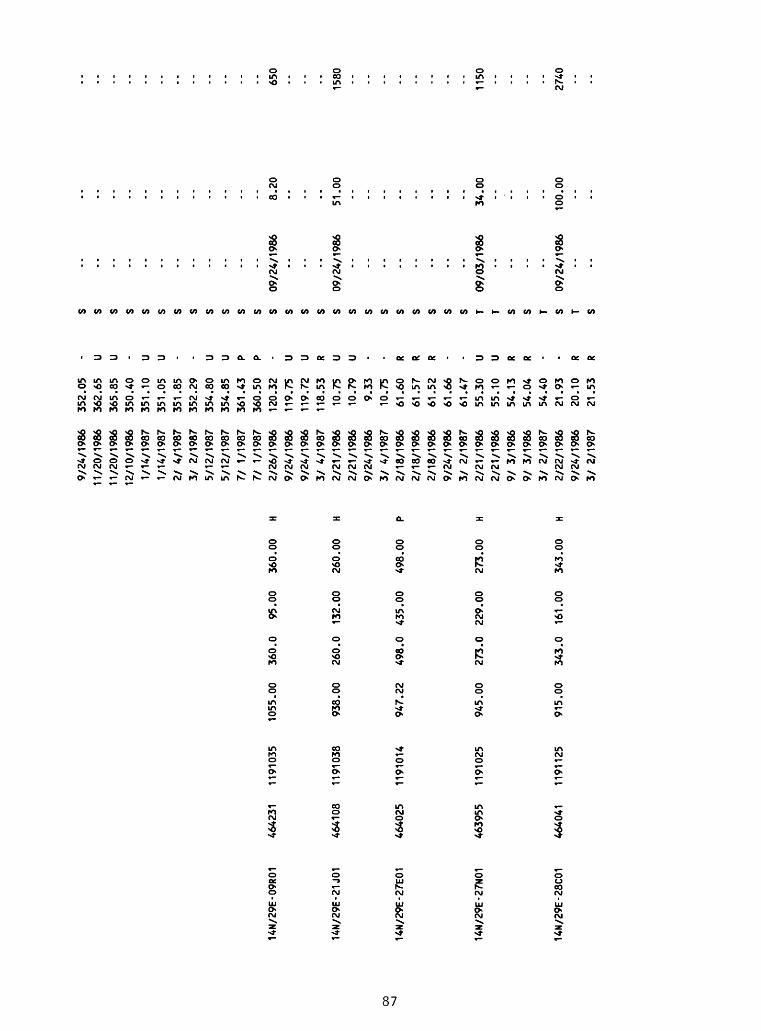
oo
14N/29E-09R01
4642
31
1191
035
1055.00
360.0
95.0
0 360.00
H
14N/
29E-
21J0
1 46
4108
11
9103
8 938.00
260.0
132.
00
260.00
H
14N/
29E-
27E0
1 464025
1191014
947.22
498.0
435.00
498.00
P
14N/29E-27N01
463955
1191025
945.00
273.0
229.00
273.00
H
14N/29E-28C01
4640
41
1191125
915.00
343.0
161.
00
343.00
H
9/24
/198
611/20/1986
11/2
0/19
8612
/10/
1986
1/14/1987
1/14/1987
2/ 4
/198
73/ 2/1987
5/12/1987
5/12/1987
7/ 1/1987
71 1/1987
2/26/1986
9/24
/198
69/
24/1
986
3/ 4
/198
72/21/1986
2/21/1986
9/24
/198
63/
4/1
987
2/18/1986
2/18/1986
2/18/1986
9/24
/198
63/ 2/1987
2/21/1986
2/21/1986
9/ 3
/1986
9/ 3
/1986
3/ 2/1987
2/22/1986
9/24
/198
63/
2/1987
352.05
362.65
365.85
350.40
351.10
351.05
351 .85
352.
29354.80
354.85
361 .4
3360.50
120.
3211
9.75
119.
72118.53
10.7
510
.79
9.33
10.75
61.60
61.57
61.52
61.66
61.47
55.30
55.10
54.13
54.04
54.40
21.93
20.1
021.53
U u - u u - - u u p p - u u R U u - R R R - - U U R R - - R R
S S S S S S S S S S S S S S S S S S S S S S S S S T T S S T S T S
09/24/1986
09/2
4/19
86
8.20
51.00
650
1580
09/0
3/19
8634.00
1150
09/24/1986
100.
002740
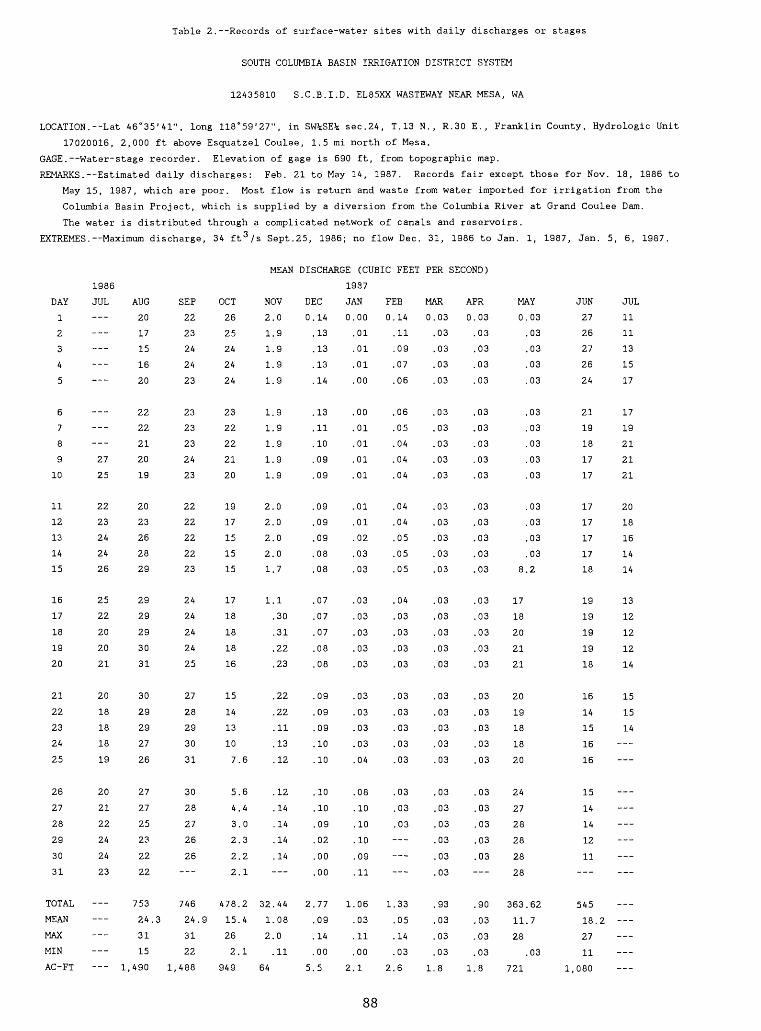
Table 2.--Records of surface-water sites with daily discharges or stages
SOUTH COLUMBIA BASIN IRRIGATION DISTRICT SYSTEM
12435810 S.C.B.I.D. EL85XX WASTEWAY NEAR MESA, WA
LOCATION.--Lat 46°35'41", long 118°59'27", in SW%SE% sec.24, T.13 N., R.30 E., Franklin County, Hydrologic Unit
17020016, 2,000 ft above Esquatzel Coulee, 1.5 mi north of Mesa.
GAGE. Water-stage recorder. Elevation of gage is 690 ft, from topographic map.
REMARKS.--Estimated daily discharges: Feb. 21 to May 14, 1987. Records fair except those for Nov. 18, 1986 to
May 15, 1987, which are poor. Most flow is return and waste from water imported for irrigation from the
Columbia Basin Project, which is supplied by a diversion from the Columbia River at Grand Coulee Dam.
The water is distributed through a complicated network of canals and reservoirs.
EXTREMES.--Maximum discharge, 34 ft 3 /s Sept.25, 1986; no flow Dec. 31, 1986 to Jan. 1, 1987, Jan. 5, 6, 1987.
MEAN DISCHARGE (CUBIC FEET PER SECOND)
DAY
1
2
3
4
5
6
7
8
9
10
11
12
13
14
15
16
17
18
19
20
21
22
23
24
25
26
27
28
29
30
31
TOTAL
MEAN
MAX
MIN
AC-FT
1986
JUL
___
27
25
22
23
24
24
26
25
22
20
20
21
20
18
18
18
19
20
21
22
24
24
23
AUG
20
17
15
16
20
22
22
21
20
19
20
23
26
28
29
29
29
29
30
31
30
29
29
27
26
27
27
25
2?
22
22
753
24.3
31
15
1,490
SEP
22
23
24
24
23
23
23
23
24
23
22
22
22
22
23
24
24
24
24
25
27
28
29
30
31
30
28
27
26
26
746
24.9
31
22
1,488
OCT
26
25
24
24
24
23
22
22
21
20
19
17
15
15
15
17
18
18
18
16
15
14
13
10
7.6
5.6
4.4
3.0
2.3
2.2
2.1
478.2
15.4
26
2.1
949
NOV
2.0
1.9
1.9
1.9
1.9
1.9
1.9
1.9
1.9
1.9
2.0
2.0
2.0
2.0
1.7
1.1
.30
.31
.22
.23
.22
.22
.11
.13
.12
.12
.14
.14
.14
.14
32.44
1.08
2.0
.11
64
DEC
0.14
.13
.13
.13
.14
.13
.11
.10
.09
.09
.09
.09
.09
.08
.08
.07
.07
.07
.08
.08
.09
.09
.09
.10
.10
.10
.10
.09
.02
.00
.00
2.77
.09
.14
.00
5.5
1987
JAN
0.00
.01
.01
.01
.00
.00
.01
.01
.01
.01
.01
.01
.02
.03
.03
.03
.03
.03
.03
.03
.03
.03
.03
.03
.04
.08
.10
.10
.10
.09
.11
1.06
.03
.11
.00
2.1
FEE
0.14
.11
.09
.07
.06
.06
.05
.04
.04
.04
.04
.04
.05
.05
.05
.04
.03
.03
.03
.03
.03
.03
.03
.03
.03
.03
.03
.03
1.33
.05
.14
.03
2.6
MAR
0.03
.03
.03
.03
.03
.03
.03
.03
.03
.03
.03
.03
.03
.03
.03
.03
.03
.03
.03
.03
.03
.03
.03
.03
.03
.03
.03
.03
.03
.03
.03
.93
.03
.03
.03
1.8
APR
0.03
.03
.03
.03
.03
.03
.03
.03
.03
.03
.03
.03
.03
.03
.03
.03
.03
.03
.03
.03
.03
.03
.03
.03
.03
.03
.03
.03
.03
.03
.90
.03
.03
.03
1.8
MAY
0.03
.03
.03
.03
.03
.03
.03
.03
.03
.03
.03
.03
.03
.03
8.2
17
18
20
21
21
20
19
18
18
20
24
27
28
28
28
28
363.62
11.7
28
.03
721
JUN
27
26
27
26
24
21
19
18
17
17
17
17
17
17
18
19
19
19
19
18
16
14
15
16
16
15
14
14
12
11
545
18.2
27
11
1,080
JUL
11
11
13
15
17
17
19
21
21
21
20
18
16
14
14
13
12
12
12
14
15
15
14
___
88
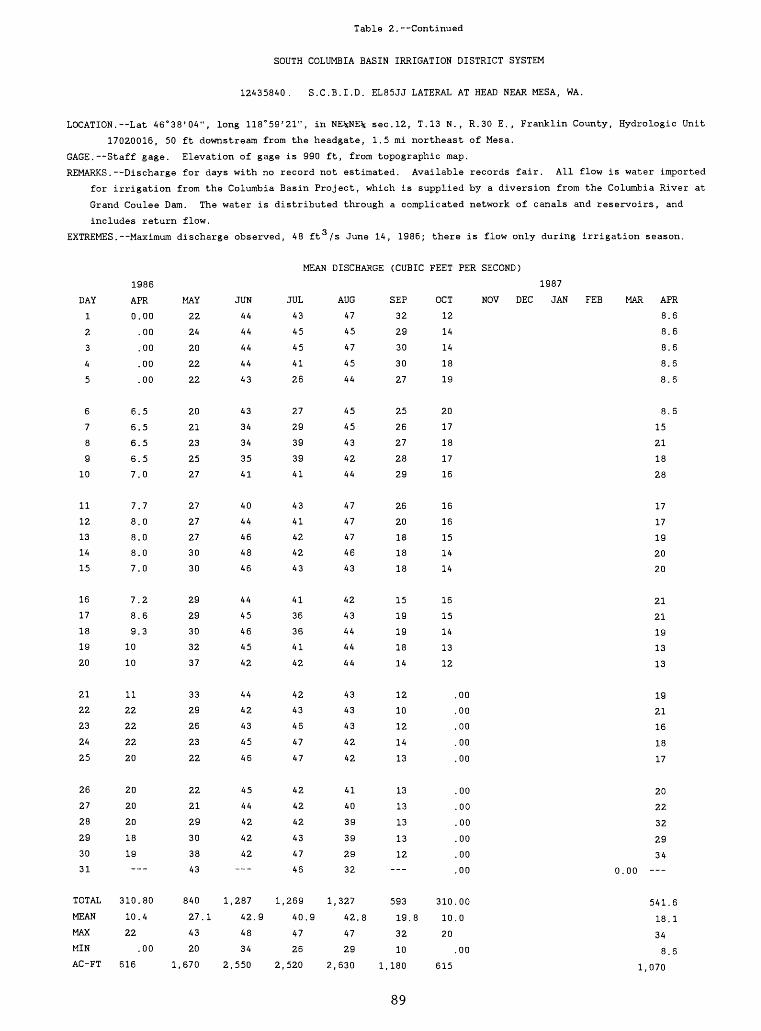
Table 2. Continued
SOUTH COLUMBIA BASIN IRRIGATION DISTRICT SYSTEM
12435840 S.C.B.I.D. EL85JJ LATERAL AT HEAD NEAR MESA, WA.
LOCATION. --Lat 46°38'04", long 118°59'21", in NE%NE% sec.12, T.13 N., R.30 E., Franklin County, Hydrologic Unit
17020016, 50 ft downstream from the headgate, 1.5 mi northeast of Mesa.
GAGE. Staff gage. Elevation of gage is 990 ft, from topographic map.
REMARKS. Discharge for days with no record not estimated. Available records fair. All flow is water imported
for irrigation from the Columbia Basin Project, which is supplied by a diversion from the Columbia River at
Grand Coulee Dam. The water is distributed through a complicated network of canals and reservoirs, and
includes return flow.
EXTREMES.--Maximum discharge observed, 48 ft 3 /s June 14, 1986; there is flow only during irrigation season.
MEAN DISCHARGE (CUBIC FEET PER SECOND)
1987
NOV DEC JAN
1986
DAY
1
2
3
4
5
6
7
8
9
10
11
12
13
14
15
16
17
18
19
20
21
22
23
24
25
26
27
28
29
30
31
TOTAL
MEAN
MAX
MIN
AC-FT
APR
0
6
6
6
6
7
7
8
8
8
7
7
8
9
10
10
11
22
22
22
20
20
20
20
18
19-
310
10
22
616
.00
.00
.00
.00
.00
.5
.5
.5
.5
.0
.7
.0
.0
.0
.0
.2
.6
.3
.80
.4
.00
MAY
22
24
20
22
22
20
21
23
25
27
27
27
27
30
30
29
29
30
32
37
33
29
26
23
22
22
21
29
30
38
43
840
27.1
43
20
1,670
JUN
44
44
44
44
43
43
34
34
35
41
40
44
46
48
46
44
45
46
45
42
44
42
43
45
46
45
44
42
42
42---
1,287
42.9
48
34
2,550
JUL
43
45
45
41
26
27
29
39
39
41
43
41
42
42
43
41
36
36
41
42
42
43
46
47
47
42
42
42
43
47
46
1,269
40.9
47
26
2,520
AUG
47
45
47
45
44
45
45
43
42
44
47
47
47
46
43
42
43
44
44
44
43
43
43
42
42
41
40
39
39
29
32
1,327
42.8
47
29
2,630
SEP
32
29
30
30
27
25
26
27
28
29
26
20
18
18
18
15
19
19
18
14
12
10
12
14
13
13
13
13
13
12___
593
19.8
32
10
1,180
OCT
12
14
14
18
19
20
17
18
17
16
16
16
15
14
14
16
15
14
13
12
310,
10.
20
615
.00
.00
,00
.00
.00
.00
.00
.00
.00
.00
.00
.00
.0
.00
FEE MAR APR
8.6
8.6
8.6
8.6
8.6
8.6
15
21
18
28
17
17
19
20
20
21
21
19
13
13
19
21
16
18
17
20
22
32
29
34 0.00
541.6
18.1
34
8.6
1,070
89

Table 2. Continued
SOUTH COLUMBIA BASIN IRRIGATION DISTRICT SYSTEM
12435850 S.C.B.I.D. EL85 CANAL BELOW EL85JJ LATERAL NEAR MESA, WA.
LOCATION.--Lat 46°38'06", long 118 <> 59'22", in NE%NE% sec.12, T.13 N., R.30 E., Franklin County, Hydrologic Unit
17020016, 20 ft downstream of EL85JJ Lateral headgate, 1.5 mi northeast of Mesa.
GAGE. Staff gage. Elevation of gage is 990 ft, from topographic map.
REMARKS.--No estimated daily discharges. Records fair. Flow is water imported for irrigation from the Columbia
Basin Project, which is supplied by a diversion from the Columbia River at Grand Coulee Dam. The water is
distributed through a complicated network of canals and reservoirs, and includes return flow.
EXTREMES. Maximum daily discharge, 24 ft /s June 6, 1986; there is flow only during irrigation season.
MEAN DISCHARGE (CUBIC FEET PER SECOND)
1987
NOV DEC JAN FEE MAR APR
0.00
.00
.00
.00
.00
.00
4.2
4.2
7.0
9.8
11
11
11
12
12
13
13
13
12
12
12
12
12
12
12
13
13
13
12
12
268.20
8.94
13
.00
532
90
1986
DAY
1
2
3
4
5
6
7
8
9
10
11
12
13
14
15
16
17
18
19
20
21
22
23
24
25
26
27
28
29
30
31
TOTAL
MEAN
MAX
MIN
AC-FT
APR
0.
5.
5.
5.
5.
5.
5.
5.
5.
5.
5.
5.
5.
5.
5.
8.
8.
8.
12
12
12
12
13
13
13
13-
206.
6.
13
410
00
00
00
00
00
9
9
9
9
9
9
9
9
9
9
9
9
9
9
0
0
0
60
89
00
MAY
12
13
12
9.
9.
12
12
12
12
13
12
12
12
9,
9.
9.
9.
9.
9.
9.
9.
13
10
9.
6.
6.
7.
9.
14
14
19
338.
10.
19
6.
671
.5
.4
,6
,4
,4
,4
,4
,4
,4
.4
9
6
.5
,6
.4
,3
9
,5
JUN
20
20
20
23
23
24
21
20
20
20
20
21
21
20
20
20
21
21
21
21
18
18
18
18
17
17
18
18
18
18---
595
19.8
24
17
1,180
JUL
18
18
18
20
20
15
15
15
18
20
20
17
17
17
17
20
20
20
20
20
23
23
23
21
23
20
14
14
14
18
18
576
18.6
23
14
1,140
AUG
17
17
17
17
18
21
21
23
23
21
21
21
23
23
23
23
21
21
21
21
19
19
19
19
19
19
23
23
23
23
20
639
20.6
23
17
1,270
SEP
20
20
16
16
16
16
9.
9.
7.
7.
7.
7.
7.
7.
7.
7.
7.
7.
6.
6.
7.
7.
8.
8.
8.
6.
6.
6.
6.
6.--
280.
9.
20
6.
557
OCT
3
2
4
4
4
4
4
4
4
4
4
1
3
3
4
4
5
5
5
3
3
3
3
3-
6
35
3
6.
4,
4,
3,
5,
5,
5,
8,
8,
9
9,
9,
9,
9.
9,
9.
7.
7.
7.
7.
144.
4.
9.
287
.3
.4
,4
.0
.1
.1
.1
.4
.5
.4
.4
.4
.4
.4
.4
.4
,1
.1
.1
.1
,00
.00
,00
00
00
,00
,00
,00
,00
.00
.00
,50
,66
,4
.00
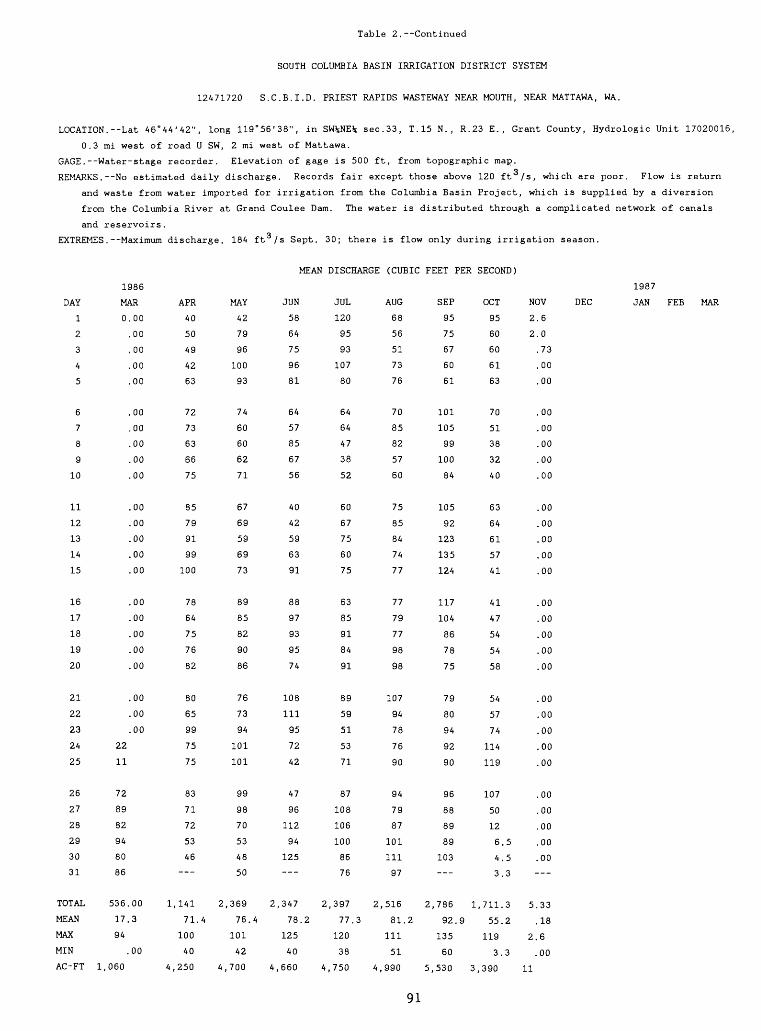
Table 2.--Continued
SOUTH COLUMBIA BASIN IRRIGATION DISTRICT SYSTEM
12471720 S.C.B.I.D. PRIEST RAPIDS WASTEWAY NEAR MOUTH, NEAR MATTAWA, WA.
LOCATION.--Lat 46°44'42", long 119°56'38", in SW%NE% sec.33, T.15 N., R.23 E., Grant County, Hydrologic Unit 17020016,
0.3 mi west of road U SW, 2 mi west of Mattawa.
GAGE.--Water-stage recorder. Elevation of gage is 500 ft, from topographic map.o
REMARKS.--No estimated daily discharge. Records fair except those above 120 ft /s, which are poor. Flow is return
and waste from water imported for irrigation from the Columbia Basin Project, which is supplied by a diversion
from the Columbia River at Grand Coulee Dam. The water is distributed through a complicated network of canals
and reservoirs.
EXTREMES.--Maximum discharge, 184 ft /s Sept. 30; there is flow only during irrigation season.
MEAN DISCHARGE (CUBIC FEET PER SECOND)
DAY
1
2
3
4
5
6
7
8
9
10
11
12
13
14
15
16
17
18
19
20
21
22
23
24
25
26
27
28
29
30
31
TOTAL
MEAN
MAX
MIN
AC-FT
1986
MAR
0.00
.00
.00
.00
.00
.00
.00
.00
.00
.00
.00
.00
.00
.00
.00
.00
.00
.00
.00
.00
.00
.00
.00
22
11
72
89
82
94
80
86
536.00
17.3
94
.00
1,060
APR
40
50
49
42
63
72
73
63
66
75
85
79
91
99
100
78
64
75
76
82
80
65
99
75
75
83
71
72
53
46___
1,141
71.4
100
40
4,250
MAY
42
79
96
100
93
74
60
60
62
71
67
69
59
69
73
89
85
82
90
86
76
73
94
101
101
99
98
70
53
48
50
2,369
76.4
101
42
4,700
JUN
58
64
75
96
81
64
57
85
67
56
40
42
59
63
91
88
97
93
95
74
108
111
95
72
42
47
96
112
94
125---
2,347
78.2
125
40
4,660
JUL
120
95
93
107
80
64
64
47
38
52
60
67
75
60
75
63
85
91
84
91
89
59
51
53
71
87
108
106
100
86
76
2,397
77.3
120
38
4,750
AUG
68
56
51
73
76
70
85
82
57
60
75
85
84
74
77
77
79
77
98
98
107
94
78
76
90
94
79
87
101
111
97
2,516
81.
Ill
51
4,990
SEP
95
75
67
60
61
101
105
99
100
84
105
92
123
135
124
117
104
86
78
75
79
80
94
92
90
96
88
89
89
103---
2,786
2 92.9
135
60
5,530
91
OCT
95
60
60
61
63
70
51
38
32
40
63
64
61
57
41
41
47
54
54
58
54
57
74
114
119
107
50
12
6.5
4.5
3.3
1,711.3
55.2
119
3.3
3,390
NOV
2.6
2.0
.73
.00
.00
.00
.00
.00
.00
.00
.00
.00
.00
.00
.00
.00
.00
.00
.00
.00
.00
.00
.00
.00
.00
.00
.00
.00
.00
.00
5.33
.18
2.6
.00
11
DEC
1987
JAN FEE MAR
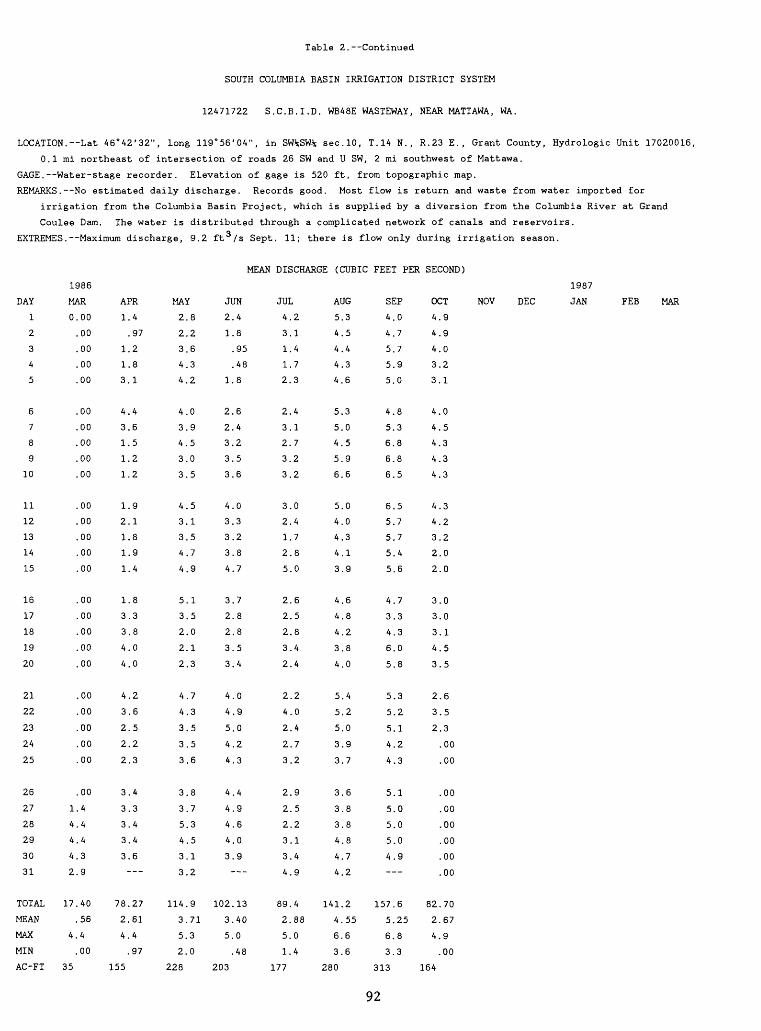
Table 2. Continued
SOUTH COLUMBIA BASIN IRRIGATION DISTRICT SYSTEM
12471722 S.C.B.I.D. WB48E WASTEWAY, NEAR MATTAWA, WA.
LOCATION. --Lat 46°42'32", long 119°56'04", in SWJsSW^ sec. 10, T.14 N. , R.23 E. , Grant County, Hydrologic Unit 17020016,
0.1 mi northeast of intersection of roads 26 SW and U SW, 2 mi southwest of Mattawa.
GAGE. Water-stage recorder. Elevation of gage is 520 ft, from topographic map.
REMARKS. --No estimated daily discharge. Records good. Most flow is return and waste from water imported for
irrigation from the Columbia Basin Project, which is supplied by a diversion from the Columbia River at Grand
Coulee Dam. The water is distributed through a complicated network of canals and reservoirs.
EXTREMES. Maximum discharge, 9.2 ft 3 /s Sept. 11; there is flow only during irrigation season.
MEAN DISCHARGE (CUBIC FEET PER SECOND)
DAY
1
2
3
4
5
6
7
8
9
10
11
12
13
14
15
16
17
18
19
20
21
22
23
24
25
26
27
28
29
30
31
TOTAL
MEAN
MAX
MIN
AC-FT
1986
MAR
0.00
.00
.00
.00
.00
.00
.00
.00
.00
.00
.00
.00
.00
.00
.00
.00
.00
.00
.00
.00
.00
.00
.00
.00
.00
.00
1.4
4.4
4.4
4.3
2.9
17.40
.56
4.4
.00
35
APR
1
1
1
3
4
3
1
1
1
1
2
1
1
1
1
3
3
4
4
4
3
2
2
2
3
3
3
3
3
78
2
4
155
.4
.97
.2
.8
.1
.4
.6
.5
.2
.2
.9
.1
.8
.9
.4
.8
.3
.8
.0
.0
.2
.6
.5
.2
.3
.4
.3
.4
.4
.6
.27
.61
.4
.97
MAY
2,
2,
3.
4.
4.
4.
3.
4.
3.
3.
4.
3.
3,
4,
4,
5
3
2,
2.
2
4
4
3
3
3
3
3
5,
4,
3
3,
114.
3.
5.
2.
228
,8
,2
.6
.3
.2
,0
,9
,5
,0
,5
.5
,1
.5
.7
.9
.1
.5
.0
.1
.3
.7
.3
.5
.5
.6
.8
.7
.3
.5
.1
.2
,9
,71
3
0
JUN
2
1
1
2
2
3
3
3
4
3
3
3
4
3
2
2
3
3
4
4
5
4
4
4
4
4
4
3
102
3
5
203
.4
.8
.95
.48
.8
.6
.4
.2
.5
.6
.0
.3
.2
.8
.7
.7
.8
.8
.5
.4
.0
.9
.0
.2
.3
.4
.9
.6
.0
.9
.13
.40
.0
.48
JUL
4.2
3.1
1.4
1.7
2.3
2.4
3.1
2.7
3.2
3.2
3.0
2.4
1.7
2.8
5.0
2.6
2.5
2.8
3.4
2.4
2.2
4.0
2.4
2.7
3.2
2.9
2.5
2.2
3.1
3.4
4.9
89.4
2.88
5.0
1.4
177
AUG
5.3
4.5
4.4
4.3
4.6
5.3
5.0
4.5
5.9
6.6
5.0
4.0
4.3
4.1
3.9
4.6
4.8
4.2
3.8
4.0
5.4
5.2
5.0
3.9
3.7
3.6
3.8
3.8
4.8
4.7
4.2
141.2
4.55
6.6
3.6
280
SEP
4.0
4.7
5.7
5.9
5.0
4.8
5.3
6.8
6.8
6.5
6.5
5.7
5.7
5.4
5.6
4.7
3.3
4.3
6.0
5.8
5.3
5.2
5.1
4.2
4.3
5.1
5.0
5.0
5.0
4.9
157.6
5.25
6.8
3.3
313
OCT
4.9
4.9
4.0
3.2
3.1
4.0
4.5
4.3
4.3
4.3
4.3
4.2
3.2
2.0
2.0
3.0
3.0
3.1
4.5
3.5
2.6
3.5
2.3
.00
.00
.00
.00
.00
.00
.00
.00
82.70
2.67
4.9
.00
164
NOV DEC
1987
JAN FEE MAR
92

Table 2. Continued
SOUTH COLUMBIA BASIN IRRIGATION DISTRICT SYSTEM
12471724 S.C.B.I.D. MATTAWA WASTEWAY, NEAR MATTAWA, WA.
LOCATION.--!at 46°39'14", long 119°47'48", in SW%SE% sec.34, T.14 N., R.24 E., Grant County, Hydrologic Unit 17020016,
1.3 mi above mouth, 6 mi southeast of Mattawa.
GAGE. Water-stage recorder. Elevation of gage is 710 ft, from topographic map.
REMARKS.--Estimated daily discharges: Oct.19-21, 24, 25. Records good except for estimated daily discharges, which
are poor. Flow is return and waste from water imported for irrigation from the Columbia Basin Project, which is
supplied by a diversion from the Columbia River at Grand Coulee Dam. The water is distributed through a
complicated network of canals and reservoirs.
EXTREMES. Maximum discharge, 35 ft 3 /s May 2; there is flow only during irrigation season.
MEAN DISCHARGE (CUBIC FEET PER SECOND)
NOVDAY
1
2
3
4
5
6
7
8
9
10
11
12
13
14
15
16
17
18
19
20
21
22
23
24
25
26
27
28
29
30
31
TOTAL
MEAN
MAX
MIN
AC -FT
1986
MAR
0.00
.00
.00
.00
.00
.00
.00
.00
.00
.00
.00
.00
.00
.00
.00
.00
.00
.00
.00
.00
.00
.00
.00
.00
.00
3.9
16
15
17
16
14
81.90
2.64
17
.00
162
APR
16
14
16
15
13
11
9.3
8.6
14
20
23
24
25
26
23
20
20
22
24
24
25
23
23
27
27
25
23
25
28
28
621.9
20.7
28
8.6
1,230
MAY
32
32
29
30
30
30
28
32
32
30
27
28
24
23
28
26
27
24
23
25
22
25
27
25
22
21
25
22
18
19
24
810
26.1
32
18
1,610
JUN
25
25
16
29
26
23
22
19
20
21
22
21
21
25
28
26
24
22
21
21
22
20
20
19
19
20
21
21
21
17
657
21.9
29
16
1,300
JUL
15
17
20
21
24
25
25
24
27
23
19
21
22
20
19
18
21
18
19
20
19
15
20
22
19
18
20
19
20
18
16
624
20.1
27
15
1,240
AUG
19
22
23
21
21
15
16
13
14
19
18
21
19
20
18
15
17
19
18
19
18
21
23
21
19
18
13
14
21
19
17
571
18.
23
13
1,130
SEP
19
18
13
18
22
21
20
23
22
20
17
16
15
16
14
16
16
13
9.3
11
17
20
19
17
17
16
15
14
15
19
508.3
4 16.9
23
9.3
1,010
OCT
14
16
18
16
18
15
11
13
12
13
14
14
18
18
15
14
18
16
15
15
14
15
15
1,
348.
11.
18
691
.0
,20
.00
.00
.00
.00
.00
.00
.20
.2
,00
DEC
1987
JAN FEE MAR
93
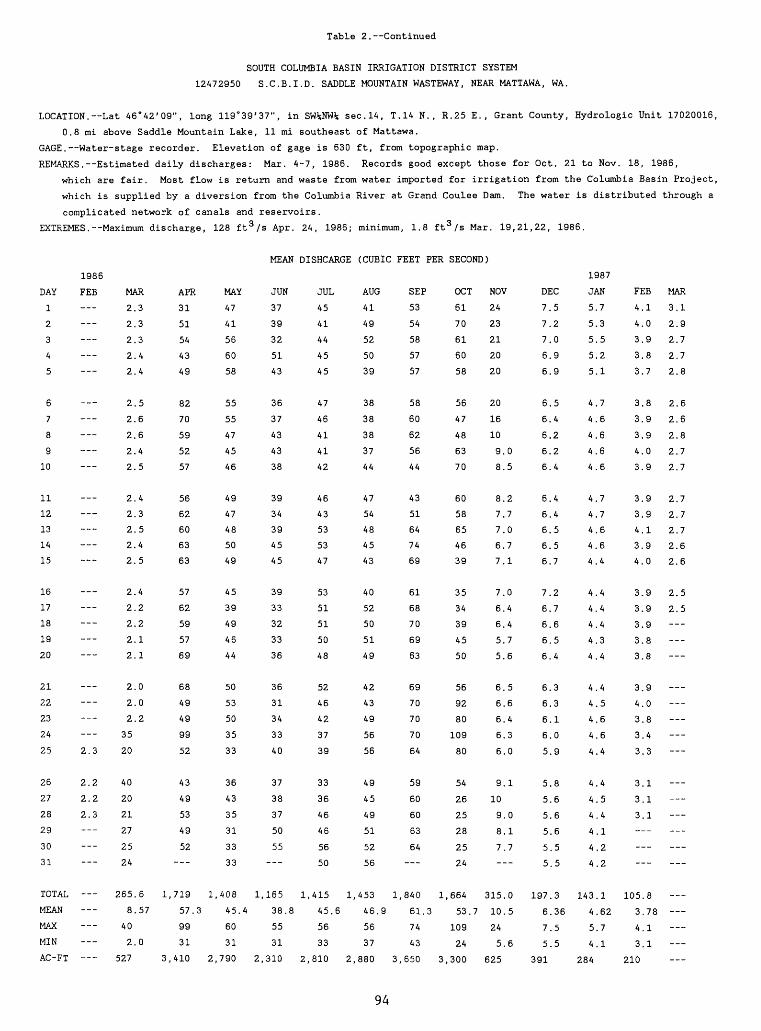
Table 2. Continued
SOUTH COLUMBIA BASIN IRRIGATION DISTRICT SYSTEM
12472950 S.C.B.I.D. SADDLE MOUNTAIN WASTEWAY, NEAR MATTAWA, WA.
LOCATION. Lat 46°42'09", long 119°39'37", in SW%NW% sec.14, T.14 N., R.25 E., Grant County, Hydrologic Unit 17020016,
0.8 mi above Saddle Mountain Lake, 11 mi southeast of Mattawa.
GAGE. Water-stage recorder. Elevation of gage is 630 ft, from topographic map.
REMARKS.--Estimated daily discharges: Mar. 4-7, 1986. Records good except those for Oct. 21 to Nov. 18, 1986,
which are fair. Most flow is return and waste from water imported for irrigation from the Columbia Basin Project,
which is supplied by a diversion from the Columbia River at Grand Coulee Dam. The water is distributed through a
complicated network of canals and reservoirs.
EXTREMES.--Maximum discharge, 128 ft 3 /s Apr. 24, 1986; minimum, 1.8 ft 3 /s Mar. 19,21,22, 1986.
MEAN DISHCARGE (CUBIC FEET PER SECOND)
1986
DAY FEE
1
2
3
4
5
6
7
8
9
10
11
12
13
14
15
16
17
18
19
20
21
22
23
24
25 2.3
26 2.2
27 2.2
28 2.3
29
30
31
TOTAL
MEAN
MAX
MINAC-FT
MAR
2.3
2.3
2.3
2.4
2.4
2.5
2.6
2.6
2.4
2.5
2.4
2.3
2.5
2.4
2.5
2.4
2.2
2.2
2.1
2.1
2.0
2.0
2.2
35
20
40
20
21
27
25
24
265.6
8.57
40
2.0
527
APR
31
51
54
43
49
82
70
59
52
57
56
62
60
63
63
57
62
59
57
69
68
49
49
99
52
43
49
53
49
52---
1,719
57.3
99
31
3,410
MAY
47
41
56
60
58
55
55
47
45
46
49
47
48
50
49
45
39
49
46
44
50
53
50
35
33
36
43
35
31
33
33
1,408
45.4
60
31
2,790
JUN
37
39
32
51
43
36
37
43
43
38
39
34
39
45
45
39
33
32
33
36
36
31
34
33
40
37
38
37
50
55---
1,165
38.8
55
31
2,310
JUL
45
41
44
45
45
47
46
41
41
42
46
43
53
53
47
53
51
51
50
48
52
46
42
37
39
33
36
46
46
56
50
1,415
45.6
56
33
2,810
AUG
41
49
52
50
39
38
38
38
37
44
47
54
48
45
43
40
52
50
51
49
42
43
49
56
56
49
45
49
51
52
56
1,453
46.9
56
37
2,880
SEP
53
54
58
57
57
58
60
62
56
44
43
51
64
74
69
61
68
70
69
63
69
70
70
70
64
59
60
60
63
64
1,840
61.3
74
43
3,650
OCT
61
70
61
60
58
56
47
48
63
70
60
58
65
46
39
35
34
39
45
50
56
92
80
109
80
54
26
25
28
25
24
1,664
53.7
109
24
3,300
NOV
24
23
21
20
20
20
16
10
9.0
8.5
8.2
7.7
7.0
6.7
7.1
7.0
6.4
6.4
5.7
5.6
6.5
6.6
6.4
6.3
6.0
9.1
10
9.0
8.1
7.7___
315.0
10.5
24
5.6
625
DEC
7.5
7.2
7.0
6.9
6.9
6.5
6.4
6.2
6.2
6.4
6.4
6.4
6.5
6.5
6.7
7.2
6.7
6.6
6.5
6.4
6.3
6.3
6.1
6.0
5.9
5.8
5.6
5.6
5.6
5.5
5.5
197.3
6.36
7.5
5.5
391
1987
JAN
5.7
5.3
5.5
5.2
5.1
4.7
4.6
4.6
4.6
4.6
4.7
4.7
4.6
4.6
4.4
4.4
4.4
4.4
4.3
4.4
4.4
4.5
4.6
4.6
4.4
4.4
4.5
4.4
4.1
4.2
4.2
143.1
4.62
5.7
4.1
284
FEE
4.1
4.0
3.9
3.8
3.7
3.8
3.9
3.9
4.0
3.9
3.9
3.9
4.1
3.9
4.0
3.9
3.9
3.9
3.8
3.8
3.9
4.0
3.8
3.4
3.3
3.1
3.1
3.1
105.8
3.78
4.1
3.1
210
MAR
3.1
2.9
2.7
2.7
2.8
2.6
2.6
2.8
2.7
2.7
2.7
2.7
2.7
2.6
2.6
2.5
2.5
___
___
94
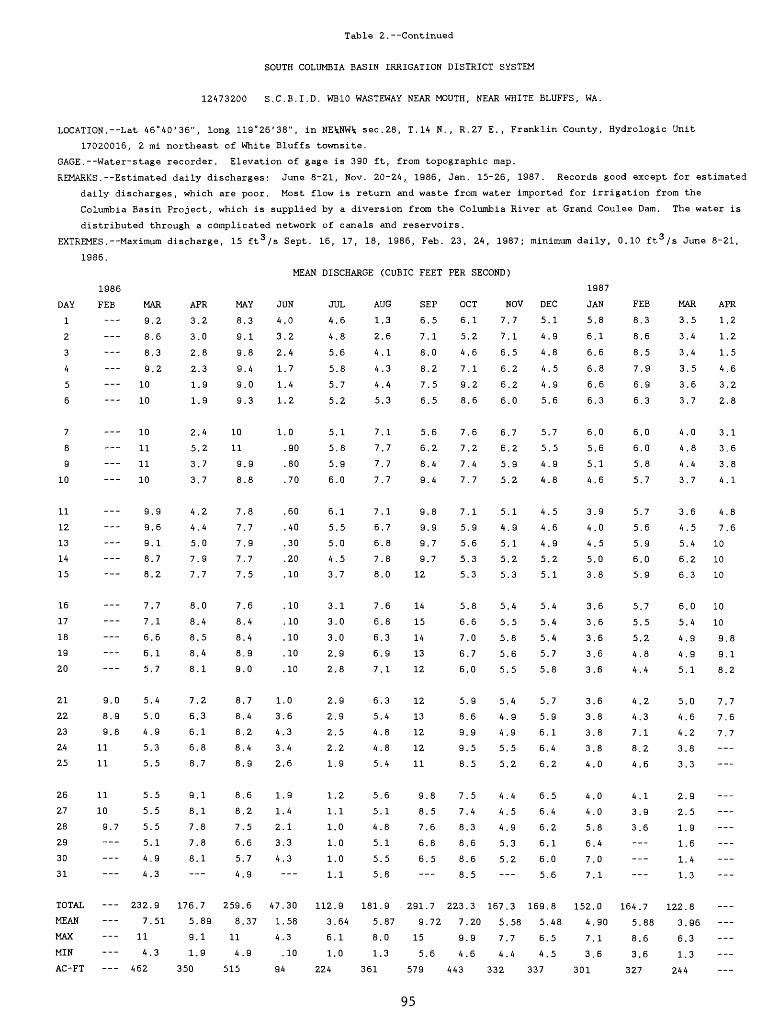
Table 2. Continued
SOUTH COLUMBIA BASIN IRRIGATION DISTRICT SYSTEM
12473200 S.C.B.I.D. WB10 WASTEWAY NEAR MOUTH, NEAR WHITE BLUFFS, WA.
LOCATION.--Lat 46°40'36", long 119°26'38", in NE%NW% sec.28, T.14 N., R.27 E., Franklin County, Hydrologic Unit
17020016, 2 mi northeast of White Bluffs townsite.
GAGE.--Water-stage recorder. Elevation of gage is 390 ft, from topographic map.
REMARKS. Estimated daily discharges: June 8-21, Nov. 20-24, 1986, Jan. 15-26, 1987. Records good except for estimated
daily discharges, which are poor. Most flow is return and waste from water imported for irrigation from the
Columbia Basin Project, which is supplied by a diversion from the Columbia River at Grand Coulee Dam. The water is
distributed through a complicated network of canals and reservoirs.
EXTREMES.--Maximum discharge, 15 ft 3 /s Sept. 16, 17, 18, 1986, Feb. 23, 24, 1987; minimum daily, 0.10 ft 3 /s June 8-21,
1986.
MEAN DISCHARGE (CUBIC FEET PER SECOND)
DAY
1
2
3
4
5
6
7
8
9
10
11
12
13
14
15
16
17
18
19
20
21
22
23
24
25
26
27
28
29
30
31
TOTAL
MEAN
MAX
MIN
AC -FT
1986
FEE MAR
9.2
8.6
8.3
9.2
10
10
10
11
11
10
9.9
9.6
9.1
8.7
8.2
7.7
7.1
6.6
6.1
5.7
9.0 5.4
8.9 5.0
9.8 4.9
11 5.3
11 5.5
11 5.5
10 5.5
9.7 5.5
5.1
4.9
4.3
232.9
7.51
11
4.3 462
APR
3.2
3.0
2.8
2.3
1.9
1.9
2.4
5.2
3.7
3.7
4.2
4.4
5.0
7.9
7.7
8.0
8.4
8.5
8.4
8.1
7.2
6.3
6.1
6.8
8.7
9.1
8.1
7.8
7.8
8.1
176.7
5.89
9.1
1.9
350
MAY
8.3
9.1
9.8
9.4
9.0
9.3
10
11
9.9
8.8
7.8
7.7
7.9
7.7
7.5
7.6
8.4
8.4
8.9
9.0
8.7
8.4
8.2
8.4
8.9
8.6
8.2
7.5
6.6
5.7
4.9
259.6
8.37
11
4.9
515
JUN
4.0
3.2
2.4
1.7
1.4
1.2
1.0
.90
.80
.70
.60
.40
.30
.20
.10
.10
.10
.10
.10
.10
1.0
3.6
4.3
3.4
2.6
1.9
1.4
2.1
3.3
4.3
47.30
1.58
4.3
.10
94
JUL
4.6
4.8
5.6
5.8
5.7
5.2
5.1
5.8
5.9
6.0
6.1
5.5
5.0
4.5
3.7
3.1
3.0
3.0
2.9
2.8
2.9
2.9
2.5
2.2
1.9
1.2
1.1
1.0
1.0
1.0
1.1
112.9
3.64
6.1
1.0
224
AUG
1.3
2.6
4.1
4.3
4.4
5.3
7.1
7.7
7.7
7.7
7.1
6.7
6.8
7.8
8.0
7.6
6.8
6.3
6.9
7.1
6.3
5.4
4.8
4.8
5.4
5.6
5.1
4.8
5.1
5.5
5.8
181.9
5.87
8.0
1.3
361
SEP
6.5
7.1
8.0
8.2
7.5
6.5
5.6
6.2
8.4
9.4
9.8
9.9
9.7
9.7
12
14
15
14
13
12
12
13
12
12
11
9.8
8.5
7.6
6.8
6.5
291.7
9.72
15
5.6
579
OCT
6.1
5.2
4.6
7.1
9.2
8.6
7.6
7.2
7.4
7.7
7.1
5.9
5.6
5.3
5.3
5.8
6.6
7.0
6.7
6.0
5.9
8.6
9.9
9.5
8.5
7.5
7.4
8.3
8.6
8.6
8.5
223.3
7.20
9.9
4.6
443
NOV
7.7
7.1
6.5
6.2
6.2
6.0
6.7
6.2
5.9
5.2
5.1
4.9
5.1
5.2
5.3
5.4
5.5
5.8
5.6
5.5
5.4
4.9
4.9
5.5
5.2
4.4
4.5
4.9
5.3
5.2___
167.3
5.58
7.7
4.4
332
DEC
5.1
4.9
4.8
4.5
4.9
5.6
5.7
5.5
4.9
4.8
4.5
4.6
4.9
5.2
5.1
5.4
5.4
5.4
5.7
5.8
5.7
5.9
6.1
6.4
6.2
6.5
6.4
6.2
6.1
6.0
5.6
169.8
5.48
6.5
4.5
337
1987
JAN
5.8
6.1
6.6
6.8
6.6
6.3
6.0
5.6
5.1
4.6
3.9
4.0
4.5
5.0
3.8
3.6
3.6
3.6
3.6
3.6
3.6
3.8
3.8
3.8
4.0
4.0
4.0
5.8
6.4
7.0
7.1
152.0
4.90
7.1
3.6
301
FEE
8.3
8.6
8.5
7.9
6.9
6.3
6.0
6.0
5.8
5.7
5.7
5.6
5.9
6.0
5.9
5.7
5.5
5.2
4.8
4.4
4.2
4.3
7.1
8.2
4.6
4.1
3.9
3.6
164.7
5.88
8.6
3.6
327
MAR
3.5
3.4
3.4
3.5
3.6
3.7
4.0
4.8
4.4
3.7
3.6
4.5
5.4
6.2
6.3
6.0
5.4
4.9
4.9
5.1
5.0
4.6
4.2
3.8
3.3
2.9
2.5
1.9
1.6
1.4
1.3
122.8
3.96
6.3
1.3
244
APR
1.2
1.2
1.5
4.6
3.2
2.8
3.1
3.6
3.8
4.1
4.8
7.6
10
10
10
10
10
9.8
9.1
8.2
7.7
7.6
7.7
___
95
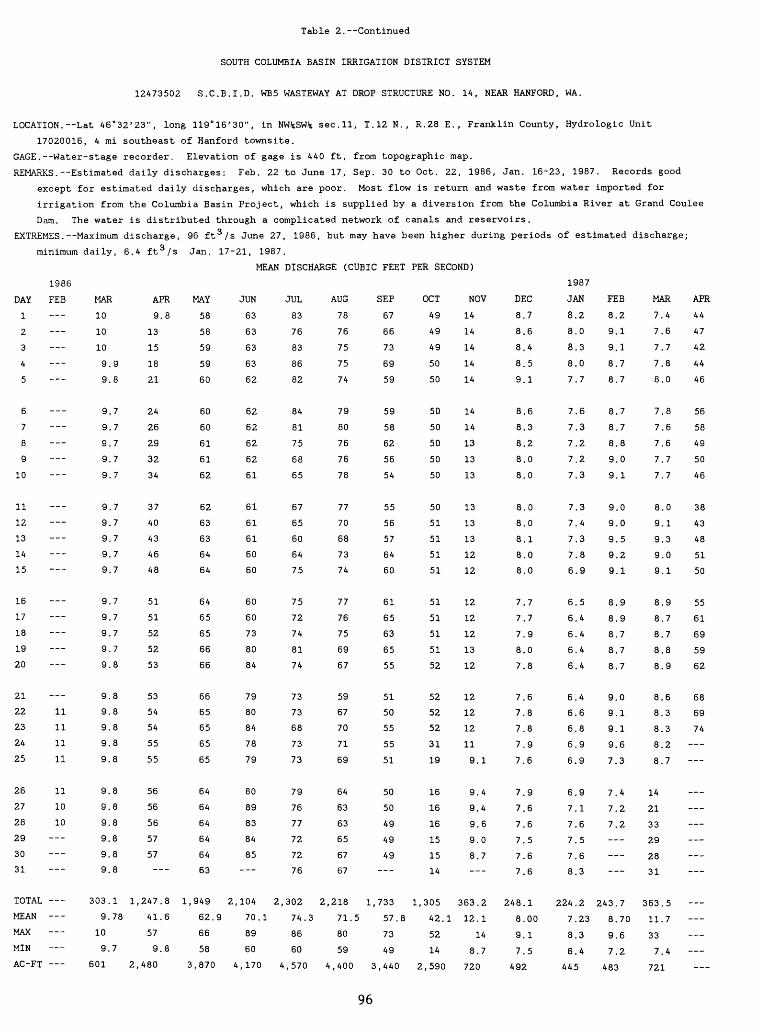
Table 2. Continued
SOUTH COLUMBIA BASIN IRRIGATION DISTRICT SYSTEM
12473502 S.C.B.I.D. WB5 WASTEWAY AT DROP STRUCTURE NO. 14, NEAR HANFORD, WA.
LOCATION.--Lat 46°32'23", long 119°16'30", in NW%SW% sec.11, T.12 N., R.28 E., Franklin County, Hydrologic Unit
17020016, 4 mi southeast of Hanford townsite.
GAGE.--Water-stage recorder. Elevation of gage is 440 ft, from topographic map.
REMARKS.--Estimated daily discharges: Feb. 22 to June 17, Sep. 30 to Oct. 22, 1986, Jan. 16-23, 1987. Records good
except for estimated daily discharges, which are poor. Most flow is return and waste from water imported for
irrigation from the Columbia Basin Project, which is supplied by a diversion from the Columbia River at Grand Coulee
Dam. The water is distributed through a complicated network of canals and reservoirs.
EXTREMES.--Maximum discharge, 96 ft 3 /s June 27, 1986, but may have been higher during periods of estimated discharge;
minimum daily, 6.4 ft 3 /s Jan. 17-21, 1987.
MEAN DISCHARGE (CUBIC FEET PER SECOND)
1986
DAY FEE
12 -
34
5
6
7
8
9
10
11
12
13
14
15
16
17
18
19
20
21
22 11
23 11
24 11
25 11
26 11
27 10
28 10
29
30
31
TOTAL
MEAN -
MAX
MINAC-FT
MAR
10
10
10
9.9
9.8
9.7
9.7
9.7
9.7
9.7
9.7
9.7
9.7
9.7
9.7
9.7
9.7
9.7
9.7
9.8
9.8
9.8
9.8
9.8
9.8
9.8
9.8
9.8
9.8
9.8
9.8
303.1
9.78
10
9.7
601
APR
9.8
13
15
18
21
24
26
29
32
34
37
40
43
46
48
51
51
52
52
53
53
54
54
55
55
56
56
56
57
57___
1,247.8
41.6
57
9.8
2,480
MAY
58
58
59
59
60
60
60
61
61
62
62
63
63
64
64
64
65
65
66
66
66
65
65
65
65
64
64
64
64
64
63
1,949
62.9
66
58
3,870
JUN
63
63
63
63
62
62
62
62
62
61
61
61
61
60
60
60
60
73
80
84
79
80
84
78
79
80
89
83
84
85
2,104
70.1
89
60
4,170
JUL
83
76
83
86
82
84
81
75
68
65
67
65
60
64
75
75
72
74
81
74
73
73
68
73
73
79
76
77
72
72
76
2,302
74.3
86
60
4,570
AUG
78
76
75
75
74
79
80
76
76
78
77
70
68
73
74
77
76
75
69
67
59
67
70
71
69
64
63
63
65
67
67
2,218
71.5
80
59
4,400
SEP
67
66
73
69
59
59
58
62
56
54
55
56
57
64
60
61
65
63
65
55
51
50
55
55
51
50
50
49
49
49
1,733
57.8
73
49
3,440
OCT
49
49
49
50
50
50
50
50
50
50
50
51
51
51
51
51
51
51
51
52
52
52
52
31
19
16
16
16
15
15
14
1,305
42.1
52
14
2,590
NOV
14
14
14
14
14
14
14
13
13
13
13
13
13
12
12
12
12
12
13
12
12
12
12
11
9.1
9.4
9.4
9.6
9.0
8.7
363.2
12.1
14
8.7
720
DEC
8.7
8.6
8.4
8.5
9.1
8.6
8.3
8.2
8.0
8.0
8.0
8.0
8.1
8.0
8.0
7.7
7.7
7.9
8.0
7.8
7.6
7.8
7.8
7.9
7.6
7.9
7.6
7.6
7.5
7.6
7.6
248.1
8.00
9.1
7.5
492
1987
JAN
8.2
8.0
8.3
8.0
7.7
7.6
7.3
7.2
7.2
7.3
7.3
7.4
7.3
7.8
6.9
6.5
6.4
6.4
6.4
6.4
6.4
6.6
6.8
6.9
6.9
6.9
7.1
7.6
7.5
7.6
8.3
224.2
7.23
8.3
6.4
445
FEE
8.2
9.1
9.1
8.7
8.7
8.7
8.7
8.8
9.0
9.1
9.0
9.0
9.5
9.2
9.1
8.9
8.9
8.7
8.7
8.7
9.0
9.1
9.1
9.6
7.3
7.4
7.2
7.2
243.7
8.70
9.6
7.2
483
MAR
7.4
7.6
7.7
7.8
8.0
7.8
7.6
7.6
7.7
7.7
8.0
9.1
9.3
9.0
9.1
8.9
8.7
8.7
8.8
8.9
8.6
8.3
8.3
8.2
8.7
14
21
33
29
28
31
363.5
11.7
33
7.4
721
APR
44
47
42
44
46
56
58
49
50
46
38
43
48
51
50
55
61
69
59
62
68
69
74
___
96
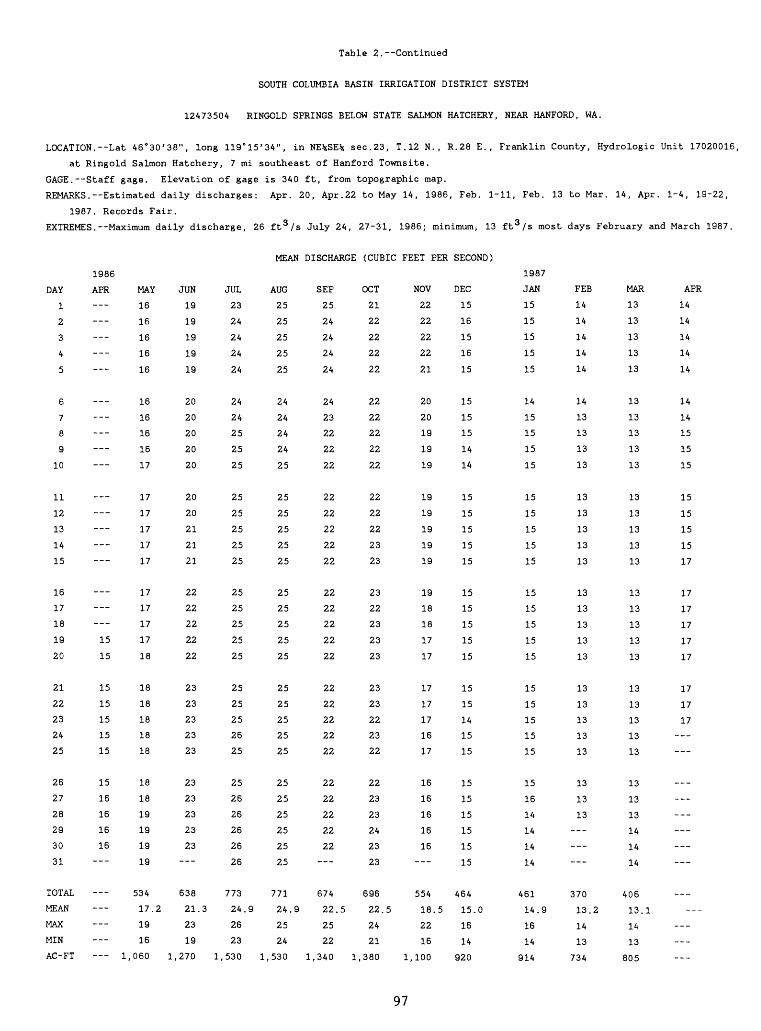
Table 2. Continued
SOUTH COLUMBIA BASIN IRRIGATION DISTRICT SYSTEM
12473504 RINGOLD SPRINGS BELOW STATE SALMON HATCHERY, NEAR HANFORD, WA.
LOCATION.--Lat 46°30'38", long 119°15'34", in NE%SE% sec.23, T.12 N., R.28 E., Franklin County, Hydrologic Unit 17020016,
at Ringold Salmon Hatchery, 7 mi southeast of Hanford Townsite.
GAGE. Staff gage. Elevation of gage is 340 ft, from topographic map.
REMARKS.--Estimated daily discharges: Apr. 20, Apr.22 to May 14, 1986, Feb. 1-11, Feb. 13 to Mar. 14, Apr. 1-4, 19-22,
1987. Records Fair.
EXTREMES. Maximum daily discharge, 26 ft 3 /s July 24, 27-31, 1986; minimum, 13 ft 3 /s most days February and March 1987.
MEAN DISCHARGE (CUBIC FEET PER SECOND)
DAY
1
2
3
4
5
6
7
8
9
10
11
12
13
14
15
16
17
18
19
20
21
22
23
24
25
26
27
28
29
30
31
TOTAL
MEAN
MAX
MIN
AC-FT
1986
APR
---
15
15
15
15
15
15
15
15
16
16
16
16---
-
MAY
16
16
16
16
16
16
16
16
16
17
17
17
17
17
17
17
17
17
17
18
18
18
18
18
18
18
18
19
19
19
19
534
17.2
19
16
1,060
JUN
19
19
19
19
19
20
20
20
20
20
20
20
21
21
21
22
22
22
22
22
23
23
23
23
23
23
23
23
23
23
638
21.3
23
19
1,270
JUL
23
24
24
24
24
24
24
25
25
25
25
25
25
25
25
25
25
25
25
25
25
25
25
26
25
25
26
26
26
26
26
773
24.9
26
23
1,530
AUG
25
25
25
25
25
24
24
24
24
25
25
25
25
25
25
25
25
25
25
25
25
25
25
25
25
25
25
25
25
25
25
771
24.9
25
24
1,530
SEP
25
24
24
24
24
24
23
22
22
22
22
22
22
22
22
22
22
22
22
22
22
22
22
22
22
22
22
22
22
22
674
22.5
25
22
1,340
OCT
21
22
22
22
22
22
22
22
22
22
22
22
22
23
23
23
22
23
23
23
23
23
22
23
22
22
23
23
24
23
23
696
22.5
24
21
1,380
NOV
22
22
22
22
21
20
20
19
19
19
19
19
19
19
19
19
18
18
17
17
17
17
17
16
17
16
16
16
16
16---
554
18.5
22
16
1,100
DEC
15
16
15
16
15
15
15
15
14
14
15
15
15
15
15
15
15
15
15
15
15
15
14
15
15
15
15
15
15
15
15
464
15.0
16
14
920
1987
JAN
15
15
15
15
15
14
15
15
15
15
15
15
15
15
15
15
15
15
15
15
15
15
15
15
15
15
16
14
14
14
14
461
14.9
16
14
914
FEE
14
14
14
14
14
14
13
13
13
13
13
13
13
13
13
13
13
13
13
13
13
13
13
13
13
13
13
13
---
370
13.2
14
13
734
MAR
13
13
13
13
13
13
13
13
13
13
13
13
13
13
13
13
13
13
13
13
13
13
13
13
13
13
13
13
14
14
14
406
13.1
14
13
805
APR
14
14
14
14
14
14
14
15
15
15
15
15
15
15
17
17
17
17
17
17
17
17
17
___
___
___
97
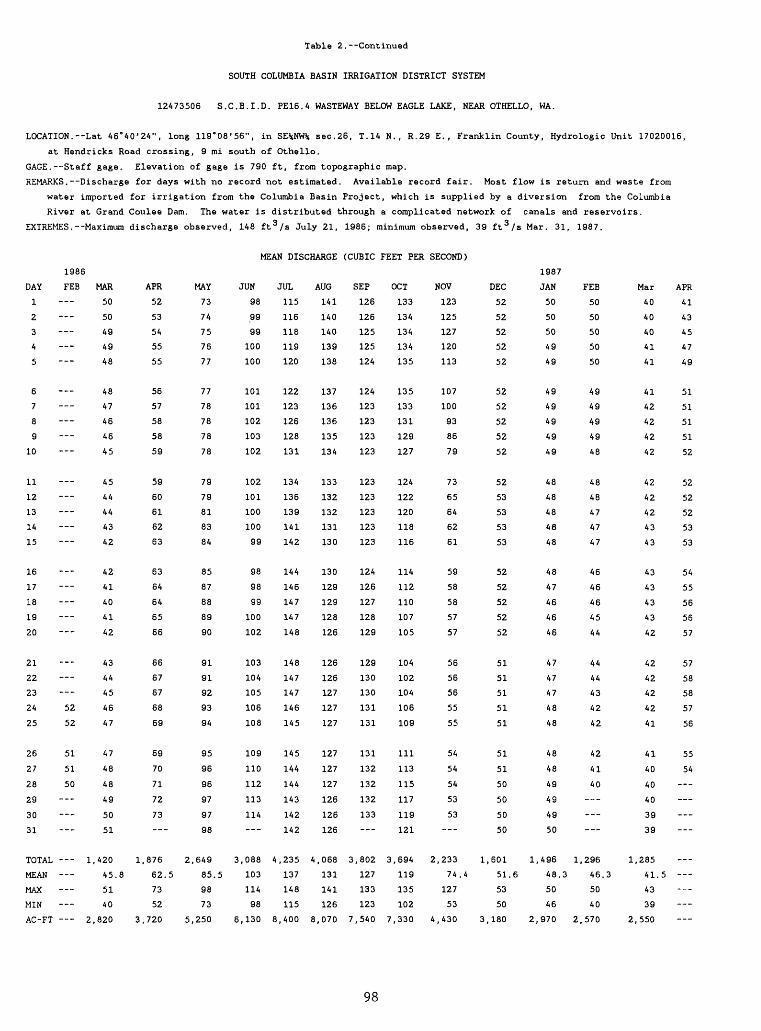
Table 2. Continued
SOUTH COLUMBIA BASIN IRRIGATION DISTRICT SYSTEM
12473506 S.C.B.I.D. PE16.4 WASTEWAY BELOW EAGLE LAKE, NEAR OTHELLO, WA.
LOCATION.--Lat 46°40'24", long lig'OS'Se", in SE%NW% sec.26, T.14 N., R.29 E., Franklin County, Hydrologic Unit 17020016,
at Hendricks Road crossing, 9 mi south of Othello.
GAGE. Staff gage. Elevation of gage is 790 ft, from topographic map.
REMARKS.--Discharge for days with no record not estimated. Available record fair. Most flow is return and waste from
water imported for irrigation from the Columbia Basin Project, which is supplied by a diversion from the Columbia
River at Grand Coulee Dam. The water is distributed through a complicated network of canals and reservoirs.
EXTREMES.--Maximum discharge observed, 148 ft 3 /s July 21, 1986; minimum observed, 39 ft 3 /s Mar. 31, 1987.
MEAN DISCHARGE (CUBIC FEET PER SECOND)
1986
DAY FEE1
2
3
45
6
7
8
9
10
11
12
13
14
15
16
17
18
1920
21
2223
24 52
25 52
26 51
27 51
28 50
29
30
31
TOTAL
MEAN
MAX
MINAC-FT
MAR
50
50
49
49
48
48
47
46
46
45
45
44
44
43
42
42
41
40
41
42
43
44
45
46
47
47
48
48
49
50
51
1,420
45.8
51
40
2,820
APR
52
53
54
55
55
56
57
58
58
59
59
60
61
62
63
63
64
64
65
66
66
67
67
68
69
69
70
71
72
73---
1,876
62.5
73
52
3,720
MAY
73
74
75
76
77
77
78
78
78
78
79
79
81
83
84
85
87
88
89
90
91
91
92
93
94
95
96
96
97
97
98
2,649
85.5
98
73
5,250
JUN
98
99
99
100
100
101
101
102
103
102
102
101
100
100
99
98
98
99
100
102
103
104
105
106
108
109
110
112
113
114---
3,088
103
114
98
6,130
JUL
115
116
118
119
120
122
123
126
128
131
134
136
139
141
142
144
146
147
147
148
148
147
147
146
145
145
144
144
143
142
142
4,235
137
148
115
8,400
AUG
141
140
140
139
138
137
136
136
135
134
133
132
132
131
130
130
129
129
128
126
126
126
127
127
127
127
127
127
126
126
126
4,068
131
141
126
8,070
SEP
126
126
125
125
124
124
123
123
123
123
123
123
123
123
123
124
126
127
128
129
129
130
130
131
131
131
132
132
132
133
3,802
127
133
123
7,540
OCT
133
134
134
134
135
135
133
131
129
127
124
122
120
118
116
114
112
110
107
105
104
102
104
106
109
111
113
115
117
119
121
3,694
119
135
102
7,330
NOV
123
125
127
120
113
107
100
93
86
79
73
65
64
62
61
59
58
58
57
57
56
56
56
55
55
54
54
54
53
53
2,233
74 .4
127
53
4,430
DEC
52
52
52
52
52
52
52
52
52
52
52
53
53
53
53
52
52
52
52
52
51
51
51
51
51
51
51
50
50
50
50
1,601
51.6
53
50
3,180
1987
JAN
50
50
50
49
49
49
49
49
49
49
48
48
48
48
48
48
47
46
46
46
47
47
47
48
48
48
48
49
49
49
50
1,496
48.
50
46
2,970
FEE
50
50
50
50
50
49
49
49
49
48
48
48
47
47
47
46
46
46
45
44
44
44
43
42
42
42
41
40
---
1,296
,3 46.3
50
40
2,570
Mar
40
40
40
41
41
41
42
42
42
42
42
42
42
43
43
43
43
43
43
42
42
42
42
42
41
41
40
40
40
39
39
1,285
41.5
43
39
2,550
APR
41
43
45
47
49
51
51
51
51
52
52
52
52
53
53
54
55
56
56
57
57
58
58
57
56
55
54
---
___
98
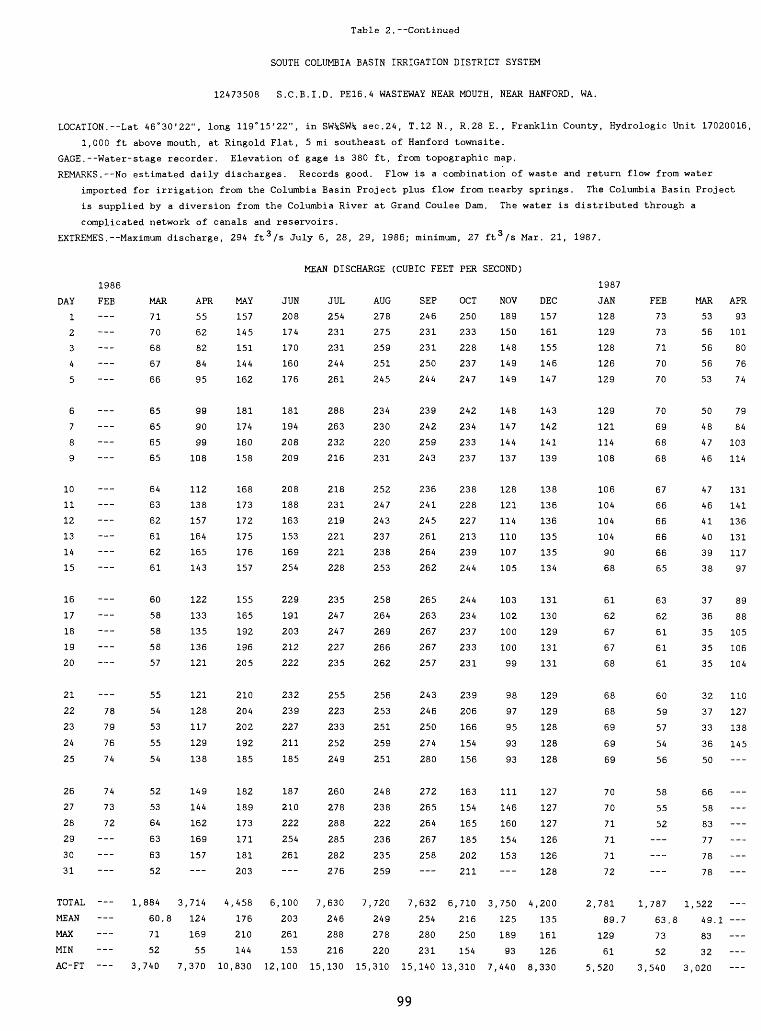
Table 2. Continued
SOUTH COLUMBIA BASIN IRRIGATION DISTRICT SYSTEM
12473508 S.C.B.I.D. PE16.4 WASTEWAY NEAR MOUTH, NEAR HANFORD, WA.
LOCATION.--Lat 46°30'22", long 119°15'22", in SW%SW% sec.24, T.12 N., R.28 E., Franklin County, Hydrologic Unit 17020016,
1,000 ft above mouth, at Ringold Flat, 5 mi southeast of Hanford townsite.
GAGE.--Water-stage recorder. Elevation of gage is 380 ft, from topographic map.
REMARKS.--No estimated daily discharges. Records good. Flow is a combination of waste and return flow from water
imported for irrigation from the Columbia Basin Project plus flow from nearby springs. The Columbia Basin Project
is supplied by a diversion from the Columbia River at Grand Coulee Dam. The water is distributed through a
complicated network of canals and reservoirs.
EXTREMES.--Maximum discharge, 294 ft 3 /s July 6, 28, 29, 1986; minimum, 27 ft 3 /s Mar. 21, 1987.
MEAN DISCHARGE (CUBIC FEET PER SECOND)
1986
DAY FEE
1
2
3
4
5
6
7
8
9
10
11
12
13
14
15
16
17
18
19
20
21
22 78
23 79
24 76
25 74
26 74
27 73
28 72
29
30
31
TOTAL -
MEAN
MAX
MINAC-FT
MAR
71
70
68
67
66
65
65
65
65
64
63
62
61
62
61
60
58
58
58
57
55
54
53
55
54
52
53
64
63
63
52
1,884
60.8
71
52
3,740
APR
55
62
82
84
95
99
90
99
108
112
138
157
164
165
143
122
133
135
136
121
121
128
117
129
138
149
144
162
169
157
3,714
124
169
55
7,370
MAY
157
145
151
144
162
181
174
160
158
168
173
172
175
176
157
155
165
192
196
205
210
204
202
192
185
182
189
173
171
181
203
4,458
176
210
144
10,830
JUN
208
174
170
160
176
181
194
208
209
208
188
163
153
169
254
229
191
203
212
222
232
239
227
211
185
187
210
222
254
261___
6,100
203
261
153
12,100
JUL
254
231
231
244
261
288
263
232
216
218
231
219
221
221
228
235
247
247
227
235
255
223
233
252
249
260
278
288
285
282
276
7,630
246
288
216
15,130
AUG
278
275
259
251
245
234
230
220
231
252
247
243
237
238
253
258
264
269
266
262
256
253
251
259
251
248
238
222
236
235
259
7,720
249
278
220
15,310
SEP
246
231
231
250
244
239
242
259
243
236
241
245
261
264
262
265
263
267
267
257
243
246
250
274
280
272
265
264
267
258
7,632
254
280
231
15,140
OCT
250
233
228
237
247
242
234
233
237
238
228
227
213
239
244
244
234
237
233
231
239
206
166
154
156
163
154
165
185
202
211
6,710
216
250
154
13,310
NOV
189
150
148
149
149
148
147
144
137
128
121
114
110
107
105
103
102
100
100
99
98
97
95
93
93
111
146
160
154
153
3,750
125
189
93
7,440
DEC
157
161
155
146
147
143
142
141
139
138
136
136
135
135
134
131
130
129
131
131
129
129
128
128
128
127
127
127
126
126
128
4,200
135
161
126
8,330
1987
JAN
128
129
128
126
129
129
121
114
108
106
104
104
104
90
68
61
62
67
67
68
68
68
69
69
69
70
70
71
71
71
72
2,781
89.7
129
61
5,520
FEE
73
73
71
70
70
70
69
68
68
67
66
66
66
66
65
63
62
61
61
61
60
59
57
54
56
58
55
52
-
1,787
63. £
73
52
3,540
MAR
53
56
56
56
53
50
48
47
46
47
46
41
40
39
38
37
36
35
35
35
32
37
33
36
50
66
58
83
77
78
78
1,522
5 49.1
83
32
3,020
APR
93
101
80
76
74
79
84
103
114
131
141
136
131
117
97
89
88
105
106
104
110
127
138
145 -
___
___
99
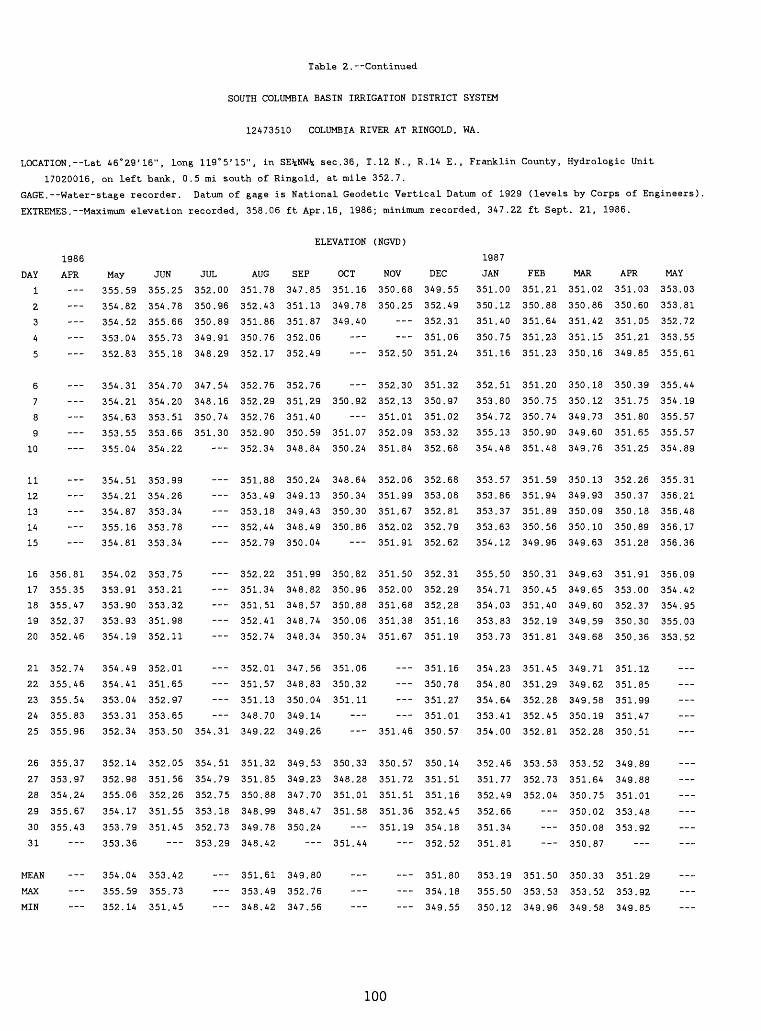
Table 2.--Continued
SOUTH COLUMBIA BASIN IRRIGATION DISTRICT SYSTEM
12473510 COLUMBIA RIVER AT RINGOLD, WA.
LOCATION.--Lat 46°29'16", long 119°5'15", in SE%NW% sec.36, T.12 N., R.14 E., Franklin County, Hydrologic Unit
17020016, on left bank, 0.5 mi south of Ringold, at mile 352.7.
GAGE. Water-stage recorder. Datum of gage is National Geodetic Vertical Datum of 1929 (levels by Corps of Engineers),
EXTREMES.--Maximum elevation recorded, 358.06 ft Apr.16, 1986; minimum recorded, 347.22 ft Sept. 21, 1986.
ELEVATION (NGVD)
DAY
1
2
3
4
5
6
7
8
9
10
11
12
13
14
15
16
17
18
19
20
21
22
23
24
25
26
27
28
29
30
31
MEAN
MAX
MIN
1986
APR
---
-
356.81
355.35
355.47
352.37
352.46
352.74
355.46
355.54
355.83
355.96
355.37
353.97
354.24
355.67
355.43---
___
May
355.59
354.82
354.52
353.04
352.83
354.31
354.21
354.63
353.55
355.04
354.51
354.21
354.87
355.16
354.81
354.02
353.91
353.90
353.93
354.19
354.49
354.41
353.04
353.31
352.34
352.14
352.98
355.06
354.17
353.79
353.36
354.04
355.59
352.14
JUN
355.25
354.78
355.66
355.73
355.18
354.70
354.20
353.51
353.66
354.22
353.99
354.26
353.34
353.78
353.34
353.75
353.21
353.32
351.98
352.11
352.01
351.65
352.97
353.65
353.50
352.05
351.56
352.26
351.55
351.45
353.42
355.73
351.45
JUL
352.
350.
350.
349.
348.
347.
348.
350.
351.-
-
-
-
-
-
-
-
-
-
-
-
-
-
-
354.
354.
354.
352.
353.
352.
353.
-
-
-
00
96
89
91
29
54
16
74
30--
--
--
--
--
--
--
--
--
--
31
51
79
75
18
73
29
--
AUG
351.78
352.43
351.86
350.76
352.17
352.76
352.29
352.76
352.90
352.34
351.88
353.49
353.18
352.44
352.79
352.22
351.34
351.51
352.41
352.74
352.01
351.57
351.13
348.70
349.22
351.32
351.85
350.88
348.99
349.78
348.42
351.61
353.49
348.42
SEP
347.85
351.13
351.87
352.06
352.49
352.76
351.29
351.40
350.59
348.84
350.24
349.13
349.43
348.49
350.04
351.99
348.82
348.57
348.74
348.34
347.56
348.83
350.04
349.14
349.26
349.53
349.23
347.70
348.47
350.24---
349.80
352.76
347.56
OCT
351.16
349.78
349.40
350.92
351.07
350.24
348.64
350.34
350.30
350.86
350.82
350.96
350.88
350.06
350.34
351.06
350.32
351.11
---
350.33
348.28
351.01
351.58
351.44
___
NOV
350.68
350.25
352.50
352.30
352.13
351.01
352.09
351.84
352.06
351.99
351.67
352.02
351.91
351.50
352.00
351.68
351.38
351.67
351.46
350.57
351.72
351.51
351.36
351.19---
___
DEC
349.
352.
352.
351.
351.
351.
350.
351.
353.
352.
352.
353.
352.
352.
352.
352.
352.
352.
351.
351.
351.
350.
351.
351.
350,
350,
351
351
352,
354
352
351
354
349
,55
49
31
,06
24
32
97
02
32
68
68
08
81
,79
62
31
29
28
,16
,19
.16
.78
.27
.01
.57
.14
.51
.16
.45
.18
.52
.80
.18
.55
1987
JAN
351.00
350.12
351.40
350.75
351.16
352.51
353.80
354.72
355.13
354.48
353.57
353.86
353.37
353.63
354.12
355.50
354.71
354.03
353.83
353.73
354.23
354.80
354.64
353.41
354.00
352.46
351.77
352.49
352.66
351.34
351.81
353.19
355.50
350.12
FEE
351.21
350.88
351.64
351.23
351.23
351.20
350.75
350.74
350.90
351.48
351.59
351.94
351.89
350.56
349.96
350.31
350.45
351.40
352.19
351.81
351.45
351.29
352.28
352.45
352.81
353.53
352.73
352.04
---
351.50
353.53
349.96
MAR
351.02
350.86
351.42
351.15
350.16
350.18
350.12
349.73
349.60
349.76
350.13
349.93
350.09
350.10
349.63
349.63
349.65
349.60
349.59
349.68
349.71
349.62
349.58
350.19
352.28
353.52
351.64
350.75
350.02
350.08
350.87
350.33
353.52
349.58
APR
351.03
350.60
351.05
351.21
349.85
350.39
351.75
351.80
351.65
351.25
352.26
350.37
350.18
350.89
351.28
351.91
353.00
352.37
350.30
350.36
351.12
351.85
351.99
351.47
350.51
349.89
349.88
351.01
353.48
353.92
351.29
353.92
349.85
MAY
353.03
353.81
352.72
353.55
355.61
355.44
354.19
355.57
355.57
354.89
355.31
356.21
356.48
356.17
356.36
356.09
354.42
354.95
355.03
353.52
---
___
100

Table 2. Continued
FRANKLIN COUNTY IRRIGATION DISTRICT SYSTEM
12A73560 F.C.I.D. CANAL WASTEWAY AT PASCO, WA.
LOCATION.--Lat A6°15'29", long 119°08'30", in SE^SE* sec.lA, T.9 N., R.29 E., Franklin County, Hydrologic Unit 17020016,
1,000 ft north of the intersection of Argent Road and Road AO.
GAGE. Water-stage recorder. Elevation of gage is A20 ft, from topographic map.
REMARKS.--No estimated daily discharges. Records poor. All flow is irrigation waste. The F.C.I.D. system is supplied
by two pumping stations which pump from the Columbia River; one is about 5 mi upstream and the second is about
2.5 mi upstream.
EXTREMES. Maximum discharge, 16 ft 3 /s May 21; there is flow only during irrigation season.
MEAN DISCHARGE (CUBIC FEET PER SECOND)
DAY
1
2
3
A
5
6
7
8
9
10
11
12
13
14
15
16
17
18
19
20
21
22
23
2A
25
26
27
28
29
30
31
TOTAL
MEAN
MAX
MIN
AC -FT
1986
MAR
0.00
.00
.00
.00
.00
.00
.00
.00
.00
.00
.00
.00
.00
.00
.00
.00
.00
.00
.00
.00
.00
.00
.00
3.0
6.7
A. 8
A. A
3.5
2. A
3.2
2.0
30.00
.97
6.7
.00
60
1987
APR
1
1
1
2
1
1
1
1
1
2
2
2
1
1
1
1
1
2
1
1
1
2
1
2
1-
A5
1
2
89
.0
.2
.7
.1
.3
.6
.5
.1
.AA
.2
.0
.3
.9
.7
.6
.3
.A
.9
.96
.0
.71
.69
.A9
.2
.2
.3
.A
.8
.A
.7--
.09
.50
.9
.44
MAY
1.
2.
2.
1.
1.
1,
2.
2.
1.
2.
1.
1.
1.
3.
3.
1.
2.
1.
2.
5.
2.
1.
1.
1,
1.
1.
1.
1.
1.
1.
60.
1.
5.
120
,7
,0
,57
,A
,6
.6
,5
,A
,9
,8
,0
,A
,8
,0
,5
,2
,9
,5
7
1
7
2
5
,3
,6
2
.9
,5
.1
,3
.8
.67
.96
.7
.57
1
1
1
1
2
2
1
1
1
1
1
2
1
1
1
1
1
1
2
1
2
1
1
3
2
1
2
3
1-
53
1
3
105
JUN
.9
.9
.7
.7
.A
.7
.A
.1
.72
.A
.0
.7
.0
.8
.2
.2
.5
.A
.0
.0
.2
.5
.A
.4
.2
.A
.9
.3
.3
.7--
.02
.77
.3
.72
JUL
1.
2.
1.
2.
1,
2.
1.
3.
1,
1.
2.
1.
1.
1.
2.
2.
2.
1.
1.
1.
1.
2.
2.
1.
2.
2.
1,
1.
2.
1.
58.
1.
3.
117
,8
,7
,7
,A
,1
.0
.7
.1
.9
.3
,5
,A
,8
.6
.1
.3
46
,2
7
A
7
5
5
,9
,5
.A
.0
.6
.7
.2
.8
.96
.90
.1
.A6
AUG
A
1
2
1
2
2
A
A
3
3
5
6
A
A
A
5
3
3
5
1
2
2
2
3
2
A
3
3
3
2
2
105
3.
6.
1
209
.6
.2
.5
.A
.0
.5
.1
.2
.7
.1
.1
.1
.A
.2
.9
.0
.7
.1
.1
.2
.9
.6
.8
.5
.9
.2
.0
.3
.A
.3
.2
.2
39
1
.2
SEP
2
2
A
2
2
2
2
3
1
1
2
2
1
2
1
2
1
1
1
1
1
1
1
2
1
1
1
1
2-
60
2
A
121
.1
.A
.2
.6
.6
.3
.8
.7
.5
.7
.8A
.2
.2
.6
.1
.8
.A
.A
.3
.8
.6
.7
.9
.5
.2
.8
.5
.6
.5
.0--
.84
.03
.2
.84
OCT
1.
1.
1.
2.
1.
1.
2.
2.
2.
2.
3.
2.
1.
2.
1.
2.
1.
2.
35
1
3
71
1
3
2
1
7
1
2
5
8
50
9
0
3
5
3
6
0
7
1
00
00
00
00
00
00
00
00
00
00
00
00
.90
.16
.0
.00
MAR
0.00
.00
.00
.00
.00
.00
.00
.00
.00
.00
.00
.00
.00
.00
.00
.00
.00
.00
.00
1.6
6.7
7. A
7.6
6. A
5.8
5.5
A. 2
6.3
6. A
A. 9
3. A
66.20
2.14
7.6
.00
131
APR
1
2
3
3
3
3
1
1
1
1
1
1
1
A
7
A
2
1
2
56
1
7
112
.3
.6
.2
.5
.1
.1
.1
.7
.A
.0
.6
.80
.67
.58
.2
.5
.9
.7
.3
.4
.83
.3
.27
.95
.82
.34
.28
.65
.75
.8
.6A
.89
.7
.27
MAY
3.2
2.2
2.2
.26
.96
.92
.96
.66
.75
.69
1.1
1.7
1.1
l.A
1.5
l.A
.87
1.1
.55
1.1
.76
.39
1.7
1.6
.78
.98
1.1
.57
.52
1.3
.96
35.28
1.14
3.2
.26
70
JUN
0
2
1
1
1
1
1
1
1
1
1
1
1
1
1
28
2
57
.74
.AO
.71
.92
.0
.87
.55
.2
.2
.A
.73
.1
.50
.96
.A
.84
.0
.2
.2
.2
.66
.61
.68
.90
.26
.2
.2
.3
.AA
.6
.97
.97
.0
.26
JUL
1.
1.
2.
1.
1.
1.
1.
1.
1.
1.
1.
3.
A.
A.
1.
1.
4.
1.
1.
1.
1.
1.
50.
1,
4.
99
,0
,1
.1
,5
.8
.88
.0
.84
,7
.9
.3
.86
.88
,1
.70
.7
,0
,1
7
A
98
69
5
,93
,6
.5
.8
,0
.6
.50
.A
.06
.61
.7
.50
AUG
0.
1.
1.
1.
1.
1.
1.
1.
1.
1.
1.
1.
1.
1.
1.
1.
1.
32,
1,
1.
6A
.98
,88
.6
,1
.2
,9A
.4
.8
.1
.72
,81
.2
,5
,1
,78
.69
,1
.1
1
99
A
,1
,36
,7A
,A1
.91
.96
.1
.6
.86
.73
.26
,OA
.8
.36
SEP
1
1
1
1
1
1
1
1
1
1
1
1
1
1
1
2
1
2
1
1
1-
3A
1
2
69
.3
.5
.5
.94
.0
.0
.30
.5
.97
.1
.88
.62
.3
.1
.2
.94
.74
.2
.90
.2
.2
.71
.2
.4
.3
.0
.2
.0
.4
.1--
.70
.16
.3
.30
101
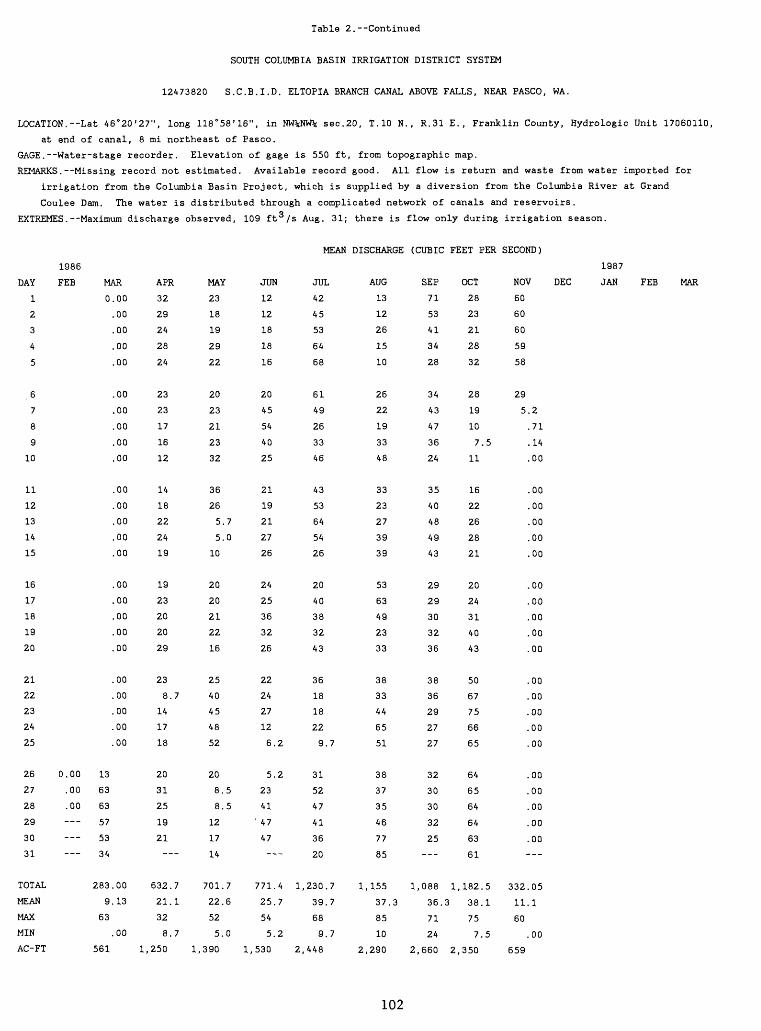
Table 2. Continued
SOUTH COLUMBIA BASIN IRRIGATION DISTRICT SYSTEM
12473820 S.C.B.I.D. ELTOPIA BRANCH CANAL ABOVE FALLS, NEAR PASCO, WA.
LOCATION.--Lat 46°20'27", long 118°58'16", in NW%;NW%; sec.20, T.10 N., R.31 E., Franklin County, Hydrologic Unit 17060110,
at end of canal, 8 mi northeast of Pasco.
GAGE. Water-stage recorder. Elevation of gage is 550 ft, from topographic map.
REMARKS. Missing record not estimated. Available record good. All flow is return and waste from water imported for
irrigation from the Columbia Basin Project, which is supplied by a diversion from the Columbia River at Grand
Coulee Dam. The water is distributed through a complicated network of canals and reservoirs.
EXTREMES. Maximum discharge observed, 109 ft 3 /s Aug. 31; there is flow only during irrigation season.
MEAN DISCHARGE (CUBIC FEET PER SECOND)
DAY
1
2
3
4
5
6
7
8
9
10
11
12
13
14
15
16
17
18
19
20
21
22
23
24
25
26
27
28
29
30
31
TOTAL
MEAN
MAX
MIN
AC-FT
1986
FEE MAR
0.00
.00
.00
.00
.00
.00
.00
.00
.00
.00
.00
.00
.00
.00
.00
.00
.00
.00
.00
.00
.00
.00
.00
.00
.00
0.00 13
.00 63
.00 63
57
53
34
283.00
9.13
63
.00
561
APR
32
29
24
28
24
23
23
17
16
12
14
18
22
24
19
19
23
20
20
29
23
8.7
14
17
18
20
31
25
19
21
632.7
21.1
32
8.7
1,250
MAY
23
18
19
29
22
20
23
21
23
32
36
26
5.7
5.0
10
20
20
21
22
16
25
40
45
48
52
20
8.5
8.5
12
17
14
701.7
22.6
52
5.0
1,390
JUN
12
12
18
18
16
20
45
54
40
25
21
19
21
27
26
24
25
36
32
26
22
24
27
12
6.2
5.2
23
41' 47
47
771.4
25.7
54
5.2
1,530
JUL
42
45
53
64
68
61
49
26
33
46
43
53
64
54
26
20
40
38
32
43
36
18
18
22
9.7
31
52
47
41
36
20
1,230.7
39.7
68
9.7
2,448
AUG
13
12
26
15
10
26
22
19
33
48
33
23
27
39
39
53
63
49
23
33
38
33
44
65
51
38
37
35
46
77
85
1,155
37.3
85
10
2,290
SEP
71
53
41
34
28
34
43
47
36
24
35
40
48
49
43
29
29
30
32
36
38
36
29
27
27
32
30
30
32
25---
1,088
36.
71
24
2,660
OCT
28
23
21
28
32
28
19
10
7.5
11
16
22
26
28
21
20
24
31
40
43
50
67
75
66
65
64
65
64
64
63
61
1,182.5
.3 38.1
75
7.5
2,350
NOV
60
60
60
59
58
29
5.2
.71
.14
.00
.00
.00
.00
.00
.00
.00
.00
.00
.00
.00
.00
.00
.00
.00
.00
.00
.00
.00
.00
.00---
332.05
11.1
60
.00
659
DEC
1987
JAN FEE MAR
102

Table 2.--Continued
SOUTH COLUMBIA BASIN IRRIGATION DISTRICT SYSTEM
12473860 S.C.B.I.D. WASTE WATER DITCH NO.l NEAR RICHLAND, WA.
LOCATION.--Lat 46°20'58", long 119°14'50", in NW%SE% sec.13, T.10 N., R.28 E., Franklin County, Hydrologic Unit 17020016,
2,000 ft above mouth, 20 ft east of Road 68, and 3 mi northeast of Richland.
GAGE.--Staff gage. Elevation of gage is 480 ft, from topographic map.
REMARKS.--Discharge for days with no record not estimated. Available record poor. Flow is return and waste from water
imported for irrigation from the Columbia Basin Project, which is supplied by a diversion from the Columbia River at
Grand Coulee Dam. The water is distributed through a complicated network of canals and reservoirs.
EXTREMES.--Maximum discharge observed, 12 ft 3 /s June 6, 1986; there is flow only during irrigation season.
MEAN DISCHARGE (CUBIC FEET PER SECOND)
DAY
1
2
3
4
5
6
7
8
9
10
11
12
13
14
15
16
17
18
19
20
21
22
23
24
25
26
27
28
29
30
31
TOTAL
MEAN
MAX
MIN
AC-FT
1986
APR
0.00
12
1.5
1.5
1.5
1.5
1.5
1.5
1.5
1.5
1.5
1.5
1.5
1.5
1.5
1.5
1.5
1.5
1.4
1.4
1.4
1.4
1.3
1.3
1.3
1.3
1.3
1.3
1.2
1.2
51.90
1.73
21
.00
103
MAY
1.2
1.4
1.2
1.8
2.4
2.0
1.7
2.4
2.4
.83
1.1
1.4
.52
4.6
4.6
4.6
1.2
1.2
1.2
1.4
1.7
2.4
2.4
4.6
6.4
8.2
6.2
8.2
4.6
5.4
9.3
98.55
3.18
9.3
.52
195
JUN
7.8
6.2
9.5
7.8
7.0
12
7.4
8.0
8.6
5.5
6.6
6.6
7.0
5.5
6.2
7.0
7.8
7.8
9.8
5.9
4.6
4.9
5.2
5.5
9.1
6.6
8.2
8.6
8.2
7.8
218.7
7.29
12
4.6
434
JUL
5.2
4.9
7.8
7.0
6.2
5.7
5.2
4.9
4.6
5.2
7.0
7.8
7.0
6.2
5.5
8.2
7.8
5.9
6.2
6.4
6.6
7.0
5.2
6.0
7.4
5.5
5.5
5.5
7.0
6.2
6.2
192.8
6.22
8.2
4.6
382
AUG
5.9
5.5
5.8
6.2
6.2
6.6
5.5
5.9
5.5
4.9
4.3
4.6
4.6
4.6
4.9
5.2
5.0
4.9
5.2
5.2
4.9
5.2
4.2
3.4
2.7
3.4
3.4
3.4
3.9
3.9
3.6
148.5
4.79
6.6
2.7
295
SEP
3.3
3.0
2.7
2.4
2.1
1.8
1.2
1.2
1.4
2.1
1.8
1.8
1.9
2.1
1.5
1.7
1.3
1.4
1.2
.90
.83
.47
1.8
1.8
1.7
1.7
1.7
1.6
1.6
1.6
51.60
1.72
3.3
.47
102
OCT
1.6
1.5
1.5
1.5
1.4
1.4
1.4
1.4
1.3
1.3
1.3
1.2
1.2
1.2
1.1
1.1
1.1
1.0
1.0
1.0
1.0
1.0
.00
.00
.00
.00
.00
.00
.00
.00
.00
27.50
.89
1.6
.00
55
NOV DEC
1987
JAN FEE MAR APR
103

Table 2. Continued
SOUTH COLUMBIA BASIN IRRIGATION DISTRICT SYSTEM
12473880 S.C.B.I.D. PPL 4.3 WASTEWAY NEAR RICHLAND, WA.
LOCATION.--Lat 46°19'19", long 119°14'08", in NW%SW% sec.30, T.10 N., R.29 E., Franklin County, Hydrologic Unit 17020016,
50 ft downstream of headgate, 50 ft west of Richview Drive, and 3 mi northeast of Richland.
GAGE. Staff gage. Elevation of gage is 500 ft, from topographic map.
REMARKS.--Discharge for days with no record not estimated. Available records poor. Most flow is return and waste from
water imported for irrigation from the Columbia Basin Project, which is supplied by a diversion from the Columbia
River at Grand Coulee Dam. The water is distributed through a complicated network of canals and reservoirs.
EXTREMES. Maximum discharge observed, 22 ft 3 /s Sept. 23, 1986; there is flow only during irrigation season.
MEAN DISCHARGE (CUBIC FEET PER SECOND)
NOVDAY
1
2
3
4
5
6
7
8
9
10
11
12
13
14
15
16
17
18
19
20
21
22
23
24
25
26
27
28
29
30
31
TOTAL
MEAN
MAX
MIN
AC-FT
1986
MAR APR
0.00
32
14
17
16
15
14
12
11
10
11
13
11
9.0
11
11
12
13
10
10
11
12
13
15
13
17
16
15
14
13
391.00
13.0
32
.00
776
MAY
15
13
12
12
13
12
12
13
14
12
12
20
15
10
6.0
9.0
13
12
11
12
13
11
12
11
9.0
8.0
8.0
11
10
11
7.0
358.0
11.5
20
6.0
710
JUN
7.0
12
10
13
13
13
13
13
9.9
9.7
10
12
13
13
13
19
13
16
16
14
13
13
12
12
9.6
11
11
11
10
14
369.2
12.3
19
7.0
732
JUL
13
10
9.8
15
13
13
14
8.9
12
19
16
12
10
7.7
9.5
9.0
9.5
8.7
5.6
5.0
4.6
4.3
4.3
4.5
3.9
6.1
6.0
12
8.2
8.3
9.4
292.3
9.43
19
3.9
580
AUG
10
11
11
8.0
17
15
15
14
13
13
12
12
7.9
8.2
9.4
9.0
9.0
12
13
14
7.6
9.3
10
10
14
12
11
9.9
9.9
13
13
353.2
11.4
17
7.6
701
SEP
13
13
10
10
12
14
15
14
13
13
12
12
12
9.8
11
12
6.4
11
11
11
11
12
22
19
15
10
11
11
11
11
368.2
12.3
22
6.4
730
OCT
16
15
15
16
16
16
17
16
15
14
14
13
12
11
11
12
8.0
9.0
10
11
12
12
.00
.00
.00
.00
.00
.00
.00
.00
.00
291.00
9.39
17
.00
577
DEC
1987
JAN FEE MAR
104
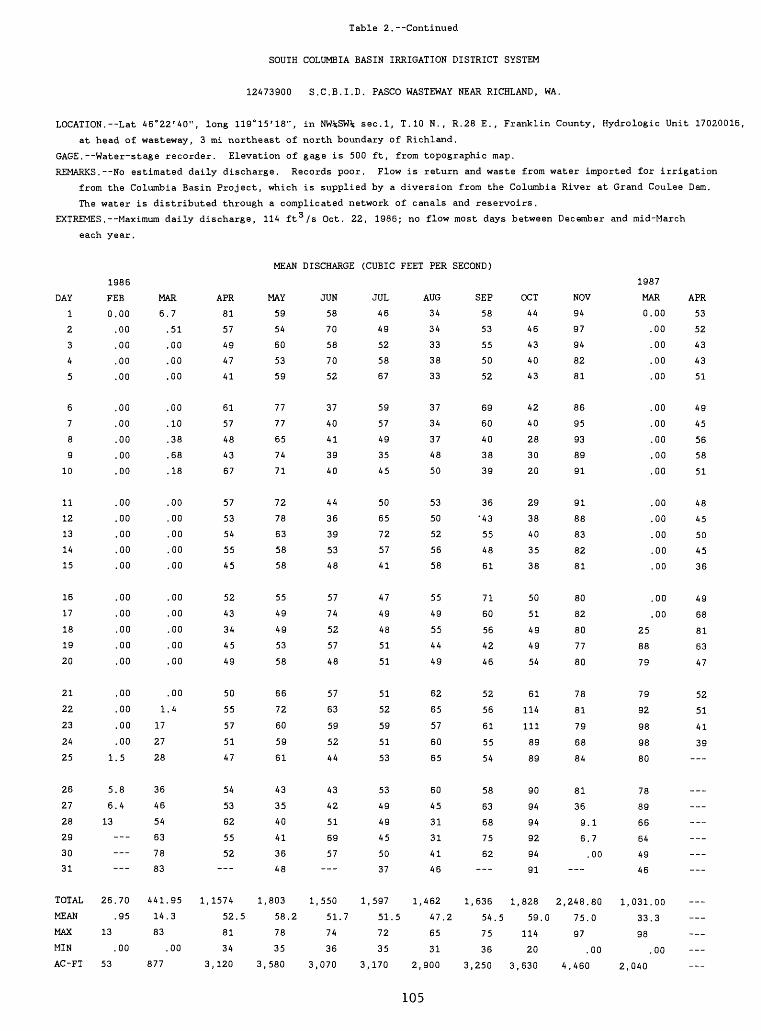
Table 2.--Continued
SOUTH COLUMBIA BASIN IRRIGATION DISTRICT SYSTEM
12473900 S.C.B.I.D. PASCO WASTEWAY NEAR HIGHLAND, WA.
LOCATION.--Lat 46°22'40", long 119°15'18", in NW%SW% sec.l, T.10 N., R.28 E., Franklin County, Hydrologic Unit 17020016,
at head of wasteway, 3 mi northeast of north boundary of Richland.
GAGE. Water-stage recorder. Elevation of gage is 500 ft, from topographic map.
REMARKS.--No estimated daily discharge. Records poor. Flow is return and waste from water imported for irrigation
from the Columbia Basin Project, which is supplied by a diversion from the Columbia River at Grand Coulee Dam.
The water is distributed through a complicated network of canals and reservoirs.
EXTREMES.--Maximum daily discharge, 114 ft 3 /s Oct. 22, 1986; no flow most days between December and mid-March
each year.
MEAN DISCHARGE (CUBIC FEET PER SECOND)
DAY
1
2
3
4
5
6
7
8
9
10
11
12
13
14
15
16
17
18
19
20
21
22
23
24
25
26
27
28
29
30
31
TOTAL
MEAN
MAX
MIN
AC-FT
1986
FEE
0.00
.00
.00
.00
.00
.00
.00
.00
.00
.00
.00
.00
.00
.00
.00
.00
.00
.00
.00
.00
.00
.00
.00
.00
1.5
5.8
6.4
13---
___
26.70
.95
13
.00
53
MAR
6.7
.51
.00
.00
.00
.00
.10
.38
.68
.18
.00
.00
.00
.00
.00
.00
.00
.00
.00
.00
.00
1.4
17
27
28
36
46
54
63
78
83
441.95
14.3
83
.00
877
APR
81
57
49
47
41
61
57
48
43
67
57
53
54
55
45
52
43
34
45
49
50
55
57
51
47
54
53
62
55
52
1,1574
52.5
81
34
3,120
MAY
59
54
60
53
59
77
77
65
74
71
72
78
63
58
58
55
49
49
53
58
66
72
60
59
61
43
35
40
41
36
48
1,803
58.2
78
35
3,580
JUN
58
70
58
70
52
37
40
41
39
40
44
36
39
53
48
57
74
52
57
48
57
63
59
52
44
43
42
51
69
57
1,550
51.7
74
36
3,070
JUL
46
49
52
58
67
59
57
49
35
45
50
65
72
57
41
47
49
48
51
51
51
52
59
51
53
53
49
49
45
50
37
1,597
51.
72
35
3,170
AUG
34
34
33
38
33
37
34
37
48
50
53
50
52
56
58
55
49
55
44
49
62
65
57
60
65
60
45
31
31
41
46
1,462
5 47.2
65
31
2,900
105
SEP
58
53
55
50
52
69
60
40
38
39
36 43
55
48
61
71
60
56
42
46
52
56
61
55
54
58
63
68
75
62
1,636
54.5
75
36
3,250
OCT
44
46
43
40
43
42
40
28
30
20
29
38
40
35
38
50
51
49
49
54
61
114
111
89
89
90
94
94
92
94
91
1,828
59.0
114
20
3,630
NOV
94
97
94
82
81
86
95
93
89
91
91
88
83
82
81
80
82
80
77
80
78
81
79
68
84
81
36
9.1
6.7
.00
2,248.80
75.0
97
.00
4,460
1987
MAR
0.00
.00
.00
.00
.00
.00
.00
.00
.00
.00
.00
.00
.00
.00
.00
.00
.00
25
88
79
79
92
98
98
80
78
89
66
64
49
46
1,031.00
33.3
98
.00
2,040
APR
53
52
43
43
51
49
45
56
58
51
48
45
50
45
36
49
68
81
63
47
52
51
41
39
___
___
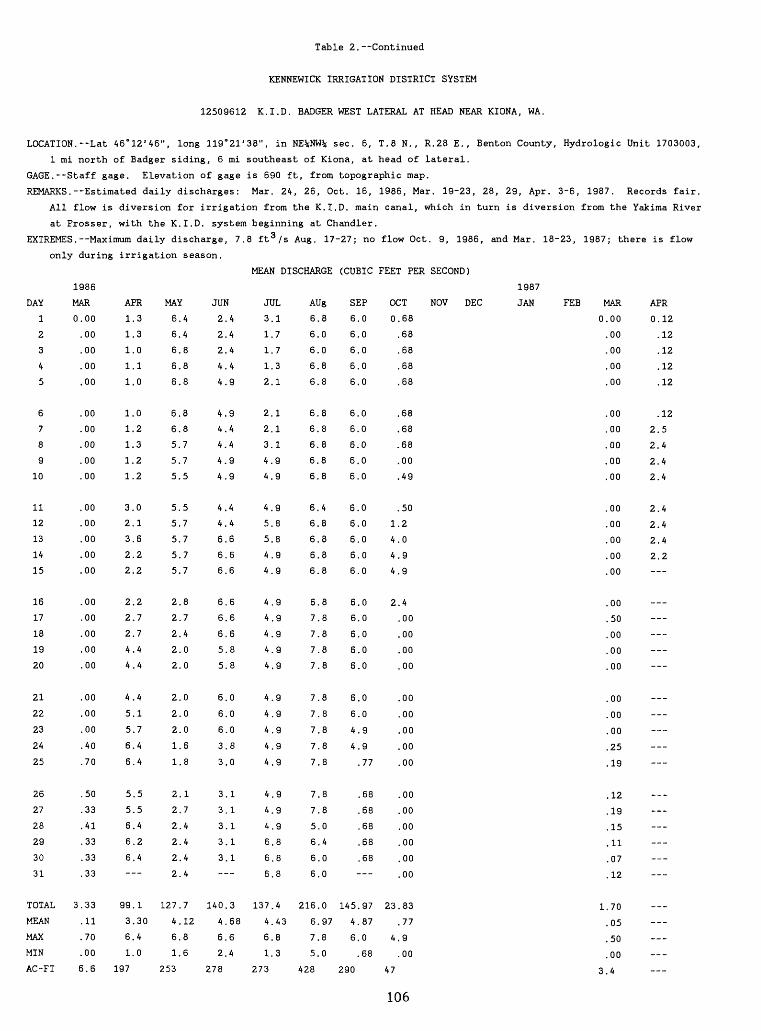
Table 2.--Continued
KENNEWICK IRRIGATION DISTRICT SYSTEM
12509612 K.I.D. BADGER WEST LATERAL AT HEAD NEAR KIONA, WA.
LOCATION.--Lat 46°12'46", long 119°21'38", in NE%NW% sec. 6, T.8 N., R.28 E., Benton County, Hydrologic Unit 1703003,
1 mi north of Badger siding, 6 mi southeast of Kiona, at head of lateral.
GAGE. Staff gage. Elevation of gage is 690 ft, from topographic map.
REMARKS.--Estimated daily discharges: Mar. 24, 26, Oct. 16, 1986, Mar. 19-23, 28, 29, Apr. 3-6, 1987. Records fair.
All flow is diversion for irrigation from the K.I.D. main canal, which in turn is diversion from the Yakima River
at Prosser, with the K.I.D. system beginning at Chandler.
EXTREMES.--Maximum daily discharge, 7.8 ft 3 /s Aug. 17-27; no flow Oct. 9, 1986, and Mar. 18-23, 1987; there is flow
only during irrigation season.
MEAN DISCHARGE (CUBIC FEET PER SECOND)
1987
DAY
1
2
3
4
5
6
7
8
9
10
11
12
13
14
15
16
17
18
19
20
21
22
23
24
25
26
27
28
29
30
31
TOTAL
MEAN
MAX
MIN
AC-FT
1986
MAR
0.00
.00
.00
.00
.00
.00
.00
.00
.00
.00
.00
.00
.00
.00
.00
.00
.00
.00
.00
.00
.00
.00
.00
.40
.70
.50
.33
.41
.33
.33
.33
3.33
.11
.70
.00
6.6
APR
1
1
1
1
1
1
1
1
1
1
3
2
3
2
2
2
2
2
4
4
4
5
5
6
6
5
5
6
6
6-
99
3
6
1
197
.3
.3
.0
.1
.0
.0
.2
.3
.2
.2
.0
.1
.6
.2
.2
.2
.7
.7
.4
.4
.4
.1
.7
.4
.4
.5
.5
.4
.2
.4--
.1
.30
.4
.0
MAY
6.4
6.4
6.8
6.8
6.8
6.8
6.8
5.7
5.7
5.5
5.5
5.7
5.7
5.7
5.7
2.8
2.7
2.4
2.0
2.0
2.0
2.0
2.0
1.6
1.8
2.1
2.7
2.4
2.4
2.4
2.4
127.7
4.12
6.8
1.6
253
JUN
2
2
2
4
4
4
4
4
4
4
4
4
6
6
6
6
6
6
5
5
6
6
6
3
3
3
3
3
3
3-
140
4
6
2
278
.4
.4
.4
.4
.9
.9
.4
.4
.9
.9
.4
.4
.6
.6
.6
.6
.6
.6
.8
.8
.0
.0
.0
.8
.0
.1
.1
.1
.1
.1--
.3
.68
.6
.4
JUL
3.
1.
1.
1.
2.
2.
2.
3.
4.
4.
4.
5.
5,
4.
4.
4.
4,
4.
4.
4,
4.
4,
4,
4,
4,
4.
4,
4.
6,
6,
6.
137.
4.
6.
1.
273
,1
,7
,7
,3
1
1
1
1
9
9
.9
,8
.8
,9
,9
.9
,9
.9
.9
.9
.9
.9
.9
.9
.9
.9
.9
.9
.8
.8
.8
.4
.43
.8
.3
AUg
6.8
6.0
6.0
6.8
6.8
6.8
6.8
6.8
6.8
6.8
6.4
6.8
6.8
6.8
6.8
6.8
7.8
7.8
7.8
7.8
7.8
7.8
7.8
7.8
7.8
7.8
7.8
5.0
6.4
6.0
6.0
216.0
6.97
7.8
5.0
428
SEP
6.0
6.0
6.0
6.0
6.0
6.0
6.0
6.0
6.0
6.0
6.0
6.0
6.0
6.0
6.0
6.0
6.0
6.0
6.0
6.0
6.0
6.0
4.9
4.9
.77
.68
.68
.68
.68
.68
145.97
4.87
6.0
.68
290
OCT
0.68
.68
.68
.68
.68
.68
.68
.68
.00
.49
.50
1.2
4.0
4.9
4.9
2.4
.00
.00
.00
.00
.00
.00
.00
.00
.00
.00
.00
.00
.00
.00
.00
23.83
.77
4.9
.00
47
106
NOV DEC JAN FEE MAR
0.00
.00
.00
.00
.00
.00
.00
.00
.00
.00
.00
.00
.00
.00
.00
.00
.50
.00
.00
.00
.00
.00
.00
.25
.19
.12
.19
.15
.11
.07
.12
1.70
.05
.50
.00
3.4
APR
0.12
.12
.12
.12
.12
.12
2.5
2.4
2.4
2.4
2.4
2.4
2.4
2.2

Table 2.--Continued
KENNEWICK IRRIGATION DISTRICT SYSTEM
12509614 K.I.D. BADGER EAST LATERAL AT HEAD NEAR KIONA, WA.
LOCATION.--Lat 46°12'44", long 119°21'36", in NE%NW% sec.6, T.8 N., R.28 E., Benton County, Hydrologic Unit 17030003,
1 mi north of Badger siding, 6 mi southeast of Kiona, at head of lateral.
GAGE.--Staff gage. Elevation of gage is 690 ft, from topographic map.
REMARKS.--Estimated daily discharges: Mar. 24, 26, Oct. 16, 1986; Mar. 19-22, 1987. Records fair. All flow is
diversion for irrigation from the K.I.D. main canal, which in turn is diversion from the Yakima River at Prosser,
with the K.I.D. system beginning at Chandler.
EXTREMES.--Maximum daily discharge, 46 ft 3 /s July 20, 1987; no flow Apr. 19-23, 1987; there is flow only during
irrigation season.
MEAN DISCHARGE (CUBIC FEET PER SECOND)
19871986
DAY
1
2
3
4
5
6
7
8
9
10
11
12
13
14
15
16
17
18
19
20
21
22
23
24
25
26
27
28
29
30
31
TOTAL
MEAN
MAX
MIN
AC -FT
MAR
0
3.
6.
5.
5.
5.
5.
5.
5.
42.
1.
6.
84
.00
.00
.00
.00
.00
.00
.00
.00
.00
.00
.00
.00
.00
.00
.00
,00
.00
.00
,00
,00
00
00
00
0
0
7
4
5
5
5
5
10
36
0
00
APR
12
9.3
9.3
11
12
12
16
21
25
22
22
16
16
16
18
18
23
24
24
24
26
28
32
33
36
39
41
34
33
31
683.6
22.8
41
9.3
1360
MAY
30
32
35
35
36
35
34
31
28
30
30
32
28
28
27
31
31
29
29
33
35
31
28
26
26
26
27
23
33
35
39
953
30.7
39
23
1,890
JUN
39
37
39
38
37
31
40
40
35
37
36
35
32
32
32
32
32
32
32
32
33
34
33
33
34
36
33
34
36
35
1,041
34.7
40
31
2,060
JUL
38
38
38
40
40
42
32
35
31
31
30
28
28
28
30
29
30
31
42
46
32
33
34
36
36
36
36
36
32
36
35
1,069
34.5
46
28
2,120
AUG
32
30
30
30
30
32
33
36
34
36
36
36
36
39
41
42
41
41
41
42
44
44
43
43
41
41
41
40
32
27
27
1,141
36.8
44
27
2,260
SEP
27
27
27
28
27
30
30
29
28
27
27
26
25
25
25
20
17
19
20
19
22
22
22
23
20
18
16
16
16
13
691
23.0
30
13
1,370
OCT
14
14
14
14
14
14
15
15
17
16
17
19
18
16
16
8.0
.00
.00
.00
.00
.00
.00
.00
.00
.00
.00
.00
.00
.00
.00
.00
241.00
7.77
19
.00
478
NOV DEC JAN FEE MAR
0
8.
6.
7.
7.
7.
7.
7.
8.
12
72.
2.
12
143
.00
.00
.00
.00
.00
.00
.00
.00
.00
.00
.00
.00
.00
.00
.00
.00
,5
,20
00
00
00
00
00
8
2
2
4
1
3
5
20
33
00
APR
15
17
19
18
18
19
26
23
29
24
26
22
22
26
---
107

Table 2. Continued
KENNEWICK IRRIGATION DISTRICT SYSTEM
12509620 K.I.D. CANAL AT BADGER CANYON ROAD NEAR KIONA, WA.
LOCATION.--Lat 46°11'55", long 119°21'53", in NW%NW% sec.7, T.8 N., R.28 E., Benton County, Hydrologic Unit 17030003,
at county road crossing, 0.A mi southwest of Badger siding, 7 mi southeast of Kiona, at canal mile 15.A.
GAGE. Staff gage. Elevation of gage is 700 ft, from topographic map.
REMARKS.--Estimated daily discharges: Mar. 17-24, 26, Oct. 16, 1986; Mar. 18-22, 1987. Records fair, except those
for Mar. 17 - Apr. 10, 1986; and Mar. 17 - Apr. 14, 1987, which are poor. All flow is diversion for irrigation
from the Yakima River at Prosser, with the K.I.D. system beginning at Chandler. There are two laterals and
numerous turnouts above the gage.
EXTREMES.--Maximum daily discharge, 230 ft 3 /s Sept. 3, 1986; no flow Mar. 25, 1986 and Mar. 19-23, 1987; there is flow
only during irrigation season.
MEAN DISCHARGE (CUBIC FEET PER SECOND)
1987
NOV DEC JAN FEE
1986
DAY
1
2
3
4
5
6
7
8
9
10
11
12
13
14
15
16
17
18
19
20
21
22
23
24
25
26
27
28
29
30
31
TOTAL
MEAN
MAX
MIN
AC -FT
MAR
0
10
60
90
90
115
145
150
115
45
83
93
93
93
84
1,266,
40,
150
2,510
.00
.00
.00
.00
.00
.00
.00
.00
.00
.00
.00
.00
.00
.00
.00
.00
.00
.00
.8
,00
APR
75
79
79
74
72
70
48
57
94
133
141
154
155
151
146
145
155
154
151
151
150
173
166
161
173
174
176
170
172
171---
3,970
132
176
48
7,870
MAY
172
171
174
174
174
177
177
178
182
181
183
187
193
195
189
187
187
191
191
189
189
186
190
193
196
196
201
193
192
198
215
5,801
187
215
171
11,510
JUN
214
212
222
214
214
212
212
210
210
207
208
208
210
210
204
204
206
205
204
203
207
206
205
207
207
203
201
199
199
199
6,222
207
222
199
12,340
JUL
199
198
197
197
197
197
196
195
193
191
194
194
194
197
191
197
197
197
205
194
194
193
189
189
189
189
194
195
191
193
196
6,032
195
205
189
11,960
AUG
201
201
201
201
199
200
200
200
196
193
194
193
193
187
188
187
188
188
188
189
191
190
191
190
192
191
191
200
207
218
218
6,066
196
218
187
12,030
SEP
217
224
230
208
198
204
207
208
218
209
205
205
197
197
195
201
191
185
178
182
178
179
174
177
161
172
161
158
159
150
5,728
191
230
150
11,360
OCT 1
149
147
145
143
143
141
125
121
120
120
124
124
126
130
128
64
.00
.00
.00
.00
.00
.00
.00
.00
.00
.00
.00
.00
.00
.00
.00
2,050.00
66.1
149
.00
4,070
MAR
0.
62
15
81
82
81
81
81
79
79
99
740.
23.
99
1,470
00
,00
.00
.00
.00
.00
.00
.00
.00
.00
.00
.00
.00
.00
.00
.00
.00
.00
.00
.00
00
00
9
00
APR
109
126
126
122
121
120
134
146
154
159
167
168
168
159
108

Table 2. Continued
KENNEWICK IRRIGATION DISTRICT SYSTEM
12509638 K.I.D. CANAL ABOVE SIPHON AT CLODFELTER ROAD, NEAR RICHLAND, WA.
LOCATION.--!at 46°11'20", long lig'lS'U", in SE^SW* sec.12, T.8 N., R.28 E., Benton County, Hydrologic Unit 7030003,
150 ft above entrance to siphon across Coyote Canyon, 1 mi south of south boundary of Richland.
GAGE. Water-stage recorder. Elevation of gage is 690 ft, from topographic map.
REMARKS. Estimated daily discharges: Sept. 18 to Oct. 7, 1986. Records good except those for estimated days,
which are fair. All flow is diversion for irrigation from the Yakima River at Prosser, with the K.I.D.
system beginning at Chandler. There are two laterals and numerous turnouts above the gage.
EXTREMES.--Maximum discharge, 235 ft 3 /s June 9, 1986; no flow Mar. 22, 1987; there is flow only during
irrigation season.
MEAN DISCHARGE (CUBIC FEET PER SECOND)
1987
NOV DEC JAN FEEDAY
1
2
3
4
5
6
7
8
9
10
11
12
13
14
15
16
17
18
19
20
21
22
23
24
25
26
27
28
29
30
31
TOTAL
MEAN
MAX
MIN
AC-FT
1986
MAR
0.00
.00
.00
.00
.00
.00
.00
.00
.00
.00
.00
.00
.00
.00
.00
.00
.00
30
89
95
103
150
154
149
31
1.6
55
102
97
95
88
1,239.60
40.0
154
.00
2,460
APR
83
93
92
89
85
77
81
60
100
122
127
139
135
128
125
131
135
136
133
131
134
149
145
141
154
162
168
164
164
163
3,746
125
168
60
7430
MAY
161
160
167
169
169
170
169
169
172
170
172
179
191
185
176
173
174
178
176
171
171
171
111
178
181
178
186
177
168
174
201
5,413
175
201
160
10740
JUN
203
195
209
194
187
187
189
201
201
189
189
189
195
195
195
198
198
196
195
195
199
198
196
195
192
189
186
179
179
182___
5,795
193
209
179
11490
JUL
183
111
176
180
182
181
180
177
171
169
173
173
174
177
176
176
178
181
191
173
172
170
169
169
168
171
176
178
173
178
184
5,456
176
191
168
10820
AUG
189
187
185
183
172
172
184
181
178
177
176
173
176
170
171
170
170
170
169
170
173
170
169
167
172
174
186
191
198
204
204
5,531
178
204
167
10970
SEP
206
211
214
193
185
191
195
196
202
192
187
185
172
168
174
181
173
165
160
160
160
160
155
155
150
150
145
145
140
155
5,225
174
214
140
10360
OCT
140
140
135
135
130
130
120
115
114
112
115
118
116
118
109
15
1.1
.43
.37
.27
.00
.00
.00
.00
.00
.00
.00
.00
.00
.00
.00
1,864.17
60.1
140
.00
3700
MAR
0.00
.00
.00
.00
.00
.00
.00
.00
.00
.00
.00
.00
.00
.00
.00
.00
1.6
3.8
2.5
1.0
.28
.00
2.4
25
64
81
79
80
79
79
80
578.58
18.7
81
.00
1,150
APR
76
103
95
94
95
95
106
132
145
154
167
165
160
152
___
--
--
--
--
--
109
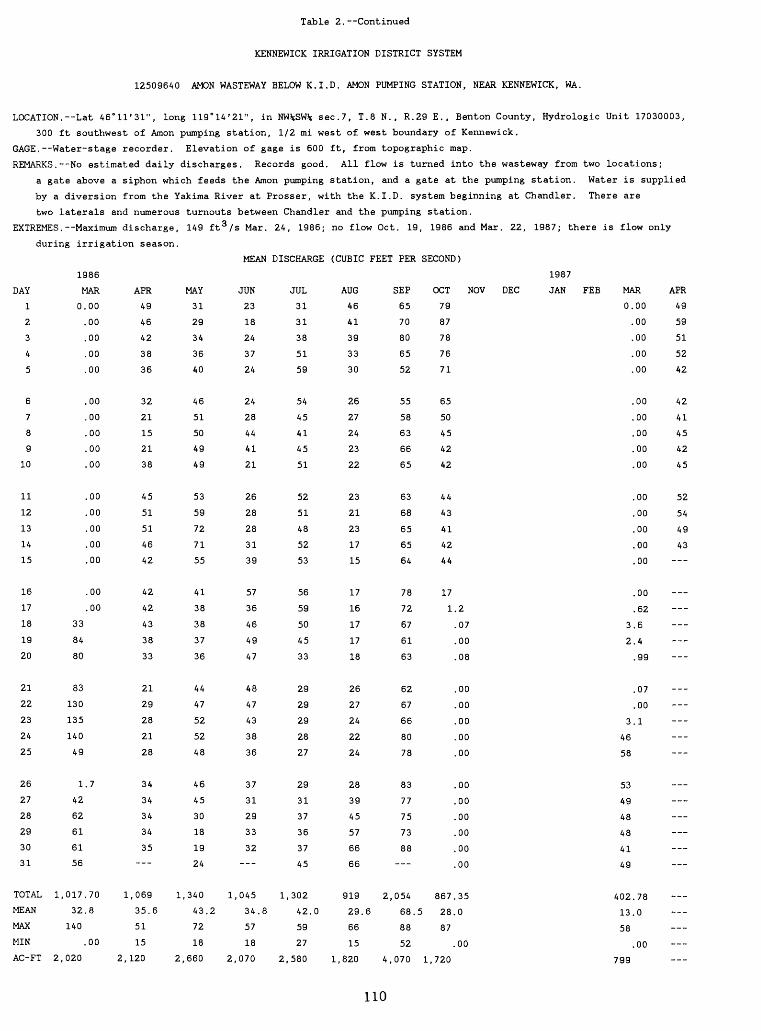
Table 2. Continued
KENNEWICK IRRIGATION DISTRICT SYSTEM
12509640 AMON WASTEWAY BELOW K.I.D. AMON PUMPING STATION, NEAR KENNEWICK, WA.
LOCATION. Lat 46°11'31", long 119°14'21", in NW%SW% sec.7, T.8 N., R.29 E., Benton County, Hydrologic Unit 17030003,
300 ft southwest of Amon pumping station, 1/2 mi west of west boundary of Kennewick.
GAGE. Water-stage recorder. Elevation of gage is 600 ft, from topographic map.
REMARKS. No estimated daily discharges. Records good. All flow is turned into the wasteway from two locations;
a gate above a siphon which feeds the Amon pumping station, and a gate at the pumping station. Water is supplied
by a diversion from the Yakima River at Prosser, with the K.I.D. system beginning at Chandler. There are
two laterals and numerous turnouts between Chandler and the pumping station.
EXTREMES.--Maximum discharge, 149 ft 3 /s Mar. 24, 1986; no flow Oct. 19, 1986 and Mar. 22, 1987; there is flow only
during irrigation season.
MEAN DISCHARGE (CUBIC FEET PER SECOND)
NOV DECDAY
1
2
3
4
5
6
7
8
9
10
11
12
13
14
15
16
17
18
19
20
21
22
23
24
25
26
27
28
29
30
31
TOTAL
MEAN
MAX
MIN
AC-FT
1986
MAR
0.00
.00
.00
.00
.00
.00
.00
.00
.00
.00
.00
.00
.00
.00
.00
.00
.00
33
84
80
83
130
135
140
49
1.7
42
62
61
61
56
1,017.70
32.8
140
.00
2,020
APR
49
46
42
38
36
32
21
15
21
38
45
51
51
46
42
42
42
43
38
33
21
29
28
21
28
34
34
34
34
35---
1,069
35.6
51
15
2,120
MAY
31
29
34
36
40
46
51
50
49
49
53
59
72
71
55
41
38
38
37
36
44
47
52
52
48
46
45
30
18
19
24
1,340
43.2
72
18
2,660
JUN
23
18
24
37
24
24
28
44
41
21
26
28
28
31
39
57
36
46
49
47
48
47
43
38
36
37
31
29
33
32---
1,045
34.8
57
18
2,070
JUL
31
31
38
51
59
54
45
41
45
51
52
51
48
52
53
56
59
50
45
33
29
29
29
28
27
29
31
37
36
37
45
1,302
42.0
59
27
2,580
AUG
46
41
39
33
30
26
27
24
23
22
23
21
23
17
15
17
16
17
17
18
26
27
24
22
24
28
39
45
57
66
66
919
29.6
66
15
1,820
SEP
65
70
80
65
52
55
58
63
66
65
63
68
65
65
64
78
72
67
61
63
62
67
66
80
78
83
77
75
73
88
2,054
68.
88
52
4,070
OCT
79
87
78
76
71
65
50
45
42
42
44
43
41
42
44
17
1
867,
5 28.
87
1,720
f
.2
.07
.00
.08
.00
.00
.00
.00
.00
.00
.00
.00
.00
.00
.00
,35
0
00
1987
JAN FEE MAR
0.00
.00
.00
.00
.00
.00
.00
.00
.00
.00
.00
.00
.00
.00
.00
.00
.62
3.6
2.4
.99
.07
.00
3.1
46
58
53
49
48
48
41
49
402.78
13.0
58
.00
799
APR
49
59
51
52
42
42
41
45
42
45
52
54
49
43___
___
___
110
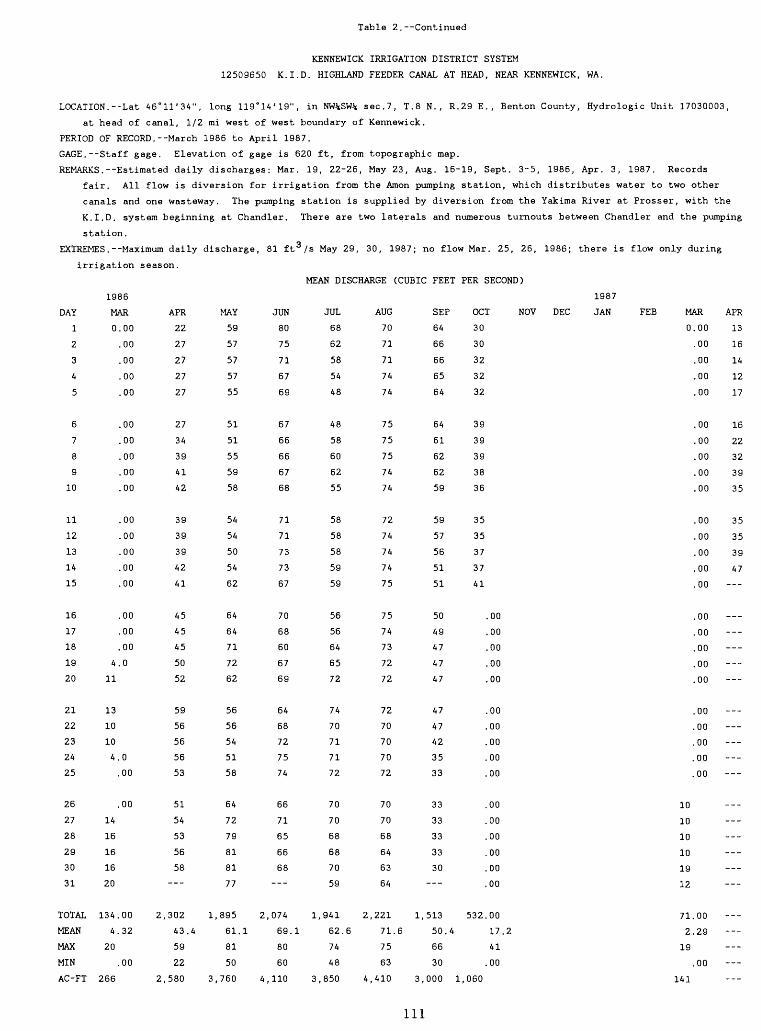
Table 2.--Continued
KENNEWICK IRRIGATION DISTRICT SYSTEM
12509650 K.I.D. HIGHLAND FEEDER CANAL AT HEAD, NEAR KENNEWICK, WA.
LOCATION. --Lat 46°11'3V, long 119*14'19", in NWjSW* sec.7, T.8 N. , R.29 E., Benton County, Hydrologic Unit 17030003,
at head of canal, 1/2 mi west of west boundary of Kennewick.
PERIOD OF RECORD.--March 1986 to April 1987.
GAGE.--Staff gage. Elevation of gage is 620 ft, from topographic map.
REMARKS.--Estimated daily discharges: Mar. 19, 22-26, May 23, Aug. 16-19, Sept. 3-5, 1986, Apr. 3, 1987. Records
fair. All flow is diversion for irrigation from the Amon pumping station, which distributes water to two other
canals and one wasteway. The pumping station is supplied by diversion from the Yakima River at Prosser, with the
K.I.D. system beginning at Chandler. There are two laterals and numerous turnouts between Chandler and the pumping
station.
EXTREMES.--Maximum daily discharge, 81 ft 3 /s May 29, 30, 1987; no flow Mar. 25, 26, 1986; there is flow only during
irrigation season.
MEAN DISCHARGE (CUBIC FEET PER SECOND)
1987
DAY
1
2
3
4
5
6
7
8
9
10
11
12
13
14
15
16
17
18
19
20
21
22
23
24
25
26
27
28
29
30
31
TOTAL
MEAN
MAX
MIN
AC-FT
1986
MAR
0.00
.00
.00
.00
.00
.00
.00
.00
.00
.00
.00
.00
.00
.00
.00
.00
.00
.00
4.0
11
13
10
10
4.0
.00
.00
14
16
16
16
20
134.00
4.32
20
.00
266
APR
22
27
27
27
27
27
34
39
41
42
39
39
39
42
41
45
45
45
50
52
59
56
56
56
53
51
54
53
56
58
2,302
43.4
59
22
2,580
MAY
59
57
57
57
55
51
51
55
59
58
54
54
50
54
62
64
64
71
72
62
56
56
54
51
58
64
72
79
81
81
77
1,895
61.1
81
50
3,760
JUN
80
75
71
67
69
67
66
66
67
68
71
71
73
73
67
70
68
60
67
69
64
68
72
75
74
66
71
65
66
68---
2,074
69.1
80
60
4,110
JUL
68
62
58
54
48
48
58
60
62
55
58
58
58
59
59
56
56
64
65
72
74
70
71
71
72
70
70
68
68
70
59
1,941
62.6
74
48
3,850
AUG
70
71
71
74
74
75
75
75
74
74
72
74
74
74
75
75
74
73
72
72
72
70
70
70
72
70
70
68
64
63
64
2,221
71.6
75
63
4,410
SEP
64
66
66
65
64
64
61
62
62
59
59
57
56
51
51
50
49
47
47
47
47
47
42
35
33
33
33
33
33
30
1,513
50.4
66
30
3,000 1,
OCT
30
30
32
32
32
39
39
39
38
36
35
35
37
37
41
.00
.00
.00
.00
.00
.00
.00
.00
.00
.00
.00
.00
.00
.00
.00
.00
532.00
17.2
41
.00
060
NOV DEC JAN FEE MAR
0.00
.00
.00
.00
.00
10
10
10
10
19
12
71.00
2.29
19
.00
141
APR
13
16
14
12
17
.00 16
.00 22
.00 32
.00 39
.00 35
.00 35
.00 35
.00 39
.00 47
.00
.00
.00
.00
.00
.00
.00
.00
.00
.00
.00
111
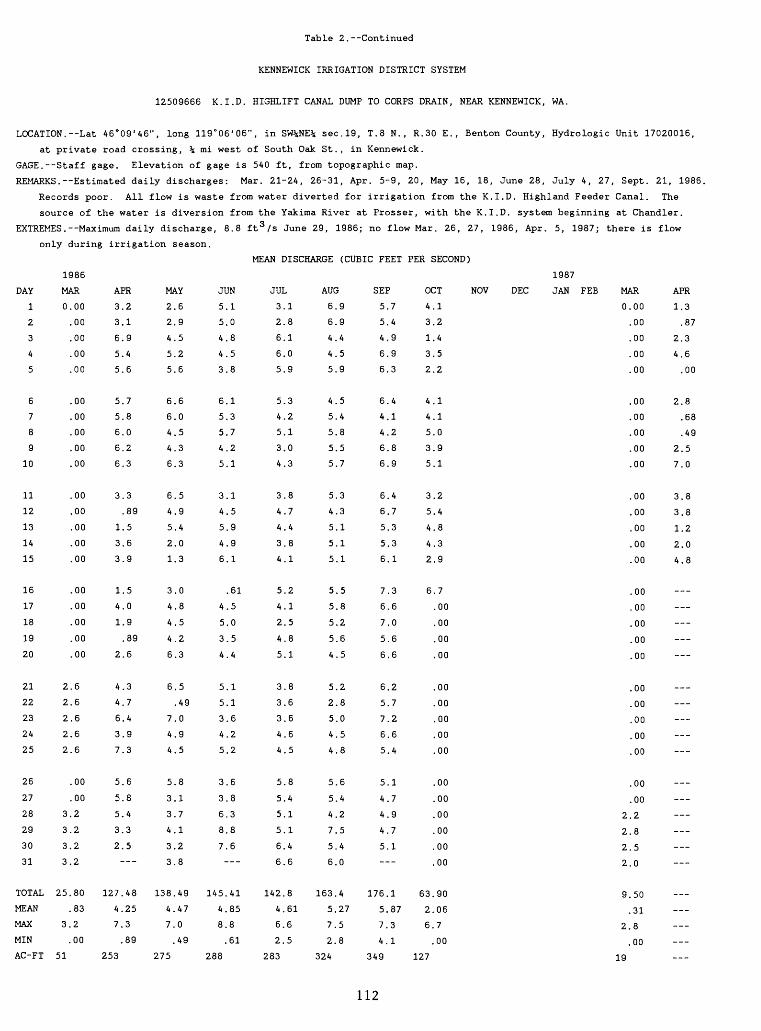
Table 2.--Continued
KENNEWICK IRRIGATION DISTRICT SYSTEM
12509666 K.I.D. HIGHLIFT CANAL DUMP TO CORPS DRAIN, NEAR KENNEWICK, WA.
LOCATION.--Lat 46°09'46", long 119°06'06", in SW%NE% sec.19, T.8 N., R.30 E., Benton County, Hydrologic Unit 17020016,
18, June 28, July 4, 27, Sept. 21, 1981
j K.I.D. Highland Feeder Canal. The
K.I.D. system beginning at Chandler.
7, 1986, Apr. 5, 1987; there is flow
1987
at private road crossing, % mi west of South Oak St., in Kennewick.
GAGE. Staff gage. Elevation of gage is 540 ft, from topographic map.
REMARKS. --Estimated daily discharges: Mar. 21-24, 26-31, Apr. 5-9, 20, May
Records poor. All flow is waste from water diverted for irrigation frot
source of the water is diversion from the Yakima River at Prosser, with
EXTREMES. --Maximum daily discharge, 8.8 ft 3 /s June 29, 1986; no flow Mar. 2
only during irrigation season.
MEAN DISCHARGE (CUBIC FEET PER SECC
1986
DAY
1
2
3
4
5
6
7
8
9
10
11
12
13
14
15
16
17
18
19
20
21
22
23
24
25
26
27
28
29
30
31
TOTAL
MEAN
MAX
MIN
AC-FT
MAR
0.00
.00
.00
.00
.00
.00
.00
.00
.00
.00
.00
.00
.00
.00
.00
.00
.00
.00
.00
.00
2.6
2.6
2.6
2.6
2.6
.00
.00
3.2
3.2
3.2
3.2
25.80
.83
3.2
.00
51
APR
3.
3.
6.
5.
5.
5.
5.
6.
6.
6.
3.
1.
3.
3.
1.
4.
1.
2.
4.
4.
6.
3.
7.
5.
5.
5.
3.
2.-
127.
4.
7.
253
2
1
9
4
6
7
8
0
2
3
3
89
5
6
9
5
0
9
89
6
3
7
4
9
3
6
8
4
3
5--
48
25
3
89
MAY
2.6
2.9
4.5
5.2
5.6
6.6
6.0
4.5
4.3
6.3
6.5
4.9
5.4
2.0
1.3
3.0
4.8
4.5
4.2
6.3
6.5
.49
7.0
4.9
4.5
5.8
3.1
3.7
4.1
3.2
3.8
138.49
4.47
7.0
.49
275
JUN
5.
5.
4.
4.
3.
6.
5.
5.
4.
5.
3.
4.
5.
4.
6.
4.
5.
3.
4.
5.
5.
3.
4.
5.
3.
3.
6.
8.
7.-
145.
4.
8.
288
1
0
8
5
8
1
3
7
2
1
1
5
9
9
1
61
5
0
5
4
1
1
6
2
2
6
8
3
8
6--
41
85
8
61
JUL
3,
2,
6.
6,
5.
5.
4.
5.
3,
4.
3
4
4
3
4
5
4
2
4
5
3
3
3
4
4
5
5.
5
5,
6.
6.
142.
4.
6.
2.
283
.1
.8
.1
.0
.9
.3
.2
.1
.0
.3
.8
.7
.4
.8
.1
.2
.1
.5
.8
.1
.8
.6
.6
.6
.5
.8
.4
.1
.1
.4
.6
.8
61
6
5
AUG
6.9
6.9
4.4
4.5
5.9
4.5
5.4
5.8
5.5
5.7
5.3
4.3
5.1
5.1
5.1
5.5
5.8
5.2
5.6
4.5
5.2
2.8
5.0
4.5
4.8
5.6
5.4
4.2
7.5
5.4
6.0
163.4
5.27
7.5
2.8
324
SEP
5.7
5.4
4.9
6.9
6.3
6.4
4.1
4.2
6.8
6.9
6.4
6.7
5.3
5.3
6.1
7.3
6.6
7.0
5.6
6.6
6.2
5.7
7.2
6.6
5.4
5.1
4.7
4.9
4.7
5.1
176.1
5.87
7.3
4.1
349
OCT
4.1
3.2
1.4
3.5
2.2
4.1
4.1
5.0
3.9
5.1
3.2
5.4
4.8
4.3
2.9
6.7
.00
.00
.00
.00
.00
.00
.00
.00
.00
.00
.00
.00
.00
.00
.00
63.90
2.06
6.7
.00
127
NOV DEC JAN FEE MAR
0.
2
2
2,
2,
9.
2.
19
.00
.00
.00
.00
.00
.00
.00
.00
.00
.00
.00
.00
.00
.00
.00
.00
.00
.00
.00
.00
.00
.00
.00
.00
.00
.00
.00
.2
.8
.5
.0
.50
,31
,8
00
APR
1.3
.87
2.3
4.6
.00
2.8
.68
.49
2.5
7.0
3.8
3.8
1.2
2.0
4.8
___
___
112

Table 2. Continued
KENNEWICK IRRIGATION DISTRICT SYSTEM
12509670 K.I.D. DIVISION FOUR CANAL AT HEAD NEAR KENNEWICK, WA.
LOCATION.--Lat 46°11'39", long 119°14'11", in SW^NW* sec.7, T.8 N., R.29 E., Benton County, Hydrologic Unit 17030003,
at head of canal, 1/2 mi west of west boundary of Kennewick.
PERIOD OF RECORD.--March 1986 to April 1987.
GAGE. Staff gage. Elevation of gage is 690 ft, from topographic map.
REMARKS. Estimated daily discharges: Mar. 19, 22-26, May 23, Aug. 16-19, Sept. 3~5, 1986, Apr. 3, 1987. Records
fair. All flow is diversion for irrigation from the Amon pumping station, which distributes water to two other
canals and one wasteway. The pumping station is supplied by diversion from the Yakima River at Prosser, with
the K.I.D. system beginning at Chandler. There are two laterals and numerous turnouts between Chandler and the
pumping station.
EXTREMES.--Maximum daily discharge, 81 ft 3 /s Aug. 14, 1986; no flow Mar. 25, 26, 1986; there is flow only during
irrigation season.
MEAN DISCHARGE (CUBIC FEET PER SECOND)
1987
DAY
1
2
3
4
5
6
7
8
9
10
11
12
13
14
15
16
17
18
19
20
21
22
23
24
25
26
27
28
29
30
31
TOTAL
MEAN
MAX
MIN
1986
MAR
0.00
.00
.00
.00
.00
.00
.00
.00
.00
.00
.00
.00
.00
.00
.00
.00
.00
.00
2.0
12
118.0
8.0
2.0
.00
.00
12
12
12
12
12
103.00
3.32
12
.00
APR
11
13
16
15
15
15
21
18
34
38
41
42
41
44
43
42
44
43
43
42
51
58
58
58
57
55
57
53
49
49
1,166
38.9
58
11
MAY
54
50
51
51
50
51
50
51
51
50
51
47
47
47
51
55
54
55
54
58
59
59
59
59
56
55
64
67
70
73
68
1,717
55.4
73
47
JUN
72
72
73
72
71
70
70
64
74
68
63
62
63
63
64
59
63
60
60
61
62
62
61
66
65
68
68
68
68
70
1,982
66.1
74
59
JUL
70
71
70
64
61
64
67
66
58
58
58
56
56
54
55
54
59
60
63
63
66
66
64
65
67
65
67
66
66
67
69
1,955
63.1
71
54
AUG
68
70
73
73
74
77
77
77
77
77
77
77
78
81
80
80
79
78
77
77
77
76
74
74
73
73
66
66
67
67
65
2,305
74.4
81
65
SEP
65
62
62
61
60
60
61
61
58
55
54
52
51
52
52
49
49
45
45
46
45
42
41
38
34
33
32
32
33
33
1,463
48.8
65
32
OCT
30
20
22
22
22
23
27
27
29
29
29
30
35
35
28
.00
.00
.00
.00
.00
.00
.00
.00
.00
.00
.00
.00
.00
.00
.00
.00
408.00
13.2
35
.00
NOV DEC JAN FEE MAR
0
13
12
12
12
12
15
17
93.
3.
17
.00
.00
.00
.00
.00
.00
.00
.00
.00
.00
.00
.00
.00
.00
.00
.00
.00
.00
.00
.00
.00
.00
.00
.00
00
00
00
APR
19
22
23
24
25
29
34
39
43
47
47
46
49
48
___
113
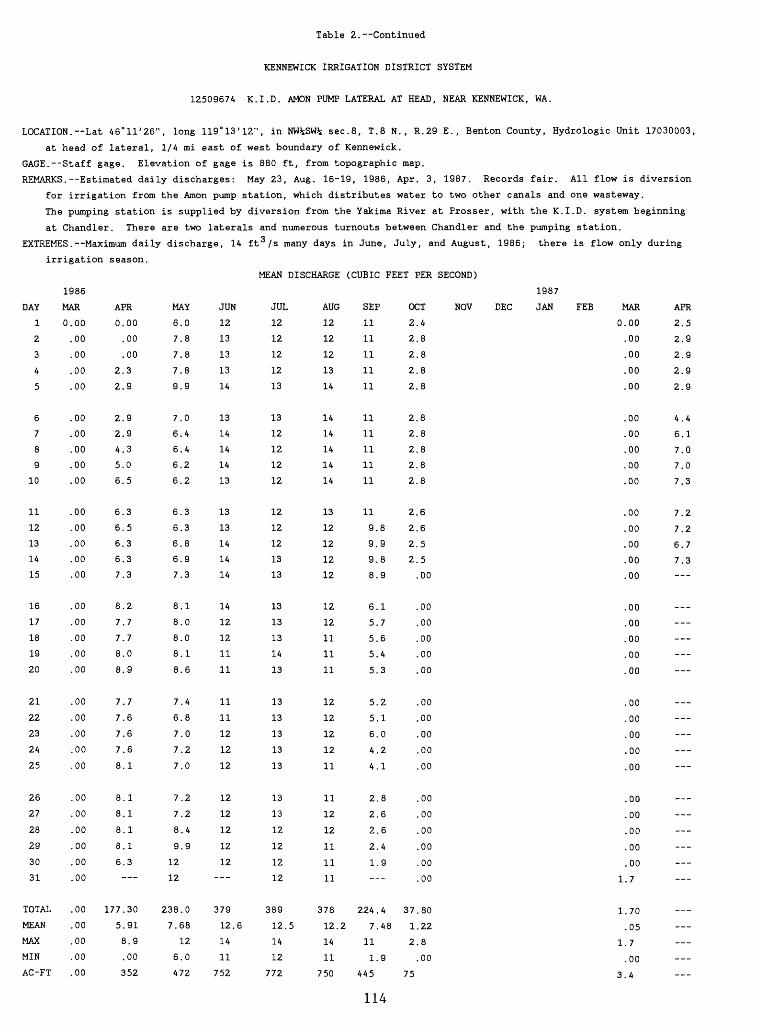
Table 2. Continued
KENNEWICK IRRIGATION DISTRICT SYSTEM
12509674 K.I.D. AMON PUMP LATERAL AT HEAD, NEAR KENNEWICK, WA.
LOCATION. Lat 46°11'26", long 119°13'12", in NWsSW^ sec.8, T.8 N., R.29 E., Benton County, Hydrologic Unit 17030003,
at head of lateral, 1/4 mi east of west boundary of Kennewick.
GAGE. Staff gage. Elevation of gage is 880 ft, from topographic map.
REMARKS. Estimated daily discharges: May 23, Aug. 16-19, 1986, Apr. 3, 1987. Records fair. All flow is diversion
for irrigation from the Amon pump station, which distributes water to two other canals and one wasteway.
The pumping station is supplied by diversion from the Yakima River at Prosser, with the K.I.D. system beginning
at Chandler. There are two laterals and numerous turnouts between Chandler and the pumping station.
EXTREMES. Maximum daily discharge, 14 ft /s many days in June, July, and August, 1986; there is flow only during
irrigation season.
MEAN DISCHARGE (CUBIC FEET PER SECOND)
1987
DAY
1
2
3
4
5
6
7
8
9
10
11
12
13
14
15
16
17
18
19
20
21
22
23
24
25
26
27
28
29
30
31
TOTAL
MEAN
MAX
MIN
AC-FT
1986
MAR
0.00
.00
.00
.00
.00
.00
.00
.00
.00
.00
.00
.00
.00
.00
.00
.00
.00
.00
.00
.00
.00
.00
.00
.00
.00
.00
.00
.00
.00
.00
.00
.00
.00
.00
.00
.00
APR
0.00
.00
.00
2.3
2.9
2.9
2.9
4.3
5.0
6.5
6.3
6.5
6.3
6.3
7.3
8.2
7.7
7.7
8.0
8.9
7.7
7.6
7.6
7.6
8.1
8.1
8.1
8.1
8.1
6.3
177.30
5.91
8.9
.00
352
MAY
6.0
7.8
7.8
7.8
9.9
7.0
6.4
6.4
6.2
6.2
6.3
6.3
6.8
6.9
7.3
8.1
8.0
8.0
8.1
8.6
7.4
6.8
7.0
7.2
7.0
7.2
7.2
8.4
9.9
12
12
238.0
7.68
12
6.0
472
JUN
12
13
13
13
14
13
14
14
14
13
13
13
14
14
14
14
12
12
11
11
11
11
12
12
12
12
12
12
12
12
379
12.6
14
11
752
JUL
12
12
12
12
13
13
12
12
12
12
12
12
12
13
13
13
13
13
14
13
13
13
13
13
13
13
13
12
12
12
12
389
12.5
14
12
772
AUG
12
12
12
13
14
14
14
14
14
14
13
12
12
12
12
12
12
11
11
11
12
12
12
12
11
11
12
12
11
11
11
378
12.2
14
11
750
SEP
11
11
11
11
11
11
11
11
11
11
11
9.8
9.9
9.8
8.9
6.1
5.7
5.6
5.4
5.3
5.2
5.1
6.0
4.2
4.1
2.8
2.6
2.6
2.4
1.9
224.4
7.48
11
1.9
445
OCT
2.4
2.8
2.8
2.8
2.8
2.8
2.8
2.8
2.8
2.8
2.6
2.6
2.5
2.5
.00
.00
.00
.00
.00
.00
.00
.00
.00
.00
.00
.00
.00
.00
.00
.00
.00
37.80
1.22
2.8
.00
75
NOV DEC JAN FEE MAR
0.
1,
1.
1.
3.
.00
,00
,00
00
00
00
00
00
00
00
00
00
00
00
00
,00
00
,00
.00
.00
,00
,00
.00
,00
.00
.00
.00
.00
.00
.00
.7
.70
.05
.7
.00
,4
APR
2.5
2.9
2.9
2.9
2.9
4.4
6.1
7.0
7.0
7.3
7.2
7.2
6.7
7.3
114
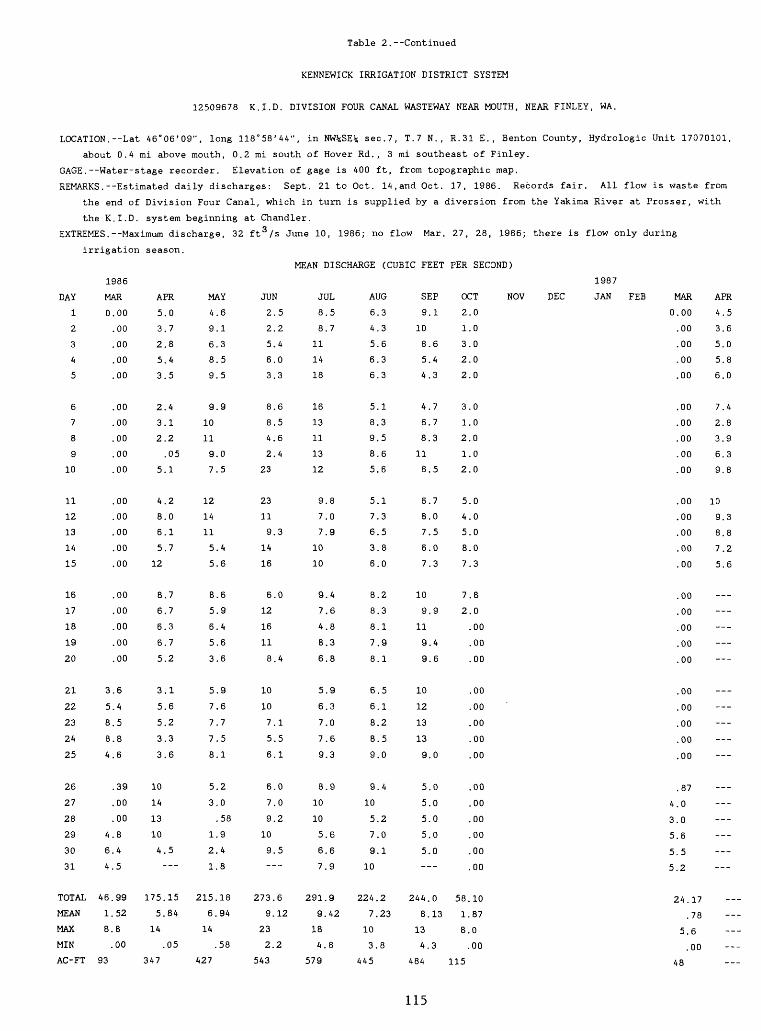
Table 2.--Continued
KENNEWICK IRRIGATION DISTRICT SYSTEM
12509678 K.I.D. DIVISION FOUR CANAL WASTEWAY NEAR MOUTH, NEAR FINLEY, WA.
LOCATION.--Lat 46°06'09", long 118°58'44", in NW%SE% sec.7, T.7 N., R.31 E., Benton County, Hydrologic Unit 17070101,
about 0.4 mi above mouth, 0.2 mi south of Hover Rd., 3 mi southeast of Finley.
GAGE.--Water-stage recorder. Elevation of gage is 400 ft, from topographic map.
REMARKS.--Estimated daily discharges: Sept. 21 to Oct. 14,and Oct. 17, 1986. Records fair. All flow is waste from
the end of Division Four Canal, which in turn is supplied by a diversion from the Yakima River at Prosser, with
the K.I.D. system beginning at Chandler.
EXTREMES.--Maximum discharge, 32 ft 3 /s June 10, 1986; no flow Mar. 27, 28, 1986; there is flow only during
irrigation season.
MEAN DISCHARGE (CUBIC FEET PER SECOND)
1987
DAY
1
2
3
4
5
6
7
8
9
10
11
12
13
14
15
16
17
18
19
20
21
22
23
24
25
26
27
28
29
30
31
TOTAL
MEAN
MAX
MIN
AC-FT
1986
MAR
0.00
.00
.00
.00
.00
.00
.00
.00
.00
.00
.00
.00
.00
.00
.00
.00
.00
.00
.00
.00
3.6
5.4
8.5
8.8
4.6
.39
.00
.00
4.8
6.4
4.5
46.99
1.52
8.8
.00
93
APR
5.
3.
2.
5.
3.
2.
3.
2.
5.
4.
8.
6.
5.
12
8.
6.
6.
6.
5.
3.
5.
5.
3.
3.
10
14
13
10
4.-
175.
5.
14
347
0
7
8
4
5
4
1
2
05
1
2
0
1
7
7
7
3
7
2
1
6
2
3
6
5--
15
84
05
MAY
4.
9
6.
8,
9,
9
10
11
9.
7,
12
14
11
5,
5
8
5
6
5
3
5
7
7
7,
8
5,
3
1,
2.
1.
215.
6.
14
427
.6
.1
.3
.5
.5
.9
.0
.5
.4
.6
.6
.9
.4
.6
.6
.9
.6
.7
.5
.1
.2
.0
.58
,9
,4
8
18
94
58
JUN
2
2
5
6
3
8
8
4
2
23
23
11
9
14
16
6
12
16
11
8
10
10
7
5
6
6
7
9
10
9-
273
9
23
2
543
.5
.2
.4
.0
.3
.6
.5
.6
.4
.3
.0
.4
.1
.5
.1
.0
.0
.2
.5--
.6
.12
.2
JUL
8,
8
11
14
18
16
13
11
13
12
9,
7
7
10
10
9
7
4
8
6
5
6
7
7
9
8
10
10
5,
6,
7.
291.
9.
18
4.
579
.5
.7
.8
.0
.9
.4
.6
.8
.3
.8
.9
.3
.0
.6
.3
.9
.6
.6
.9
9
42
8
AUG
6.3
4.3
5.6
6.3
6.3
5.1
8.3
9.5
8.6
5.6
5.1
7.3
6.5
3.8
6.0
8.2
8.3
8.1
7.9
8.1
6.5
6.1
8.2
8.5
9.0
9.4
10
5.2
7.0
9.1
10
224.2
7.23
10
3.8
445
SEP
9.1
10
8.6
5.4
4.3
4.7
6.7
8.3
11
8.5
6.7
8.0
7.5
6.0
7.3
10
9.9
11
9.4
9.6
10
12
13
13
9.0
5.0
5.0
5.0
5.0
5.0
244.0
8.13
13
4.3
484
OCT
2.0
1.0
3.0
2.0
2.0
3.0
1.0
2.0
1.0
2.0
5.0
4.0
5.0
8.0
7.3
7.8
2.0
.00
.00
.00
.00
.00
.00
.00
.00
.00
.00
.00
.00
.00
.00
58.10
1.87
8.0
.00
115
NOV DEC JAN FEE MAR
0
4
3
5,
5,
5,
.00
.00
.00
.00
.00
.00
.00
.00
.00
.00
.00
.00
.00
.00
.00
.00
.00
.00
.00
.00
.00
.00
.00
.00
.00
.87
.0
.0
.6
.5
.2
APR
4.5
3.6
5.0
5.8
6.0
7.4
2.8
3.9
6.3
9.8
10
9.3
8.8
7.2
5.6
___
---
24.17
.78
5.6
.00
--
--
--
48
115
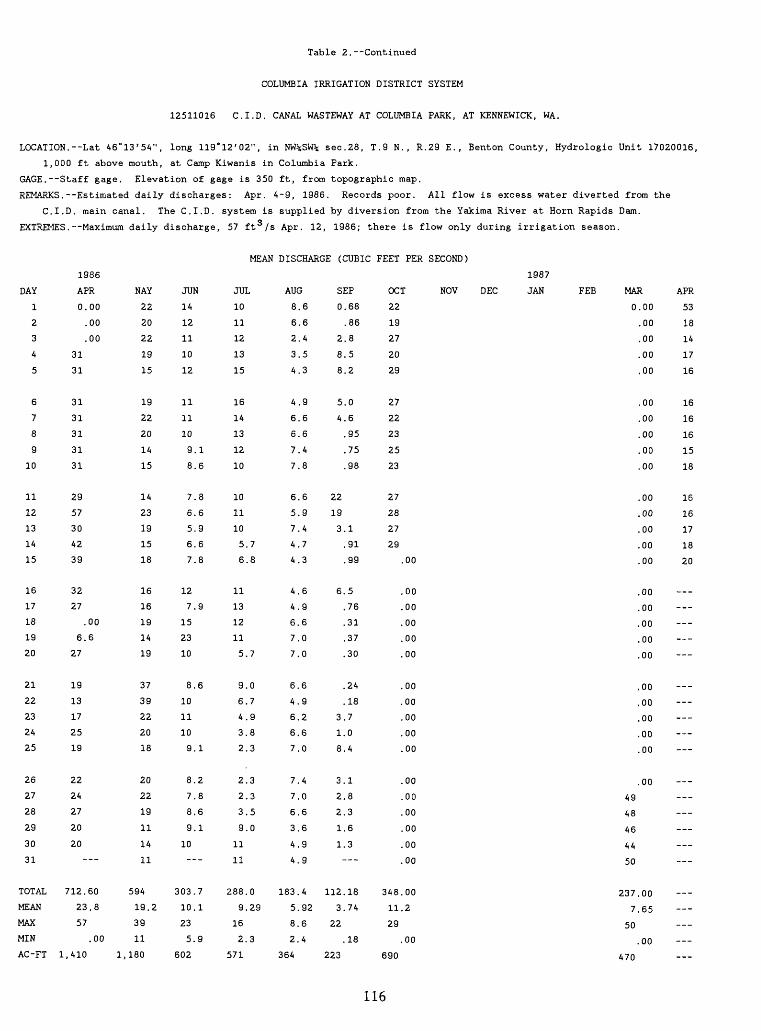
Table 2. Continued
COLUMBIA IRRIGATION DISTRICT SYSTEM
12511016 C.I.D. CANAL WASTEWAY AT COLUMBIA PARK, AT KENNEWICK, WA.
LOCATION.--Lat 46°13'54", long 119 8 12'02", in NW%SW% sec.28, T.9 N., R.29 E., Benton County, Hydrologic Unit 17020016,
1,000 ft above mouth, at Camp Kiwanis in Columbia Park.
GAGE.--Staff gage. Elevation of gage is 350 ft, from topographic map.
REMARKS.--Estimated daily discharges: Apr. 4-9, 1986. Records poor. All flow is excess water diverted from the
C.I.D. main canal. The C.I.D. system is supplied by diversion from the Yakima River at Horn Rapids Dam.
EXTREMES. Maximum daily discharge, 57 ft /s Apr. 12, 1986; there is flow only during irrigation season.
MEAN DISCHARGE (CUBIC FEET PER SECOND)
NOVDAY
1
2
3
4
5
6
7
8
9
10
11
12
13
14
15
16
17
18
19
20
21
22
23
24
25
26
27
28
29
30
31
TOTAL
MEAN
MAX
MIN
AC-FT
1986
APR
0.00
.00
.00
31
31
31
31
31
31
31
29
57
30
42
39
32
27
.00
6.6
27
19
13
17
25
19
22
24
27
20
20
712.60
23.8
57
.00
1,410
NAY
22
20
22
19
15
19
22
20
14
15
14
23
19
15
18
16
16
19
14
19
37
39
22
20
18
20
22
19
11
14
11
594
19.2
39
11
1,180
JUN
14
12
11
10
12
11
11
10
9.1
8.6
7.8
6.6
5.9
6.6
7.8
12
7.9
15
23
10
8.6
10
11
10
9.1
8.2
7.8
8.6
9.1
10
303.7
10.1
23
5.9
602
JUL
10
11
12
13
15
16
14
13
12
10
10
11
10
5.7
6.8
11
13
12
11
5.7
9.0
6.7
4.9
3.8
2.3
2.3
2.3
3.5
9.0
11
11
288.0
9.29
16
2.3
571
AUG
8.6
6.6
2.4
3.5
4.3
4.9
6.6
6.6
7.4
7.8
6.6
5.9
7.4
4.7
4.3
4.6
4.9
6.6
7.0
7.0
6.6
4.9
6.2
6.6
7.0
7.4
7.0
6.6
3.6
4.9
4.9
183.4
5.92
8.6
2.4
364
SEP
0.68
.86
2.8
8.5
8.2
5.0
4.6
.95
.75
.98
22
19
3.1
.91
.99
6.5
.76
.31
.37
.30
.24
.18
3.7
1.0
8.4
3.1
2.8
2.3
1.6
1.3
112.18
3.74
22
.18
223
OCT
22
19
27
20
29
27
22
23
25
23
27
28
27
29
.00
.00
.00
.00
.00
.00
.00
.00
.00
.00
.00
.00
.00
.00
.00
.00
.00
348.00
11.2
29
.00
690
DEC
1987
JAN FEE MAR
0
49
48
46
44
50
237.
7.
50
470
.00
.00
.00
.00
.00
.00
.00
.00
.00
.00
.00
.00
.00
.00
.00
,00
,00
,00
,00
.00
,00
,00
,00
.00
,00
,00
,00
65
00
APR
53
18
14
17
16
16
16
16
15
18
16
16
17
18
20
___
___
116
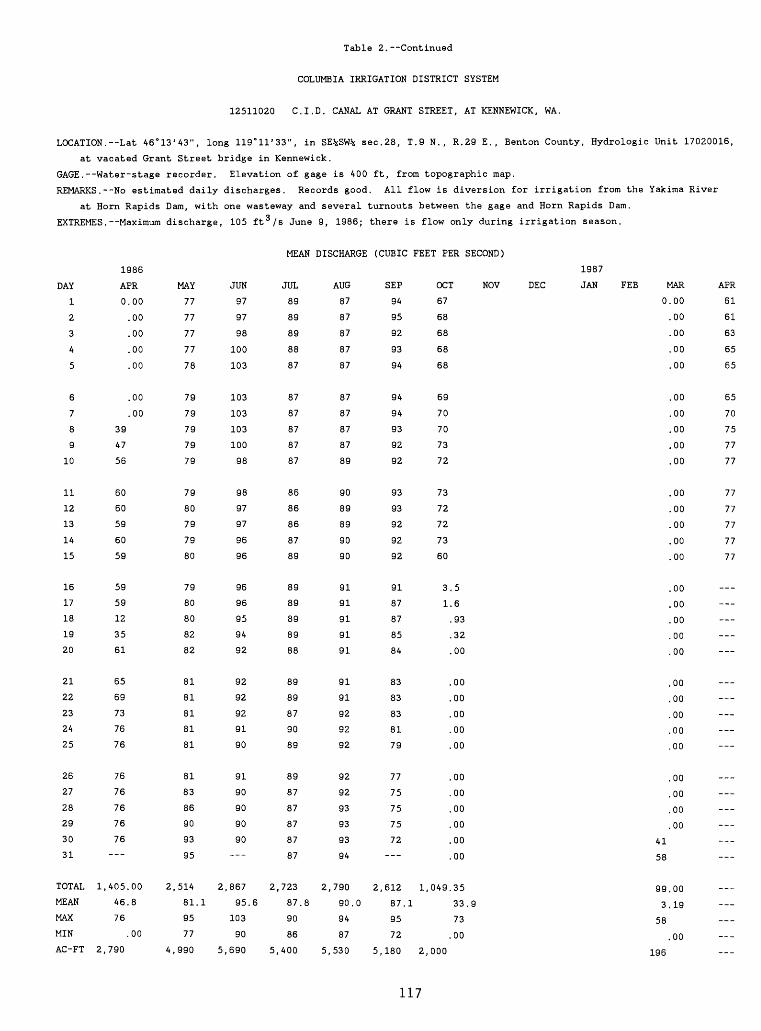
Table 2. Continued
COLUMBIA IRRIGATION DISTRICT SYSTEM
12511020 C.I.D. CANAL AT GRANT STREET, AT KENNEWICK, WA.
LOCATION.--Lat 46°13'43", long 119 0 11'33", in SE^SW^ sec.28, T.9 N., R.29 E., Benton County, Hydrologic Unit 17020016,
at vacated Grant Street bridge in Kennewick.
GAGE . Water-stage
REMARKS
recorder.
.--No estimated daily
at Horn Rapids
EXTREMES . --Maximum
DAY
1
2
3
A
5
6
7
8
9
10
11
12
13
1A
15
16
17
18
19
20
21
22
23
2A
25
26
27
28
29
30
31
TOTAL
MEAN
MAX
MIN
AC-FT
1986
APR
0.00
.00
.00
.00
.00
.00
.00
39
A7
56
60
60
59
60
59
59
59
12
35
61
65
69
73
76
76
76
76
76
76
76___
1,405.00
46. 8
76
.00
2,790
Dam, with
discharge,
MAY
77
77
77
77
78
79
79
79
79
79
79
80
79
79
80
79
80
80
82
82
81
81
81
81
81
81
83
86
90
93
95
2,514 2
81.1
95
77
4,990 5
Elevation
discharges
of gage is AOO
Records good
one wasteway and
105 ft 3 /s June
JUN
97
97
98
100
103
103
103
103
100
98
98
97
97
96
96
96
96
95
9A
92
92
92
92
91
90
91
90
90
90
90
,867 2,
95.6
103
90
,690 5,
MEAN
JUL
89
89
89
88
87
87
87
87
87
87
86
86
86
87
89
89
89
89
89
88
89
89
87
90
89
89
87
87
87
87
87
723
87.8
90
86
400
several
9, 1986;
DISCHARGE
AUG
87
87
87
87
87
87
87
87
87
89
90
89
89
90
90
91
91
91
91
91
91
91
92
92
92
92
92
93
93
93
94
2,790
90.0
94
87
5,530
ft, from topographic ma]
. All flow is diversion
turnouts between the gagi
there is flow only durin
(CUBIC
SEP
94
95
92
93
94
94
94
93
92
92
93
93
92
92
92
91
87
87
85
84
83
83
83
81
79
77
75
75
75
72
2,612
87.
95
72
5,180
FEET PER SECOND)
OCT NOV
67
68
68
68
68
69
70
70
73
72
73
72
72
73
60
3.5
1.6
.93
.32
.00
.00
.00
.00
.00
.00
.00
.00
.00
.00
.00
.00
1,049.35
1 33.9
73
.00
2,000
DEC
1987
JAN FEE MAR
0.00
.00
.00
.00
.00
.00
.00
.00
.00
.00
.00
.00
.00
.00
.00
.00
.00
.00
.00
.00
.00
.00
.00
.00
.00
.00
.00
.00
.00
41
58
99.00
3.19
58
.00
196
APR
61
61
63
65
65
65
70
75
77
77
77
77
77
77
77
___
---
...
...
___
___
___
117

Table 2. Continued
COLUMBIA IRRIGATION DISTRICT SYSTEM
12511030 C.I.D. No.2 CANAL AT HEAD, AT KENNEWICK, WA.
LOCATION.--Lat 46°12'07", long 119°06'28", in NE^SWJj sec.6, T.8 N., R.30 E., Benton County, Hydrologic Unit 17020016,
500 ft west of Gum St. in Kennewick.
GAGE.--Staff gage. Elevation of gage is 390 ft, from topographic map.
REMARKS.--Estimated daily discharges: Apr.10, Apr. 12 to May 1, May 3-10, Oct. 16, 1986, Apr. 1-3, 1987. All flow
is diversion for irrigation from the C.I.D. main canal. The C.I.D. system is supplied by diversion from the
Yakima River at Horn Rapids Dam.
EXTREMES.--Maximum daily discharge, 37 ft 3 /s June 19, Aug.11, 1986; there is flow only during irrigation season.
MEAN DISCHARGE (CUBIC FEET PER SECOND)
1987
NOV DEC JAN FEE MAR APR
0.00 20
.00 20
.00 21
.00 23
.00 23
.00 21
.00 21
.00 25
.00 25
.00 26
.00 26
.00 26
.00 26
.00 23
.00 2A
.00
.00
.00
.00
.00
.00
.00
.00
.00
.00
.00
.00
.00
.00
.00
15
15.00
.48
15
.00
30
118
DAY
1
2
3
4
5
6
7
8
9
10
11
12
13
14
15
16
17
18
19
20
21
22
23
24
25
26
27
28
29
30
31
TOTAL
MEAN
MAX
MIN
AC-FT
1986
APR
0.00
.00
.00
.00
.00
.00
.00
.00
.00
8.0
16
23
22
23
22
22
22
4.5
13
23
25
26
28
29
29
29
29
29
29
29_.._
480.50
16.0
29
.00
953
MAY
29
29
29
29
29
30
30
30
30
30
27
28
28
28
28
28
29
31
31
31
34
34
34
33
33
33
33
33
34
33
32
950
30.6
34
27
1,880
JUN
32
32
33
34
35
35
35
36
35
35
35
35
35
35
36
36
36
36
37
36
36
36
36
36
35
35
36
36
36
36---
1,057
35.2
37
32
2,100
JUL
35
35
35
36
36
35
35
34
34
35
34
35
35
34
35
35
35
35
35
34
34
34
33
35
36
35
35
35
35
36
36
1,081
34.9
36
33
2,140
AUG
36
36
36
36
36
36
36
36
36
35
37
36
36
36
36
35
35
35
35
35
36
36
35
35
36
36
35
35
36
36
36
1,107
35.7
37
35
2,200
SEP
36
36
34
34
36
35
35
35
35
34
35
35
35
35
35
36
36
34
34
33
32
33
32
33
30
30
27
26
26
26
993
33.1
36
26
1,970
OCT
25
25
26
26
24
24
26
26
27
27
27
27
27
27
27
14
405
13,
27
803
.00
.00
.00
.00
.00
.00
.00
.00
.00
.00
.00
.00
.00
.00
.00
.00
.1
.00

Table 2. Continued
COLUMBIA IRRIGATION DISTRICT SYSTEM
12511034 C.I.D. No.2 CANAL WASTEWAY, NEAR FINLEY, WA.
LOCATION.--Lat 46°10'55", long 119°01'47", in NW%NW% sec.14, T.8 N., R.30 E., Benton County, Hydrologic Unit 17070101,
1986, Mar. 31, Apr. 2, 3, 1987. Records
C.I.D. system is supplied by diversion
5, and June 1, 1986; there is flow only
ND)
1987
2 mi north of Finley.
GAGE. --Staff gage. Elevation of gage is 360 ft, from topographic map.
REMARKS. --Estimated daily discharges: Apr. 11-13, 22-25, June 11, Oct.
poor. All flow is excess water diverted from C.I.D. No. 2 canal,
from the Yakima River at Horn Rapids Dam.
EXTREMES. --Maximum daily discharge, 21 ft 3 /s Aug. 19, 1986; no flow Ma>
during irrigation season.
MEAN DISCHARGE (CUBIC FEET PER
1986
DAY
1
2
3
4
5
6
7
8
9
10
11
12
13
14
15
16
17
18
19
20
21
22
23
24
25
26
27
28
29
30
31
TOTAL
MEAN
MAX
MIN
AC -FT
APR
0.00
.00
.00
.00
.00
.00
.00
.00
.00
.00
1.0
2.0
3.0
3.4
4.5
8.0
8.8
1.5
1.5
8.0
4.2
1.5
1.5
8.0
8.0
1.0
1.1
2.5
2.5
2.1
74.10
2.47
8.8
.00
147
MAY
2
1
4
4
4
4
2
4
4
2
4
4
4
3
3
4
3
4
4
4
3
2
1
2,
2.
1,
84.
2.
4.
168
.4
.1
.02
.00
.00
.7
.1
.1
.1
.4
.1
.3
.4
.1
.1
.1
.1
.1
.1
.1
.1
.3
.1
.1
.4
.3
.03
.3
.4
,2
,02
,67
73
7
00
JUN
0.
3.
5.
3.
5.
5.
8.
4.
4.
4.
4.
5.
5.
5.
5.
5.
5.
4.
4.
4.
4.
5.
3.
2.
3.
4.
3.
5.
4.-
129.
4.
8.
258
00
44
0
3
1
3
3
4
2
3
6
8
3
3
3
3
3
3
7
1
1
5
3
3
4
6
1
9
3
1
94
33
4
00
JUL
3.
3.
4.
6.
8.
8.
4.
4.
5.
5.
5.
5.
5.
5.
4.
4.
5.
5.
5.
3.
4.
3.
2.
3.
3.
3.
3.
3.
3.
4.
4.
140.
1
1
5
3
5
5
2
1
0
0
0
3
3
3
5
5
3
0
3
1
1
3
9
6
9
1
1
9
9
1
1
9
4.55
8.5
2.9
279
AUG
4.1
4.1
4.1
3.1
3.1
1.2
1.8
1.8
2.4
1.5
3.1
2.4
1.8
2.9
3.1
4.1
4.1
4.1
21
4.6
4.0
4.1
3.1
3.1
3.1
2.2
1.9
2.7
3.1
5.3
5.3
116.3
3.75
21
1.2
231
SEP
4.1
4.1
4.1
4.1
4.7
5.3
5.3
4.7
4.1
4.1
4.1
3.6
3.1
6.6
5.3
5.3
8.4
5.4
8.8
5.6
5.6
5.7
4.3
5.0
4.3
7.7
5.2
5.1
5.3
6.3
155.3
5.18
8.8
3.1
308
OCT
4
3
3
2
1,
2
3,
2
3,
3,
3
3
6
6
8
4
61.
1.
8.
122
.5
.3
.3
.4
.8
.4
.3
.4
,3
,4
.4
.4
.2
.4
.1
.0
.00
.00
.00
.00
.00
.00
.00
.00
.00
.00
.00
,00
,00
,00
,00
.60
99
1
00
NOV DEC JAN FEE MAR
0
1
1.
1.
3.
.00
.00
.00
.00
.00
.00
.00
.00
.00
,00
.00
.00
.00
.00
.00
.00
.00
.00
.00
.00
.00
.00
.00
.00
.00
.00
.00
.00
.00
.00
.7
.70
.05
7
00
4
APR
3.4
6.0
9.0
12
7.6
4.1
1.3
7.6
9.8
7.6
7.6
12
7.6
7.6
7.6
7.6
___
___
119

Table 2. Continued
COLUMBIA IRRIGATION DISTRICT SYSTEM
12511038 C.I.D. No.2 CANAL AT END, NEAR FINLEY, WA.
LOCATION.--Lat 46°09'53", long 119°00'55", in NE%NE% sec.23, T.8 N., R.30 E., Benton County, Hydrologic Unit 17070101,
: map.
from diversion for irrigation,
rn Rapids Dam.
pr. 13, 17-20, 1986; there is flow only
)ND)
1987
1 mi northeast of Finley.
GAGE. --Water- stage recorder. Elevation of gage is 360 ft, from topogra
REMARKS. No estimated daily discharges. Records fair. All flow is wa
The C.I.D. system is supplied by diversion from the Yakima River at
EXTREMES. --Maximum discharge, 9.0 ft 3 /s May 6 and Oct. 16, 1986; no fl<
during irrigation season.
MEAN DISCHARGE (CUBIC FEET PER
1986
DAY
1
2
3
4
5
6
7
8
9
10
11
12
13
14
15
16
17
18
19
20
21
22
23
24
25
26
27
28
29
30
31
TOTAL
MEAN
MAX
MIN
AC -FT
APR
0.00
.00
.00
.00
.00
.00
.00
.00
.00
.00
.59
1.1
2.4
2.8
2.7
2.6
1.6
.00
.00
.92
1.6
2.0
3.1
4.1
4.3
5.5
6.0
5.6
5.8
5.4
58.11
1.94
6.0
.00
115
MAY
4.
3.
3.
3.
4.
7,
6.
5.
3.
4,
3.
3.
4.
4.
3.
3.
3.
3.
3.
3.
4,
5.
6,
5,
5,
4,
3,
2
2.
2.
2
130.
4.
7,
2.
259
.2
.8
.2
.3
.3
.4
.9
.8
.9
.0
.7
,7
.2
.6
,8
.8
.8
.6
.8
.6
.1
.0
.1
.3
.1
.8
.8
.8
.8
.7
.6
.5
.21
,4
,6
JUN
2.
3.
3.
3.
3.
4.
3.
3.
4.
3.
3.
3.
3.
3.
3.
4.
3.
3.
3.
3.
3.
3.
4.
4.
3.
3.
4.
4.
5.
4.
114.
3.
5.
2.
228
8
3
5
8
9
3
8
6
0
5
6
3
3
6
9
0
7
4
5
7
8
8
5
0
7
6
3
5
5
7-
9
83
5
8
JUL
4
4
4
6,
6.
4,
3.
3.
3.
3.
3.
2.
3.
2.
2.
2.
2.
2.
2.
2.
2,
2.
2,
2
2
2
3
3
3,
2,
2
104
3.
6.
2.
206
.6
.6
,6
.0
,4
.8
.9
.8
.1
.2
.3
.9
.3
.9
.8
.6
.7
.6
.7
.6
.7
.8
.7
.5
.6
.9
.0
.1
.1
.8
.5
,1
.36
.4
,5
AUG
2.4
2.4
2.4
2.4
2.3
2.3
2.5
2.7
3.0
3.4
3.5
2.9
2.9
2.9
2.4
2.6
2.9
2.9
2.8
3.0
3.1
2.9
2.6
2.6
2.5
2.3
2.4
2.3
2.6
3.0
2.9
83.8
2.70
3.5
2.3
166
SEP
2.7
2.7
2.9
2.5
2.5
2.4
2.3
2.9
3.9
4.6
4.9
4.9
5.3
5.5
5.5
5.8
6.4
6.1
6.2
6.4
6.7
6.1
6.0
6.5
6.4
6.3
5.5
5.8
5.6
6.3
147.6
4.92
6.7
2.3
293
OCT fl
6,
7,
7.
7.
6.
5.
5.
4.
5.
5,
5.
5.
6.
6.
7.
2.
97,
3,
7.
194
.6
.5
.9
.6
.5
.7
.2
,8
,6
.7
.4
,9
,7
.7
.1
.7
.00
.00
.00
.00
.00
.00
.00
.00
.00
.00
.00
.00
.00
,00
.00
.60
.15
.9
.00
NOV DEC JAN FEE MAR
0,
1
1
1,
3,
.00
.00
.00
.00
.00
.00
.00
.00
.00
.00
.00
.00
.00
.00
.00
,00
.00
.00
.00
.00
.00
.00
.00
.00
.00
.00
.00
.00
.00
.00
.6
.60
.05
.6
.00
,2
APR
5.1
3.0
2.5
3.7
5.0
3.8
3.2
3.4
2.9
3.0
3.8
3.7
3.3
3.0
2.8
3.1
---
120

Table 2. Continued
COLUMBIA IRRIGATION DISTRICT SYSTEM
12511040 C.I.D. No.3 CANAL AT HEAD, AT KENNEWICK, WA.
LOCATION.--Lat 46°12'01", long 119°06'47", in SW%SW% sec.6, T.8 N., R.30 E., Benton County, Hydrologic Unit 17020016,
20 ft below headgate for siphon to C.I.D. No. 2 and C.I.D. No.l canals, 700 ft east of Washington St. in Kennewick.
GAGE.--Staff gage. Elevation of gage is 390 ft, from topographic map.
REMARKS. Estimated daily discharges: Apr. 9, 11-14, 19, 22, 23, 1986, Apr. 1-3, 1987. Records fair. All flow is
diversion for irrigation. The C.I.D. system is supplied by a diversion from the Yakima River at Horn Rapids Dam.
EXTREMES.--Maximum daily discharge, 46 ft 3 /s June 19, 1986; there is flow only during irrigation season.
MEAN DISCHARGE (CUBIC FEET PER SECOND)
DAY
1
2
3
4
5
6
7
8
9
10
11
12
13
14
15
16
17
18
19
20
21
22
23
24
25
26
27
28
29
30
31
TOTAL
MEAN
MAX
MIN
AC-FT
1986
APR
0.00
.00
.00
.00
.00
.00
.00
.00
14
27
26
26
25
26
32
32
32
31
15
31
35
29
31
29
33
33
33
31
31
31
633.00
21.1
35
.00
1260
MAY
31
31
32
32
31
31
31
31
31
31
36
33
33
33
34
34
34
33
34
35
43
37
37
38
36
35
29
36
36
37
35
1,050
33.9
43
29
2,080
JUN
38
36
31
29
37
37
38
37
37
34
38
39
39
40
42
42
42
42
46
40
42
44
40
39
37
37
38
38
42
42
1,163
38.8
46
29
2,310
JUL
42
39
41
42
42
41
40
37
35
36
37
35
35
35
37
38
40
37
35
35
32
36
35
41
41
41
41
41
38
40
40
1,185
38.2
42
32
2,350
AUG
40
40
41
41
40
37
37
37
36
37
41
40
40
39
36
37
36
35
36
36
38
38
38
38
36
36
34
35
36
37
35
1,163
37.5
41
34
2,310
SEP
32
31
28
28
31
31
31
30
34
32
32
33
32
31
31
30
31
31
31
28
28
28
25
28
28
29
27
28
28
28
895
29.8
34
25
1,780
OCT
20
20
20
21
23
24
23
24
26
26
26
26
26
25
26
13
.00
.00
.00
.00
.00
.00
.00
.00
.00
.00
.00
.00
.00
.00
.00
369.00
11.9
26
.00
732
NOV DEC
1987
JAN FEE MAR
0.00
.00
.00
.00
.00
.00
.00
.00
.00
.00
.00
.00
.00
.00
.00
.00
.00
.00
.00
.00
.00
.00
.00
.00
.00
.00
.00
.00
.00
15
30
45.00
1.45
30
.00
89
APR
26
26
26
33
33
33
31
35
31
29
29
29
29
29
29
29
___
121
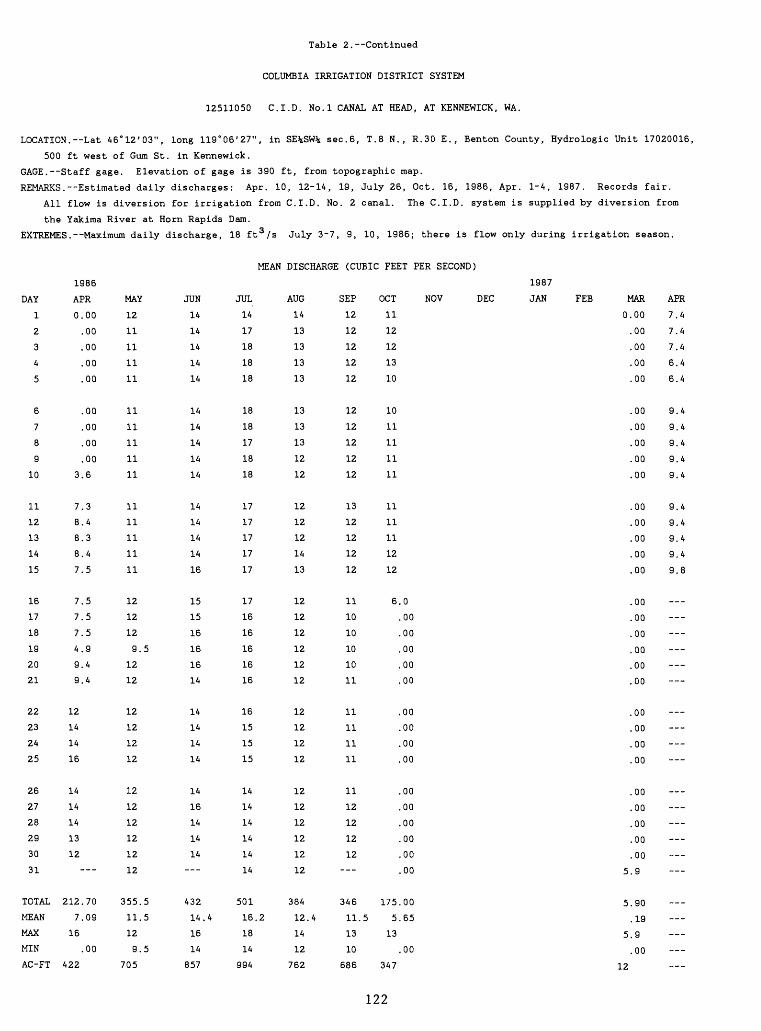
Table 2. Continued
COLUMBIA IRRIGATION DISTRICT SYSTEM
12511050 C.I.D. No.l CANAL AT HEAD, AT KENNEWICK, WA.
LOCATION.--Lat 46°12'03", long 119°06'27", in SE%SW% sec.6, T.8 N., R.30 E., Benton County, Hydrologic Unit 17020016,
500 ft west of Gum St. in Kennewick.
GAGE. Staff gage. Elevation of gage is 390 ft, from topographic map.
REMARKS.--Estimated daily discharges: Apr. 10, 12-14, 19, July 26, Oct. 16, 1986, Apr. 1-4, 1987. Records fair.
All flow is diversion for irrigation from C.I.D. No. 2 canal. The C.I.D. system is supplied by diversion from
the Yakima River at Horn Rapids Dam.
EXTREMES. Maximum daily discharge, 18 ft /s July 3~7, 9, 10, 1986; there is flow only during irrigation season.
MEAN DISCHARGE (CUBIC FEET PER SECOND)
NOV DEC
1986
DAY
1
2
3
4
5
6
7
8
9
10
11
12
13
14
15
16
17
18
19
20
21
22
23
24
25
26
27
28
29
30
31
TOTAL
MEAN
MAX
MIN
AC-FT
APR
0.
3.
7.
8.
8.
8.
7.
7.
7.
7.
4.
9.
9.
12
14
14
16
14
14
14
13
12-
212.
7.
16
422
00
00
00
00
00
00
00
00
00
6
3
4
3
4
5
5
5
5
9
4
4
--
70
09
00
MAY
12
11
11
11
11
11
11
11
11
11
11
11
11
11
11
12
12
12
9.5
12
12
12
12
12
12
12
12
12
12
12
12
355.5
11.5
12
9.5
705
JUN
14
14
14
14
14
14
14
14
14
14
14
14
14
14
16
15
15
16
16
16
14
14
14
14
14
14
16
14
14
14
432
14.4
16
14
857
JUL
14
17
18
18
18
18
18
17
18
18
17
17
17
17
17
17
16
16
16
16
16
16
15
15
15
14
14
14
14
14
14
501
16.2
18
14
994
AUG
14
13
13
13
13
13
13
13
12
12
12
12
12
14
13
12
12
12
12
12
12
12
12
12
12
12
12
12
12
12
12
384
12.4
14
12
762
SEP
12
12
12
12
12
12
12
12
12
12
13
12
12
12
12
11
10
10
10
10
11
11
11
11
11
11
12
12
12
12
346
11.5
13
10
686
OCT
11
12
12
13
10
10
11
11
11
11
11
11
11
12
12
6,
175
5
13
347
.0
.00
.00
.00
,00
,00
,00
.00
.00
,00
.00
.00
.00
.00
.00
.00
.00
.65
.00
1987
JAN FEE MAR
0.00
.00
.00
.00
.00
APR
7.4
7.4
7.4
6.4
6.4
.00 9.4
.00 9.4
.00 9.4
.00 9.4
.00 9.4
.00 9.4
.00 9.4
.00 9.4
.00 9.4
.00 9.8
.00
.00
.00
.00
.00
.00
.00
.00
.00
.00
.00
.00
.00
.00
.00
5.9
5.90
.19
5.9
.00
12
122
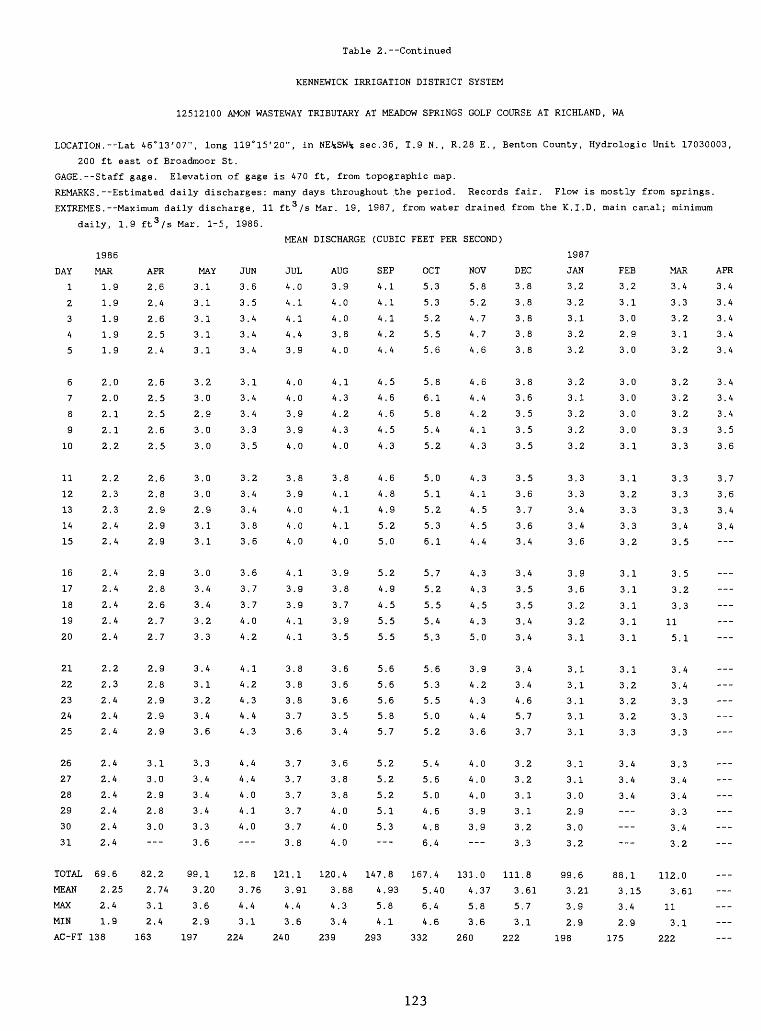
Table 2.--Continued
KENNEWICK IRRIGATION DISTRICT SYSTEM
12512100 AMON WASTEWAY TRIBUTARY AT MEADOW SPRINGS GOLF COURSE AT RICHLAND, WA
200 ft east of Broadmoor St.
GAGE. --Staff gage. Elevation of gage is 470 ft, from topographic map.
REMARKS. Estimated daily discharges: many days throughout the period. Records fair. Flow is
EXTREMES. --Maximum daily discharge. 11 ft 3 /s Mar. 19, 1987, from water drained from the K.I.D.
daily, 1.9 ft 3 /s Mar. 1-5, 1986.
MEAN DISCHARGE (CUBIC FEET PER SECOND)
DAY
1
2
3
4
5
6
7
8
9
10
11
12
13
14
15
16
17
18
19
20
21
22
23
24
25
26
27
28
29
30
31
TOTAL
MEAN
MAX
MIN
AC -FT
1986
MAR
1.9
1.9
1.9
1.9
1.9
2.0
2.0
2.1
2.1
2.2
2.2
2.3
2.3
2.4
2.4
2.4
2.4
2.4
2.4
2.4
2.2
2.3
2.4
2.4
2.4
2.4
2.4
2.4
2.4
2.4
2.4
69.6
2.25
2.4
1.9
138
APR
2.6
2.4
2.6
2.5
2.4
2.6
2.5
2.5
2.6
2.5
2.6
2.8
2.9
2.9
2.9
2.9
2.8
2.6
2.7
2.7
2.9
2.8
2.9
2.9
2.9
3.1
3.0
2.9
2.8
3.0
82.2
2.74
3.1
2.4
163
MAY
3.1
3.1
3.1
3.1
3.1
3.2
3.0
2.9
3.0
3.0
3.0
3.0
2.9
3.1
3.1
3.0
3.4
3.4
3.2
3.3
3.4
3.1
3.2
3.4
3.6
3.3
3.4
3.4
3.4
3.3
3.6
99.1
3.20
3.6
2.9
197
JUN
3.6
3.5
3.4
3.4
3.4
3.1
3.4
3.4
3.3
3.5
3.2
3.4
3.4
3.8
3.6
3.6
3.7
3.7
4.0
4.2
4.1
4.2
4.3
4.4
4.3
4.4
4.4
4.0
4.1
4.0---
12.8
3.76
4.4
3.1
224
JUL
4.0
4.1
4.1
4.4
3.9
4.0
4.0
3.9
3.9
4.0
3.8
3.9
4.0
4.0
4.0
4.1
3.9
3.9
4.1
4.1
3.8
3.8
3.8
3.7
3.6
3.7
3.7
3.7
3.7
3.7
3.8
121.1
3.91
4.4
3.6
240
AUG
3.9
4.0
4.0
3.8
4.0
4.1
4.3
4.2
4.3
4.0
3.8
4.1
4.1
4.1
4.0
3.9
3.8
3.7
3.9
3.5
3.6
3.6
3.6
3.5
3.4
3.6
3.8
3.8
4.0
4.0
4.0
120.4
3.88
4.3
3.4
239
SEP
4.1
4.1
4.1
4.2
4.4
4.5
4.6
4.6
4.5
4.3
4.6
4.8
4.9
5.2
5.0
5.2
4.9
4.5
5.5
5.5
5.6
5.6
5.6
5.8
5.7
5.2
5.2
5.2
5.1
5.3
147.8
4.93
5.8
4.1
293
OCT
5.3
5.3
5.2
5.5
5.6
5.8
6.1
5.8
5.4
5.2
5.0
5.1
5.2
5.3
6.1
5.7
5.2
5.5
5.4
5.3
5.6
5.3
5.5
5.0
5.2
5.4
5.6
5.0
4.6
4.8
6.4
167.4
5.40
6.4
4.6
332
NOV
5.8
5.2
4.7
4.7
4.6
4.6
4.4
4.2
4.1
4.3
4.3
4.1
4.5
4.5
4.4
4.3
4.3
4.5
4.3
5.0
3.9
4.2
4.3
4.4
3.6
4.0
4.0
4.0
3.9
3.9
131.0
4.37
5.8
3.6
260
DEC
3.8
3.8
3.8
3.8
3.8
3.8
3.6
3.5
3.5
3.5
3.5
3.6
3.7
3.6
3.4
3.4
3.5
3.5
3.4
3.4
3.4
3.4
4.6
5.7
3.7
3.2
3.2
3.1
3.1
3.2
3.3
111.8
3.61
5.7
3.1
222
1987
JAN
3.2
3.2
3.1
3.2
3.2
3.2
3.1
3.2
3.2
3.2
3.3
3.3
3.4
3.4
3.6
3.9
3.6
3.2
3.2
3.1
3.1
3.1
3.1
3.1
3.1
3.1
3.1
3.0
2.9
3.0
3.2
99.6
3.21
3.9
2.9
198
mostly from springs,
main canal; minimum
FEE
3.2
3.1
3.0
2.9
3.0
3.0
3.0
3.0
3.0
3.1
3.1
3.2
3.3
3.3
3.2
3.1
3.1
3.1
3.1
3.1
3.1
3.2
3.2
3.2
3.3
3.4
3.4
3.4
88.1
3.15
3.4
2.9
175
MAR
3.4
3.3
3.2
3.1
3.2
3.2
3.2
3.2
3.3
3.3
3.3
3.3
3.3
3.4
3.5
3.5
3.2
3.3
11
5.1
3.4
3.4
3.3
3.3
3.3
3.3
3.4
3.4
3.3
3.4
3.2
112.0
3.61
11
3.1
222
APR
3.4
3.4
3.4
3.4
3.4
3.4
3.4
3.4
3.5
3.6
3.7
3.6
3.4
3.4
___
___
123
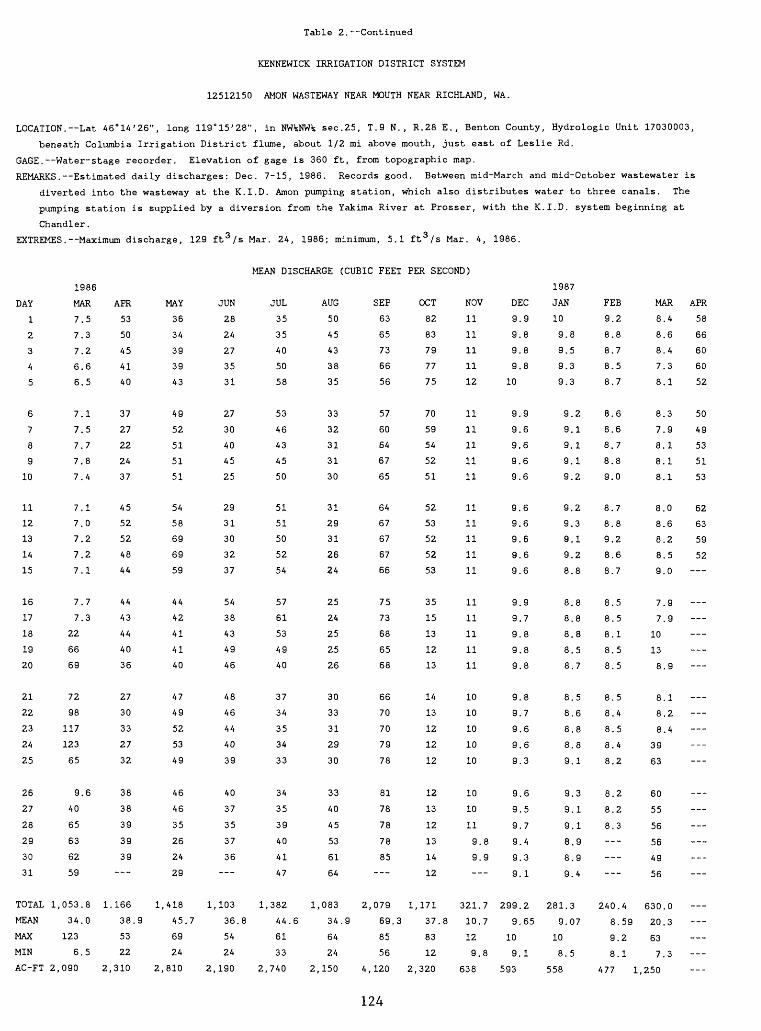
Table 2. Continued
KENNEWICK IRRIGATION DISTRICT SYSTEM
12512150 AMON WASTEWAY NEAR MOUTH NEAR RICHLAND, WA.
LOCATION.--Lat 46°14'26", long 119°15'28", in NW^NWi sec.25, T.9 N., R.28 E., Benton County, Hydrologic Unit 17030003,
beneath Columbia Irrigation District flume, about 1/2 mi above mouth, just east of Leslie Rd.
GAGE. Water-stage recorder. Elevation of gage is 360 ft, from topographic map.
REMARKS. Estimated daily discharges: Dec. 7-15, 1986. Records good. Between mid-March and mid-October wastewater is
diverted into the wasteway at the K.I.D. Amon pumping station, which also distributes water to three canals. The
pumping station is supplied by a diversion from the Yakima River at Prosser, with the K.I.D. system beginning at
Chandler.
EXTREMES.--Maximum discharge, 129 ft 3 /s Mar. 24, 1986; minimum, 5.1 ft 3 /s Mar. 4, 1986.
MEAN DISCHARGE (CUBIC FEET PER SECOND)
DAY
1
2
3
4
5
6
7
8
9
10
11
12
13
14
15
16
17
18
19
20
21
22
23
24
25
26
27
28
29
30
31
TOTAL
MEAN
MAX
MIN
AC-FT
1986
MAR
7.5
7.3
7.2
6.6
6.5
7.1
7.5
7.7
7.8
7.4
7.1
7.0
7.2
7.2
7.1
7.7
7.3
22
66
69
72
98
117
123
65
9.6
40
65
63
62
59
1,053.8
34.0
123
6.5
2,090
APR
53
50
45
41
40
37
27
22
24
37
45
52
52
48
44
44
43
44
40
36
27
30
33
27
32
38
38
39
39
39
1.166
38.9
53
22
2,310
MAY
36
34
39
39
43
49
52
51
51
51
54
58
69
69
59
44
42
41
41
40
47
49
52
53
49
46
46
35
26
24
29
1,418
45.7
69
24
2,810
JUN
28
24
27
35
31
27
30
40
45
25
29
31
30
32
37
54
38
43
49
46
48
46
44
40
39
40
37
35
37
36
1,103
36.8
54
24
2,190
JUL
35
35
40
50
58
53
46
43
45
50
51
51
50
52
54
57
61
53
49
40
37
34
35
34
33
34
35
39
40
41
47
1,382
44.6
61
33
2,740
AUG
50
45
43
38
35
33
32
31
31
30
31
29
31
26
24
25
24
25
25
26
30
33
31
29
30
33
40
45
53
61
64
1,083
34.9
64
24
2,150
SEP
63
65
73
66
56
57
60
64
67
65
64
67
67
67
66
75
73
68
65
68
66
70
70
79
78
81
78
78
78
85
2,079
69.
85
56
4,120
124
OCT
82
83
79
77
75
70
59
54
52
51
52
53
52
52
53
35
15
13
12
13
14
13
12
12
12
12
13
12
13
14
12
1,171
3 37.8
83
12
2,320
NOV
11
11
11
11
12
11
11
11
11
11
11
11
11
11
11
11
11
11
11
11
10
10
10
10
10
10
10
11
9.8
9.9
321.7
10.7
12
9.8
638
DEC
9.9
9.8
9.8
9.8
10
9.9
9.6
9.6
9.6
9.6
9.6
9.6
9.6
9.6
9.6
9.9
9.7
9.8
9.8
9.8
9.8
9.7
9.6
9.6
9.3
9.6
9.5
9.7
9.4
9.3
9.1
299.2
9.65
10
9.1
593
1987
JAN
10
9.8
9.5
9.3
9.3
9.2
9.1
9.1
9.1
9.2
9.2
9.3
9.1
9.2
8.8
8.8
8.8
8.8
8.5
8.7
8.5
8.6
8.8
8.8
9.1
9.3
9.1
9.1
8.9
8.9
9.4
281.3
9.07
10
8.5
558
FEE
9.2
8.8
8.7
8.5
8.7
8.6
8.6
8.7
8.8
9.0
8.7
8.8
9.2
8.6
8.7
8.5
8.5
8.1
8.5
8.5
8.5
8.4
8.5
8.4
8.2
8.2
8.2
8.3
240.4
8.59
9.2
8.1
477 1
MAR
8.4
8.6
8.4
7.3
8.1
8.3
7.9
8.1
8.1
8.1
8.0
8.6
8.2
8.5
9.0
7.9
7.9
10
13
8.9
8.1
8.2
8.4
39
63
60
55
56
56
49
56
630.0
20.3
63
7.3
,250
APR
58
66
60
60
52
50
49
53
51
53
62
63
59
52
___
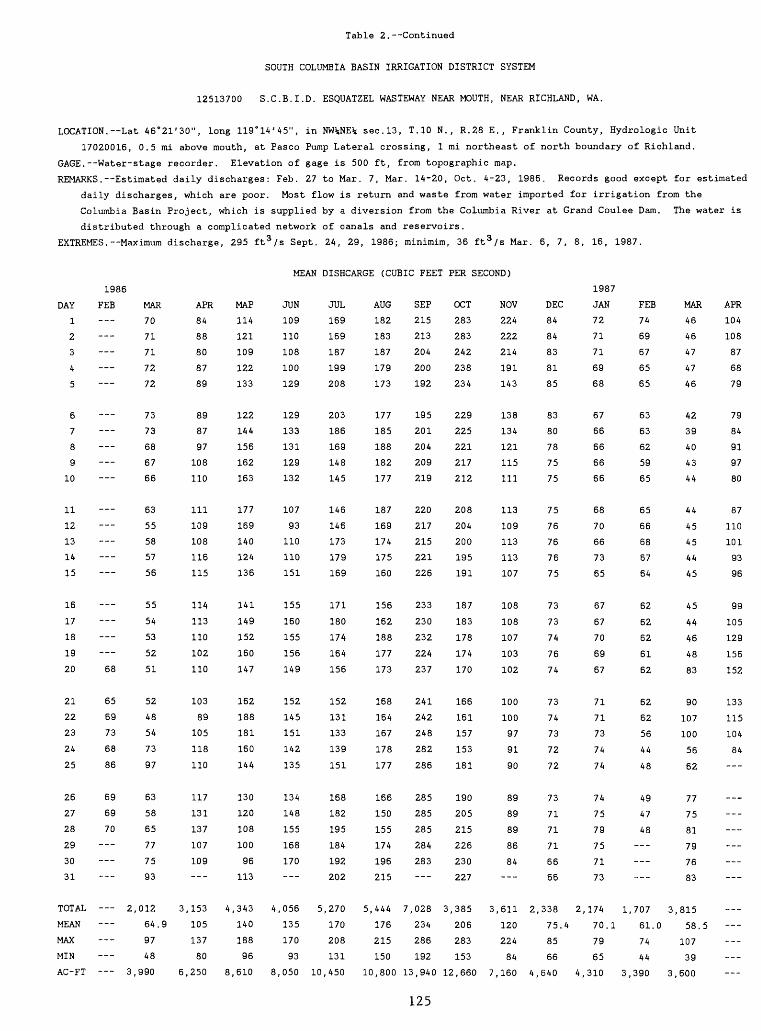
Table 2. Continued
SOUTH COLUMBIA BASIN IRRIGATION DISTRICT SYSTEM
12513700 S.C.B.I.D. ESQUATZEL WASTEWAY NEAR MOUTH, NEAR RICHLAND, WA.
LOCATION. Lat 46 0 21'30", long 119°14'45", in NW%NE% sec.13, T.10 N., R.28 E., Franklin County, Hydrologic Unit
17020016, 0.5 mi above mouth, at Pasco Pump Lateral crossing, 1 mi northeast of north boundary of Richland.
GAGE. Water-stage recorder. Elevation of gage is 500 ft, from topographic map.
REMARKS. Estimated daily discharges: Feb. 27 to Mar. 7, Mar. 14-20, Oct. 4-23, 1986. Records good except for estimated
daily discharges, which are poor. Most flow is return and waste from water imported for irrigation from the
Columbia Basin Project, which is supplied by a diversion from the Columbia River at Grand Coulee Dam. The water is
distributed through a complicated network of canals and reservoirs.
EXTREMES.--Maximum discharge, 295 ft 3 /s Sept. 24, 29, 1986; minimim, 36 ft 3 /s Mar. 6, 7, 8, 16, 1987.
MEAN DISHCARGE (CUBIC FEET PER SECOND)
DAY
1
2
3
4
5
6
7
8
9
10
11
12
13
14
15
16
17
18
19
20
21
22
23
24
25
26
27
28
29
30
31
TOTAL
MEAN
MAX
MIN
AC-FT
1986
FEE MAR
70
71
71
72
72
73
73
68
67
66
63
55
58
57
56
55
54
53
52
68 51
65 52
69 48
73 54
68 73
86 97
69 63
69 58
70 65
77
75
93
2,012
64.9
97
48
3,990
APR
84
88
80
87
89
89
87
97
108
110
111
109
108
116
115
114
113
110
102
110
103
89
105
118
110
117
131
137
107
109---
3,153
105
137
80
6,250
MAP
114
121
109
122
133
122
144
156
162
163
177
169
140
124
136
141
149
152
160
147
162
188
181
160
144
130
120
108
100
96
113
4,343
140
188
96
8,610
JUN
109
110
108
100
129
129
133
131
129
132
107
93
110
110
151
155
160
155
156
149
152
145
151
142
135
134
148
155
168
170---
4,056
135
170
93
8,050
JUL
169
169
187
199
208
203
186
169
148
145
146
146
173
179
169
171
180
174
164
156
152
131
133
139
151
168
182
195
184
192
202
5,270
170
208
131
10,450
AUG
182
183
187
179
173
177
185
188
182
177
187
169
174
175
160
156
162
188
177
173
168
164
167
178
177
166
150
155
174
196
215
5,444
176
215
150
10,800
SEP
215
213
204
200
192
195
201
204
209
219
220
217
215
221
226
233
230
232
224
237
241
242
248
282
286
285
285
285
284
283
7,028
234
286
192
13,940
OCT
283
283
242
238
234
229
225
221
217
212
208
204
200
195
191
187
183
178
174
170
166
161
157
153
181
190
205
215
226
230
227
3,385
206
283
153
12,660
NOV
224
222
214
191
143
138
134
121
115
111
113
109
113
113
107
108
108
107
103
102
100
100
97
91
90
89
89
89
86
84
3,611
120
224
84
7,160
DEC
84
84
83
81
85
83
80
78
75
75
75
76
76
76
75
73
73
74
76
74
73
74
73
72
72
73
71
71
71
66
66
2,338
75.4
85
66
4,640
1987
JAN
72
71
71
69
68
67
66
66
66
66
68
70
66
73
65
67
67
70
69
67
71
71
73
74
74
74
75
79
75
71
73
2,174
70.1
79
65
4,310
FEE
74
69
67
65
65
63
63
62
59
65
65
66
68
67
64
62
62
62
61
62
62
62
56
44
48
49
47
48
---
1,707
61.0
74
44
3,390
MAR
46
46
47
47
46
42
39
40
43
44
44
45
45
44
45
45
44
46
48
83
90
107
100
56
62
77
75
81
79
76
83
3,815
58.5
107
39
3,600
APR
104
108
87
68
79
79
84
91
97
80
87
110
101
93
96
99
105
129
156
152
133
115
104
84
125
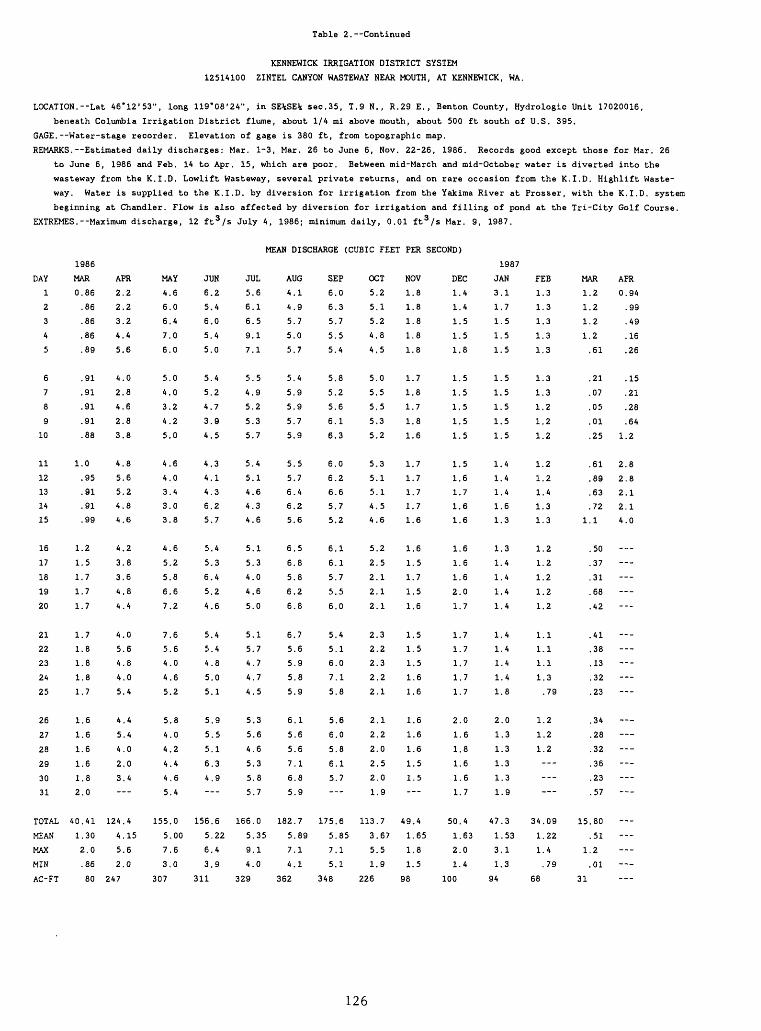
Table 2. Continued
KENNEWICK IRRIGATION DISTRICT SYSTEM
12514100 ZINTEL CANYON WASTEWAY NEAR MOUTH, AT KENNEWICK, WA.
LOCATION.--Lat 46*12'53", long 119*08'24", in SE%SE% sec.35, T.9 N., R.29 E., Benton County, Hydrologic Unit 17020016,
beneath Columbia Irrigation District flume, about 1/4 mi above mouth, about 500 ft south of U.S. 395.
GAGE. Water-stage recorder. Elevation of gage is 380 ft, from topographic map.
REMARKS. Estimated daily discharges: Mar. 1-3, Mar. 26 to June 6, Nov. 22-26, 1986. Records good except those for Mar. 26
to June 6, 1986 and Feb. 14 to Apr. 15, which are poor. Between mid-March and mid-October water is diverted into the
wasteway from the K.I.D. Lowlift Wasteway, several private returns, and on rare occasion from the K.I.D. Highlift Waste-
way. Water is supplied to the K.I.D. by diversion for irrigation from the Yakima River at Prosser, with the K.I.D. system
beginning at Chandler. Flow is also affected by diversion for irrigation and filling of pond at the Tri-City Golf Course.
EXTREMES.--Maximum discharge, 12 ft 3 /s July 4, 1986; minimum daily, 0.01 ft 3 /s Mar. 9, 1987.
MEAN DISCHARGE (CUBIC FEET PER SECOND)
DAY
1
2
3
4
5
6
7
8
9
10
11
12
13
14
15
16
17
18
19
20
21
22
23
24
25
26
27
28
29
30
31
TOTAL
MEAN
MAX
MIN
AC-FT
1986
MAR
0.86
.86
.86
.86
.89
.91
.91
.91
.91
.88
1.0
.95
.91
.91
.99
1.2
1.5
1.7
1.7
1.7
1.7
1.8
1.8
1.8
1.7
1.6
1.6
1.6
1.6
1.8
2.0
40.41
1.30
2.0
.86
80
APR
2.2
2.2
3.2
4.4
5.6
4.0
2.8
4.6
2.8
3.8
4.8
5.6
5.2
4.8
4.6
4.2
3.8
3.6
4.8
4.4
4.0
5.6
4.8
4.0
5.4
4.4
5.4
4.0
2.0
3.4
124.4
4.15
5.6
2.0
247
MAY
4.6
6.0
6.4
7.0
6.0
5.0
4.0
3.2
4.2
5.0
4.6
4.0
3.4
3.0
3.8
4.6
5.2
5.8
6.6
7.2
7.6
5.6
4.0
4.6
5.2
5.8
4.0
4.2
4.4
4.6
5.4
155.0
5.00
7.6
3.0
307
JUN
6.2
5.4
6.0
5.4
5.0
5.4
5.2
4.7
3.9
4.5
4.3
4.1
4.3
6.2
5.7
5.4
5.3
6.4
5.2
4.6
5.4
5.4
4.8
5.0
5.1
5.9
5.5
5.1
6.3
4.9
156.6
5.22
6.4
3.9
311
JUL
5.6
6.1
6.5
9.1
7.1
5.5
4.9
5.2
5.3
5.7
5.4
5.1
4.6
4.3
4.6
5.1
5.3
4.0
4.6
5.0
5.1
5.7
4.7
4.7
4.5
5.3
5.6
4.6
5.3
5.8
5.7
166.0
5.35
9.1
4.0
329
AUG
4.1
4.9
5.7
5.0
5.7
5.4
5.9
5.9
5.7
5.9
5.5
5.7
6.4
6.2
5.6
6.5
6.8
5.8
6.2
6.8
6.7
5.6
5.9
5.8
5.9
6.1
5.6
5.6
7.1
6.8
5.9
182.7
5.89
7.1
4.1
362
SEP
6.0
6.3
5.7
5.5
5.4
5.8
5.2
5.6
6.1
6.3
6.0
6.2
6.6
5.7
5.2
6.1
6.1
5.7
5.5
6.0
5.4
5.1
6.0
7.1
5.8
5.6
6.0
5.8
6.1
5.7
175.6
5.85
7.1
5.1
348
OCT
5.2
5.1
5.2
4.8
4.5
5.0
5.5
5.5
5.3
5.2
5.3
5.1
5.1
4.5
4.6
5.2
2.5
2.1
2.1
2.1
2.3
2.2
2.3
2.2
2.1
2.1
2.2
2.0
2.5
2.0
1.9
113.7
3.67
5.5
1.9
226
NOV
1.8
1.8
1.8
1.8
1.8
1.7
1.8
1.7
1.8
1.6
1.7
1.7
1.7
1.7
1.6
1.6
1.5
1.7
1.5
1.6
1.5
1.5
1.5
1.6
1.6
1.6
1.6
1.6
1.5
1.5
49.4
1.65
1.8
1.5
98
DEC
1.4
1.4
1.5
1.5
1.8
1.5
1.5
1.5
1.5
1.5
1.5
1.6
1.7
1.6
1.6
1.6
1.6
1.6
2.0
1.7
1.7
1.7
1.7
1.7
1.7
2.0
1.6
1.8
1.6
1.6
1.7
50.4
1.63
2.0
1.4
100
1987
JAN
3.1
1.7
1.5
1.5
1.5
1.5
1.5
1.5
1.5
1.5
1.4
1.4
1.4
1.6
1.3
1.3
1.4
1.4
1.4
1.4
1.4
1.4
1.4
1.4
1.8
2.0
1.3
1.3
1.3
1.3
1.9
47.3
1.53
3.1
1.3
94
FEE
1.3
1.3
1.3
1.3
1.3
1.3
1.3
1.2
1.2
1.2
1.2
1.2
1.4
1.3
1.3
1.2
1.2
1.2
1.2
1.2
1.1
1.1
1.1
1.3
.79
1.2
1.2
1.2
34.09
1.22
1.4
.79
68
MAR
1.2
1.2
1.2
1.2
.61
.21
.07
.05
.01
.25
.61
.89
.63
.72
1.1
.50
.37
.31
.68
.42
.41
.38
.13
.32
.23
.34
.28
.32
.36
.23
.57
15.80
.51
1.2
.01
31
APR
0.94
.99
.49
.16
.26
.15
.21
.28
.64
1.2
2.8
2.8
2.1
2.1
4.0
---
--_
---
126
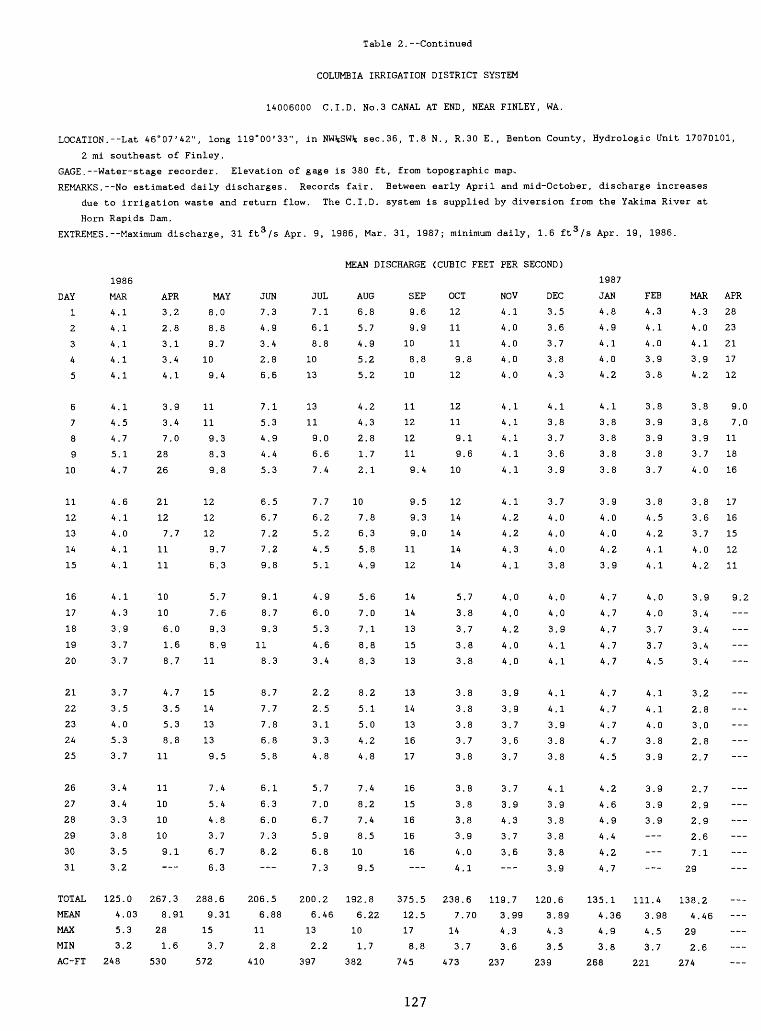
Table 2.--Continued
COLUMBIA IRRIGATION DISTRICT SYSTEM
14006000 C.I.D. No.3 CANAL AT END, NEAR FINLEY, WA.
LOCATION.--Lat 46°07'42", long 119°00'33", in NW%SW% sec.36, T.8 N., R.30 E., Benton County, Hydrologic Unit 17070101,
2 mi southeast of Finley.
GAGE.--Water-stage recorder. Elevation of gage is 380 ft, from topographic map.
REMARKS.--No estimated daily discharges. Records fair. Between early April and mid-October, discharge increases
due to irrigation waste and return flow. The C.I.D. system is supplied by diversion from the Yakima River at
Horn Rapids Dam.
EXTREMES.--Maximum discharge, 31 ft 3 /s Apr. 9, 1986, Mar. 31, 1987; minimum daily, 1.6 ft 3 /s Apr. 19, 1986.
MEAN DISCHARGE (CUBIC FEET PER SECOND)
DAY
1
2
3
4
5
6
7
8
9
10
11
12
13
14
15
16
17
18
19
20
21
22
23
24
25
26
27
28
29
30
31
TOTAL
MEAN
MAX
MIN
AC -FT
1986
MAR
4.1
4.1
4.1
4.1
4.1
4.1
A. 5
4.7
5.1
A. 7
4.6
4.1
4.0
4.1
4.1
4.1
4.3
3.9
3.7
3.7
3.7
3.5
A.O
5.3
3.7
3. A
3. A
3.3
3.8
3.5
3.2
125.0
4.03
5.3
3.2
2A8
APR
3.2
2.8
3.1
3.4
4.1
3.9
3. A
7.0
28
26
21
12
7.7
11
11
10
10
6.0
1.6
8.7
A. 7
3.5
5.3
8.8
11
11
10
10
10
9.1___
267.3
8.91
28
1.6
530
MAY
8.0
8.8
9.7
10
9.4
11
11
9.3
8.3
9.8
12
12
12
9.7
6.3
5.7
7.6
9.3
8.9
11
15
1A
13
13
9.5
7.4
5.4
A. 8
3.7
6.7
6.3
288.6
9.31
15
3.7
572
JUN
7.3
4.9
3.4
2.8
6.6
7.1
5.3
A. 9
4.4
5.3
6.5
6.7
7.2
7.2
9.8
9.1
8.7
9.3
11
8.3
8.7
7.7
7.8
6.8
5.8
6.1
6.3
6.0
7.3
8.2
206.5
6.88
11
2.8
410
JUL
7.1
6.1
8.8
10
13
13
11
9.0
6.6
7.4
7.7
6.2
5.2
4.5
5.1
4.9
6.0
5.3
A. 6
3. A
2.2
2.5
3.1
3.3
4.8
5.7
7.0
6.7
5.9
6.8
7.3
200.2
6.46
13
2.2
397
AUG
6.8
5.7
4.9
5.2
5.2
4.2
A. 3
2.8
1.7
2.1
10
7.8
6.3
5.8
4.9
5.6
7.0
7.1
8.8
8.3
8.2
5.1
5.0
A. 2
4.8
7. A
8.2
7. A
8.5
10
9.5
192.8
6.22
10
1.7
382
SEP
9.6
9.9
10
8.8
10
11
12
12
11
9. A
9.5
9.3
9.0
11
12
14
1A
13
15
13
13
14
13
16
17
16
15
16
16
16
375.5
12.5
17
8.8
745
OCT
12
11
11
9.8
12
12
11
9.1
9.6
10
12
14
1A
14
1A
5.7
3.8
3.7
3.8
3.8
3.8
3.8
3.8
3.7
3.8
3.8
3.8
3.8
3.9
4.0
A.I
238.6
7.70
14
3.7
473
NOV
4.1
4.0
A.O
4.0
A.O
4.1
A.I
A.I
4.1
4.1
4.1
4.2
4.2
4.3
4.1
A.O
A.O
A. 2
A.O
A.O
3.9
3.9
3.7
3.6
3.7
3.7
3.9
A. 3
3.7
3.6
119.7
3.99
A. 3
3.6
237
DEC
3.5
3.6
3.7
3.8
4.3
A.I
3.8
3.7
3.6
3.9
3.7
4.0
4.0
4.0
3.8
4.0
A.O
3.9
4.1
4.1
A.I
4.1
3.9
3.8
3.8
A.I
3.9
3.8
3.8
3.8
3.9
120.6
3.89
4.3
3.5
239
1987
JAN
4.8
4.9
4.1
4.0
A. 2
A.I
3.8
3.8
3.8
3.8
3.9
A.O
A.O
A. 2
3.9
A. 7
A. 7
A. 7
A. 7
A. 7
A. 7
A. 7
4.7
A. 7
A. 5
A. 2
A. 6
A. 9
A. 4
A. 2
A. 7
135.1
A. 36
A. 9
3.8
268
FEB
A. 3
4.1
4.0
3.9
3.8
3.8
3.9
3.9
3.8
3.7
3.8
4.5
4.2
4.1
4.1
A.O
A.O
3.7
3.7
4.5
A.I
4.1
4.0
3.8
3.9
3.9
3.9
3.9
111.4
3.98
A. 5
3.7
221
MAR
4.3
4.0
A.I
3.9
A. 2
3.8
3.8
3.9
3.7
4.0
3.8
3.6
3.7
4.0
A. 2
3.9
3.4
3.4
3.4
3.4
3.2
2.8
3.0
2.8
2.7
2.7
2.9
2.9
2.6
7.1
29
138.2
A. 46
29
2.6
27A
APR
28
23
21
17
12
9.0
7.0
11
18
16
17
16
15
12
11
9.2
___
127
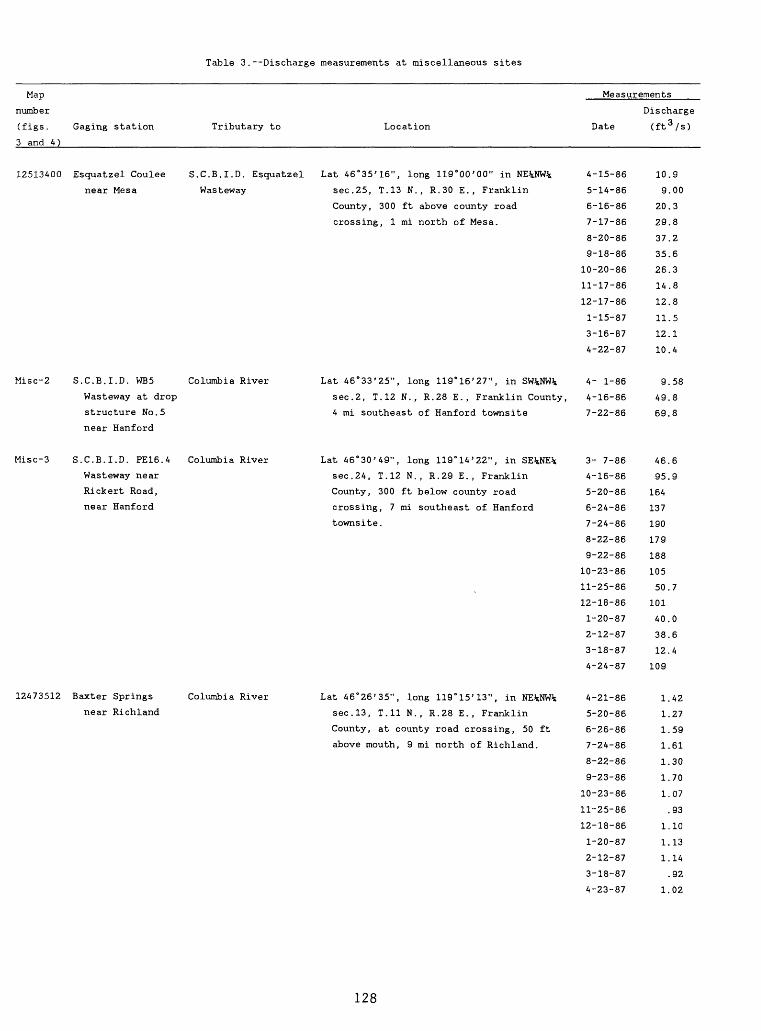
Table 3.--Discharge measurements at miscellaneous sites
Map
number
(figs. Gaging station
3 and 4)______________
Tributary to Location
Measurements
Date
Discharge
(ft 3 /s)
12513400 Esquatzel Coulee
near Mesa
S.C.B.I.D. Esquatzel
Wasteway
Lat 46°35'16", long 119°00'00" in
sec.25, T.13 N., R.30 E., Franklin
County, 300 ft above county road
crossing, 1 mi north of Mesa.
4-15-86
5-14-86
6-16-86
7-17-86
8-20-86
9-18-86
10-20-86
11-17-86
12-17-86 1-15-87
3-16-87
4-22-87
10.9
9.00
20.3
29.8
37.2
35.6
26.3
14.8
12.8
11.5
12.1
10.4
Misc-2 S.C.B.I.D. WB5 Columbia River
Wasteway at drop
structure No.5
near Hanford
Lat 46°33'25", long 119°16'27", in SW^NW^ 4- 1-86 9.58
sec.2, T.12 N., R.28 E., Franklin County, 4-16-86 49.8
4 mi southeast of Hanford townsite 7-22-86 69.8
Misc-3 S.C.B.I.D. PE16.4
Wasteway near
Rickert Road,
near Hanford
Columbia River Lat 46°30'49", long 119°14'22", in
sec.24, T.12 N., R.29 E., Franklin
County, 300 ft below county road
crossing, 7 mi southeast of Hanford
townsite.
3- 7-86
4-16-86
5-20-86
6-24-86
7-24-86
8-22-86
9-22-86
10-23-86
11-25-86
12-18-86
1-20-87
2-12-87
3-18-87
4-24-87
46.6
95.9
164
137
190
179
188
105
50.7
101
40.0
38.6
12.4
109
12473512 Baxter Springs
near Richland
Columbia River Lat 46°26'35", long 119°15'13", in
sec.13, T.ll N., R.28 E., Franklin
County, at county road crossing, 50 ft
above mouth, 9 mi north of Richland.
4-21-86
5-20-86
6-26-86
7-24-86
8-22-86
9-23-86
10-23-86
11-25-86
12-18-86
1-20-87
2-12-87
3-18-87
4-23-87
1.42
1.27
1.59
1.61
1.30
1.70
1.07
.93
1.10
1.13
1.14
.92
1.02
128

Table 3.--Discharge measurements at miscellaneous sites Continued
Map
number
(figs. Gaging station Tributary to
3 and A)
Misc-5 Rankin Springs Columbia River
near Richland
Misc-6 Yakima River Yakiraa River
tributary at
Kiona
(461507119281800)
Misc-7 Yakima River Yakima River
tributary at
Interstate 182
near Richland
(460019120001900)
Misc-8 C.I.D. No. 3 C.I.D. No. 3 Canal
Canal tributary
at South Highlands
at Kennewick
Measur
Location Date
Lat 46°25'24", long 119°15'24", in NW%SW% 4-21-86
sec. 24, T.ll N., R.28 E., Franklin 5-20-86
County, at county road crossing, 50 ft 6-26-86
above mouth, 8 mi north of Richland. 7-24-868-22-86
9-23-86
10-23-86
11-25-86
12-18-86
2-12-87
3-18-87
4-23-87
Lat 46°15'07", long 119°28'18", in SW%NW% 3- 3-86
sec. 20, T.9 N. , R.27 E., Benton County, 4-29-86
just north of westbound off-ramp from 6- 4-86
Interstate 82, 0.4 mi northeast of Kiona. 7- 8-868-11-86
9- 9-86
10- 7-86
11-14-86
12-15-86
1-14-87
2-11-87
3-13-87
4-14-87
Lat 46°15'33", long 119°17'28", in SW%SE% 3- 5-86
sec. 15, T.9 N., R.28 E., Benton County, 5- 1-86
100 ft northwest of west-bound lanes of 6- 5-86
Interstate 182, 1 mi south of Whitman 7-15-86
School in Richland. 8-13-869-10-86
10-10-86
11-14-86
12-15-86
1^14-87
2-11-87
3-13-87
4-14-87
Lat 46°11'01", long 119°07'06", in NE%NE% 3- 5-86
sec. 13, T.8 N., R.29 E., Benton County, 5- 2-86
at Cascade St. crossing in Kennewick. 6-11-86
7-15-86
8-14-86
ements
Discharge
(ft 3 /s)
1.79
.88
.27
.19
1.60
.03
0
0
0
0
0
.83
.75
.73
.63
.37
.08
.07
.25
.28
.42
.78
.21
.83
.30
1.23
QQ . £?£?
1.12
1.05
1.15
1.15
.93
1.20
.99
1.55
1.25
1.10
.90
0.74
1.04
1.17
1.49
1.71
(continued)
129
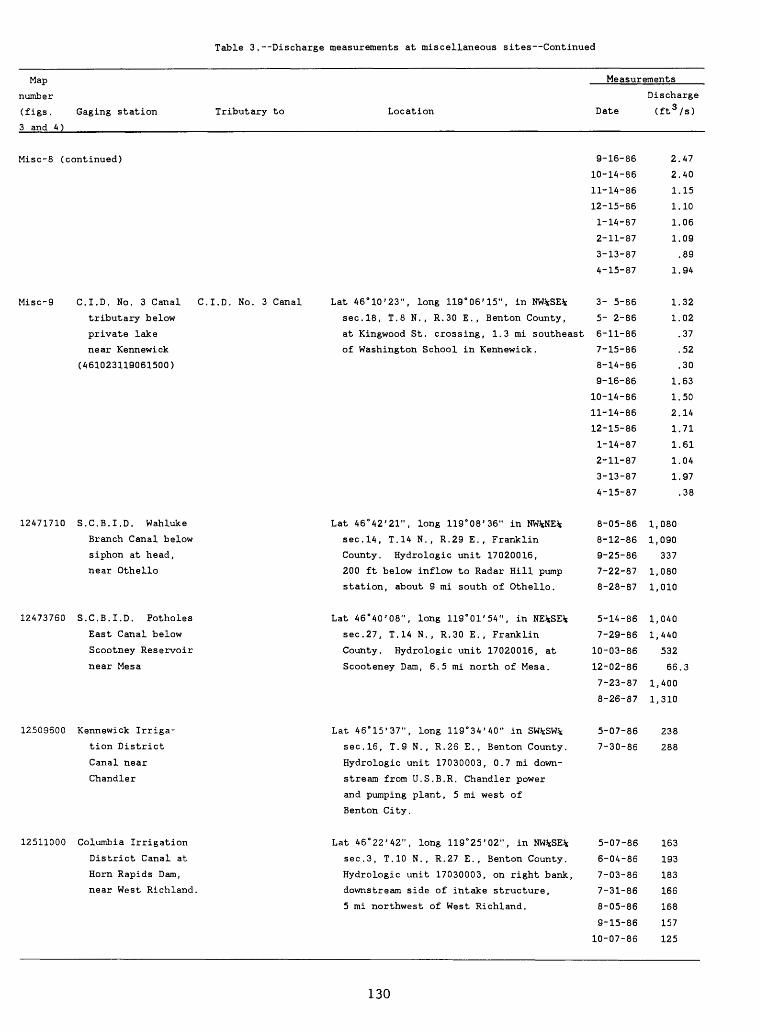
Table 3. Discharge measurements at miscellaneous sites Continued
Map
number
(figs.
3 and A)
Measurements
Gaging station Tributary to Location
Misc-8 (continued)
Misc-9
12471710
12473760
12509600
12511000
C.I.D. No. 3 Canal C.I.D. No. 3 Canal
tributary below
private lake
near Kennewick
(461023119061500)
S.C.B.I.D. Wahluke
Branch Canal below
siphon at head,
near Othello
S.C.B.I.D. Potholes
East Canal below
Scootney Reservoir
near Mesa
Kennewick Irriga
tion District
Canal near
Chandler
Columbia Irrigation
District Canal at
Horn Rapids Dam,
near West Richland.
Lat 46°10'23" ) long 119°06'15", in NW*SE*
sec. 18, T.8 N., R.30 E., Benton County,
at Kingwood St. crossing, 1.3 mi southeast
of Washington School in Kennewick.
Lat 46°42'21", long 119 8 08'36" in NW*NE*
sec. 14, T.14 N., R.29 E., Franklin
County. Hydro logic unit 17020016,
200 ft below inflow to Radar Hill pump
station, about 9 mi south of Othello.
Lat 46"40'08", long 119°01'54", in NE^SE*
sec. 27, T.14 N. , R.30 E., Franklin
County. Hydrologic unit 17020016, at
Scooteney Dam, 6.5 mi north of Mesa.
Lat 46°15'37", long 119°34'40" in SWJsSWJs
sec. 16, T.9 N., R.26 E., Benton County.
Hydrologic unit 17030003, 0 . 7 mi down
stream from U.S.B.R. Chandler power
and pumping plant, 5 mi west of
Benton City.
Lat 46°22'42", long 119°25'02", in NW^SE*
sec. 3, T.10 N., R.27 E., Benton County.
Hydrologic unit 17030003, on right bank,
downstream side of intake structure.
5 mi northwest of West Richland.
Date
9-16-86
10-14-86
11-14-86
12-15-86
1-14-87
2-11-87
3-13-87
4-15-87
3- 5-86
5- 2-86
6-11-86
7-15-86
8-14-86
9-16-86
10-14-86
11-14-86
12-15-86
1-14-87
2-11-87
3-13-87
4-15-87
8-05-86
8-12-86
9-25-86
7-22-87
8-28-87
5-14-86
7-29-86
10-03-86
12-02-86
7-23-87
8-26-87
5-07-86
7-30-86
5-07-86
6-04-86
7-03-86
7-31-86
8-05-86
9-15-86
10-07-86
Discharge
(ft 3 /s)
2.47
2.40
1.15
1.10
1.06
1.09
.89
1.94
1.32
1.02
.37
.52
.30
1.63
1.50
2.14
1.71
1.61
1.04
1.97
.38
1,080
1,090
337
1,080
1,010
1,040
1,440
532
66.3
1,400
1,310
238
288
163
193
183
166
168
157
125
130

Table 4.--Water-quality data from surface-water sites
Dissolved Specific
Station number Date of Time nitrate plus conductance-
Name of gaging station and map number Latitude Longitude sample of nitrite, as N (microsiemens
(figs. 3 and 4) (1986) sample (milligrams per centimeter
per liter) at 25 °C)
S.C.B.I.D. EL85xx Wasteway 12435810
near Mesa, WA
S.C.B.I.D. EL85JJ Lateral 12435840
at head near Mesa, WA
S.C.B.I.D. Wahluke Branch 12471710
canal below siphon, near
Othello, WA
S.C.B.I.D.WB5 Wasteway at 12473502
drop structure No. 14,
near Hanford, WA
Ringold Springs above State Misc-1
salmon hatchery, near
Ringold, WA
S.C.B.I.D. PE16.4 Wasteway 12473506
below Eagle Lake, near
Othello, WA
S.C.B.I.D. PE16.4 Wasteway 12473508
near mouth, near Hanford, WA
Baxter Canyon Springs near 12473512
Richland, WA
S.C.B.I.D. PE27L Lateral Misc-10
near Mesa, WA
S.C.B.I.D. Potholes East 12473760
Canal below Scootney
Reservoir, near Mesa, WA
S.C.B.I.D. Eltopia Branch 12473820
Canal above falls, near
Pasco, WA
S.C.B.I.D. Pasco Wasteway near 12473900
Richland, WA
46°35'41" 118°59'27" 9/7 18:30 0.2
46°38'04" 118°59'21" 9/7 17:55 .1
46°42'21" 119°08'36'
46°40'24"
46°39'51" 119°03'49'
46°40'05"
9/7 16:30 .7
46°32'23" 119°16'30" 9/8 18:00 4.A
46°30'48" 119°15'19" 9/12 10:15
9/7 15:30 1.9
A6°30'22" 119°15'22" 9/12 9:00 2.4
46°26'35" 119°15'13" 9/12 10:40 2.5
9/7 17:30 .9
9/7 14:56 1.0
46°20'27" 118°58'16" 9/8 13:30 .9
46°22'40" 119°15'18" 9/12 11:00 1.3
205
141
356
600
1,040
620
550
735
341
360
361
394
K.I.D. Main Canal near
Chandler, WA
12509600 46°15'37" 119°34'41' 9/7 13:15 1.4 288
Amon Wasteway below K.I.D.
Amon pumping station near
Kennewick, WA
12509640 46°11'31" 119°14'12" 9/7 16:20 3.7 291
131
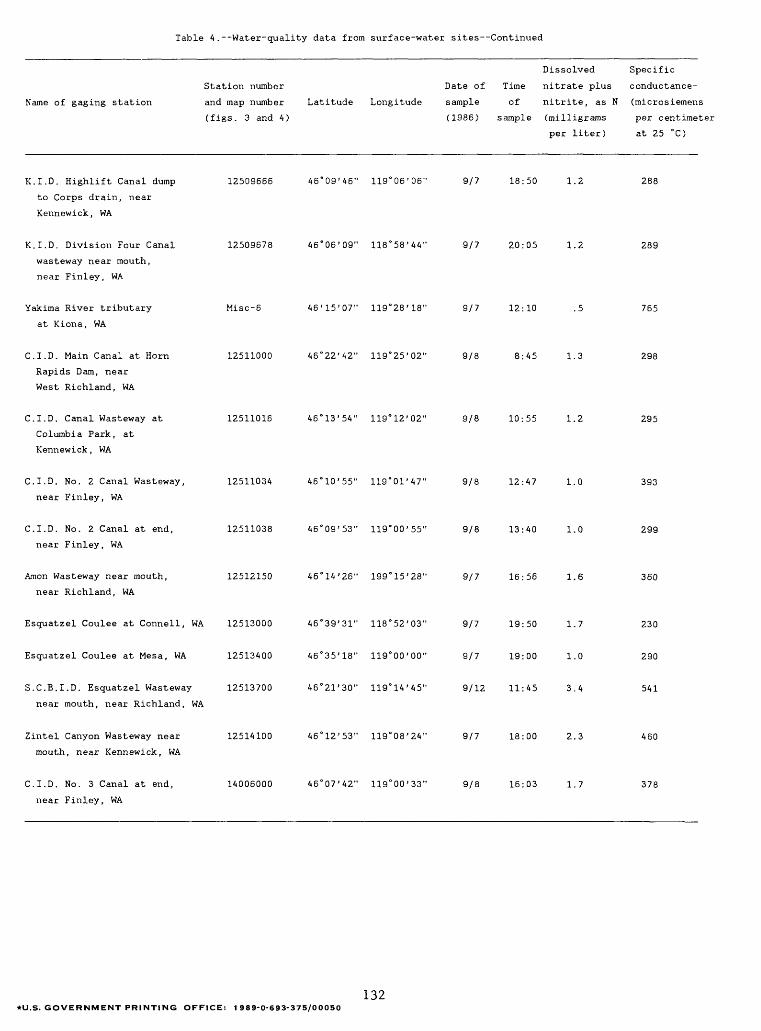
Table 4.--Water-quality data from surface-water sites Continued
Dissolved Specific
Station number Date of Time nitrate plus conductance-
Name of gaging station and map number Latitude Longitude sample of nitrite, as N (microsiemens
(figs. 3 and 4) (1986) sample (milligrams per centimeter
per liter) at 25 °C)
K.I.D. Highlift Canal dump
to Corps drain, near
Kennewick, WA
12509666 46"09'46" 119°06'06" 9/7 18:50 1.2 288
K.I.D. Division Four Canal
wasteway near mouth,
near Finley, WA
12509678 46°06'09" 118°58'44" 9/7 20:05 1.2 289
Yakima River tributary
at Kiona, WA
Misc-6 46'15'07" 119°28'18" 9/7 12:10 .5 765
C.I.D. Main Canal at Horn
Rapids Dam, near
West Richland, WA
C.I.D. Canal Wasteway at
Columbia Park, at
Kennewick, WA
C.I.D. No. 2 Canal Wasteway,
near Finley, WA
C.I.D. No. 2 Canal at end,
near Finley, WA
Amon Wasteway near mouth,
near Richland, WA
12511000 46°22'42" 119°25'02" 9/8 8:45 1.3
12511016 46°13'54" 119°12'02" 9/8 10:55 1.2
12511034 46°10'55" 119°01'47" 9/8 12:47 1.0
12511038 46°09'53" 119°00'55" 9/8 13:40 1.0
12512150 46°14'26" 199°15'28" 9/7 16:56 1.6
298
295
393
299
360
Esquatzel Coulee at Connell, WA 12513000
Esquatzel Coulee at Mesa, WA 12513400
S.C.B.I.D. Esquatzel Wasteway 12513700
near mouth, near Richland, WA
46°39'31" 118°52'03'
46°35'18" 119°00'00'
46°21'30" 119°14'45'
9/7
9/7
9/12
19:50
19:00
11:45
1.7
1.0
3.4
230
290
541
Zintel Canyon Wasteway near
mouth, near Kennewick, WA
C.I.D. No. 3 Canal at end,
near Finley, WA
12514100 46°12'53" 119°08'24" 9/7 18:00 2.3
14006000 46°07'42" 119°00'33" 9/8 16:03 1.7
460
378
132*U.S. GOVERNMENT PRINTING OFFICE: 1989-0-693-375/00050
Related Documents