Carbon and nitrogen fluxes in the marine coccolithophore Emiliania huxleyi grown under different nitrate concentrations Athanasios Kaffes a , Silke Thoms a, ⁎, Scarlett Trimborn a , Björn Rost a , Gerald Langer b , Klaus-Uwe Richter a , Angela Köhler a , Alessandra Norici c , Mario Giordano c a Alfred Wegener Institute for Polar and Marine Research, Am Handelshafen 12, 27570 Bremerhaven, Germany b Institute of Environmental Science and Technology (ICTA), Universidad Autònoma de Barcelona (UAB), Bellaterra, 08193, Spain c Department of Marine Sciences, Università Politecnica delle Marche, 60131 Ancona, Italy abstract article info Article history: Received 9 March 2010 Received in revised form 11 May 2010 Accepted 7 June 2010 Keywords: Calcification Emiliania huxleyi Nitrate Nitrate assimilation Photosynthesis Information on interaction of C and N at the cellular level is lacking for ecologically relevant phytoplankton species. We examined the effects of NO 3 - availability on C and N fluxes in the widely distributed marine coccolithophore Emiliania huxleyi. Cells were cultured at replete (∼280 μM) and ambient (∼10 μM) NO 3 - , the latter representing a typical surface water nitrate concentration of the North Atlantic Ocean during spring. While growth rates and C to N ratios were not altered by the NO 3 - availability, organic C and N as well as inorganic C quotas were reduced under ambient NO 3 - . Growth at ambient NO 3 - caused a higher proportion of fixed C to be allocated to lipids relative to carbohydrates and especially to proteins. Ambient NO 3 - -grown cells showed lower V max of nitrate reductase (NR) and nitrite reductase (NiR) (ambient/replete: V max NR =0.64/1.09 fmol min -1 cell -1 ; V max NiR = 0.3/0.56 fmol min -1 cell -1 ), whereas they had higher V max of glutamine synthetase (GS) and glutamate synthase (GOGAT) (ambient/replete: V max GS =0.57/0.38 fmol min -1 cell -1 ;V max GOG =3.91/2.87 fmol min -1 cell -1 ). In these cells, photosynthetic O 2 evolution and HCO 3 - uptake rates were lower as compared to replete NO 3 - -grown cells (ambient/replete: V max O2 = 6.5/12.9 fmol min -1 cell -1 ;V max HCO3 - = 2.8/8.1 fmol min -1 cell -1 ). The CO 2 uptake and the maximum light use efficiency of photosynthesis (α) were unaffected by the concentration of NO 3 - . The affinities of NR for NO 3 - , of NiR for NO 2 - , of GS for Glu, and of the inorganic carbon uptake system for HCO 3 - were higher under ambient NO 3 - (ambient/replete: K m NR = 0.074/0.099 mM; K m NiR = 1.69/3.14 mM; K m GS = 1.62/ 3.81 mM; K m HCO3 - = 195/524 μM). Our data suggest that a concerted regulation of the intracellular CO 2 and NO 3 - concentrations is required to maintain balanced C and N metabolic fluxes resulting in a constant C to N ratio. © 2010 Elsevier B.V. All rights reserved. 1. Introduction Assimilation of C and N consume the largest part of ATP and reductants generated in the cell (Huppe and Turpin, 1994). Although competing for energy, the acquisition and metabolism of C and N must be tightly coupled. This is due to the fact that the boundaries of the C to N ratio are defined by the stoichiometry of key components of the cell machinery, such as amino acids, proteins, nucleic acids and chlorophylls (Turpin, 1991 and references therein). The relative size of the different pools, within the above mentioned boundaries, is determined by the N availability relative to C in the environment (Giordano et al., 2001; Palmucci and Giordano, submitted for publication). Much information on NO 3 - assimilation is available for model microalgae such as Chlamydomonas reinhardtii (Fernandez and Galvan, 2008 and references therein), but very little is known for ecologically relevant phytoplankton species. In this study, we focused on the widely distributed coccolithophore Emiliania huxleyi (Winter et al., 1994). This organism provides an important contribution to the marine primary production and it is considered to be one of the major producers of calcite in the ocean (Baumann et al., 2004). Very limited data has been published on the NO 3 - acquisition by E. huxleyi (Page et al., 1999; Riegman et al. 2000). Some data are available for E. huxleyi nitrate reductase (NR), which shows some unique properties compared to the NR proteins of other microalgae (Iwamoto and Shiraiwa, 2003). Native E. huxleyi NR has an overall mass of 514 kD and is composed of six 85 kD homologous subunits (Iwamoto and Shiraiwa, 2003). The K m for NADH and NO 3 - of purified NR were 40 μM and 104 μM, respectively (Iwamoto and Shiraiwa, 2003). No infor- mation is available for E. huxleyi nitrite reductase (NiR), the enzyme responsible for the subsequent reduction of NO 2 - to NH 4 + . The NH 4 + generated thanks to the catalysis by NiR is incorporated into amino acids via the glutamine synthetase/ glutamate synthase (GS/GOGAT) cycle. Two different GS isoforms of the enzyme, one located in the Journal of Experimental Marine Biology and Ecology 393 (2010) 1–8 ⁎ Corresponding author. Tel.: + 49 47148311801; fax: + 49 47148311425. E-mail address: [email protected] (S. Thoms). 0022-0981/$ – see front matter © 2010 Elsevier B.V. All rights reserved. doi:10.1016/j.jembe.2010.06.004 Contents lists available at ScienceDirect Journal of Experimental Marine Biology and Ecology journal homepage: www.elsevier.com/locate/jembe

Welcome message from author
This document is posted to help you gain knowledge. Please leave a comment to let me know what you think about it! Share it to your friends and learn new things together.
Transcript
Journal of Experimental Marine Biology and Ecology 393 (2010) 1–8
Contents lists available at ScienceDirect
Journal of Experimental Marine Biology and Ecology
j ourna l homepage: www.e lsev ie r.com/ locate / jembe
Carbon and nitrogen fluxes in the marine coccolithophore Emiliania huxleyi grownunder different nitrate concentrations
Athanasios Kaffes a, Silke Thoms a,⁎, Scarlett Trimborn a, Björn Rost a, Gerald Langer b, Klaus-Uwe Richter a,Angela Köhler a, Alessandra Norici c, Mario Giordano c
a Alfred Wegener Institute for Polar and Marine Research, Am Handelshafen 12, 27570 Bremerhaven, Germanyb Institute of Environmental Science and Technology (ICTA), Universidad Autònoma de Barcelona (UAB), Bellaterra, 08193, Spainc Department of Marine Sciences, Università Politecnica delle Marche, 60131 Ancona, Italy
⁎ Corresponding author. Tel.: +49 47148311801; faxE-mail address: [email protected] (S. Thoms).
0022-0981/$ – see front matter © 2010 Elsevier B.V. Aldoi:10.1016/j.jembe.2010.06.004
a b s t r a c t
a r t i c l e i n f oArticle history:Received 9 March 2010Received in revised form 11 May 2010Accepted 7 June 2010
Keywords:CalcificationEmiliania huxleyiNitrateNitrate assimilationPhotosynthesis
Information on interaction of C and N at the cellular level is lacking for ecologically relevant phytoplanktonspecies. We examined the effects of NO3
- availability on C and N fluxes in the widely distributed marinecoccolithophore Emiliania huxleyi. Cells were cultured at replete (∼280 μM) and ambient (∼10 μM) NO3
- , thelatter representing a typical surface water nitrate concentration of the North Atlantic Ocean during spring.Whilegrowth rates and C to N ratios were not altered by the NO3
- availability, organic C and N as well as inorganicC quotas were reduced under ambient NO3
- . Growth at ambient NO3- caused a higher proportion of fixed C to be
allocated to lipids relative to carbohydrates and especially to proteins. Ambient NO3--grown cells showed lower
Vmax of nitrate reductase (NR) and nitrite reductase (NiR) (ambient/replete: VmaxNR =0.64/1.09 fmol min-1 cell-1;
VmaxNiR = 0.3/0.56 fmol min-1 cell-1), whereas they had higher Vmax of glutamine synthetase (GS) and glutamate
synthase (GOGAT) (ambient/replete: VmaxGS =0.57/0.38 fmol min-1 cell-1; Vmax
GOG=3.91/2.87 fmol min-1 cell-1). Inthese cells, photosynthetic O2 evolution and HCO3
- uptake rates were lower as compared to replete NO3--grown
cells (ambient/replete: VmaxO2 = 6.5/12.9 fmol min-1 cell-1; Vmax
HCO3-= 2.8/8.1 fmol min-1 cell-1). The CO2 uptake and
the maximum light use efficiency of photosynthesis (α) were unaffected by the concentration of NO3- . The
affinities of NR for NO3- , of NiR for NO2
- , of GS for Glu, and of the inorganic carbon uptake system for HCO3- were
higher under ambient NO3- (ambient/replete: Km
NR=0.074/0.099 mM; KmNiR=1.69/3.14 mM; Km
GS=1.62/3.81 mM; Km
HCO3-= 195/524 μM). Our data suggest that a concerted regulation of the intracellular CO2 and
NO3- concentrations is required to maintain balanced C and N metabolic fluxes resulting in a constant C to N
ratio.
: +49 47148311425.
l rights reserved.
© 2010 Elsevier B.V. All rights reserved.
1. Introduction
Assimilation of C and N consume the largest part of ATP andreductants generated in the cell (Huppe and Turpin, 1994). Althoughcompeting for energy, the acquisition and metabolism of C and N mustbe tightly coupled. This is due to the fact that the boundaries of theC toNratio are defined by the stoichiometry of key components of the cellmachinery, such as amino acids, proteins, nucleic acids and chlorophylls(Turpin, 1991 and references therein). The relative size of the differentpools, within the above mentioned boundaries, is determined by the Navailability relative to C in the environment (Giordano et al., 2001;Palmucci and Giordano, submitted for publication).
Much information on NO3- assimilation is available for model
microalgae such as Chlamydomonas reinhardtii (Fernandez and
Galvan, 2008 and references therein), but very little is known forecologically relevant phytoplankton species. In this study, we focusedon the widely distributed coccolithophore Emiliania huxleyi (Winteret al., 1994). This organism provides an important contribution to themarine primary production and it is considered to be one of the majorproducers of calcite in the ocean (Baumann et al., 2004). Very limiteddata has been published on the NO3
- acquisition by E. huxleyi (Page etal., 1999; Riegman et al. 2000). Some data are available for E. huxleyinitrate reductase (NR), which shows some unique propertiescompared to the NR proteins of other microalgae (Iwamoto andShiraiwa, 2003). Native E. huxleyi NR has an overall mass of 514 kDand is composed of six 85 kD homologous subunits (Iwamoto andShiraiwa, 2003). The Km for NADH and NO3
- of purified NR were 40 μMand 104 μM, respectively (Iwamoto and Shiraiwa, 2003). No infor-mation is available for E. huxleyi nitrite reductase (NiR), the enzymeresponsible for the subsequent reduction of NO2
- to NH4+. The NH4
+
generated thanks to the catalysis by NiR is incorporated into aminoacids via the glutamine synthetase/ glutamate synthase (GS/GOGAT)cycle. Two different GS isoforms of the enzyme, one located in the
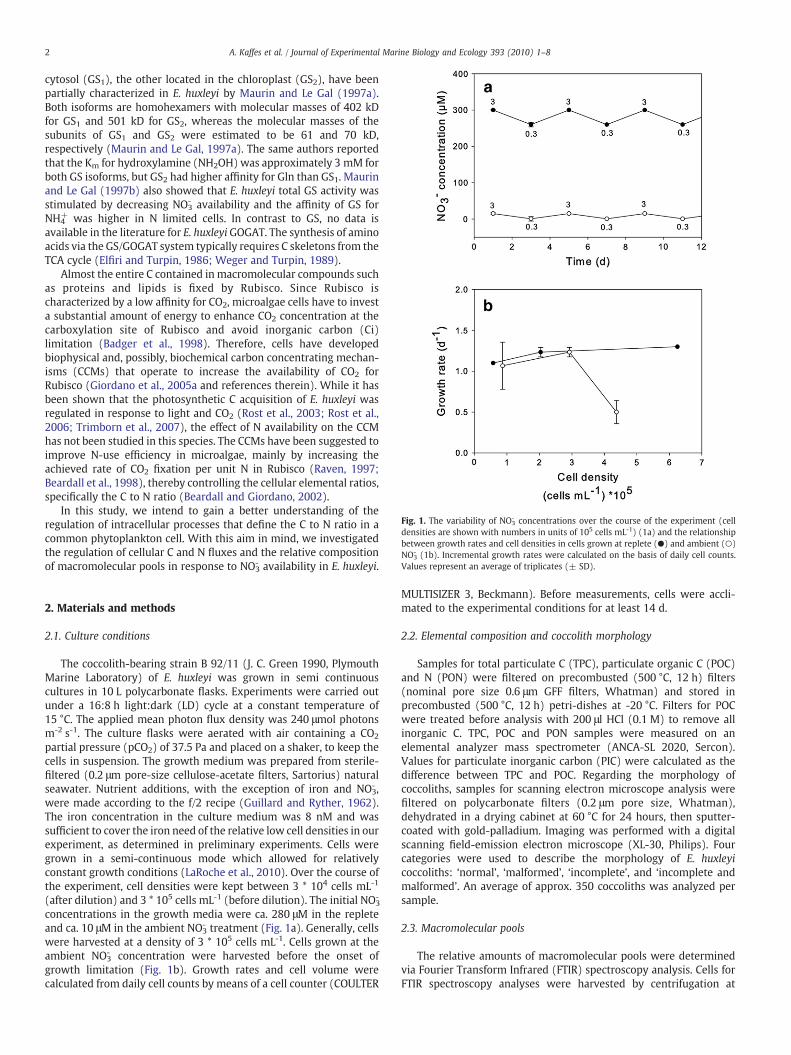
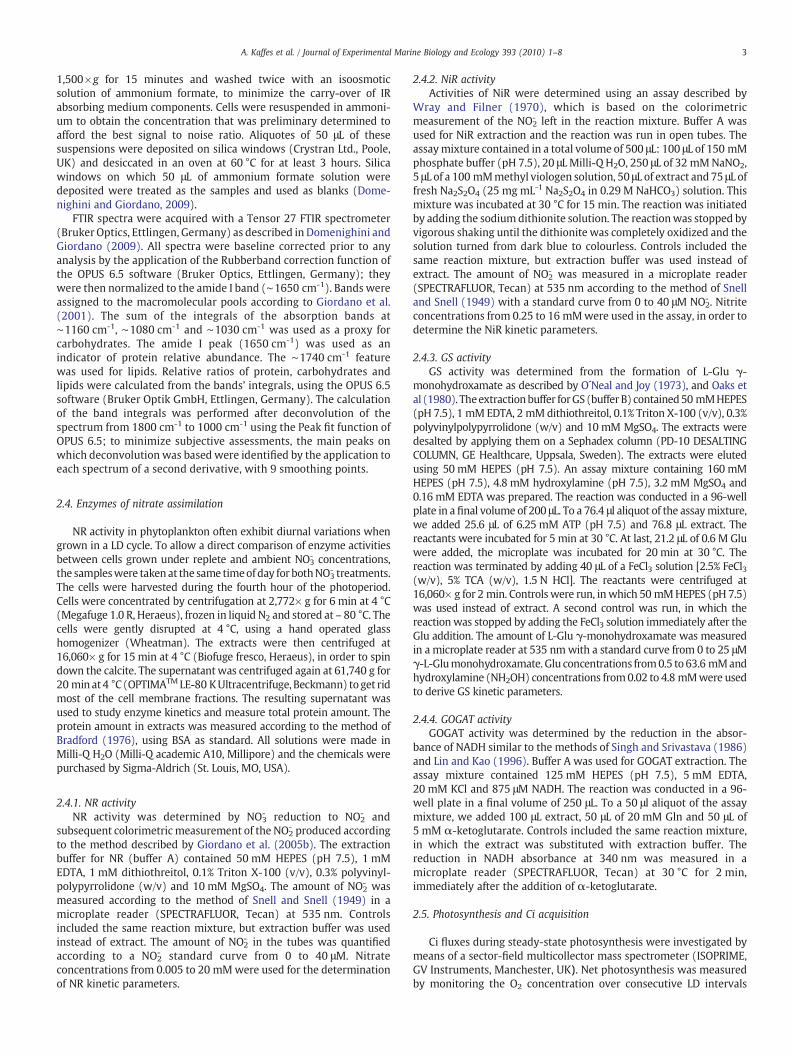
Fig. 1. The variability of NO3- concentrations over the course of the experiment (cell
densities are shown with numbers in units of 105 cells mL-1) (1a) and the relationshipbetween growth rates and cell densities in cells grown at replete (●) and ambient (○)NO3
- (1b). Incremental growth rates were calculated on the basis of daily cell counts.Values represent an average of triplicates (± SD).
2 A. Kaffes et al. / Journal of Experimental Marine Biology and Ecology 393 (2010) 1–8
cytosol (GS1), the other located in the chloroplast (GS2), have beenpartially characterized in E. huxleyi by Maurin and Le Gal (1997a).Both isoforms are homohexamers with molecular masses of 402 kDfor GS1 and 501 kD for GS2, whereas the molecular masses of thesubunits of GS1 and GS2 were estimated to be 61 and 70 kD,respectively (Maurin and Le Gal, 1997a). The same authors reportedthat the Km for hydroxylamine (NH2OH) was approximately 3 mM forboth GS isoforms, but GS2 had higher affinity for Gln than GS1. Maurinand Le Gal (1997b) also showed that E. huxleyi total GS activity wasstimulated by decreasing NO3
- availability and the affinity of GS forNH4
+ was higher in N limited cells. In contrast to GS, no data isavailable in the literature for E. huxleyi GOGAT. The synthesis of aminoacids via the GS/GOGAT system typically requires C skeletons from theTCA cycle (Elfiri and Turpin, 1986; Weger and Turpin, 1989).
Almost the entire C contained in macromolecular compounds suchas proteins and lipids is fixed by Rubisco. Since Rubisco ischaracterized by a low affinity for CO2, microalgae cells have to investa substantial amount of energy to enhance CO2 concentration at thecarboxylation site of Rubisco and avoid inorganic carbon (Ci)limitation (Badger et al., 1998). Therefore, cells have developedbiophysical and, possibly, biochemical carbon concentrating mechan-isms (CCMs) that operate to increase the availability of CO2 forRubisco (Giordano et al., 2005a and references therein). While it hasbeen shown that the photosynthetic C acquisition of E. huxleyi wasregulated in response to light and CO2 (Rost et al., 2003; Rost et al.,2006; Trimborn et al., 2007), the effect of N availability on the CCMhas not been studied in this species. The CCMs have been suggested toimprove N-use efficiency in microalgae, mainly by increasing theachieved rate of CO2 fixation per unit N in Rubisco (Raven, 1997;Beardall et al., 1998), thereby controlling the cellular elemental ratios,specifically the C to N ratio (Beardall and Giordano, 2002).
In this study, we intend to gain a better understanding of theregulation of intracellular processes that define the C to N ratio in acommon phytoplankton cell. With this aim in mind, we investigatedthe regulation of cellular C and N fluxes and the relative compositionof macromolecular pools in response to NO3
- availability in E. huxleyi.
2. Materials and methods
2.1. Culture conditions
The coccolith-bearing strain B 92/11 (J. C. Green 1990, PlymouthMarine Laboratory) of E. huxleyi was grown in semi continuouscultures in 10 L polycarbonate flasks. Experiments were carried outunder a 16:8 h light:dark (LD) cycle at a constant temperature of15 °C. The applied mean photon flux density was 240 μmol photonsm-2 s-1. The culture flasks were aerated with air containing a CO2
partial pressure (pCO2) of 37.5 Pa and placed on a shaker, to keep thecells in suspension. The growth medium was prepared from sterile-filtered (0.2 μm pore-size cellulose-acetate filters, Sartorius) naturalseawater. Nutrient additions, with the exception of iron and NO3
- ,were made according to the f/2 recipe (Guillard and Ryther, 1962).The iron concentration in the culture medium was 8 nM and wassufficient to cover the iron need of the relative low cell densities in ourexperiment, as determined in preliminary experiments. Cells weregrown in a semi-continuous mode which allowed for relativelyconstant growth conditions (LaRoche et al., 2010). Over the course ofthe experiment, cell densities were kept between 3 * 104 cells mL-1
(after dilution) and 3 * 105 cells mL-1 (before dilution). The initial NO3-
concentrations in the growth media were ca. 280 μM in the repleteand ca. 10 μM in the ambient NO3
- treatment (Fig. 1a). Generally, cellswere harvested at a density of 3 * 105 cells mL-1. Cells grown at theambient NO3
- concentration were harvested before the onset ofgrowth limitation (Fig. 1b). Growth rates and cell volume werecalculated from daily cell counts by means of a cell counter (COULTER
MULTISIZER 3, Beckmann). Before measurements, cells were accli-mated to the experimental conditions for at least 14 d.
2.2. Elemental composition and coccolith morphology
Samples for total particulate C (TPC), particulate organic C (POC)and N (PON) were filtered on precombusted (500 °C, 12 h) filters(nominal pore size 0.6 μm GFF filters, Whatman) and stored inprecombusted (500 °C, 12 h) petri-dishes at -20 °C. Filters for POCwere treated before analysis with 200 μl HCl (0.1 M) to remove allinorganic C. TPC, POC and PON samples were measured on anelemental analyzer mass spectrometer (ANCA-SL 2020, Sercon).Values for particulate inorganic carbon (PIC) were calculated as thedifference between TPC and POC. Regarding the morphology ofcoccoliths, samples for scanning electron microscope analysis werefiltered on polycarbonate filters (0.2 μm pore size, Whatman),dehydrated in a drying cabinet at 60 °C for 24 hours, then sputter-coated with gold-palladium. Imaging was performed with a digitalscanning field-emission electron microscope (XL-30, Philips). Fourcategories were used to describe the morphology of E. huxleyicoccoliths: ‘normal’, ‘malformed’, ‘incomplete’, and ‘incomplete andmalformed’. An average of approx. 350 coccoliths was analyzed persample.
2.3. Macromolecular pools
The relative amounts of macromolecular pools were determinedvia Fourier Transform Infrared (FTIR) spectroscopy analysis. Cells forFTIR spectroscopy analyses were harvested by centrifugation at
3A. Kaffes et al. / Journal of Experimental Marine Biology and Ecology 393 (2010) 1–8
1,500×g for 15 minutes and washed twice with an isoosmoticsolution of ammonium formate, to minimize the carry-over of IRabsorbing medium components. Cells were resuspended in ammoni-um to obtain the concentration that was preliminary determined toafford the best signal to noise ratio. Aliquotes of 50 μL of thesesuspensions were deposited on silica windows (Crystran Ltd., Poole,UK) and desiccated in an oven at 60 °C for at least 3 hours. Silicawindows on which 50 μL of ammonium formate solution weredeposited were treated as the samples and used as blanks (Dome-nighini and Giordano, 2009).
FTIR spectra were acquired with a Tensor 27 FTIR spectrometer(Bruker Optics, Ettlingen, Germany) as described in Domenighini andGiordano (2009). All spectra were baseline corrected prior to anyanalysis by the application of the Rubberband correction function ofthe OPUS 6.5 software (Bruker Optics, Ettlingen, Germany); theywere then normalized to the amide I band (∼1650 cm-1). Bands wereassigned to the macromolecular pools according to Giordano et al.(2001). The sum of the integrals of the absorption bands at∼1160 cm-1, ∼1080 cm-1 and ∼1030 cm-1 was used as a proxy forcarbohydrates. The amide I peak (1650 cm-1) was used as anindicator of protein relative abundance. The ∼1740 cm-1 featurewas used for lipids. Relative ratios of protein, carbohydrates andlipids were calculated from the bands’ integrals, using the OPUS 6.5software (Bruker Optik GmbH, Ettlingen, Germany). The calculationof the band integrals was performed after deconvolution of thespectrum from 1800 cm-1 to 1000 cm-1 using the Peak fit function ofOPUS 6.5; to minimize subjective assessments, the main peaks onwhich deconvolution was based were identified by the application toeach spectrum of a second derivative, with 9 smoothing points.
2.4. Enzymes of nitrate assimilation
NR activity in phytoplankton often exhibit diurnal variations whengrown in a LD cycle. To allow a direct comparison of enzyme activitiesbetween cells grown under replete and ambient NO3
- concentrations,the sampleswere taken at the same timeofday for bothNO3
- treatments.The cells were harvested during the fourth hour of the photoperiod.Cells were concentrated by centrifugation at 2,772× g for 6 min at 4 °C(Megafuge 1.0 R, Heraeus), frozen in liquid N2 and stored at – 80 °C. Thecells were gently disrupted at 4 °C, using a hand operated glasshomogenizer (Wheatman). The extracts were then centrifuged at16,060× g for 15 min at 4 °C (Biofuge fresco, Heraeus), in order to spindown the calcite. The supernatant was centrifuged again at 61,740 g for20 minat4 °C (OPTIMATMLE-80 KUltracentrifuge, Beckmann) toget ridmost of the cell membrane fractions. The resulting supernatant wasused to study enzyme kinetics and measure total protein amount. Theprotein amount in extracts was measured according to the method ofBradford (1976), using BSA as standard. All solutions were made inMilli-Q H2O (Milli-Q academic A10, Millipore) and the chemicals werepurchased by Sigma-Aldrich (St. Louis, MO, USA).
2.4.1. NR activityNR activity was determined by NO3
- reduction to NO2- and
subsequent colorimetric measurement of the NO2- produced according
to the method described by Giordano et al. (2005b). The extractionbuffer for NR (buffer A) contained 50 mM HEPES (pH 7.5), 1 mMEDTA, 1 mM dithiothreitol, 0.1% Triton X-100 (v/v), 0.3% polyvinyl-polypyrrolidone (w/v) and 10 mM MgSO4. The amount of NO2
- wasmeasured according to the method of Snell and Snell (1949) in amicroplate reader (SPECTRAFLUOR, Tecan) at 535 nm. Controlsincluded the same reaction mixture, but extraction buffer was usedinstead of extract. The amount of NO2
- in the tubes was quantifiedaccording to a NO2
- standard curve from 0 to 40 μM. Nitrateconcentrations from 0.005 to 20 mMwere used for the determinationof NR kinetic parameters.
2.4.2. NiR activityActivities of NiR were determined using an assay described by
Wray and Filner (1970), which is based on the colorimetricmeasurement of the NO2
- left in the reaction mixture. Buffer A wasused for NiR extraction and the reaction was run in open tubes. Theassaymixture contained in a total volume of 500 μL: 100 μL of 150 mMphosphate buffer (pH 7.5), 20 μL Milli-Q H2O, 250 μL of 32 mMNaNO2,5 μL of a 100 mMmethyl viologen solution, 50 μL of extract and 75 μL offresh Na2S2O4 (25 mg mL-1 Na2S2O4 in 0.29 M NaHCO3) solution. Thismixture was incubated at 30 °C for 15 min. The reaction was initiatedby adding the sodium dithionite solution. The reactionwas stopped byvigorous shaking until the dithionite was completely oxidized and thesolution turned from dark blue to colourless. Controls included thesame reaction mixture, but extraction buffer was used instead ofextract. The amount of NO2
- was measured in a microplate reader(SPECTRAFLUOR, Tecan) at 535 nm according to the method of Snelland Snell (1949) with a standard curve from 0 to 40 μM NO2
- . Nitriteconcentrations from 0.25 to 16 mMwere used in the assay, in order todetermine the NiR kinetic parameters.
2.4.3. GS activityGS activity was determined from the formation of L-Glu γ-
monohydroxamate as described by O´Neal and Joy (1973), and Oaks etal (1980). Theextractionbuffer forGS (buffer B) contained50 mMHEPES(pH 7.5), 1 mM EDTA, 2 mMdithiothreitol, 0.1% Triton X-100 (v/v), 0.3%polyvinylpolypyrrolidone (w/v) and 10 mM MgSO4. The extracts weredesalted by applying them on a Sephadex column (PD-10 DESALTINGCOLUMN, GE Healthcare, Uppsala, Sweden). The extracts were elutedusing 50 mM HEPES (pH 7.5). An assay mixture containing 160 mMHEPES (pH 7.5), 4.8 mM hydroxylamine (pH 7.5), 3.2 mM MgSO4 and0.16 mM EDTA was prepared. The reaction was conducted in a 96-wellplate in a final volume of 200 μL. To a 76.4 μl aliquot of the assaymixture,we added 25.6 μL of 6.25 mM ATP (pH 7.5) and 76.8 μL extract. Thereactants were incubated for 5 min at 30 °C. At last, 21.2 μL of 0.6 M Gluwere added, the microplate was incubated for 20 min at 30 °C. Thereaction was terminated by adding 40 μL of a FeCl3 solution [2.5% FeCl3(w/v), 5% TCA (w/v), 1.5 N HCl]. The reactants were centrifuged at16,060× g for 2 min. Controlswere run, inwhich 50 mMHEPES (pH 7.5)was used instead of extract. A second control was run, in which thereactionwas stopped by adding the FeCl3 solution immediately after theGlu addition. The amount of L-Glu γ-monohydroxamate was measuredin a microplate reader at 535 nmwith a standard curve from 0 to 25 μMγ-L-Glumonohydroxamate. Glu concentrations from0.5 to 63.6 mMandhydroxylamine (NH2OH) concentrations from0.02 to 4.8 mMwere usedto derive GS kinetic parameters.
2.4.4. GOGAT activityGOGAT activity was determined by the reduction in the absor-
bance of NADH similar to the methods of Singh and Srivastava (1986)and Lin and Kao (1996). Buffer A was used for GOGAT extraction. Theassay mixture contained 125 mM HEPES (pH 7.5), 5 mM EDTA,20 mM KCl and 875 μM NADH. The reaction was conducted in a 96-well plate in a final volume of 250 μL. To a 50 μl aliquot of the assaymixture, we added 100 μL extract, 50 μL of 20 mM Gln and 50 μL of5 mM α-ketoglutarate. Controls included the same reaction mixture,in which the extract was substituted with extraction buffer. Thereduction in NADH absorbance at 340 nm was measured in amicroplate reader (SPECTRAFLUOR, Tecan) at 30 °C for 2 min,immediately after the addition of α-ketoglutarate.
2.5. Photosynthesis and Ci acquisition
Ci fluxes during steady-state photosynthesis were investigated bymeans of a sector-field multicollector mass spectrometer (ISOPRIME,GV Instruments, Manchester, UK). Net photosynthesis was measuredby monitoring the O2 concentration over consecutive LD intervals
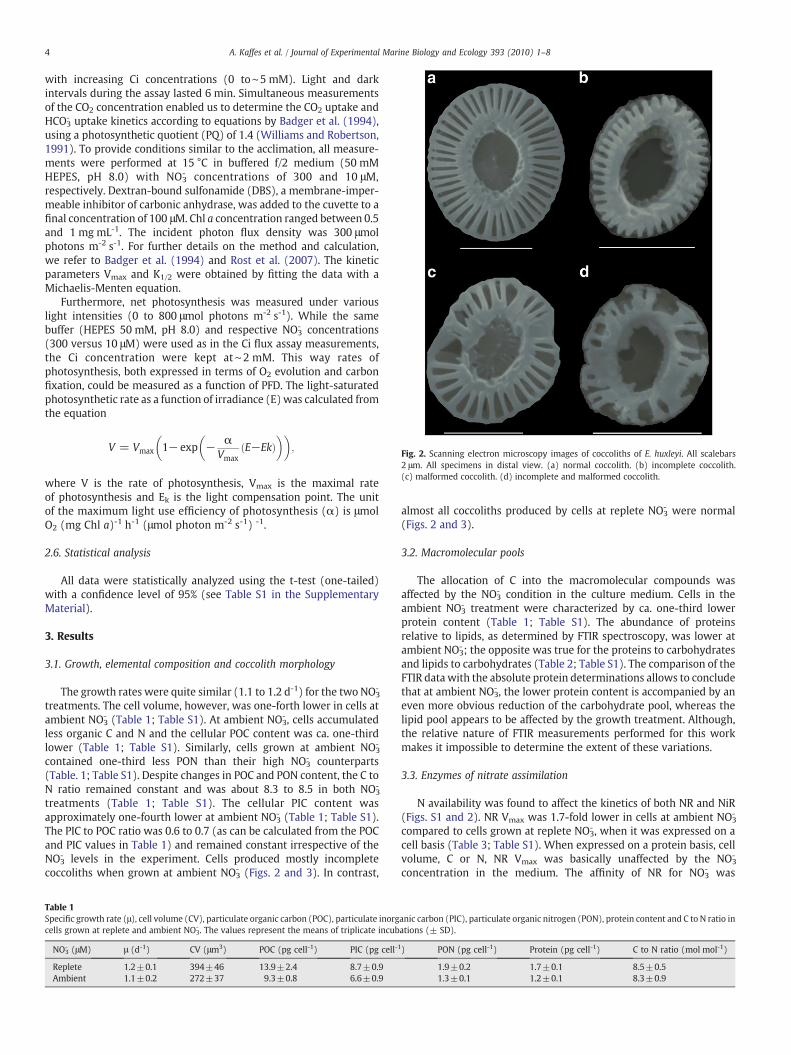
Fig. 2. Scanning electron microscopy images of coccoliths of E. huxleyi. All scalebars2 μm. All specimens in distal view. (a) normal coccolith. (b) incomplete coccolith.(c) malformed coccolith. (d) incomplete and malformed coccolith.
4 A. Kaffes et al. / Journal of Experimental Marine Biology and Ecology 393 (2010) 1–8
with increasing Ci concentrations (0 to∼5 mM). Light and darkintervals during the assay lasted 6 min. Simultaneous measurementsof the CO2 concentration enabled us to determine the CO2 uptake andHCO3
- uptake kinetics according to equations by Badger et al. (1994),using a photosynthetic quotient (PQ) of 1.4 (Williams and Robertson,1991). To provide conditions similar to the acclimation, all measure-ments were performed at 15 °C in buffered f/2 medium (50 mMHEPES, pH 8.0) with NO3
- concentrations of 300 and 10 μM,respectively. Dextran-bound sulfonamide (DBS), a membrane-imper-meable inhibitor of carbonic anhydrase, was added to the cuvette to afinal concentration of 100 μM. Chl a concentration ranged between 0.5and 1 mg mL-1. The incident photon flux density was 300 μmolphotons m-2 s-1. For further details on the method and calculation,we refer to Badger et al. (1994) and Rost et al. (2007). The kineticparameters Vmax and K1/2 were obtained by fitting the data with aMichaelis-Menten equation.
Furthermore, net photosynthesis was measured under variouslight intensities (0 to 800 μmol photons m-2 s-1). While the samebuffer (HEPES 50 mM, pH 8.0) and respective NO3
- concentrations(300 versus 10 μM) were used as in the Ci flux assay measurements,the Ci concentration were kept at∼2 mM. This way rates ofphotosynthesis, both expressed in terms of O2 evolution and carbonfixation, could be measured as a function of PFD. The light-saturatedphotosynthetic rate as a function of irradiance (E) was calculated fromthe equation
V = Vmax 1− exp − αVmax
ðE−EkÞ� �� �
;
where V is the rate of photosynthesis, Vmax is the maximal rateof photosynthesis and Ek is the light compensation point. The unitof the maximum light use efficiency of photosynthesis (α) is μmolO2 (mg Chl a)-1 h-1 (μmol photon m-2 s-1) -1.
2.6. Statistical analysis
All data were statistically analyzed using the t-test (one-tailed)with a confidence level of 95% (see Table S1 in the SupplementaryMaterial).
3. Results
3.1. Growth, elemental composition and coccolith morphology
The growth rates were quite similar (1.1 to 1.2 d-1) for the two NO3-
treatments. The cell volume, however, was one-forth lower in cells atambient NO3
- (Table 1; Table S1). At ambient NO3- , cells accumulated
less organic C and N and the cellular POC content was ca. one-thirdlower (Table 1; Table S1). Similarly, cells grown at ambient NO3
-
contained one-third less PON than their high NO3- counterparts
(Table. 1; Table S1). Despite changes in POC and PON content, the C toN ratio remained constant and was about 8.3 to 8.5 in both NO3
-
treatments (Table 1; Table S1). The cellular PIC content wasapproximately one-fourth lower at ambient NO3
- (Table 1; Table S1).The PIC to POC ratio was 0.6 to 0.7 (as can be calculated from the POCand PIC values in Table 1) and remained constant irrespective of theNO3
- levels in the experiment. Cells produced mostly incompletecoccoliths when grown at ambient NO3
- (Figs. 2 and 3). In contrast,
Table 1Specific growth rate (μ), cell volume (CV), particulate organic carbon (POC), particulate inorgcells grown at replete and ambient NO3
- . The values represent the means of triplicate incub
NO3- (μM) μ (d-1) CV (μm3) POC (pg cell-1) PIC (pg cell-1
Replete 1.2±0.1 394±46 13.9±2.4 8.7±0.9Ambient 1.1±0.2 272±37 9.3±0.8 6.6±0.9
almost all coccoliths produced by cells at replete NO3- were normal
(Figs. 2 and 3).
3.2. Macromolecular pools
The allocation of C into the macromolecular compounds wasaffected by the NO3
- condition in the culture medium. Cells in theambient NO3
- treatment were characterized by ca. one-third lowerprotein content (Table 1; Table S1). The abundance of proteinsrelative to lipids, as determined by FTIR spectroscopy, was lower atambient NO3
- ; the opposite was true for the proteins to carbohydratesand lipids to carbohydrates (Table 2; Table S1). The comparison of theFTIR data with the absolute protein determinations allows to concludethat at ambient NO3
- , the lower protein content is accompanied by aneven more obvious reduction of the carbohydrate pool, whereas thelipid pool appears to be affected by the growth treatment. Although,the relative nature of FTIR measurements performed for this workmakes it impossible to determine the extent of these variations.
3.3. Enzymes of nitrate assimilation
N availability was found to affect the kinetics of both NR and NiR(Figs. S1 and 2). NR Vmax was 1.7-fold lower in cells at ambient NO3
-
compared to cells grown at replete NO3- , when it was expressed on a
cell basis (Table 3; Table S1). When expressed on a protein basis, cellvolume, C or N, NR Vmax was basically unaffected by the NO3
-
concentration in the medium. The affinity of NR for NO3- was
anic carbon (PIC), particulate organic nitrogen (PON), protein content and C to N ratio inations (± SD).
) PON (pg cell-1) Protein (pg cell-1) C to N ratio (mol mol-1)
1.9±0.2 1.7±0.1 8.5±0.51.3±0.1 1.2±0.1 8.3±0.9
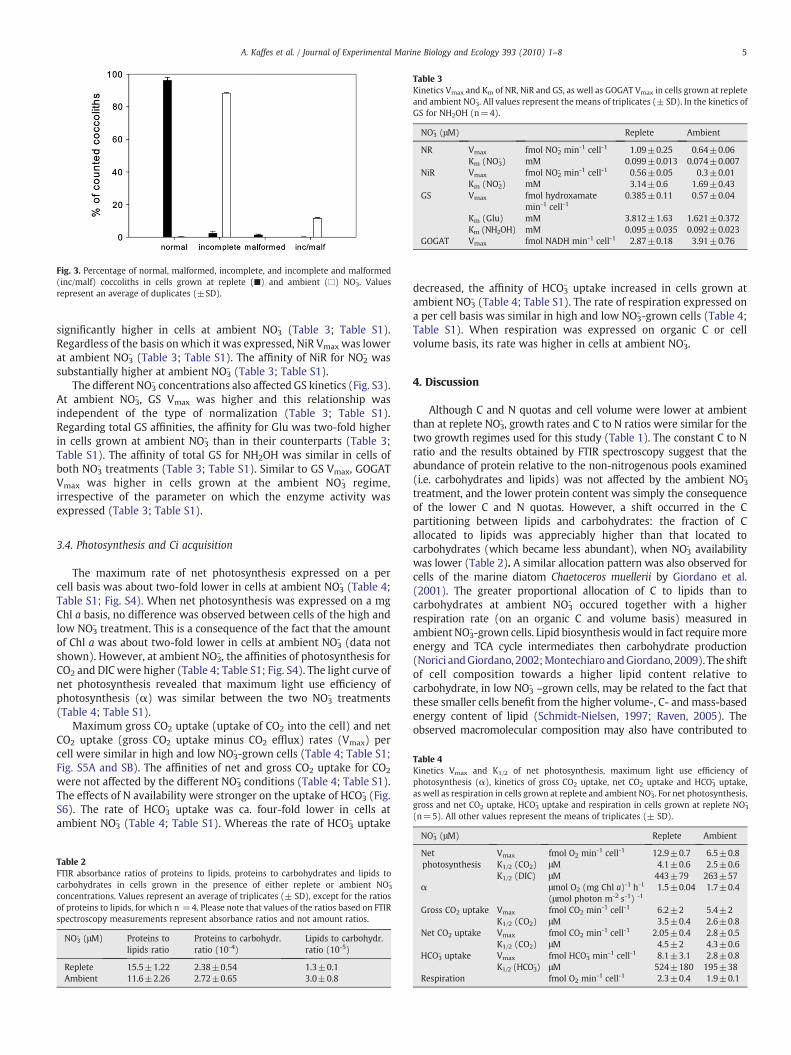
Fig. 3. Percentage of normal, malformed, incomplete, and incomplete and malformed(inc/malf) coccoliths in cells grown at replete (■) and ambient (□) NO3
- . Valuesrepresent an average of duplicates (±SD).
Table 3Kinetics Vmax and Km of NR, NiR and GS, as well as GOGAT Vmax in cells grown at repleteand ambient NO3
- . All values represent the means of triplicates (± SD). In the kinetics ofGS for NH2OH (n=4).
NO3- (μM) Replete Ambient
NR Vmax fmol NO2- min-1 cell-1 1.09±0.25 0.64±0.06
Km (NO3-) mM 0.099±0.013 0.074±0.007
NiR Vmax fmol NO2- min-1 cell-1 0.56±0.05 0.3±0.01
Km (NO2-) mM 3.14±0.6 1.69±0.43
GS Vmax fmol hydroxamatemin-1 cell-1
0.385±0.11 0.57±0.04
Km (Glu) mM 3.812±1.63 1.621±0.372Km (NH2OH) mM 0.095±0.035 0.092±0.023
GOGAT Vmax fmol NADH min-1 cell-1 2.87±0.18 3.91±0.76
Table 4Kinetics Vmax and K1/2 of net photosynthesis, maximum light use efficiency ofphotosynthesis (α), kinetics of gross CO2 uptake, net CO2 uptake and HCO3
- uptake,as well as respiration in cells grown at replete and ambient NO3
- . For net photosynthesis,gross and net CO2 uptake, HCO3
- uptake and respiration in cells grown at replete NO3-
(n=5). All other values represent the means of triplicates (± SD).
5A. Kaffes et al. / Journal of Experimental Marine Biology and Ecology 393 (2010) 1–8
significantly higher in cells at ambient NO3- (Table 3; Table S1).
Regardless of the basis on which it was expressed, NiR Vmax was lowerat ambient NO3
- (Table 3; Table S1). The affinity of NiR for NO2- was
substantially higher at ambient NO3- (Table 3; Table S1).
The different NO3- concentrations also affected GS kinetics (Fig. S3).
At ambient NO3- , GS Vmax was higher and this relationship was
independent of the type of normalization (Table 3; Table S1).Regarding total GS affinities, the affinity for Glu was two-fold higherin cells grown at ambient NO3
- than in their counterparts (Table 3;Table S1). The affinity of total GS for NH2OH was similar in cells ofboth NO3
- treatments (Table 3; Table S1). Similar to GS Vmax, GOGATVmax was higher in cells grown at the ambient NO3
- regime,irrespective of the parameter on which the enzyme activity wasexpressed (Table 3; Table S1).
3.4. Photosynthesis and Ci acquisition
The maximum rate of net photosynthesis expressed on a percell basis was about two-fold lower in cells at ambient NO3
- (Table 4;Table S1; Fig. S4). When net photosynthesis was expressed on a mgChl a basis, no difference was observed between cells of the high andlow NO3
- treatment. This is a consequence of the fact that the amountof Chl a was about two-fold lower in cells at ambient NO3
- (data notshown). However, at ambient NO3
- , the affinities of photosynthesis forCO2 and DIC were higher (Table 4; Table S1; Fig. S4). The light curve ofnet photosynthesis revealed that maximum light use efficiency ofphotosynthesis (α) was similar between the two NO3
- treatments(Table 4; Table S1).
Maximum gross CO2 uptake (uptake of CO2 into the cell) and netCO2 uptake (gross CO2 uptake minus CO2 efflux) rates (Vmax) percell were similar in high and low NO3
- -grown cells (Table 4; Table S1;Fig. S5A and SB). The affinities of net and gross CO2 uptake for CO2
were not affected by the different NO3- conditions (Table 4; Table S1).
The effects of N availability were stronger on the uptake of HCO3- (Fig.
S6). The rate of HCO3- uptake was ca. four-fold lower in cells at
ambient NO3- (Table 4; Table S1). Whereas the rate of HCO3
- uptake
Table 2FTIR absorbance ratios of proteins to lipids, proteins to carbohydrates and lipids tocarbohydrates in cells grown in the presence of either replete or ambient NO3
-
concentrations. Values represent an average of triplicates (± SD), except for the ratiosof proteins to lipids, for which n =4. Please note that values of the ratios based on FTIRspectroscopy measurements represent absorbance ratios and not amount ratios.
NO3- (μM) Proteins to
lipids ratioProteins to carbohydr.ratio (10-4)
Lipids to carbohydr.ratio (10-5)
Replete 15.5±1.22 2.38±0.54 1.3±0.1Ambient 11.6±2.26 2.72±0.65 3.0±0.8
decreased, the affinity of HCO3- uptake increased in cells grown at
ambient NO3- (Table 4; Table S1). The rate of respiration expressed on
a per cell basis was similar in high and low NO3- -grown cells (Table 4;
Table S1). When respiration was expressed on organic C or cellvolume basis, its rate was higher in cells at ambient NO3
- .
4. Discussion
Although C and N quotas and cell volume were lower at ambientthan at replete NO3
- , growth rates and C to N ratios were similar for thetwo growth regimes used for this study (Table 1). The constant C to Nratio and the results obtained by FTIR spectroscopy suggest that theabundance of protein relative to the non-nitrogenous pools examined(i.e. carbohydrates and lipids) was not affected by the ambient NO3
-
treatment, and the lower protein content was simply the consequenceof the lower C and N quotas. However, a shift occurred in the Cpartitioning between lipids and carbohydrates: the fraction of Callocated to lipids was appreciably higher than that located tocarbohydrates (which became less abundant), when NO3
- availabilitywas lower (Table 2). A similar allocation pattern was also observed forcells of the marine diatom Chaetoceros muellerii by Giordano et al.(2001). The greater proportional allocation of C to lipids than tocarbohydrates at ambient NO3
- occured together with a higherrespiration rate (on an organic C and volume basis) measured inambient NO3
--grown cells. Lipid biosynthesis would in fact requiremoreenergy and TCA cycle intermediates then carbohydrate production(Norici andGiordano, 2002;Montechiaro andGiordano, 2009). The shiftof cell composition towards a higher lipid content relative tocarbohydrate, in low NO3
- –grown cells, may be related to the fact thatthese smaller cells benefit from the higher volume-, C- and mass-basedenergy content of lipid (Schmidt-Nielsen, 1997; Raven, 2005). Theobserved macromolecular composition may also have contributed to
NO3- (μM) Replete Ambient
Netphotosynthesis
Vmax fmol O2 min-1 cell-1 12.9±0.7 6.5±0.8K1/2 (CO2) μM 4.1±0.6 2.5±0.6K1/2 (DIC) μM 443±79 263±57
α μmol O2 (mg Chl a)-1 h-1
(μmol photon m-2 s-1) -11.5±0.04 1.7±0.4
Gross CO2 uptake Vmax fmol CO2 min-1 cell-1 6.2±2 5.4±2K1/2 (CO2) μM 3.5±0.4 2.6±0.8
Net CO2 uptake Vmax fmol CO2 min-1 cell-1 2.05±0.4 2.8±0.5K1/2 (CO2) μM 4.5±2 4.3±0.6
HCO3- uptake Vmax fmol HCO3
- min-1 cell-1 8.1±3.1 2.8±0.8K1/2 (HCO3
-) μM 524±180 195±38Respiration fmol O2 min-1 cell-1 2.3±0.4 1.9±0.1
6 A. Kaffes et al. / Journal of Experimental Marine Biology and Ecology 393 (2010) 1–8
the decreased calcite content (Table 1) and higher proportion ofincomplete coccoliths (Figs. 2 and 3) observed for lowNO3
--grown cells.It has been hypothesized that, under N-deficiency, incomplete coccolithformation may be caused by a shortage of polysaccharides involvedin coccolithogenesis and/or to "an inadequate level of some essentialN-compound" (e.g. protein) that may affect crystal growth (Paasche,1998). It is conspicuous that no differences in the percentagesof malformed coccoliths were observed (Fig. 3). It is concluded thatN-deficiency does not disturb the coccolith-shaping machinery assuch. Two components of this machinery have been identified,namely the Coccolith Associated Polysaccharide, CAP (Henriksen etal., 2004; Marsh et al., 2002) and the cytoskeleton (Langer et al.,submitted for publication). Hence, the shortage of polysaccharides,hypothesized by Paasche (1998), does not include CAP, nor does theshortage of protein include the cytoskeleton.
Based on the enzyme kinetics measured for NR and the kinetics ofnet photosynthesis derived from the MIMS measurements, weestimated the intracellular concentrations of NO3
- and CO2 whichallow for balanced growth, i.e. maintenance of a constant C to N ratio.Please note that C and N fluxes based on MIMS measurements and NRactivity represent instantaneous rates obtained three to four hours afterthe beginning of the photoperiod, while the C and N quotas representintegrated values over a complete LD cycle. For E. huxleyi, no significantdifferences were found between the integrated C to N ratios duringexponential growth under continuous light and the ones under LD cycle(Price et al., 1998). During growth under continuous light, fixation of Cand N appear to be closely coupled, hence the primary products ofphotosynthesis are directly used in biosynthesis rather than for carbonstorage (Burkhardt et al., 1999). Under these circumstances, the netfixation rate of C (Cflux) can thus be expressed in terms of theN assimilation rate (Nflux), using the C to N ratio:
Cflux
Nflux=
POCPON
ð1Þ
The upper boundary for Cflux in balance with N assimilation isprovided by the maximum NR activity Vmax
NR and would be obtained atinfinite NO3
- concentration in the cytosol. Using our result for VmaxNR , the
upper limit for Cflux that derives from Eq. (1) is very similar to themaximum net photosynthesis (in terms of C), which we obtained fromthe MIMS measurements (Vmax
CO2 =VmaxO2 /PQ, with PQ being the photo-
synthetic quotient). For balanced growth to bemaintained (Eq.(1)), theupper limit for Cflux must assume a value of 9.3 fmol min-1 cell-1 for thereplete NO3
- condition (POC/PON=8.5), and 5.3 fmol min-1 cell-1 forcells acclimated to ambient NO3
- (POC/PON = 8.3). Given thephotosynthetic quotient from a NO3
--utilizing cell (PQ=1.36;Williamsand Robertson, 1991), the MIMS measurements predict a Vmax
CO2 of9.5±0.5 fmol min-1 cell-1 and 4.8±0.6 fmol min-1 cell-1, for thereplete and ambient NO3
- conditions, respectively. Hence, the ratiosof Vmax
CO2 and VmaxNR are approximately given by the C to N ratios for
the two growth NO3- concentrations used for this study (high NO3
-:1.0 POC/PON, low NO3
-: 0.9 POC/PON). Using Eq. (1) and VmaxCO2 /Vmax
NR ≈POC/PON it follows that
Cflux
VmaxCO2
≈ Nflux
VmaxNR ð2Þ
In the following, we assume for the Cflux the enzyme activity ofRubisco and for the Nflux the enzyme activity of NR. Using Michaelis-Menten kinetics for the C and N fluxes, Eq. (2) yields the condition forbalanced growth in terms of the intracellular concentrations of NO3
- andCO2
½CO2�KRub + ½CO2�
≈ ½NO−3�
KNR + ½NO−3�
ð3Þ
which can be written as
KRub
½CO2�+ 1
� �−1≈ KNR
½NO−3 � + 1
� �−1ð4Þ
Finally, a further simplification of (4) yields
½CO2�KRub
≈ NO−3½ �
KNRð5Þ
with KRub and KNR being the Michaelis-Menten constants for Rubiscoand NR, respectively.
Generally, for an enzyme possessing the activity V0, the ratio ofthe concentration of the substrate S and the Michaelis-Mentenconstant Km determines the degree of saturation of the enzymeactivity (V0/Vmax=1/(Km/[S]+1)). Based on Eq. (5) it follows that aconstant C to N ratio can be maintained for intracellular [CO2] and[NO3
- ] which yield a comparable saturation of the enzyme activity forthe enzymes involved in C and N assimilation. Hence, the mainte-nance of a constant C to N ratio requires a concerted regulation of theintracellular [CO2] and [NO3
- ] to equilibrate the fluxes through the Cand N assimilation pathway. It should be noted that Eq. (5) is valid forall degrees of enzyme saturation (0bV0/Vmaxb1) in the cellsacclimated to the two growth regimes. This flexibility indicates thatthe maintenance of a constant C to N ratio under different growthconditions does not imply constant kinetic properties of the enzymesinvolved in the C and N assimilation pathway. In fact, the availabilityof NO3
- affects the kinetics of NR, NiR and net photosynthesis in E.huxleyi cells. At ambient NO3
- , the Vmax of NR, NiR and netphotosynthesis was down-regulated compared to cells grown atreplete NO3
- (Tables 3 and 4), probably as a result of less proteinamounts. In cells grown at ambient NO3
- , the effect of lower enzymeactivity (Vmax) on the C and N flux was weakened by the increase inthe affinity of NR, NiR and net photosynthesis for the substrates(Tables 3 and 4). Since the E. huxleyi genome appears to have only onegene encoding for NR (Bruhn et al., 2010) and one encoding for NiR(Wurch), the change in the affinity for the substrates (lower Km of NRfor NO3
- and of NiR for NO2- at ambient NO3
- ) cannot be attributed to theexpression of different isoforms and must be attributed to post-translational regulation. The decrease in the K1/2 of photosynthesis atambient NO3
- may be related to post-translational regulation orexpression of high-affinity HCO3
- transporters (Amoroso et al., 2003).The kinetics of GS in E. huxleyi cells are also modified in response toNO3
- availability. The higher total GS Vmax in cells at ambient NO3-
(Table 3) may be a response of NH4+ re-assimilation after increased
proteolysis in cells under N limiting conditions (Hipkin et al., 1982).The activity of GOGAT showed more or less the same response to NO3
-
availability as total GS activity; this is not surprising, since these twoenzymes operate sequentially.
In addition to the regulation of Km, the degree of enzymesaturation is determined by the substrate concentration establishedat the site of the enzyme. For instance, when the NR activity reaches80% of its maximum value, NO3
- accumulates in the cytosol, yieldingconcentrations of 396 μM and 296 μM for the cells acclimated to highand low NO3
- , respectively. For balanced growth to be maintained(Eq. (5)), the CO2 concentration at the site of Rubisco must thenexceed KRub by a factor of 4, for the replete and ambient NO3
-
conditions. The values of KRub for the two growth conditions are notknown. Assuming a KRub of 30 μM (Badger et al., 1998), it follows a[CO2] at Rubisco of 120 μM. We assumed steady state conditions forN assimilation. In other words, the substrates inside the cellaccumulate until the rates of reactions are the same for all the
7A. Kaffes et al. / Journal of Experimental Marine Biology and Ecology 393 (2010) 1–8
enzymes involved in the N assimilation pathway (from NO3- to NH4
+
assimilation by GS):
Nflux =Vmax
NR NO−3½ �
KNR + NO−3
� � =Vmax
NiR NO−2½ �
KNiR + NO−2
� � =Vmax
GS NHþ4
� �KGS + NHþ
4
� � ð6Þ
Then, the NiR kinetics data predicts an accumulation of high NO2-
concentrations at the site of NiR activity. The requirement for a highNO2
- concentration for E. huxleyi NiR suggests that this enzyme isconfined in the proximity of the chloroplast envelope, possibly nearthe entry point of NO2
- into the chloroplast. However, high internalNO2
- pools of 4 to 5 mM have been reported for the diatomChaetocheros sp. (Lomas and Glibert, 2000).
The GS could not be used for estimated intracellular NH4+
concentrations in our study. Glutamine synthetase activity wasfound to be approximately 40% higher when measured with aradioactive assay with ammonia as substrate in comparison to thecolorimetric assay with NH2OH as substrate (Listrom et al., 1997).Furthermore, GS activity in microalgae deriving from measurementswith the biosynthetic reaction assay was found to be two to three foldhigher compared with the enzyme activity from the transferasereaction assay (Bressler and Ahmed, 1984). Therefore the use ofNH2OH instead of NH4
+ and/or the application of the GS transferaseinstead of the biosynthetic assay may be the reasons that do not allowusing GS Vmax for the estimation of intracellular NH4
+ concentrationsin our study.
In conclusion, NO3- availability seem to have a crucial impact on the
regulation of C and N fluxes in the marine coccolithophore E. huxleyi,without necessarily changing the C to N ratios and/or growth rates ofcells. With the exception of GS and GOGAT, cells generally respond toambient NO3
- availability with a down regulation of activities ofproteins involved in the acquisition and assimilation of inorganic Cand N. At the same time, the substrate affinities of these proteinsincrease in response to ambient NO3
- . Our study suggests that theintracellular CO2 and NO3
- concentrations have to be carefullyregulated, in order to equilibrate the fluxes through the C and Nassimilation pathways, and ensure an adequate growth for therespective NO3
- conditions.
Acknowledgements
We would like to thank Ellen Lichte for technical assistance. Theresearch leading to these results has received funding from theGerman Research Foundation (DFG) and is part of the project TH 744/2-3. This research was also supported by the Spanish Ministry ofEducation (Juan de la Cierva programme) cofunded by the EuropeanSocial Fund andMinistry of Science and Innovation. S. Trimborn and B.Rost acknowledge financial support by the European Research Councilunder the European Community’s Seventh Framework Programme(FP7/2007-2013)/ERC grant agreement (205150). [SS]
Appendix A. Supplementary data
Supplementary data associated with this article can be found, inthe online version, at doi:10.1016/j.jembe.2010.06.004.
References
Amoroso, G., Seimetz, N., Sueltemeyer, D., 2003. The dc13 gene upstream of ictB isinvolved in rapid induction of the high affinity Na+ dependent HCO3
- transporter incyanobacteria. Photosynth. Res. 77, 127–138.
Badger, M.R., Palmqvist, K., Yu, J.W., 1994. Measurement of CO2 and HCO3-fluxes in
cyanobacteria and microalgae during steady-state photosynthesis. Physiol. Plant.90, 529–536.
Badger, M.R., Andrews, T.J., Whitney, S.M., Ludwig, M., Yellwolees, C., Leggat, W., Price,G.D., 1998. The diversity and coevolution of Rubisco, plastids, pyrenoids, andchloroplast-based CO2-concentrating mechanisms in microalgae. Can. J. Bot. 76,1052–1071.
Baumann, K.H., Bockel, B., Frenz, M., 2004. Coccolith contribution to South Atlantikcarbonate sedimentation. In: Thierstein, H.R., Young, J.R. (Eds.), Coccolithophores:From Molecular Processes to Global Impact. Springer, Berlin, pp. 367–402.
Beardall, J., Giordano, M., 2002. Ecological implications of microalgal and cyano-bacterial CO2 concentrating mechanisms, and their regulation. Funct. Plant Biol.29, 335–347.
Beardall, J., Johnston, A., Raven, J.A., 1998. Environmental regulation of CO2-concentrating mechanisms in microalgae. Can. J. Bot. 76, 1010–1017.
Bradford, M.M., 1976. A rapid and sensitive method for the quantitation of microgramquantities of protein utilizing the principle of protein-dye binding. Anal. Biochem.72, 248–254.
Bressler, S.L., Ahmed, S.I., 1984. Detection of glutamine synthetase activity in marinephytoplankton: optimization of the biosynthetic assay. Mar. Ecol. Prog. Ser. 14,207–217.
Bruhn, A., LaRoche, J., Richardson, K., 2010. Emiliania huxleyi (Prymnesiophyceae):Nitrogen-metabolism genes and their expression in response to external nitrogensources. J. Phycol. 14, 266–277.
Burkhardt, S., Zondervan, I., Riebesell, U., 1999. Effect of CO2 concentration on C:N:Pratio in marine phytoplankton: A species comparison. Limnol. Oceanogr. 44 (3),683–690.
Domenighini, A., Giordano, M., 2009. Fourier transform infrared spectroscopy ofmicroalgae as a novel tool for biodiversity studies, species identification, and theassessment of water quality. J. Phycol. 45, 522–531.
Elfiri, I.R., Turpin, D.H., 1986. NO3- and NH4
+ induced photosynthetic suppression in N-limited Selenastrum minutum. Plant Physiol. 81, 273–279.
Fernandez, A., Galvan, A., 2008. Nitrate assimilation in Chlamydomonas. Euk. Cell. 7,555–559.
Giordano, M., Kansiz, M., Heraud, P., Beardall, J., Wood, B., McNaughton, D., 2001.Fourier transform infrared spectroscopy as a novel tool to investigate changes inintracellular macromolecular pools in the marine microalga Chaetoceros muellerii(Bacillariophyceae). J. Phycol. 37, 271–279.
Giordano, M., Beardall, J., Raven, J.A., 2005a. CO2 concentrating mechanisms in algae.Mechanisms, environmental modulation, and evolution. Annu. Rev. Plant Biol. 56,99–131.
Giordano, M., Chen, Y.B., Koblizek, M., Falkowski, P., 2005b. Regulation of nitratereductase in Chlamydomonas reinhardtii by the redox state of the plastoquinonepool. Eur. J. Phycol. 40, 345–352.
Guillard, R.R.L., Ryther, J.H., 1962. Studies of marine planktonic diatoms. Can. J.Microbiol. 8, 229–239.
Henriksen, K., Stipp, S.L.S., Young, J.R., Marsh, M.E., 2004. Biological control on calcitecrystallization: AFM investigation of coccolith polysaccharide function. Am.Mineral. 89, 1709–1716.
Hipkin, C.R., Everest, S.A., Rees, T.A.V., Syrett, P.J., 1982. Ammonium generation bynitrogen-starved cultures of Chlamydomonas reinhardtii. Planta 154, 587–592.
Huppe, H.C., Turpin, D.H., 1994. Integration of carbon and nitrogen metabolism in plantand algal cells. Annu. Rev. Plant Physiol. 45, 577–607.
Iwamoto, K., Shiraiwa, Y., 2003. Characterization of NADH: nitrate reductase from thecoccolithophorid Emiliania huxleyi (Lohman) Hay & Mohler (Haptophyceae). Mar.Biotechnol. 5, 20–26.
Langer, G., De Nooijer, L., Oetjen, K., submitted for publication. On the role of thecytoskeleton incoccolithmorphogenesis: theeffect of cytoskeleton inhibitors. J. Phycol.
LaRoche, J., Rost, B., Engel, A., 2010. Bioassays, batch culture and chemostatexperimentation. In: Riebesell, U., Fabry, V.J., Hansson, L., Gattuso, J.-P. (Eds.),Guide to best practices for ocean acidification research and data reporting, 260 p.Luxembourg: Publications Office of the European Union 81–94.
Lin, C.C., Kao, C.H., 1996. Disturbed ammonium assimilation is associated with growthinhibition of roots in rice seedlings caused by NaCl. Plant Growth. Reg. 18, 233–238.
Listrom, C.D., Morizono, H., Rajagopal, B.S., McCann, M.T., Tuchman, M., Allewell, N.M.,1997. Expression, purification, and characterization of recombinant humanglutamine synthetase. Biochem. J. 328, 159–163.
Lomas, M.W., Glibert, P.M., 2000. Comparisons of nitrate uptake, storage, and reductionin marine diatoms and flagellates. J. Phycol. 36, 903–913.
Marsh, M.E., Ridall, A.L., Azadi, P., Duke, P.J., 2002. Galacturonomannan and Golgi-derived membrane linked to growth and shaping of biogenic calcite. J. Struct. Biol.139, 39–45.
Maurin, C., Le Gal, Y., 1997a. Isoforms of glutamine synthetase in the marinecoccolithophorid Emiliania huxlyei (Prymnesiophyceae). Comp. Biochem. Physiol.118, 903–912.
Maurin, C., Le Gal, Y., 1997b. Glutamine synthetase in the marine coccolithophoridEmiliania huxleyi (Prymnesiophyceae): regulation of activity in relation to light andnitrogen availability. Plant Sci. 122, 61–69.
Montechiaro, F., Giordano, M., 2009. Effect of prolonged dark incubation on pigmentsand photosynthesis of the cave-dwelling cyanobacterium Phormidium autumnale(Oscillatoriales, Cyanobacteria). Phycologia 45, 704–710.
Norici, A., Giordano, M., 2002. Anaplerosis in microalgae. Rec. Res. Dev. Plant Phys. 3,153–164.
Oaks, A., Stulen, I., Jones, K., Winspear, M.J., Misra, S., Boesel, I.L., 1980. Enzymes ofnitrogen assimilation in maize roots. Planta 148, 477–484.
O´Neal, D., Joy, K.W., 1973. Glutamine synthetase of pea leaves. I. Purification,stabilization and pH optima. Arch. Biochem. Biophys. 159, 113–122.
Paasche, E., 1998. Roles of nitrogen and phosphorus in coccolith formation in Emilianiahuxleyi (Prymnesiophyceae). Eur. J. Phycol. 33, 33–42.
Page, S., Hipkin, C.R., Flynn, K.J., 1999. Interactions between ammonium and nitrate inEmiliania huxleyi. J. Exp. Mar. Biol. Ecol. 236, 307–319.
Palmucci, M., Giordano, M., submitted for publication. Carbon allocation in elevenmicroalgal species cultured at different nitrate concentrations. Eur. J. Phycol.
8 A. Kaffes et al. / Journal of Experimental Marine Biology and Ecology 393 (2010) 1–8
Price, L.L., Yin, K., Harrison, P.J., 1998. Influence of continuous light and L:D cycles on thegrowth and chemical composition of Prymnesiophyceae including coccolithophores.J. Exp. Mar. Biol. Ecol. 223, 223–234.
Raven, J.A., 1997. Inorganic carbon acquisition in marine autotrophs. Adv. Bot. Res. 27,85–209.
Raven, J.A., 2005. Cellular location of starch synthesis and evolutionary origins of starchgenes. J. Phycol. 41, 1070–1072.
Riegman, R., Stolte, W., Noordeloos, A.A.M., Slezak, D., 2000. Nutrient uptake andalkaline phosphatase activity of Emiliania huxleyi (Prymnesiophyceae) duringgrowth under N and P limitation in continuous cultures. J. Phycol. 36, 87–96.
Rost, B., Riebesell, U., Burkhardt, S., Sültemeyer, D., 2003. Carbon acquisition of bloom-forming marine phytoplankton. Limnol. Oceanogr. 48, 55–67.
Rost, B., Riebesell, U., Sültemeyer, D., 2006. Carbon acquisition of marine phytoplankton:Effect of photoperiod length. Limnol. Oceanogr. 51, 12–20.
Rost, B., Kranz, S.A., Richter, K.-U., Tortell, P.D., 2007. Isotope disequilibrium and massspectrometric studies of inorganic carbon acquisition by phytoplankton. Limnol.Oceanogr. Methods 5, 328–337.
Schmidt-Nielsen, K., 1997. Animal Physiology: Adaptation and Environment, 5th ed.Cambridge University Press, Cambridge, pp. 1–617.
Singh, R.P., Srivastava, H.S., 1986. Increase in glutamate synthase (NADH) in maizeseedlings in response to nitrate and ammonium nitrogen. Physiol. Plant. 66,413–416.
Snell, F.D., Snell, C.T., 1949. “Colorimetric methods of analysis”, vol. II. Van Nostrand,New York, pp. 804–805.
Trimborn, S., Langer, G., Rost, B., 2007. Effect of varying calcium concentrations andlight intensities on calcification and photosynthesis in Emiliania huxleyi. Limnol.Oceanogr. 52, 2285–2293.
Turpin, D.H., 1991. Effects of inorganic N availability on algal photosynthesis and carbonmetabolism. J. Phycol. 27, 14–20.
Weger, H.G., Turpin, D.H., 1989. Mitochondrial respiration can support NO3- and NO2
-
reduction during photosynthesis. Interactions between photosynthesis, respira-tion, and N assimilation in the N-limited green alga Selenastrum minutum. PlantPhysiol. 89, 409–415.
Williams, P.J.I., Robertson, J.E., 1991. Overall planktonic oxygen and carbon dioxidernetabolisrns: the problem of reconciling observations and calculations ofphotosynthetic quotients. J. Plankton Res. 13, 153–169.
Winter, A., Jordan, R.W., Roth, P.H., 1994. Biogeography of living coccolithophores inoceanwaters. In:Winter, A., Siesser,W.G. (Eds.), coccolithophores. Cambridge UnivPress, pp. 161–177.
Wray, J.L., Filner, P., 1970. Structural and functional relationships of enzyme activitiesinduced by nitrate in barley. Biochem. J. 119, 715–725.
Wurch, L., http://genome.jgi-psf.org/cgi-bin/dispGeneModel?db=Emihu1&tid=430293.
Related Documents