Journal of Plankton Research Vol.18 no.12 pp.2349-2366, 1996 Patterns of carbon and nitrogen uptake during blooms of Emiliania huxleyi in two Norwegian fjords E.Ferndndez, 1 E.MararS6n, 2 D.S.Harbour, 3 S.Kristiansen 4 and B.R.Heimdal 5 1 Departamento de Recursos Naturais e Medio Ambiente, Universidade de Vigo, Campus La%oas-Marcosende, E-36200 Vigo, 2 Departmento de Biologla de Organismos y Sistemas, Universidad de Oviedo, E-33071 Oviedo, Spain, 3 Plymouth Marine Laboratory, Prospect Place, West Hoe, Plymouth PL1 3DH, UK, 4 Department of Biology, Marine Botany, University of Oslo, PO Box 1069 BUndent, N-0316 Oslo and 5 Department of Fisheries and Marine Biology, Bergen High Technology Center, University of Bergen, N-5020 Bergen, Norway Abstract. Blooms of the coccolithophorid Emiliania huxleyi were monitored in two land-locked fjords, Fauskangerpollen and Nordasvannet (Western Norway), in May 1993. The chemical composi- tion of participate matter, size-fractionated photosynthesis, calcification, nitrogen uptake rates and the patterns of macromolecular synthesis were examined during the peak and decline of E. huxleyi blooms. The temporal evolution of the bloom in Fauskangerpollen was defined by a gradual decrease in cell abundance and cell-specific calcification rates, and by increasing numbers of empty coccospheres and the ratio detached coccoliths/living cells. A large proportion of the nitrogen required for microplank- ton growth was supplied by ammonium and dissolved organic compounds such as urea and, as a con- sequence, the f-ratios were low (-0.2). In general, nitrogen uptake patterns were consistent with ambient concentrations of nitrogenous species. The photosynthetic carbon metabolism of E.huxleyi- dominated phytoplankton assemblages was characterized by high carbon allocation into lipids and relatively low carbon incorporation into protein as compared with diatom-dominated assemblages. Consequently, the organic Gnitrogen uptake ratio determined stoichiometrically was significantly higher (up to 10.8) when coccolithophorids were dominant than in diatom-based or mixed-phyto- plankton assemblages. These carbon incorporation patterns were reflected in differences in the chemi- cal composition of paniculate matter. Introduction The coccolithophorid Emiliania huxleyi (Lohm.) Hay et Mohler is a species known to form extensive blooms in coastal and oceanic environments (e.g. Holli- gan et al., 1983,1993; Balch et al, 1991; Van der Val et al., 1995). Recent investi- gations have stressed the significance of this species in the biogeochemical cycling of carbon (Holligan et al., 1993; Robertson et al., 1994) and sulphur (Malin et al., 1993; Matrai and Keller, 1993), derived from its capability of synthesizing external structures of calcium carbonate (coccoliths) and considerable amounts of the climate-related volatile compound dimethyl sulfide. In spite of the increasing efforts in recent years devoted to the investigation of E. huxleyi bloom dynamics, knowledge on the temporal evolution of these blooms under natural conditions is still limited. It has been shown that at the time of being detected by remote sensing, they are in a declining or even collapsing stage (Fer- ndndez et al, 1993). Moreover, little is known about the basic ecophysiological characteristics of these populations, such as the patterns of carbon and nitrogen assimilation under sea-truth conditions (see, for example, Balch et al, 1992; Fer- nandez et al, 1993). Emiliania huxleyi blooms succeeding the spring diatom bloom are known to be © Oxford University Press 2349 by guest on September 26, 2012 http://plankt.oxfordjournals.org/ Downloaded from

Welcome message from author
This document is posted to help you gain knowledge. Please leave a comment to let me know what you think about it! Share it to your friends and learn new things together.
Transcript
Journal of Plankton Research Vol.18 no.12 pp.2349-2366, 1996
Patterns of carbon and nitrogen uptake during blooms ofEmiliania huxleyi in two Norwegian fjords
E.Ferndndez,1 E.MararS6n,2 D.S.Harbour,3 S.Kristiansen4 and B.R.Heimdal5
1Departamento de Recursos Naturais e Medio Ambiente, Universidade de Vigo,Campus La%oas-Marcosende, E-36200 Vigo, 2Departmento de Biologla deOrganismos y Sistemas, Universidad de Oviedo, E-33071 Oviedo, Spain,3Plymouth Marine Laboratory, Prospect Place, West Hoe, Plymouth PL1 3DH,UK, 4Department of Biology, Marine Botany, University of Oslo, PO Box 1069BUndent, N-0316 Oslo and 5Department of Fisheries and Marine Biology, BergenHigh Technology Center, University of Bergen, N-5020 Bergen, Norway
Abstract. Blooms of the coccolithophorid Emiliania huxleyi were monitored in two land-lockedfjords, Fauskangerpollen and Nordasvannet (Western Norway), in May 1993. The chemical composi-tion of participate matter, size-fractionated photosynthesis, calcification, nitrogen uptake rates and thepatterns of macromolecular synthesis were examined during the peak and decline of E. huxleyi blooms.The temporal evolution of the bloom in Fauskangerpollen was defined by a gradual decrease in cellabundance and cell-specific calcification rates, and by increasing numbers of empty coccospheres andthe ratio detached coccoliths/living cells. A large proportion of the nitrogen required for microplank-ton growth was supplied by ammonium and dissolved organic compounds such as urea and, as a con-sequence, the f-ratios were low (-0.2). In general, nitrogen uptake patterns were consistent withambient concentrations of nitrogenous species. The photosynthetic carbon metabolism of E.huxleyi-dominated phytoplankton assemblages was characterized by high carbon allocation into lipids andrelatively low carbon incorporation into protein as compared with diatom-dominated assemblages.Consequently, the organic Gnitrogen uptake ratio determined stoichiometrically was significantlyhigher (up to 10.8) when coccolithophorids were dominant than in diatom-based or mixed-phyto-plankton assemblages. These carbon incorporation patterns were reflected in differences in the chemi-cal composition of paniculate matter.
Introduction
The coccolithophorid Emiliania huxleyi (Lohm.) Hay et Mohler is a speciesknown to form extensive blooms in coastal and oceanic environments (e.g. Holli-gan et al., 1983,1993; Balch et al, 1991; Van der Val et al., 1995). Recent investi-gations have stressed the significance of this species in the biogeochemical cyclingof carbon (Holligan et al., 1993; Robertson et al., 1994) and sulphur (Malin et al.,1993; Matrai and Keller, 1993), derived from its capability of synthesizing externalstructures of calcium carbonate (coccoliths) and considerable amounts of theclimate-related volatile compound dimethyl sulfide.
In spite of the increasing efforts in recent years devoted to the investigation ofE. huxleyi bloom dynamics, knowledge on the temporal evolution of these bloomsunder natural conditions is still limited. It has been shown that at the time of beingdetected by remote sensing, they are in a declining or even collapsing stage (Fer-ndndez et al, 1993). Moreover, little is known about the basic ecophysiologicalcharacteristics of these populations, such as the patterns of carbon and nitrogenassimilation under sea-truth conditions (see, for example, Balch et al, 1992; Fer-nandez et al, 1993).
Emiliania huxleyi blooms succeeding the spring diatom bloom are known to be
© Oxford University Press 2349
by guest on September 26, 2012
http://plankt.oxfordjournals.org/D
ownloaded from
E.Fernindez et al.
recurrent features in Norwegian fjords (e.g. Braarud et al., 1974; Erga, 1989) andhave been reported since early this century (Gran, 1912). These blooms are some-times restricted to subsurface waters underneath a brackish surface layer (Kris-tiansen et al., 1994b), but discoloration of surface waters due to extremely highdensities of this organism is also quite common (Berge, 1962).
Fjords, and particularly land-locked fjords, are excellent locations for study-ing the dynamics of E.huxleyi populations because it is possible to monitoralmost unaltered water bodies during time scales relevant for the evolution ofphytoplankton blooms. This singular characteristic is even more pronouncedwhen these blooms take place in subsurface layers as exchange processesbetween land-locked and the main fjord are then more restricted (Gaarder andBjerkan, 1934). The objectives of this research were: (i) to describe changes instanding stocks and physiological rates associated with the development(decline) of a bloom of E.huxleyi in a land-locked fjord; (ii) to determine ratesof calcification and nitrogen uptake by phytoplankton populations in the fjords;(iii) to find out differences in the patterns of photosynthetic carbon metabolismbetween £./zujt/e_yj-dominated and diatom-dominated phytoplankton assem-blages.
Method
Sampling and study sites
Sampling was conducted on board R/V 'Hans Brattstrom' in Fauskangerpollen(60°30'N, 5°02'W; 19,24 and 26 May, 1993) and Nordasvannet (60°20'N, 5°20'W;27 May 1993). Both study sites are land-locked fjords situated on the west coastof Norway. Fauskangerpollen, located -20 km west of Bergen, is connected withthe main fjord through a 40 m wide, 4 m deep entrance and consists of a singlebasin with a maximum depth of 92 m. Nordasvannet is situated ~7 km south ofBergen and consists of an inner basin 90 m deep which is connected with the outerfjord by two parallel channels, each -12 m wide and with a maximum depth of2-4 m.
Water samples for the determination of salinity, nutrients, chlorophyll a phyto-plankton abundance, particulate carbon and nitrogen, proteins, carbohydrates,lipids, and carbon and nitrogen incorporation rates were collected with 5 1 Niskinbottles. The samples were then transferred to 5 1 acid-washed polypropylenecarboys and kept refrigerated in darkness until transport to the laboratory. Thevertical extinction of light was calculated from the reading of the Secchi diskdepth.
Hydrographic and standing stock variables
Salinity was determined with an inductive salinometer, and dissolved nitrate andsoluble reactive phosphorus in a Scalar autoanalyzer within 24 h, according toGrashoff et al (1983). Ammonium and urea were analyzed within 2-4 h after sam-pling following the methods of Sol6rzano (1969) and McCarthy (1970), respectively.
Chlorophyll a was measured on two size fractions, 0.2-5 |i,m, by filtration of
2350
by guest on September 26, 2012
http://plankt.oxfordjournals.org/D
ownloaded from

Carbon and nitrogen uptake in E-huxleyl blooms
100 ml water subsamples through Poretics polycarbonate filters, freezing of thefilter and extraction in 90% acetone at 4°C overnight. Chlorophyll a fluorescencewas then measured with a Turner Design fluorometer previously calibrated with asolution of pure chlorophyll a. Identification and counting of phytoplankton cellswere performed by examining samples preserved both in Lugol's iodine andbuffered formalin with an inverted microscope. Coccolithophorids were countedonly in the formalin-preserved samples. Samples preserved in Lugol's iodine solu-tion were not taken on the second visit to Fauskangerpollen (24 May) and, as a con-sequence, the abundance of small flagellates on that date could not be estimated.Cell numbers were converted to carbon biomass as described in Holligan et al.(1984).
Data on total particulate carbon and nitrogen are not reliable due to methodo-logical problems during sample preparation, and therefore are not presented inthis paper. The concentration of proteins, carbohydrates and lipids was deter-mined as described in Fernandez et al (1992) using as standards bovine serumalbumin, glucose and cholesterol, respectively. Concentrations were converted tocarbon equivalents by assuming the carbon content of each biochemical pool tobe 53% of total weight for proteins (Laws, 1991), and 40 and 83% for carbohy-drates and lipids, respectively (Fraga and P6rez, 1990). These conversion factorshave previously been demonstrated to show a very small variability in naturalphytoplankton populations (Fraga and P6rez, 1990; Laws, 1991). Parallel esti-mates of the organic carbon content in natural phytoplankton measured by ele-mental analysis and the sum of the carbon content of proteins, carbohydrates andlipids calculated as described above did not show significant differences (Fern&n-dez et al, 1994b). Experiments undertaken with cultures of E.huxleyi (Ferndndezet al, 1996a) revealed that both estimates were linearly related with a slope notdiffering significantly from unity [particulate organic carbon (POC) (estimated)= 0.97 (± 0.13) POC (measured) -0.41 (± 1.65) r = 0.80, P < 0.001]. Total particu-late nitrogen standing stock was estimated by dividing total particulate proteinsby 6.25 (Packard and Dortch, 1975).
Nitrogen uptake measurements
Uptake rates of ammonium, nitrate and urea were determined on water samplestaken from the 5 1 carboys using 15N isotopes (Kristiansen and Paasche, 1989);0.5 u.mol H of ammonium (95 atom-% 15N), nitrate (96.8 atom-% 15N) and urea(99 atom-% 15N) were added to separate incubation bottles covered with neutral-density screens. The bottles were placed in deck incubators cooled by circulatingsurface seawater. Incubations started between 14:00 and 15:00 h (local time), andlasted 3 h (24 and 27 May) or 6 h (26 May). After incubation, the samples were fil-tered through pre-combusted Whatman GF/F glass fiber filters (no fractiona-tions), which were dried at 60°C and later analyzed by emission spectrometry(Kristiansen and Paasche, 1989). Reduced incubation times (3-6 h) and 15N addi-tions of 0.5 u,mol I"1 were used because we expected short turnover times of dis-solved nitrogen. The uptake rates may have been slightly overestimated becauseof the isotope additions.
2351
by guest on September 26, 2012
http://plankt.oxfordjournals.org/D
ownloaded from
E.FernAndez et al.
Carbon incorporation measurements
Triplicate 20 ml acid-washed glass vials were filled with water from each 5 1 carboyat the laboratory 3-4 h after sampling and were then inoculated with 370 kbq(10 jtCi) of NaHI4CO3, placed in an incubator provided with an artificial lightsource (Osram Powerstar HQ1-T 400 W/DH) and cooled by circulating water.Samples were incubated at a range of irradiances simulating the irradiance experi-enced by the cells at the sampling depth. The irradiance level corresponding tosurface samples was set at 650 JJLE rrr2 sr1. Attenuation of light was achieved byusing neutral-density glass filters. Incubations were performed under a 16 h:8 hlight-dark cycle and lasted 24 h.
For the determination of carbon incorporation into photosynthetic end prod-ucts, the contents of the incubation vials were filtered sequentially through 5 and0.2 jim Poretics polycarbonate filters, and stored at -20°C until further analysis.Rates of 14C incorporation into methanol/water-soluble compounds (low-mole-cular-weight metabolites; LMWM), chloroform-soluble compounds (lipids), hottrichloroacetic acid (TCA)-soluble compounds (polysaccharides and nucleicacids) and hot TCA-insoluble compounds (proteins) were determined as inMarafi6n et al. (1995a). During the first steps of the extraction, coccoliths are dis-solved and the 14C fixed through calcification completely removed. Carbonincorporation for each size fraction was calculated as the sum of the radioactivitymeasured in each biochemical pool. In previous experiments using this technique,between 93 and 100% (n - 24) of the 14C has been recovered relative to totalcarbon fixation. Carbon (C) to nitrogen-assimilation ratios were calculated byassuming: (i) an average molar C/N ratio of 3.28 for proteins (Laws, 1991) and 3.75for nucleic acids (Fraga and Perez, 1990); (ii) a free amino acid-N to protein-Nratio of 0.05 (Dortch et al., 1984); (iii) a negligible amount of radioactive carbonas free nucleotides (-0.5% of total incorporated carbon); and (iv) fixation of 4%of the 14C incorporated into nucleic acids (Fraga and Perez, 1990). Variations inthe ratio amino acid-N/protein-N did not cause large changes in the C/N assimi-lation ratios as they represented a small proportion of the carbon incorporatedinto the LMWM fraction which, in turn, generally accounts for <20% of the totalcarbon incorporation in this study.
Rates of carbon incorporation into calcium carbonate cellular structures (coc-coliths) were determined using the 14C method (Paasche, 1963), basically follow-ing the procedure described in Fernandez et al. (1993). Inoculation and incubationprocedures were as described above for the incorporation of carbon into macro-molecules.
Results
Physical and chemical conditions
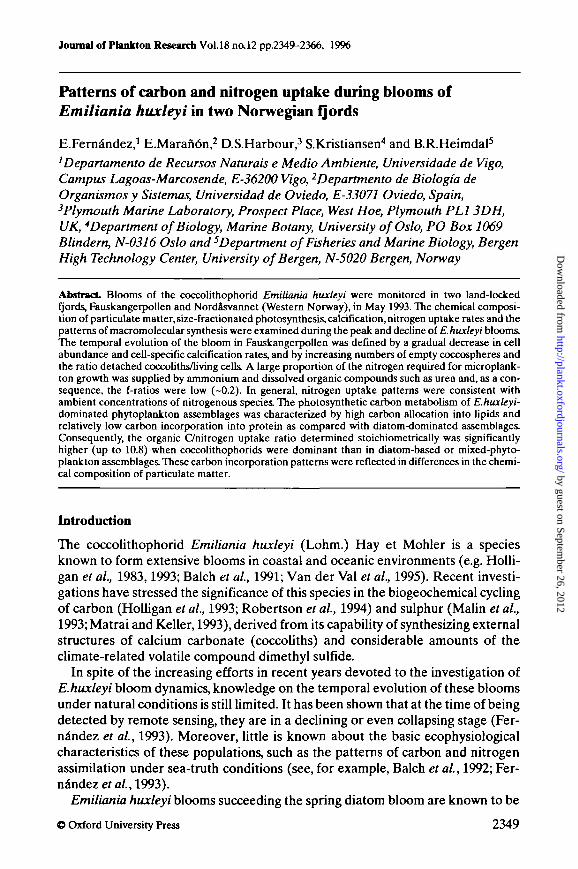
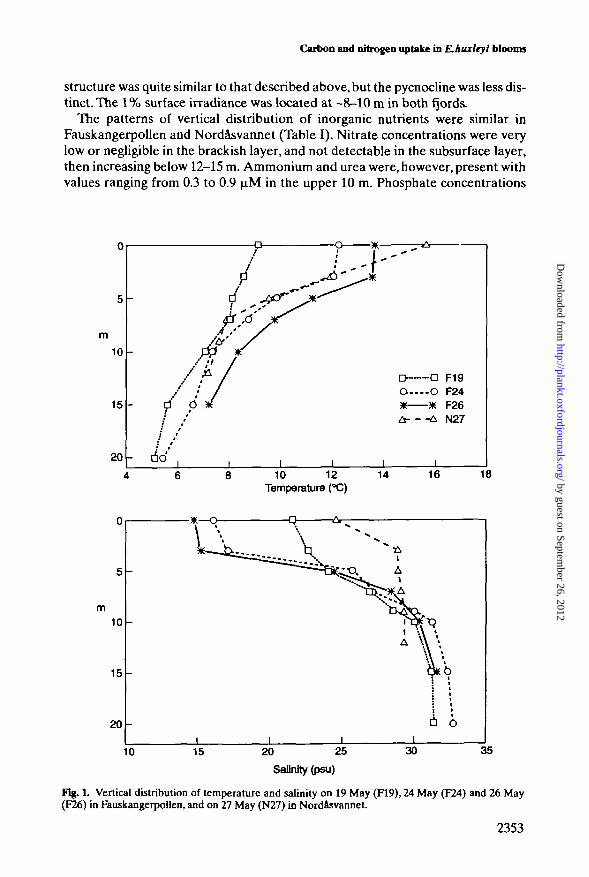
A sharp pycnocline was present in Fauskangerpollen between 3 and 5 m depth(Figure 1), overlying a subsurface layer characterized by temperatures between 5and 10°C and salinities >25 psu.This layer maintained its thermohaline propertiesrather unaltered throughout the study. In Nordasvannet, the thermohaline
2352
by guest on September 26, 2012
http://plankt.oxfordjournals.org/D
ownloaded from
Carbon and nitrogen uptake in BLhuxleyl blooms
structure was quite similar to that described above, but the pycnocline was less dis-tinct. The 1% surface irradiance was located at -8-10 m in both fjords.
The patterns of vertical distribution of inorganic nutrients were similar inFauskangerpollen and Nordasvannet (Table I). Nitrate concentrations were verylow or negligible in the brackish layer, and not detectable in the subsurface layer,then increasing below 12-15 m. Ammonium and urea were, however, present withvalues ranging from 0.3 to 0.9 u.M in the upper 10 m. Phosphate concentrations
m10
15
D a F19O —-O F24* * F26A A N27
I I10 12 14
Temperature (°C)16 18
10 15 20 25
SaOnity(psu)
30
Fig. L Vertical distribution of temperature and salinity on 19 May (F19), 24 May (F24) and 26 May(F26) in Fauskangerpollen, and on 27 May (N27) in Nordasvannet.
2353
by guest on September 26, 2012
http://plankt.oxfordjournals.org/D
ownloaded from
E.Feraindei et al.
Fauskangerpollen 19/05
D — o 0.2-5 umo - o >5jim
5rv * — * Total
Fauskangerpollen 24/05
m
15 \ A0.5 1 1.5 2 2.5
Chlorophyll-a (mg rrr3)
Fauskangerpollen 26/05l—s
15 -0.5 1 1.5 2 2.5
Crtforophyll-a (mg nrr3)
Nordasvannet 27/05
0.5 1 1.5 2 2.5Chlorophyll-a (mg m"3)
1 2 3 4 5Chtorophyil-a (mg rrr3)
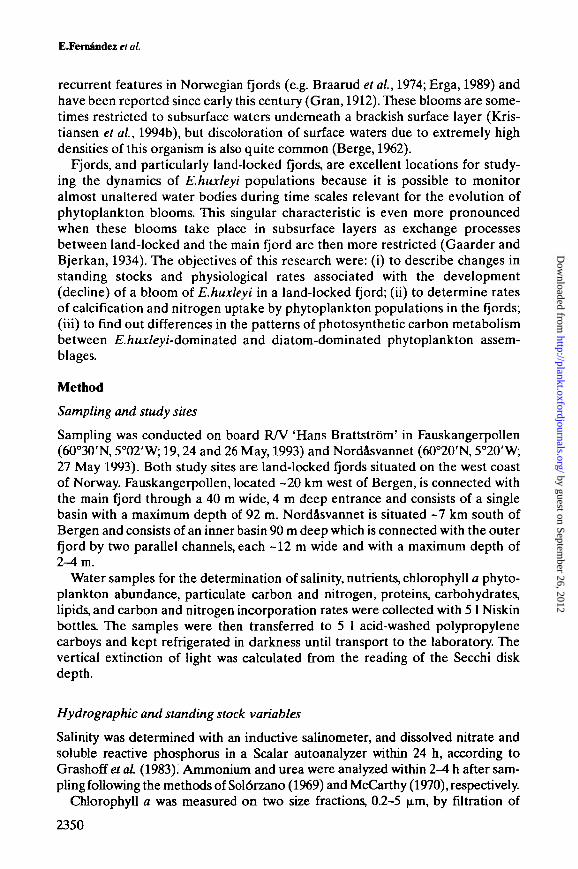
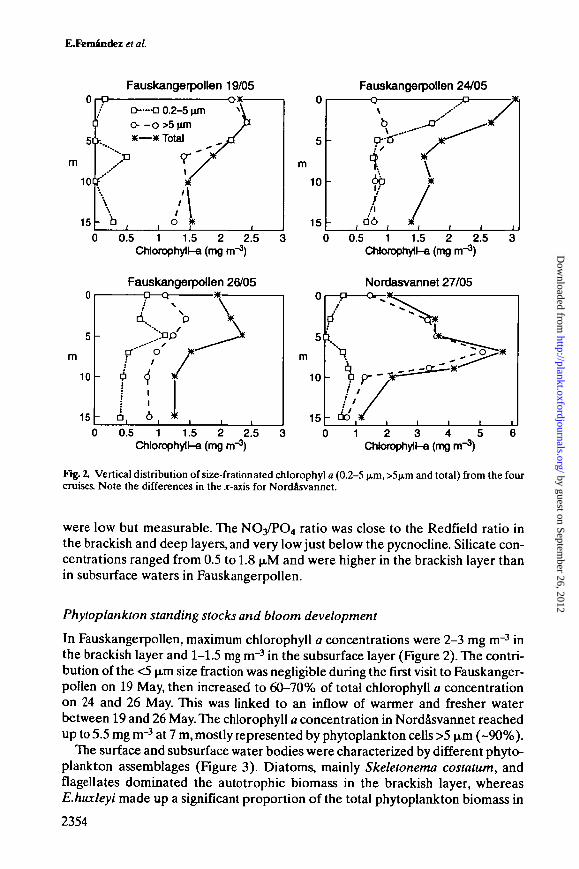
Fig. 2. Vertical distribution of size-frationated chlorophyl a (0.2-5 (im, >5(j.m and total) from the fourcruises. Note the differences in the jr-axis for Nordasvannet.
were low but measurable. The NO3/PO4 ratio was close to the Redfield ratio inthe brackish and deep layers, and very low just below the pycnocline. Silicate con-centrations ranged from 0.5 to 1.8 JJLM and were higher in the brackish layer thanin subsurface waters in Fauskangerpollen.
Phytoplankton standing stocks and bloom development
In Fauskangerpollen, maximum chlorophyll a concentrations were 2-3 mg m"3 inthe brackish layer and 1-1.5 mg m"3 in the subsurface layer (Figure 2). The contri-bution of the <5 jim size fraction was negligible during the first visit to Fauskanger-pollen on 19 May, then increased to 60-70% of total chlorophyll a concentrationon 24 and 26 May. This was linked to an inflow of warmer and fresher waterbetween 19 and 26 May. The chlorophyll a concentration in Nordasvannet reachedup to 5.5 mg nr3 at 7 m, mostly represented by phytoplankton cells >5 p,m (-90%).
The surface and subsurface water bodies were characterized by different phyto-plankton assemblages (Figure 3). Diatoms, mainly Skeletonema costatum, andflagellates dominated the autotrophic biomass in the brackish layer, whereasE.huxleyi made up a significant proportion of the total phytoplankton biomass in
2354
by guest on September 26, 2012
http://plankt.oxfordjournals.org/D
ownloaded from
Carbon and nitrogen uptake in E-huxleyi blooms
Table L Concentrations (jiM) of dissolved nitrate, ammonium, urea, phosphate and silicate atFauskangerpoUen (Fausk) and Nordasvannet (Nordfls)
Cruise
Fausk-1(19 May)
Fausk-2(24 May)
Fausk-3(26 May)
Nordas(27 May)
Depth(m)
0357
101520
0357
101520
0357
1015
03579
1215
Nitrate
0.240.000.000.000.000.005.23
0.620.180.000.000.000.885.23
0.000.000.000.030.000.00
0.000.000.000.000.000.103.34
Ammonium
_------
0.360.270.250.360.230.38-
0.330.380.380.480.540.62
0.330.400.470.540.420.401.17
Urea-N"
___--_-
0.200.390.220.410.110.63-
0.430330.770.770.871.91
_--0.13---
Phosphate
0.190.200.210.210.220.230.70
0.080.080.120.130.14020.63
0.090.080.120.120.140.16
0.130.140.150.310.170.260.48
Silicate
0.270220310340.420.450.74
1.811.030.450.520.552.975.87
0.650.480.470.540.560.81
0380.520.500.530.480.621.61
Phytoplanktonassemblage
DiatomsDiatomsMixedE-huxleyiE.huxleyiMixedMixed
DiatomsDiatomsMixedE.huxleyiE.huxleyiMixedMixed
DiatomsDiatomsMixedMixedMixedMixed
MixedE.huxleyiE.huxleyiE.huxleyiE.huxleyiMixedMixed
• 1 M urea = 2 M urea-N.
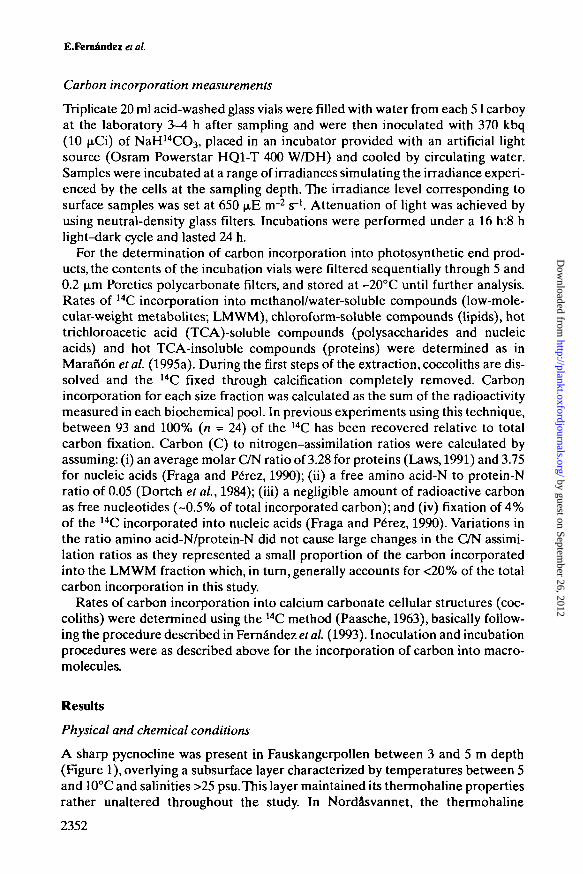
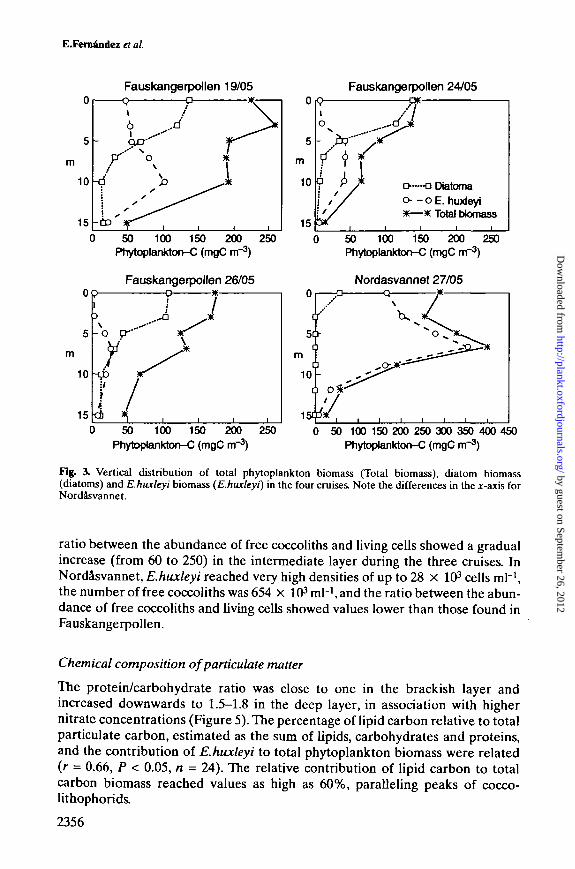
the subsurface layer. Emiliania huxleyi biomass decreased gradually inFauskangerpoUen: from 100 mg C nr3 on 19 May to 25 mg C nr3 on 26 May. InNordasvannet, diatoms were not abundant (<20%), whereas E.huxleyi biomassrepresented >87% of the total phytoplankton biomass at depths greater than 3 m.The maximum E.huxleyi biomass was found at 7 m (355 mg C nr3).
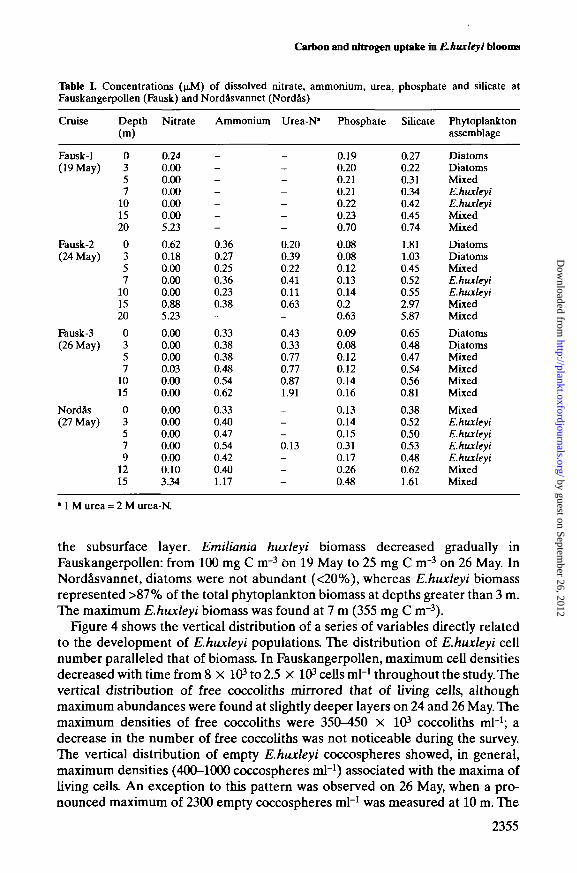
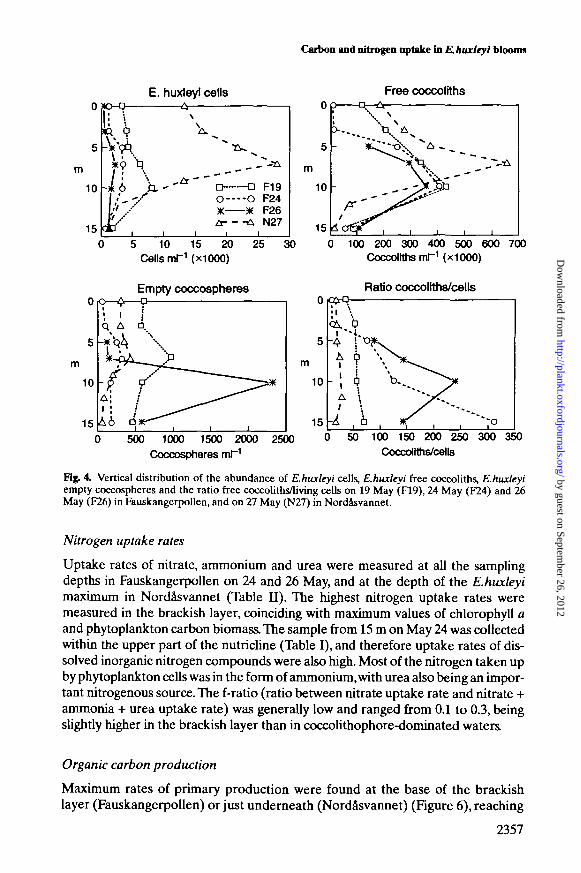
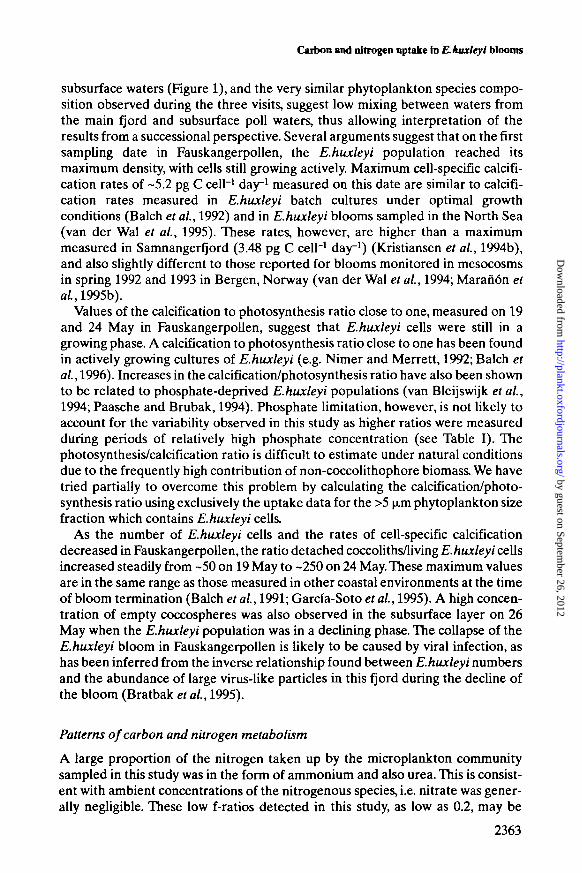
Figure 4 shows the vertical distribution of a series of variables directly relatedto the development of E.huxleyi populations. The distribution of E.huxleyi cellnumber paralleled that of biomass. In FauskangerpoUen, maximum cell densitiesdecreased with time from 8 X 10³ to 2.5 X 10³ cells ml"1 throughout the study. Thevertical distribution of free coccoliths mirrored that of living cells, althoughmaximum abundances were found at slightly deeper layers on 24 and 26 May. Themaximum densities of free coccoliths were 350-450 X 103 coccoliths ml"1; adecrease in the number of free coccoliths was not noticeable during the survey.The vertical distribution of empty E.huxleyi coccospheres showed, in general,maximum densities (400-1000 coccospheres ml"1) associated with the maxima ofliving cells. An exception to this pattern was observed on 26 May, when a pro-nounced maximum of 2300 empty coccospheres ml"1 was measured at 10 m. The
2355
by guest on September 26, 2012
http://plankt.oxfordjournals.org/D
ownloaded from
E.Femindez et al.
m
0
5
10
15
-
/
ii
-to'
FauskangerpollenQ
l
6
>r•
J19/05
\
r*i
Fauskangerpollen 24/05
50 100 150 200 250PtiytopUinkton-C (mgC m"3)
Fauskangerpollen 26/05
r>—DDiatomao - o E . huxJeyi*—x Total btomass
50 100 150 200 250Phytoplankton-C (mgC rrr3)
Nordasvannet 27/05
0 50 100 150 200 250Phytoptankton-C (mgC m"3)
50 100 150 200250300350400450PhytoplanJcton-C (mgC rrr3)
Fig. 3. Vertical distribution of total phytoplankton biomass (Total biomass), diatom biomass(diatoms) and Khwcleyi biomass (E.huxleyi) in the four cruises. Note the differences in the jr-axis forNordasvannet.
ratio between the abundance of free coccoliths and living cells showed a gradualincrease (from 60 to 250) in the intermediate layer during the three cruises. InNordasvannet, E.huxleyi reached very high densities of up to 28 X 103 cells ml"1,the number of free coccoliths was 654 X 103 mH, and the ratio between the abun-dance of free coccoliths and living cells showed values lower than those found inFauskangerpollen.
Chemical composition of paniculate matter
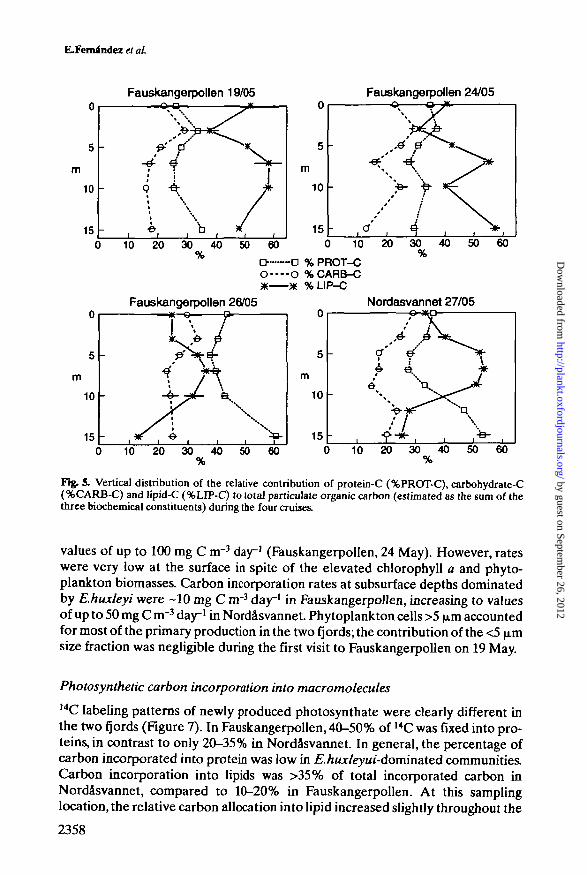
The protein/carbohydrate ratio was close to one in the brackish layer andincreased downwards to 1.5-1.8 in the deep layer, in association with highernitrate concentrations (Figure 5). The percentage of lipid carbon relative to totalparticulate carbon, estimated as the sum of lipids, carbohydrates and proteins,and the contribution of E.huxleyi to total phytoplankton biomass were related(r = 0.66, P < 0.05, n - 24). The relative contribution of lipid carbon to totalcarbon biomass reached values as high as 60%, paralleling peaks of cocco-lithophorids.
2356
by guest on September 26, 2012
http://plankt.oxfordjournals.org/D
ownloaded from
E. huxleyi cells
Carbon and nitrogen uptake in E. Huxleyi blooms
Free coccoliths
m10
15
nx o \/ : \
1 ' - "••'*
V '•''£/* ^ i
A
\
- •?-!&
~'*~ D • F19O O F24* * F26A A N27
I I I I
10 15 20 25 3015
Cells mr 1 (X1000)
Empty coccospheresfr—fy 0-
100 200 300 400 500 600 700Coccdiths mT1 (xiOOO)
Ratio coccollths/cells
15500 1000 1500 2000
Coccosptieres mT1
2500 50 100 150 200 250 300 350Coccollths/cells
Fig. 4, Vertical distribution of the abundance of E.huxleyi cells, E.huxleyi free coccoliths, E.huxleyiempty coccospheres and the ratio free coccoliths/living cells on 19 May (F19), 24 May (F24) and 26May (F26) in Fauskangerpollen, and on 27 May (N27) in Nordasvannet.
Nitrogen uptake rates
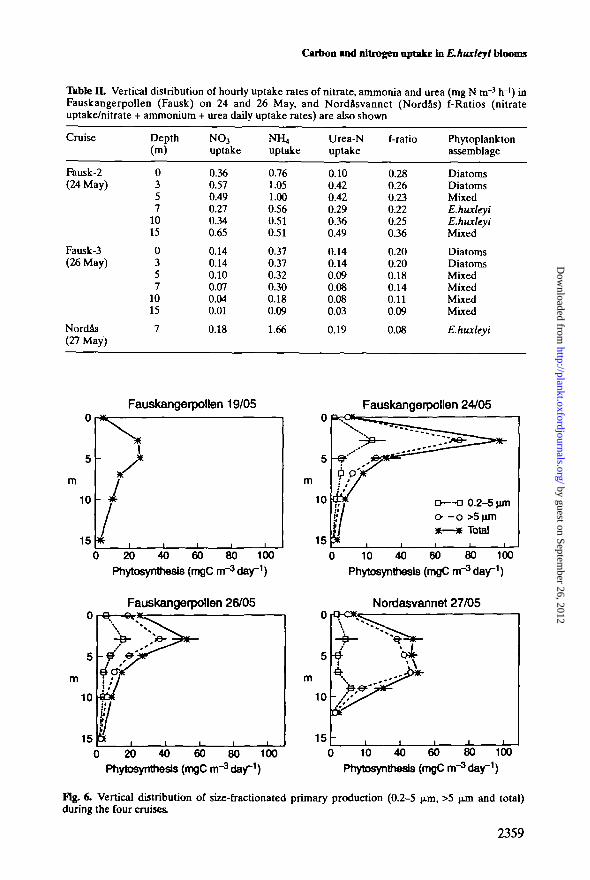
Uptake rates of nitrate, ammonium and urea were measured at all the samplingdepths in Fauskangerpollen on 24 and 26 May, and at the depth of the E.huxleyimaximum in Nordasvannet ("Table II). The highest nitrogen uptake rates weremeasured in the brackish layer, coinciding with maximum values of chlorophyll aand phytoplankton carbon biomass The sample from 15 m on May 24 was collectedwithin the upper part of the nutricline (Table I), and therefore uptake rates of dis-solved inorganic nitrogen compounds were also high. Most of the nitrogen taken upby phytoplankton cells was in the form of ammonium, with urea also being an impor-tant nitrogenous source. The f-ratio (ratio between nitrate uptake rate and nitrate +ammonia + urea uptake rate) was generally low and ranged from 0.1 to 0.3, beingslightly higher in the brackish layer than in coccolithophore-dominated waters.
Organic carbon production
Maximum rates of primary production were found at the base of the brackishlayer (Fauskangerpollen) or just underneath (Nordasvannet) (Figure 6), reaching
2357
by guest on September 26, 2012
http://plankt.oxfordjournals.org/D
ownloaded from
E-Femindez et aL
Fauskangerpollen 19/05 Fauskangerpollen 24/05
0 10 2 0 3 0 4 0 5 0 6 0 0 10 2 0 3 0 4 0 5 0 6 0
O D % PROT-CO----O %CARB-C* * %LIP-C
Fauskangerpollen 26/05 Nordasvannet 27/05
10 20 30 40 50 6010 20 30 40 50 60
Fig. 5. Vertical distribution of the relative contribution of protein-C (%PROT-C), carbohydrate-C(%CARB-C) and lipid-C (%LIP-C) to total paniculate organic carbon (estimated as the sum of thethree biochemical constituents) during the four cruises.
values of up to 100 mg C nr3 day-1 (Fauskangerpollen, 24 May). However, rateswere very low at the surface in spite of the elevated chlorophyll a and phyto-plankton biomasses. Carbon incorporation rates at subsurface depths dominatedby E.huxleyi were -10 mg C nr3 day-' in Fauskangerpollen, increasing to valuesof up to 50 mg C nr3 day-1 in Nordasvannet. Phy toplankton cells >5 u.m accountedfor most of the primary production in the two fjords; the contribution of the <5 u,msize fraction was negligible during the first visit to Fauskangerpollen on 19 May.
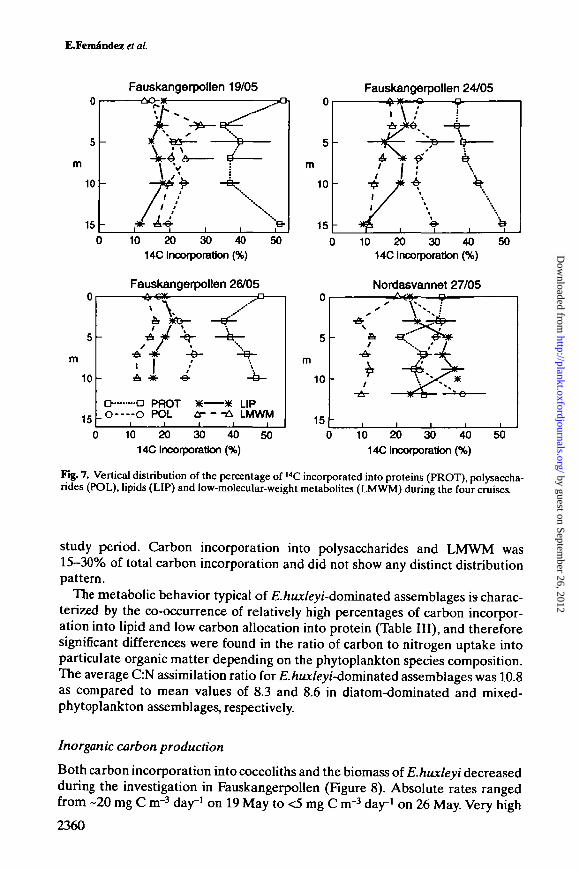
Photosynthetic carbon incorporation into macro molecules14C labeling patterns of newly produced photosynthate were clearly different inthe two fjords (Figure 7). In Fauskangerpollen, 40-50% of 14C was fixed into pro-teins, in contrast to only 20-35% in Nordasvannet. In general, the percentage ofcarbon incorporated into protein was low in £./iKx/eyu/-dominated communities.Carbon incorporation into lipids was >35% of total incorporated carbon inNordasvannet, compared to 10-20% in Fauskangerpollen. At this samplinglocation, the relative carbon allocation into lipid increased slightly throughout the
2358
by guest on September 26, 2012
http://plankt.oxfordjournals.org/D
ownloaded from
Carbon and nitrogen uptake in Khuxleyl blooms
Table IL Vertical distribution of hourly uptake rates of nitrate, ammonia and urea (mg N m"3 h~') inFauskangerpollen (Fausk) on 24 and 26 May, and Nordflsvannet (Nordas) f-Ratios (nitrateuptake/nitrate + ammonium + urea daily uptake rates) are also shown
Cruise
Fausk-2(24 May)
Fausk-3(26 May)
Nordas(27 May)
Depth(m)
0357
1015
0357
1015
7
NO3
uptake
0.360.570.490.270.340.65
0.140.140.100.070.040.01
0.18
NH,uptake
0.761.051.000.560.510.51
0370.370.320.300.180.09
1.66
Urea-Nuptake
0.100.420.420.290.360.49
0.140.140.090.080.080.03
0.19
f-ratio
0.280.260.230.220.25036
0.200.200.180.140.110.09
0.08
Phytoplanktonassemblage
DiatomsDiatomsMixedE.huxleyiE.huxleyiMixed
DiatomsDiatomsMixedMixedMixedMixed
E.huxleyi
Fauskangerpollen 19/05 Fauskangerpollen 24/05
m
150 20 40 60 80 100
Phytosynthesis (mgC rrr 'day1 )
10
15
a—D 0.2-5 umo - o >5 urn
Total
0 10 40 60 80 100
Phytosynthesis (mgC m"3 day"1)
Fauskangerpollen 26/05 Nordasvannet 27/05
15
0 20 40 60 80 100Phytosynthesis (mgC rrr3 day"1)
0 10 40 60 80 100P h y t o s y n t h e s i s ( m g C r r ^ 1
Fig. 6. Vertical distribution of size-fractionated primary production (0.2-5 (im, >5 pjn and total)during the four cruises.
2359
by guest on September 26, 2012
http://plankt.oxfordjournals.org/D
ownloaded from
E.Feraandez et al
m
10
15
m
Fauskangerpollen 19/05
10 20 30 40 5014C Incorporation (%)
n
5
10
15
Fauskangerpollen 26/05
A * •&•
a -a PROT * -_O O POL A-
i i i
~ \ ^ _
* LIP- • * LMWM
0 10 20 30 40 5014C Incorporation (%)
5 -
m
10 -
15 -
15 -
Fauskangerpollen 24/05i 1 » a
x \
-4-- \ —
k\
\
10 20 30 40 5014C Incorporation (%)
Nordasvannet 27/05
0 10 20 30 40 5014C Incorporation (%)
Fig. 7. Vertical distribution of the percentage of I4C incorporated into proteins (PROT), polysaccha-rides (POL), lipids (LIP) and low-molecular-weight metabolites (LMWM) during the four cruises.
study period. Carbon incorporation into polysaccharides and LMWM was15-30% of total carbon incorporation and did not show any distinct distributionpattern.
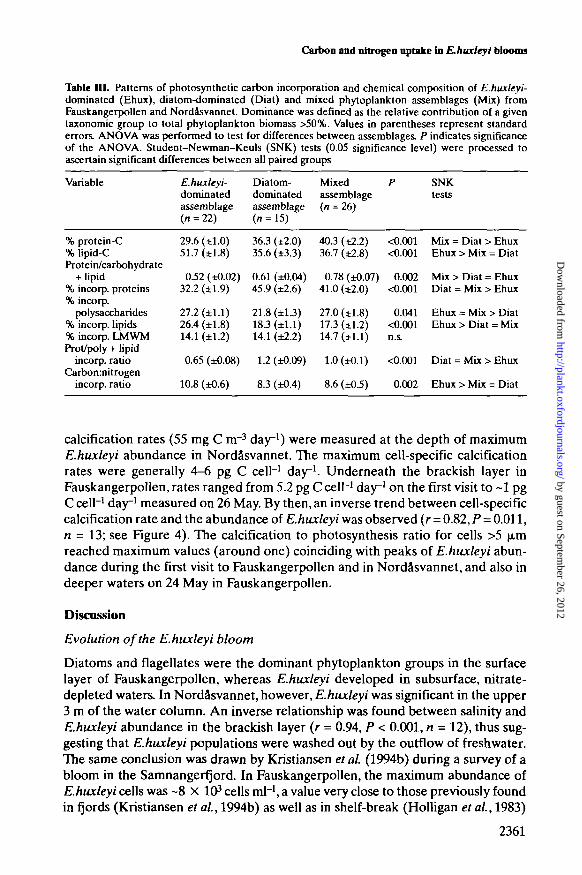
The metabolic behavior typical of £./ju*/e>7-dominated assemblages is charac-terized by the co-occurrence of relatively high percentages of carbon incorpor-ation into lipid and low carbon allocation into protein (Table III), and thereforesignificant differences were found in the ratio of carbon to nitrogen uptake intoparticulate organic matter depending on the phytoplankton species composition.The average C:N assimilation ratio for £./zux/eyi-dominated assemblages was 10.8as compared to mean values of 8.3 and 8.6 in diatom-dominated and mixed-phytoplankton assemblages, respectively.
Inorganic carbon production
Both carbon incorporation into coccoliths and the biomass of E.huxleyi decreasedduring the investigation in Fauskangerpollen (Figure 8). Absolute rates rangedfrom -20 mg C m~3 day-1 on 19 May to <5 mg C m~3 day1 on 26 May. Very high
2360
by guest on September 26, 2012
http://plankt.oxfordjournals.org/D
ownloaded from
Cartoon and nitrogen uptake in ELhuxleyi blooms
Table ID. Patterns of photosynthetic carbon incorporation and chemical composition of E.huxleyi-dominated (Ehux), diatom-dominated (Diat) and mixed phytoplankton assemblages (Mix) fromFauskangerpollen and Nordasvannet. Dominance was defined as the relative contribution of a giventaxonomic group to total phytoplankton biomass >50%. Values in parentheses represent standarderrors. ANOVA was performed to test for differences between assemblages. P indicates significanceof the ANOVA. Student-Newman-Keuls (SNK) tests (0.05 significance level) were processed toascertain significant differences between all paired groups
Variable E.huxleyi- Diatom- Mixeddominated dominated assemblageassemblage assemblage (n = 26)(« = 22) (/i = 15)
SNKtests
% protein-C% lipid-CProtein/carbohydrate
+ lipid% incorp. proteins% incorp.
polysaccharides% incorp. lipids% incorp. LMWMProt/poly + lipid
incorp. ratioCarbonmitrogen
incorp. ratio
29.6 (±1.0)51.7 (±1.8)
0.52 (±0.02)32.2 (±1.9)
27.2 (±1.1)26.4 (±1.8)14.1 (±1.2)
0.65 (±0.08)
10.8 (±0.6)
36.3 (±2.0)35.6 (±33)
0.61 (±0.04)45.9 (±2.6)
21.8 (±13)183 (±1.1)14.1 (±2.2)
1.2 (±0.09)
8.3 (±0.4)
403 (±2.2)36.7 (±2.8)
0.78 (±0.07)41.0 (±2.0)
27.0 (±1.8)17.3 (±1.2)14.7 (±1.1)
1.0 (±0.1)
8.6 (±0.5)
<0.001<0.001
0.002<0.001
0.041<0.001n.s.
<0.001
0.002
Mix = Diat > EhuxEhux > Mix = Diat
Mix > Diat = EhuxDiat = Mix > Ehux
Ehux = Mix > DiatEhux > Diat = Mix
Diat = Mix > Ehux
Ehux > Mix = Diat
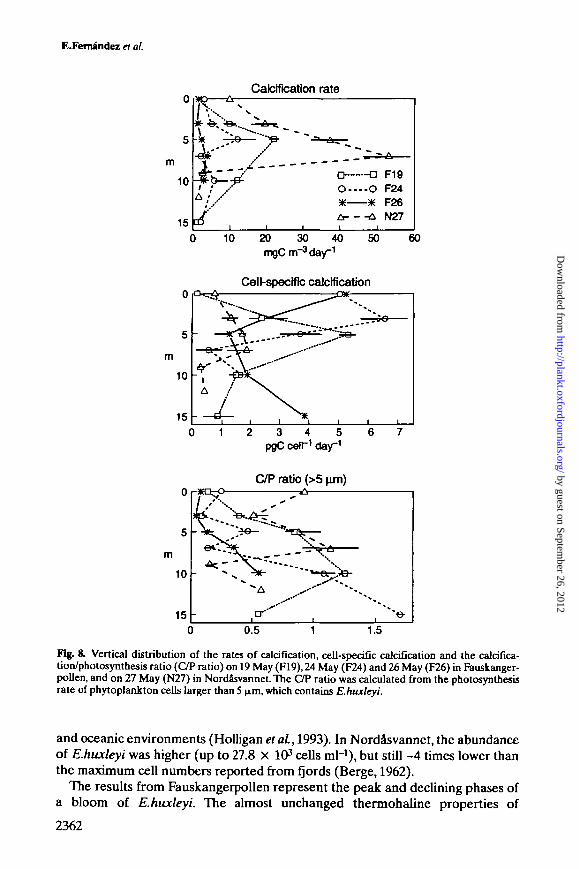
calcification rates (55 mg C m~3 day1) were measured at the depth of maximumE.huxleyi abundance in Nordasvannet. The maximum cell-specific calcificationrates were generally 4-6 pg C cell"1 day1. Underneath the brackish layer inFauskangerpollen, rates ranged from 5.2 pg C celH day1 on the first visit to ~1 pgC cell"1 day1 measured on 26 May. By then, an inverse trend between cell-specificcalcification rate and the abundance of E.huxleyi was observed (r = 0.82, P = 0.011,n = 13; see Figure 4). The calcification to photosynthesis ratio for cells >5 (xmreached maximum values (around one) coinciding with peaks of E.huxleyi abun-dance during the first visit to Fauskangerpollen and in Nordasvannet, and also indeeper waters on 24 May in Fauskangerpollen.
Discussion
Evolution of the E.huxleyi bloom
Diatoms and flagellates were the dominant phytoplankton groups in the surfacelayer of Fauskangerpollen, whereas E.huxleyi developed in subsurface, nitrate-depleted waters. In Nordasvannet, however, E.huxleyi was significant in the upper3 m of the water column. An inverse relationship was found between salinity andE.huxleyi abundance in the brackish layer (r = 0.94, P < 0.001, n = 12), thus sug-gesting that E.huxleyi populations were washed out by the outflow of freshwater.The same conclusion was drawn by Kristiansen et al. (1994b) during a survey of abloom in the Samnangerfjord. In Fauskangerpollen, the maximum abundance ofE.huxleyi cells was ~8 X 10³ cells ml"1, a value very close to those previously foundin fjords (Kristiansen et al., 1994b) as well as in shelf-break (Holligan et al., 1983)
2361
by guest on September 26, 2012
http://plankt.oxfordjournals.org/D
ownloaded from
E.Fernindez et al.
Calcification rate
10 20 30 40 50 60mgCrrr^day"1
Celt-specific calcification
A
5
m
10
15
C/P ratio (>
. ̂ v - -— Oi
i i
5^)
0.5 1.5
Fig. 8. Vertical distribution of the rates of calcification, cell-specific calcification and the calcifica-tion/photosynthesis ratio (C/P ratio) on 19 May (F19), 24 May (F24) and 26 May (F26) in Fauskanger-pollen, and on 27 May (N27) in Nordasvannet. The C/P ratio was calculated from the photosynthesisrate of phytoplankton cells larger than 5 (Am, which contains E.huxleyi.
and oceanic environments (Holligan etaL, 1993). In Nordasvannet, the abundanceof E.huxleyi was higher (up to 27.8 X 10³ cells ml-1), but still ~4 times lower thanthe maximum cell numbers reported from fjords (Berge, 1962).
Hie results from Fauskangerpollen represent the peak and declining phases ofa bloom of E.huxleyi. The almost unchanged thermohaline properties of
2362
by guest on September 26, 2012
http://plankt.oxfordjournals.org/D
ownloaded from
Carbon and nitrogen nptake in E.huxleyi blooms
subsurface waters (Figure 1), and the very similar phytoplankton species compo-sition observed during the three visits, suggest low mixing between waters fromthe main fjord and subsurface poll waters, thus allowing interpretation of theresults from a successional perspective. Several arguments suggest that on the firstsampling date in Fauskangerpollen, the E.huxleyi population reached itsmaximum density, with cells still growing actively. Maximum cell-specific calcifi-cation rates of -5.2 pg C cell"1 day1 measured on this date are similar to calcifi-cation rates measured in E.huxleyi batch cultures under optimal growthconditions (Balch et al, 1992) and in E.huxleyi blooms sampled in the North Sea(van der Wai et al., 1995). These rates, however, are higher than a maximummeasured in Samnangerfjord (3.48 pg C cell"1 day"1) (Kristiansen et al., 1994b),and also slightly different to those reported for blooms monitored in mesocosmsin spring 1992 and 1993 in Bergen, Norway (van der Wai et al., 1994; Marafidn etai, 1995b).
Values of the calcification to photosynthesis ratio close to one, measured on 19and 24 May in Fauskangerpollen, suggest that E.huxleyi cells were still in agrowing phase. A calcification to photosynthesis ratio close to one has been foundin actively growing cultures of E.huxleyi (e.g. Nimer and Merrett, 1992; Balch etal., 1996). Increases in the calcification/photosynthesis ratio have also been shownto be related to phosphate-deprived E.huxleyi populations (van Bleijswijk et al.,1994; Paasche and Brubak, 1994). Phosphate limitation, however, is not likely toaccount for the variability observed in this study as higher ratios were measuredduring periods of relatively high phosphate concentration (see Table I). Thephotosynthesis/calcification ratio is difficult to estimate under natural conditionsdue to the frequently high contribution of non-coccolithophore biomass. We havetried partially to overcome this problem by calculating the calcification/photo-synthesis ratio using exclusively the uptake data for the >5 \im phytoplankton sizefraction which contains E.huxleyi cells.
As the number of E.huxleyi cells and the rates of cell-specific calcificationdecreased in Fauskangerpollen, the ratio detached coccoliths/living E.huxleyi cellsincreased steadily from -50 on 19 May to -250 on 24 May. These maximum valuesare in the same range as those measured in other coastal environments at the timeof bloom termination (Balch et al., 1991; Garcfa-Soto et al., 1995). A high concen-tration of empty coccospheres was also observed in the subsurface layer on 26May when the E.huxleyi population was in a declining phase. The collapse of theE.huxleyi bloom in Fauskangerpollen is likely to be caused by viral infection, ashas been inferred from the inverse relationship found between E.huxleyi numbersand the abundance of large virus-like particles in this fjord during the decline ofthe bloom (Bratbak etai, 1995).
Patterns of carbon and nitrogen metabolism
A large proportion of the nitrogen taken up by the microplankton communitysampled in this study was in the form of ammonium and also urea. This is consist-ent with ambient concentrations of the nitrogenous species, i.e. nitrate was gener-ally negligible. These low f-ratios detected in this study, as low as 0.2, may be
2363
by guest on September 26, 2012
http://plankt.oxfordjournals.org/D
ownloaded from
E.Feraandez et al.
typical during E.huxleyi blooms in the Norwegian fjords (Kristiansen et al.,1994b). Nitrogen uptake rates were abnormally high compared to carbonincorporation rates. This disagreement arises from the different incubation timesused (3-6 h for N, 24 h for C), overestimation of the nitrogen uptake rates (15Nadditions) and because nitrogen incorporation is also influenced by bacterialactivity (Kristiansen etal., 1994a).
The photosynthetic carbon metabolism of £./jMJt/ey/-dominated populationswas characterized by very high carbon incorporation into lipids and relatively lowcarbon fixation into proteins as compared to the diatom-dominated populations(Figure 7 and Table III), especially in NordSsvannet. These patterns of macro-molecular synthesis were even more conspicuous when considering the chemicalcomposition of particulate matter (Figure 5;Table III). Similar patterns of photo-synthetic carbon metabolism were reported for cultures of these species (Ferndn-dez et al., 1994a, 1996a,b) and also for natural phytoplankton populationsdominated by either coccolithophorids (Maraft6n et al., 1995) or other Prymne-siophyceae (Fernandez et al, 1994b).
A high inorganic carbon to nitrogen uptake ratio, resulting from the elevatedlipid to protein synthesis ratio, and a low f-ratio seem to be characteristic forE.huxleyi blooms in Norwegian fjords. A direct consequence of this pattern oforganic carbon biosynthesis is that naturally occurring phytoplankton populationsdominated by E.huxleyi would take up more carbon relative to nitrogen fromsurface waters, regardless of the effect of calcification, as compared to diatom-dominated assemblages. These blooms are therefore good examples of the limi-tations involved in estimating net community production rates by scaling nitrateuptake by the Redfield ratio.
Acknowledgements
This work was funded by the European Commission under the EHUX contractMAS-CT92-0038 and the Research Council of Norway (Division for Science andTechnology). E.M. acknowledges the receipt of a studentship from the M.E.C.Spain. This is EHUX contribution no. 21.
ReferencesBalch,W.M., Holligan,P.M., Ackleson,S.G. and Voss,KJ. (1991) Biological and optical properties of
mesoscale coccolithophore blooms in the Gulf of Maine. LimnoL Oceanogr., 36,629-643.Balch,W.M., Holligan.P.M. and Kilpatrick.K. A. (1992) Calcification, photosynthesis and growth of the
bloom-forming coccolithophore, Emiliania huxleyi. Com Shelf Res., 12,1353-1374.Balch,W.M., FritzJ. and Fernandez^- (1996) Decoupling of calcification and photosynthesis in the coc-
colithophore Emiliania huxleyi under steady-state light-limited growth. Mar. EcoL Prog. Ser., in press.Berge,G. (1962) Discoloration of the sea due to Coccolithus huxleyi 'bloom'. Sarsia, 6,29-41.Braarud,T, Hofsvang3.F., Hjelmfoss,P. and Overland,A.K. (1974) The natural history of the Hardan-
gerfjord. 10. The phytoplankton in 1955-56.The quantitative phytoplankton cycle in the fjord watersand in the offshore waters. Sarsia, 55,63-98.
Bratbak.G, Levasseurjvl., Michaud^., Cantin.G, FernandezJE., Heimdal,B.R. and Heldal.M. (1995)Viral activity in relation to Emiliania huxleyi blooms: a mechanism of DMSP release? Mar. EcoLProg. Ser., 128,133-142.
Dortch,Q., OaytonJ.R., Jr,Thoresen^S. and Ahmed, S.I. (1984) Species differences in accumulationof nitrogen pools in phytoplankton. Mar. BioL,9U 237-250.
2364
by guest on September 26, 2012
http://plankt.oxfordjournals.org/D
ownloaded from
Carbon and nitrogen uptake in E. huxleyi blooms
Erga,S.R. (1989) Ecological studies on the phytoplankton of Boknafjorden, western Norway. 1. Theeffect of water exchange processes and environmental factors on temporal and vertical variabilityof biomass. Sarsia, 74,161-176.
Femandez,E., Serret,P., MadariagaJ., HarbourJD.S. and Davies^A.G. (1992) Photosynthetic carbonmetabolism and biochemical composition of spring phytoplankton assemblages enclosed in micro-cosms: the diaiom-Phaeocystis sp. succession. Mar. EcoL Prog. Ser, 90,89-102.
Fernandez^., Boyd.P, Holligan, P.M. and Harbour.D.S. (1993) Production of organic and inorganiccarbon within a large scale coccolithophore bloom in the North Atlantic ocean. Mar. EcoL Prog. Ser.,97,271-285.
Fernandez^., Balch.W.M., Maran6n,E. and Holligan.P.M. (1994a) High rates of lipid biosynthesis incultured, mesocosm and coastal populations of the coccolithophore Emiliania huxleyi. Mar. EcoLProg. Ser., MA, 13-22.
Fernandez.E., Maran6n,E., Harbour.D.S. and Pingree.R.D. (1994b) Phytoplankton carbon incorpor-ation patterns and biochemical composition of particulate matter in the eastern North-Atlantic sub-tropical region. / Plankton Res., 16,1627-1644.
Fernandez.E., FritzJJ. and Balch.W.M. (1996a) Chemical composition of the coccohthophorid Emil-iania huxleyi under light-limited steady state growth. / Exp. Mar. Biol. EcoL, in press.
Femandez,E., Marafi6n,E. and Balch.W.M. (1996b) Intracellular carbon partitioning in the cocco-lithophorid Emiliania huxleyi. J. Mar. Sys., 262, in press.
Fraga,F. and Pe>ez,F.F. (1990) Transformaciones entre composici6n qufmica del fitoplancton, com-posici6n elemental y relation de Redfield. Set Afar,54,69-76.
Gaarder.T. and Bjerkan ,P. (1934) Osiers og o'sterskultur i Norge. John Griegs Boktrylckeri, Bergen, 99 pp.Garda-Soto,C, Femandez.E., Pingree,R.D. and HarbourJD.S. (1995) Evolution and structure of a
shelf coccolithophore bloom in the western English Channel. /. Plankton Res., ¥7,2011-2036.Gran,H.H. (1912) Pelagic plant life. In Murray,! and HjortJ. (eds), The Depths of the Ocean. McMil-
lan and Co., London, pp. 307-386.Grasshoff,K., Ehrhardt,M. and Kremling,M. (1983) Methods of Seawater Analysis. Verlag Chemie,
Weinheim,419pp.HolliganJ'.M., Viollier,M., Harbour,D.S., Camus,P. and Champagne-Philippe,M. (1983) Satellite and
ship studies of coccolithophore production along a continental shelf-edge. Nature, 304,339-342.Holligan,P.M., Harris,R.R, Newell,R.C, HarbourJJ.S., Head.R.N., Linley.E.A.S., LucasM.I.,
TranterJ'.R.G. and Weekly.C.M. (1984) Vertical distribution and partitioning of organic carbon inmixed, frontal and stratified waters of the English Channel. Mar. EcoL Prog. Ser, 14,111-127.
Holligan.P.M., Femandez.E., AikenJ., Balch.W.M., Boyd,P, Burkill,P.H., Hnch,M., Groom,S.R,Malin,G, MullerJC., PurdieJD.A., Robinson,C.,Trees,C.,Turner,S.M. and van der Wal,P.A. (1993) Abiogeochemical study of the coccolithophore EnuUania huxleyi in the North Atlantic Global Bio-geochem. Cycles, 7,879-900.
Kristiansen.S. and Paasche^E. (1989) An improved method for determining relative 15N abundance inammonium regeneration studies by direct diffusion. Mar. EcoL Prog. Ser., 54,203-207.
Kristiansen.S., Farbrot.T. and Wheeler.P.A. (1994a) Nitrogen cycling in the Barents Sea. Seasonaldynamics of new and regenerated production in the marginal ice zone. LimnoL Oceanogr, 39,1630-1642.
Kristiansen.S., Thingstad.T.E, van der Wal.R, Farbrot.T. and Skjoldal,E.F. (1994b) An Emilianiahuxleyi dominated subsurface bloom in the Samnangerfjord, western Norway. Importance ofhydrography and nutrients. Sarsia, 79,357-368.
Laws,E.A. (1991) Photosynthetic quotients, new production and net community production in theopen ocean. Deep-Sea Res., 38,143—167.
Malin,G.,Turner,S., LissJ., Holh'gan.P.M. and Harbour.D.S. (1993) Dimethyl sulphide and dimethyl-sulphoniopropionate in the north east Atlantic during the summer coccolithophore bloom. Deep-SeaRes, 40,1487-1508.
Marafi6n,E., Fernandez^, and Anad6n,RJ (1995a) Patterns of macromolecular synthesis by naturalphytoplankton assemblages under changing upwelling regimes: in situ observations andmicroscosms experiments. J. Exp. Mar. BioL EcoL, 188,1-28.
Maraft6n,E., Fernandez,E., Harris,R.P. and Harbour.D.S. (1995b) Effects of the diatom-Emilianiahuxleyi succession on photosynthesis, calcification and carbon metabolism by size-fractionatedphytoplankton. Hydrobiologia, 317,189-199.
Matrai,P.A. and Keller,M.D. (1993) Dimethylsulphide in a large-scale coccolithophore bloom in theGulf of Maine. Cora. Shelf Res., 13,831-843.
McCarthyJJ. (1970) An urease method for urea in seawater. LimnoL Oceanogr, 15,309-313.Nimer,N.A. and Merrett^lJ. (1992) Calcification and utilization of inorganic carbon by the cocco-
lithophorid Emiliania huxleyi Lohman. New PhytoL,H\-, 173-177.
2365
by guest on September 26, 2012
http://plankt.oxfordjournals.org/D
ownloaded from
E.Fernindez et al
Paasche.E. (1963) The adaption of the carbon-14 method for the measurement of coccolith produc-tion in Coccolithus huxleyi. PhysioL Plant., 16,186-200.
Paasche.E. and Brubak.S. (1994) Enhanced calcification in the coccolithophorid Emiliania huxleyi(Haptophyceae) under phosphorus limitation. Phycologia, 3,324-330.
Packard.T.T. and Dortch.Q. (1975) Particulate protein-nitrogen in North Atlantic surface waters. Mar.BioL, 33,347-354.
RobertsonJ.E.,Robinson,C.,TurnerJ).R.,HolliganJ>.M.,Watson,A.,BoydJ>.,Femandez,E.andFmch,M. (1994) The impact of a coccolithophore bloom on oceanic carbon uptake in the N.E. Atlanticduring summer 1991. Deep-Sea Res., 41,297-314.
Sol6rzanoJL. (1969) Determination of ammonia in natural waters by the phenolhypochlorite method.LimnoL Oceanogr., 14,799-801.
Van BleijswijkJ.D.L., Kempers,R.S. and Veldhuis,M J. (1994) Cell and growth characteristics of typesA and B of Emiliania huxleyi (Prymnesiophyceae) as determined by flow cytometry and chemicalanalyses. J. Phycol.,30,230-241.
Van der Wal,P., Van Bleijswijk,J.D.L. and EggeJ.K. (1994) Primary production and calcification ratein blooms of the coccolithophorid Emiliania huxleyi (Lohmann) Hay et Mohler developing in meso-cosms. Sarsia, 79,401^*08.
Van der Wal.P., Kempers,R.S. and Veldhuis^iJ.W. (1995) Production and downward flux of organicmatter and calcite in a North Sea bloom of the coccolithophore Emiliania huxleyi. Mar. EcoL Prog.Ser, 126,247-265.
Received on March 15,1994; accepted on July 29,1996
2366
by guest on September 26, 2012
http://plankt.oxfordjournals.org/D
ownloaded from
Related Documents