Determinants of the PIC : POC response in the coccolithophore Emiliania huxleyi under future ocean acidification scenarios Helen S. Findlay, a,* Piero Calosi, b and Katharine Crawfurd a,1 a Plymouth Marine Laboratory, Plymouth, United Kingdom b Marine Biology and Ecology Research Centre, University of Plymouth, Plymouth, United Kingdom Abstract We use a meta-analysis to quantify the response of Emiliania huxleyi particulate inorganic carbon (PIC) to particulate organic carbon (POC) ratio under different laboratory conditions and changes in carbonate chemistry. There is an overarching trend of decreasing PIC : POC across all ecotypes irrespective of the strain, isolation date, isolation location, and method of acidification. The variability about this overall trend is explained by the different nutrient and light regimes used in each experiment, but there is no evidence for a strain-specific response that might be expected if strains had adapted to the average environmental conditions at the locations from which the strain was isolated; indeed, each strain shows a comparably broad physiological window. We propose that E. huxleyi PIC : POC exhibits a plastic response to carbonate conditions that can be predicted by the seawater concentrations of aqueous CO 2 , total alkalinity, and phosphate conditions. This relationship now requires field validation as well as longer-term studies of E. huxleyi response to variable environmental conditions. The increasing carbon dioxide (CO 2 ) concentration in the atmosphere is leading to large-scale changes in the terrestrial and marine environments. In the oceans, sea surface temperatures are increasing (Ramanathan and Feng 2008), and changes are occurring to the ocean chemistry. The oceans are a natural sink for CO 2 , absorbing about 25% of CO 2 emissions (Sabine et al. 2004); however, CO 2 reacts with water to form carbonic acid, which changes the natural balance of carbon in the oceans and leads to a decrease in pH and carbonate ions in a process recently termed ocean acidification (OA; Caldeira and Wickett 2003). The predicted CO 2 emissions for the year 2100 using a business-as-usual scenario will result in a decrease in pH from the current global average of 8.1 to a global average of 7.7 (IPCC 2007), whereas the global average preindustrial pH level was about 8.2. A variety of responses have been characterized in marine organisms exposed to changing pH, even when the same function (e.g., calcification) was investigated (Ries et al. 2009; Hendriks et al. 2010). Although meta-analyses of the effects of OA on invertebrates have been conducted, the high level of variability prevents general trends from being formulated even with respect to one species or one process. Calcification has been the focus of much research into the effects of OA on marine organisms because of the resulting decrease in carbonate ion concentration ([CO 2{ 3 ]). Some marine organisms produce calcium carbonate (CaCO 3 ) shells and liths (armor plates), which will become more costly for organisms to maintain as [CO 2{ 3 ] decreases (Po ¨ rtner 2008; Findlay et al. in press). Although calcifica- tion has been studied within several phyla (including Cnidaria, Mollusca, and Crustacea), only in the cocco- lithophore Emiliania huxleyi has there been a relatively extensive account of the calcification response in geograph- ically separated strains of a single species (Langer et al. 2009; Ridgwell et al. 2009), thus making it an amenable biological model for the investigation of OA effects on a large geographical scale, an approach that can help to verify whether general response trends can be found and help to refine models. E. huxleyi is one of the most ubiquitous calcareous phytoplankton species (Berge 1962; Holligan et al. 1993), and can tolerate a broad range of temperatures (1–41uC) and salinities (15–45) (Brown and Yoder 1994), making it an easy species to culture, and for this reason it is arguably the most well studied of all the phytoplankton (Iglesias- Rodrı ´guez et al. 2006). Over recent decades, researchers have examined the responses of perhaps 10 different strains of E. huxleyi living at different geographic locations characterized by different environmental conditions. In- deed, Iglesias-Rodrı ´guez et al. (2006) suggested that a high level of genetic diversity exists in populations of E. huxleyi. In addition, Ridgwell et al. (2009) argued that E. huxleyi should be regarded as a diverse assemblage of genotypes with highly variable calcification characteristics and eco- logical adaptations, and Langer et al. (2009) reported that the four E. huxleyi strains they analyzed differed substan- tially in their level of sensitivity to OA, this likely having a genetic basis. This high variability makes future projections of the response of E. huxleyi across the global ocean complicated but nevertheless important. There are several reasons to attempt to make sense of the response of coccolithophores to OA, as they play a major role in biogeochemical cycles. They contribute significantly to the carbon cycle, both through photosynthesis (taking up CO 2 to form organic carbon compounds) and calcifi- cation of their liths (removing carbon from seawater to form inorganic carbon compounds) (Sikes and Fabry * Corresponding author: [email protected] 1 Present address: Nederlands Instituut voor Onderzoek der Zee (NIOZ) Royal Netherlands Institute for Sea Research, Horntje (Texel), The Netherlands Limnol. Oceanogr., 56(3), 2011, 1168–1178 E 2011, by the American Society of Limnology and Oceanography, Inc. doi:10.4319/lo.2011.56.3.1168 1168

Welcome message from author
This document is posted to help you gain knowledge. Please leave a comment to let me know what you think about it! Share it to your friends and learn new things together.
Transcript

Determinants of the PIC : POC response in the coccolithophore Emiliania huxleyi under
future ocean acidification scenarios
Helen S. Findlay,a,* Piero Calosi,b and Katharine Crawfurda,1
a Plymouth Marine Laboratory, Plymouth, United KingdombMarine Biology and Ecology Research Centre, University of Plymouth, Plymouth, United Kingdom
Abstract
We use a meta-analysis to quantify the response of Emiliania huxleyi particulate inorganic carbon (PIC) toparticulate organic carbon (POC) ratio under different laboratory conditions and changes in carbonate chemistry.There is an overarching trend of decreasing PIC : POC across all ecotypes irrespective of the strain, isolation date,isolation location, and method of acidification. The variability about this overall trend is explained by thedifferent nutrient and light regimes used in each experiment, but there is no evidence for a strain-specific responsethat might be expected if strains had adapted to the average environmental conditions at the locations from whichthe strain was isolated; indeed, each strain shows a comparably broad physiological window. We propose that E.huxleyi PIC : POC exhibits a plastic response to carbonate conditions that can be predicted by the seawaterconcentrations of aqueous CO2, total alkalinity, and phosphate conditions. This relationship now requires fieldvalidation as well as longer-term studies of E. huxleyi response to variable environmental conditions.
The increasing carbon dioxide (CO2) concentration inthe atmosphere is leading to large-scale changes in theterrestrial and marine environments. In the oceans, seasurface temperatures are increasing (Ramanathan andFeng 2008), and changes are occurring to the oceanchemistry. The oceans are a natural sink for CO2,absorbing about 25% of CO2 emissions (Sabine et al.2004); however, CO2 reacts with water to form carbonicacid, which changes the natural balance of carbon in theoceans and leads to a decrease in pH and carbonate ions ina process recently termed ocean acidification (OA; Caldeiraand Wickett 2003). The predicted CO2 emissions for theyear 2100 using a business-as-usual scenario will result in adecrease in pH from the current global average of 8.1 to aglobal average of 7.7 (IPCC 2007), whereas the globalaverage preindustrial pH level was about 8.2.
A variety of responses have been characterized in marineorganisms exposed to changing pH, even when the samefunction (e.g., calcification) was investigated (Ries et al.2009; Hendriks et al. 2010). Although meta-analyses of theeffects of OA on invertebrates have been conducted, thehigh level of variability prevents general trends from beingformulated even with respect to one species or one process.Calcification has been the focus of much research into theeffects of OA on marine organisms because of the resultingdecrease in carbonate ion concentration ([CO 2{
3 ]). Somemarine organisms produce calcium carbonate (CaCO3)shells and liths (armor plates), which will become morecostly for organisms to maintain as [CO 2{
3 ] decreases(Portner 2008; Findlay et al. in press). Although calcifica-tion has been studied within several phyla (including
Cnidaria, Mollusca, and Crustacea), only in the cocco-lithophore Emiliania huxleyi has there been a relativelyextensive account of the calcification response in geograph-ically separated strains of a single species (Langer et al.2009; Ridgwell et al. 2009), thus making it an amenablebiological model for the investigation of OA effects on alarge geographical scale, an approach that can help toverify whether general response trends can be found andhelp to refine models.
E. huxleyi is one of the most ubiquitous calcareousphytoplankton species (Berge 1962; Holligan et al. 1993),and can tolerate a broad range of temperatures (1–41uC)and salinities (15–45) (Brown and Yoder 1994), making itan easy species to culture, and for this reason it is arguablythe most well studied of all the phytoplankton (Iglesias-Rodrıguez et al. 2006). Over recent decades, researchershave examined the responses of perhaps 10 different strainsof E. huxleyi living at different geographic locationscharacterized by different environmental conditions. In-deed, Iglesias-Rodrıguez et al. (2006) suggested that a highlevel of genetic diversity exists in populations of E. huxleyi.In addition, Ridgwell et al. (2009) argued that E. huxleyishould be regarded as a diverse assemblage of genotypeswith highly variable calcification characteristics and eco-logical adaptations, and Langer et al. (2009) reported thatthe four E. huxleyi strains they analyzed differed substan-tially in their level of sensitivity to OA, this likely having agenetic basis. This high variability makes future projectionsof the response of E. huxleyi across the global oceancomplicated but nevertheless important.
There are several reasons to attempt to make sense of theresponse of coccolithophores to OA, as they play a majorrole in biogeochemical cycles. They contribute significantlyto the carbon cycle, both through photosynthesis (takingup CO2 to form organic carbon compounds) and calcifi-cation of their liths (removing carbon from seawater toform inorganic carbon compounds) (Sikes and Fabry
* Corresponding author: [email protected]
1 Present address: Nederlands Instituut voor Onderzoek der Zee(NIOZ) Royal Netherlands Institute for Sea Research, Horntje(Texel), The Netherlands
Limnol. Oceanogr., 56(3), 2011, 1168–1178
E 2011, by the American Society of Limnology and Oceanography, Inc.doi:10.4319/lo.2011.56.3.1168
1168

1994). The sinking of their liths once they have diedcontributes to the biological pump of capturing carbonfrom the surface ocean and sinking down to the deep ocean(Westbroek et al. 1993). However, calcification is a netsource of CO2, with deposition of 1 mol of calciumcarbonate releasing 0.6 mol CO2 into seawater (Gattuso etal. 1995). The particulate organic carbon (POC) content, orproduction, of coccolithophores is often used as a measureof net autotrophic productivity, whereas particulate inor-ganic carbon (PIC) content or production is used as ameasure of net calcification. PIC and POC are thereforeconsequential quantities, or traits, that are produced as aresult of physiological processes (photosynthesis, respira-tion, and calcification). Environmental factors can influ-ence the physiological functioning of coccolithophores,resulting in a change in production of PIC and POC. Theratio between PIC and POC gives a measure of the exportratio and is an important term for modeling carbon cyclingin the oceans (Ridgwell et al. 2009).
The environmental conditions thought to allow E.huxleyi to form large blooms include high light, as theybloom only in highly stratified upper surface waters, andlow nitrate conditions, with phosphate levels being moreimportant (Tyrrell and Taylor 1996); and, more recently,[CO 2{
3 ] has been suggested as a contributing factor: Mericoet al. (2006) demonstrated that coccolithophore bloomsfollowed the spring bloom in the Barents Sea when thecalcite saturation state (Vcalcite) was high, Findlay et al.(2008) showed agreement with data and modeling from theNorwegian Sea, and Tyrrell et al. (2008) argued that E.huxleyi was absent from the Baltic Sea but present in theBlack Sea because of low wintertime Vcalcite. There is alsoevidence from the natural environment that less heavilycalcified ecotypes are dominant at lower saturation states(Cubillos et al. 2007), and Beaufort et al. (2008) inferredthat size and weight of liths of coccolithophores in thePacific Ocean correlated with the carbonate systemparameters, especially alkalinity. Triantaphyllou et al.(2010) additionally showed a seasonal variation in sizeand calcification of coccoliths in the Aegean Sea, whichcorrelated with temperature and productivity but alsopotentially with changes in the carbonate system, althoughexactly which parameters ([HCO {
3 ], [CO 2{3 ], alkalinity,
dissolved inorganic carbon [DIC], etc.) affected the growthof the coccolithophores obviously could not be resolvedfrom these field studies. Tyrrell and Taylor (1995) showedusing data and modeling of the North Atlantic that E.huxleyi was not associated with low CO2 conditions, asmight be expected if it had evolved to be a successfulcompetitor in a low CO2 environment.
Variation in laboratory methodology or experimentaldesign might explain some of the variability observed in E.huxleyi response to a change in carbonate chemistry.However, the environment from which the organism wasoriginally collected is also likely to shape an organism’sability to respond to changes in environmental conditions.Many taxa and populations show local adaptation and oracclimatization to a suite of environmental conditions thatanother taxon, population, or strain from a differentlocation would be unable to tolerate or would react
differently to (Stillman 2003; Calosi et al. 2008). Hence,the existing level of adaptation may lead to taxa and strain-specific responses to OA: see, for example, differences inthe responses to OA in genetically distinctive clonal lines ofthe bryozoan Celleporella hyalina (Pistevos et al. 2011).Thus, the level of physiological adaptation of differentfunctions (i.e., photosynthesis, calcification) in differentstrains of E. huxleyi could contribute to the changesobserved in the PIC : POC ratio. It is important inattempting to constrain the consequences of OA toconsider strain- and or population-level adaptation tospecific environmental conditions (Dobzhansky 1973).
In this study, using a meta-analysis approach, wequantitatively characterize for the first time the relationshipbetween the response in PIC : POC of genetically differentstrains of the coccolithophore E. huxleyi collected atdifferent locations and the pH and carbonate systemparameters (and other environmental variables), whilecontrolling for experimental conditions. Further, weprovide a test for the hypothesis proposed by Ridgwell etal. (2009) of the possible existence of an analogy betweenEppley curve (Eppley 1972) encapsulation of temperature–growth behavior and the CO2–calcification system. Finally,on the basis of our results we propose a model to predict E.huxleyi response (PIC : POC) to different environmentalconditions, and calculate the expected PIC : POC value incurrent and future environmental scenarios over thelocations where the strains were collected.
Methods
Meta-analysis—We chose to study the ratio between PICand POC (PIC : POC), a measure often used as a carbonexport ratio, of the coccolithophore E. huxleyi exposed todifferent pH conditions. Although PIC and POC areroutinely measured in CO2 experiments, they are sometimesprovided as quota values and other times reported asproduction rates. This makes it difficult to compare thesevalues across studies. PIC : POC, however, provides astandard unit-less value that can be compared acrosstreatments and experiments. CO2 experiments conductedon E. huxleyi were chosen from a literature search of allpublished data. Studies were excluded if there were no dataon PIC or POC. Studies that used either acid–base or CO2
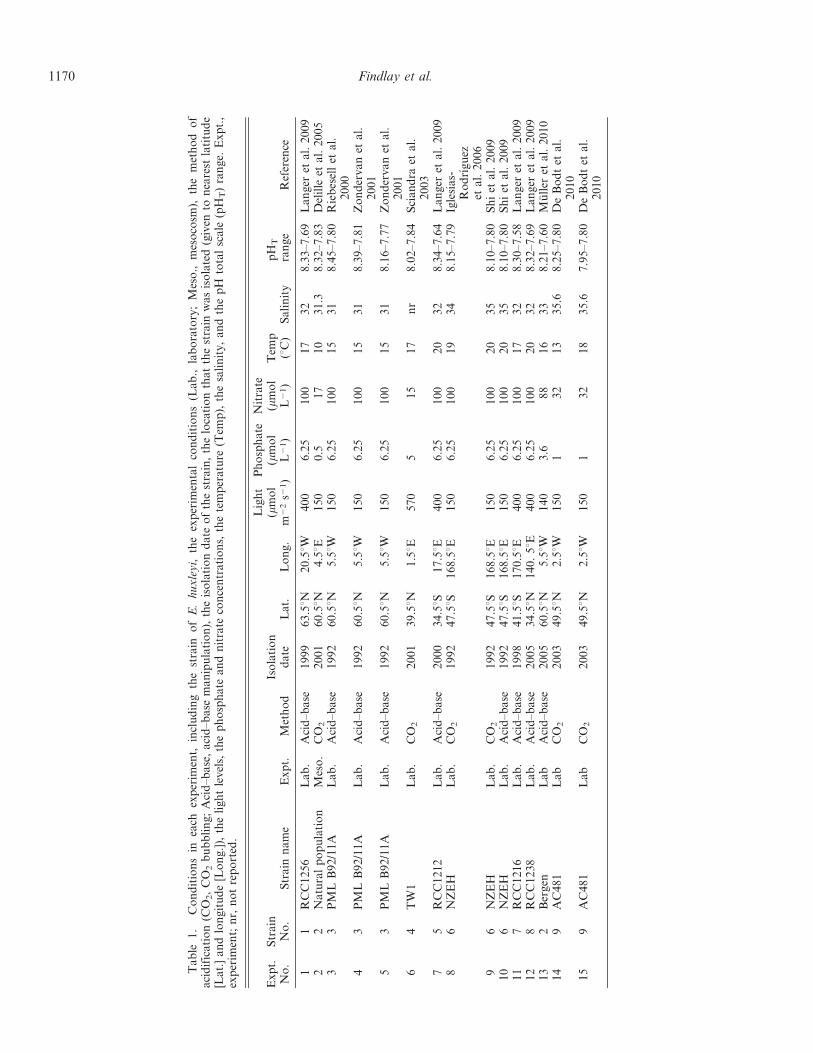
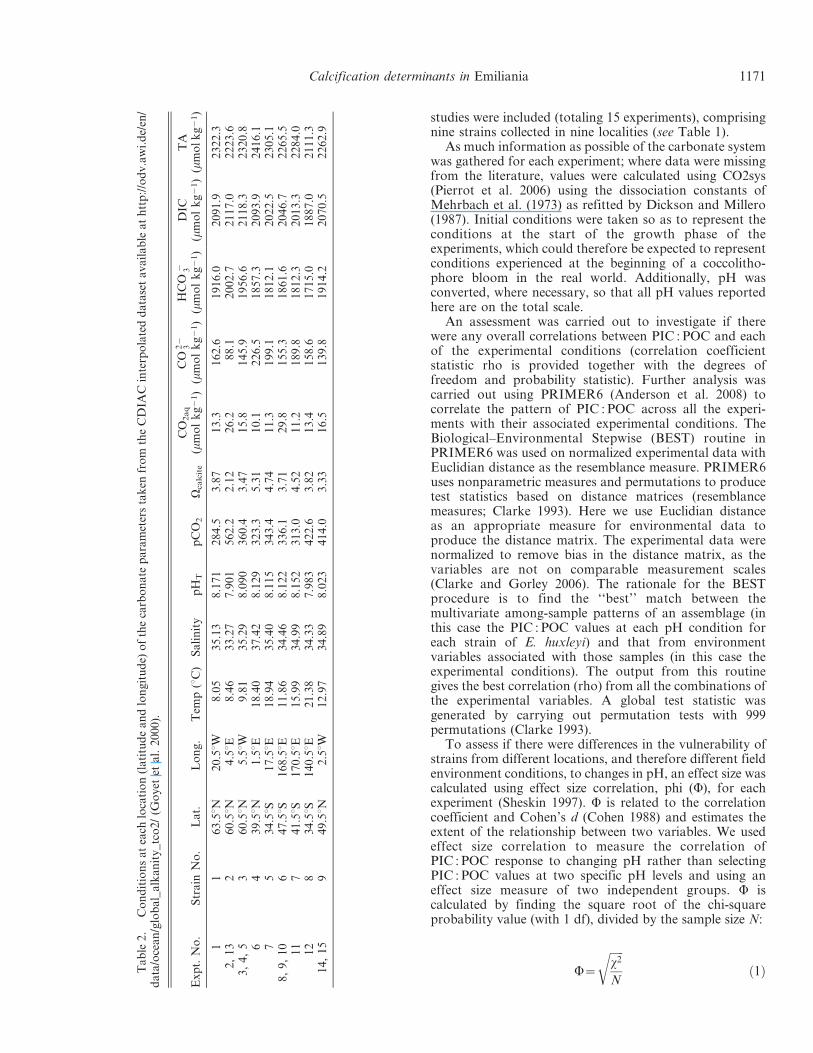
bubbling as a mechanism for altering the carbonate systemwere included in the analysis, and mechanism wasconsidered as a factor. Data were gathered on theexperimental conditions (nitrate, phosphate, light level,temperature, and salinity) as well as strain name, date andlocation of isolation (using latitudinal and longitudinalcoordinates), and morphotype, if the information wasavailable (Table 1). To provide an understanding ofambient environmental conditions experienced at thelocation of isolation of each strain, data were obtainedfrom the interpolated Carbon Dioxide Information Anal-ysis Centre (CDIAC) database developed by Goyet et al.(2000). The data gathered were DIC, total alkalinity (TA),temperature, and salinity, as well as calculated Vcalcite, pH,pCO2, and [CO 2{
3 ] at the nearest latitude and longitudeusing Ocean Data View (version 4) (Table 2). In total, nine
Calcification determinants in Emiliania 1169
Table
1.
Co
nd
itio
ns
inea
chex
per
imen
t,in
clu
din
gth
est
rain
of
E.
hu
xle
yi,
the
exp
erim
enta
lco
nd
itio
ns
(La
b.,
lab
ora
tory
;M
eso
.,m
eso
cosm
),th
em
eth
od
of
aci
dif
ica
tio
n(C
O2,
CO
2b
ub
bli
ng
;A
cid
–b
ase
,a
cid
–b
ase
ma
nip
ula
tio
n),
the
iso
lati
on
da
teo
fth
est
rain
,th
elo
cati
on
tha
tth
est
rain
wa
sis
ola
ted
(giv
ento
nea
rest
lati
tud
e[L
at.
]a
nd
lon
git
ud
e[L
on
g.]
),th
eli
gh
tle
vel
s,th
ep
ho
sph
ate
an
dn
itra
teco
nce
ntr
ati
on
s,th
ete
mp
era
ture
(Tem
p),
the
sali
nit
y,
an
dth
ep
Hto
tal
sca
le(p
HT)
ran
ge.
Ex
pt.
,ex
per
imen
t;n
r,n
ot
rep
ort
ed.
Ex
pt.
No
.S
tra
inN
o.
Str
ain
na
me
Ex
pt.
Met
ho
dIs
ola
tio
nd
ate
La
t.L
on
g.
Lig
ht
(mm
ol
m2
2s2
1)
Ph
osp
ha
te(m
mo
lL
21)
Nit
rate
(mm
ol
L2
1)
Tem
p(u
C)
Sa
lin
ity
pH
T
ran
ge
Ref
eren
ce
11
RC
C1
25
6L
ab
.A
cid
–b
ase
19
99
63
.5uN
20
.5uW
40
06
.25
10
01
73
28
.33
–7
.69
La
ng
eret
al.
20
09
22
Na
tura
lp
op
ula
tio
nM
eso
.C
O2
20
01
60
.5uN
4.5uE
15
00
.51
71
03
1.3
8.3
2–
7.8
3D
elil
leet
al.
20
05
33
PM
LB
92
/11
AL
ab
.A
cid
–b
ase
19
92
60
.5uN
5.5uW
15
06
.25
10
01
53
18
.45
–7
.80
Rie
bes
ell
eta
l.2
00
04
3P
ML
B9
2/1
1A
La
b.
Aci
d–
ba
se1
99
26
0.5uN
5.5uW
15
06
.25
10
01
53
18
.39
–7
.81
Zo
nd
erv
an
eta
l.2
00
15
3P
ML
B9
2/1
1A
La
b.
Aci
d–
ba
se1
99
26
0.5uN
5.5uW
15
06
.25
10
01
53
18
.16
–7
.77
Zo
nd
erv
an
eta
l.2
00
16
4T
W1
La
b.
CO
22
00
13
9.5uN
1.5uE
57
05
15
17
nr
8.0
2–
7.8
4S
cia
nd
raet
al.
20
03
75
RC
C1
21
2L
ab
.A
cid
–b
ase
20
00
34
.5uS
17
.5uE
40
06
.25
10
02
03
28
.34
–7
.64
La
ng
eret
al.
20
09
86
NZ
EH
La
b.
CO
21
99
24
7.5uS
16
8.5uE
15
06
.25
10
01
93
48
.15
–7
.79
Igle
sia
s-R
od
rıg
uez
eta
l.2
00
69
6N
ZE
HL
ab
.C
O2
19
92
47
.5uS
16
8.5uE
15
06
.25
10
02
03
58
.10
–7
.80
Sh
iet
al.
20
09
10
6N
ZE
HL
ab
.A
cid
–b
ase
19
92
47
.5uS
16
8.5uE
15
06
.25
10
02
03
58
.10
–7
.80
Sh
iet
al.
20
09
11
7R
CC
12
16
La
b.
Aci
d–
ba
se1
99
84
1.5uS
17
0.5uE
40
06
.25
10
01
73
28
.30
–7
.58
La
ng
eret
al.
20
09
12
8R
CC
12
38
La
b.
Aci
d–
ba
se2
00
53
4.5uN
14
0.
5uE
40
06
.25
10
02
03
28
.32
–7
.69
La
ng
eret
al.
20
09
13
2B
erg
enL
ab
Aci
d–
ba
se2
00
56
0.5uN
5.5uW
14
03
.68
81
63
38
.21
–7
.60
Mu
ller
eta
l.2
01
01
49
AC
48
1L
ab
CO
22
00
34
9.5uN
2.5uW
15
01
32
13
35
.68
.25
–7
.80
De
Bo
dt
eta
l.2
01
01
59
AC
48
1L
ab
CO
22
00
34
9.5uN
2.5uW
15
01
32
18
35
.67
.95
–7
.80
De
Bo
dt
eta
l.2
01
0
1170 Findlay et al.
studies were included (totaling 15 experiments), comprisingnine strains collected in nine localities (see Table 1).
As much information as possible of the carbonate systemwas gathered for each experiment; where data were missingfrom the literature, values were calculated using CO2sys(Pierrot et al. 2006) using the dissociation constants ofMehrbach et al. (1973) as refitted by Dickson and Millero(1987). Initial conditions were taken so as to represent theconditions at the start of the growth phase of theexperiments, which could therefore be expected to representconditions experienced at the beginning of a coccolitho-phore bloom in the real world. Additionally, pH wasconverted, where necessary, so that all pH values reportedhere are on the total scale.
An assessment was carried out to investigate if therewere any overall correlations between PIC : POC and eachof the experimental conditions (correlation coefficientstatistic rho is provided together with the degrees offreedom and probability statistic). Further analysis wascarried out using PRIMER6 (Anderson et al. 2008) tocorrelate the pattern of PIC : POC across all the experi-ments with their associated experimental conditions. TheBiological–Environmental Stepwise (BEST) routine inPRIMER6 was used on normalized experimental data withEuclidian distance as the resemblance measure. PRIMER6uses nonparametric measures and permutations to producetest statistics based on distance matrices (resemblancemeasures; Clarke 1993). Here we use Euclidian distanceas an appropriate measure for environmental data toproduce the distance matrix. The experimental data werenormalized to remove bias in the distance matrix, as thevariables are not on comparable measurement scales(Clarke and Gorley 2006). The rationale for the BESTprocedure is to find the ‘‘best’’ match between themultivariate among-sample patterns of an assemblage (inthis case the PIC : POC values at each pH condition foreach strain of E. huxleyi) and that from environmentvariables associated with those samples (in this case theexperimental conditions). The output from this routinegives the best correlation (rho) from all the combinations ofthe experimental variables. A global test statistic wasgenerated by carrying out permutation tests with 999permutations (Clarke 1993).
To assess if there were differences in the vulnerability ofstrains from different locations, and therefore different fieldenvironment conditions, to changes in pH, an effect size wascalculated using effect size correlation, phi (W), for eachexperiment (Sheskin 1997). W is related to the correlationcoefficient and Cohen’s d (Cohen 1988) and estimates theextent of the relationship between two variables. We usedeffect size correlation to measure the correlation ofPIC : POC response to changing pH rather than selectingPIC : POC values at two specific pH levels and using aneffect size measure of two independent groups. W iscalculated by finding the square root of the chi-squareprobability value (with 1 df), divided by the sample size N:
W~
ffiffiffiffiffix2
N
rð1ÞT
able2.
Co
nd
itio
ns
at
each
loca
tio
n(l
ati
tud
ea
nd
lon
git
ud
e)o
fth
eca
rbo
na
tep
ara
met
ers
tak
enfr
om
the
CD
IAC
inte
rpo
late
dd
ata
set
av
ail
ab
lea
th
ttp
://o
dv
.aw
i.d
e/en
/d
ata
/oce
an
/glo
ba
l_a
lka
nit
y_
tco
2/
(Go
yet
eta
l.2
00
0).
Ex
pt.
No
.S
tra
inN
o.
La
t.L
on
g.
Tem
p(u
C)
Sa
lin
ity
pH
Tp
CO
2V
ca
lcit
e
CO
2a
q
(mm
ol
kg
21)
CO
2{
3
(mm
ol
kg
21)
HC
O{ 3
(mm
ol
kg
21)
DIC
(mm
ol
kg
21)
TA
(mm
olk
g2
1)
11
63
.5uN
20
.5uW
8.0
53
5.1
38
.17
12
84
.53
.87
13
.31
62
.61
91
6.0
20
91
.92
32
2.3
2,
13
26
0.5uN
4.5uE
8.4
63
3.2
77
.90
15
62
.22
.12
26
.28
8.1
20
02
.72
11
7.0
22
23
.63
,4
,5
36
0.5uN
5.5uW
9.8
13
5.2
98
.09
03
60
.43
.47
15
.81
45
.91
95
6.6
21
18
.32
32
0.8
64
39
.5uN
1.5uE
18
.40
37
.42
8.1
29
32
3.3
5.3
11
0.1
22
6.5
18
57
.32
09
3.9
24
16
.17
53
4.5uS
17
.5uE
18
.94
35
.40
8.1
15
34
3.4
4.7
41
1.3
19
9.1
18
12
.12
02
2.5
23
05
.18
,9
,1
06
47
.5uS
16
8.5uE
11
.86
34
.46
8.1
22
33
6.1
3.7
12
9.8
15
5.3
18
61
.62
04
6.7
22
65
.51
17
41
.5uS
17
0.5uE
15
.99
34
.99
8.1
52
31
3.0
4.5
21
1.2
18
9.8
18
12
.32
01
3.3
22
84
.01
28
34
.5uS
14
0.5uE
21
.38
34
.33
7.9
83
42
2.6
3.8
21
3.4
15
8.6
17
15
.01
88
7.0
21
11
.31
4,
15
94
9.5uN
2.5uW
12
.97
34
.89
8.0
23
41
4.0
3.3
31
6.5
13
9.8
19
14
.22
07
0.5
22
62
.9
Calcification determinants in Emiliania 1171
The PIC : POC value (experimental result) at each pHlevel was compared to the average PIC : POC value in eachexperiment, based on the null hypothesis that there is nochange in PIC : POC with changing pH. A meta-analysiswas used to assess whether the strain, absolute latitudinalposition, environmental conditions (data obtained fromGoyet et al. 2000: temperature, salinity, and carbonatesystem parameters), morphotype, collection date, andmethod of acidification correlated with the effect size.
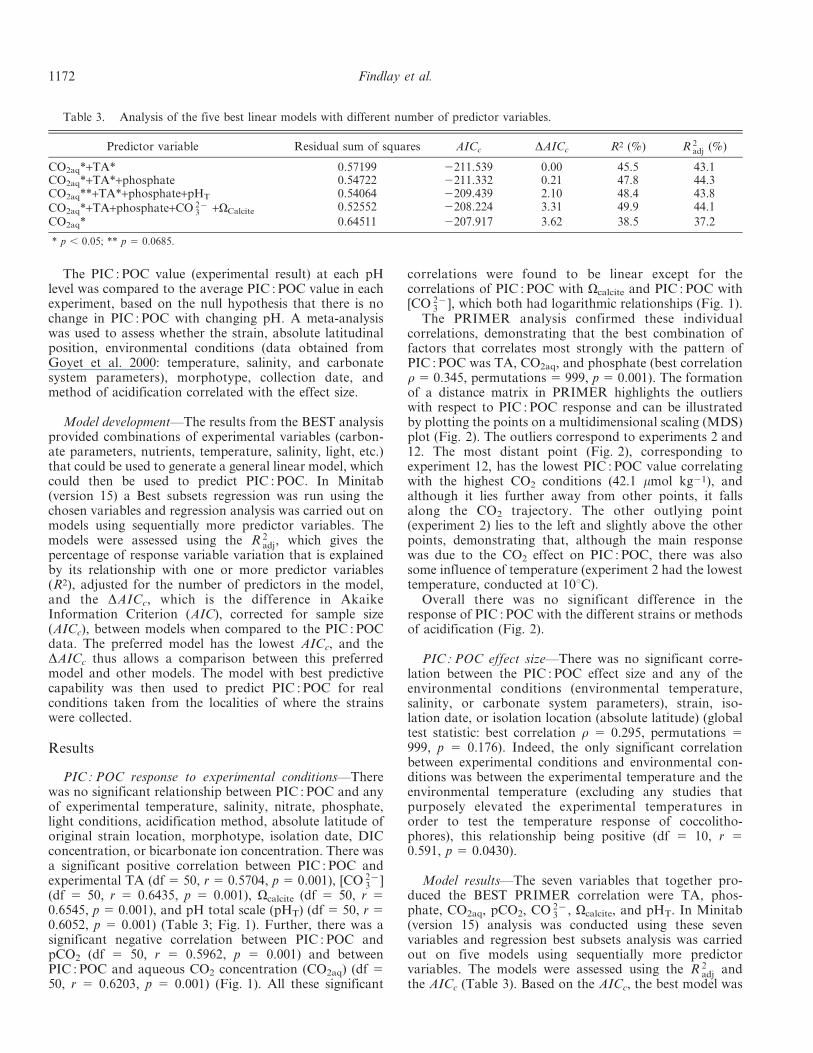
Model development—The results from the BEST analysisprovided combinations of experimental variables (carbon-ate parameters, nutrients, temperature, salinity, light, etc.)that could be used to generate a general linear model, whichcould then be used to predict PIC : POC. In Minitab(version 15) a Best subsets regression was run using thechosen variables and regression analysis was carried out onmodels using sequentially more predictor variables. Themodels were assessed using the R 2
adj, which gives thepercentage of response variable variation that is explainedby its relationship with one or more predictor variables(R2), adjusted for the number of predictors in the model,and the DAICc, which is the difference in AkaikeInformation Criterion (AIC), corrected for sample size(AICc), between models when compared to the PIC : POCdata. The preferred model has the lowest AICc, and theDAICc thus allows a comparison between this preferredmodel and other models. The model with best predictivecapability was then used to predict PIC : POC for realconditions taken from the localities of where the strainswere collected.
Results
PIC : POC response to experimental conditions—Therewas no significant relationship between PIC : POC and anyof experimental temperature, salinity, nitrate, phosphate,light conditions, acidification method, absolute latitude oforiginal strain location, morphotype, isolation date, DICconcentration, or bicarbonate ion concentration. There wasa significant positive correlation between PIC : POC andexperimental TA (df 5 50, r 5 0.5704, p 5 0.001), [CO 2{
3 ](df 5 50, r 5 0.6435, p 5 0.001), Vcalcite (df 5 50, r 50.6545, p 5 0.001), and pH total scale (pHT) (df 5 50, r 50.6052, p 5 0.001) (Table 3; Fig. 1). Further, there was asignificant negative correlation between PIC : POC andpCO2 (df 5 50, r 5 0.5962, p 5 0.001) and betweenPIC : POC and aqueous CO2 concentration (CO2aq) (df 550, r 5 0.6203, p 5 0.001) (Fig. 1). All these significant
correlations were found to be linear except for thecorrelations of PIC : POC with Vcalcite and PIC : POC with[CO 2{
3 ], which both had logarithmic relationships (Fig. 1).The PRIMER analysis confirmed these individual
correlations, demonstrating that the best combination offactors that correlates most strongly with the pattern ofPIC : POC was TA, CO2aq, and phosphate (best correlationr 5 0.345, permutations 5 999, p 5 0.001). The formationof a distance matrix in PRIMER highlights the outlierswith respect to PIC : POC response and can be illustratedby plotting the points on a multidimensional scaling (MDS)plot (Fig. 2). The outliers correspond to experiments 2 and12. The most distant point (Fig. 2), corresponding toexperiment 12, has the lowest PIC : POC value correlatingwith the highest CO2 conditions (42.1 mmol kg21), andalthough it lies further away from other points, it fallsalong the CO2 trajectory. The other outlying point(experiment 2) lies to the left and slightly above the otherpoints, demonstrating that, although the main responsewas due to the CO2 effect on PIC : POC, there was alsosome influence of temperature (experiment 2 had the lowesttemperature, conducted at 10uC).
Overall there was no significant difference in theresponse of PIC : POC with the different strains or methodsof acidification (Fig. 2).
PIC : POC effect size—There was no significant corre-lation between the PIC : POC effect size and any of theenvironmental conditions (environmental temperature,salinity, or carbonate system parameters), strain, iso-lation date, or isolation location (absolute latitude) (globaltest statistic: best correlation r 5 0.295, permutations 5999, p 5 0.176). Indeed, the only significant correlationbetween experimental conditions and environmental con-ditions was between the experimental temperature and theenvironmental temperature (excluding any studies thatpurposely elevated the experimental temperatures inorder to test the temperature response of coccolitho-phores), this relationship being positive (df 5 10, r 50.591, p 5 0.0430).
Model results—The seven variables that together pro-duced the BEST PRIMER correlation were TA, phos-phate, CO2aq, pCO2, CO 2{
3 , Vcalcite, and pHT. In Minitab(version 15) analysis was conducted using these sevenvariables and regression best subsets analysis was carriedout on five models using sequentially more predictorvariables. The models were assessed using the R 2
adj andthe AICc (Table 3). Based on the AICc, the best model was
Table 3. Analysis of the five best linear models with different number of predictor variables.
Predictor variable Residual sum of squares AICc DAICc R2 (%) R 2adj (%)
CO2aq*+TA* 0.57199 2211.539 0.00 45.5 43.1CO2aq*+TA*+phosphate 0.54722 2211.332 0.21 47.8 44.3CO2aq**+TA*+phosphate+pHT 0.54064 2209.439 2.10 48.4 43.8
CO2aq*+TA+phosphate+CO 2{3 +VCalcite 0.52552 2208.224 3.31 49.9 44.1
CO2aq* 0.64511 2207.917 3.62 38.5 37.2
* p , 0.05; ** p 5 0.0685.
1172 Findlay et al.
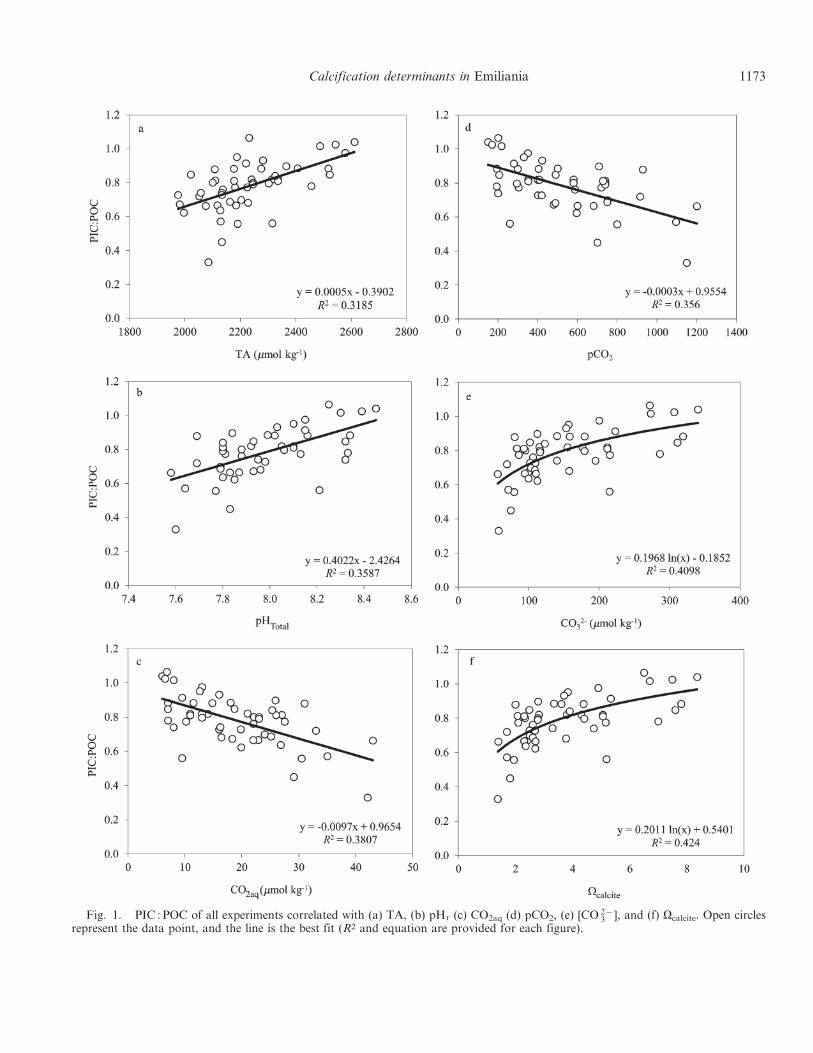
Fig. 1. PIC : POC of all experiments correlated with (a) TA, (b) pHT (c) CO2aq (d) pCO2, (e) [CO 2{3 ], and (f) Vcalcite. Open circles
represent the data point, and the line is the best fit (R2 and equation are provided for each figure).
Calcification determinants in Emiliania 1173

with TA and CO2aq; however, the model using TA, CO2aq,and phosphate had an improved R 2
adj by 1.2 and onlyslightly higher AICc (DAICc 5 0.21). By ranking andscoring the models by their respective values of DAICc andr 2
adj and averaging such scores, we show that although thereis much similarity between the model AICc and r 2
adj values,the best model, taking into account both statistics, is themodel using TA, CO2aq, and phosphate. Analysis of eachvariable component within the model shows, however, thatonly TA and CO2aq are statistically significant contributorsto the prediction (Table 3).
The predictive model is therefore
PIC : POC~0:266{0:00178|½CO2aq�
z0:000264|½TA�z0:0118|½phosphate� ð2Þ
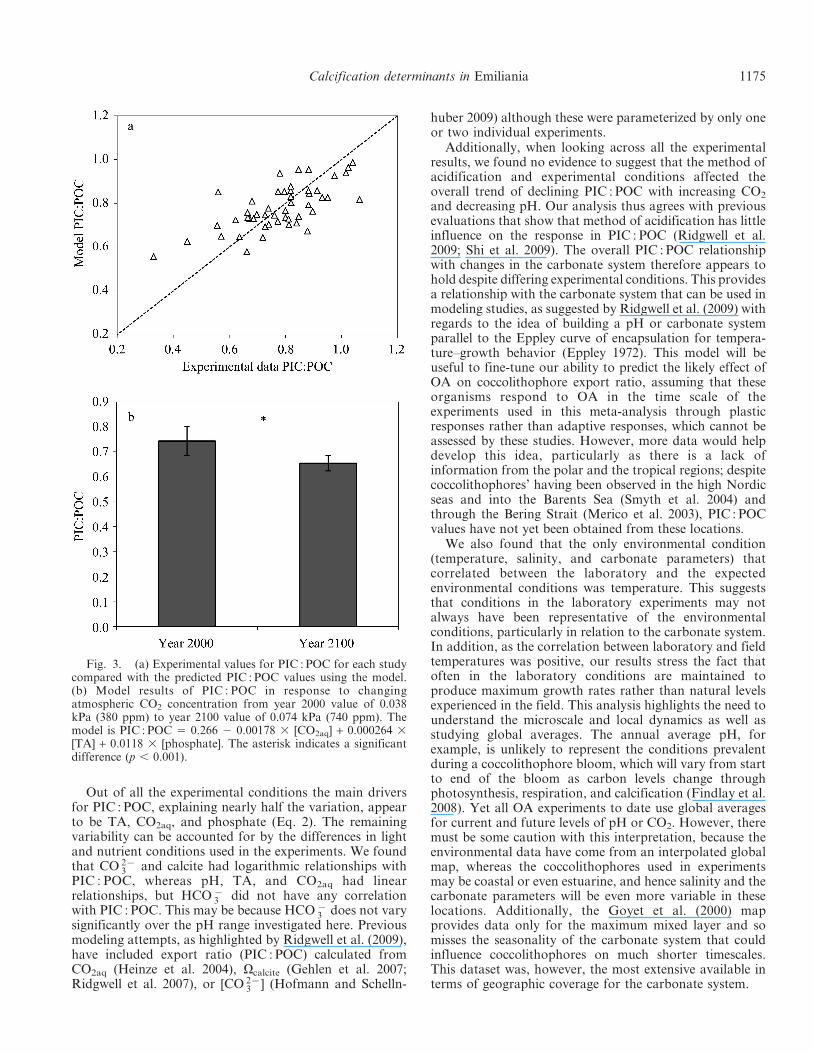
This model underestimates PIC : POC at higher valuesand overestimates PIC : POC at lower values, where therewere fewer data points to constrain the model (Fig. 3a).
The model was then used to predict the PIC : POC valuefor each geographic location of each strain using theenvironmental values gathered from the dataset of Goyet etal. (2000). The average PIC : POC under current conditionswas 0.803 (s2 5 0.0588), whereas under a future OAscenario, where pH decreases by 0.3 units from ambientconditions (while maintaining constant TA and constantphosphate), the average PIC : POC decreased to 0.717 (s2 50.0326) (Fig. 3b). The main predictor is the CO2 concen-tration, which has a distributional gradient over the world’soceans determined by a number of factors involving the
water mass properties but also the anthropogenic input(highest in the western Atlantic) as well as upwellinglocations and areas of high riverine input.
Discussion
Overarching trends in laboratory experiments—In orderto understand and predict future responses of coccolitho-phores to increased pCO2, a large number of experimentshave recently been performed that have yielded a surprisingdiversity of results. Explanations for apparently contradic-tory results have included differences in experimentalconditions, strain (genetic adaptation), and CO2 manipu-lation techniques. The ability to extrapolate from culturesthat have been in laboratory conditions for several decadesto natural populations is also often discussed. Ridgwell etal. (2009) summarized qualitatively the different responsesand the relationship between acidification method andexperimental conditions, concluding that methodologicaldifferences in acidification have negligible influence on theresults, whereas strain difference may be notable, particu-larly where strains have been in culture for many years.Ridgwell et al. (2009) showed that no study had yetreported an increased PIC : POC in response to increasingOA, yet PIC : POC is the most useful value for helpingestimate the effects of OA on global carbonate production,and for use in models. Here we have shown that althoughthere are variable responses in PIC and POC in theliterature across E. huxleyi experiments, the response to OAin terms of PIC : POC ratio is surprisingly uniform acrossexperiments.
Fig. 2. MDS ordination of PIC : POC from all experiments overlaid with the experimentalvariables. Symbols (defined in the legend) represent the different strains (strain numbers are givenin Table 1), and the numbers above each symbol represent the method of acidification: method 15 bubbling with CO2, method 2 5 acid or base adjustment. The MDS is overlaid with trajectoriesrepresenting the influence of the experimental conditions. The majority of the PIC : POC responsefollows the CO2aq (CO2) and TA (TAlk) lines.
1174 Findlay et al.
Out of all the experimental conditions the main driversfor PIC : POC, explaining nearly half the variation, appearto be TA, CO2aq, and phosphate (Eq. 2). The remainingvariability can be accounted for by the differences in lightand nutrient conditions used in the experiments. We foundthat CO 2{
3 and calcite had logarithmic relationships withPIC : POC, whereas pH, TA, and CO2aq had linearrelationships, but HCO {
3 did not have any correlationwith PIC : POC. This may be because HCO {
3 does not varysignificantly over the pH range investigated here. Previousmodeling attempts, as highlighted by Ridgwell et al. (2009),have included export ratio (PIC : POC) calculated fromCO2aq (Heinze et al. 2004), Vcalcite (Gehlen et al. 2007;Ridgwell et al. 2007), or [CO 2{
3 ] (Hofmann and Schelln-
huber 2009) although these were parameterized by only oneor two individual experiments.
Additionally, when looking across all the experimentalresults, we found no evidence to suggest that the method ofacidification and experimental conditions affected theoverall trend of declining PIC : POC with increasing CO2
and decreasing pH. Our analysis thus agrees with previousevaluations that show that method of acidification has littleinfluence on the response in PIC : POC (Ridgwell et al.2009; Shi et al. 2009). The overall PIC : POC relationshipwith changes in the carbonate system therefore appears tohold despite differing experimental conditions. This providesa relationship with the carbonate system that can be used inmodeling studies, as suggested by Ridgwell et al. (2009) withregards to the idea of building a pH or carbonate systemparallel to the Eppley curve of encapsulation for tempera-ture–growth behavior (Eppley 1972). This model will beuseful to fine-tune our ability to predict the likely effect ofOA on coccolithophore export ratio, assuming that theseorganisms respond to OA in the time scale of theexperiments used in this meta-analysis through plasticresponses rather than adaptive responses, which cannot beassessed by these studies. However, more data would helpdevelop this idea, particularly as there is a lack ofinformation from the polar and the tropical regions; despitecoccolithophores’ having been observed in the high Nordicseas and into the Barents Sea (Smyth et al. 2004) andthrough the Bering Strait (Merico et al. 2003), PIC : POCvalues have not yet been obtained from these locations.
We also found that the only environmental condition(temperature, salinity, and carbonate parameters) thatcorrelated between the laboratory and the expectedenvironmental conditions was temperature. This suggeststhat conditions in the laboratory experiments may notalways have been representative of the environmentalconditions, particularly in relation to the carbonate system.In addition, as the correlation between laboratory and fieldtemperatures was positive, our results stress the fact thatoften in the laboratory conditions are maintained toproduce maximum growth rates rather than natural levelsexperienced in the field. This analysis highlights the need tounderstand the microscale and local dynamics as well asstudying global averages. The annual average pH, forexample, is unlikely to represent the conditions prevalentduring a coccolithophore bloom, which will vary from startto end of the bloom as carbon levels change throughphotosynthesis, respiration, and calcification (Findlay et al.2008). Yet all OA experiments to date use global averagesfor current and future levels of pH or CO2. However, theremust be some caution with this interpretation, because theenvironmental data have come from an interpolated globalmap, whereas the coccolithophores used in experimentsmay be coastal or even estuarine, and hence salinity and thecarbonate parameters will be even more variable in theselocations. Additionally, the Goyet et al. (2000) mapprovides data only for the maximum mixed layer and somisses the seasonality of the carbonate system that couldinfluence coccolithophores on much shorter timescales.This dataset was, however, the most extensive available interms of geographic coverage for the carbonate system.
Fig. 3. (a) Experimental values for PIC : POC for each studycompared with the predicted PIC : POC values using the model.(b) Model results of PIC : POC in response to changingatmospheric CO2 concentration from year 2000 value of 0.038kPa (380 ppm) to year 2100 value of 0.074 kPa (740 ppm). Themodel is PIC : POC 5 0.266 2 0.00178 3 [CO2aq] + 0.000264 3[TA] + 0.0118 3 [phosphate]. The asterisk indicates a significantdifference (p , 0.001).
Calcification determinants in Emiliania 1175
It is important to consider the caveats associated withmeta-analysis. Meta-analysis provide information only ofthe data available in the literature; if there are publicationbiases (i.e., significant results are more likely to bepublished) then this will skew the overall trends. Thereare also problems associated with meta-analysis whendifferences in experimental conditions are not considered.This study uses the experimental conditions where possibleas correlative factors to determine if they do or do notinfluence the PIC : POC response. However, not all studiesin the literature provide all the information required, e.g.,information on salinity in some cases was not available.This again could lead to some bias in our interpretations.
Response sensitivity across strains—By quantitativelyevaluating results presented in the literature, we found nodifference in the effect size (i.e., the response in PIC : POC toOA) between strains, locations, and environmental condi-tions. This assessment provides some indication of whetherthe different responses observed between experiments andstrains (in terms of PIC and/or POC) results in strain-specificsensitivity to OA in terms of export ratio (PIC : POC).Although E. huxleyi populations appear highly geneticallydiverse (Iglesias-Rodrıguez et al. 2006), our results suggestthat such a degree of intraspecific genetic diversity (demon-strated by a large variability in PIC responses and in POCresponses) does not translate into functional variability (e.g.,export ratio), as suggested by Iglesias-Rodrıguez et al.(2006), and demonstrated by the fact that the PIC : POCresponse to changes in the carbonate system appears highlyconserved within an environmentally relevant pH.
The similar response in PIC : POC found in all ecotypes(strains) across the gradients in carbonate system parameters(CO2, pH, etc.) suggests that the coccolithophore strains donot show any specific level of adaptation to regional or localcarbonate conditions. However, there is still limited under-standing from these short-timescale experiments of whethera change from present (early 21st century) to future (end of21st century) average carbonate conditions would result ingenetic adaptation, or whether the range of variability incarbonate conditions that these organisms currently experi-ence would allow the extant populations to respond to theseshifts in the carbonate system. Further assessment of naturalassemblages and the conditions in which they thrive wouldhelp to develop whether there can be shifts from one ecotypedominance to another. Our analysis furthers the work ofRidgwell et al. (2009) by assessing the conditions within theexperiments, as well as the differences between ecotypes(strains) and the environmental conditions in which theywere originally located. A next step would be to understandthe extent of variability to which these organisms areexposed in the natural environment, as well as the plasticresponses of strains and scope for further adaptation to lowpH–high CO2 conditions.
Our analysis also provides the first quantitative assess-ment that time spent in culture does not appear to affect theresponse of PIC : POC to OA. However, it is important tonote that estimated culture times are of several years,timescales during which a high number of generations canoccur, and together with a variety of uncontrolled selective
processes, this may prevent us from appreciating the realpotential for adaptation of E. huxleyi, especially as therates of calcification, photosynthesis, and cell growth incoccolithophores are dynamic, alter on short timescales,show strong diel periodicity, and are affected by celldivision rate (Paasche 2002). A recent long-term study byMuller et al. (2010) suggested that changing the carbonatesystem more slowly and over several generations causessimilar responses in PIC : POC as seen in shorter-termexperiments. Examples from the field have shown thatcoccolithophores are seasonally dynamic in their growth,coccolith size, and thickness (a measure of calcification),increasing in size and becoming more heavily calcified inthe winter and early spring (Triantaphyllou et al. 2010).
Environmental conditions and wider implications—Inter-estingly, although not a significant contributor, experimen-tal phosphate was a dominant predictor of PIC : POC. Thephosphate levels were not limiting in any of the experiments(see Table 1); indeed, E. huxelyi is believed to haveenhanced growth in low-phosphate conditions, whichallows it to dominate over more phosphate-limitedphytoplankton species (Eppley et al. 1969; Iglesias-Rodrı-guez et al. 2002; Satoh et al. 2009). Previous models forexport ratio have not included any nutrient parameters, yetunder analysis of a wide range of results, as shown here,phosphate concentration does appear important.
The water–mass properties and physical dynamicsexperienced by these organisms ultimately determine whatconditions they are exposed to. As CO2aq and TA appear tobe the dominant predictors for PIC : POC, we can assess theresponse in relation to the current levels of CO2aq and TAfound in the oceans. For example, the northern Atlantichas high levels of anthropogenic CO2 compared to theNorth Pacific (Sabine et al. 2004); deep water rich in CO2
have been shown to encroach on the surface water,particularly in upwelling areas on the eastern Pacific (Feelyet al. 2008; E. S. Mayol et al. unpubl.). We might thereforepredict, then, that these areas of high CO2 conditionsalready have lower PIC : POC levels, which could be furtherreduced by OA, as it appears there is no local adaptationthat would make these organisms equally vulnerable toenvironmental change despite their location.
The reduction in PIC : POC appears, in the majority ofexperiments, to result from a decrease in PIC (Riebesell et al.2000; Langer et al. 2009). A decrease in PIC with stable POCand specific growth rate, as in these cases (Riebesell et al.2000; Langer et al. 2009), would reduce the weight of cells,reducing sinking rates (Armstrong et al. 2002; Klaas andArcher 2002), but would also reduce the potential CO2
released by calcification (Ridgwell et al. 2007). In the cases ofIglesias-Rodrıguez et al. (2008) and Shi et al. (2009),PIC : POC decreased with increasing CO2 because althoughboth PIC and POC increased, there was a slight mismatch inthe magnitude of increase, i.e., POC increased more. In otherstudies, an increase in POC is seen alongside a decrease inPIC (Zondervan et al. 2001), which results in even greaterdecreases in the PIC : POC ratio with increasing CO2.
The PIC : POC response to OA does not appear to be strainspecific but can be predicted from TA, CO2aq, and phosphate
1176 Findlay et al.
conditions as a phenotypically plastic response to theenvironment. PIC : POC can be characterized by an overallrelationship with the carbonate system, such that there is alinear decrease in PIC : POC with increasing TA, increasingCO2aq, and decreasing pH, and a logarithmic decrease inPIC : POC with decreasing [CO 2{
3 ] and decreasing Vcalcite.Furthermore, PIC : POC variation with environmental con-ditions can be characterized to specific water masses, althoughthis relationship now needs validation from field results.There appears to be no complication that local populations ordifferent strains have become biologically isolated to responddifferently to the changes in chemistry, most likely becausethey experience a wide range of conditions. This means that ageneral increase in CO2 or decrease in pH over the globaloceans will ultimately produce comparable responses ingenetically distinctive strains of E. huxleyi, yet there will beregional differences in the rate of change and therefore therelative contribution to the export ratio.
AcknowledgmentsThis work was undertaken while H.S.F. was in receipt of the
Lord Kingsland Fellowship at the Plymouth Marine Laboratoryand P.C. a Research Council UK Research Fellowship toinvestigate ocean acidification at the University of Plymouth;K.C. was funded by a Natural Environment Research CouncilBlueskies Ph.D. studentship. This paper benefited from helpfulreviewing of two anonymous reviewers.
References
ANDERSON, M. J., R. N. GORLEY, AND K. R. CLARKE. 2008.PERMANOVA+ for PRIMER: Guide to software andstatistical methods. PRIMER-E.
ARMSTRONG, R. A., C. LEE, J. I. HEDGES, S. HONJO, AND S. G.WAKEHAM. 2002. A new, mechanistic model for organiccarbon fluxes in the ocean: Based on the quantitativeassociation of POC with ballast minerals. Deep-Sea Res. II49: 219–236, doi:10.1016/S0967-0645(01)00101-1
BEAUFORT, L., M. COUAPEL, N. BUCHET, H. CLAUSTRE, AND C. GOYET.2008. Calcite production by coccolithophores in the south eastPacific Ocean. Biogeosciences 5: 1101–1117, doi:10.5194/bg-5-1101-2008
BERGE, G. 1962. Discoloration of the sea due to Coccolithushuxleyi ‘‘bloom.’’ Sarsia 6: 27–41.
BROWN, C. W., AND J. A. YODER. 1994. Coccolithophorid blooms inthe global ocean. J. Geophys. Res. 99: 7467–7482, doi:10.1029/93JC02156
CALDEIRA, K., AND M. E. WICKETT. 2003. Anthropogenic carbonand ocean pH. Nature 425: 365, doi:10.1038/425365a
CALOSI, P., D. T. BILTON, AND J. I. SPICER. 2008. Thermal tolerance,acclimatory capacity and vulnerability to global climatechange. Biol. Lett. 4: 99–102, doi:10.1098/rsbl.2007.0408
CLARKE, K. R. 1993. Non-parametric multivariate analyses ofchanges in community structure. Aust. J. Ecol. 18: 117–143,doi:10.1111/j.1442-9993.1993.tb00438.x
———, AND R. N. GORLEY. 2006. PRIMER v6: User manual/tutorial. PRIMER-E.
COHEN, J. 1988. Statistical power analysis for the behavioralsciences, 2nd ed. Lawrence Erlbaum.
CUBILLOS, J. C., AND oTHERS. 2007. Calcification morphotypes ofthe coccolithophorid Emiliania huxleyi in the Southern Ocean:Changes in 2001 to 2006 compared to historical data. Mar.Ecol. Prog. Ser. 348: 47–54, doi:10.3354/meps07058
DE BODT, C., N. VAN OOSTENDE, J. HARLAY, K. SABBE, AND L.CHOU. 2010. Individual and interacting effects of pCO2 andtemperature on Emiliania huxleyi calcification: Study of thecalcite production, the coccolith morphology and the cocco-sphere size. Biogeosciences 7: 1401–1412, doi:10.5194/bg-7-1401-2010
DELILLE, B., AND oTHERS. 2005. Response of primary productionand calcification to changes of pCO2 during experimentalblooms of the coccolithophorid Emiliania huxleyi. GlobalBiogeochem. Cycles 19: GB2023, doi:10.1029/2004GB002318
DICKSON, A. G., AND F. J. MILLERO. 1987. A comparison of theequilibrium-constants for the dissociation of carbonic-acid inseawater media. Deep-Sea Res. 34: 1733–1743.
DOBZHANSKY, T. 1973. Nothing in biology makes sense except inlight of evolution. Am. Biol. Teach. 35: 125–129.
EPPLEY, R. A. 1972. Temperature and phytoplankton growth inthe sea. Fish. Bull. 70: 1063–1085.
EPPLEY, R. W., J. N. ROGERS, AND J. J. MCCARTHY. 1969. Half-saturation constants for uptake of nitrate and ammonium bymarine phytoplankton. Limnol. Oceanogr. 14: 912–920,doi:10.4319/lo.1969.14.6.0912
FEELY, R. A., C. L. SABINE, J. M. HERNANDEZ-AYON, D. IANSON,AND B. HALES. 2008. Evidence for upwelling of corrosive‘‘acidified’’ water onto the continental shelf. Science 320:1490–1492, doi:10.1126/science.1155676
FINDLAY, H. S., T. TYRRELL, R. G. J. BELLERBY, A. MERICO, AND I.SKJELVAN. 2008. Carbon and nutrient mixed layer dynamics inthe Norwegian Sea. Biogeosciences 5: 1395–1410, doi:10.5194/bg-5-1395-2008
———, H. L. WOOD, M. A. KENDALL, J. I. SPICER, R. J.TWITCHETT, AND S. WIDDICOMBE. In press. Comparing theimpact of high CO2 on calcium carbonate structures indifferent marine organisms. Mar. Biol. Res.
GATTUSO, J. P., M. PICHON, AND M. FRANKIGNOULLE. 1995.Biological control of air-sea CO2 fluxes: Effect of photosyn-thetic and calcifying marine organisms and ecosystems. Mar.Ecol. Prog. Ser. 129: 307–312, doi:10.3354/meps129307
GEHLEN, M., R. GANGSTØ, B. SCHNEIDER, L. BOPP, O. AUMONT,AND C. ETHE. 2007. The fate of pelagic CaCO3 production in ahigh CO2 ocean: a model study. Biogeosciences 4: 505–519,doi:10.5194/bg-4-505-2007
GOYET, C., R. J. HEALY, AND J. P. RYAN. 2000. Global distributionof total inorganic carbon and total alkalinity below thedeepest winter mixed layer depths. Carbon Dioxide Informa-tion Analysis Center, Oak Ridge National Laboratory, U.S.Department of Energy. ORNL/CDIAC-127, NDP-076.
HEINZE, C. 2004. Simulating oceanic CaCO3 export production inthe greenhouse. Geophys. Res. Lett. 31: L16308, doi:10.1029/2004GL020613
HENDRIKS, I. E., C. M. DUARTE, AND M. ALVAREZ. 2010.Vulnerability of marine biodiversity to ocean acidification:A meta-analysis. Estuar. Coast. Shelf Sci. 86: 157–164,doi:10.1016/j.ecss.2009.11.022
HOFMANN, M., AND H.-J. SCHELLNHUBER. 2009. Oceanic acidifi-cation affects marine carbon pump and triggers extendedmarine oxygen holes. Proc. Nat. Acad. Sci. 106: 3017–3022,doi:10.1073/pnas.0813384106
HOLLIGAN, P. M., AND oTHERS. 1993. A biogeochemical study of thecoccolithophore Emiliania huxleyi in the north Atlantic. GlobalBiogeochem. Cycles 7: 879–900, doi:10.1029/93GB01731
IGLESIAS-RODRIGUEZ, M. D., O. M. SCHOFIELD, J. BATLEY, L. K.MEDLIN, AND P. K. HAYES. 2006. Intraspecific genetic diversityin the marine coccolithophore Emiliania huxleyi (Prymnesio-phyceae): The use of microsatellite analysis in marinephytoplankton population studies. J. Phycol. 42: 526–536,doi:10.1111/j.1529-8817.2006.00231.x
Calcification determinants in Emiliania 1177
———, AND oTHERS. 2002. Representing key phytoplanktonfunctional groups in ocean carbon cycle models: Coccolitho-phorids. Global Biogeochem. Cycles 16: 1100, doi:10.1029/2001GB001454
———, AND ———. 2008. Phytoplankton calcification in a highCO2 world. Science 320: 336–340, doi:10.1126/science.1154122
IPCC. Climate change 2007: The physical science basis, p.749–844. In S. Solomon, D. Qin, M. Manning, Z. Chen, M.Marquis, K. B. Averyt, M. Tignor, and H. L. Miller [eds.],Contribution of working group I to the fourth assessment.Report of the Intergovernmental Panel on Climate Change.Cambridge Univ. Press.
KLAAS, C., AND D. E. ARCHER. 2002. Association of sinkingorganic matter with various types of mineral ballast in thedeep sea: Implications for the rain ratio. Global Biogeochem.Cycles 16: 1116, doi:10.1029/2001GB001765
LANGER, G., G. NEHRKE, I. PROBERT, J. LY, AND P. ZIVERI. 2009.Strain-specific responses of Emiliania huxleyi to changingseawater carbonate chemistry. Biogeosciences 6: 2637–2646,doi:10.5194/bg-6-2637-2009
MEHRBACH, C., C. H. CULBERSON, J. E. HAWLEY, AND R. M.PYTKOWICZ. 1973. Measurements of the apparent dissociationconstants of carbonic acid in seawater at atmosphericpressure. Limnol. Oceanogr. 18: 897–907, doi:10.4319/lo.1973.18.6.0897
MERICO, A., T. TYRRELL, C. W. BROWN, S. B. GROOM, AND P. I.MILLER. 2003. Analysis of satellite imagery for Emilianiahuxleyi blooms in the Bering Sea before 1997. Geophys. Res.Lett. 30: 1337–1340, doi:10.1029/2002GL016648
———, ———, AND T. COKACAR. 2006. Is there any relationshipbetween phytoplankton seasonal dynamics and the carbonatesystem? J. Mar. Sys. 59: 120–142, doi:10.1016/j.jmarsys.2005.11.004
MULLER, M. N., K. G. SCHULZ, AND U. RIEBESELL. 2010. Effects oflong-term high CO2 exposure on two species of coccolithophores.Biogeosciences 7: 1109–1116, doi:10.5194/bg-7-1109-2010
PAASCHE, E. 2002. A review of the coccolithophorid Emilianiahuxleyi (prymnesiophyceae), with particular reference togrowth, coccolith formation, and calcification–photosynthesisinteractions. Phycologia. 40: 503–529, doi:10.2216/i0031-8884-40-6-503.1
PIERROT, D., E. LEWIS, AND D. W. R. WALLACE. 2006. Co2sysDOS program developed for CO2 system calculations.Carbon Dioxide Information Analysis Center, Oak RidgeNational Laboratory, U.S. Department of Energy. ORNL/CDIAC-105.
PISTEVOS, J. C. A., P. CALOSI, S. WIDDICOMBE, AND J. D. D. BISHOP.2011. Will variation among genetic individuals influencespecies response to global climate change? Oikos, doi:10.1111/j.1600-0706.2010.19470.x
PORTNER, H.-O. 2008. Ecosystem effects of ocean acidification intimes of ocean warming: A physiologist’s view. Mar. Ecol.Prog. Ser. 373: 203–217, doi:10.3354/meps07768
RAMANATHAN, V., AND Y. FENG. 2008. On avoiding dangerousanthropogenic interference with the climate system: Formi-dable challenges ahead. Proc. Natl. Acad. Sci. USA. 105:14245–14250, doi:10.1073/pnas.0803838105
RIDGWELL, A., D. N. SCHMIDT, C. TURLEY, C. BROWNLEE, M. T.MALDONADO, P. TORTELL, AND J. R. YOUNG. 2009. Fromlaboratory manipulations to Earth system models: Scalingcalcification impacts of ocean acidification. Biogeosciences 6:2611–2623, doi:10.5194/bg-6-2611-2009
———, I. ZONDERVAN, J. C. HARGREAVES, J. BIJMA, AND T. M.LENTON. 2007. Assessing the potential long-term increase ofoceanic fossil fuel CO2 uptake due to CO2-calcificationfeedback. Biogeosciences 4: 481–492, doi:10.5194/bg-4-481-2007
RIEBESELL, U., I. ZONDERVAN, J. ROST, P. D. TORTELL, R. E. ZEEBE,AND F. M. M. MOREL. 2000. Reduced calcification of marineplankton in response to increased atmospheric CO2. Nature407: 364–367, doi:10.1038/35030078
RIES, J. B., A. L. COHEN, AND D. C. MCCORKLE. 2009. Marinecalcifiers exhibit mixed responses to CO2-induced oceanacidification. Geology 37: 1131–1134, doi:10.1130/G30210A.1
SABINE, C. L., AND oTHERS. 2004. The oceanic sink foranthropogenic CO2. Science 305: 367–371, doi:10.1126/science.1097403
SATOH, M., K. IWAMOTO, I. SUZUKI, AND Y. SHIRAIWA. 2009. Mar.Biotechnol. 11: 327–333, doi:10.1007/s10126-008-9147-0
SCIANDRA, A., J. HARLAY, D. LEFEVRE, R. LEMEE, P. RIMMELIN, M.DENIS, AND J.-P. GATTUSO. 2003. Response of coccolitho-phorid Emiliania huxleyi to elevated partial pressure of CO2
under nitrogen limitation. Mar. Ecol. Prog. Ser. 261: 111–122,doi:10.3354/meps261111
SHESKIN, D. 1997. Handbook of parametric and nonparametricstatistical procedures. CRC.
SHI, D., Y. XU, AND F. M. M. MOREL. 2009. Effects of the pH/pCO2
control method on medium chemistry and phytoplankton growth.Biogeosciences 6: 1199–1207, doi:10.5194/bg-6-1199-2009
SIKES, C. S., AND V. J. FABRY. 1994. Photosynthesis, CaCO3
deposition, coccolithophorids, and the global carbon cycle, p.217–233. In N. E. Tolbert and J. Preiss [eds.], Photosyntheticcarbon metabolism and regulation of atmospheric CO2 andO2. Oxford Univ. Press.
SMYTH, T. J., T. TYRRELL, AND B. TARRANT. 2004. Time series ofcoccolithophore activity in the Barents Sea, from twenty yearsof satellite imagery. Geophys. Res. Lett. 31: L11302,doi:10.1029/2004GL019735
STILLMAN, J. H. 2003. Acclimation capacity underlies susceptibil-ity to climate change. Science 301: 65, doi:10.1126/sci-ence.1083073
TRIANTAPHYLLOU, M., M. DIMIZA, E. KRASAKOPOULOU, E. MAL-
INVERNO, V. LIANOU, AND E. SOUVERMEZOGLOU. 2010. Seasonalvariation in Emiliania huxleyi coccolith morphology andcalcification in the Aegean Sea (Eastern Mediterranean).Geobios 43: 99–110, doi:10.1016/j.geobios.2009.09.002
TYRRELL, T., B. SCHNEIDER, A. CHARALAMPOPOULOU, AND U.RIEBESELL. 2008. Coccolithophores and calcite saturationstate in the Baltic and Black Seas. Biogeosciences 5:485–494, doi:10.5194/bg-5-485-2008
———, AND A. H. TAYLOR. 1995. Latitudinal and seasonalvariations in carbon dioxide and oxygen in the northeastAtlantic, and the effects on Emiliania huxleyi and otherphytoplankton. Global Biogeochem. Cycles 9: 585–604,doi:10.1029/95GB01133
———, AND ———. 1996. A modelling study of Emiliania huxleyiin the NE Atlantic. J. Mar. Sys. 9: 83–112, doi:10.1016/0924-7963(96)00019-X
WESTBROEK, P., AND oTHERS. 1993. A model system approach tobiological climate forcing. The example of Emiliania huxleyi.Global Planet. Change 8: 27–46.
ZONDERVAN, I., R. E. ZEEBE, B. ROST, AND U. RIEBESELL. 2001.Decreasing marine biogenic calcification: A negative feedbackon rising atmospheric pCO2. Global Biogeochem. Cycles 15:507–516, doi:10.1029/2000GB001321
Associate editor: Bo Thamdrup
Received: 04 August 2010Accepted: 21 January 2011
Amended: 01 March 2011
1178 Findlay et al.
Related Documents