Prepared in Cooperation with Bernalillo County Precipitation; Ground-Water Age; Ground- Water Nitrate Concentrations, 1995-2002; and Ground-Water Levels, 2002-03 in Eastern Bernalillo County, New Mexico Scientific Investigations Report 2004-5189 U.S. Department of the Interior U.S. Geological Survey

Welcome message from author
This document is posted to help you gain knowledge. Please leave a comment to let me know what you think about it! Share it to your friends and learn new things together.
Transcript
Blanchard, Paul J.—Precipitation; G
round-Water A
ge; Ground-W
ater Nitrate Concentrations, 1995-2002; and G
round-Water Levels, 2002-03
in Eastern Bernalillo County, N
ew M
exico—Scientific Investigations Report 2004-5189
Prepared in Cooperation with Bernalillo County
Precipitation; Ground-Water Age; Ground-Water Nitrate Concentrations, 1995-2002; and Ground-Water Levels, 2002-03 in Eastern Bernalillo County, New Mexico
Scientific Investigations Report 2004-5189
U.S. Department of the InteriorU.S. Geological Survey
Precipitation; Ground-Water Age; Ground-Water Nitrate Concentrations, 1995-2002; and Ground-Water Levels, 2002-03 in Eastern Bernalillo County, New Mexico
By Paul J. Blanchard
Prepared in cooperation with Bernalillo County
Scientific Investigations Report 2004-5189
U.S. Department of the InteriorU.S. Geological Survey
U.S. Department of the Interior Gale A. Norton, Secretary
U.S. Geological SurveyCharles G. Groat, Director
U.S. Geological Survey, Reston, Virginia: 2004
For sale by U.S. Geological Survey, Information ServicesBox 25286, Denver Federal CenterDenver, CO 80225
For more information about the USGS and its products:Telephone: 1-888-ASK-USGSWorld Wide Web: http://www.usgs.gov/
Any use of trade, product, or firm names in this publication is for descriptive purposes only and does not imply endorsement by the U.S. Government.
Although this report is in the public domain, permission must be secured from the individual copyright owners toreproduce any copyrighted materials contained within this report.
iii
Contents
Abstract . . . . . . . . . . . . . . . . . . . . . . . . . . . . . . . . . . . . . . . . . . . . . . . . . . . . . . . . . . . . . . . . . . . . . . . . . . . . . . . . . . . . . . . . . . . . . . . . . . . . 1
Introduction . . . . . . . . . . . . . . . . . . . . . . . . . . . . . . . . . . . . . . . . . . . . . . . . . . . . . . . . . . . . . . . . . . . . . . . . . . . . . . . . . . . . . . . . . . . . . . . . . 1
Purpose and Scope . . . . . . . . . . . . . . . . . . . . . . . . . . . . . . . . . . . . . . . . . . . . . . . . . . . . . . . . . . . . . . . . . . . . . . . . . . . . . . . . . . . 1
Description of the Study Area . . . . . . . . . . . . . . . . . . . . . . . . . . . . . . . . . . . . . . . . . . . . . . . . . . . . . . . . . . . . . . . . . . . . . . . . . 2
Acknowledgments . . . . . . . . . . . . . . . . . . . . . . . . . . . . . . . . . . . . . . . . . . . . . . . . . . . . . . . . . . . . . . . . . . . . . . . . . . . . . . . . . . . 2
Precipitation . . . . . . . . . . . . . . . . . . . . . . . . . . . . . . . . . . . . . . . . . . . . . . . . . . . . . . . . . . . . . . . . . . . . . . . . . . . . . . . . . . . . . . . . . . . . . . . . 2
Precipitation at National Oceanic and Atmospheric Administration Sites . . . . . . . . . . . . . . . . . . . . . . . . . . . . . . 2
Snowfall at National Oceanic and Atmospheric Administration Sites . . . . . . . . . . . . . . . . . . . . . . . . . . . . . . . . . . 6
Precipitation at U.S. Geological Survey Sites . . . . . . . . . . . . . . . . . . . . . . . . . . . . . . . . . . . . . . . . . . . . . . . . . . . . . . . . . . 6
Ground-Water Age . . . . . . . . . . . . . . . . . . . . . . . . . . . . . . . . . . . . . . . . . . . . . . . . . . . . . . . . . . . . . . . . . . . . . . . . . . . . . . . . . . . . . . . . 17
Dissolved Nitrate Concentrations, 1995-2002 . . . . . . . . . . . . . . . . . . . . . . . . . . . . . . . . . . . . . . . . . . . . . . . . . . . . . . . . . . . . . . . 17
Ground-Water-Level Changes, 2002-03 . . . . . . . . . . . . . . . . . . . . . . . . . . . . . . . . . . . . . . . . . . . . . . . . . . . . . . . . . . . . . . . . . . . . 19
Summary . . . . . . . . . . . . . . . . . . . . . . . . . . . . . . . . . . . . . . . . . . . . . . . . . . . . . . . . . . . . . . . . . . . . . . . . . . . . . . . . . . . . . . . . . . . . . . . . . . 23
References . . . . . . . . . . . . . . . . . . . . . . . . . . . . . . . . . . . . . . . . . . . . . . . . . . . . . . . . . . . . . . . . . . . . . . . . . . . . . . . . . . . . . . . . . . . . . . . . 24
Supplemental Data . . . . . . . . . . . . . . . . . . . . . . . . . . . . . . . . . . . . . . . . . . . . . . . . . . . . . . . . . . . . . . . . . . . . . . . . . . . . . . . . . . . . . . . . . 25
Figures
1-3. Maps showing— 1. Location of study area and data-collection sites, eastern Bernalillo County, New Mexico . . . . .32. Geologic terranes in eastern Bernalillo County, New Mexico . . . . . . . . . . . . . . . . . . . . . . . . . . . . . . . . .43. Approximate ground-water divide and general direction of ground-water flow in
eastern Bernalillo County, New Mexico. . . . . . . . . . . . . . . . . . . . . . . . . . . . . . . . . . . . . . . . . . . . . . . . . . . . . . .54-8. Graphs showing—
4. Average monthly precipitation at Sandia Crest, Sandia Park, and Sandia Ranger Station, periods of record . . . . . . . . . . . . . . . . . . . . . . . . . . . . . . . . . . . . . . . . . . . . . . . . . . . . . . . . . . . . . . . . . . . . . . . . . . . . .9
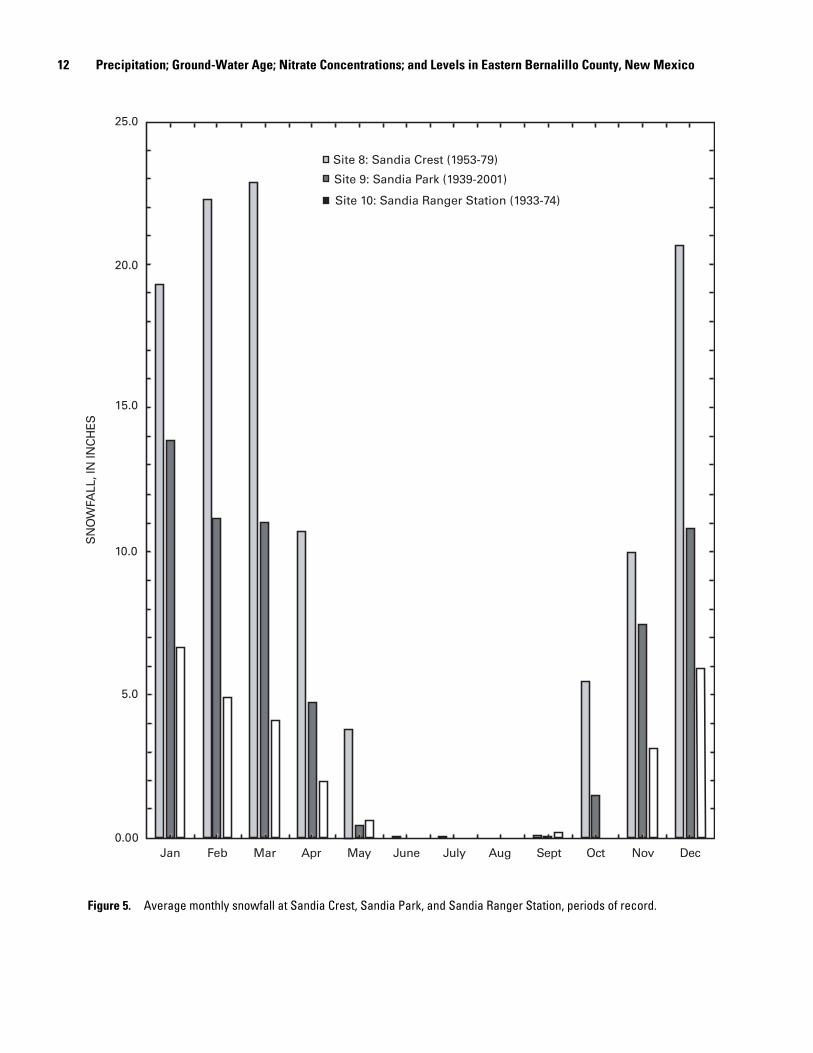
5. Average monthly snowfall at Sandia Crest, Sandia Park, and Sandia Ranger Station, periods of record . . . . . . . . . . . . . . . . . . . . . . . . . . . . . . . . . . . . . . . . . . . . . . . . . . . . . . . . . . . . . . . . . . . . . . . . . . . 12
6. Average monthly precipitation at site 8, Sandia Crest, 1953-79, and monthly precipitation at site 1, Sandia Mountains high altitude, 2001-03 . . . . . . . . . . . . . . . . . . . . . . . . . . . . . . . . . . . . . . . . . . . 13
7. Average monthly precipitation at site 9, Sandia Park, 1939-2001, and monthly precipitation at site 3, Sandia Mountains low altitude, 2001-03 . . . . . . . . . . . . . . . . . . . . . . . . . . . . . . . . . . . . . . . . . . . . 14
8. Average monthly precipitation at site 10, Sandia Ranger Station, 1933-74, and monthly precipitation at site 7, Tijeras, New Mexico, 2001-03. . . . . . . . . . . . . . . . . . . . . . . . . . . . . . . . . . . . . . . . . 15
9-11. Maps showing—9. Estimated age of ground water in selected monitoring wells and spring as determined
by concentrations of chlorofluorocarbons . . . . . . . . . . . . . . . . . . . . . . . . . . . . . . . . . . . . . . . . . . . . . . . . . . 1810. Change in dissolved nitrate concentrations in selected monitoring wells, 1995-98 to
2001-02. . . . . . . . . . . . . . . . . . . . . . . . . . . . . . . . . . . . . . . . . . . . . . . . . . . . . . . . . . . . . . . . . . . . . . . . . . . . . . . . . . . . . 2011. Change in ground-water levels in selected monitoring wells, 2002-03. . . . . . . . . . . . . . . . . . . . . . . . 22
iv
Tables
1. Precipitation sites in the eastern Bernalillo County study area. . . . . . . . . . . . . . . . . . . . . . . . . . . . . . . . . . . . . . .6 2. Monthly and annual precipitation, in inches, at National Oceanic and Atmospheric
Administration precipitation stations, periods of record . . . . . . . . . . . . . . . . . . . . . . . . . . . . . . . . . . . . . . . . . . . . .7 3. Monthly and annual precipitation, in inches, at National Oceanic and Atmospheric
Administration precipitation stations, 1954-74 . . . . . . . . . . . . . . . . . . . . . . . . . . . . . . . . . . . . . . . . . . . . . . . . . . . . . . .8 4. Monthly and annual snowfall, in inches, at National Oceanic and Atmospheric
Administration precipitation stations, periods of record . . . . . . . . . . . . . . . . . . . . . . . . . . . . . . . . . . . . . . . . . . . 10 5. Monthly and annual snowfall, in inches, at National Oceanic and Atmospheric
Administration precipitation stations, 1954-74 . . . . . . . . . . . . . . . . . . . . . . . . . . . . . . . . . . . . . . . . . . . . . . . . . . . . . 11 6. Comparison of average monthly and annual precipitation at National Oceanic and
Atmospheric Administration precipitation sites and monthly and annual precipitation at U.S. Geological Survey and volunteer precipitation sites. . . . . . . . . . . . . . . . . . . . . . . . . . . . . . . . . . . . . . . . 16
7. Estimated ground-water age determined by concentrations of chlorofluorocarbons . . . . . . . . . . . . . . 19 8. Nitrate concentrations in monitoring wells, 1995-2002, and change, 2001-02, from most
recent 1995-98 concentration. . . . . . . . . . . . . . . . . . . . . . . . . . . . . . . . . . . . . . . . . . . . . . . . . . . . . . . . . . . . . . . . . . . . . 21 9. Ground-water-level changes in selected monitoring wells, 2002-03 . . . . . . . . . . . . . . . . . . . . . . . . . . . . . . . 23
10. Monthly and annual precipitation at U.S. Geological Survey and volunteer precipitation sites, 2001-03. . . . . . . . . . . . . . . . . . . . . . . . . . . . . . . . . . . . . . . . . . . . . . . . . . . . . . . . . . . . . . . . . . . . . . . . . . . . . . . . . . . . . . . . . . . 26
11. Precipitation at Sandia Crest, in inches, 1953-79. . . . . . . . . . . . . . . . . . . . . . . . . . . . . . . . . . . . . . . . . . . . . . . . . . . 27 12. Precipitation at Sandia Park, in inches, 1939-2001 . . . . . . . . . . . . . . . . . . . . . . . . . . . . . . . . . . . . . . . . . . . . . . . . . 28 13. Precipitation at the Sandia Ranger Station, in inches, 1933-74 . . . . . . . . . . . . . . . . . . . . . . . . . . . . . . . . . . . . . 30 14. Snowfall at Sandia Crest, in inches, 1953-79. . . . . . . . . . . . . . . . . . . . . . . . . . . . . . . . . . . . . . . . . . . . . . . . . . . . . . . 32 15. Snowfall at Sandia Park, in inches, 1939-2001 . . . . . . . . . . . . . . . . . . . . . . . . . . . . . . . . . . . . . . . . . . . . . . . . . . . . . 33 16. Snowfall at the Sandia Ranger Station, in inches, 1933-74 . . . . . . . . . . . . . . . . . . . . . . . . . . . . . . . . . . . . . . . . . 35
Conversion Factors and Vertical Datum
Multiply By To obtain
Length
inch (in.) 2.54 centimeter (cm)
foot (ft) 0.3048 meter (m)
mile (mi) 1.609 kilometer (km)
Area
square mile (mi2) 2.590 square kilometer (km2)
Vertical coordinate information is referenced to the North American Vertical Datum of 1988 (NAVD 88).
Altitude, as used in this report, refers to distance above or below the National Geodetic Vertical Datum of 1929 (NGVD 29).
Concentrations of chemical constituents in water are given in milligrams per liter (mg/L).
Precipitation; Ground-Water Age; Ground-Water Nitrate Concentrations, 1995-2002; and Ground-Water Levels, 2002-03 in Eastern Bernalillo County, New Mexico
By Paul J. Blanchard
Abstract
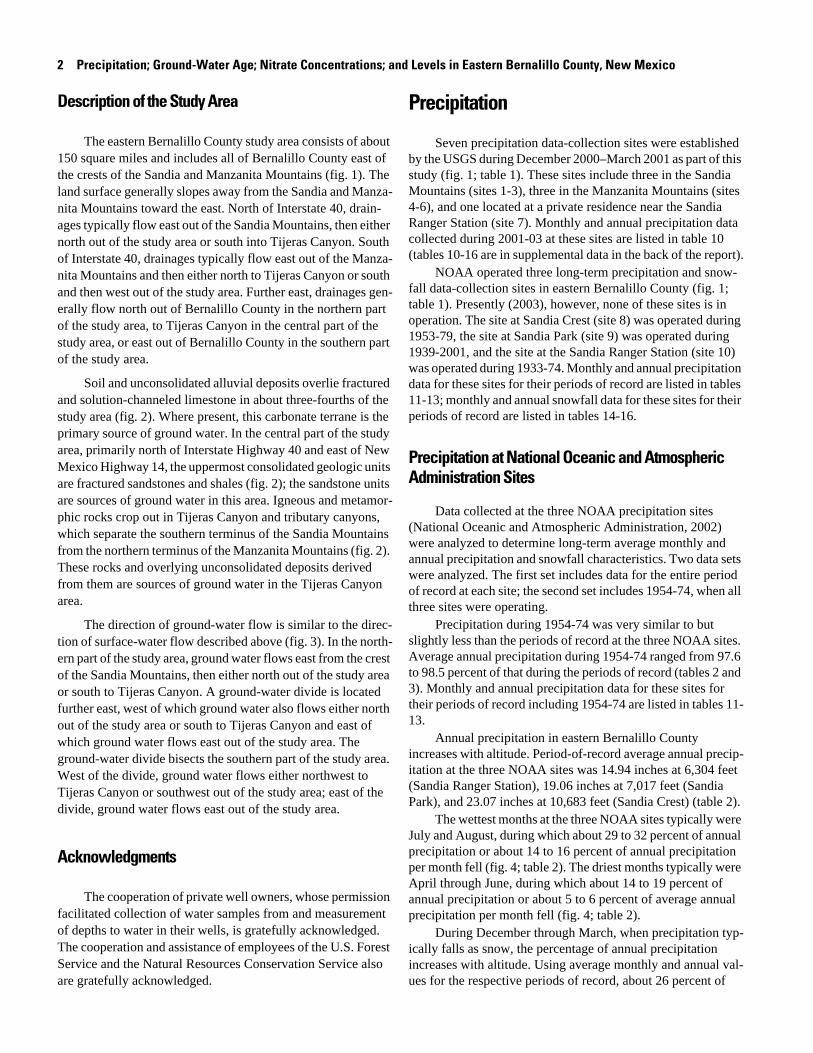
The eastern Bernalillo County study area consists of about 150 square miles and includes all of Bernalillo County east of the crests of the Sandia and Manzanita Mountains. Soil and unconsolidated alluvial deposits overlie fractured and solution-channeled limestone in most of the study area. North of Interstate Highway 40 and east of New Mexico Highway 14, the uppermost consolidated geologic units are fractured sandstones and shales. Average annual precipitation at three long-term National Oceanic and Atmospheric Administration precipitation and snowfall data-collection sites was 14.94 inches at approximately 6,300 feet (Sandia Ranger Station), 19.06 inches at about 7,020 feet (Sandia Park), and 23.07 inches at approximately 10,680 feet (Sandia Crest). The periods of record at these sites are 1933-74, 1939-2001, and 1953-79, respectively. Average annual snowfall during these same periods of record was 27.7 inches at Sandia Ranger Station, 60.8 inches at Sandia Park, and 115.5 inches at Sandia Crest. Seven precipitation data-collection sites were established during December 2000– March 2001. Precipitation during 2001-03 at three U.S. Geological Survey sites ranged from 66 to 94 percent of period-of-record average annual precipitation at corresponding National Oceanic and Atmospheric Administration long-term sites in 2001, from 51 to 75 percent in 2002, and from 34 to 81 percent during January through September 2003. Missing precipitation records for one site resulted in the 34-percent value in 2003. Analyses of concentrations of chlorofluorocarbons CFC-11, CFC-12, and CFC-113 in ground-water samples from nine wells and one spring were used to estimate when the sampled water entered the ground-water system. Apparent ages of ground water ranged from as young as about 10 to 16 years to as old as about 20 to 26 years. Concentrations of dissolved nitrates in samples collected from 24 wells during 2001-02 were similar to concentrations in samples collected from the same wells during 1995, 1997, and (or) 1998. Nitrate concentrations in two wells were larger than the U.S. Environmental Protection Agency primary drinking-water regulation of 10 milligrams per liter in 1998 and in 2001. Ground-water levels were measured during June and July 2002 and during June, July, and August 2003 in 18 monitoring wells. The median change in water level for all 18 wells was a decline of 2.03 feet.
Introduction
Unincorporated areas of eastern Bernalillo County, New Mexico, have undergone rapid development and population increases in recent years, and the demand for water and the potential for contamination of ground water have increased accordingly. Ground water is the source of domestic supply throughout the area, and water for most homes is supplied by individual domestic wells or by small community water systems. Most homes use septic systems for the disposal of wastewater. Concentrations of nitrate, measured as nitrate plus nitrite, have routinely exceeded the U.S. Environmental Protection Agency (USEPA) primary drinking-water regulation of 10 milligrams per liter (mg/L) at certain wells (U.S. Environmental Protection Agency, 2002).
For Bernalillo County to effectively manage and protect ground-water resources in the eastern Bernalillo County area, the U.S. Geological Survey (USGS) and Bernalillo County have been cooperatively conducting ongoing ground-water investigations in eastern Bernalillo County since 1990. This report was prepared in cooperation with Bernalillo County.
Purpose and Scope
This report presents interpretations of historical precipitation data and precipitation data collected during 2001-03, estimated ground-water age data collected during 2003, nitrate concentration changes from 1995-98 to 2002, and ground-water-level changes from 2002 to 2003. Precipitation data collected at three sites by the National Oceanic and Atmospheric Administration (NOAA) were summarized and additional precipitation data were collected during 2001-03 at seven sites established by the USGS. Ground-water ages were estimated by analysis of chlorofluorocarbon concentrations in samples collected from nine wells and one spring during 2002-03. Nitrate concentrations in samples collected from 24 wells during 2001-02 (Blanchard, 2003) were compared with concentrations in samples collected from the same wells during 1995-98 (Rankin, 2000). Ground-water levels measured in 18 wells during the summer of 2003 were compared to levels measured in the same wells during the summer of 2002 (Blanchard, 2003).
2 Precipitation; Ground-Water Age; Nitrate Concentrations; and Levels in Eastern Bernalillo County, New Mexico
Description of the Study Area
The eastern Bernalillo County study area consists of about 150 square miles and includes all of Bernalillo County east of the crests of the Sandia and Manzanita Mountains (fig. 1). The land surface generally slopes away from the Sandia and Manzanita Mountains toward the east. North of Interstate 40, drainages typically flow east out of the Sandia Mountains, then either north out of the study area or south into Tijeras Canyon. South of Interstate 40, drainages typically flow east out of the Manzanita Mountains and then either north to Tijeras Canyon or south and then west out of the study area. Further east, drainages generally flow north out of Bernalillo County in the northern part of the study area, to Tijeras Canyon in the central part of the study area, or east out of Bernalillo County in the southern part of the study area.
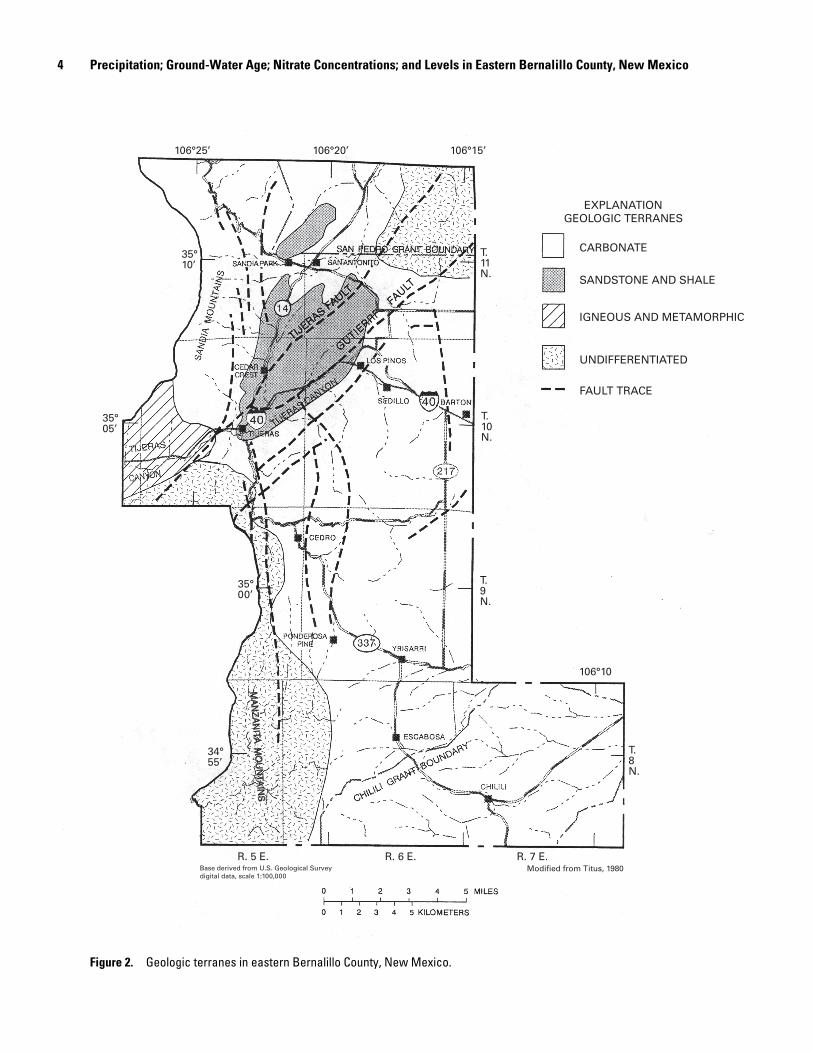
Soil and unconsolidated alluvial deposits overlie fractured and solution-channeled limestone in about three-fourths of the study area (fig. 2). Where present, this carbonate terrane is the primary source of ground water. In the central part of the study area, primarily north of Interstate Highway 40 and east of New Mexico Highway 14, the uppermost consolidated geologic units are fractured sandstones and shales (fig. 2); the sandstone units are sources of ground water in this area. Igneous and metamorphic rocks crop out in Tijeras Canyon and tributary canyons, which separate the southern terminus of the Sandia Mountains from the northern terminus of the Manzanita Mountains (fig. 2). These rocks and overlying unconsolidated deposits derived from them are sources of ground water in the Tijeras Canyon area.
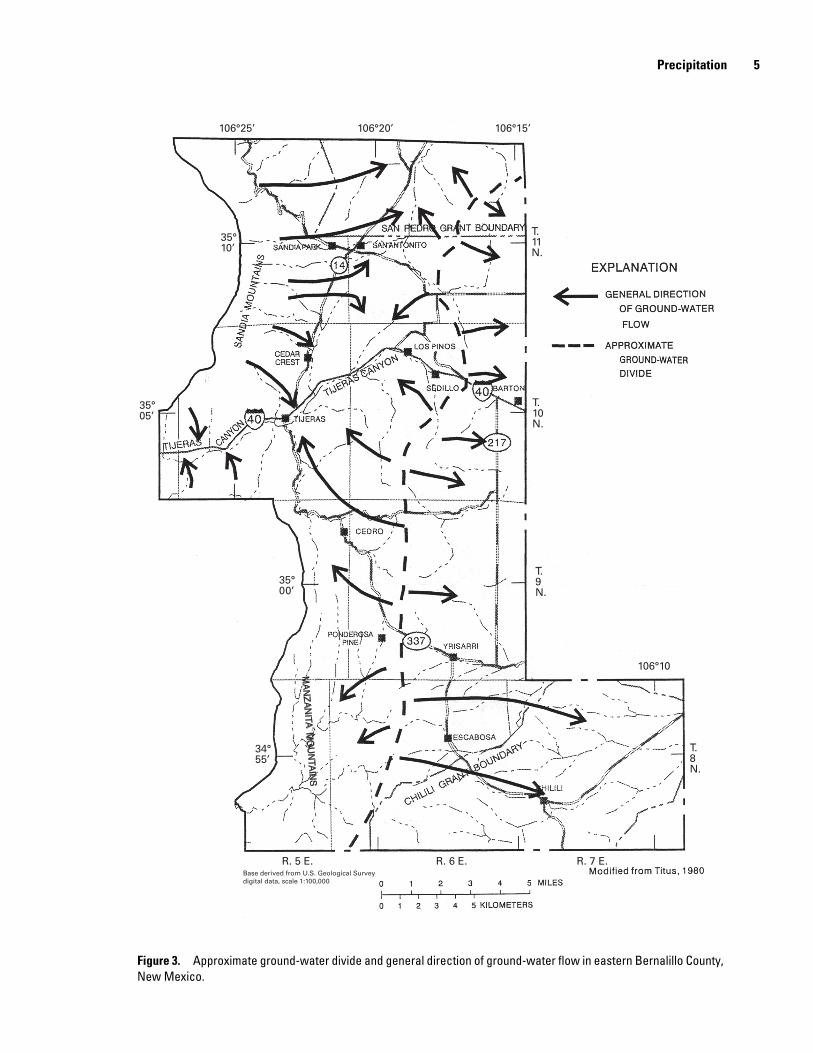
The direction of ground-water flow is similar to the direction of surface-water flow described above (fig. 3). In the northern part of the study area, ground water flows east from the crest of the Sandia Mountains, then either north out of the study area or south to Tijeras Canyon. A ground-water divide is located further east, west of which ground water also flows either north out of the study area or south to Tijeras Canyon and east of which ground water flows east out of the study area. The ground-water divide bisects the southern part of the study area. West of the divide, ground water flows either northwest to Tijeras Canyon or southwest out of the study area; east of the divide, ground water flows east out of the study area.
Acknowledgments
The cooperation of private well owners, whose permission facilitated collection of water samples from and measurement of depths to water in their wells, is gratefully acknowledged. The cooperation and assistance of employees of the U.S. Forest Service and the Natural Resources Conservation Service also are gratefully acknowledged.
Precipitation
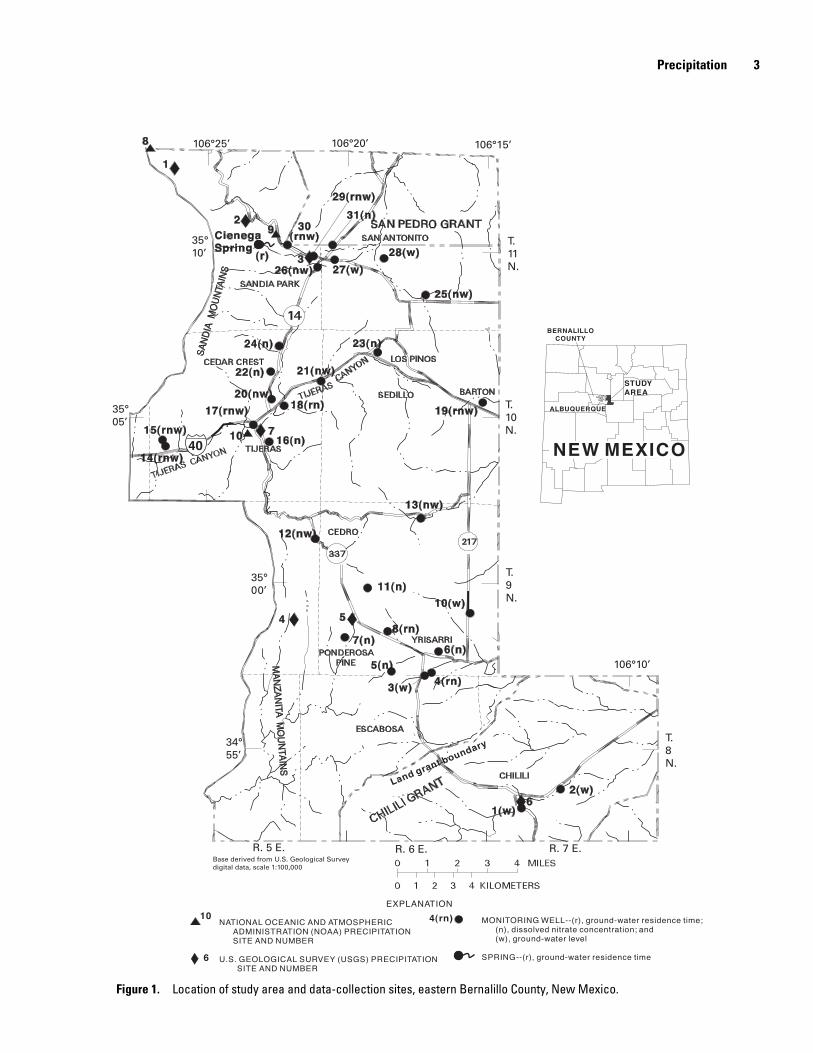
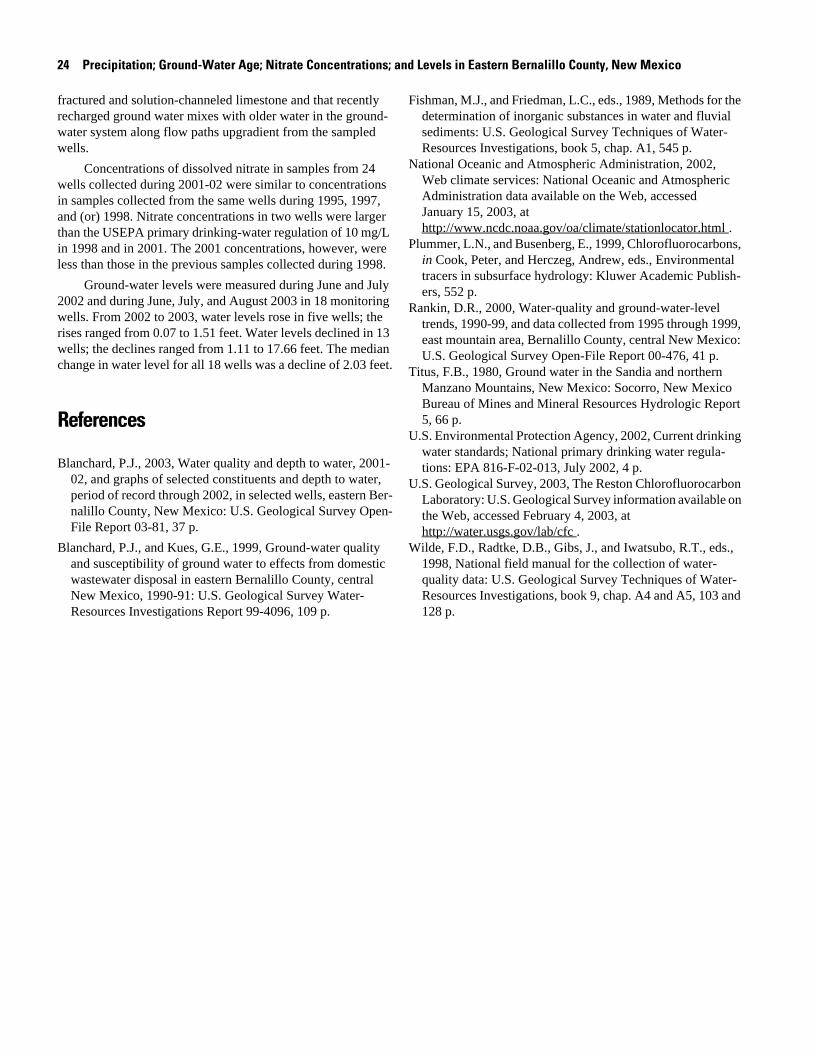
Seven precipitation data-collection sites were established by the USGS during December 2000–March 2001 as part of this study (fig. 1; table 1). These sites include three in the Sandia Mountains (sites 1-3), three in the Manzanita Mountains (sites 4-6), and one located at a private residence near the Sandia Ranger Station (site 7). Monthly and annual precipitation data collected during 2001-03 at these sites are listed in table 10 (tables 10-16 are in supplemental data in the back of the report).
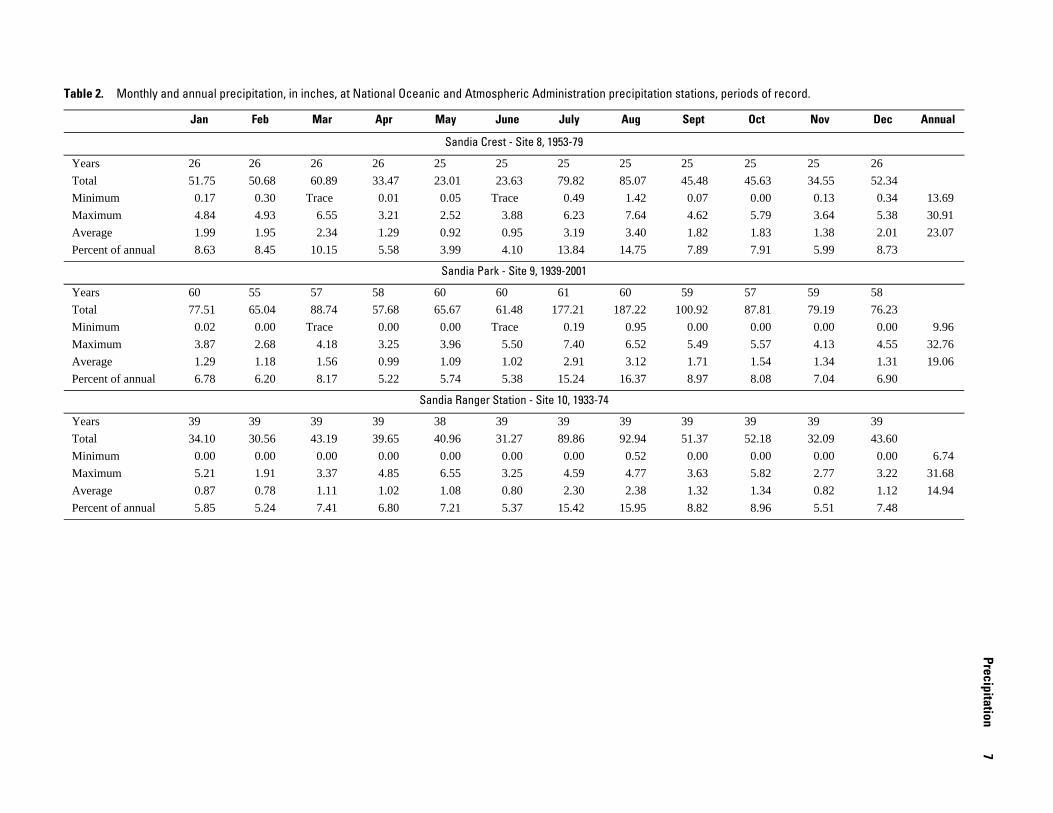
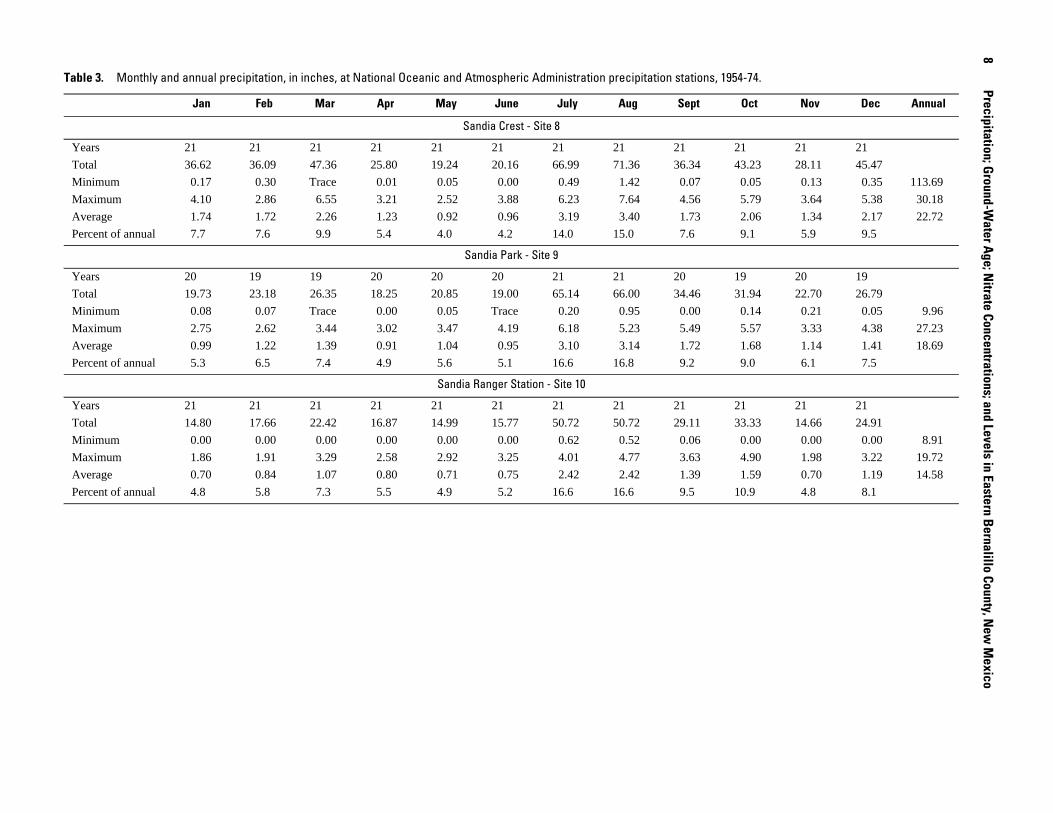
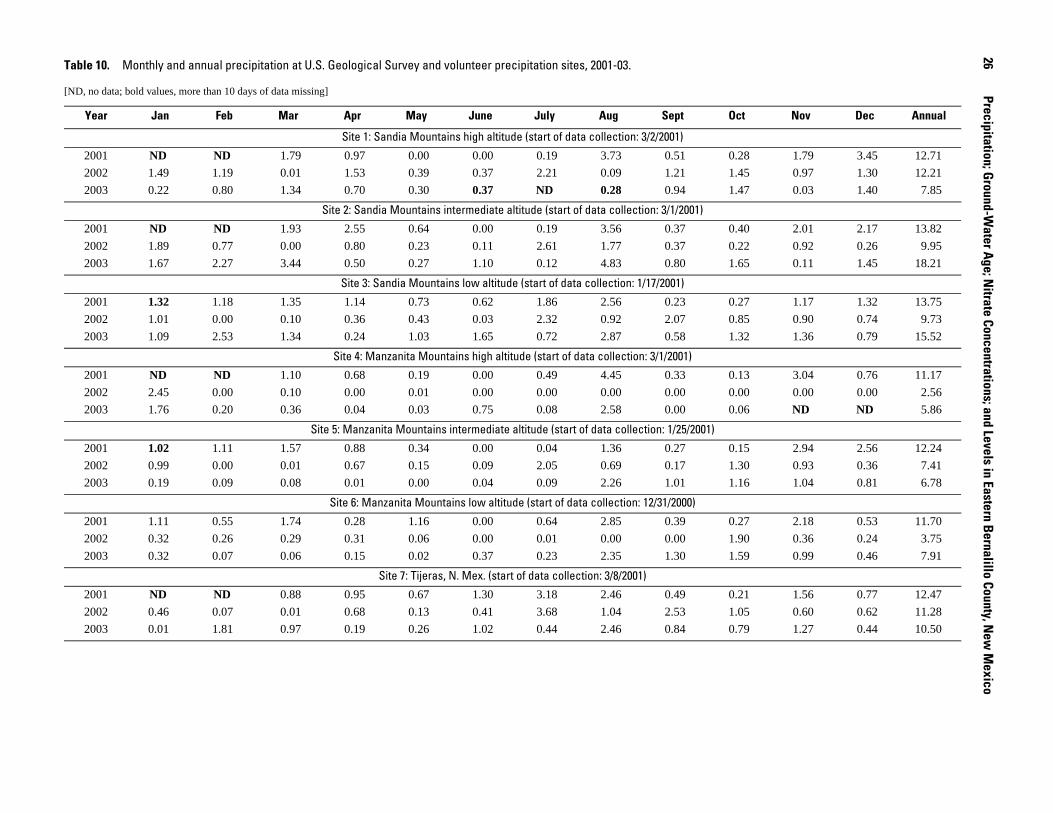
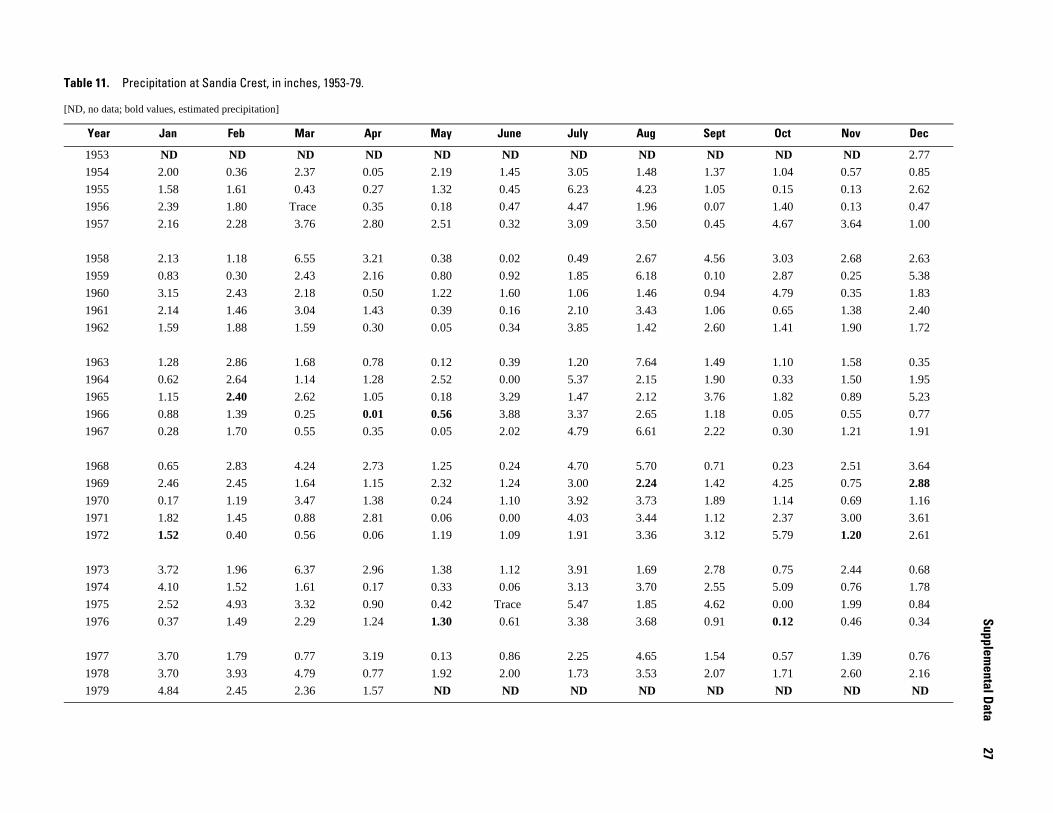
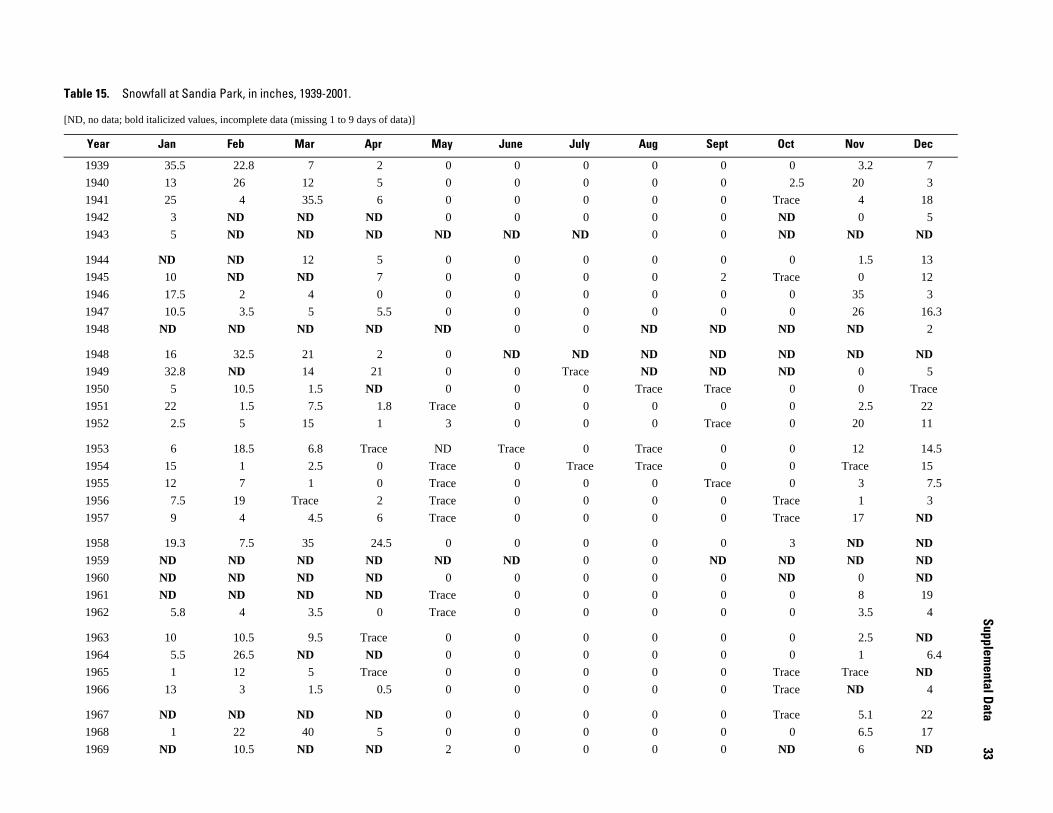
NOAA operated three long-term precipitation and snowfall data-collection sites in eastern Bernalillo County (fig. 1; table 1). Presently (2003), however, none of these sites is in operation. The site at Sandia Crest (site 8) was operated during 1953-79, the site at Sandia Park (site 9) was operated during 1939-2001, and the site at the Sandia Ranger Station (site 10) was operated during 1933-74. Monthly and annual precipitation data for these sites for their periods of record are listed in tables 11-13; monthly and annual snowfall data for these sites for their periods of record are listed in tables 14-16.
Precipitation at National Oceanic and Atmospheric Administration Sites
Data collected at the three NOAA precipitation sites (National Oceanic and Atmospheric Administration, 2002) were analyzed to determine long-term average monthly and annual precipitation and snowfall characteristics. Two data sets were analyzed. The first set includes data for the entire period of record at each site; the second set includes 1954-74, when all three sites were operating.
Precipitation during 1954-74 was very similar to but slightly less than the periods of record at the three NOAA sites. Average annual precipitation during 1954-74 ranged from 97.6 to 98.5 percent of that during the periods of record (tables 2 and 3). Monthly and annual precipitation data for these sites for their periods of record including 1954-74 are listed in tables 1113.
Annual precipitation in eastern Bernalillo County increases with altitude. Period-of-record average annual precipitation at the three NOAA sites was 14.94 inches at 6,304 feet (Sandia Ranger Station), 19.06 inches at 7,017 feet (Sandia Park), and 23.07 inches at 10,683 feet (Sandia Crest) (table 2).
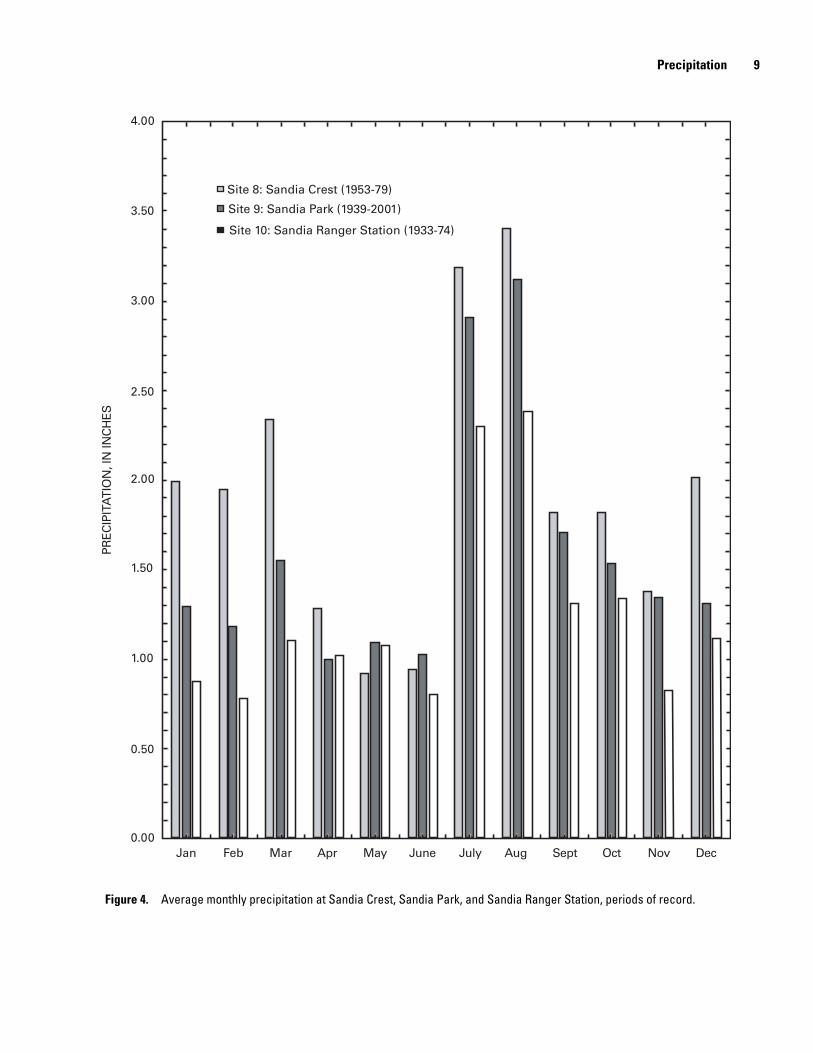
The wettest months at the three NOAA sites typically were July and August, during which about 29 to 32 percent of annual precipitation or about 14 to 16 percent of annual precipitation per month fell (fig. 4; table 2). The driest months typically were April through June, during which about 14 to 19 percent of annual precipitation or about 5 to 6 percent of average annual precipitation per month fell (fig. 4; table 2).
During December through March, when precipitation typically falls as snow, the percentage of annual precipitation increases with altitude. Using average monthly and annual values for the respective periods of record, about 26 percent of
Precipitation 3
Figure 1. Location of study area and data-collection sites, eastern Bernalillo County, New Mexico.
4 Precipitation; Ground-Water Age; Nitrate Concentrations; and Levels in Eastern Bernalillo County, New Mexico
Figure 2. Geologic terranes in eastern Bernalillo County, New Mexico.
5 Precipitation
Figure 3. Approximate ground-water divide and general direction of ground-water flow in eastern Bernalillo County, New Mexico.
6 Precipitation; Ground-Water Age; Nitrate Concentrations; and Levels in Eastern Bernalillo County, New Mexico
Table 1. Precipitation sites in the eastern Bernalillo County study area.
[Identification number: for sites 1-7, first 13 digits are the latitude and longitude of the site, and last two digits are the sequence number of that site's latitude and longitude; for sites 8-10, number assigned by National Oceanic and Atmospheric Administration (NOAA) or U.S. Geological Survey (USGS). USFS, U.S. Forest Service; altitude in feet above NGVD29]
Site number (fig. 1)
Identification number
Responsible agency General location
Altitude (feet) Period of record
1 351228106261130 USGS Sandia Mountains high altitude 10,030 03/02/2001 - present
2 351054106233330 USGS Sandia Mountains intermediate altitude 8,020 03/01/2001 - present
3 350948106212630 USGS Sandia Mountains low altitude 7,030 01/17/2001 - present
4 345848106214730 USGS Manzanito Mountains high altitude 7,550 03/01/2001 - 10/031
5 345853106195130 USGS Manzanito Mountains intermediate altitude 7,460 01/25/2001 - present
6 345318106135430 USGS Manzanito Mountains low altitude 6,780 12/29/2000 - present
7 350434106230501 USGS Tijeras, N. Mex. 6,350 03/08/2001 - present
8 298011 NOAA Sandia Crest, N. Mex. 10,683 11/01/1953 - 04/30/1979
9 298015 NOAA Sandia Park, N. Mex. 7,017 01/01/1939 - 11/30/2001
10 298018 NOAA USFS Sandia Ranger Station, N. Mex. 6,304 01/01/1933 - 12/31/1974 1Site 4 was vandalized and rendered inoperable on an unknown date in October 2003.
annual precipitation falls during these months at Sandia Ranger Station (altitude 6,304 feet), about 28 percent falls during these months at Sandia Park (altitude 7,017 feet), and about 36 percent falls during these months at Sandia Crest (altitude 10,683 feet) (fig. 4; table 2).
Snowfall at National Oceanic and Atmospheric Administration Sites
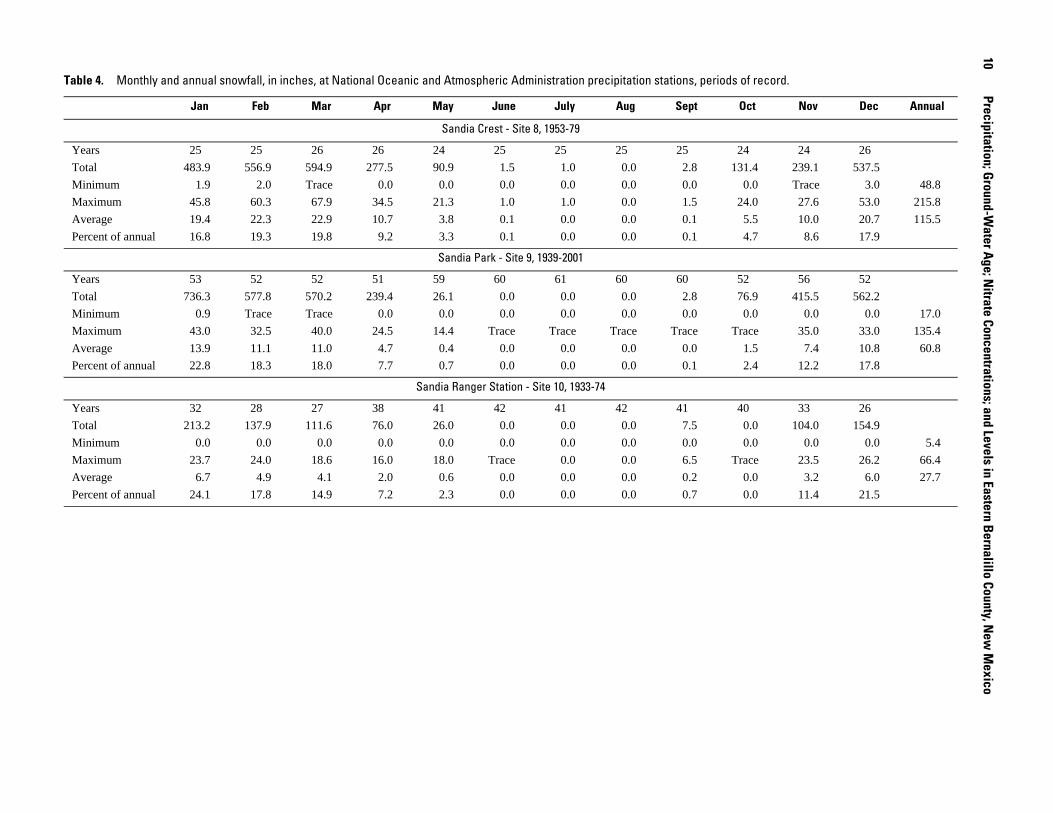
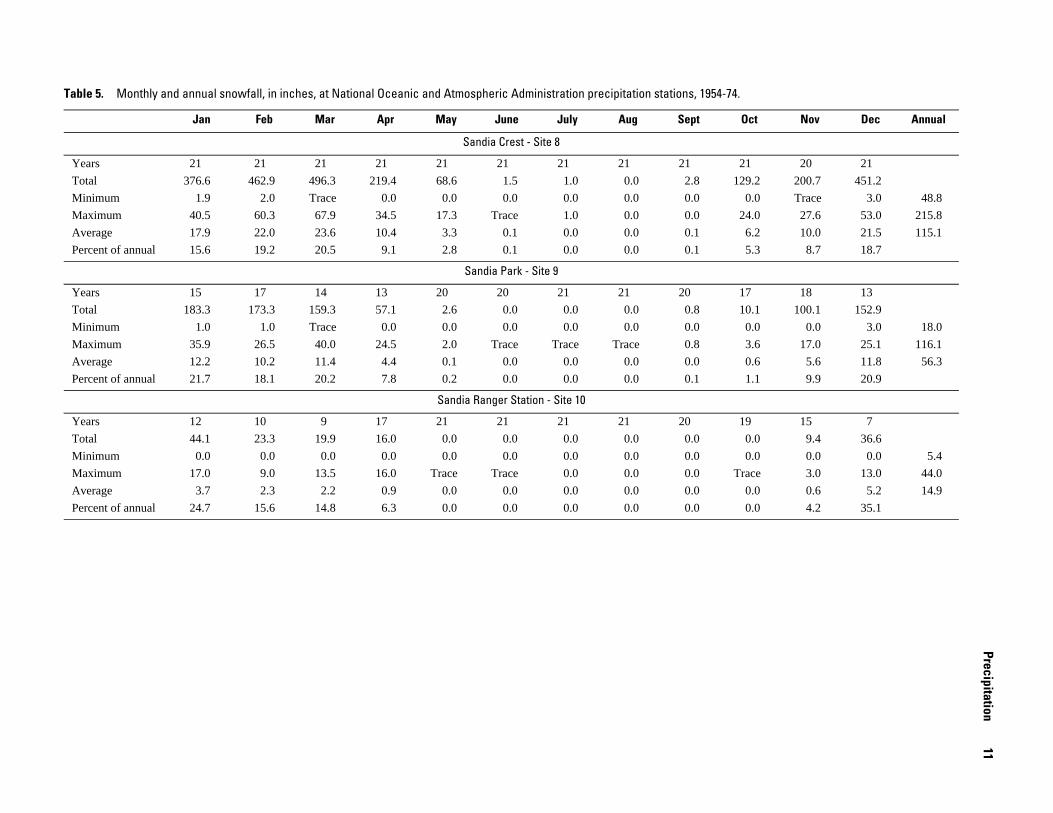
The 1954-74 average annual snowfall ranged from about one-half the period-of-record average annual snowfall at Sandia Ranger Station, to slightly less than the period-of-record average annual snowfall at Sandia Park, to about the same as the period-of-record average annual snowfall at Sandia Crest (tables 4 and 5). The 1954-74 average annual snowfall was about 54 percent of the period-of-record average annual snowfall at the Sandia Ranger Station, about 93 percent of that at Sandia Park, and more than 99 percent of that at Sandia Crest. Monthly and annual snowfall data at these sites for their periods of record including 1954-74 are listed in tables 14-16.
Annual snowfall in eastern Bernalillo County increases with altitude. Period-of-record average annual snowfall at the three NOAA sites was 27.7 inches at 6,304 feet (Sandia Ranger Station), 60.8 inches at 7,017 feet (Sandia Park), and 115.5 inches at 10,683 feet (Sandia Crest) (table 4).
Snow can fall in the Sandia Mountains during nearly any time of the year (fig. 5; table 4). At least a trace of snowfall has been recorded in every month of the year except July and August at Sandia Ranger Station, in every month of the year at Sandia Park, and in every month of the year except August at Sandia Crest. About 74 to 78 percent of annual snow, however, falls during December through March at the three sites.
Precipitation at U.S. Geological Survey Sites
In the Sandia and Manzanita Mountains, high-altitude (sites 1 and 4), intermediate-altitude (sites 2 and 5), and low-altitude (sites 3, 6, and 7) precipitation data-collection sites were established (fig. 1; table 1). The differences in altitude between the high- and low-altitude sites are about 3,000 feet in the Sandia Mountains and about 1,200 feet in the Manzanita Mountains. The NOAA long-term precipitation sites at Sandia Crest (site 8), Sandia Park (site 9), and the Sandia Ranger Station (site 10) correspond closely in location and altitude with USGS sites 1, 3, and 7, respectively (fig. 1; table 1).
Precipitation at USGS sites 1-6 was measured continually at 1-hour intervals using a tipping-bucket rain gage connected to a data recorder. During winter months, a precipitation adapter was added to accommodate snowfall collection. Precipitation data were downloaded onsite from the data recorder to a laptop computer and then processed in the office. Precipitation at USGS site 7 was measured once per day using a 4-inch-diame-ter cylindrical rain gage with an inner cylinder graduated at 0.01-inch intervals. Data collected at sites 1-7 are stored in the USGS National Water Information System (NWIS) database.
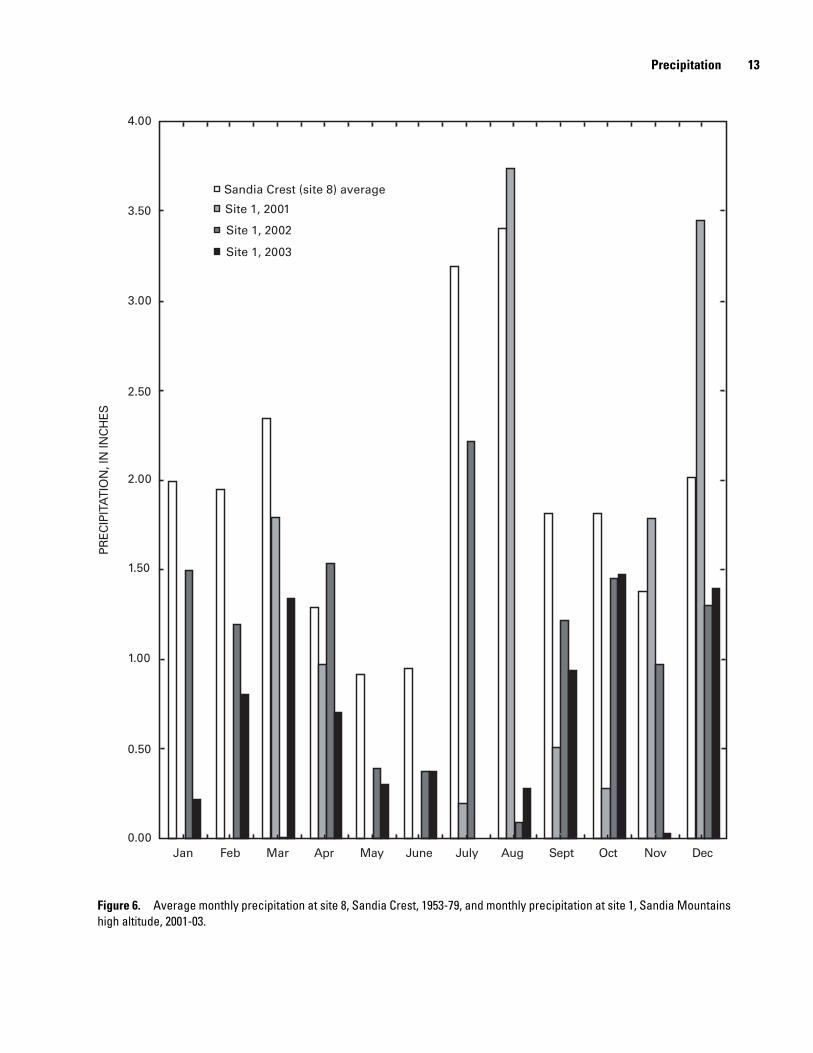
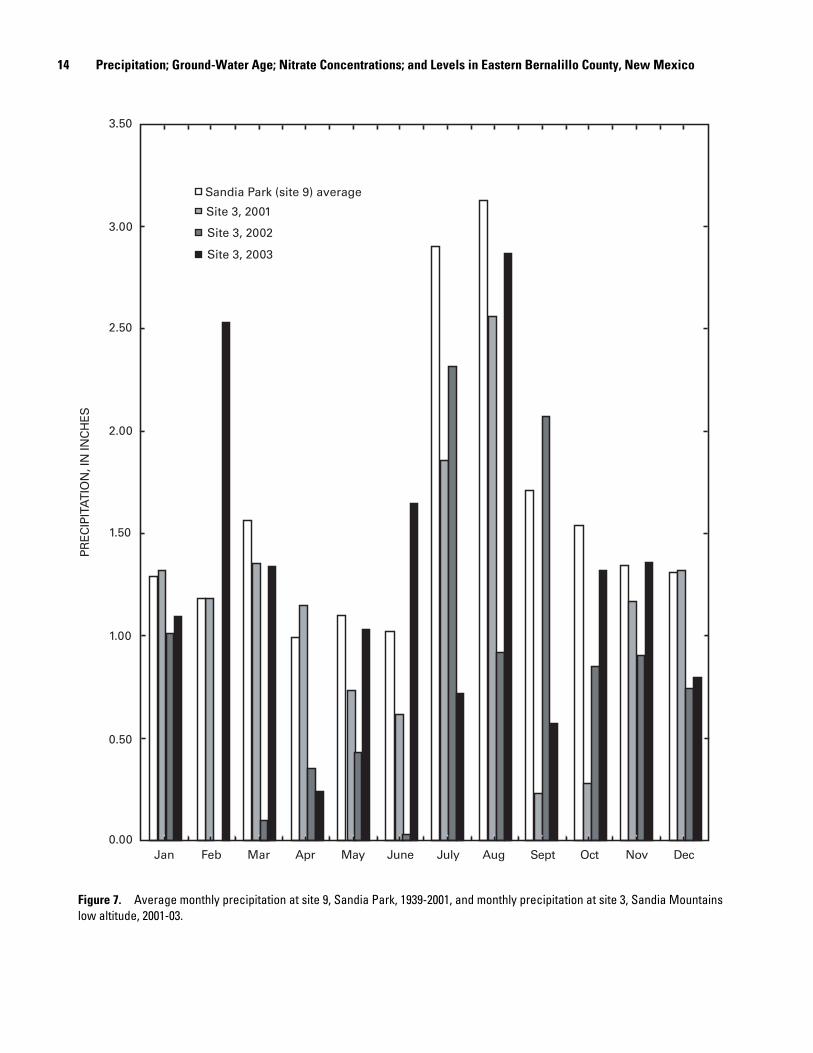
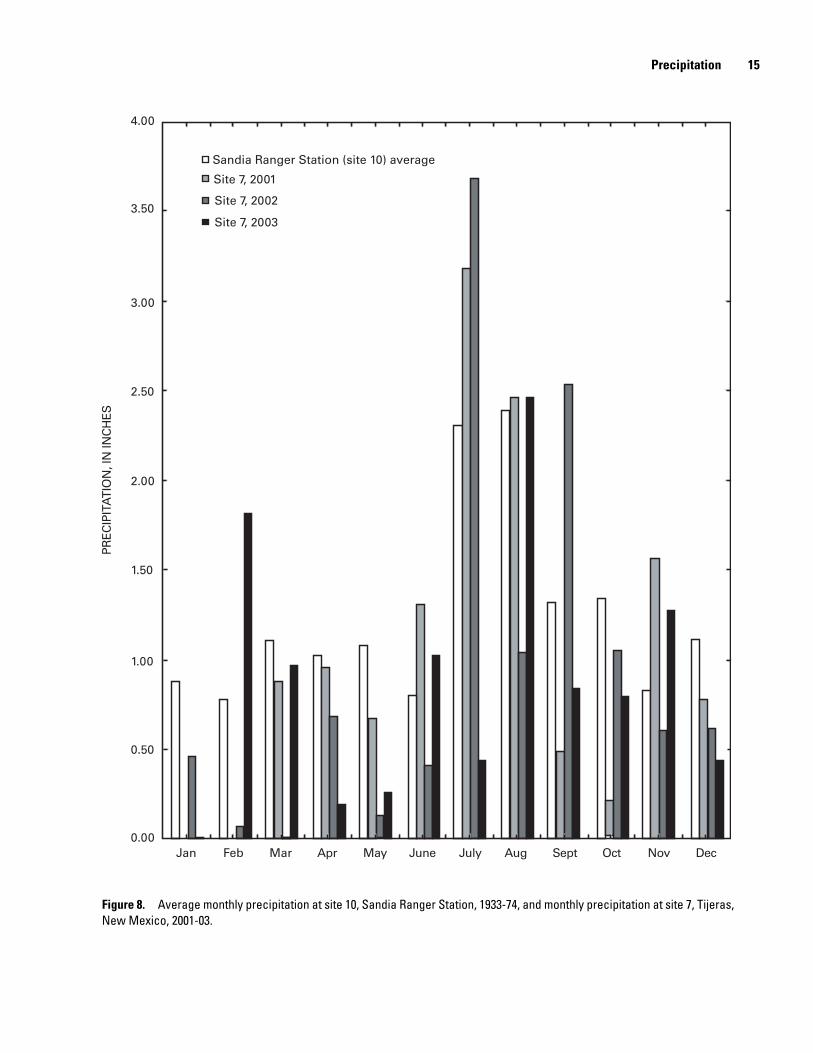
Annual precipitation during 2001-03 was less than typical in eastern Bernalillo County (figs. 6-8; table 6). Precipitation at USGS sites 1, 3, and 7 ranged from 66 to 94 percent of period-of-record average annual precipitation at corresponding NOAA sites in 2001, ranged from 51 to 75 percent in 2002, and ranged from 34 to 81 percent in 2003 (table 6). The 34 percent of average annual precipitation at site 1 during 2003, however, is based on incomplete data during June and August and no data during July. During 2001-03, monthly precipitation was less than average at site 1 in 27 of 31 months (excluding June and August 2003), at site 3 in 28 of 35 months, and at site 7 in 24 of 34 months (figs. 6-8; table 6).
7
record.
Nov Dec Annual
25 26
34.55 52.34
0.13 0.34 13.69
3.64 5.38 30.91
1.38 2.01 23.07
5.99 8.73
59 58
79.19 76.23
0.00 0.00 9.96
4.13 4.55 32.76
1.34 1.31 19.06
7.04 6.90
39 39
32.09 43.60
0.00 0.00 6.74
2.77 3.22 31.68
0.82 1.12 14.94
5.51 7.48
Precipitation
Table 2. Monthly and annual precipitation, in inches, at National Oceanic and Atmospheric Administration precipitation stations, periods of
Jan Feb Mar Apr May June July Aug Sept Oct
Sandia Crest - Site 8, 1953-79
Years 26 26 26 26 25 25 25 25 25 25
Total 51.75 50.68 60.89 33.47 23.01 23.63 79.82 85.07 45.48 45.63
Minimum 0.17 0.30 Trace 0.01 0.05 Trace 0.49 1.42 0.07 0.00
Maximum 4.84 4.93 6.55 3.21 2.52 3.88 6.23 7.64 4.62 5.79
Average 1.99 1.95 2.34 1.29 0.92 0.95 3.19 3.40 1.82 1.83
Percent of annual 8.63 8.45 10.15 5.58 3.99 4.10 13.84 14.75 7.89 7.91
Sandia Park - Site 9, 1939-2001
Years 60 55 57 58 60 60 61 60 59 57
Total 77.51 65.04 88.74 57.68 65.67 61.48 177.21 187.22 100.92 87.81
Minimum 0.02 0.00 Trace 0.00 0.00 Trace 0.19 0.95 0.00 0.00
Maximum 3.87 2.68 4.18 3.25 3.96 5.50 7.40 6.52 5.49 5.57
Average 1.29 1.18 1.56 0.99 1.09 1.02 2.91 3.12 1.71 1.54
Percent of annual 6.78 6.20 8.17 5.22 5.74 5.38 15.24 16.37 8.97 8.08
Sandia Ranger Station - Site 10, 1933-74
Years 39 39 39 39 38 39 39 39 39 39
Total 34.10 30.56 43.19 39.65 40.96 31.27 89.86 92.94 51.37 52.18
Minimum 0.00 0.00 0.00 0.00 0.00 0.00 0.00 0.52 0.00 0.00
Maximum 5.21 1.91 3.37 4.85 6.55 3.25 4.59 4.77 3.63 5.82
Average 0.87 0.78 1.11 1.02 1.08 0.80 2.30 2.38 1.32 1.34
Percent of annual 5.85 5.24 7.41 6.80 7.21 5.37 15.42 15.95 8.82 8.96
8 Table 3. Monthly and annual precipitation, in inches, at National Oceanic and Atmospheric Administration precipitation stations, 1954-74.
Nov Dec Annual
21 21
28.11 45.47
0.13 0.35 113.69
3.64 5.38 30.18
1.34 2.17 22.72
5.9 9.5
20 19
22.70 26.79
0.21 0.05 9.96
3.33 4.38 27.23
1.14 1.41 18.69
6.1 7.5
21 21
14.66 24.91
0.00 0.00 8.91
1.98 3.22 19.72
0.70 1.19 14.58
4.8 8.1
Precipitation; Ground-W
ater Age; N
itrate Concentrations; and Levels in Eastern Bernalillo County, N
ew M
exico
Jan Feb Mar Apr May June July Aug Sept Oct
Sandia Crest - Site 8
Years 21 21 21 21 21 21 21 21 21 21
Total 36.62 36.09 47.36 25.80 19.24 20.16 66.99 71.36 36.34 43.23
Minimum 0.17 0.30 Trace 0.01 0.05 0.00 0.49 1.42 0.07 0.05
Maximum 4.10 2.86 6.55 3.21 2.52 3.88 6.23 7.64 4.56 5.79
Average 1.74 1.72 2.26 1.23 0.92 0.96 3.19 3.40 1.73 2.06
Percent of annual 7.7 7.6 9.9 5.4 4.0 4.2 14.0 15.0 7.6 9.1
Sandia Park - Site 9
Years 20 19 19 20 20 20 21 21 20 19
Total 19.73 23.18 26.35 18.25 20.85 19.00 65.14 66.00 34.46 31.94
Minimum 0.08 0.07 Trace 0.00 0.05 Trace 0.20 0.95 0.00 0.14
Maximum 2.75 2.62 3.44 3.02 3.47 4.19 6.18 5.23 5.49 5.57
Average 0.99 1.22 1.39 0.91 1.04 0.95 3.10 3.14 1.72 1.68
Percent of annual 5.3 6.5 7.4 4.9 5.6 5.1 16.6 16.8 9.2 9.0
Sandia Ranger Station - Site 10
Years 21 21 21 21 21 21 21 21 21 21
Total 14.80 17.66 22.42 16.87 14.99 15.77 50.72 50.72 29.11 33.33
Minimum 0.00 0.00 0.00 0.00 0.00 0.00 0.62 0.52 0.06 0.00
Maximum 1.86 1.91 3.29 2.58 2.92 3.25 4.01 4.77 3.63 4.90
Average 0.70 0.84 1.07 0.80 0.71 0.75 2.42 2.42 1.39 1.59
Percent of annual 4.8 5.8 7.3 5.5 4.9 5.2 16.6 16.6 9.5 10.9
9 Precipitation
Figure 4. Average monthly precipitation at Sandia Crest, Sandia Park, and Sandia Ranger Station, periods of record.
10 ecord.
Nov Dec Annual
24 26
239.1 537.5
Trace 3.0 48.8
27.6 53.0 215.8
10.0 20.7 115.5
8.6 17.9
56 52
415.5 562.2
0.0 0.0 17.0
35.0 33.0 135.4
7.4 10.8 60.8
12.2 17.8
33 26
104.0 154.9
0.0 0.0 5.4
23.5 26.2 66.4
3.2 6.0 27.7
11.4 21.5
Precipitation; Ground-W
ater Age; N
itrate Concentrations; and Levels in Eastern Bernalillo County, N
ew M
exico
Table 4. Monthly and annual snowfall, in inches, at National Oceanic and Atmospheric Administration precipitation stations, periods of rJan Feb Mar Apr May June July Aug Sept Oct
Sandia Crest - Site 8, 1953-79
Years 25 25 26 26 24 25 25 25 25 24
Total 483.9 556.9 594.9 277.5 90.9 1.5 1.0 0.0 2.8 131.4
Minimum 1.9 2.0 Trace 0.0 0.0 0.0 0.0 0.0 0.0 0.0
Maximum 45.8 60.3 67.9 34.5 21.3 1.0 1.0 0.0 1.5 24.0
Average 19.4 22.3 22.9 10.7 3.8 0.1 0.0 0.0 0.1 5.5
Percent of annual 16.8 19.3 19.8 9.2 3.3 0.1 0.0 0.0 0.1 4.7
Sandia Park - Site 9, 1939-2001
Years 53 52 52 51 59 60 61 60 60 52
Total 736.3 577.8 570.2 239.4 26.1 0.0 0.0 0.0 2.8 76.9
Minimum 0.9 Trace Trace 0.0 0.0 0.0 0.0 0.0 0.0 0.0
Maximum 43.0 32.5 40.0 24.5 14.4 Trace Trace Trace Trace Trace
Average 13.9 11.1 11.0 4.7 0.4 0.0 0.0 0.0 0.0 1.5
Percent of annual 22.8 18.3 18.0 7.7 0.7 0.0 0.0 0.0 0.1 2.4
Sandia Ranger Station - Site 10, 1933-74
Years 32 28 27 38 41 42 41 42 41 40
Total 213.2 137.9 111.6 76.0 26.0 0.0 0.0 0.0 7.5 0.0
Minimum 0.0 0.0 0.0 0.0 0.0 0.0 0.0 0.0 0.0 0.0
Maximum 23.7 24.0 18.6 16.0 18.0 Trace 0.0 0.0 6.5 Trace
Average 6.7 4.9 4.1 2.0 0.6 0.0 0.0 0.0 0.2 0.0
Percent of annual 24.1 17.8 14.9 7.2 2.3 0.0 0.0 0.0 0.7 0.0
Nov Dec Annual
20 21
200.7 451.2
Trace 3.0 48.8
27.6 53.0 215.8
10.0 21.5 115.1
8.7 18.7
18 13
100.1 152.9
0.0 3.0 18.0
17.0 25.1 116.1
5.6 11.8 56.3
9.9 20.9
15 7
9.4 36.6
0.0 0.0 5.4
3.0 13.0 44.0
0.6 5.2 14.9
4.2 35.1
Precipitation
11
Table 5. Monthly and annual snowfall, in inches, at National Oceanic and Atmospheric Administration precipitation stations, 1954-74.
Jan Feb Mar Apr May June July Aug Sept Oct
Sandia Crest - Site 8
Years 21 21 21 21 21 21 21 21 21 21
Total 376.6 462.9 496.3 219.4 68.6 1.5 1.0 0.0 2.8 129.2
Minimum 1.9 2.0 Trace 0.0 0.0 0.0 0.0 0.0 0.0 0.0
Maximum 40.5 60.3 67.9 34.5 17.3 Trace 1.0 0.0 0.0 24.0
Average 17.9 22.0 23.6 10.4 3.3 0.1 0.0 0.0 0.1 6.2
Percent of annual 15.6 19.2 20.5 9.1 2.8 0.1 0.0 0.0 0.1 5.3
Sandia Park - Site 9
Years 15 17 14 13 20 20 21 21 20 17
Total 183.3 173.3 159.3 57.1 2.6 0.0 0.0 0.0 0.8 10.1
Minimum 1.0 1.0 Trace 0.0 0.0 0.0 0.0 0.0 0.0 0.0
Maximum 35.9 26.5 40.0 24.5 2.0 Trace Trace Trace 0.8 3.6
Average 12.2 10.2 11.4 4.4 0.1 0.0 0.0 0.0 0.0 0.6
Percent of annual 21.7 18.1 20.2 7.8 0.2 0.0 0.0 0.0 0.1 1.1
Sandia Ranger Station - Site 10
Years 12 10 9 17 21 21 21 21 20 19
Total 44.1 23.3 19.9 16.0 0.0 0.0 0.0 0.0 0.0 0.0
Minimum 0.0 0.0 0.0 0.0 0.0 0.0 0.0 0.0 0.0 0.0
Maximum 17.0 9.0 13.5 16.0 Trace Trace 0.0 0.0 0.0 Trace
Average 3.7 2.3 2.2 0.9 0.0 0.0 0.0 0.0 0.0 0.0
Percent of annual 24.7 15.6 14.8 6.3 0.0 0.0 0.0 0.0 0.0 0.0
12 Precipitation; Ground-Water Age; Nitrate Concentrations; and Levels in Eastern Bernalillo County, New Mexico
Figure 5. Average monthly snowfall at Sandia Crest, Sandia Park, and Sandia Ranger Station, periods of record.
13 Precipitation
Figure 6. Average monthly precipitation at site 8, Sandia Crest, 1953-79, and monthly precipitation at site 1, Sandia Mountains high altitude, 2001-03.
14 Precipitation; Ground-Water Age; Nitrate Concentrations; and Levels in Eastern Bernalillo County, New Mexico
3.50
3.00
2.50
2.00
1.50
1.00
0.50
0.00
Sandia Park (site 9) average
Site 3, 2001
Site 3, 2002
PREC
IPIT
ATI
ON
, IN
INC
HES
Site 3, 2003
Jan Feb Mar Apr May June July Aug Sept Oct Nov Dec
Figure 7. Average monthly precipitation at site 9, Sandia Park, 1939-2001, and monthly precipitation at site 3, Sandia Mountains low altitude, 2001-03.
15 Precipitation
Figure 8. Average monthly precipitation at site 10, Sandia Ranger Station, 1933-74, and monthly precipitation at site 7, Tijeras, New Mexico, 2001-03.
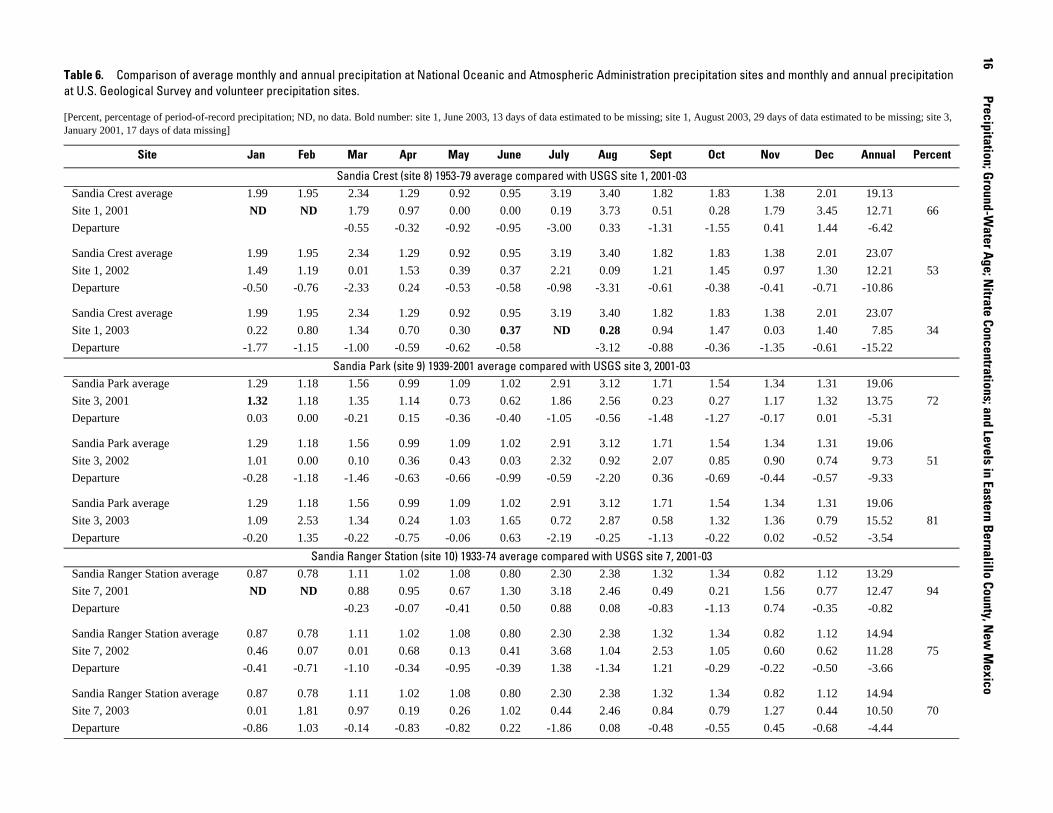
16 Table 6. Comparison of average monthly and annual precipitation at National Oceanic and Atmospheric Administration precipitation sites and monthly and annual precipitation
days of data estimated to be missing; site 3,
ov Dec Annual Percent
1.38 2.01 19.13
1.79 3.45 12.71 66
0.41 1.44 -6.42
1.38 2.01 23.07
0.97 1.30 12.21 53
0.41 -0.71 -10.86
1.38 2.01 23.07
0.03 1.40 7.85 34
1.35 -0.61 -15.22
1.34 1.31 19.06
1.17 1.32 13.75 72
0.17 0.01 -5.31
1.34 1.31 19.06
0.90 0.74 9.73 51
0.44 -0.57 -9.33
1.34 1.31 19.06
1.36 0.79 15.52 81
0.02 -0.52 -3.54
0.82 1.12 13.29
1.56 0.77 12.47 94
0.74 -0.35 -0.82
0.82 1.12 14.94
0.60 0.62 11.28 75
0.22 -0.50 -3.66
0.82 1.12 14.94
1.27 0.44 10.50 70
0.45 -0.68 -4.44
Precipitation; Ground-W
ater Age; N
itrate Concentrations; and Levels in Eastern Bernalillo County, N
ew M
exico
at U.S. Geological Survey and volunteer precipitation sites.
[Percent, percentage of period-of-record precipitation; ND, no data. Bold number: site 1, June 2003, 13 days of data estimated to be missing; site 1, August 2003, 29January 2001, 17 days of data missing]
Site Jan Feb Mar Apr May June July Aug Sept Oct N
Sandia Crest (site 8) 1953-79 average compared with USGS site 1, 2001-03 Sandia Crest average 1.99 1.95 2.34 1.29 0.92 0.95 3.19 3.40 1.82 1.83
Site 1, 2001 ND ND 1.79 0.97 0.00 0.00 0.19 3.73 0.51 0.28
Departure -0.55 -0.32 -0.92 -0.95 -3.00 0.33 -1.31 -1.55
Sandia Crest average 1.99 1.95 2.34 1.29 0.92 0.95 3.19 3.40 1.82 1.83
Site 1, 2002 1.49 1.19 0.01 1.53 0.39 0.37 2.21 0.09 1.21 1.45
Departure -0.50 -0.76 -2.33 0.24 -0.53 -0.58 -0.98 -3.31 -0.61 -0.38 -
Sandia Crest average 1.99 1.95 2.34 1.29 0.92 0.95 3.19 3.40 1.82 1.83
Site 1, 2003 0.22 0.80 1.34 0.70 0.30 0.37 ND 0.28 0.94 1.47
Departure -1.77 -1.15 -1.00 -0.59 -0.62 -0.58 -3.12 -0.88 -0.36 -
Sandia Park (site 9) 1939-2001 average compared with USGS site 3, 2001-03 Sandia Park average 1.29 1.18 1.56 0.99 1.09 1.02 2.91 3.12 1.71 1.54
Site 3, 2001 1.32 1.18 1.35 1.14 0.73 0.62 1.86 2.56 0.23 0.27
Departure 0.03 0.00 -0.21 0.15 -0.36 -0.40 -1.05 -0.56 -1.48 -1.27 -
Sandia Park average 1.29 1.18 1.56 0.99 1.09 1.02 2.91 3.12 1.71 1.54
Site 3, 2002 1.01 0.00 0.10 0.36 0.43 0.03 2.32 0.92 2.07 0.85
Departure -0.28 -1.18 -1.46 -0.63 -0.66 -0.99 -0.59 -2.20 0.36 -0.69 -
Sandia Park average 1.29 1.18 1.56 0.99 1.09 1.02 2.91 3.12 1.71 1.54
Site 3, 2003 1.09 2.53 1.34 0.24 1.03 1.65 0.72 2.87 0.58 1.32
Departure -0.20 1.35 -0.22 -0.75 -0.06 0.63 -2.19 -0.25 -1.13 -0.22
Sandia Ranger Station (site 10) 1933-74 average compared with USGS site 7, 2001-03 Sandia Ranger Station average 0.87 0.78 1.11 1.02 1.08 0.80 2.30 2.38 1.32 1.34
Site 7, 2001 ND ND 0.88 0.95 0.67 1.30 3.18 2.46 0.49 0.21
Departure -0.23 -0.07 -0.41 0.50 0.88 0.08 -0.83 -1.13
Sandia Ranger Station average 0.87 0.78 1.11 1.02 1.08 0.80 2.30 2.38 1.32 1.34
Site 7, 2002 0.46 0.07 0.01 0.68 0.13 0.41 3.68 1.04 2.53 1.05
Departure -0.41 -0.71 -1.10 -0.34 -0.95 -0.39 1.38 -1.34 1.21 -0.29 -
Sandia Ranger Station average 0.87 0.78 1.11 1.02 1.08 0.80 2.30 2.38 1.32 1.34
Site 7, 2003 0.01 1.81 0.97 0.19 0.26 1.02 0.44 2.46 0.84 0.79
Departure -0.86 1.03 -0.14 -0.83 -0.82 0.22 -1.86 0.08 -0.48 -0.55
Ground-Water Age 17
Ground-Water Age
Analyses of selected chlorofluorocarbon (CFC) concentrations in ground-water samples from nine wells and one spring were used to estimate when the sampled water entered the ground-water system and, therefore, the age or residence time of water in the ground-water system. Samples were collected, processed, and shipped during February and April 2003 according to procedures developed by the USGS Reston Chlorofluorocarbon Laboratory in Reston, Virginia (U.S. Geological Survey, 2003). The sampling procedure isolates the sample from exposure to and contamination by ambient air.
The selected chlorofluorocarbons, CFC-11, CFC-12, and CFC-113, have been used as refrigerants and aerosol propellants since about 1940. The concentration of each CFC in the atmosphere and, therefore, in recharge water that is in equilibrium with the atmosphere, has been measured or reconstructed for 1940 to the present (2003). The concentrations of these chemicals in ground-water samples provide an estimate of when the sampled water entered the ground-water system.
Several conditions, however, can occur during movement of water through soil and bedrock to the ground-water system and within the ground-water system that affect CFC concentrations in ground water (Plummer and Busenberg, 1999). Processes and conditions that potentially occur in eastern Bernalillo County include excess air entrapped in the water, thick unsaturated zones, and recharge occurring at high but variable altitudes combined with mixing of water in the ground-water system.
Excess air can become entrapped and subsequently dissolved in water that rapidly enters the ground-water system, resulting in an apparent age that is too young (Plummer and Busenberg, 1999). Most of eastern Bernalillo County is underlain by fractured and solution-channeled limestone (Titus, 1980), which has the potential to facilitate rapid movement of recharge water through the unsaturated zone to the water table. Ground-water levels have been observed to rise relatively rapidly following a large precipitation event or a series of such events (Blanchard and Kues, 1999), suggesting that water moves rapidly through the unsaturated zone to the water table.
The age of ground water can appear to be older than it actually is when the unsaturated-zone thickness is more than about 30 feet and older by 8 to 12 years when the thickness of the unsaturated is about 100 feet (Plummer and Busenberg, 1999). Depths to water in four of the nine wells sampled for CFC’s ranged from about 100 to about 194 feet. Depth to water in a fifth well was about 75 feet; depths to water in the remaining four wells were less than 50 feet.
Recharge at high altitudes and attendant low barometric pressure can result in CFC concentrations that suggest a ground-water age that is too old (Plummer and Busenberg, 1999). Recharge altitudes have been estimated for the wells and spring sampled for CFC’s, but recharge can potentially occur nearly anywhere in eastern Bernalillo County. Recharge to the ground-water system in which a particular well is completed
likely occurs at a range of altitudes along flow paths intercepted by the well. For example, recharge to a well located east of the Sandia Mountains at an altitude of 7,000 feet could occur near the well in addition to upgradient along the ground-water flow path to as high as about 10,000 feet near the crest of the Sandia Mountains.
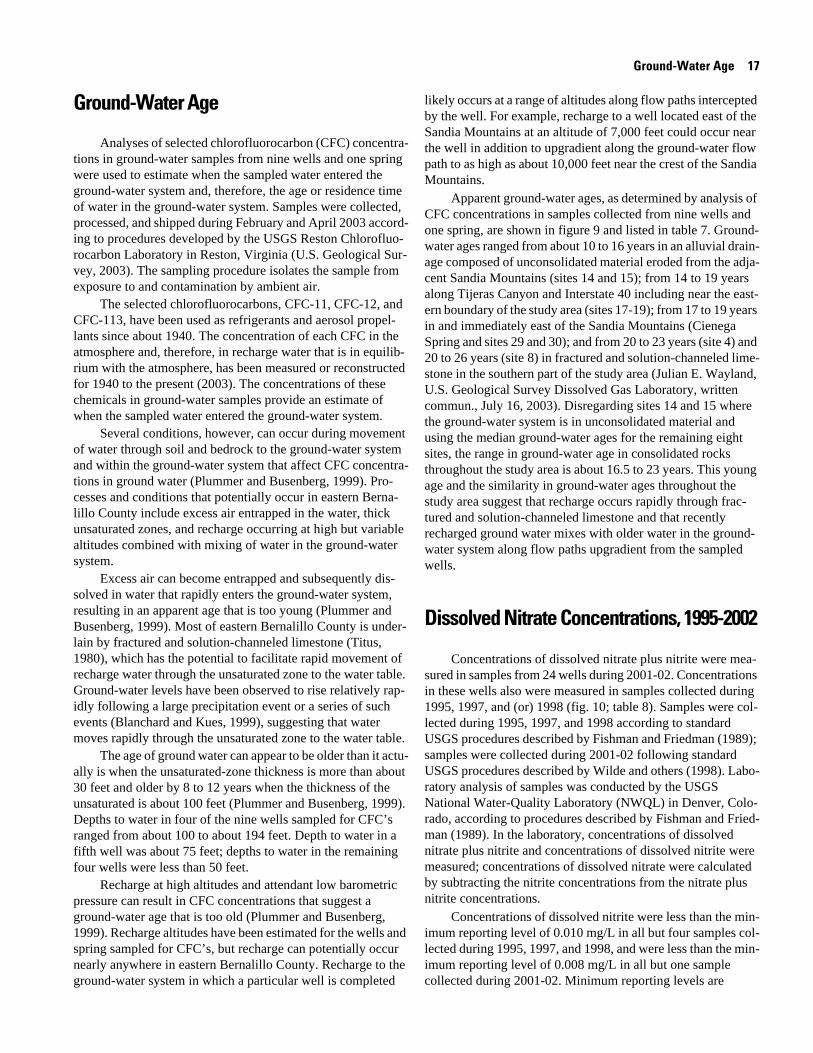
Apparent ground-water ages, as determined by analysis of CFC concentrations in samples collected from nine wells and one spring, are shown in figure 9 and listed in table 7. Groundwater ages ranged from about 10 to 16 years in an alluvial drainage composed of unconsolidated material eroded from the adjacent Sandia Mountains (sites 14 and 15); from 14 to 19 years along Tijeras Canyon and Interstate 40 including near the eastern boundary of the study area (sites 17-19); from 17 to 19 years in and immediately east of the Sandia Mountains (Cienega Spring and sites 29 and 30); and from 20 to 23 years (site 4) and 20 to 26 years (site 8) in fractured and solution-channeled limestone in the southern part of the study area (Julian E. Wayland, U.S. Geological Survey Dissolved Gas Laboratory, written commun., July 16, 2003). Disregarding sites 14 and 15 where the ground-water system is in unconsolidated material and using the median ground-water ages for the remaining eight sites, the range in ground-water age in consolidated rocks throughout the study area is about 16.5 to 23 years. This young age and the similarity in ground-water ages throughout the study area suggest that recharge occurs rapidly through fractured and solution-channeled limestone and that recently recharged ground water mixes with older water in the groundwater system along flow paths upgradient from the sampled wells.
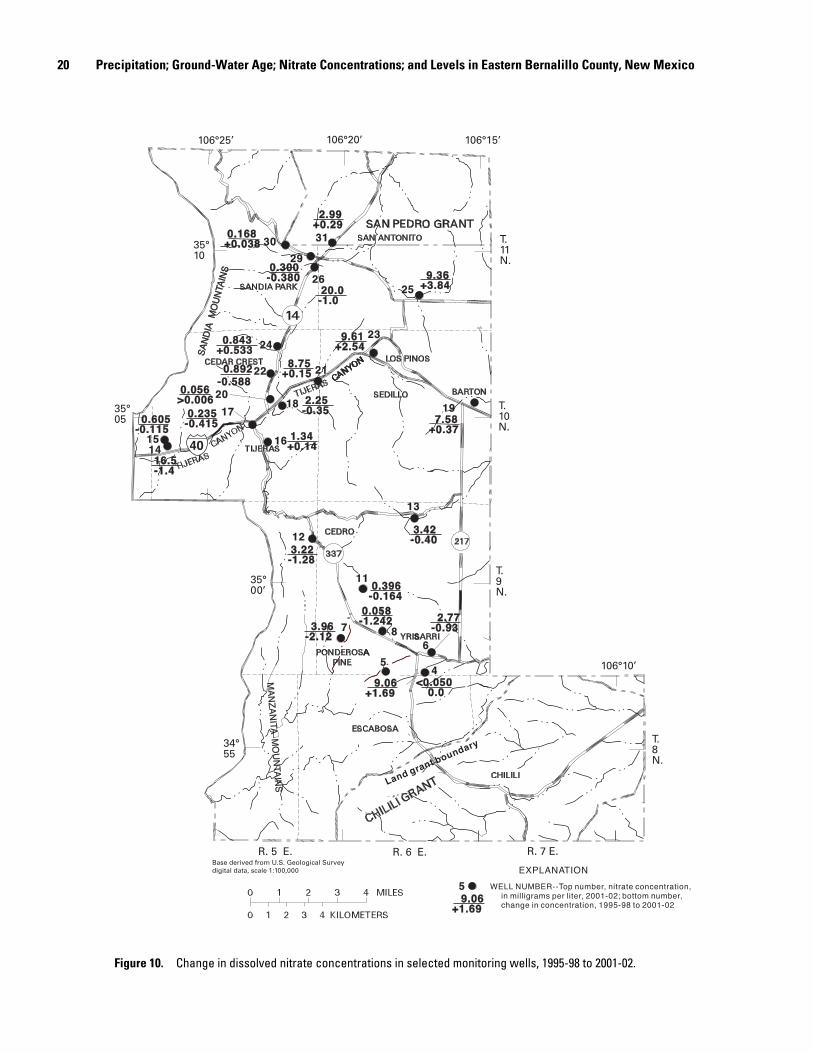
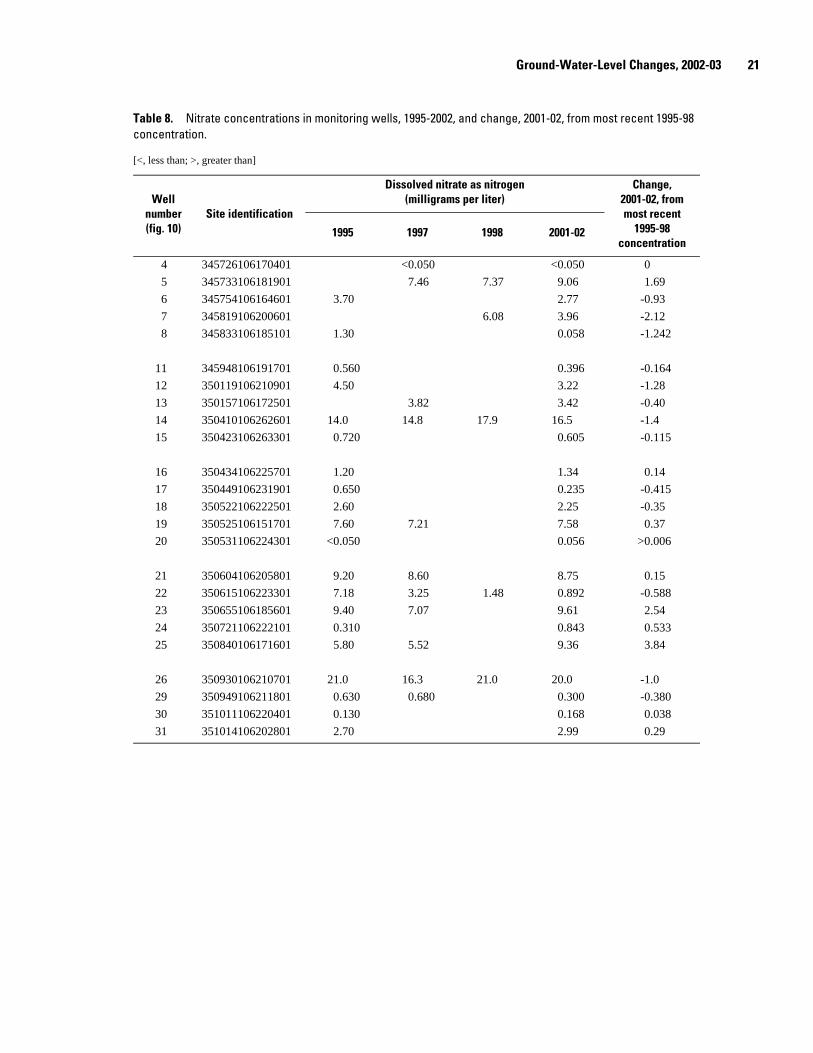
Dissolved Nitrate Concentrations, 1995-2002
Concentrations of dissolved nitrate plus nitrite were measured in samples from 24 wells during 2001-02. Concentrations in these wells also were measured in samples collected during 1995, 1997, and (or) 1998 (fig. 10; table 8). Samples were collected during 1995, 1997, and 1998 according to standard USGS procedures described by Fishman and Friedman (1989); samples were collected during 2001-02 following standard USGS procedures described by Wilde and others (1998). Laboratory analysis of samples was conducted by the USGS National Water-Quality Laboratory (NWQL) in Denver, Colorado, according to procedures described by Fishman and Friedman (1989). In the laboratory, concentrations of dissolved nitrate plus nitrite and concentrations of dissolved nitrite were measured; concentrations of dissolved nitrate were calculated by subtracting the nitrite concentrations from the nitrate plus nitrite concentrations.
Concentrations of dissolved nitrite were less than the minimum reporting level of 0.010 mg/L in all but four samples collected during 1995, 1997, and 1998, and were less than the minimum reporting level of 0.008 mg/L in all but one sample collected during 2001-02. Minimum reporting levels are
18 Precipitation; Ground-Water Age; Nitrate Concentrations; and Levels in Eastern Bernalillo County, New Mexico
Figure 9. Estimated age of ground water in selected monitoring wells and spring as determined by concentrations of chlorofluorocarbons.
Ground-Water-Level Changes, 2002-03 19
Table 7. Estimated ground-water age determined by concentrations of chlorofluorocarbons.
[CFC, chlorofluorocarbon]
Well number/ CFC used Approxispring name Site identification to estimate mate age
(fig. 9) age (years)
4 345726106170401 11, 12, 113 20 to 23
8 345833106185101 113 20 to 26
14 350410106262601 113 10 to 16
15 350423106263301 12, 113 10 to 16
17 350449106231901 113 14 to 19
18 350522106222501 113 14 to 19
19 350525106151701 11, 12, 113 14 to 19
29 350949106211301 12, 113 17 to 19
30 351011106220401 12, 113 17 to 19
Cienega Spring 351012106230401 12, 113 17 to 19
established by the NWQL. The concentrations of dissolved nitrite in samples collected from wells 17, 22, and 24 in 1995 were 0.010, 0.020, and 0.020 mg/L, respectively; the concentration in the sample collected from well 7 in 1998 was unusually large: 0.942 mg/L. The concentrations of nitrate shown in figure 10 and listed in table 8 for these four samples were determined by subtracting the concentration of nitrite from the concentration of nitrate plus nitrite. The concentration of dissolved nitrite in the sample collected from well 8 in 2002 was less than 0.010 mg/L. Concentrations of dissolved nitrite in this sample and all other samples (all less than 0.010 mg/L) were considered to be insignificant.
Concentrations of dissolved nitrate were grouped into four categories:
1. Less than 0.050 to 0.999 mg/L; considered to be at or near background concentrations,
2. 1.00 to 4.99 mg/L; considered to be larger than background concentrations, but not large enough to prompt concern regarding health concerns,
3. 5.00 to 9.99 mg/L; considered to be larger than background concentrations and large enough to prompt concern regarding health concerns, and
4. 10.0 or more mg/L; larger than the USEPA primary drinking-water regulation, which is based on health concerns.
Dissolved nitrate concentrations in samples collected from 17 of the 24 wells during 2001-02 were less than 5.0 mg/L, and concentrations in 10 of these samples were less than 1.0 mg/L (fig. 10; table 8). Concentrations in samples collected from five
wells during 2001-02 were between 5.0 and 9.99 mg/L (wells 5, 19, 21, 23, and 25). Concentrations in wells 14 (16.5 mg/L) and 26 (20.0 mg/L) were larger than the USEPA primary drinking-water regulation of 10 mg/L; these concentrations, however, were less than those in the previous samples collected during 1998. Wells 14 and 26 are located in areas of residential development where septic tanks and leach fields are used.
Dissolved nitrate concentrations in samples collected during 2001-02 typically were consistent with those collected during 1995, 1997, and 1998 (table 8). Dissolved nitrate concentrations in samples collected during 2001-02 were in the same concentration category as concentrations in samples collected during 1995-98 in all wells except 7, 8, and 22, in which concentrations decreased and were classified in a smaller concentration category. From 1998 to 2002, dissolved nitrate concentrations decreased from 6.08 to 3.96 mg/L in well 7; from 1995 to 2001, concentrations steadily decreased from 7.18 to 0.892 mg/L in four samples collected from well 22.
Dissolved nitrate concentrations in samples collected during 2001-02 were larger than the largest 1995-98 concentration in 8 of the 24 wells; increases, however, were less than 1.0 mg/L in 6 of these wells. Dissolved nitrate concentrations in wells 5 and 25 during 2001-02 were 1.60 and 3.56 mg/L larger, respectively, than the previous largest concentration and were more than 9.0 mg/L in 2002.
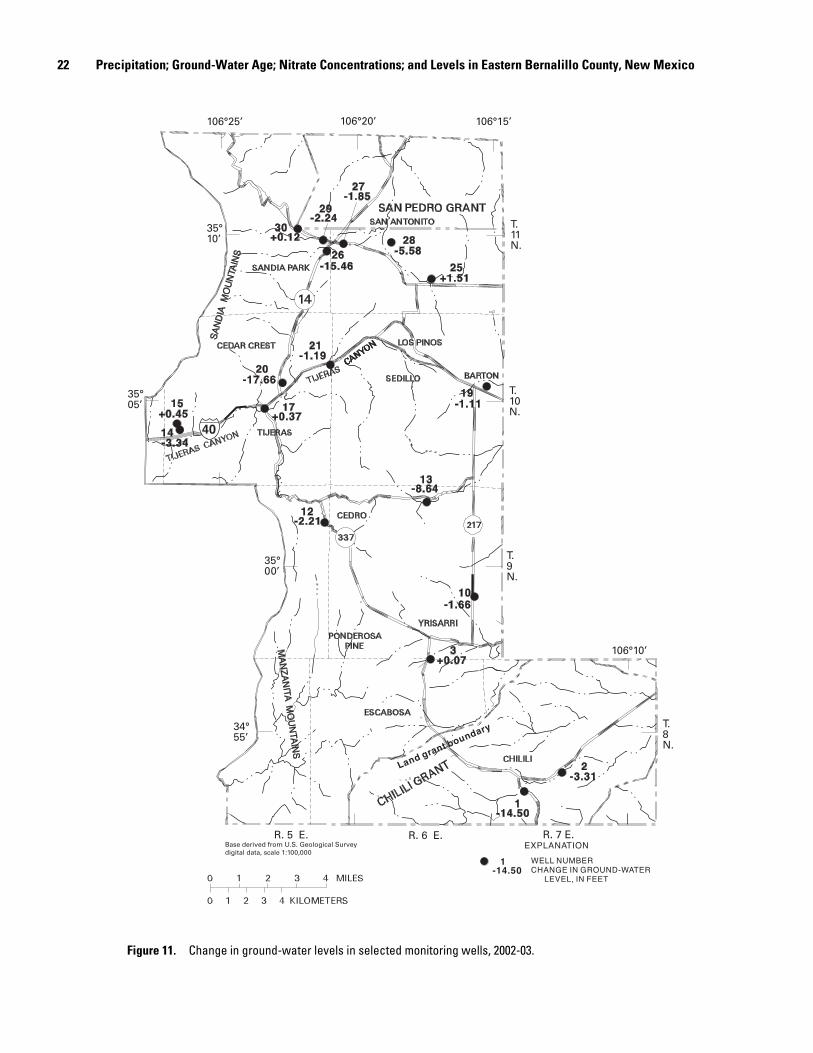
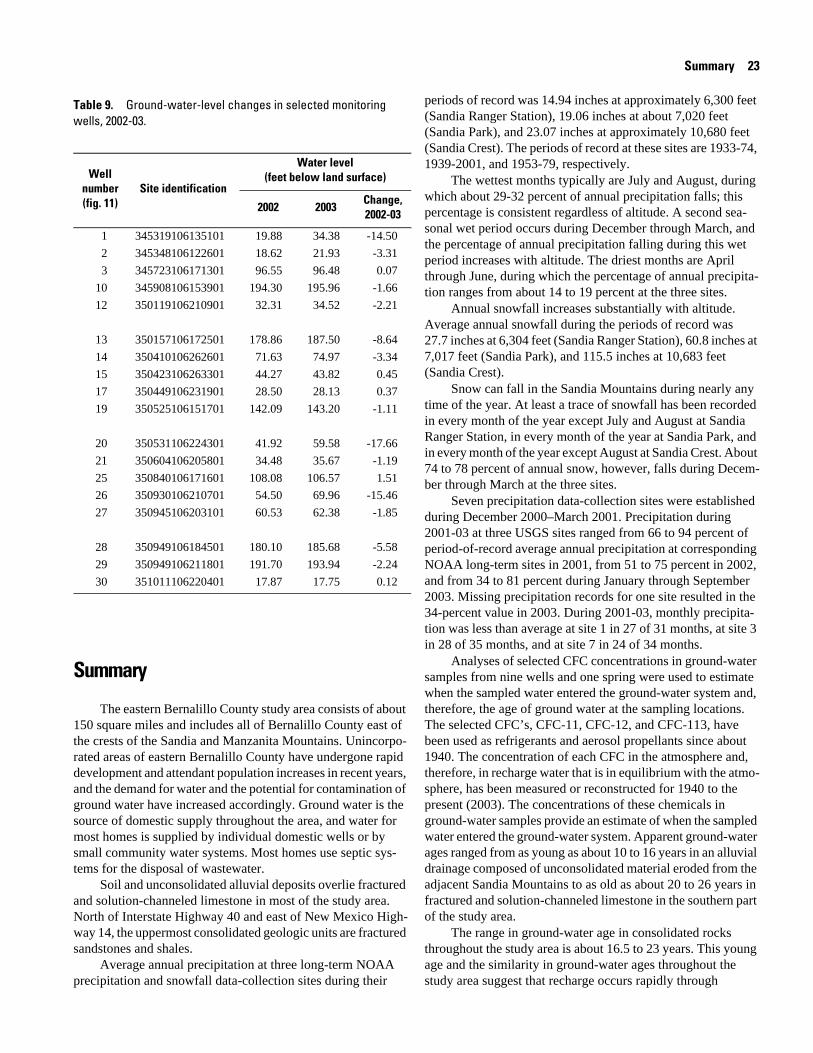
Ground-Water-Level Changes, 2002-03
Ground-water levels were measured during June and July 2002 and during June, July, and August 2003 in 18 monitoring wells. Four wells were inactive and not regularly supplying water and 14 wells were active and supplying water to a residence, commercial establishment, or fire station. Water-level changes from 2002 to 2003 are shown in figure 11 and are listed in table 9.
From 2002 to 2003, water-level rises in five wells ranged from 0.07 to 1.51 feet, and the median rise was 0.37 foot. Water-level declines in 13 wells ranged from 1.11 to 17.66 feet, and the median decline was 3.31 feet. The median change in water level for all 18 wells was a decline of 2.03 feet.
In active domestic wells, water levels can be affected by changes in the volume of water routinely withdrawn from the wells as dictated by habits of the residents. For example, the volume of water withdrawn from a well can be affected by a change in the number of residents in a home or by the amount of time that residents spend in a home.
Water levels declined more than 8.64 feet in three wells. One of these wells was used by a day care facility and one was used by an office building (declines of 14.50 and 15.46 feet, respectively). The third well was used by a residence in which the family changed from two parents and two children to two parents and six home-schooled children (decline of 17.66 feet).
20 Precipitation; Ground-Water Age; Nitrate Concentrations; and Levels in Eastern Bernalillo County, New Mexico
:(//�180%(5��7RS�QXPEHU��QLWUDWH�FRQFHQWUDWLRQ�������LQ�PLOOLJUDPV�SHU�OLWHU�����������ERWWRP�QXPEHU������FKDQJH�LQ�FRQFHQWUDWLRQ����������WR��������
(;3/$1$7,21
������������������
����������������������
����������������������
����������������������������
����������������
������������������������
������������������������
����������������
��������������������������
������������������������
��������������������
��������������������
����������������������
����������������������
��������������������������
��
�� ��
��
��
��
��
����
������
����
��
��
��
��
��
��
�
��������!�����������!�����
��������������������
������������������������
������������������������
��������������������������
����������������������
��������������������������
������������������������
��������������������
�������������������������
6$1',$��02817$,16
6$1',$��02817$,16
0$1=$1,7$��0
2817$,16
��
/DQG�JUDQW�ERXQGDU\
��ª���
��ª��
��ª��
��ª��
���ª��� ���ª��� ���ª���
4���.�
4���.�
4��.�
���ª���
4��.�
2����%�2�����%�2�����%�"ASE�DERIVED�FROM�5�3��'EOLOGICAL�3URVEY�DIGITAL�DATA��SCALE����������
Figure 10. Change in dissolved nitrate concentrations in selected monitoring wells, 1995-98 to 2001-02.
21 Ground-Water-Level Changes, 2002-03
Table 8. Nitrate concentrations in monitoring wells, 1995-2002, and change, 2001-02, from most recent 1995-98 concentration.
[<, less than; >, greater than]
Dissolved nitrate as nitrogen Change, Well (milligrams per liter) 2001-02, from
number Site identification most recent (fig. 10) 1995 1997 1998 2001-02 1995-98
concentration
4 345726106170401 <0.050 <0.050 0
5 345733106181901 7.46 7.37 9.06 1.69
6 345754106164601 3.70 2.77 -0.93
7 345819106200601 6.08 3.96 -2.12
8 345833106185101 1.30 0.058 -1.242
11 345948106191701 0.560 0.396 -0.164
12 350119106210901 4.50 3.22 -1.28
13 350157106172501 3.82 3.42 -0.40
14 350410106262601 14.0 14.8 17.9 16.5 -1.4
15 350423106263301 0.720 0.605 -0.115
16 350434106225701 1.20 1.34 0.14
17 350449106231901 0.650 0.235 -0.415
18 350522106222501 2.60 2.25 -0.35
19 350525106151701 7.60 7.21 7.58 0.37
20 350531106224301 <0.050 0.056 >0.006
21 350604106205801 9.20 8.60 8.75 0.15
22 350615106223301 7.18 3.25 1.48 0.892 -0.588
23 350655106185601 9.40 7.07 9.61 2.54
24 350721106222101 0.310 0.843 0.533
25 350840106171601 5.80 5.52 9.36 3.84
26 350930106210701 21.0 16.3 21.0 20.0 -1.0
29 350949106211801 0.630 0.680 0.300 -0.380
30 351011106220401 0.130 0.168 0.038
31 351014106202801 2.70 2.99 0.29
22 Precipitation; Ground-Water Age; Nitrate Concentrations; and Levels in Eastern Bernalillo County, New Mexico
Figure 11. Change in ground-water levels in selected monitoring wells, 2002-03.
Summary 23
Table 9. Ground-water-level changes in selected monitoring wells, 2002-03.
Water level Well
number Site identification (feet below land surface)
(fig. 11) 2002 2003 Change, 2002-03
1 345319106135101 19.88 34.38 -14.50
2 345348106122601 18.62 21.93 -3.31
3 345723106171301 96.55 96.48 0.07
10 345908106153901 194.30 195.96 -1.66
12 350119106210901 32.31 34.52 -2.21
13 350157106172501 178.86 187.50 -8.64
14 350410106262601 71.63 74.97 -3.34
15 350423106263301 44.27 43.82 0.45
17 350449106231901 28.50 28.13 0.37
19 350525106151701 142.09 143.20 -1.11
20 350531106224301 41.92 59.58 -17.66
21 350604106205801 34.48 35.67 -1.19
25 350840106171601 108.08 106.57 1.51
26 350930106210701 54.50 69.96 -15.46
27 350945106203101 60.53 62.38 -1.85
28 350949106184501 180.10 185.68 -5.58
29 350949106211801 191.70 193.94 -2.24
30 351011106220401 17.87 17.75 0.12
Summary
The eastern Bernalillo County study area consists of about 150 square miles and includes all of Bernalillo County east of the crests of the Sandia and Manzanita Mountains. Unincorporated areas of eastern Bernalillo County have undergone rapid development and attendant population increases in recent years, and the demand for water and the potential for contamination of ground water have increased accordingly. Ground water is the source of domestic supply throughout the area, and water for most homes is supplied by individual domestic wells or by small community water systems. Most homes use septic systems for the disposal of wastewater.
Soil and unconsolidated alluvial deposits overlie fractured and solution-channeled limestone in most of the study area. North of Interstate Highway 40 and east of New Mexico Highway 14, the uppermost consolidated geologic units are fractured sandstones and shales.
Average annual precipitation at three long-term NOAA precipitation and snowfall data-collection sites during their
periods of record was 14.94 inches at approximately 6,300 feet (Sandia Ranger Station), 19.06 inches at about 7,020 feet (Sandia Park), and 23.07 inches at approximately 10,680 feet (Sandia Crest). The periods of record at these sites are 1933-74, 1939-2001, and 1953-79, respectively.
The wettest months typically are July and August, during which about 29-32 percent of annual precipitation falls; this percentage is consistent regardless of altitude. A second seasonal wet period occurs during December through March, and the percentage of annual precipitation falling during this wet period increases with altitude. The driest months are April through June, during which the percentage of annual precipitation ranges from about 14 to 19 percent at the three sites.
Annual snowfall increases substantially with altitude. Average annual snowfall during the periods of record was 27.7 inches at 6,304 feet (Sandia Ranger Station), 60.8 inches at 7,017 feet (Sandia Park), and 115.5 inches at 10,683 feet (Sandia Crest).
Snow can fall in the Sandia Mountains during nearly any time of the year. At least a trace of snowfall has been recorded in every month of the year except July and August at Sandia Ranger Station, in every month of the year at Sandia Park, and in every month of the year except August at Sandia Crest. About 74 to 78 percent of annual snow, however, falls during December through March at the three sites.
Seven precipitation data-collection sites were established during December 2000–March 2001. Precipitation during 2001-03 at three USGS sites ranged from 66 to 94 percent of period-of-record average annual precipitation at corresponding NOAA long-term sites in 2001, from 51 to 75 percent in 2002, and from 34 to 81 percent during January through September 2003. Missing precipitation records for one site resulted in the 34-percent value in 2003. During 2001-03, monthly precipitation was less than average at site 1 in 27 of 31 months, at site 3 in 28 of 35 months, and at site 7 in 24 of 34 months.
Analyses of selected CFC concentrations in ground-water samples from nine wells and one spring were used to estimate when the sampled water entered the ground-water system and, therefore, the age of ground water at the sampling locations. The selected CFC’s, CFC-11, CFC-12, and CFC-113, have been used as refrigerants and aerosol propellants since about 1940. The concentration of each CFC in the atmosphere and, therefore, in recharge water that is in equilibrium with the atmosphere, has been measured or reconstructed for 1940 to the present (2003). The concentrations of these chemicals in ground-water samples provide an estimate of when the sampled water entered the ground-water system. Apparent ground-water ages ranged from as young as about 10 to 16 years in an alluvial drainage composed of unconsolidated material eroded from the adjacent Sandia Mountains to as old as about 20 to 26 years in fractured and solution-channeled limestone in the southern part of the study area.
The range in ground-water age in consolidated rocks throughout the study area is about 16.5 to 23 years. This young age and the similarity in ground-water ages throughout the study area suggest that recharge occurs rapidly through
24 Precipitation; Ground-Water Age; Nitrate Concentrations; and Levels in Eastern Bernalillo County, New Mexico
fractured and solution-channeled limestone and that recently recharged ground water mixes with older water in the groundwater system along flow paths upgradient from the sampled wells.
Concentrations of dissolved nitrate in samples from 24 wells collected during 2001-02 were similar to concentrations in samples collected from the same wells during 1995, 1997, and (or) 1998. Nitrate concentrations in two wells were larger than the USEPA primary drinking-water regulation of 10 mg/L in 1998 and in 2001. The 2001 concentrations, however, were less than those in the previous samples collected during 1998.
Ground-water levels were measured during June and July 2002 and during June, July, and August 2003 in 18 monitoring wells. From 2002 to 2003, water levels rose in five wells; the rises ranged from 0.07 to 1.51 feet. Water levels declined in 13 wells; the declines ranged from 1.11 to 17.66 feet. The median change in water level for all 18 wells was a decline of 2.03 feet.
References
Blanchard, P.J., 2003, Water quality and depth to water, 200102, and graphs of selected constituents and depth to water, period of record through 2002, in selected wells, eastern Bernalillo County, New Mexico: U.S. Geological Survey Open-File Report 03-81, 37 p.
Blanchard, P.J., and Kues, G.E., 1999, Ground-water quality and susceptibility of ground water to effects from domestic wastewater disposal in eastern Bernalillo County, central New Mexico, 1990-91: U.S. Geological Survey Water-Resources Investigations Report 99-4096, 109 p.
Fishman, M.J., and Friedman, L.C., eds., 1989, Methods for the determination of inorganic substances in water and fluvial sediments: U.S. Geological Survey Techniques of Water-Resources Investigations, book 5, chap. A1, 545 p.
National Oceanic and Atmospheric Administration, 2002, Web climate services: National Oceanic and Atmospheric Administration data available on the Web, accessed January 15, 2003, at http://www.ncdc.noaa.gov/oa/climate/stationlocator.html .
Plummer, L.N., and Busenberg, E., 1999, Chlorofluorocarbons, in Cook, Peter, and Herczeg, Andrew, eds., Environmental tracers in subsurface hydrology: Kluwer Academic Publishers, 552 p.
Rankin, D.R., 2000, Water-quality and ground-water-level trends, 1990-99, and data collected from 1995 through 1999, east mountain area, Bernalillo County, central New Mexico: U.S. Geological Survey Open-File Report 00-476, 41 p.
Titus, F.B., 1980, Ground water in the Sandia and northern Manzano Mountains, New Mexico: Socorro, New Mexico Bureau of Mines and Mineral Resources Hydrologic Report 5, 66 p.
U.S. Environmental Protection Agency, 2002, Current drinking water standards; National primary drinking water regulations: EPA 816-F-02-013, July 2002, 4 p.
U.S. Geological Survey, 2003, The Reston Chlorofluorocarbon Laboratory: U.S. Geological Survey information available on the Web, accessed February 4, 2003, at http://water.usgs.gov/lab/cfc .
Wilde, F.D., Radtke, D.B., Gibs, J., and Iwatsubo, R.T., eds., 1998, National field manual for the collection of water-quality data: U.S. Geological Survey Techniques of Water-Resources Investigations, book 9, chap. A4 and A5, 103 and 128 p.

Supplemental Data
26 Table 10. Monthly and annual precipitation at U.S. Geological Survey and volunteer precipitation sites, 2001-03.
Nov Dec Annual
1.79 3.45 12.71
0.97 1.30 12.21
0.03 1.40 7.85
2.01 2.17 13.82
0.92 0.26 9.95
0.11 1.45 18.21
1.17 1.32 13.75
0.90 0.74 9.73
1.36 0.79 15.52
3.04 0.76 11.17
0.00 0.00 2.56
ND ND 5.86
2.94 2.56 12.24
0.93 0.36 7.41
1.04 0.81 6.78
2.18 0.53 11.70
0.36 0.24 3.75
0.99 0.46 7.91
1.56 0.77 12.47
0.60 0.62 11.28
1.27 0.44 10.50
Precipitation; Ground-W
ater Age; N
itrate Concentrations; and Levels in Eastern Bernalillo County, N
ew M
exico
[ND, no data; bold values, more than 10 days of data missing]
Year Jan Feb Mar Apr May June July Aug Sept Oct
Site 1: Sandia Mountains high altitude (start of data collection: 3/2/2001)
2001 ND ND 1.79 0.97 0.00 0.00 0.19 3.73 0.51 0.28
2002 1.49 1.19 0.01 1.53 0.39 0.37 2.21 0.09 1.21 1.45
2003 0.22 0.80 1.34 0.70 0.30 0.37 ND 0.28 0.94 1.47
Site 2: Sandia Mountains intermediate altitude (start of data collection: 3/1/2001)
2001 ND ND 1.93 2.55 0.64 0.00 0.19 3.56 0.37 0.40
2002 1.89 0.77 0.00 0.80 0.23 0.11 2.61 1.77 0.37 0.22
2003 1.67 2.27 3.44 0.50 0.27 1.10 0.12 4.83 0.80 1.65
Site 3: Sandia Mountains low altitude (start of data collection: 1/17/2001)
2001 1.32 1.18 1.35 1.14 0.73 0.62 1.86 2.56 0.23 0.27
2002 1.01 0.00 0.10 0.36 0.43 0.03 2.32 0.92 2.07 0.85
2003 1.09 2.53 1.34 0.24 1.03 1.65 0.72 2.87 0.58 1.32
Site 4: Manzanita Mountains high altitude (start of data collection: 3/1/2001)
2001 ND ND 1.10 0.68 0.19 0.00 0.49 4.45 0.33 0.13
2002 2.45 0.00 0.10 0.00 0.01 0.00 0.00 0.00 0.00 0.00
2003 1.76 0.20 0.36 0.04 0.03 0.75 0.08 2.58 0.00 0.06
Site 5: Manzanita Mountains intermediate altitude (start of data collection: 1/25/2001)
2001 1.02 1.11 1.57 0.88 0.34 0.00 0.04 1.36 0.27 0.15
2002 0.99 0.00 0.01 0.67 0.15 0.09 2.05 0.69 0.17 1.30
2003 0.19 0.09 0.08 0.01 0.00 0.04 0.09 2.26 1.01 1.16
Site 6: Manzanita Mountains low altitude (start of data collection: 12/31/2000)
2001 1.11 0.55 1.74 0.28 1.16 0.00 0.64 2.85 0.39 0.27
2002 0.32 0.26 0.29 0.31 0.06 0.00 0.01 0.00 0.00 1.90
2003 0.32 0.07 0.06 0.15 0.02 0.37 0.23 2.35 1.30 1.59
Site 7: Tijeras, N. Mex. (start of data collection: 3/8/2001)
2001 ND ND 0.88 0.95 0.67 1.30 3.18 2.46 0.49 0.21
2002 0.46 0.07 0.01 0.68 0.13 0.41 3.68 1.04 2.53 1.05
2003 0.01 1.81 0.97 0.19 0.26 1.02 0.44 2.46 0.84 0.79
27
Oct Nov Dec
ND ND 2.77
1.04 0.57 0.85
0.15 0.13 2.62
1.40 0.13 0.47
4.67 3.64 1.00
3.03 2.68 2.63
2.87 0.25 5.38
4.79 0.35 1.83
0.65 1.38 2.40
1.41 1.90 1.72
1.10 1.58 0.35
0.33 1.50 1.95
1.82 0.89 5.23
0.05 0.55 0.77
0.30 1.21 1.91
0.23 2.51 3.64
4.25 0.75 2.88
1.14 0.69 1.16
2.37 3.00 3.61
5.79 1.20 2.61
0.75 2.44 0.68
5.09 0.76 1.78
0.00 1.99 0.84
0.12 0.46 0.34
0.57 1.39 0.76
1.71 2.60 2.16
ND ND ND
Supplemental D
ata
Table 11. Precipitation at Sandia Crest, in inches, 1953-79.[ND, no data; bold values, estimated precipitation]
Year Jan Feb Mar Apr May June July Aug Sept
1953 ND ND ND ND ND ND ND ND ND 1954 2.00 0.36 2.37 0.05 2.19 1.45 3.05 1.48 1.37
1955 1.58 1.61 0.43 0.27 1.32 0.45 6.23 4.23 1.05
1956 2.39 1.80 Trace 0.35 0.18 0.47 4.47 1.96 0.07
1957 2.16 2.28 3.76 2.80 2.51 0.32 3.09 3.50 0.45
1958 2.13 1.18 6.55 3.21 0.38 0.02 0.49 2.67 4.56
1959 0.83 0.30 2.43 2.16 0.80 0.92 1.85 6.18 0.10
1960 3.15 2.43 2.18 0.50 1.22 1.60 1.06 1.46 0.94
1961 2.14 1.46 3.04 1.43 0.39 0.16 2.10 3.43 1.06
1962 1.59 1.88 1.59 0.30 0.05 0.34 3.85 1.42 2.60
1963 1.28 2.86 1.68 0.78 0.12 0.39 1.20 7.64 1.49
1964 0.62 2.64 1.14 1.28 2.52 0.00 5.37 2.15 1.90
1965 1.15 2.40 2.62 1.05 0.18 3.29 1.47 2.12 3.76
1966 0.88 1.39 0.25 0.01 0.56 3.88 3.37 2.65 1.18
1967 0.28 1.70 0.55 0.35 0.05 2.02 4.79 6.61 2.22
1968 0.65 2.83 4.24 2.73 1.25 0.24 4.70 5.70 0.71
1969 2.46 2.45 1.64 1.15 2.32 1.24 3.00 2.24 1.42
1970 0.17 1.19 3.47 1.38 0.24 1.10 3.92 3.73 1.89
1971 1.82 1.45 0.88 2.81 0.06 0.00 4.03 3.44 1.12
1972 1.52 0.40 0.56 0.06 1.19 1.09 1.91 3.36 3.12
1973 3.72 1.96 6.37 2.96 1.38 1.12 3.91 1.69 2.78
1974 4.10 1.52 1.61 0.17 0.33 0.06 3.13 3.70 2.55
1975 2.52 4.93 3.32 0.90 0.42 Trace 5.47 1.85 4.62
1976 0.37 1.49 2.29 1.24 1.30 0.61 3.38 3.68 0.91
1977 3.70 1.79 0.77 3.19 0.13 0.86 2.25 4.65 1.54
1978 3.70 3.93 4.79 0.77 1.92 2.00 1.73 3.53 2.07
1979 4.84 2.45 2.36 1.57 ND ND ND ND ND
28 Table 12. Precipitation at Sandia Park, in inches, 1939-2001.
Oct Nov Dec
1.69 1.47 0.49
0.72 3.06 2.56
5.29 2.18 1.33
2.84 Trace 4.55
ND ND ND
1.18 1.62 1.98
1.27 0.00 2.21
2.52 3.37 0.91
0.70 1.52 1.49
ND 1.10 0.74
0.36 0.15 0.95
0.04 0.00 0.02
0.73 0.79 1.79
0.00 1.96 0.86
0.87 2.14 0.83
0.70 0.27 0.62
0.14 0.24 1.85
1.69 0.27 0.24
2.81 3.33 0.25
2.04 1.82 1.38
ND ND ND
ND 0.45 ND
0.40 1.47 1.37
1.11 1.88 1.14
1.29 0.72 0.30
0.31 0.98 1.23
1.49 2.14 4.38
0.42 0.21 1.33
0.44 0.69 1.76
0.39 1.41 1.53
4.15 1.24 2.24
2.07 0.62 0.55
Precipitation; Ground-W
ater Age; N
itrate Concentrations; and Levels in Eastern Bernalillo County, N
ew M
exico
[ND, no data; bold values, estimated precipitation; bold italicized values, incomplete data (missing 1 to 9 days of data)]
Year Jan Feb Mar Apr May June July Aug Sept
1939 2.60 0.79 2.31 1.27 0.10 0.24 3.01 3.05 2.46
1940 1.29 2.60 2.06 0.73 1.69 0.57 0.48 2.72 1.66
1941 2.51 1.07 4.18 2.50 3.96 0.93 4.01 1.51 3.29
1942 0.35 ND ND ND 0.25 0.54 0.26 3.99 2.29
1943 0.81 ND ND ND ND ND ND 3.86 0.43
1944 ND ND 1.72 1.27 0.30 0.43 3.54 3.07 1.43
1945 1.67 ND ND 1.92 0.00 0.30 2.54 3.24 1.05
1946 1.22 0.10 0.82 0.89 0.63 0.33 2.75 6.52 0.72
1947 0.41 0.39 0.37 0.42 1.04 0.45 1.30 3.89 0.60
1948 1.16 2.68 2.00 0.74 0.82 1.25 1.27 ND ND
1949 2.10 0.00 1.86 1.82 2.14 0.92 3.06 ND ND 1950 1.66 0.97 0.24 0.24 0.18 0.40 6.43 1.16 2.88
1951 1.56 0.44 0.96 0.44 0.48 0.03 3.10 3.67 0.05
1952 0.99 0.87 1.63 1.00 1.96 1.32 1.70 4.39 1.57
1953 0.42 1.13 1.70 1.33 0.87 3.04 1.43 1.81 Trace
1954 1.18 0.07 1.71 0.02 1.02 1.05 4.48 2.70 1.28
1955 0.68 1.02 0.07 0.37 1.16 0.46 3.78 4.46 2.37
1956 1.03 0.90 Trace 0.17 0.39 0.55 2.90 1.82 0.00
1957 1.45 1.71 2.22 0.95 1.61 0.11 4.36 4.42 0.17
1958 0.96 1.11 3.44 3.02 0.67 0.24 0.20 3.10 5.49
1959 0.35 ND ND 1.64 ND ND 2.12 4.10 ND
1960 ND ND ND ND 1.15 4.19 1.26 2.20 0.40
1961 0.94 0.67 1.25 1.70 0.51 0.57 2.52 3.56 1.26
1962 0.78 1.44 0.76 0.11 0.24 0.97 6.18 0.95 1.90
1963 0.63 2.43 2.07 0.55 0.26 0.79 1.05 5.23 1.13
1964 0.69 2.62 0.46 1.61 2.27 Trace 3.64 2.36 1.67
1965 1.38 1.72 1.68 1.05 0.81 2.69 3.72 3.18 2.99
1966 1.32 0.36 0.05 0.11 0.79 1.86 4.07 1.76 1.16
1967 0.61 1.27 1.12 0.34 0.28 2.07 2.63 5.19 1.48
1968 0.08 2.40 3.31 1.39 1.04 0.11 3.40 4.34 0.13
1969 1.19 1.50 1.29 1.91 3.47 1.00 1.15 3.85 3.42
1970 0.09 0.39 1.82 0.58 0.05 0.85 3.93 2.37 1.34
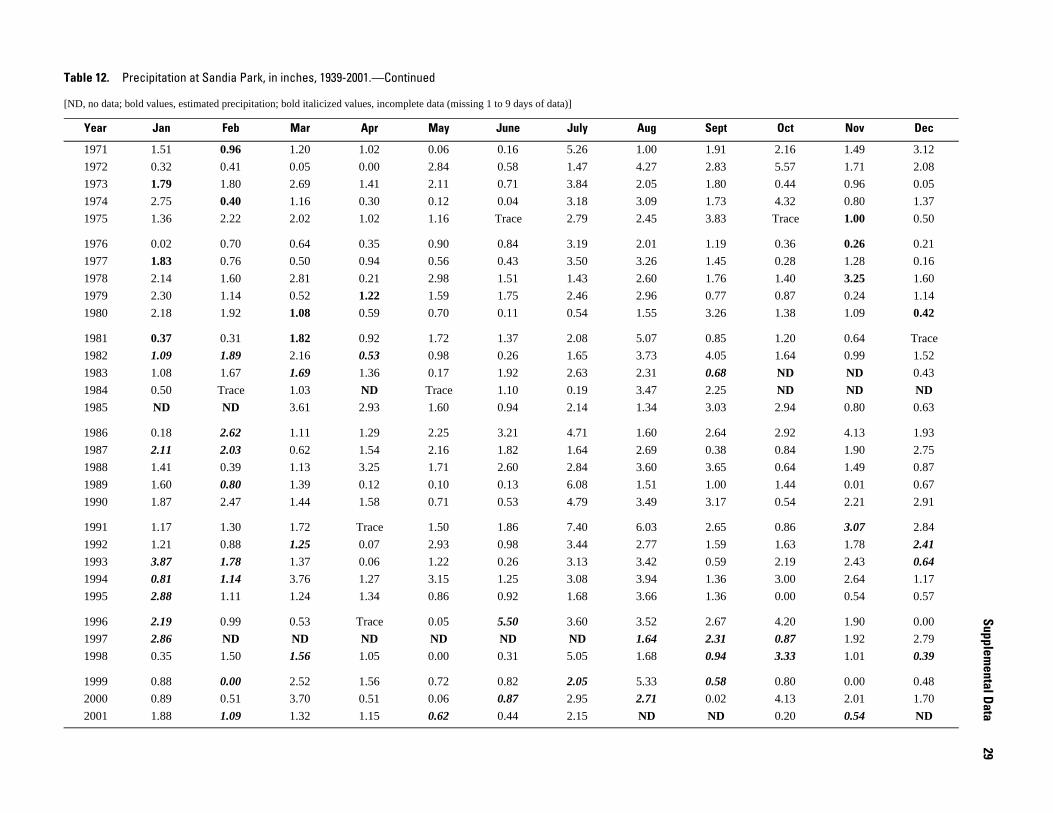
29 Table 12. Precipitation at Sandia Park, in inches, 1939-2001.—Continued
Oct Nov Dec
2.16 1.49 3.12
5.57 1.71 2.08
0.44 0.96 0.05
4.32 0.80 1.37
Trace 1.00 0.50
0.36 0.26 0.21
0.28 1.28 0.16
1.40 3.25 1.60
0.87 0.24 1.14
1.38 1.09 0.42
1.20 0.64 Trace
1.64 0.99 1.52
ND ND 0.43
ND ND ND 2.94 0.80 0.63
2.92 4.13 1.93
0.84 1.90 2.75
0.64 1.49 0.87
1.44 0.01 0.67
0.54 2.21 2.91
0.86 3.07 2.84
1.63 1.78 2.41
2.19 2.43 0.64
3.00 2.64 1.17
0.00 0.54 0.57
4.20 1.90 0.00
0.87 1.92 2.79
3.33 1.01 0.39
0.80 0.00 0.48
4.13 2.01 1.70
0.20 0.54 ND
Supplemental D
ata
[ND, no data; bold values, estimated precipitation; bold italicized values, incomplete data (missing 1 to 9 days of data)]
Year Jan Feb Mar Apr May June July Aug Sept
1971 1.51 0.96 1.20 1.02 0.06 0.16 5.26 1.00 1.91
1972 0.32 0.41 0.05 0.00 2.84 0.58 1.47 4.27 2.83
1973 1.79 1.80 2.69 1.41 2.11 0.71 3.84 2.05 1.80
1974 2.75 0.40 1.16 0.30 0.12 0.04 3.18 3.09 1.73
1975 1.36 2.22 2.02 1.02 1.16 Trace 2.79 2.45 3.83
1976 0.02 0.70 0.64 0.35 0.90 0.84 3.19 2.01 1.19
1977 1.83 0.76 0.50 0.94 0.56 0.43 3.50 3.26 1.45
1978 2.14 1.60 2.81 0.21 2.98 1.51 1.43 2.60 1.76
1979 2.30 1.14 0.52 1.22 1.59 1.75 2.46 2.96 0.77
1980 2.18 1.92 1.08 0.59 0.70 0.11 0.54 1.55 3.26
1981 0.37 0.31 1.82 0.92 1.72 1.37 2.08 5.07 0.85
1982 1.09 1.89 2.16 0.53 0.98 0.26 1.65 3.73 4.05
1983 1.08 1.67 1.69 1.36 0.17 1.92 2.63 2.31 0.68
1984 0.50 Trace 1.03 ND Trace 1.10 0.19 3.47 2.25
1985 ND ND 3.61 2.93 1.60 0.94 2.14 1.34 3.03
1986 0.18 2.62 1.11 1.29 2.25 3.21 4.71 1.60 2.64
1987 2.11 2.03 0.62 1.54 2.16 1.82 1.64 2.69 0.38
1988 1.41 0.39 1.13 3.25 1.71 2.60 2.84 3.60 3.65
1989 1.60 0.80 1.39 0.12 0.10 0.13 6.08 1.51 1.00
1990 1.87 2.47 1.44 1.58 0.71 0.53 4.79 3.49 3.17
1991 1.17 1.30 1.72 Trace 1.50 1.86 7.40 6.03 2.65
1992 1.21 0.88 1.25 0.07 2.93 0.98 3.44 2.77 1.59
1993 3.87 1.78 1.37 0.06 1.22 0.26 3.13 3.42 0.59
1994 0.81 1.14 3.76 1.27 3.15 1.25 3.08 3.94 1.36
1995 2.88 1.11 1.24 1.34 0.86 0.92 1.68 3.66 1.36
1996 2.19 0.99 0.53 Trace 0.05 5.50 3.60 3.52 2.67
1997 2.86 ND ND ND ND ND ND 1.64 2.31
1998 0.35 1.50 1.56 1.05 0.00 0.31 5.05 1.68 0.94
1999 0.88 0.00 2.52 1.56 0.72 0.82 2.05 5.33 0.58
2000 0.89 0.51 3.70 0.51 0.06 0.87 2.95 2.71 0.02
2001 1.88 1.09 1.32 1.15 0.62 0.44 2.15 ND ND
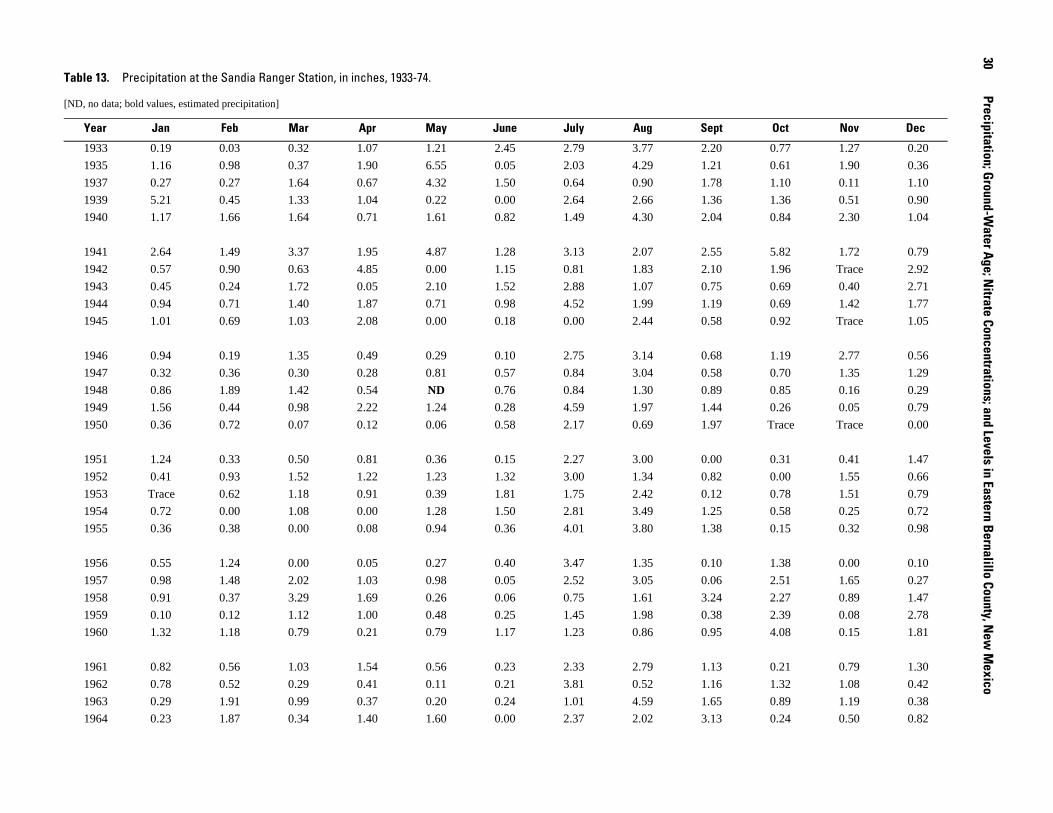
30 Table 13. Precipitation at the Sandia Ranger Station, in inches, 1933-74.
Oct Nov Dec
0.77 1.27 0.20
0.61 1.90 0.36
1.10 0.11 1.10
1.36 0.51 0.90
0.84 2.30 1.04
5.82 1.72 0.79
1.96 Trace 2.92
0.69 0.40 2.71
0.69 1.42 1.77
0.92 Trace 1.05
1.19 2.77 0.56
0.70 1.35 1.29
0.85 0.16 0.29
0.26 0.05 0.79
Trace Trace 0.00
0.31 0.41 1.47
0.00 1.55 0.66
0.78 1.51 0.79
0.58 0.25 0.72
0.15 0.32 0.98
1.38 0.00 0.10
2.51 1.65 0.27
2.27 0.89 1.47
2.39 0.08 2.78
4.08 0.15 1.81
0.21 0.79 1.30
1.32 1.08 0.42
0.89 1.19 0.38
0.24 0.50 0.82
Precipitation; Ground-W
ater Age; N
itrate Concentrations; and Levels in Eastern Bernalillo County, N
ew M
exico
[ND, no data; bold values, estimated precipitation]
Year Jan Feb Mar Apr May June July Aug Sept
1933 0.19 0.03 0.32 1.07 1.21 2.45 2.79 3.77 2.20
1935 1.16 0.98 0.37 1.90 6.55 0.05 2.03 4.29 1.21
1937 0.27 0.27 1.64 0.67 4.32 1.50 0.64 0.90 1.78
1939 5.21 0.45 1.33 1.04 0.22 0.00 2.64 2.66 1.36
1940 1.17 1.66 1.64 0.71 1.61 0.82 1.49 4.30 2.04
1941 2.64 1.49 3.37 1.95 4.87 1.28 3.13 2.07 2.55
1942 0.57 0.90 0.63 4.85 0.00 1.15 0.81 1.83 2.10
1943 0.45 0.24 1.72 0.05 2.10 1.52 2.88 1.07 0.75
1944 0.94 0.71 1.40 1.87 0.71 0.98 4.52 1.99 1.19
1945 1.01 0.69 1.03 2.08 0.00 0.18 0.00 2.44 0.58
1946 0.94 0.19 1.35 0.49 0.29 0.10 2.75 3.14 0.68
1947 0.32 0.36 0.30 0.28 0.81 0.57 0.84 3.04 0.58
1948 0.86 1.89 1.42 0.54 ND 0.76 0.84 1.30 0.89
1949 1.56 0.44 0.98 2.22 1.24 0.28 4.59 1.97 1.44
1950 0.36 0.72 0.07 0.12 0.06 0.58 2.17 0.69 1.97
1951 1.24 0.33 0.50 0.81 0.36 0.15 2.27 3.00 0.00
1952 0.41 0.93 1.52 1.22 1.23 1.32 3.00 1.34 0.82
1953 Trace 0.62 1.18 0.91 0.39 1.81 1.75 2.42 0.12
1954 0.72 0.00 1.08 0.00 1.28 1.50 2.81 3.49 1.25
1955 0.36 0.38 0.00 0.08 0.94 0.36 4.01 3.80 1.38
1956 0.55 1.24 0.00 0.05 0.27 0.40 3.47 1.35 0.10
1957 0.98 1.48 2.02 1.03 0.98 0.05 2.52 3.05 0.06
1958 0.91 0.37 3.29 1.69 0.26 0.06 0.75 1.61 3.24
1959 0.10 0.12 1.12 1.00 0.48 0.25 1.45 1.98 0.38
1960 1.32 1.18 0.79 0.21 0.79 1.17 1.23 0.86 0.95
1961 0.82 0.56 1.03 1.54 0.56 0.23 2.33 2.79 1.13
1962 0.78 0.52 0.29 0.41 0.11 0.21 3.81 0.52 1.16
1963 0.29 1.91 0.99 0.37 0.20 0.24 1.01 4.59 1.65
1964 0.23 1.87 0.34 1.40 1.60 0.00 2.37 2.02 3.13
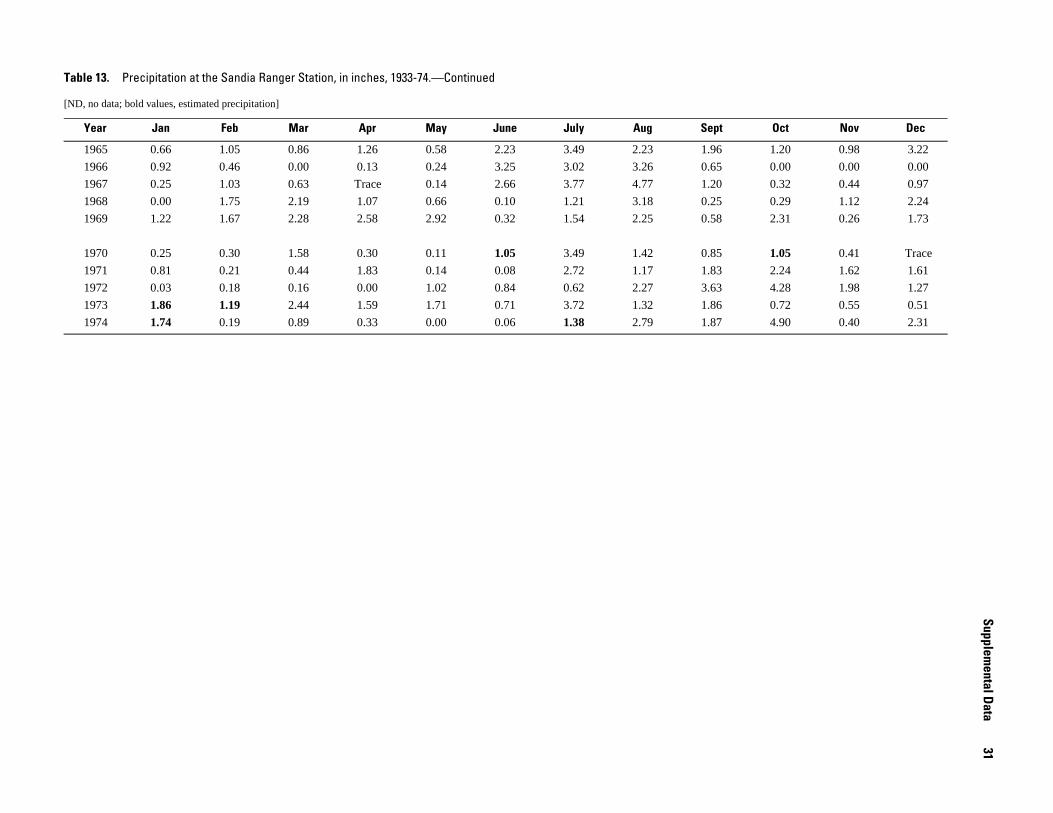
31 Table 13. Precipitation at the Sandia Ranger Station, in inches, 1933-74.—Continued
Oct Nov Dec
.20 0.98 3.22
.00 0.00 0.00
.32 0.44 0.97
.29 1.12 2.24
.31 0.26 1.73
.05 0.41 Trace
.24 1.62 1.61
.28 1.98 1.27
.72 0.55 0.51
.90 0.40 2.31
Supplemental D
ata
[ND, no data; bold values, estimated precipitation]
Year Jan Feb Mar Apr May June July Aug Sept
1965 0.66 1.05 0.86 1.26 0.58 2.23 3.49 2.23 1.96 1
1966 0.92 0.46 0.00 0.13 0.24 3.25 3.02 3.26 0.65 0
1967 0.25 1.03 0.63 Trace 0.14 2.66 3.77 4.77 1.20 0
1968 0.00 1.75 2.19 1.07 0.66 0.10 1.21 3.18 0.25 0
1969 1.22 1.67 2.28 2.58 2.92 0.32 1.54 2.25 0.58 2
1970 0.25 0.30 1.58 0.30 0.11 1.05 3.49 1.42 0.85 1
1971 0.81 0.21 0.44 1.83 0.14 0.08 2.72 1.17 1.83 2
1972 0.03 0.18 0.16 0.00 1.02 0.84 0.62 2.27 3.63 4
1973 1.86 1.19 2.44 1.59 1.71 0.71 3.72 1.32 1.86 0
1974 1.74 0.19 0.89 0.33 0.00 0.06 1.38 2.79 1.87 4
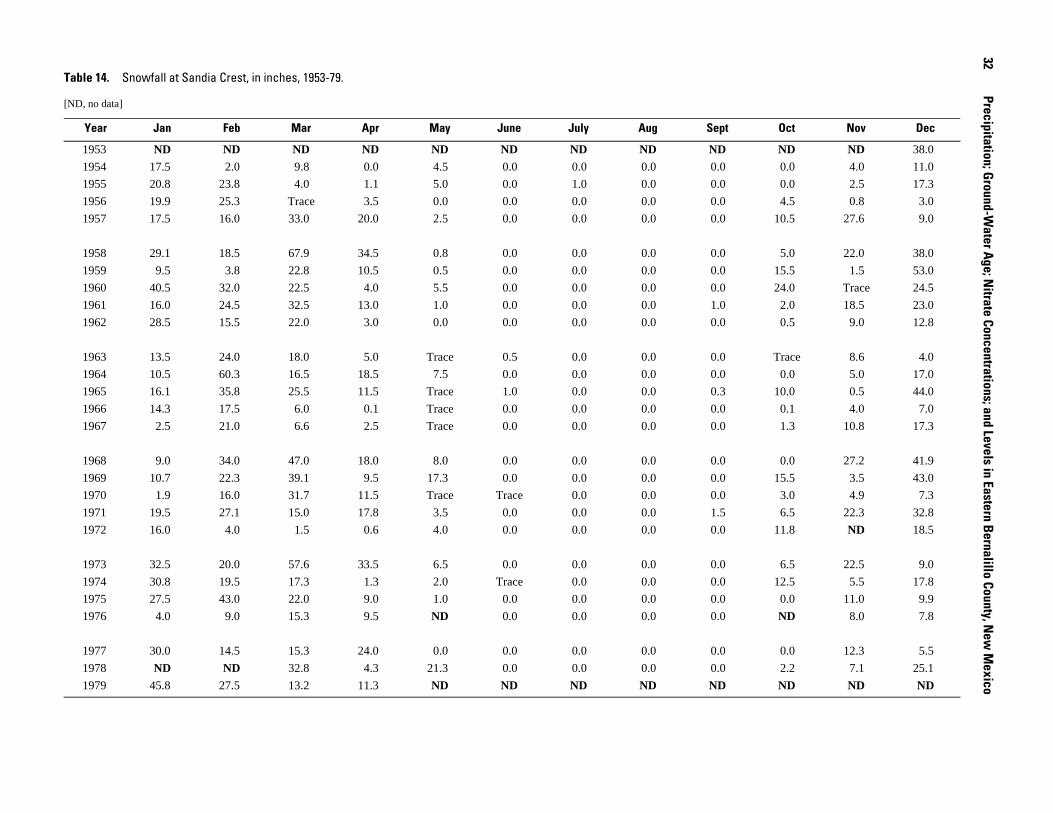
32 Table 14. Snowfall at Sandia Crest, in inches, 1953-79.
Oct Nov Dec
ND ND 38.0
0.0 4.0 11.0
0.0 2.5 17.3
4.5 0.8 3.0
10.5 27.6 9.0
5.0 22.0 38.0
15.5 1.5 53.0
24.0 Trace 24.5
2.0 18.5 23.0
0.5 9.0 12.8
Trace 8.6 4.0
0.0 5.0 17.0
10.0 0.5 44.0
0.1 4.0 7.0
1.3 10.8 17.3
0.0 27.2 41.9
15.5 3.5 43.0
3.0 4.9 7.3
6.5 22.3 32.8
11.8 ND 18.5
6.5 22.5 9.0
12.5 5.5 17.8
0.0 11.0 9.9
ND 8.0 7.8
0.0 12.3 5.5
2.2 7.1 25.1
ND ND ND
Precipitation; Ground-W
ater Age; N
itrate Concentrations; and Levels in Eastern Bernalillo County, N
ew M
exico
[ND, no data]
Year Jan Feb Mar Apr May June July Aug Sept
1953 ND ND ND ND ND ND ND ND ND
1954 17.5 2.0 9.8 0.0 4.5 0.0 0.0 0.0 0.0
1955 20.8 23.8 4.0 1.1 5.0 0.0 1.0 0.0 0.0
1956 19.9 25.3 Trace 3.5 0.0 0.0 0.0 0.0 0.0
1957 17.5 16.0 33.0 20.0 2.5 0.0 0.0 0.0 0.0
1958 29.1 18.5 67.9 34.5 0.8 0.0 0.0 0.0 0.0
1959 9.5 3.8 22.8 10.5 0.5 0.0 0.0 0.0 0.0
1960 40.5 32.0 22.5 4.0 5.5 0.0 0.0 0.0 0.0
1961 16.0 24.5 32.5 13.0 1.0 0.0 0.0 0.0 1.0
1962 28.5 15.5 22.0 3.0 0.0 0.0 0.0 0.0 0.0
1963 13.5 24.0 18.0 5.0 Trace 0.5 0.0 0.0 0.0
1964 10.5 60.3 16.5 18.5 7.5 0.0 0.0 0.0 0.0
1965 16.1 35.8 25.5 11.5 Trace 1.0 0.0 0.0 0.3
1966 14.3 17.5 6.0 0.1 Trace 0.0 0.0 0.0 0.0
1967 2.5 21.0 6.6 2.5 Trace 0.0 0.0 0.0 0.0
1968 9.0 34.0 47.0 18.0 8.0 0.0 0.0 0.0 0.0
1969 10.7 22.3 39.1 9.5 17.3 0.0 0.0 0.0 0.0
1970 1.9 16.0 31.7 11.5 Trace Trace 0.0 0.0 0.0
1971 19.5 27.1 15.0 17.8 3.5 0.0 0.0 0.0 1.5
1972 16.0 4.0 1.5 0.6 4.0 0.0 0.0 0.0 0.0
1973 32.5 20.0 57.6 33.5 6.5 0.0 0.0 0.0 0.0
1974 30.8 19.5 17.3 1.3 2.0 Trace 0.0 0.0 0.0
1975 27.5 43.0 22.0 9.0 1.0 0.0 0.0 0.0 0.0
1976 4.0 9.0 15.3 9.5 ND 0.0 0.0 0.0 0.0
1977 30.0 14.5 15.3 24.0 0.0 0.0 0.0 0.0 0.0
1978 ND ND 32.8 4.3 21.3 0.0 0.0 0.0 0.0
1979 45.8 27.5 13.2 11.3 ND ND ND ND ND
33
Oct Nov Dec
0 3.2 7
2.5 20 3
Trace 4 18
ND 0 5
ND ND ND
0 1.5 13
Trace 0 12
0 35 3
0 26 16.3
ND ND 2
ND ND ND ND 0 5
0 0 Trace
0 2.5 22
0 20 11
0 12 14.5
0 Trace 15
0 3 7.5
Trace 1 3
Trace 17 ND
3 ND ND
ND ND ND
ND 0 ND 0 8 19
0 3.5 4
0 2.5 ND 0 1 6.4
Trace Trace ND
Trace ND 4
Trace 5.1 22
0 6.5 17
ND 6 ND
Supplemental D
ata
Table 15. Snowfall at Sandia Park, in inches, 1939-2001.
[ND, no data; bold italicized values, incomplete data (missing 1 to 9 days of data)]
Year Jan Feb Mar Apr May June July Aug Sept
1939 35.5 22.8 7 2 0 0 0 0 0
1940 13 26 12 5 0 0 0 0 0
1941 25 4 35.5 6 0 0 0 0 0
1942 3 ND ND ND 0 0 0 0 0
1943 5 ND ND ND ND ND ND 0 0
1944 ND ND 12 5 0 0 0 0 0
1945 10 ND ND 7 0 0 0 0 2
1946 17.5 2 4 0 0 0 0 0 0
1947 10.5 3.5 5 5.5 0 0 0 0 0
1948 ND ND ND ND ND 0 0 ND ND
1948 16 32.5 21 2 0 ND ND ND ND 1949 32.8 ND 14 21 0 0 Trace ND ND
1950 5 10.5 1.5 ND 0 0 0 Trace Trace
1951 22 1.5 7.5 1.8 Trace 0 0 0 0
1952 2.5 5 15 1 3 0 0 0 Trace
1953 6 18.5 6.8 Trace ND Trace 0 Trace 0
1954 15 1 2.5 0 Trace 0 Trace Trace 0
1955 12 7 1 0 Trace 0 0 0 Trace
1956 7.5 19 Trace 2 Trace 0 0 0 0
1957 9 4 4.5 6 Trace 0 0 0 0
1958 19.3 7.5 35 24.5 0 0 0 0 0
1959 ND ND ND ND ND ND 0 0 ND
1960 ND ND ND ND 0 0 0 0 0
1961 ND ND ND ND Trace 0 0 0 0
1962 5.8 4 3.5 0 Trace 0 0 0 0
1963 10 10.5 9.5 Trace 0 0 0 0 0
1964 5.5 26.5 ND ND 0 0 0 0 0
1965 1 12 5 Trace 0 0 0 0 0
1966 13 3 1.5 0.5 0 0 0 0 0
1967 ND ND ND ND 0 0 0 0 0
1968 1 22 40 5 0 0 0 0 0
1969 ND 10.5 ND ND 2 0 0 0 0
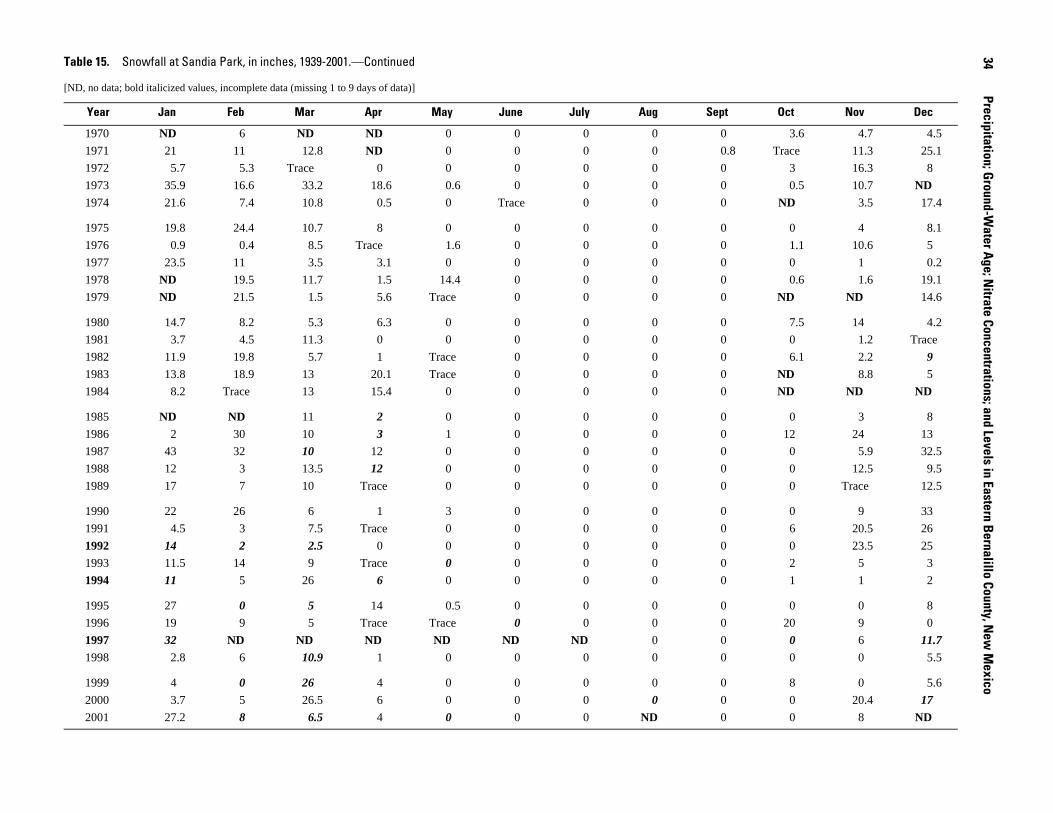
34 Table 15. Snowfall at Sandia Park, in inches, 1939-2001.—Continued
Oct Nov Dec
3.6 4.7 4.5
Trace 11.3 25.1
3 16.3 8
0.5 10.7 ND
ND 3.5 17.4
0 4 8.1
1.1 10.6 5
0 1 0.2
0.6 1.6 19.1
ND ND 14.6
7.5 14 4.2
0 1.2 Trace
6.1 2.2 9
ND 8.8 5
ND ND ND
0 3 8
12 24 13
0 5.9 32.5
0 12.5 9.5
0 Trace 12.5
0 9 33
6 20.5 26
0 23.5 25
2 5 3
1 1 2
0 0 8
20 9 0
0 6 11.7
0 0 5.5
8 0 5.6
0 20.4 17
0 8 ND
Precipitation; Ground-W
ater Age; N
itrate Concentrations; and Levels in Eastern Bernalillo County, N
ew M
exico
[ND, no data; bold italicized values, incomplete data (missing 1 to 9 days of data)]
Year Jan Feb Mar Apr May June July Aug Sept
1970 ND 6 ND ND 0 0 0 0 0
1971 21 11 12.8 ND 0 0 0 0 0.8
1972 5.7 5.3 Trace 0 0 0 0 0 0
1973 35.9 16.6 33.2 18.6 0.6 0 0 0 0
1974 21.6 7.4 10.8 0.5 0 Trace 0 0 0
1975 19.8 24.4 10.7 8 0 0 0 0 0
1976 0.9 0.4 8.5 Trace 1.6 0 0 0 0
1977 23.5 11 3.5 3.1 0 0 0 0 0
1978 ND 19.5 11.7 1.5 14.4 0 0 0 0
1979 ND 21.5 1.5 5.6 Trace 0 0 0 0
1980 14.7 8.2 5.3 6.3 0 0 0 0 0
1981 3.7 4.5 11.3 0 0 0 0 0 0
1982 11.9 19.8 5.7 1 Trace 0 0 0 0
1983 13.8 18.9 13 20.1 Trace 0 0 0 0
1984 8.2 Trace 13 15.4 0 0 0 0 0
1985 ND ND 11 2 0 0 0 0 0
1986 2 30 10 3 1 0 0 0 0
1987 43 32 10 12 0 0 0 0 0
1988 12 3 13.5 12 0 0 0 0 0
1989 17 7 10 Trace 0 0 0 0 0
1990 22 26 6 1 3 0 0 0 0
1991 4.5 3 7.5 Trace 0 0 0 0 0
1992 14 2 2.5 0 0 0 0 0 0
1993 11.5 14 9 Trace 0 0 0 0 0
1994 11 5 26 6 0 0 0 0 0
1995 27 0 5 14 0.5 0 0 0 0
1996 19 9 5 Trace Trace 0 0 0 0
1997 32 ND ND ND ND ND ND 0 0
1998 2.8 6 10.9 1 0 0 0 0 0
1999 4 0 26 4 0 0 0 0 0
2000 3.7 5 26.5 6 0 0 0 0 0
2001 27.2 8 6.5 4 0 0 0 ND 0
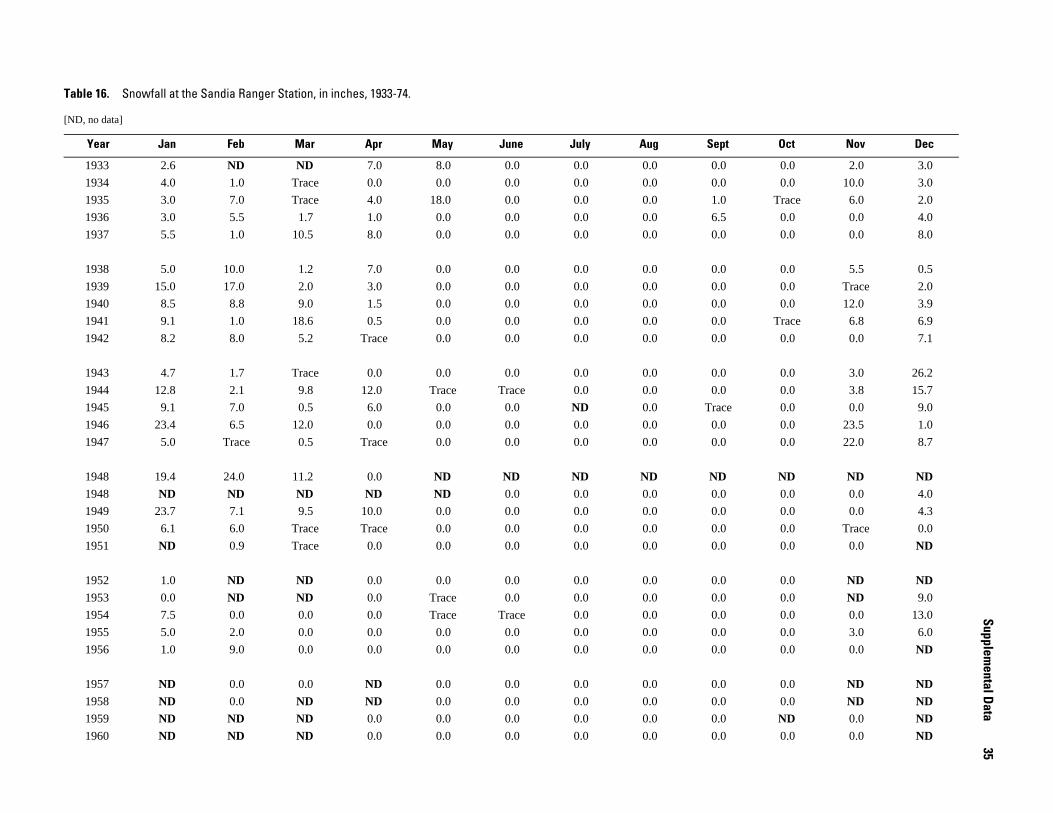
35
Oct Nov Dec
0.0 2.0 3.0
0.0 10.0 3.0
Trace 6.0 2.0
0.0 0.0 4.0
0.0 0.0 8.0
0.0 5.5 0.5
0.0 Trace 2.0
0.0 12.0 3.9
Trace 6.8 6.9
0.0 0.0 7.1
0.0 3.0 26.2
0.0 3.8 15.7
0.0 0.0 9.0
0.0 23.5 1.0
0.0 22.0 8.7
ND ND ND
0.0 0.0 4.0
0.0 0.0 4.3
0.0 Trace 0.0
0.0 0.0 ND
0.0 ND ND
0.0 ND 9.0
0.0 0.0 13.0
0.0 3.0 6.0
0.0 0.0 ND
0.0 ND ND
0.0 ND ND ND 0.0 ND
0.0 0.0 ND
Supplemental D
ata
Table 16. Snowfall at the Sandia Ranger Station, in inches, 1933-74.
[ND, no data]
Year Jan Feb Mar Apr May June July Aug Sept
1933 2.6 ND ND 7.0 8.0 0.0 0.0 0.0 0.0
1934 4.0 1.0 Trace 0.0 0.0 0.0 0.0 0.0 0.0
1935 3.0 7.0 Trace 4.0 18.0 0.0 0.0 0.0 1.0
1936 3.0 5.5 1.7 1.0 0.0 0.0 0.0 0.0 6.5
1937 5.5 1.0 10.5 8.0 0.0 0.0 0.0 0.0 0.0
1938 5.0 10.0 1.2 7.0 0.0 0.0 0.0 0.0 0.0
1939 15.0 17.0 2.0 3.0 0.0 0.0 0.0 0.0 0.0
1940 8.5 8.8 9.0 1.5 0.0 0.0 0.0 0.0 0.0
1941 9.1 1.0 18.6 0.5 0.0 0.0 0.0 0.0 0.0
1942 8.2 8.0 5.2 Trace 0.0 0.0 0.0 0.0 0.0
1943 4.7 1.7 Trace 0.0 0.0 0.0 0.0 0.0 0.0
1944 12.8 2.1 9.8 12.0 Trace Trace 0.0 0.0 0.0
1945 9.1 7.0 0.5 6.0 0.0 0.0 ND 0.0 Trace
1946 23.4 6.5 12.0 0.0 0.0 0.0 0.0 0.0 0.0
1947 5.0 Trace 0.5 Trace 0.0 0.0 0.0 0.0 0.0
1948 19.4 24.0 11.2 0.0 ND ND ND ND ND
1948 ND ND ND ND ND 0.0 0.0 0.0 0.0
1949 23.7 7.1 9.5 10.0 0.0 0.0 0.0 0.0 0.0
1950 6.1 6.0 Trace Trace 0.0 0.0 0.0 0.0 0.0
1951 ND 0.9 Trace 0.0 0.0 0.0 0.0 0.0 0.0
1952 1.0 ND ND 0.0 0.0 0.0 0.0 0.0 0.0
1953 0.0 ND ND 0.0 Trace 0.0 0.0 0.0 0.0
1954 7.5 0.0 0.0 0.0 Trace Trace 0.0 0.0 0.0
1955 5.0 2.0 0.0 0.0 0.0 0.0 0.0 0.0 0.0
1956 1.0 9.0 0.0 0.0 0.0 0.0 0.0 0.0 0.0
1957 ND 0.0 0.0 ND 0.0 0.0 0.0 0.0 0.0
1958 ND 0.0 ND ND 0.0 0.0 0.0 0.0 0.0
1959 ND ND ND 0.0 0.0 0.0 0.0 0.0 0.0
1960 ND ND ND 0.0 0.0 0.0 0.0 0.0 0.0
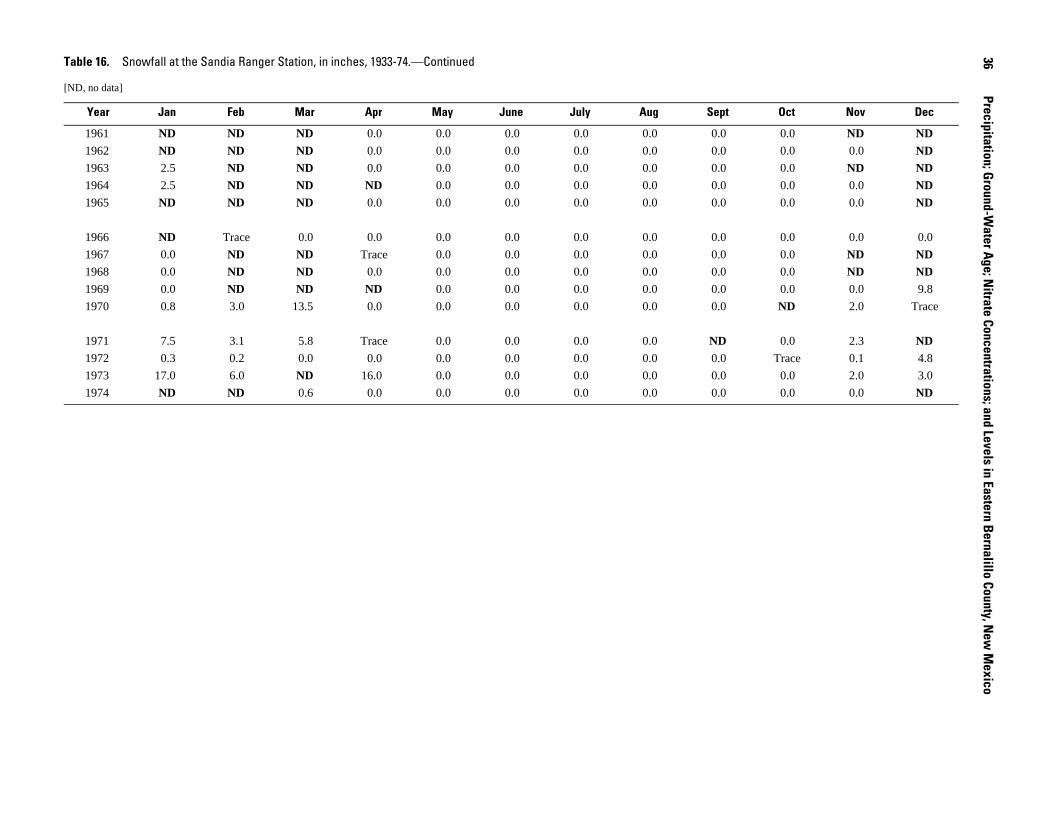
36 Table 16. Snowfall at the Sandia Ranger Station, in inches, 1933-74.—Continued
Oct Nov Dec
0.0 ND ND
0.0 0.0 ND 0.0 ND ND
0.0 0.0 ND
0.0 0.0 ND
0.0 0.0 0.0
0.0 ND ND 0.0 ND ND
0.0 0.0 9.8
ND 2.0 Trace
0.0 2.3 ND
Trace 0.1 4.8
0.0 2.0 3.0
0.0 0.0 ND
Precipitation; Ground-W
ater Age; N
itrate Concentrations; and Levels in Eastern Bernalillo County, N
ew M
exico
[ND, no data]
Year Jan Feb Mar Apr May June July Aug Sept
1961 ND ND ND 0.0 0.0 0.0 0.0 0.0 0.0
1962 ND ND ND 0.0 0.0 0.0 0.0 0.0 0.0
1963 2.5 ND ND 0.0 0.0 0.0 0.0 0.0 0.0
1964 2.5 ND ND ND 0.0 0.0 0.0 0.0 0.0
1965 ND ND ND 0.0 0.0 0.0 0.0 0.0 0.0
1966 ND Trace 0.0 0.0 0.0 0.0 0.0 0.0 0.0
1967 0.0 ND ND Trace 0.0 0.0 0.0 0.0 0.0
1968 0.0 ND ND 0.0 0.0 0.0 0.0 0.0 0.0
1969 0.0 ND ND ND 0.0 0.0 0.0 0.0 0.0
1970 0.8 3.0 13.5 0.0 0.0 0.0 0.0 0.0 0.0
1971 7.5 3.1 5.8 Trace 0.0 0.0 0.0 0.0 ND
1972 0.3 0.2 0.0 0.0 0.0 0.0 0.0 0.0 0.0
1973 17.0 6.0 ND 16.0 0.0 0.0 0.0 0.0 0.0
1974 ND ND 0.6 0.0 0.0 0.0 0.0 0.0 0.0
For more information concerning the research in this report, contact:
Linda Weiss, District Chief U.S. Geological Survey 5338 Montgomery Blvd, NE Suite 400 Albuquerque, NM 87109
or visit our Web site at: http://nm.water.usgs.gov
U.S. Department of the InteriorU.S. Geological Survey
Precipitation; Ground-Water Age; Ground-Water Nitrate Concentrations, 1995-2002;and Ground-Water Levels, 2002-03 inEastern Bernalillo County, New Mexico
Scientific Investigations Report 2004-5189
Prepared in Cooperation with Bernalillo County
Blanchard, Paul J.—Precipitation; G
round-Water A
ge; Ground-W
ater Nitrate Concentrations, 1995-2002; and G
round-Water Levels, 2002-03
in Eastern Bernalillo County, N
ew M
exico—Scientific Investigations Report 2004-5189
Related Documents