Water Related Indicators and Development Trajectories for Sustainable Crop-Livestock Intensification Planning in Ethiopia: the ‘Quick-Water’ toolbox Charlotte MacAlister with Yenenesh Abebe, Teklu Erkossa, Gebrehaweria Gebregziabher, Amare Haileslassie, Simon Langan, An Notenbaert and Catherine Pfeifer This report produced by International Water Management Institute, International Livestock Research Institute, Bahir Dar University, Arba Minch University It is published by International Livestock Research Institute September 25, 2012

Welcome message from author
This document is posted to help you gain knowledge. Please leave a comment to let me know what you think about it! Share it to your friends and learn new things together.
Transcript
Water Related Indicators and Development Trajectories for Sustainable Crop-Livestock
Intensification Planning in Ethiopia: the ‘Quick-Water’ toolbox
Charlotte MacAlister with Yenenesh Abebe, Teklu Erkossa, Gebrehaweria Gebregziabher, Amare Haileslassie, Simon Langan, An Notenbaert and
Catherine Pfeifer
This report produced by
International Water Management Institute, International Livestock Research Institute, Bahir Dar University, Arba Minch University
It is published by International Livestock Research Institute
September 25, 2012
The Africa Research in Sustainable Intensification for the Next Generation (Africa RISING) program comprises three research-for-development projects supported by the United States Agency for International Development as part of the U.S. government’s Feed the Future initiative. Through action research and development partnerships, Africa RISING will create opportunities for smallholder farm households to move out of hunger and poverty through sustainably intensified farming systems that improve food, nutrition, and income security, particularly for women and children, and conserve or enhance the natural resource base. The three projects are led by the International Institute of Tropical Agriculture (in West Africa and East and Southern Africa) and the International Livestock Research Institute (in the Ethiopian Highlands). The International Food Policy Research Institute leads an associated project on monitoring, evaluation and impact assessment.
This document is licensed for use under a Creative Commons Attribution-Noncommercial-Share Alike 3.0 Unported License
Contents
Summary ................................................................................................................................................. 1
Introduction ............................................................................................................................................ 2
Global Experience in Land Use Planning Approaches ............................................................................. 3
Ethiopian Context to Land Use Planning and Agricultural Development ............................................... 6
The MERET Project for Land Regeneration in Ethiopia ....................................................................... 6
Plan for Accelerated and Sustainable Development to End Poverty (PASDEP) .................................. 7
Agricultural Growth Program (AGP) ................................................................................................... 8
Sustainable Land Management (SLM) .............................................................................................. 10
Growth Corridors .............................................................................................................................. 10
The AgWater Solutions Project ......................................................................................................... 11
Identification of potential development strategies, or trajectories, and the indicators applied to assess suitability and likelihood of adoption ........................................................................................ 13
Soil and water conservation in crop livestock systems .................................................................... 14
Rainfed smallholder intensification in crop-livestock systems or agro-pastoralist systems’ and ‘Rainfed commercial farming ............................................................................................................ 14
Livestock based intensification ......................................................................................................... 14
Peri-urban Dairy ................................................................................................................................ 15
Small Scale Irrigation Based Crop Livestock System Intensification ................................................. 15
Large-Scale Irrigation Based Crop-Livestock Intensification ............................................................. 15
Vertisol management........................................................................................................................ 15
Indicators and thresholds of trajectories .......................................................................................... 16
Mapping approach for sustainable intensification trajectories ............................................................ 19
Discussion and next steps ..................................................................................................................... 21
Spatial Distribution of Key Agricultural Intensification Trajectories in Ethiopia................................... 23
References ............................................................................................................................................ 28
Appendix 1: Indicators potentially available as spatial data layers ...................................................... 30
Appendix 2. National Meeting: Africa Rising Tool for Sustainable Crop-Livestock Intensification Planning in Ethiopia, September 14, 2012, Beshale Hotel, Addis Ababa ............................................. 31
1
Summary The ‘Quick-Water’ project on water related indicators for use in sustainable crop-livestock intensification planning in Ethiopia is part of the first phase of the USAID ‘Feed the Future’ program. This multi-stakeholder agricultural research project aims to address global hunger and food security issues in sub-Saharan Africa by supporting the transformation of agricultural systems in areas of high poverty. In the first year of the program (2012) research was commissioned to produce tangible short-term outputs and to provide inputs to support the longer term objectives of ‘Africa RISING’. As part of this program in Ethiopia, six ‘quick win’ projects were established. The Quick-water project provides a proof of concept aimed at improving the targeting of water and landscape interventions through better integration of natural resource management and socio-economic factors used in strategic planning, which in turn will increase both productivity and sustainability of livelihoods in crop livestock systems. The approach adopted is based on identification of development trajectories that take forward existing and planned policy for agricultural intensification. Eight trajectories of change, which combine a number of practices to achieve different objectives have been identified and developed. These trajectories recognize a number of local spatially variable potential opportunities, limitations, existing livelihood and social conditions. To assess the suitability of these trajectories we have selected and applied indicators to evaluate the suitability of a practice, combinations of practices, and the likelihood of their adoption by farmers. For each trajectory a number of spatially explicit indicators (1 to a maximum of 5) were selected. The final product from this development and analysis is a set of maps of suitability. Collectively these elements provide a toolbox for targeting and prioritizing future land use interventions to reduce poverty and improve livelihoods at a landscape scale. To test the proof of concept of the approach we tested the toolbox through two pilot workshops with Ethiopian university researchers and regional policy staff in which we gathered comments on the use and applicability of the approach. These comments will help focus the work if there is a subsequent call for development and incorporation into the wider second phase of Africa RISING. The GIS tool, maps and trajectory tool box are available, together with all of the project detailed
working are available for viewing and downloading from the Africa RISING wiki: http://africa-rising.wikispaces.com/Quick+water
2
Introduction In common with many developing countries agriculture is the main stay of the Ethiopian economy contributing about 47% of the GDP, 90% of exports and forming 85% of employment. The associated agro-processing industries comprise 80% of the manufacturing sector (Ministry of Agriculture and Rural Development, 2009). The Ethiopian Government has demonstrated strong commitment to agriculture and rural development by allocating around 15% of annual public expenditure to agriculture with the objective of transforming the national economy. Currently the major agricultural production systems in Ethiopia are predominately rainfed mixed crop-livestock, pastoral and agropastoral systems. Although Ethiopia is often quoted as a water tower of Africa with an estimated annual runoff of 122Bm3 and about 2.6-6.5Bm3 of potential ground water, the contribution of these resources to improved production and productivity of agriculture is still at early stage (Awulachew et al, 2007). Subsequently Ethiopian farmers are subject to a high degree of vulnerability to climatic variability, including short term droughts and flooding, and longer term trends. According to the National Adaptation Plan of Action (NAPA) of Ethiopia (Abebe, 2007), climate and water related hazards in the country include drought, floods, heavy rains, strong winds, frost and heat waves. Farmers relying on rainfed systems, common throughout Ethiopia, rarely have access to alternative water inputs. With increasing population and growing scarcity of land for extensive agriculture, there is a general agreement that future human food demands must be met through agricultural intensification. Well planned intensification can also facilitate regeneration of degraded land and conservation of fragile ecosystems (Gregory et al, 2002, Cassman et al, 2003, Sadras and Roget, 2004) and ultimately contribute to a wider basket of ecosystem services on which society also relies. The effectiveness and efficiency of agricultural interventions to increase agricultural productivity and sustainability depend on the extent to which the potential and constraints of the target areas are taken into account. This includes biophysical limitations; climate and water related risks; local livelihood and agro-ecological potential, so that multifaceted interventions must be developed and targeted appropriately. Ethiopia has a long history of planned agricultural development dating from the late 19th century (Assefa, 2008) and this has continued to present day. Globally the approach to the targeting of development activities and strategies has changed over time, and this is also reflected in organized Ethiopia agricultural development. In this project report, we review briefly how land suitability and intensification targeting has evolved at a global level (section 2) and provide more background to the Ethiopian context. This is primarily set against agricultural policies and related development vehicles of the last four decades (section 3). From this starting point we have taken a sample of currently favorable development strategies or ‘trajectories’ for sustainable intensification (section 4). These have then been mapped to show the distribution of combined biophysical suitability and likelihood of successful adoption of the trajectories throughout Ethiopia (section 5). To help frame the work in relation to planning we have used livelihood zones for the mapping. The limits of indicators are not fixed and can be adjusted within the simple GIS tool, developed within the project, which allows the user/planner to define and adjust the ranges of suitability indicators. The output from the tool is a set of maps which define areas suitable for targeting of different intensification activities and suggest where multiple trajectories are possible. The detailed progress, outputs and GIS toolbox which permits users to edit the indicators of the trajectories can be downloaded from: http://africa-rising.wikispaces.com/Quick+water
3
Global Experience in Land Use Planning Approaches Globally there is a long history of land use planning approaches dating back to the late 19th century with roots in North America and Europe, and different degrees of application in the developed and developing world. Land-use planning is the systematic assessment of land and water potential, alternatives for land use and economic and social conditions in order to select and adopt the best land-use options. Its purpose is to select and put into practice those land uses that will best meet the needs of the people while safeguarding resources for the future. All kinds of rural land use are involved: agriculture, pastoralism, forestry, wildlife conservation and tourism. Planning involves anticipation of the need for change as well as reactions to it. Its objectives are set by social or political imperatives and must take account of the existing situation. Land-use planning aims to make the best use of limited resources by: • assessing present and future needs and systematically evaluating the land's ability to supply them; • identifying and resolving conflicts between competing uses, between the needs of individuals and those of the community, and between the needs of the present generation and those of future generations; • seeking sustainable options and choosing those that best meet identified needs; • planning to bring about desired changes; • learning from experience. Land use must be economically viable, so one goal of development planning is to make efficient and productive use of the land. Land use must also be socially acceptable. And finally, land use should meet the needs of the present while, at the same time, conserving resources for future generations. Clearly, there are often conflicts between these goals and the final land use plans must take the trade-offs between these goals and different users into account. When going through the process of land use planning it is important to realize that land and associated resources are not everywhere the same. Capital, labour, management skills and technology can be moved to where they are needed. Land cannot be moved, and different areas present different opportunities and different management problems. Nor are land resources unchanging: this is obvious in the case of climate and vegetation, but examples such as the depletion of water resources or the loss of soil by erosion or salinity are reminders that resources can be degraded, in some cases irreversibly. Good information about land resources is thus essential to land-use planning. Land-use decisions are not made just on the basis of land suitability but also according to the demand for products and the extent to which the use of a particular area is critical for a particular purpose. Planning has to integrate information about the suitability of the land, the demands for alternative products or uses and the opportunities for satisfying those demands on the available land, now and in the future. An essential step in land use planning is therefore the evaluation of land suitability. The land suitability can be described in terms of the land use requirements or the qualities the land needs for sustained production. A land quality is a complex attribute of land that has a direct effect on land use. Examples are the availability of water and nutrients, rooting conditions and erosion hazard. Most land qualities are determined by the interaction of several land characteristics, measurable attributes of the land. For example, the quality, ‘availability of water’, is determined by the balance between water demand and water supply. The demand is the potential evaporation from the surface of the crop and the soil; the supply is determined by rainfall, infiltration, storage of water in the soil and the ability of the crop to extract the stored water.
4
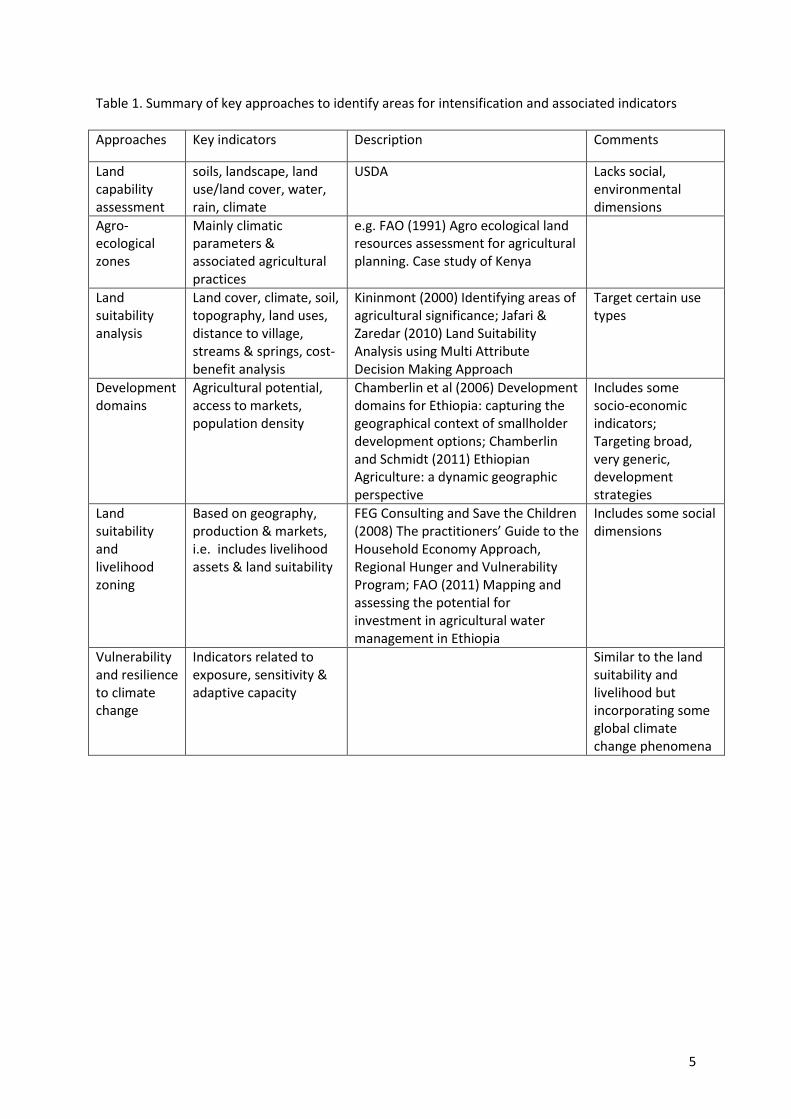
Having selected relevant land qualities, it is necessary to decide which land characteristics are to be used for measuring them. For example the quality, ‘erosion hazard’, requires information on rainfall intensity, slope and soil properties. A compromise must be reached between characteristics that most closely define the land quality and those that are less precise but on which information is more readily available. Out of necessity, the choice is limited to those characteristics for which information is already available or can be gathered quickly. Land evaluations are sometimes conducted directly in terms of land characteristics, e.g. by using rainfall instead of availability of water, slope angle instead of erosion hazard; these are what we call indicators. Indicators are measures or statistical values expressed in a meaningful way that provide an indication of the condition or direction over time of performance of a defined process or achievement of a defined outcome. Carefully selected indicators can provide a sound base for rational decision-making on current as well as potential future issues of local, national, regional and global concerns. They provide objective basis for prioritizing investment, monitoring progress and evaluating achievements of a given process. They provide evidences that a certain condition exists or certain results have or have not been achieved. Indicators used to plan and monitor sustainable intensification have evolved along with better understanding of intensification processes and their consequences. In brief, indicators can be categorized into those that address biophysical, socio-economic and environmental issues. Earlier the key approaches towards agricultural intensification planning was the land capability analysis of USDA, which focuses on the physical characteristics of specified land uses in relation to defined land units. However, it does not consider broader economic, social and environmental conditions necessary for the sustainable development of an agricultural land use. Thus land suitability evaluation emerged as a framework to fill these gaps and this was interchangeably used with agro-ecological zone based land resource assessment for planning. The key conceptual elements of agro ecological zones are rooted firmly in FAO (1976), which emphasized the need to characterize land utilization types as a necessary precursor to land evaluation and land use planning. More recently as the results of unprecedented global changes the FAO revised the sustainability framework and underpinned the need to integrate issues of biodiversity, global change, agro-ecosystem functions, stakeholder participation and agro-environmental monitoring into an updated land evaluation framework (FAO 2007). An extended definition of land evaluation should cover evaluation of not only goods but also services of the land. In response to this growing knowledge base, most recent approaches to delineation of areas for sustainable intensification involve livelihood zones, and some also incorporate vulnerability and resilience to climate change as indicator. Table 1 summarizes historical approaches to identify areas for intensification and plan agricultural development.
5
Table 1. Summary of key approaches to identify areas for intensification and associated indicators
Approaches Key indicators Description Comments
Land capability assessment
soils, landscape, land use/land cover, water, rain, climate
USDA Lacks social, environmental dimensions
Agro-ecological zones
Mainly climatic parameters & associated agricultural practices
e.g. FAO (1991) Agro ecological land resources assessment for agricultural planning. Case study of Kenya
Land suitability analysis
Land cover, climate, soil, topography, land uses, distance to village, streams & springs, cost-benefit analysis
Kininmont (2000) Identifying areas of agricultural significance; Jafari & Zaredar (2010) Land Suitability Analysis using Multi Attribute Decision Making Approach
Target certain use types
Development domains
Agricultural potential, access to markets, population density
Chamberlin et al (2006) Development domains for Ethiopia: capturing the geographical context of smallholder development options; Chamberlin and Schmidt (2011) Ethiopian Agriculture: a dynamic geographic perspective
Includes some socio-economic indicators; Targeting broad, very generic, development strategies
Land suitability and livelihood zoning
Based on geography, production & markets, i.e. includes livelihood assets & land suitability
FEG Consulting and Save the Children (2008) The practitioners’ Guide to the Household Economy Approach, Regional Hunger and Vulnerability Program; FAO (2011) Mapping and assessing the potential for investment in agricultural water management in Ethiopia
Includes some social dimensions
Vulnerability and resilience to climate change
Indicators related to exposure, sensitivity & adaptive capacity
Similar to the land suitability and livelihood but incorporating some global climate change phenomena
6
Ethiopian Context to Land Use Planning and Agricultural Development
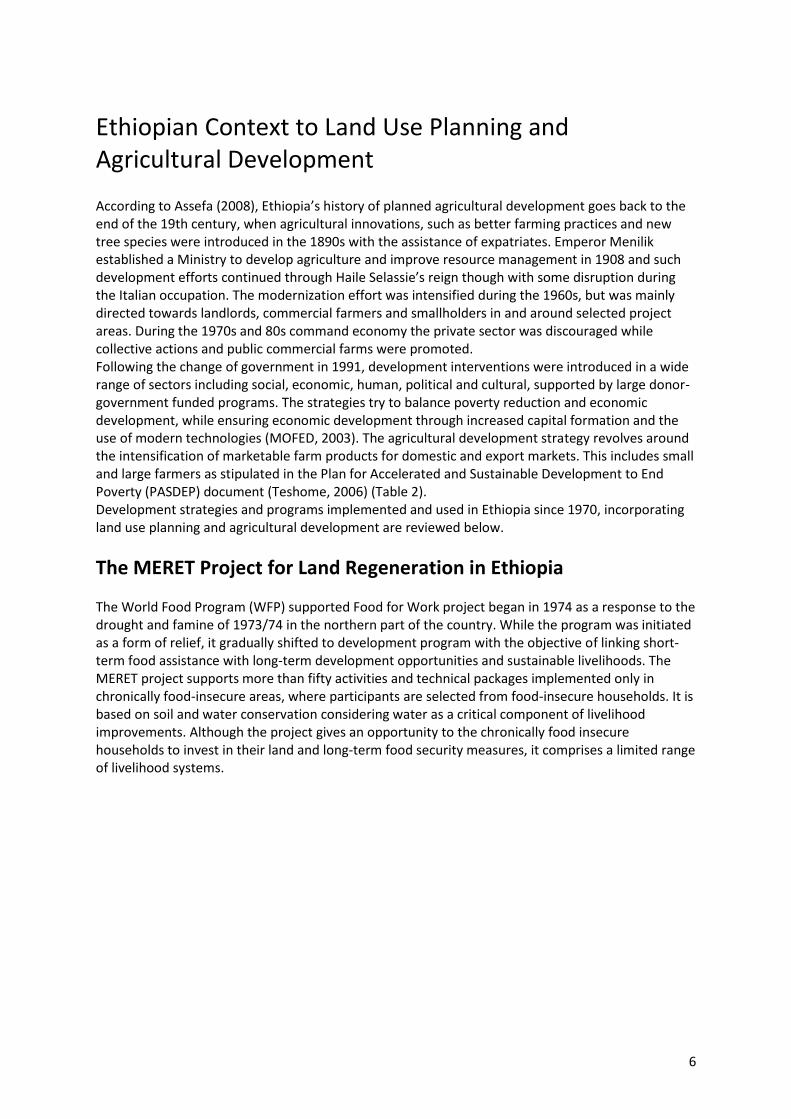
According to Assefa (2008), Ethiopia’s history of planned agricultural development goes back to the end of the 19th century, when agricultural innovations, such as better farming practices and new tree species were introduced in the 1890s with the assistance of expatriates. Emperor Menilik established a Ministry to develop agriculture and improve resource management in 1908 and such development efforts continued through Haile Selassie’s reign though with some disruption during the Italian occupation. The modernization effort was intensified during the 1960s, but was mainly directed towards landlords, commercial farmers and smallholders in and around selected project areas. During the 1970s and 80s command economy the private sector was discouraged while collective actions and public commercial farms were promoted. Following the change of government in 1991, development interventions were introduced in a wide range of sectors including social, economic, human, political and cultural, supported by large donor-government funded programs. The strategies try to balance poverty reduction and economic development, while ensuring economic development through increased capital formation and the use of modern technologies (MOFED, 2003). The agricultural development strategy revolves around the intensification of marketable farm products for domestic and export markets. This includes small and large farmers as stipulated in the Plan for Accelerated and Sustainable Development to End Poverty (PASDEP) document (Teshome, 2006) (Table 2). Development strategies and programs implemented and used in Ethiopia since 1970, incorporating land use planning and agricultural development are reviewed below.
The MERET Project for Land Regeneration in Ethiopia The World Food Program (WFP) supported Food for Work project began in 1974 as a response to the drought and famine of 1973/74 in the northern part of the country. While the program was initiated as a form of relief, it gradually shifted to development program with the objective of linking short-term food assistance with long-term development opportunities and sustainable livelihoods. The MERET project supports more than fifty activities and technical packages implemented only in chronically food-insecure areas, where participants are selected from food-insecure households. It is based on soil and water conservation considering water as a critical component of livelihood improvements. Although the project gives an opportunity to the chronically food insecure households to invest in their land and long-term food security measures, it comprises a limited range of livelihood systems.
7
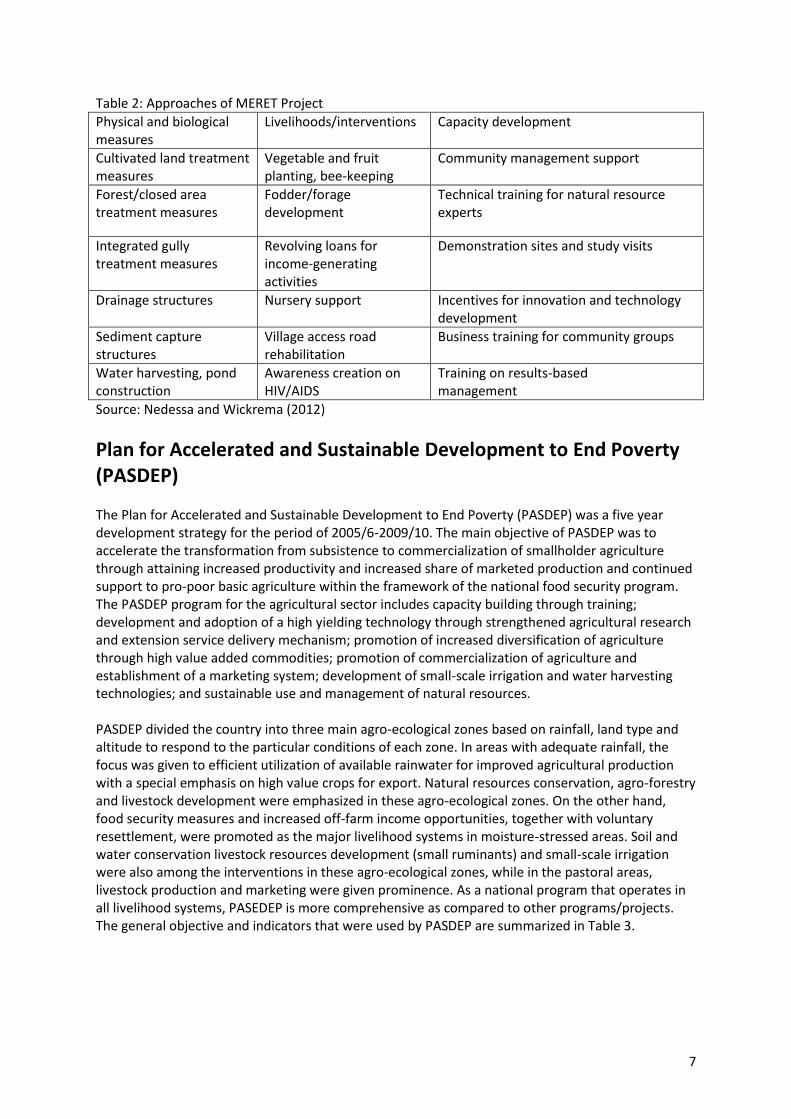
Table 2: Approaches of MERET Project
Physical and biological measures
Livelihoods/interventions Capacity development
Cultivated land treatment measures
Vegetable and fruit planting, bee-keeping
Community management support
Forest/closed area treatment measures
Fodder/forage development
Technical training for natural resource experts
Integrated gully treatment measures
Revolving loans for income-generating activities
Demonstration sites and study visits
Drainage structures
Nursery support Incentives for innovation and technology development
Sediment capture structures
Village access road rehabilitation
Business training for community groups
Water harvesting, pond construction
Awareness creation on HIV/AIDS
Training on results-based management
Source: Nedessa and Wickrema (2012)
Plan for Accelerated and Sustainable Development to End Poverty (PASDEP) The Plan for Accelerated and Sustainable Development to End Poverty (PASDEP) was a five year development strategy for the period of 2005/6-2009/10. The main objective of PASDEP was to accelerate the transformation from subsistence to commercialization of smallholder agriculture through attaining increased productivity and increased share of marketed production and continued support to pro-poor basic agriculture within the framework of the national food security program. The PASDEP program for the agricultural sector includes capacity building through training; development and adoption of a high yielding technology through strengthened agricultural research and extension service delivery mechanism; promotion of increased diversification of agriculture through high value added commodities; promotion of commercialization of agriculture and establishment of a marketing system; development of small-scale irrigation and water harvesting technologies; and sustainable use and management of natural resources. PASDEP divided the country into three main agro-ecological zones based on rainfall, land type and altitude to respond to the particular conditions of each zone. In areas with adequate rainfall, the focus was given to efficient utilization of available rainwater for improved agricultural production with a special emphasis on high value crops for export. Natural resources conservation, agro-forestry and livestock development were emphasized in these agro-ecological zones. On the other hand, food security measures and increased off-farm income opportunities, together with voluntary resettlement, were promoted as the major livelihood systems in moisture-stressed areas. Soil and water conservation livestock resources development (small ruminants) and small-scale irrigation were also among the interventions in these agro-ecological zones, while in the pastoral areas, livestock production and marketing were given prominence. As a national program that operates in all livelihood systems, PASEDEP is more comprehensive as compared to other programs/projects. The general objective and indicators that were used by PASDEP are summarized in Table 3.
8
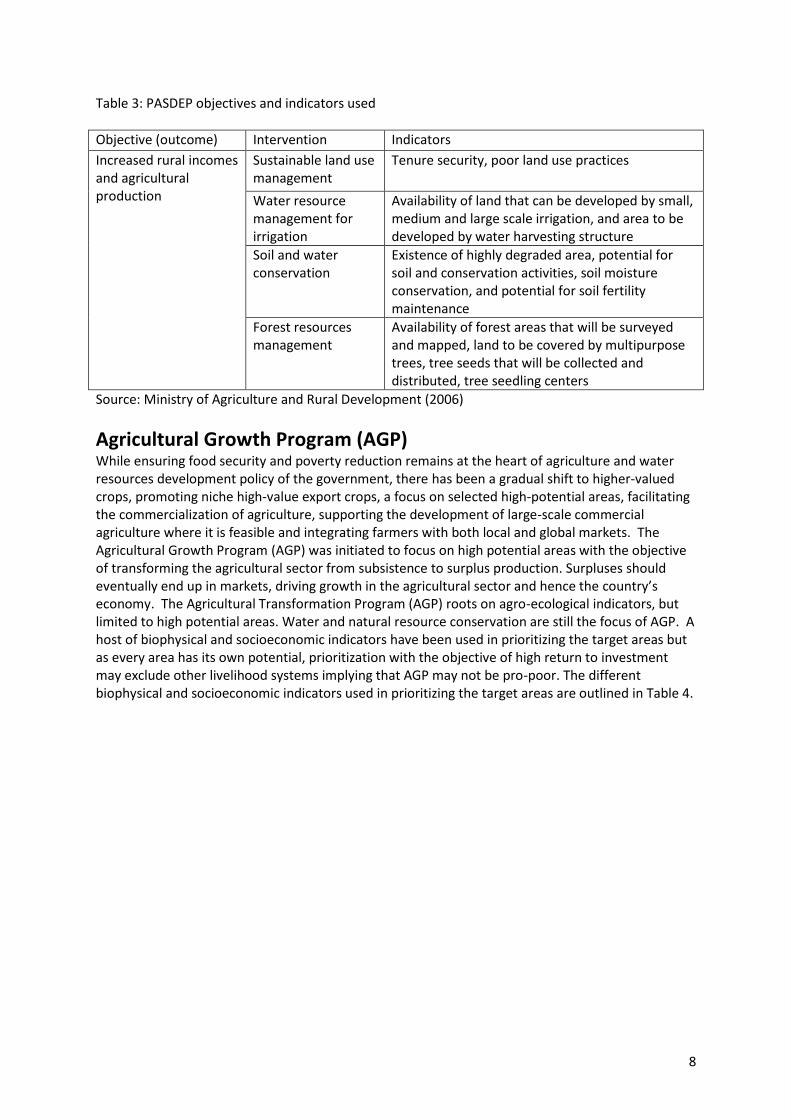
Table 3: PASDEP objectives and indicators used
Objective (outcome) Intervention Indicators
Increased rural incomes and agricultural production
Sustainable land use management
Tenure security, poor land use practices
Water resource management for irrigation
Availability of land that can be developed by small, medium and large scale irrigation, and area to be developed by water harvesting structure
Soil and water conservation
Existence of highly degraded area, potential for soil and conservation activities, soil moisture conservation, and potential for soil fertility maintenance
Forest resources management
Availability of forest areas that will be surveyed and mapped, land to be covered by multipurpose trees, tree seeds that will be collected and distributed, tree seedling centers
Source: Ministry of Agriculture and Rural Development (2006)
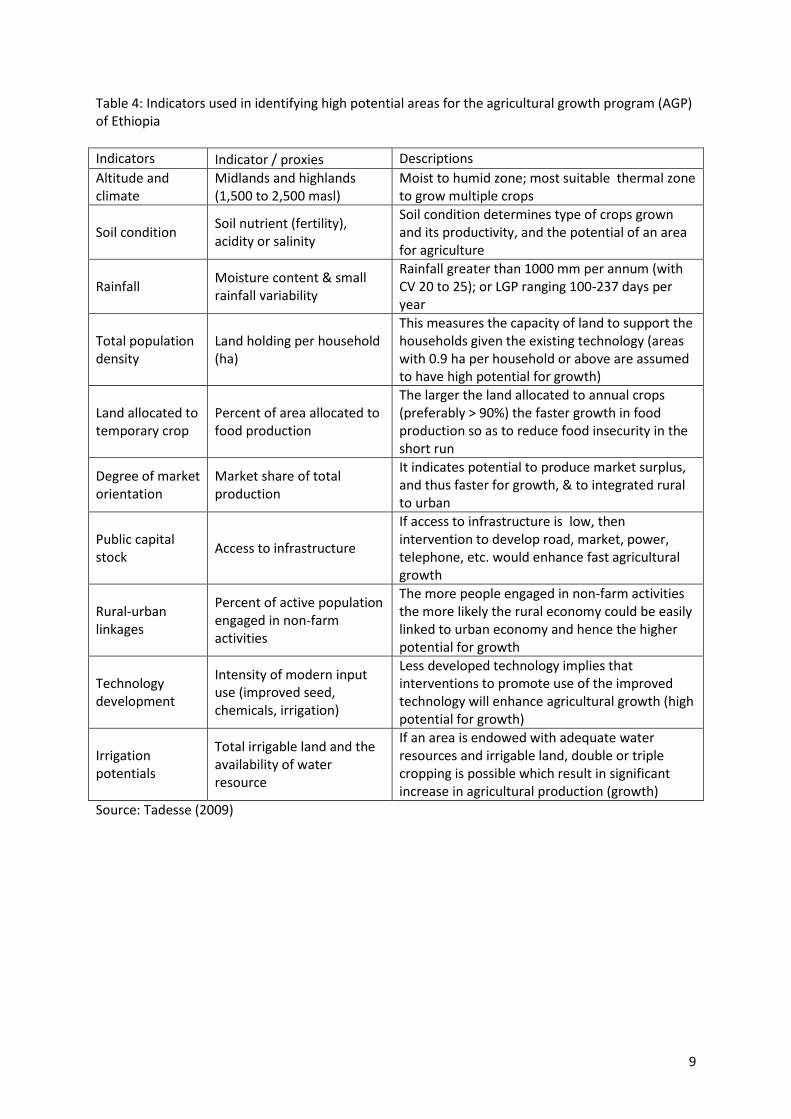
Agricultural Growth Program (AGP) While ensuring food security and poverty reduction remains at the heart of agriculture and water resources development policy of the government, there has been a gradual shift to higher-valued crops, promoting niche high-value export crops, a focus on selected high-potential areas, facilitating the commercialization of agriculture, supporting the development of large-scale commercial agriculture where it is feasible and integrating farmers with both local and global markets. The Agricultural Growth Program (AGP) was initiated to focus on high potential areas with the objective of transforming the agricultural sector from subsistence to surplus production. Surpluses should eventually end up in markets, driving growth in the agricultural sector and hence the country’s economy. The Agricultural Transformation Program (AGP) roots on agro-ecological indicators, but limited to high potential areas. Water and natural resource conservation are still the focus of AGP. A host of biophysical and socioeconomic indicators have been used in prioritizing the target areas but as every area has its own potential, prioritization with the objective of high return to investment may exclude other livelihood systems implying that AGP may not be pro-poor. The different biophysical and socioeconomic indicators used in prioritizing the target areas are outlined in Table 4.
9
Table 4: Indicators used in identifying high potential areas for the agricultural growth program (AGP) of Ethiopia
Indicators Indicator / proxies Descriptions
Altitude and climate
Midlands and highlands (1,500 to 2,500 masl)
Moist to humid zone; most suitable thermal zone to grow multiple crops
Soil condition Soil nutrient (fertility), acidity or salinity
Soil condition determines type of crops grown and its productivity, and the potential of an area for agriculture
Rainfall Moisture content & small rainfall variability
Rainfall greater than 1000 mm per annum (with CV 20 to 25); or LGP ranging 100-237 days per year
Total population density
Land holding per household (ha)
This measures the capacity of land to support the households given the existing technology (areas with 0.9 ha per household or above are assumed to have high potential for growth)
Land allocated to temporary crop
Percent of area allocated to food production
The larger the land allocated to annual crops (preferably > 90%) the faster growth in food production so as to reduce food insecurity in the short run
Degree of market orientation
Market share of total production
It indicates potential to produce market surplus, and thus faster for growth, & to integrated rural to urban
Public capital stock
Access to infrastructure
If access to infrastructure is low, then intervention to develop road, market, power, telephone, etc. would enhance fast agricultural growth
Rural-urban linkages
Percent of active population engaged in non-farm activities
The more people engaged in non-farm activities the more likely the rural economy could be easily linked to urban economy and hence the higher potential for growth
Technology development
Intensity of modern input use (improved seed, chemicals, irrigation)
Less developed technology implies that interventions to promote use of the improved technology will enhance agricultural growth (high potential for growth)
Irrigation potentials
Total irrigable land and the availability of water resource
If an area is endowed with adequate water resources and irrigable land, double or triple cropping is possible which result in significant increase in agricultural production (growth)
Source: Tadesse (2009)
10
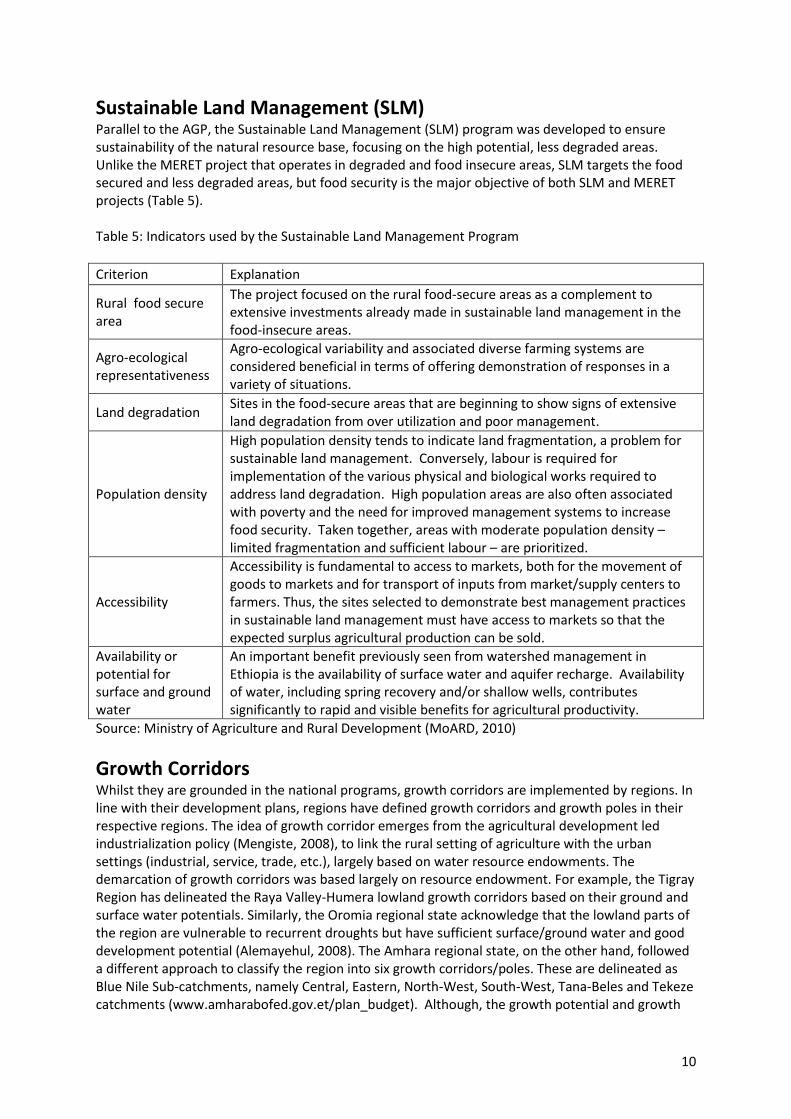
Sustainable Land Management (SLM) Parallel to the AGP, the Sustainable Land Management (SLM) program was developed to ensure sustainability of the natural resource base, focusing on the high potential, less degraded areas. Unlike the MERET project that operates in degraded and food insecure areas, SLM targets the food secured and less degraded areas, but food security is the major objective of both SLM and MERET projects (Table 5). Table 5: Indicators used by the Sustainable Land Management Program
Criterion Explanation
Rural food secure area
The project focused on the rural food-secure areas as a complement to extensive investments already made in sustainable land management in the food-insecure areas.
Agro-ecological representativeness
Agro-ecological variability and associated diverse farming systems are considered beneficial in terms of offering demonstration of responses in a variety of situations.
Land degradation Sites in the food-secure areas that are beginning to show signs of extensive land degradation from over utilization and poor management.
Population density
High population density tends to indicate land fragmentation, a problem for sustainable land management. Conversely, labour is required for implementation of the various physical and biological works required to address land degradation. High population areas are also often associated with poverty and the need for improved management systems to increase food security. Taken together, areas with moderate population density – limited fragmentation and sufficient labour – are prioritized.
Accessibility
Accessibility is fundamental to access to markets, both for the movement of goods to markets and for transport of inputs from market/supply centers to farmers. Thus, the sites selected to demonstrate best management practices in sustainable land management must have access to markets so that the expected surplus agricultural production can be sold.
Availability or potential for surface and ground water
An important benefit previously seen from watershed management in Ethiopia is the availability of surface water and aquifer recharge. Availability of water, including spring recovery and/or shallow wells, contributes significantly to rapid and visible benefits for agricultural productivity.
Source: Ministry of Agriculture and Rural Development (MoARD, 2010)
Growth Corridors Whilst they are grounded in the national programs, growth corridors are implemented by regions. In line with their development plans, regions have defined growth corridors and growth poles in their respective regions. The idea of growth corridor emerges from the agricultural development led industrialization policy (Mengiste, 2008), to link the rural setting of agriculture with the urban settings (industrial, service, trade, etc.), largely based on water resource endowments. The demarcation of growth corridors was based largely on resource endowment. For example, the Tigray Region has delineated the Raya Valley-Humera lowland growth corridors based on their ground and surface water potentials. Similarly, the Oromia regional state acknowledge that the lowland parts of the region are vulnerable to recurrent droughts but have sufficient surface/ground water and good development potential (Alemayehul, 2008). The Amhara regional state, on the other hand, followed a different approach to classify the region into six growth corridors/poles. These are delineated as Blue Nile Sub-catchments, namely Central, Eastern, North-West, South-West, Tana-Beles and Tekeze catchments (www.amharabofed.gov.et/plan_budget). Although, the growth potential and growth
11
poles of each zone were considered, the livelihoods are not homogeneous. In general the growth corridor approach is based on water and water based investment potentials without considering the growth potential of other livelihood systems..
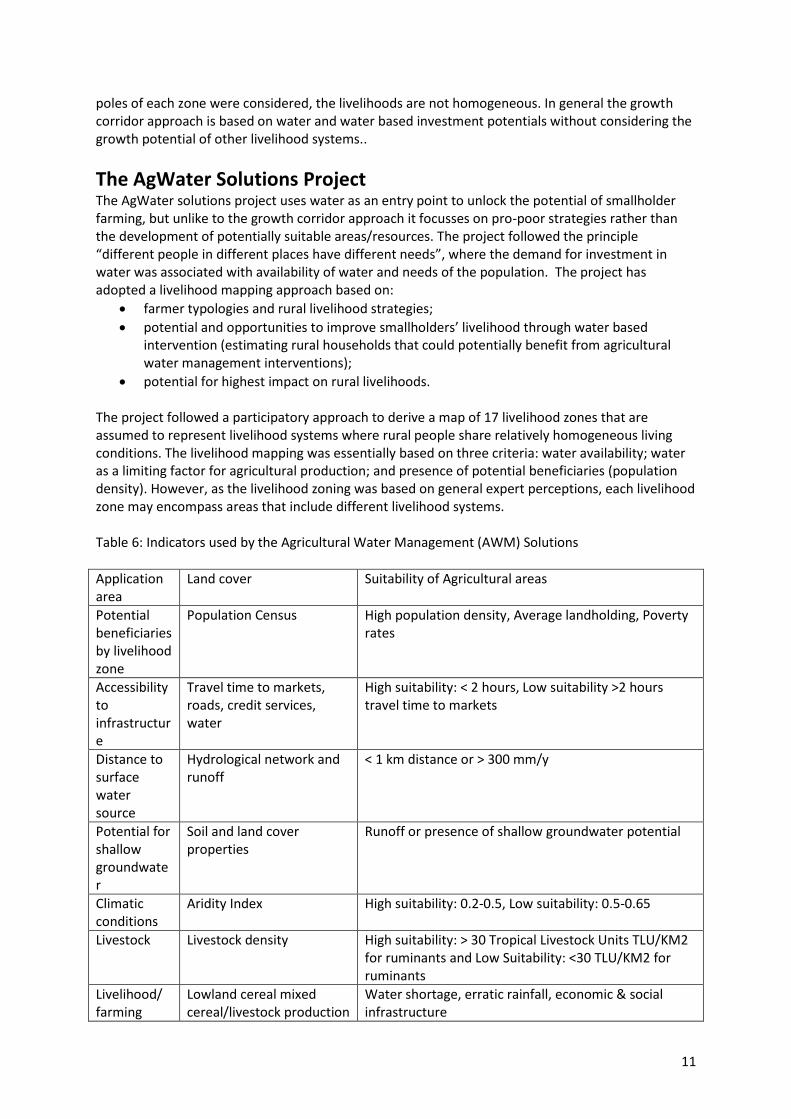
The AgWater Solutions Project The AgWater solutions project uses water as an entry point to unlock the potential of smallholder farming, but unlike to the growth corridor approach it focusses on pro-poor strategies rather than the development of potentially suitable areas/resources. The project followed the principle “different people in different places have different needs”, where the demand for investment in water was associated with availability of water and needs of the population. The project has adopted a livelihood mapping approach based on:
farmer typologies and rural livelihood strategies;
potential and opportunities to improve smallholders’ livelihood through water based intervention (estimating rural households that could potentially benefit from agricultural water management interventions);
potential for highest impact on rural livelihoods. The project followed a participatory approach to derive a map of 17 livelihood zones that are assumed to represent livelihood systems where rural people share relatively homogeneous living conditions. The livelihood mapping was essentially based on three criteria: water availability; water as a limiting factor for agricultural production; and presence of potential beneficiaries (population density). However, as the livelihood zoning was based on general expert perceptions, each livelihood zone may encompass areas that include different livelihood systems. Table 6: Indicators used by the Agricultural Water Management (AWM) Solutions
Application area
Land cover Suitability of Agricultural areas
Potential beneficiaries by livelihood zone
Population Census High population density, Average landholding, Poverty rates
Accessibility to infrastructure
Travel time to markets, roads, credit services, water
High suitability: < 2 hours, Low suitability >2 hours travel time to markets
Distance to surface water source
Hydrological network and runoff
< 1 km distance or > 300 mm/y
Potential for shallow groundwater
Soil and land cover properties
Runoff or presence of shallow groundwater potential
Climatic conditions
Aridity Index High suitability: 0.2-0.5, Low suitability: 0.5-0.65
Livestock Livestock density High suitability: > 30 Tropical Livestock Units TLU/KM2 for ruminants and Low Suitability: <30 TLU/KM2 for ruminants
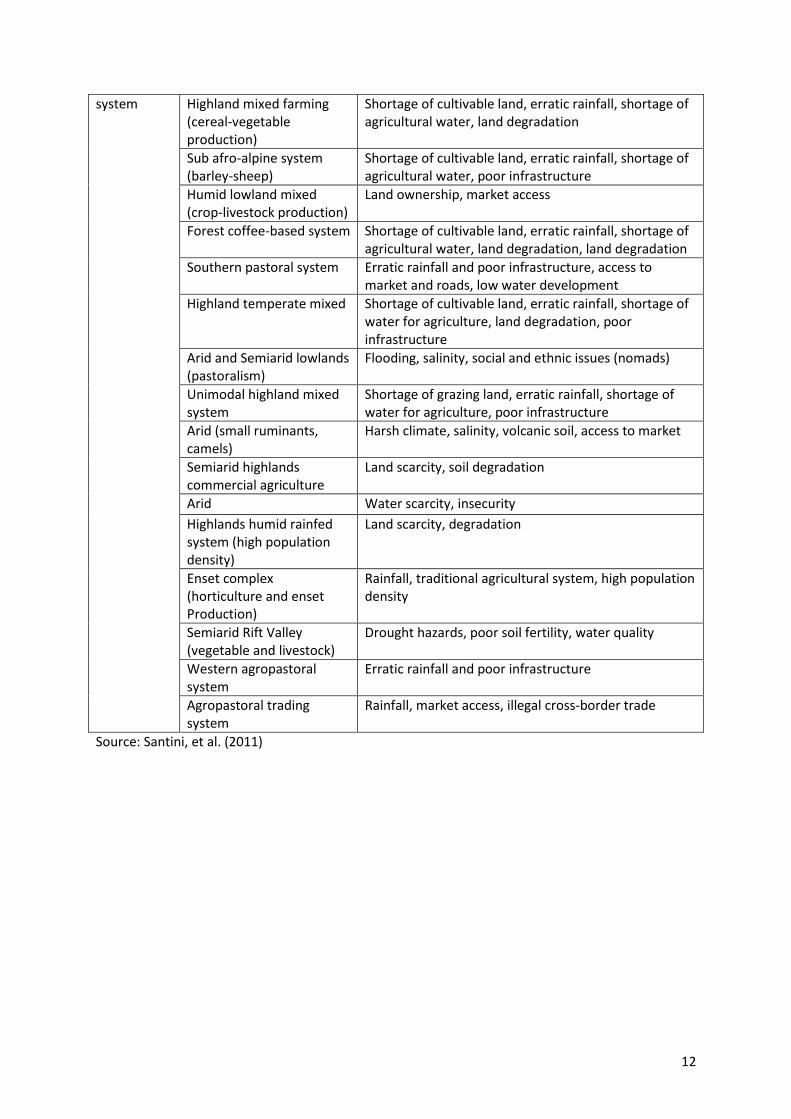
Livelihood/ farming
Lowland cereal mixed cereal/livestock production
Water shortage, erratic rainfall, economic & social infrastructure
12
system
Highland mixed farming (cereal-vegetable production)
Shortage of cultivable land, erratic rainfall, shortage of agricultural water, land degradation
Sub afro-alpine system (barley-sheep)
Shortage of cultivable land, erratic rainfall, shortage of agricultural water, poor infrastructure
Humid lowland mixed (crop-livestock production)
Land ownership, market access
Forest coffee-based system Shortage of cultivable land, erratic rainfall, shortage of agricultural water, land degradation, land degradation
Southern pastoral system Erratic rainfall and poor infrastructure, access to market and roads, low water development
Highland temperate mixed Shortage of cultivable land, erratic rainfall, shortage of water for agriculture, land degradation, poor infrastructure
Arid and Semiarid lowlands (pastoralism)
Flooding, salinity, social and ethnic issues (nomads)
Unimodal highland mixed system
Shortage of grazing land, erratic rainfall, shortage of water for agriculture, poor infrastructure
Arid (small ruminants, camels)
Harsh climate, salinity, volcanic soil, access to market
Semiarid highlands commercial agriculture
Land scarcity, soil degradation
Arid Water scarcity, insecurity
Highlands humid rainfed system (high population density)
Land scarcity, degradation
Enset complex (horticulture and enset Production)
Rainfall, traditional agricultural system, high population density
Semiarid Rift Valley (vegetable and livestock)
Drought hazards, poor soil fertility, water quality
Western agropastoral system
Erratic rainfall and poor infrastructure
Agropastoral trading system
Rainfall, market access, illegal cross-border trade
Source: Santini, et al. (2011)
13
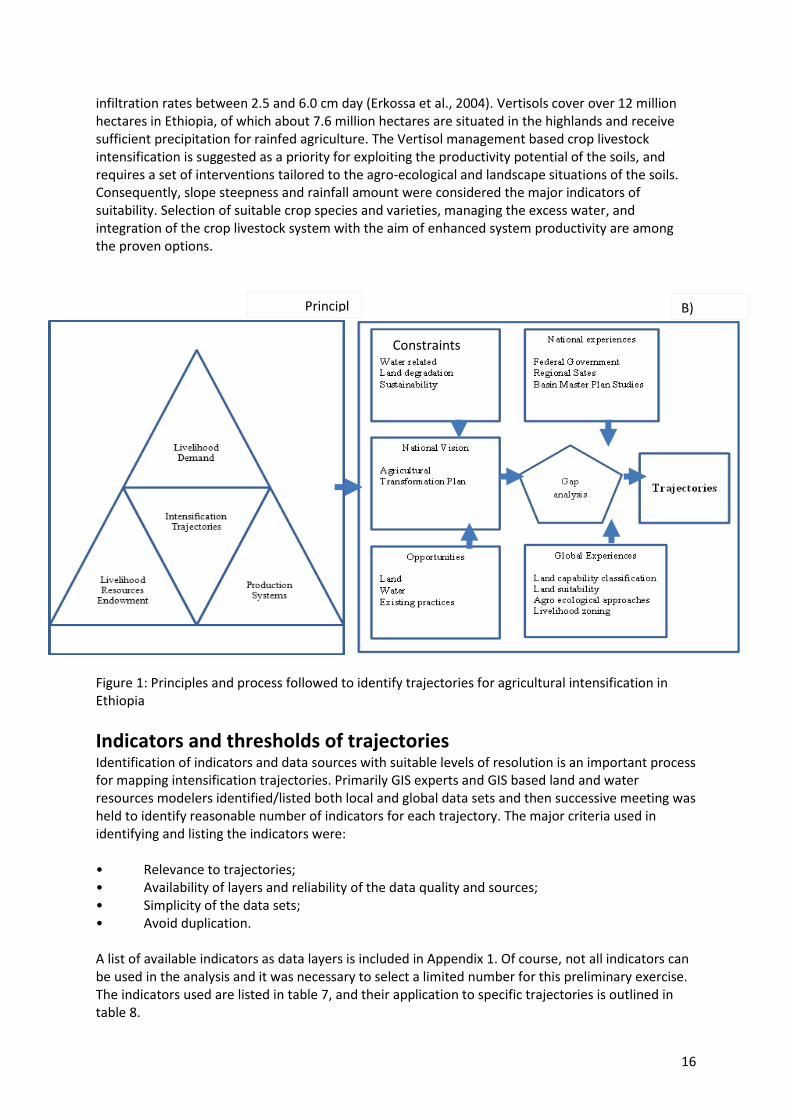
Identification of potential development strategies, or trajectories, and the indicators applied to assess suitability and likelihood of adoption In order to begin the process of assessing where a particular development strategy would be biophysically suitable and also likely to be adopted by farmers (on the basis of socio-economic opportunities and constraints), we had to identify a number of probable trajectories. These trajectories of change, aiming towards intensified productivity, are likely to include a number of practices combined to achieve different objectives depending on potential local opportunities, limitations and existing livelihood and social conditions. Having identified an initial range of trajectories we then had to find indicators which could be applied to assess the suitability of a practice, and combinations of practices, and the likelihood of their adoption by farmers. As the final product is a set of maps of suitability, the indicators must be quantitative and spatially distributed. Figure 1 summarizes the principles and practices followed to identify trajectories for sustainable intensification in Ethiopia. The flow diagram illustrates that identification of trajectories of intensification must be built primarily on principles that drive intensification of agriculture. Early 2012 the International Livestock Research Institute (ILRI) gathered on line ideas to understand public opinion as to what drives and shapes intensification trajectories (http://africa-rising.net/2012/01/16/drivers). Natural, physical and social capital, farming practices, population growth, and market access were the primary factors identified as defining trajectories of intensification. Figure 1 systematically organizes these ideas. If we assume the three interactive factors of livelihood demand, resources endowment and practices are the internal drivers of intensification trajectories, there are external factors that dictate the pace and direction of intensification. These external factors include for example the Ethiopian Government policies, such as the Agricultural Growth Plan, global and local experiences. Some other important phenomenon that shape intensification trajectories include: the interactions between the external factors and the principles which are most often manifest as constraints and opportunities. Eight initial trajectories were selected to ‘test the model’. This initial set of intensification trajectories include:
Soil and water conservation based crop livestock intensification,
Small and medium scale irrigation based crop-livestock,
Large-scale irrigation based commercial agriculture,
Urban and pre-urban dairy development,
Llivestock based intensification in pastoral region,
Large scale rain fed based commercial agriculture,
Smallholder rain fed based crop livestock intensification,
Vertisol management based crop livestock.
These eight initial trajectories remain open to debate and change, and are suggested primarily to give an overview and proof of concept. In the future it is likely that additional practices and strategies can be added. The eight trajectories were also debated and discussed with stakeholders at two regional and one national meeting (the reports from the regional meetings are included as appendices). An overview of feedback from these discussions is provided in Section 6.
14
More details on why each of the trajectories were selected for mapping is given below, and the initial indicators/thresholds for the trajectories are explained below.
Soil and water conservation in crop livestock systems One of the most challenging phenomena in intensification of agricultural sector in Ethiopia is soil erosion and land degradation. Studies by Haileslassie et al. (2005) clearly indicated that as much as 100kg/ha/yr of nitrogen is depleted, with erosion a major contributor to nutrient this loss. This is highly correlated to unproductive water loss. For agriculture to be productive and sustainable, water must be conserved and nutrient stocks maintained. Against this background a trajectory to reduce such soil and nutrient loss through soil and water conservation based crop-livestock agricultural system intensification is proposed. To build this trajectory data on soil erosion and deposition estimated using Landscape Process Models of Multi-dimensions and Scales (LAPSUS) from Haileslassie et al., (2005) and Haileslassie et al., (2006) was used. LAPSUS is a model that simulates amount of erosion and sedimentation at landscape scale using Digital Elevation Model (DEM), runoff, infiltration rate, soil depth and soil detachment factors (Schoorl et al., 2000). The drawback of this model is that it does not consider gully erosion. But gives over all general pictures as to where erosion is an important factor. Although conservation is broader in its meaning and may involve management of acid and saline soil there is ample data showing the extent of these attributes in Ethiopia and thus not considered in this study. The conservation based agricultural intensification trajectory has number of ‘sub-trajectories’ including: physical conservation measures (terrace, gully reclamation), biological conservation measures (agroforestry) and also activities related to run off water harvesting. Improved livestock management through for example improved feed sourcing and feeding and better agronomic practices are by default important components of this trajectory.
Rainfed smallholder intensification in crop-livestock systems or agro-pastoralist systems’ and ‘Rainfed commercial farming Within the agro-pastoral systems of Ethiopia it is well documented that there are ample areas of agricultural land with sufficient rain fall (500-2000mm per year) and fertile soils (vertisols and alfisols). Unlike the highland areas of Ethiopia which are often highly populated with fragmented agricultural land, many parts of the agro pastoral areas consist of large land holdings, areas that can be developed into commercial agriculture. Therefore in this part of the country two trajectories with potential complementary interaction are proposed: rainfed smallholder intensification in crop-livestock systems or agro-pastoralist systems, and rainfed commercial farming. Implementation of both trajectories must be with due respect to the interest and benefits of the local community. There are number of ‘sub-trajectories’ that can support the overall success of the major trajectory. This includes for example capacity building of the local communities on agricultural production (sedenterization of the agro pastoral communities) and conservation and planting of high value trees.
Livestock based intensification Livestock are important components of most rural livelihoods in Ethiopia and are included in many of the trajectories proposed in this study. This ensures better resource use efficiencies (water, land through use of crop residues) and supports nutrient recycling and redistribution (if properly managed). In fact livestock are important sources of traction power in general and because of the terrain in the highlands, it is likely this tradition will persist for some time to come. But there are systems such as the pastoral systems where livestock is a lead system components and development in those areas will be reasonably sustainable if it is livestock based. The major challenges of livestock production for the pastoral systems are drinking water and feed. The spatial focus of this trajectory was therefore identified based on feed demand supply data and aridity index. As this area is
15
generally the least developed area this intensification trajectory has number of sub trajectories which include: proper water supply schemes, fodder bank, improved marketing systems, development of irrigated fodder, index based livestock insurances and so on.
Peri-urban Dairy As the result of both internal and external drivers currently the demand for livestock product is increasing sharply and so is the price for input and out pot of the livestock products. This has created a market opportunities for smallholder farmers closer to the demand market. But the majority of farmers area constrained by access to input and output markets and also low producing animal. This study proposes peri-urban areas to be the major focus areas to start for example dairy development as this is already a practice gaining momentum in many parts of the country: for example milk market for Addis Ababa comes from as far as 100km radius. There are number of sub trajectories in this major trajectory including: improved feed marketing, processing options, improved animal breed, establishing and strengthening local institutions that support the marketing of livestock products.
Small Scale Irrigation Based Crop Livestock System Intensification Among the major constraints to crop and livestock intensification by smallholder farmers in Ethiopia with fragmented holdings is the shortage or high variability of rainfall inputs. Supplemental or full irrigation using surface or subsurface water can be used to provide a bridge in the gap of water availability during dry months and ensure sustainable intensification in different parts of the county. Small scale irrigation are labor intensive with lower financial cost unlike the large scale irrigation schemes, they are considered a priority in Ethiopia for rural poverty alleviation and growth at least in the short term (MOFED, 2006). Such farming systems will also play significant role in adaptation to climate change through the reduction of the risk of crop failure due to moisture stress., Farmers having access to small scale irrigation with less risk to climatic variability are often more willing to use fertilizers and improved seeds including high value crops for market. In highly populated areas where land shortage is prevalent, small scale irrigation allows crop intensification through multiple cropping per year with different crops. The small scale irrigation based crop livestock system intensification is suggested to be a priority in areas where there is suitable land and water provided that market for the products are ensured.
Large-Scale Irrigation Based Crop-Livestock Intensification In areas with large and productive land and with access to sufficient surface or subsurface water, the Large-Scale Irrigation Based Crop-Livestock Intensification is a recommendable priority either for commercial or small scale farmers. Such systems break the relationship between agricultural growth and rainfall with lower per hectare investment. In addition to land and water suitability, basic infrastructure such as all-weather roads, electric city and availability of labor are considered indicators of suitability. In addition to fueling the national economy through production of strategic export or industrial crops, large scale irrigation can also benefit smallholders through ‘out-growers schemes’ or through creation of alternative livelihoods in the form of permanent and temporary employment. Such practices are not new to Ethiopia; The Mathara scheme created 11,000 jobs, 3,700 of which are permanent; while the Wonji scheme operates in conjunction with seven cooperatives that cultivate and sell sugar cane to the enterprise as out-growers in addition to employing 4,000 to 7,500 workers (Awulachew et al, 2010).
Vertisol management Vertisols have the potential to be highly productive soils for agriculture. They are relatively fertile, but their productivity is constrained mainly by water logging due to their slow internal drainage, with
16
infiltration rates between 2.5 and 6.0 cm day (Erkossa et al., 2004). Vertisols cover over 12 million hectares in Ethiopia, of which about 7.6 million hectares are situated in the highlands and receive sufficient precipitation for rainfed agriculture. The Vertisol management based crop livestock intensification is suggested as a priority for exploiting the productivity potential of the soils, and requires a set of interventions tailored to the agro-ecological and landscape situations of the soils. Consequently, slope steepness and rainfall amount were considered the major indicators of suitability. Selection of suitable crop species and varieties, managing the excess water, and integration of the crop livestock system with the aim of enhanced system productivity are among the proven options.
Figure 1: Principles and process followed to identify trajectories for agricultural intensification in Ethiopia
Indicators and thresholds of trajectories Identification of indicators and data sources with suitable levels of resolution is an important process for mapping intensification trajectories. Primarily GIS experts and GIS based land and water resources modelers identified/listed both local and global data sets and then successive meeting was held to identify reasonable number of indicators for each trajectory. The major criteria used in identifying and listing the indicators were: • Relevance to trajectories; • Availability of layers and reliability of the data quality and sources; • Simplicity of the data sets; • Avoid duplication. A list of available indicators as data layers is included in Appendix 1. Of course, not all indicators can be used in the analysis and it was necessary to select a limited number for this preliminary exercise. The indicators used are listed in table 7, and their application to specific trajectories is outlined in table 8.
Principles
B) Process
Constraints
17
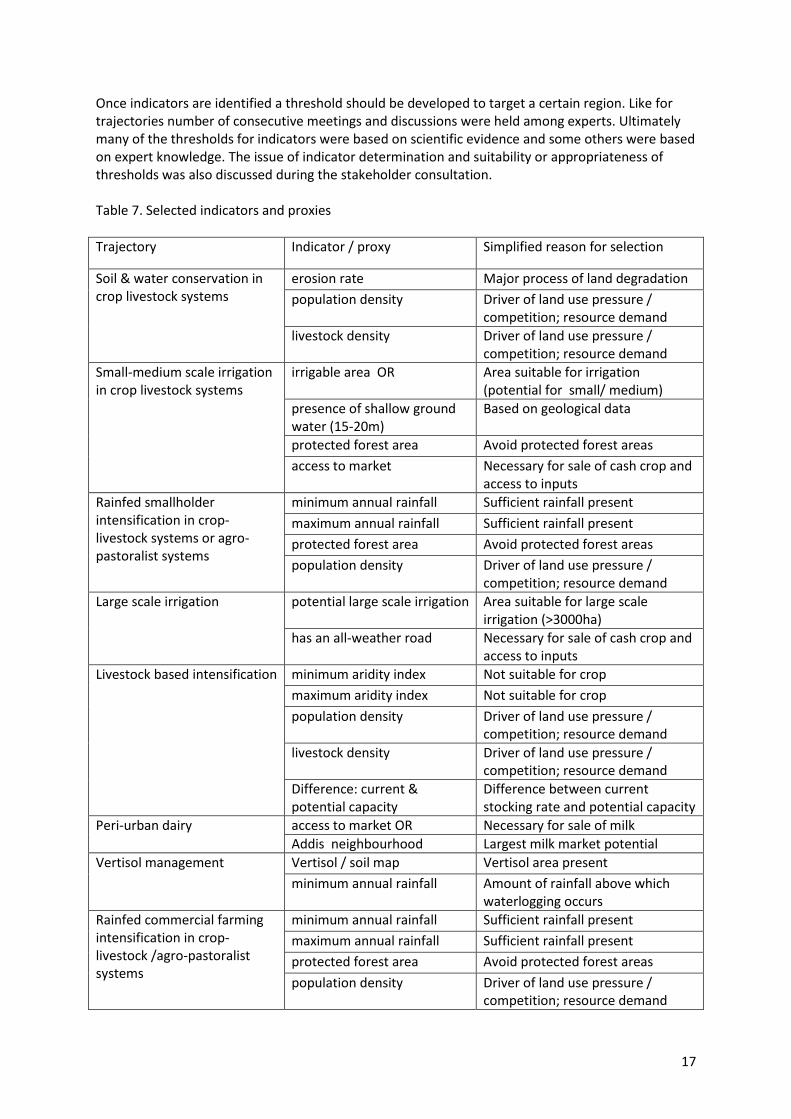
Once indicators are identified a threshold should be developed to target a certain region. Like for trajectories number of consecutive meetings and discussions were held among experts. Ultimately many of the thresholds for indicators were based on scientific evidence and some others were based on expert knowledge. The issue of indicator determination and suitability or appropriateness of thresholds was also discussed during the stakeholder consultation. Table 7. Selected indicators and proxies
Trajectory Indicator / proxy Simplified reason for selection
Soil & water conservation in crop livestock systems
erosion rate Major process of land degradation
population density Driver of land use pressure / competition; resource demand
livestock density Driver of land use pressure / competition; resource demand
Small-medium scale irrigation in crop livestock systems
irrigable area OR Area suitable for irrigation (potential for small/ medium)
presence of shallow ground water (15-20m)
Based on geological data
protected forest area Avoid protected forest areas
access to market Necessary for sale of cash crop and access to inputs
Rainfed smallholder intensification in crop-livestock systems or agro-pastoralist systems
minimum annual rainfall Sufficient rainfall present
maximum annual rainfall Sufficient rainfall present
protected forest area Avoid protected forest areas
population density Driver of land use pressure / competition; resource demand
Large scale irrigation
potential large scale irrigation Area suitable for large scale irrigation (>3000ha)
has an all-weather road Necessary for sale of cash crop and access to inputs
Livestock based intensification
minimum aridity index Not suitable for crop
maximum aridity index Not suitable for crop
population density Driver of land use pressure / competition; resource demand
livestock density Driver of land use pressure / competition; resource demand
Difference: current & potential capacity
Difference between current stocking rate and potential capacity
Peri-urban dairy
access to market OR Necessary for sale of milk
Addis neighbourhood Largest milk market potential
Vertisol management Vertisol / soil map Vertisol area present
minimum annual rainfall Amount of rainfall above which waterlogging occurs
Rainfed commercial farming intensification in crop-livestock /agro-pastoralist systems
minimum annual rainfall Sufficient rainfall present
maximum annual rainfall Sufficient rainfall present
protected forest area Avoid protected forest areas
population density Driver of land use pressure / competition; resource demand
18
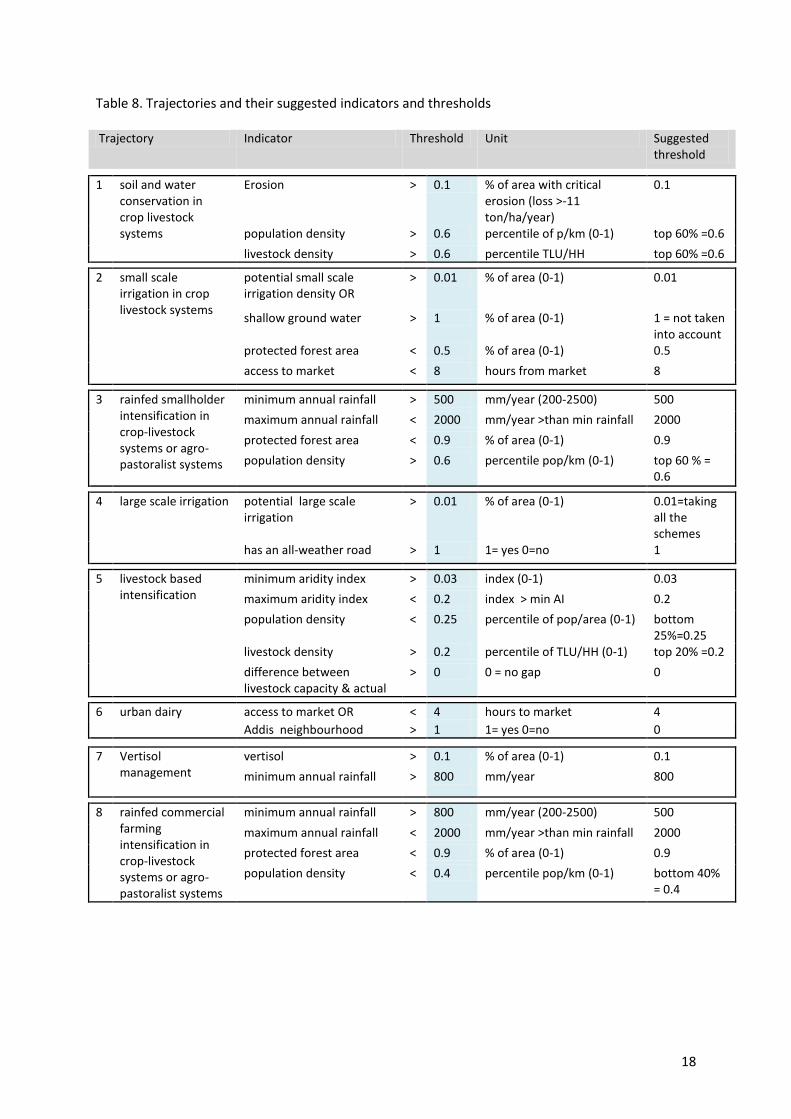
Table 8. Trajectories and their suggested indicators and thresholds Trajectory Indicator Threshold Unit Suggested
threshold
1 soil and water
conservation in crop livestock systems
Erosion > 0.1 % of area with critical erosion (loss >-11 ton/ha/year)
0.1
population density > 0.6 percentile of p/km (0-1) top 60% =0.6
livestock density > 0.6 percentile TLU/HH top 60% =0.6
2 small scale irrigation in crop livestock systems
potential small scale irrigation density OR
> 0.01 % of area (0-1) 0.01
shallow ground water > 1 % of area (0-1) 1 = not taken into account
protected forest area < 0.5 % of area (0-1) 0.5
access to market < 8 hours from market 8
3 rainfed smallholder intensification in crop-livestock systems or agro-pastoralist systems
minimum annual rainfall > 500 mm/year (200-2500) 500
maximum annual rainfall < 2000 mm/year >than min rainfall 2000
protected forest area < 0.9 % of area (0-1) 0.9
population density > 0.6 percentile pop/km (0-1) top 60 % = 0.6
4 large scale irrigation potential large scale irrigation
> 0.01 % of area (0-1) 0.01=taking all the schemes
has an all-weather road > 1 1= yes 0=no 1
5 livestock based intensification
minimum aridity index > 0.03 index (0-1) 0.03
maximum aridity index < 0.2 index > min AI 0.2
population density < 0.25 percentile of pop/area (0-1) bottom 25%=0.25
livestock density > 0.2 percentile of TLU/HH (0-1) top 20% =0.2
difference between livestock capacity & actual
> 0 0 = no gap 0
6 urban dairy access to market OR < 4 hours to market 4
Addis neighbourhood > 1 1= yes 0=no 0
7 Vertisol
management
vertisol > 0.1 % of area (0-1) 0.1
minimum annual rainfall > 800 mm/year 800
8 rainfed commercial farming intensification in crop-livestock systems or agro-pastoralist systems
minimum annual rainfall > 800 mm/year (200-2500) 500
maximum annual rainfall < 2000 mm/year >than min rainfall 2000
protected forest area < 0.9 % of area (0-1) 0.9
population density < 0.4 percentile pop/km (0-1) bottom 40% = 0.4
19
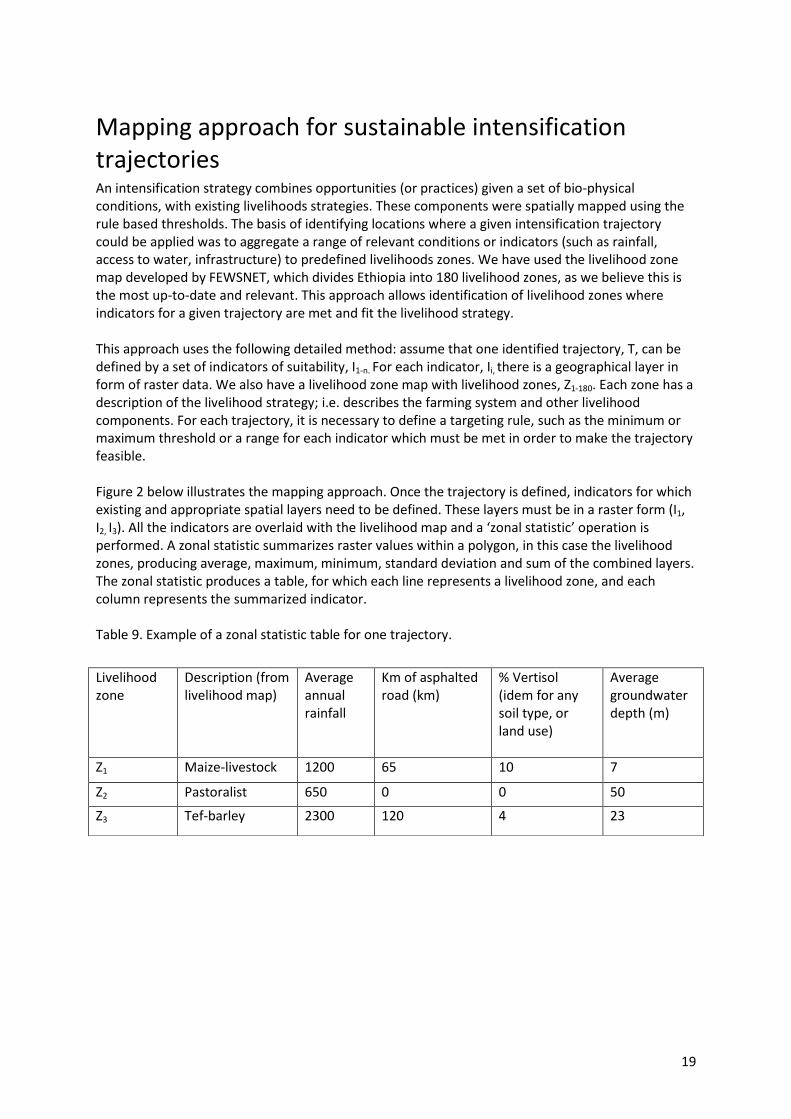
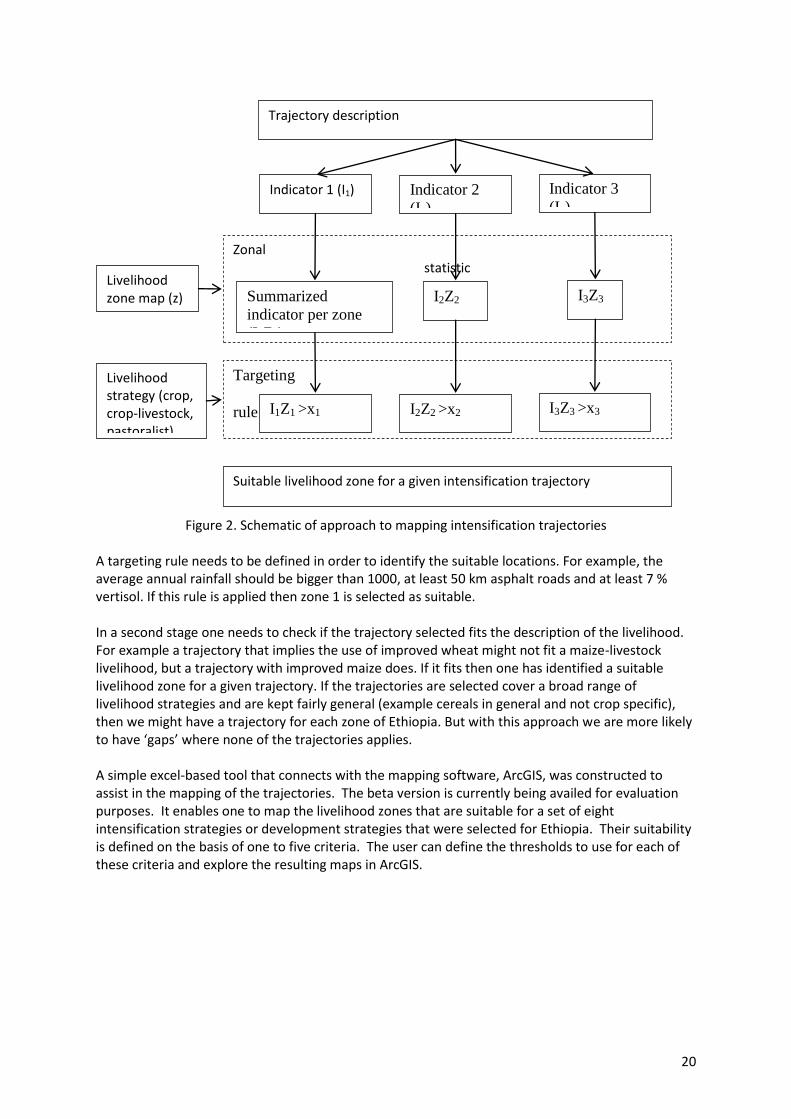
Mapping approach for sustainable intensification trajectories An intensification strategy combines opportunities (or practices) given a set of bio-physical conditions, with existing livelihoods strategies. These components were spatially mapped using the rule based thresholds. The basis of identifying locations where a given intensification trajectory could be applied was to aggregate a range of relevant conditions or indicators (such as rainfall, access to water, infrastructure) to predefined livelihoods zones. We have used the livelihood zone map developed by FEWSNET, which divides Ethiopia into 180 livelihood zones, as we believe this is the most up-to-date and relevant. This approach allows identification of livelihood zones where indicators for a given trajectory are met and fit the livelihood strategy. This approach uses the following detailed method: assume that one identified trajectory, T, can be defined by a set of indicators of suitability, I1-n. For each indicator, Ii, there is a geographical layer in form of raster data. We also have a livelihood zone map with livelihood zones, Z1-180. Each zone has a description of the livelihood strategy; i.e. describes the farming system and other livelihood components. For each trajectory, it is necessary to define a targeting rule, such as the minimum or maximum threshold or a range for each indicator which must be met in order to make the trajectory feasible. Figure 2 below illustrates the mapping approach. Once the trajectory is defined, indicators for which existing and appropriate spatial layers need to be defined. These layers must be in a raster form (I1, I2, I3). All the indicators are overlaid with the livelihood map and a ‘zonal statistic’ operation is performed. A zonal statistic summarizes raster values within a polygon, in this case the livelihood zones, producing average, maximum, minimum, standard deviation and sum of the combined layers. The zonal statistic produces a table, for which each line represents a livelihood zone, and each column represents the summarized indicator. Table 9. Example of a zonal statistic table for one trajectory.
Livelihood zone
Description (from livelihood map)
Average annual rainfall
Km of asphalted road (km)
% Vertisol (idem for any soil type, or land use)
Average groundwater depth (m)
Z1 Maize-livestock 1200 65 10 7
Z2 Pastoralist 650 0 0 50
Z3 Tef-barley 2300 120 4 23
20
Figure 2. Schematic of approach to mapping intensification trajectories
A targeting rule needs to be defined in order to identify the suitable locations. For example, the average annual rainfall should be bigger than 1000, at least 50 km asphalt roads and at least 7 % vertisol. If this rule is applied then zone 1 is selected as suitable. In a second stage one needs to check if the trajectory selected fits the description of the livelihood. For example a trajectory that implies the use of improved wheat might not fit a maize-livestock livelihood, but a trajectory with improved maize does. If it fits then one has identified a suitable livelihood zone for a given trajectory. If the trajectories are selected cover a broad range of livelihood strategies and are kept fairly general (example cereals in general and not crop specific), then we might have a trajectory for each zone of Ethiopia. But with this approach we are more likely to have ‘gaps’ where none of the trajectories applies. A simple excel-based tool that connects with the mapping software, ArcGIS, was constructed to assist in the mapping of the trajectories. The beta version is currently being availed for evaluation purposes. It enables one to map the livelihood zones that are suitable for a set of eight intensification strategies or development strategies that were selected for Ethiopia. Their suitability is defined on the basis of one to five criteria. The user can define the thresholds to use for each of these criteria and explore the resulting maps in ArcGIS.
Zonal statistic
Trajectory description
Indicator 1 (I1) Indicator 2
(I2)
Indicator 3
(I3)
Summarized
indicator per zone
(I1Z1)
I2Z2 I3Z3
Livelihood zone map (z)
Targeting
rule I1Z1 >x1 I2Z2 >x2
I3Z3 >x3
Livelihood strategy (crop, crop-livestock, pastoralist)
Suitable livelihood zone for a given intensification trajectory
21
Discussion and next steps The simple tool created during the short, initial phase of this work, allows the user to explore which of the predefined livelihood zones throughout Ethiopia (according to the FEWSNET typology), are suitable and likely to be appropriate for intensification in the direction outlined by the eight trajectories. The user can adjust the criteria by which suitability is indicated by changing the threshold values within the spreadsheet component. Part of the process in the development of this tool was to ‘test’ the trajectories, the indicators and their thresholds by asking local and national partners for their input on these. Three stakeholder workshops were conducted with national partners including researchers, natural resource, development, extension and planning staff from four regions of Ethiopia (Tigray, Amhara, Oromyia and SNNP) in addition to Federal and National level representatives. Two consultation workshops were conducted locally (one in the north organized by Barhidar University, and one in the south organized by Arba Minch University), and one workshop was held in Addis Ababa (organized by IWMI). The reports from these workshops are included as Appendices 2-4, which include detailed feedback from the listed participants. During all of the consultation meetings the most active topic of discussion was the selection of trajectories their corresponding indicators and thresholds. A wealth of information and input was provided by participants on the definition of trajectories and locally prioritized development. A number of new potential trajectories were suggested by regional agencies who also requested a more focused development of the toolbox two allow them to test localized development. They also agreed to provide detailed local data for indicators in order to make this possible. Future development of the trajectories and tool will need to: Generally
1. Allow users to define their own trajectories (potentially from a menu of predefined practices) or sub-trajectories. If the toolbox was ‘set-up’ for regions this may be one approach to simplify the complications of different zonal statics.
2. Incorporate more indicators – these could also be locally specific. 3. It may be necessary to collect some primary data for indicators depending on
prioritized trajectories and availability of local data. For example improving the spatial data sets on existing and future irrigation sites. This is an important activity in general as without good quality spatial data sets it will be difficult to prioritize in a systematic and equitable manner areas in which interventions could be targeted in an objective and transparent manner.
4. In terms of national level developments, further evaluation and refinement or establishment of trajectories and indicators against existing and developing government agricultural policy. For instance the government is currently embarking on a drive to establish A Cleaner, Resilient Green Economy (CRGE) with input from a number of donors.
5. Closer collaboration with regional authorities and planners to incorporate local development priorities.
6. Field testing and analysis of the predictions against the situation across a gradient of locations, in terms of biophysical, social and economic conditions in the highlands, potentially linked (or the same as) the Africa Rising selected sites.
7. Development and valisdation of trajectories and indicators should be an inclusive process, allowing us to reach a wide range audience of potential users.
8. The question of scale needs to be addressed in terms of local/regional strategies/trajectories, and also in terms of downscaling to farm level.
22
9. How can we integrate further with the wider ‘Africa RISING’ research in the Ethiopian Highlands.
Technically
10. We need a way to incorporate or indicate the level of uncertainty connected to the maps which are generated? How do we visualize this uncertainty? Or are there other tools we can incorporate?
11. We have some specific needs to change the format of thresholds e.g. replace percentiles with person/km2.
12. The tool must become more flexible allowing the user to develop their own maps at a range of resolution.
13. We need an interface that is both more robust and more flexible and eliminates the need for switching between excel and ArcGIS, version issues and licenses etc. The tool should include an interface with menu of trajectories or practices and indicators with selectable and flexible thresholds. This could have a VBA or web style interface but the GIS must be share-wear if not open source. (e.g. ILRI goblet package).
14. We need a way to update any distributed toolbox – this could be by a web down-loadable update or a ‘new version’ to be downloaded from the web. This would include the addition of new trajectories (or practices) and associated indicators. We could also ‘run’ the toolbox online. At this stage we have avoided the web and we distributed the toolbox at the national meeting on a USB stick / flash drive so that web access is not necessary (many potential users do not have reliable web access).
Overall we feel, and we think that the feedback supports our view that this exercise has proved the concept we set out to illustrate. It has been developed for Ethiopia but could relatively easily be extended to other regions/ areas where there is a) demand; b) available information on trajectories; and c) required spatial data.
23
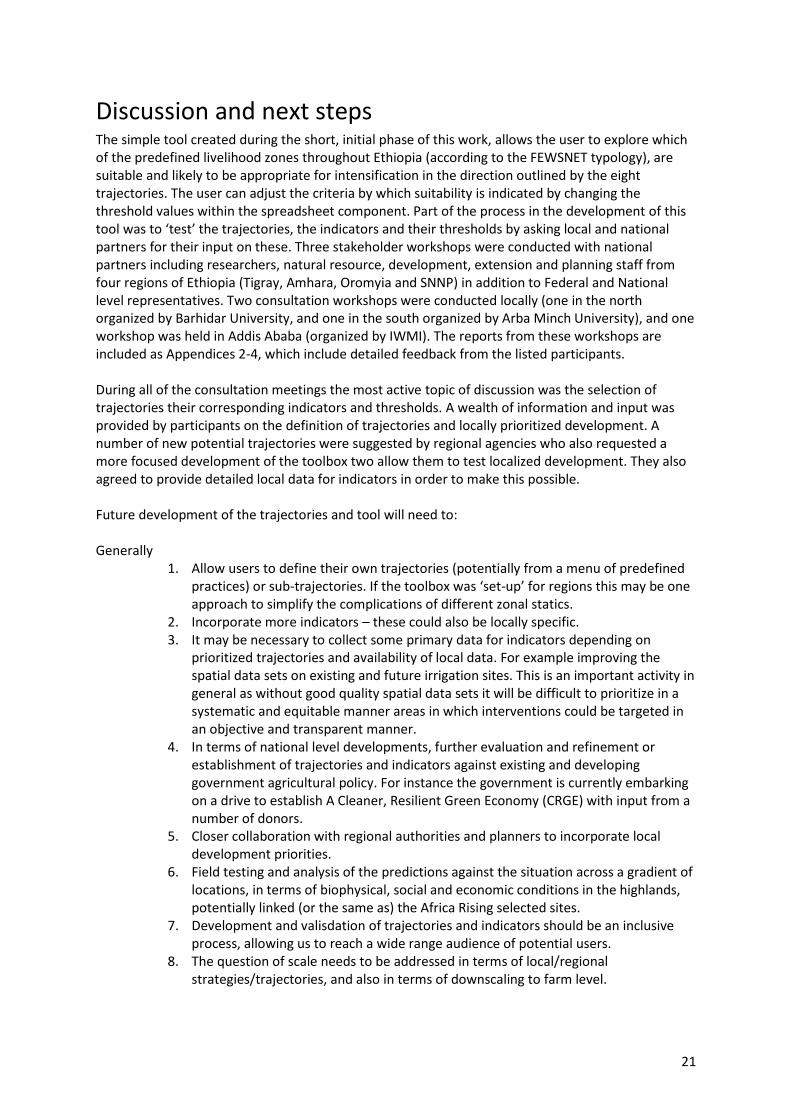
Spatial Distribution of Key Agricultural Intensification Trajectories in Ethiopia The spatial distribution of the agricultural intensification trajectories is based on the current thresholds suggested in table 8.
Figure 3 Soil and water conservation intensification areas
24
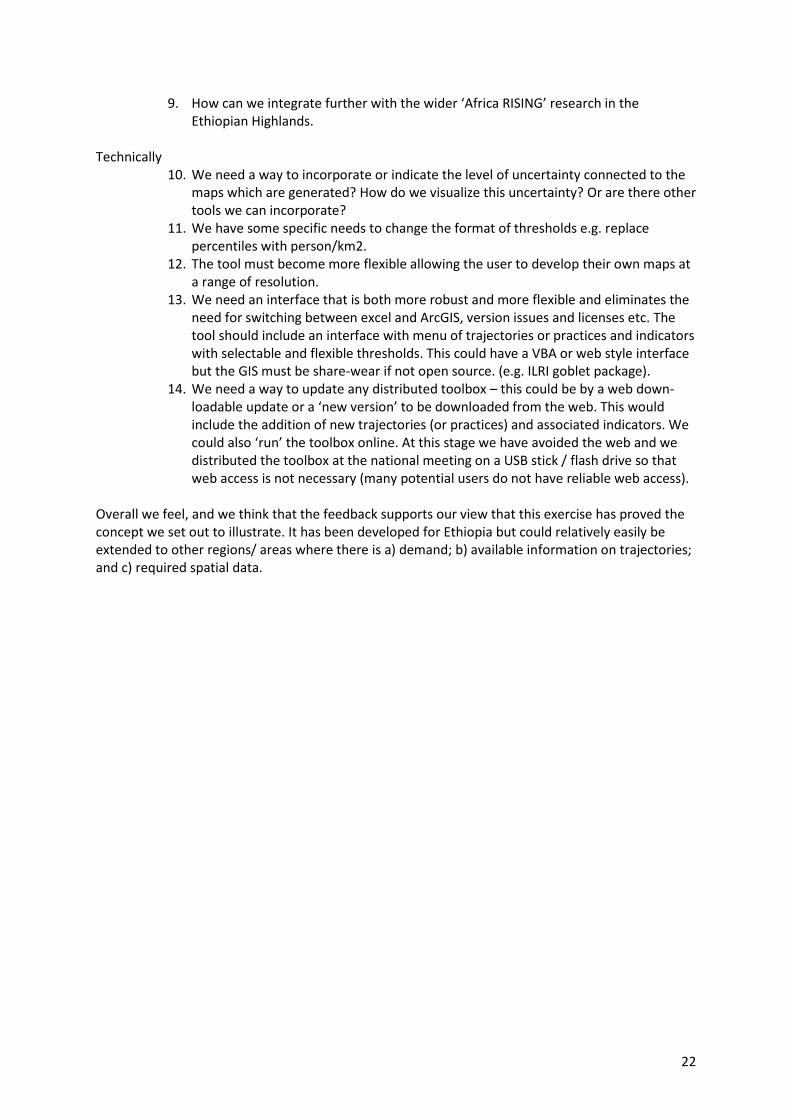
Figure 4 Small and medium scale irrigation intensification areas
Figure 5 Rain fed smallholder intensification areas
25
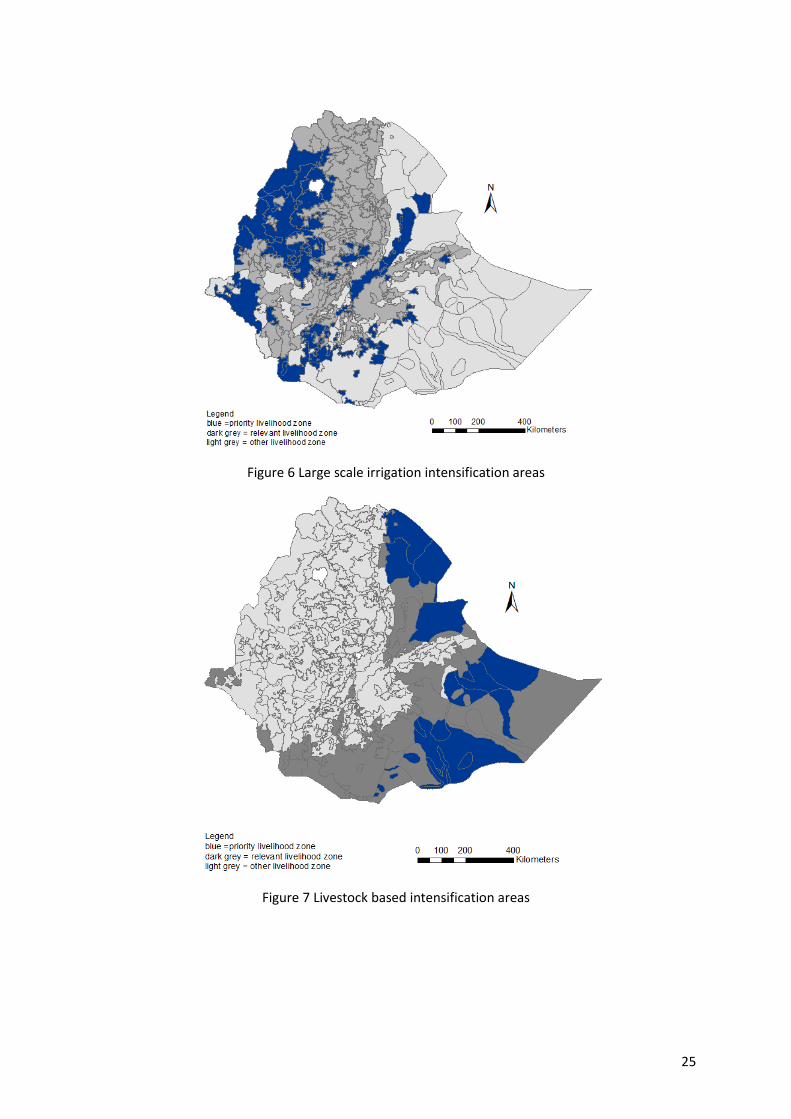
Figure 6 Large scale irrigation intensification areas
Figure 7 Livestock based intensification areas
26
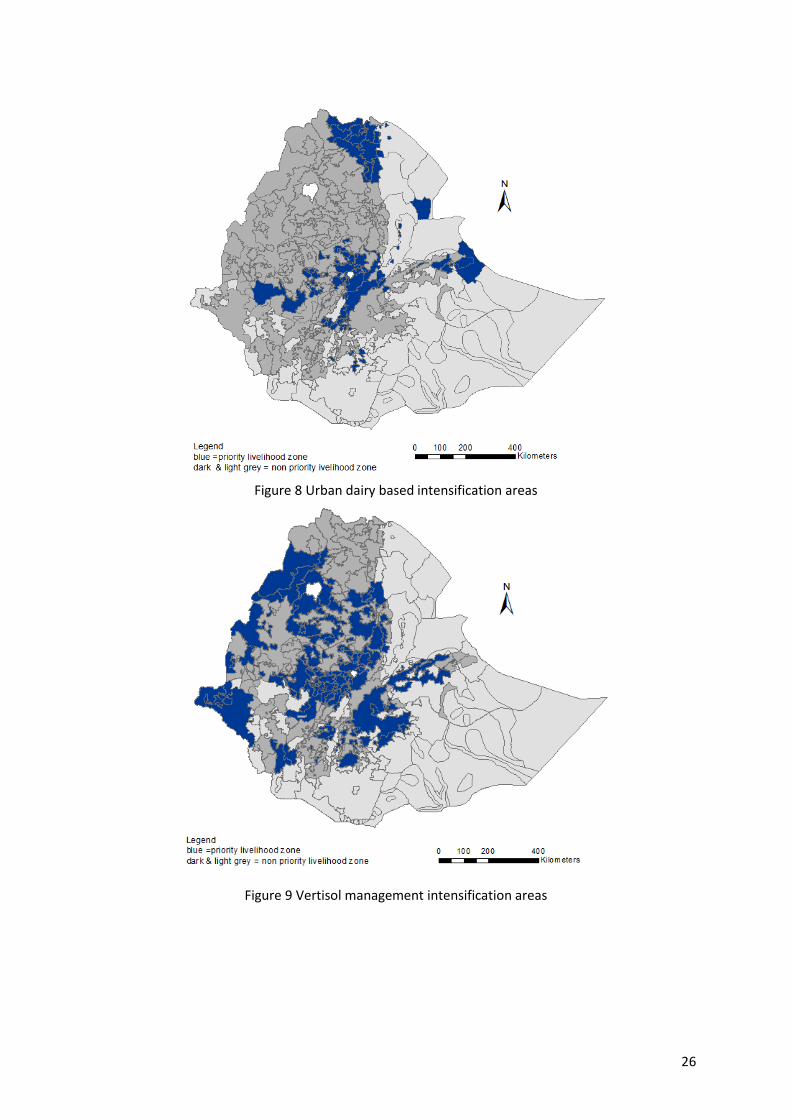
Figure 8 Urban dairy based intensification areas
Figure 9 Vertisol management intensification areas
27
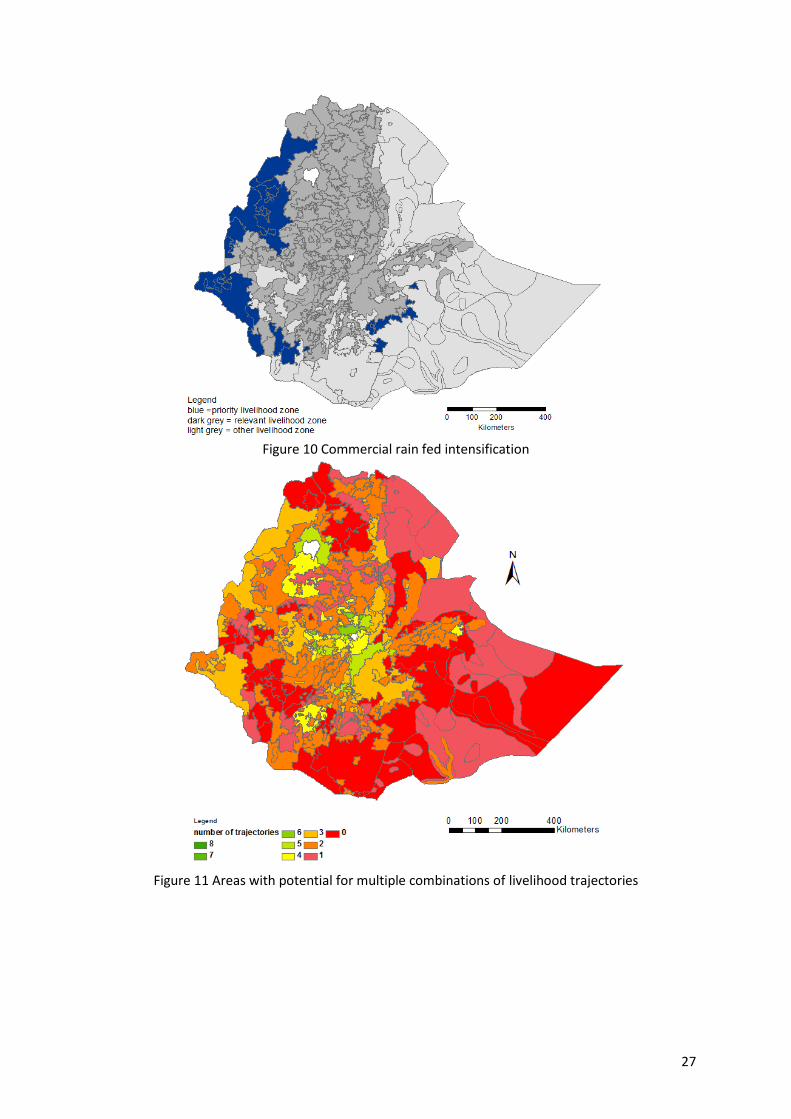
Figure 10 Commercial rain fed intensification
Figure 11 Areas with potential for multiple combinations of livelihood trajectories
28
References Alemayehu, M, (2008) Water-Centered Growth Corridor in the Rural Setting – Key to Social and economic Transformation. A Case Study of Northern Ethiopia. In: S. B. Awulachew, T. Erkossa and Y. Balcha (Eds.) Proceedings of the Second Forum: Summary Report, Abstracts of Papers with Proceedings on Cd-Rom, December 15–16, 2008, Addis Ababa, Ethiopia
Alemayehu, T, (2008), Land Use Guided Growth Corridor Development Approach to ensure Sustainable Development. The Case of Oromia Regional State. In: S. B. Awulachew, T. Erkossa and Y. Balcha (Eds.) Proceedings of The Second Forum: Summary Report, Abstracts of Papers with Proceedings on Cd-Rom, December 15–16, 2008, Addis Ababa, Ethiopia
Amdissa T.2006. Agriculture, Growth and Poverty Reduction in Ethiopia: Policy Processes around the New PRSP (PASDEP), Research paper 004, Future Agriculture, March 2006
Amhara Bureau of Finance and Economic Development- BoFED), Strategic Plan of Amhara Region, at: http://www.amharabofed.gov.et/plan_budget.html, accessed on July, 22, 2012
Awulachew, S. B., Yilma, A. D., Loulseged, M., Loiskandl, W., Ayana, M. and Alamirew, T. 2007. Water Resources and Irrigation Development in Ethiopia. IWMI Working Paper 123.
Brown, A, (2011) A Review of Water Scarcity Indices and Methodologies, The Sustainability Consortium, White paper no. 106, pp. 19
Cassman, K.G., Dobermann, A., Walters, D.T., Yang, H. 2003. Meeting cereal demand while protecting natural resources and improving environmental quality. Annu. Rev. Environ. Resource. 28: 315-358.
Charles H., J. Godfray1, John R. Beddington, Ian R. Crute, Lawrence Haddad, David Lawrence. 2010. Food Security the challenge of feeding 9 billion people. Science 327, 812
Clay, D., Reardon, T., Kangasniemi, J. 1998. Sustainable intensification in the highland tropics: Rwandan farmers’ investments in land conservation and soil fertility. Economic Development and Cultural Change 46 (2), 351–378.
FAO (2011) Federal Republic of Ethiopia mapping and assessing the potential for investment agricultural water management. FAO Rome.
FAO. 2007. Land Evaluation: towards a revised framework. Food and Agricultural Organizations of the United Nations (FAO), Rome
FAO.1976. A Framework for land evaluation: Soils Bulletins 32, Rome.
Gregory, PJ, Ingram, JSI, Andersson, R, Betts, RA, Brovkin, V, Chase, TN, Grace, PR, Gray,AJ, Hamilton, N, Hardy, TB, Howden, SM, Jenkins, A, Meybeck, M, Olsson, M, Ortiz- Monasterio, I, Palm, CA, Payn, TW, Rummukainen, M, Schulze, RE, Thiem, M, Valentin, C, Wilkinson, MJ .2002. Environmental consequences of alternative practices for intensifying crop production. Agriculture, Ecosystems and Environment, 88, 279–290.
Haileslassie, A., Hagos, F., Mapedza, E., Sadoff, C., Bekele, S., Gebreselassie, S. and Peden, D. 2009. Institutional settings and livelihood strategies in the Blue Nile Basin: Implications for upstream/downstream linkages, IWMI Working Paper 132, International Water Management Institute, Colombo, Sri Lanka
Hobbs P. R., K. Sayre, R. Gupta, Philos. Trans. R. Soc. London Ser. B Biol. Sci. 363, 543 (2008).
https://sites.google.com/site/meretproject04/hot-news-1/headline2,
29
Jafari, S. Zaredar, N. (2010). Land Suitability Analysis using Multi Attribute Decision Making Approach. International Journal of Environmental Science and Development, Vol.1, No.5, December 2010. ISSN: 2010-0264. Australia.
Kininmonth, I. (2000). Identifying areas of agricultural significance. Citation missing
Ministry of Agriculture and Rural Development (MoARD) 2006. Agricultural Policies, Programs And Targets for a Plan for Accelerated and Sustainable Development to End Poverty (PASDEP): (2005/6 - 2009/10)
Ministry of Agriculture and Rural Development (MoARD) 2010. Revised Project Implementation Manual for the Sustainable Land Management Project
Ministry of Agriculture and Rural Development (MoARD). 2009. The Five Year Seed Plan (2009–2014), Addis Ababa, Ethiopia: Ministry of Agriculture and Rural Development
Nedassa, B., (2012), MERET Beyond Borders: MERET PROJECT (accessed on July, 19, 2012):
Nedessa, B., Wickrema, S., (2012), Disaster risk reduction: Experience from the MERET project in Ethiopia (accessed on July, 19, 2012): https://sites.google.com/site/meretproject04/hot-news-1/disasterriskreductionexperiencefrommeretprojectinethiopia
Reardon, T., Barrett, C., Kelly, V., Savadogo, K. (1999), Policy rforms and sustainable agricultural intensification in Africa. Development Policy Review 17 (4), 375–386.
Reardon, T., Kelly, V., Crawford, E., Diagana, B., Dione, J., Savadogo, K., Boughton, D. (1997),
Reardon. T., Kelly, V. and Crawford, E. (1997), Promoting sustainable intensification and productivity growth in Sahel agriculture after macroeconomic policy reform. Food Policy 22 (4), 317–328
Rodell, M., Velicogna, I., and Famiglietti, J.S. (2009), Satellite-based estimates of groundwater depletion in India. Nature. 460: 999-1002
Royal Society of London. 2009. Reaping the Benefits: Science and the Sustainable Intensification of Global Agriculture (Royal Society, London, 2009).
Sadras VO, Roget DK. 2004 Production and environmental aspects of cropping intensification in a semiarid environment of southeastern Australia. Agronomy Journal 96:236-246
Santini, G., Peiser, L., Faurès, J. M., Neves, B. and Vallée, D. (2011), Planning smart investments in agricultural water management through a livelihood mapping approach: the case of Ethiopia: Draft
Tadege A (Ed.). 2007. Climate change National Adaptation Programme of Action (NAP) of Ethiopia, the Federal Democratic Republic of Ethiopia, Ministry of Water Resources National Meteorological Agency, pp. 85
Tadesse B (2009), Potential Agricultural Growth Areas in Ethiopia: A Preliminary Draft Submitted to World Bank, Ethiopia
Taye A. 2008. Digest of Ethiopia’s National Policies, Strategies and Programmes, Forum for Social Studies
Tiffen, M., Mortimore, M. and Gichuki, F., 1994, More People, Less Erosion: Environmental Recovery in Kenya, Chichester: Wiley
Vaviglia O., Fernando H. Andrade 2010 Sustainable intensification of Agriculture in the Argentinean Pampas: Capture and use efficiency of environmental resources. The American Journal of plant science and biotechnology, Global Science books

30
Appendix 1: Indicators potentially available as spatial data layers
Indicators
Climate: Other water:
annual precip direct runoff (yield)
rainfall variability wetlands / topographic index
coeffient of variation (precip) storage? Surface
standard precip index soil moisture - seasonal / AWC / variability
min/max temp accessibility
ET / PET / bare soil evap distance from perrenial surface water /
frequency of seasonal drought depth to ground water
severity / period of season drought current irrigation
dry spells? - length irrigation potential
frequency of seasonal flood planned irrigation
aridity index slope
worldclim - bioclim indicators aspect
to be reviewed in terms of CC
FEWS.net indicators Socio-economic / other:
reliability of onset
Crop / livestock: pop density
soil type pop growth
soil limitations % / proportion pop reliant on agriculture
erosion hazard % / proportion pop reliant on livestock
farming system poverty indices
livestock density market access
herd size per household road access
off-take rate credit access
crop yield statistics extension service access
land cover / land use remittance
livelihood zones income diversification index
fertilizer use level of education (hh head)
seed access distance to school / density
length of growing season female / male proportion (migration)
coeff of variation of growing season access to medical centre
health indicators - malnutrition
tetse fly zone
malaria zone
environmentally sensitive areas
31
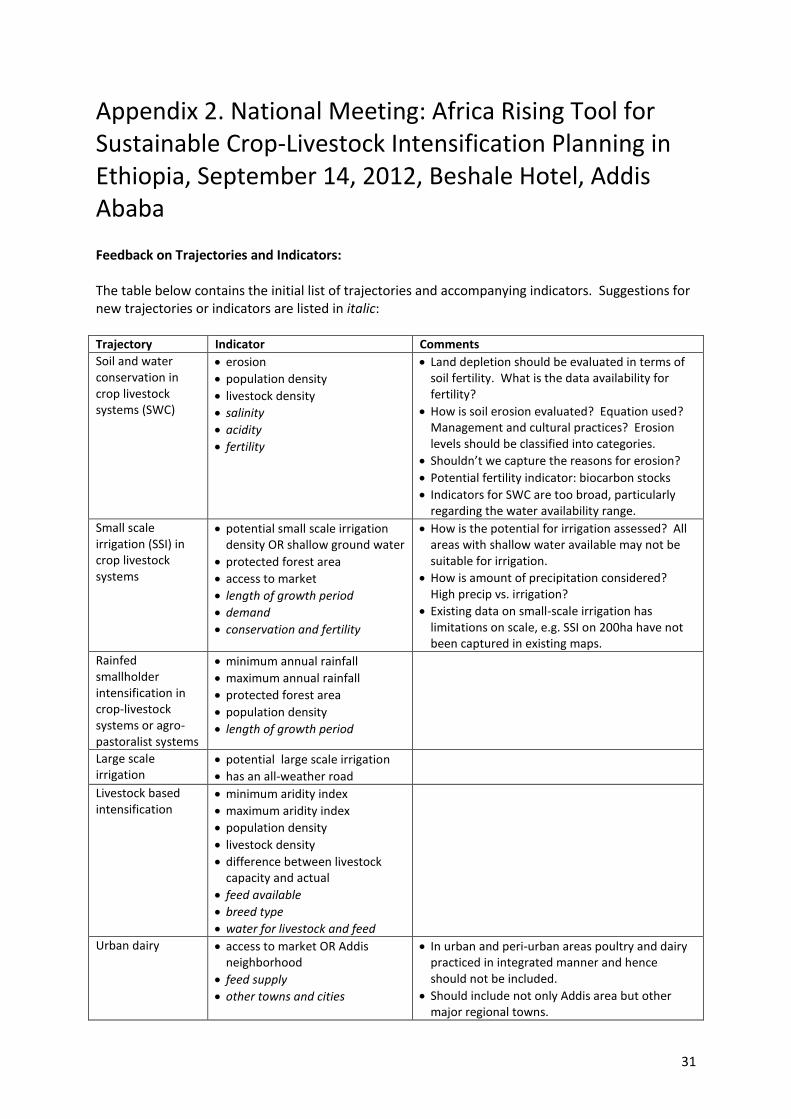
Appendix 2. National Meeting: Africa Rising Tool for Sustainable Crop-Livestock Intensification Planning in Ethiopia, September 14, 2012, Beshale Hotel, Addis Ababa Feedback on Trajectories and Indicators: The table below contains the initial list of trajectories and accompanying indicators. Suggestions for new trajectories or indicators are listed in italic: Trajectory Indicator Comments
Soil and water conservation in crop livestock systems (SWC)
erosion
population density
livestock density
salinity
acidity
fertility
Land depletion should be evaluated in terms of soil fertility. What is the data availability for fertility?
How is soil erosion evaluated? Equation used? Management and cultural practices? Erosion levels should be classified into categories.
Shouldn’t we capture the reasons for erosion?
Potential fertility indicator: biocarbon stocks
Indicators for SWC are too broad, particularly regarding the water availability range.
Small scale irrigation (SSI) in crop livestock systems
potential small scale irrigation density OR shallow ground water
protected forest area
access to market
length of growth period
demand
conservation and fertility
How is the potential for irrigation assessed? All areas with shallow water available may not be suitable for irrigation.
How is amount of precipitation considered? High precip vs. irrigation?
Existing data on small-scale irrigation has limitations on scale, e.g. SSI on 200ha have not been captured in existing maps.
Rainfed smallholder intensification in crop-livestock systems or agro-pastoralist systems
minimum annual rainfall
maximum annual rainfall
protected forest area
population density
length of growth period
Large scale irrigation
potential large scale irrigation
has an all-weather road
Livestock based intensification
minimum aridity index
maximum aridity index
population density
livestock density
difference between livestock capacity and actual
feed available
breed type
water for livestock and feed
Urban dairy access to market OR Addis neighborhood
feed supply
other towns and cities
In urban and peri-urban areas poultry and dairy practiced in integrated manner and hence should not be included.
Should include not only Addis area but other major regional towns.
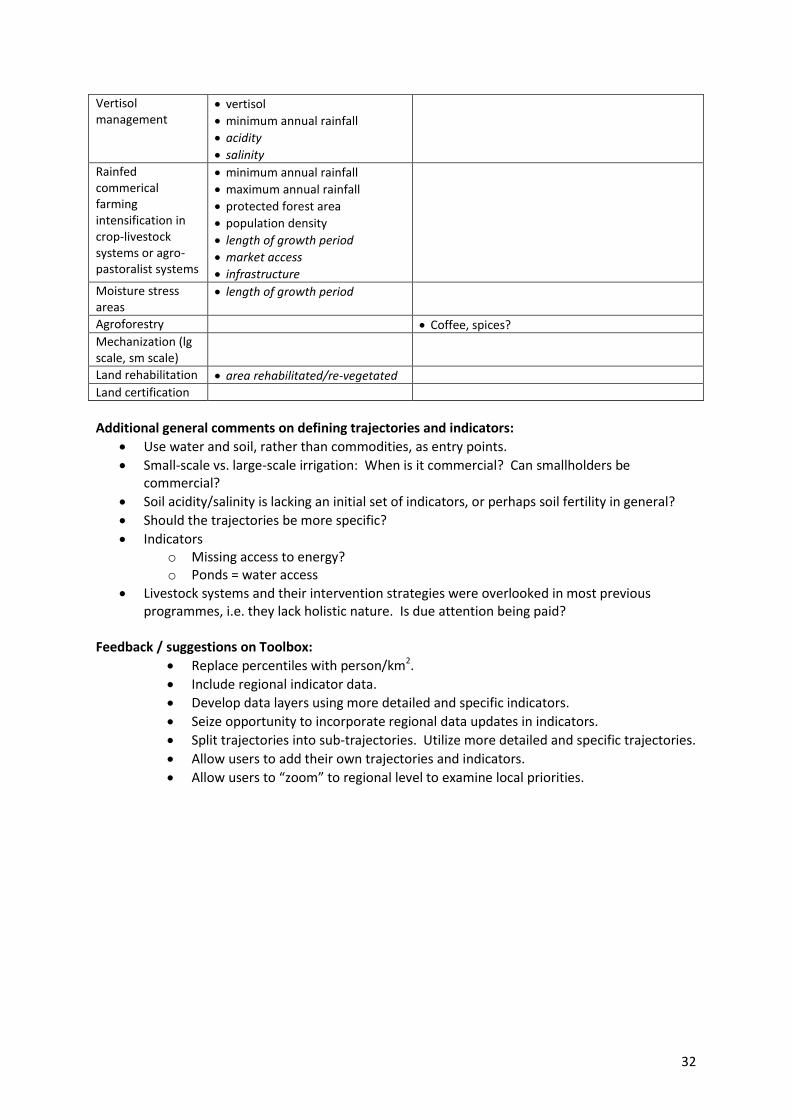
32
Vertisol management
vertisol
minimum annual rainfall
acidity
salinity
Rainfed commerical farming intensification in crop-livestock systems or agro-pastoralist systems
minimum annual rainfall
maximum annual rainfall
protected forest area
population density
length of growth period
market access
infrastructure
Moisture stress areas
length of growth period
Agroforestry Coffee, spices?
Mechanization (lg scale, sm scale)
Land rehabilitation area rehabilitated/re-vegetated
Land certification
Additional general comments on defining trajectories and indicators:
Use water and soil, rather than commodities, as entry points.
Small-scale vs. large-scale irrigation: When is it commercial? Can smallholders be commercial?
Soil acidity/salinity is lacking an initial set of indicators, or perhaps soil fertility in general?
Should the trajectories be more specific?
Indicators o Missing access to energy? o Ponds = water access
Livestock systems and their intervention strategies were overlooked in most previous programmes, i.e. they lack holistic nature. Is due attention being paid?
Feedback / suggestions on Toolbox:
Replace percentiles with person/km2.
Include regional indicator data.
Develop data layers using more detailed and specific indicators.
Seize opportunity to incorporate regional data updates in indicators.
Split trajectories into sub-trajectories. Utilize more detailed and specific trajectories.
Allow users to add their own trajectories and indicators.
Allow users to “zoom” to regional level to examine local priorities.
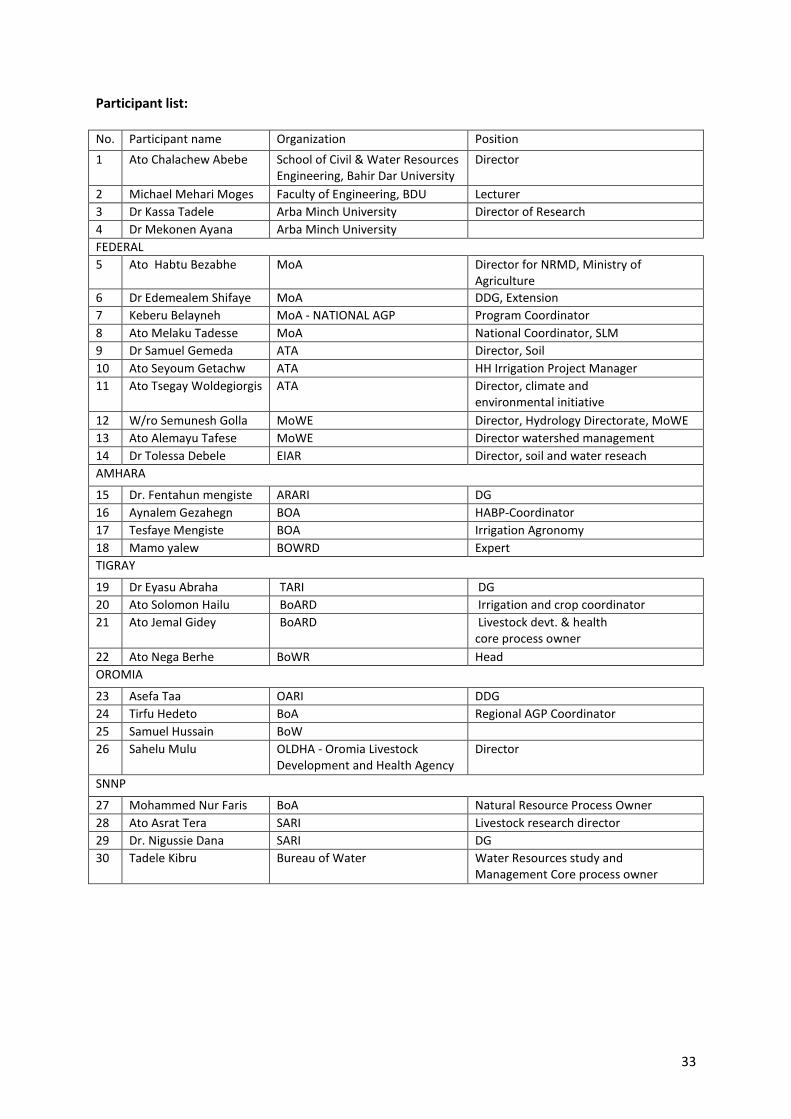
33
Participant list: No. Participant name Organization Position
1 Ato Chalachew Abebe School of Civil & Water Resources Engineering, Bahir Dar University
Director
2 Michael Mehari Moges Faculty of Engineering, BDU Lecturer
3 Dr Kassa Tadele Arba Minch University Director of Research
4 Dr Mekonen Ayana Arba Minch University
FEDERAL
5 Ato Habtu Bezabhe MoA Director for NRMD, Ministry of Agriculture
6 Dr Edemealem Shifaye MoA DDG, Extension
7 Keberu Belayneh MoA - NATIONAL AGP Program Coordinator
8 Ato Melaku Tadesse MoA National Coordinator, SLM
9 Dr Samuel Gemeda ATA Director, Soil
10 Ato Seyoum Getachw ATA HH Irrigation Project Manager
11 Ato Tsegay Woldegiorgis ATA Director, climate and environmental initiative
12 W/ro Semunesh Golla MoWE Director, Hydrology Directorate, MoWE
13 Ato Alemayu Tafese MoWE Director watershed management
14 Dr Tolessa Debele EIAR Director, soil and water reseach
AMHARA
15 Dr. Fentahun mengiste ARARI DG
16 Aynalem Gezahegn BOA HABP-Coordinator
17 Tesfaye Mengiste BOA Irrigation Agronomy
18 Mamo yalew BOWRD Expert
TIGRAY
19 Dr Eyasu Abraha TARI DG
20 Ato Solomon Hailu BoARD Irrigation and crop coordinator
21 Ato Jemal Gidey BoARD Livestock devt. & health core process owner
22 Ato Nega Berhe BoWR Head
OROMIA
23 Asefa Taa OARI DDG
24 Tirfu Hedeto BoA Regional AGP Coordinator
25 Samuel Hussain BoW
26 Sahelu Mulu OLDHA - Oromia Livestock Development and Health Agency
Director
SNNP
27 Mohammed Nur Faris BoA Natural Resource Process Owner
28 Ato Asrat Tera SARI Livestock research director
29 Dr. Nigussie Dana SARI DG
30 Tadele Kibru Bureau of Water Water Resources study and Management Core process owner
Related Documents