Voluntary attention changes the speed of perceptual neural processing Yasuki Noguchi, 1,3,4 Hiroki C. Tanabe, 2 Norihiro Sadato, 2 Minoru Hoshiyama 3 and Ryusuke Kakigi 1 1 Department of Integrative Physiology, National Institute for Physiological Sciences, Myodaiji, Okazaki, Japan 2 Department of Cerebral Research, National Institute for Physiological Sciences, Myodaiji, Okazaki, Japan 3 Department of Health Science, Faculty of Medicine, Nagoya University, Nagoya, Japan 4 Division of Biology, California Institute of Technology, Pasadena, California 91125, USA Keywords: functional magnetic resonance imaging (fMRI), humans, magnetoencephalography (MEG), ventral pathway, visual cortex Abstract While previous studies in psychology demonstrated that humans can respond more quickly to the stimuli at attended than unattended locations, it remains unclear whether attention also accelerates the speed of perceptual neural activity in the human brain. One possible reason for this unclarity would be an insufficient spatial resolution of previous electroencephalography (EEG) and magnetoencephalography (MEG) techniques in which neural signals from multiple brain regions are merged with each other. Here, we addressed this issue by combining MEG with a novel stimulus-presentation technique that can focus on neural signals from higher visual cortex where the magnitude of attentional modulation is prominent. Results revealed that the allocation of spatial attention induces both an increase in neural intensity (attentional enhancement) and a decrease in neural latency (attentional acceleration) to the attended compared to unattended visual stimuli (Experiment 1). Furthermore, an attention-induced behavioural facilitation reported in previous psychological studies (Posner paradigm) was closely correlated with the neural ‘acceleration’ rather than ‘enhancement’ in the visual cortex (Experiment 2). In addition to bridging a gap between previous psychological and neurological findings, our results demonstrated a temporal dynamics of attentional modulation in the human brain. Introduction Many studies in neuroscience have shown that an allocation of attention produces the enhancement of neural activity in various visual areas (Desimone et al., 1990; Motter, 1993; Cook & Maunsell, 2002; Reynolds & Chelazzi, 2004). One important but unsolved question is whether attention also induces temporal changes in sensory neutral activities. While previous psychological studies indicate that attention makes the visual processing of humans faster (Posner et al., 1980; Carrasco & McElree, 2001), results in the neurological studies on humans, using electroencephalography (EEG) or magnetoencephalo- graphy (MEG), are controversial. In both voluntary and reflexive types of attention, most studies denied a possibility that attention accelerates sensory neural activity (Hillyard & Anllo-Vento, 1998; Di Russo et al., 2003; McDonald et al., 2005), whereas a few groups reported a shortening of latency in EEG waveforms induced by attention (Di Russo & Spinelli, 2002; Schuller & Rossion, 2005). One possible reason for this discrepancy would be an insufficient spatial resolution of previous EEG ⁄ MEG techniques. When investi- gating visual activities, this would produce a confounding of neural signals from the lower and higher visual areas. On the other hand, it is well known that the attentional modulation is generally stronger in the higher than lower visual areas (Cook & Maunsell, 2002; Saenz et al., 2002). Therefore, the confounding of neural signals from the lower visual areas into EEG ⁄ MEG data might have obscured the attentional modulation of the latency occurring selectively in the higher rather than lower visual regions, resulting in an underestimation or oversight of latency changes in some cases. In the present study, we investigated this issue by combining MEG with a new stimulus-presentation technique. Our technique is based on previous neurophysiological findings that neurons in the higher visual areas (e.g. fusiform and inferior temporal regions) show a ‘cue- invariant’ response property (Sary et al., 1993; Grill-Spector et al., 1998). The activities of these high-level neurons are not influenced whether shapes of stimuli are defined by luminance or nonluminance cues (e.g. contrast, texture, or motion) from the background. In contrast, neuronal activities in the lower (e.g. V1) areas are strongly attenuated when stimuli are defined by the nonluminance cue, although they show a strong activity to luminance-defined edges (Chaudhuri & Albright, 1997). Taking advantage of this difference in cue-invariance, we used visual patterns defined by static-dynamic contrast of random dot fields (random-dot blinking method, RDB, Fig. 1A), not by the luminance difference. Thus, those RDB visual patterns can activate the higher visual areas without evoking strong responses in the lower regions, providing an ideal approach for discerning whether attention can change temporal profiles of percep- tual neural activity. In subsequent experiments, we initially confirmed a validity of our RDB method using functional magnetic resonance imaging (fMRI) and examined whether the RDB stimulus could induce a significant activity in the higher visual areas while minimizing responses in the Correspondence: Dr Yasuki Noguchi, 4 Division of Biology, as above. E-mail: [email protected] Received 30 December 2006, revised 11 March 2007, accepted 20 March 2007 European Journal of Neuroscience, Vol. 25, pp. 3163–3172, 2007 doi:10.1111/j.1460-9568.2007.05552.x ª The Authors (2007). Journal Compilation ª Federation of European Neuroscience Societies and Blackwell Publishing Ltd

Welcome message from author
This document is posted to help you gain knowledge. Please leave a comment to let me know what you think about it! Share it to your friends and learn new things together.
Transcript
Voluntary attention changes the speed of perceptual neuralprocessing
Yasuki Noguchi,1,3,4 Hiroki C. Tanabe,2 Norihiro Sadato,2 Minoru Hoshiyama3 and Ryusuke Kakigi11Department of Integrative Physiology, National Institute for Physiological Sciences, Myodaiji, Okazaki, Japan2Department of Cerebral Research, National Institute for Physiological Sciences, Myodaiji, Okazaki, Japan3Department of Health Science, Faculty of Medicine, Nagoya University, Nagoya, Japan4Division of Biology, California Institute of Technology, Pasadena, California 91125, USA
Keywords: functional magnetic resonance imaging (fMRI), humans, magnetoencephalography (MEG), ventral pathway, visualcortex
Abstract
While previous studies in psychology demonstrated that humans can respond more quickly to the stimuli at attended than unattendedlocations, it remains unclear whether attention also accelerates the speed of perceptual neural activity in the human brain. Onepossible reason for this unclarity would be an insufficient spatial resolution of previous electroencephalography (EEG) andmagnetoencephalography (MEG) techniques in which neural signals from multiple brain regions are merged with each other. Here,we addressed this issue by combining MEG with a novel stimulus-presentation technique that can focus on neural signals from highervisual cortex where the magnitude of attentional modulation is prominent. Results revealed that the allocation of spatial attentioninduces both an increase in neural intensity (attentional enhancement) and a decrease in neural latency (attentional acceleration) tothe attended compared to unattended visual stimuli (Experiment 1). Furthermore, an attention-induced behavioural facilitationreported in previous psychological studies (Posner paradigm) was closely correlated with the neural ‘acceleration’ rather than‘enhancement’ in the visual cortex (Experiment 2). In addition to bridging a gap between previous psychological and neurologicalfindings, our results demonstrated a temporal dynamics of attentional modulation in the human brain.
Introduction
Many studies in neuroscience have shown that an allocation ofattention produces the enhancement of neural activity in various visualareas (Desimone et al., 1990; Motter, 1993; Cook & Maunsell, 2002;Reynolds & Chelazzi, 2004). One important but unsolved question iswhether attention also induces temporal changes in sensory neutralactivities. While previous psychological studies indicate that attentionmakes the visual processing of humans faster (Posner et al., 1980;Carrasco & McElree, 2001), results in the neurological studies onhumans, using electroencephalography (EEG) or magnetoencephalo-graphy (MEG), are controversial. In both voluntary and reflexive typesof attention, most studies denied a possibility that attention acceleratessensory neural activity (Hillyard & Anllo-Vento, 1998; Di Russoet al., 2003; McDonald et al., 2005), whereas a few groups reported ashortening of latency in EEG waveforms induced by attention (DiRusso & Spinelli, 2002; Schuller & Rossion, 2005).
One possible reason for this discrepancy would be an insufficientspatial resolution of previous EEG ⁄ MEG techniques. When investi-gating visual activities, this would produce a confounding of neuralsignals from the lower and higher visual areas. On the other hand, it iswell known that the attentional modulation is generally stronger in thehigher than lower visual areas (Cook & Maunsell, 2002; Saenz et al.,2002). Therefore, the confounding of neural signals from the lower
visual areas into EEG ⁄ MEG data might have obscured the attentionalmodulation of the latency occurring selectively in the higher ratherthan lower visual regions, resulting in an underestimation or oversightof latency changes in some cases.In the present study, we investigated this issue by combining MEG
with a new stimulus-presentation technique. Our technique is based onprevious neurophysiological findings that neurons in the higher visualareas (e.g. fusiform and inferior temporal regions) show a ‘cue-invariant’ response property (Sary et al., 1993; Grill-Spector et al.,1998). The activities of these high-level neurons are not influencedwhether shapes of stimuli are defined by luminance or nonluminancecues (e.g. contrast, texture, or motion) from the background. Incontrast, neuronal activities in the lower (e.g. V1) areas are stronglyattenuated when stimuli are defined by the nonluminance cue,although they show a strong activity to luminance-defined edges(Chaudhuri & Albright, 1997). Taking advantage of this difference incue-invariance, we used visual patterns defined by static-dynamiccontrast of random dot fields (random-dot blinking method, RDB,Fig. 1A), not by the luminance difference. Thus, those RDB visualpatterns can activate the higher visual areas without evoking strongresponses in the lower regions, providing an ideal approach fordiscerning whether attention can change temporal profiles of percep-tual neural activity.In subsequent experiments, we initially confirmed a validity of our
RDB method using functional magnetic resonance imaging (fMRI)and examined whether the RDB stimulus could induce a significantactivity in the higher visual areas while minimizing responses in the
Correspondence: Dr Yasuki Noguchi, 4Division of Biology, as above.E-mail: [email protected]
Received 30 December 2006, revised 11 March 2007, accepted 20 March 2007
European Journal of Neuroscience, Vol. 25, pp. 3163–3172, 2007 doi:10.1111/j.1460-9568.2007.05552.x
ª The Authors (2007). Journal Compilation ª Federation of European Neuroscience Societies and Blackwell Publishing Ltd
lower regions. We then applied this technique into two MEG studies,one for a sustained spatial attention and another for a trial-by-trialattention-cuing task.
Materials and methods
Subjects
We conducted four experiments; one fMRI, one behavioural and twoMEG experiments. Numbers of subjects were 11 (fMRI), 9 (beha-vioural), 14 and 10 (MEG Experiment 1 and 2, respectively). Allsubjects had normal or corrected-to-normal visual acuity. Informedconsent was received from each subject after the nature of the studyhad been explained. All procedures in this study conformed to TheCode of Ethics of the World Medical Association (Declaration ofHelsinki), and approval for these experiments was obtained from the
ethics committee of the National Institute for Physiological Sciences,Okazaki, Japan.
Random-dot blinking method
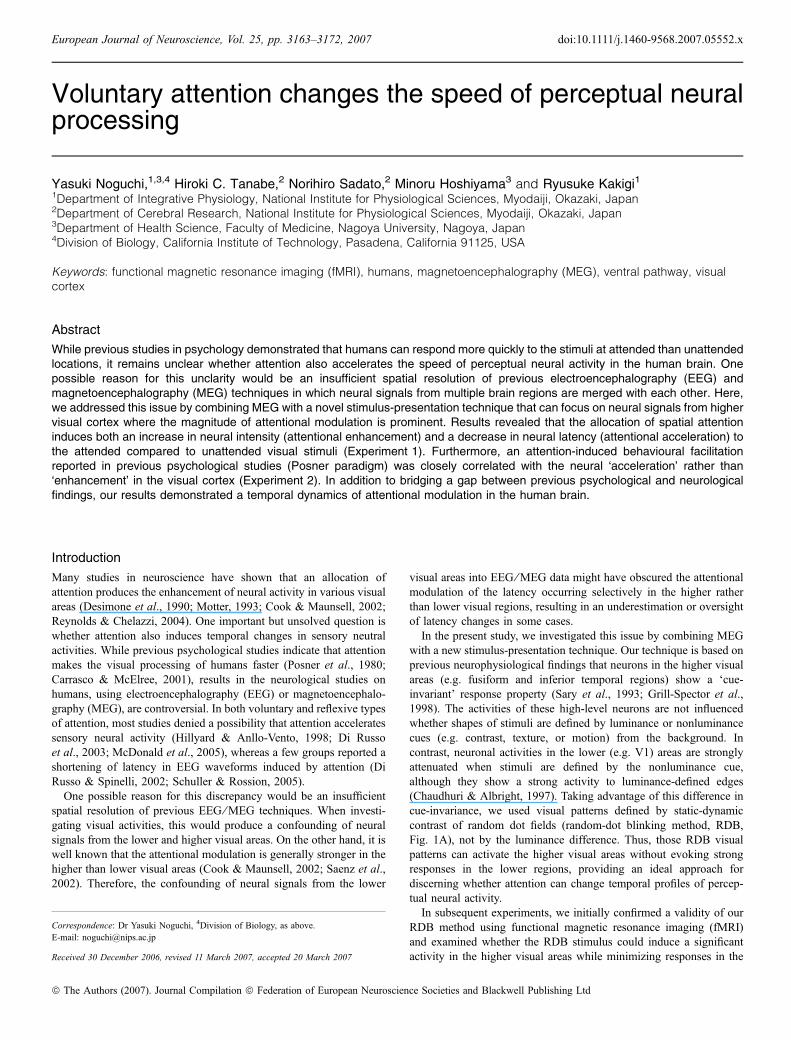
All task stimuli in the present MEG study were presented through ourrandom dot blinking (RDB) technique (Okusa et al., 1998; Noguchiet al., 2004), in order to focus on the neural activity in occipito-temporal higher visual regions related to shape perception or objectrecognition (Grill-Spector et al., 1998; Kourtzi & Kanwisher, 2001).In this method, visual patterns were presented on a black-and-whiterandom dot field (60 · 60 dots, 8 · 8 degrees). Although all dots inthe field flickered (60 Hz) continuously in the resting period, a subsetof dots making up the visual pattern became static during the patternpresentation period while the other dots (outside the visual pattern)remained dynamic (Fig. 1A). This static-dynamic contrast of randomdot field enabled observers to perceive the shape of the visual pattern.As the ratio of white and black pixels was fixed (white : black, 1 : 3)throughout both periods, the mean luminance of the field was alwaysthe same. According to our previous study, these RDB visual patternsinduced one simple neuromagnetic response at a peak latency of 250–300 ms (the 300-ms component), the signal source of which isestimated to lie in the occipito-temporal area around the fusiformgyrus. Other details on the RDB method have been describedelsewhere (Noguchi & Kakigi, 2006).
fMRI experiment
Although previous neurophysiological findings on the cue-invariantproperty in high-level visual neurons (Sary et al., 1993; Grill-Spectoret al., 1998; Zeki et al., 2003) lead us to assume that our RDB methodcould minimize the neural activity from lower visual regions, weexamined this assumption using an fMRI technique. Brain responsesto the conventional luminance-defined (LD) stimuli and our RDBletters were investigated in separate runs of the block design (Fig. 1A–C).Each run consisted of the alternations of five baseline (20 s)and four activation (24 s) epochs. In the baseline epoch, only thebackground of each condition (a black screen for the LD and therandom-dot filed for the RDB runs) was shown and the subjects wereasked to fixate on a central point (no task). On the other hand,12 unilateral stimuli (duration, 300 ms for each) were sequentiallypresented in the activation epoch at a rate of 2 s per stimulus. Thestimuli were either upright or an inverted ‘T’ (Noesselt et al., 2002)presented at the upper left or right visual field (a centre-to-fixationdistance, 4.2 degrees). In the activation epoch of LD runs, upright orinverted white T-shape (34 cd ⁄ m2, presentation ratio of upright : -inverted, 1 : 1) appeared every 2 s with the order of the four types ofstimuli randomized. The stimuli were identical in the RDB runs exceptthat the T-shape was depicted by the static-dynamic contrast of therandom dots (not luminance difference). In both runs, the subjectswere required to judge whether the presented stimuli were upright orinverted, ignoring the position of presentation. They pressed one oftwo buttons with the right index ⁄ middle finger in response toupright ⁄ inverted T. One experiment contained four runs, two for LDand two for RDB. The order of the two conditions was counterbal-anced across the subjects.All fMRI experiments were conducted with a 3-T MRI system
(Allegra, Siemens, Germany). For functional images, an interleavedT2*-weighted gradient-echo echo-planar imaging (EPI) sequence wasused to produce 34 continuous slices of 4 mm thickness covering theentire brain volume (repetition time, 2000 ms; echo time, 30 ms; flip
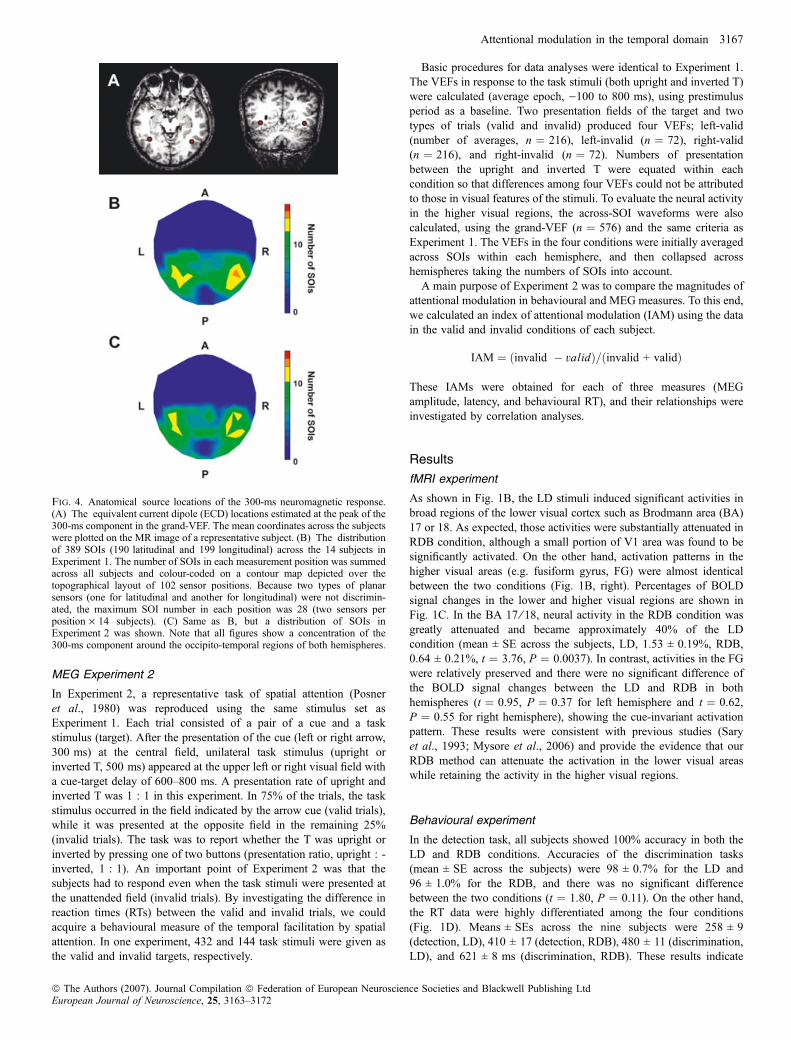
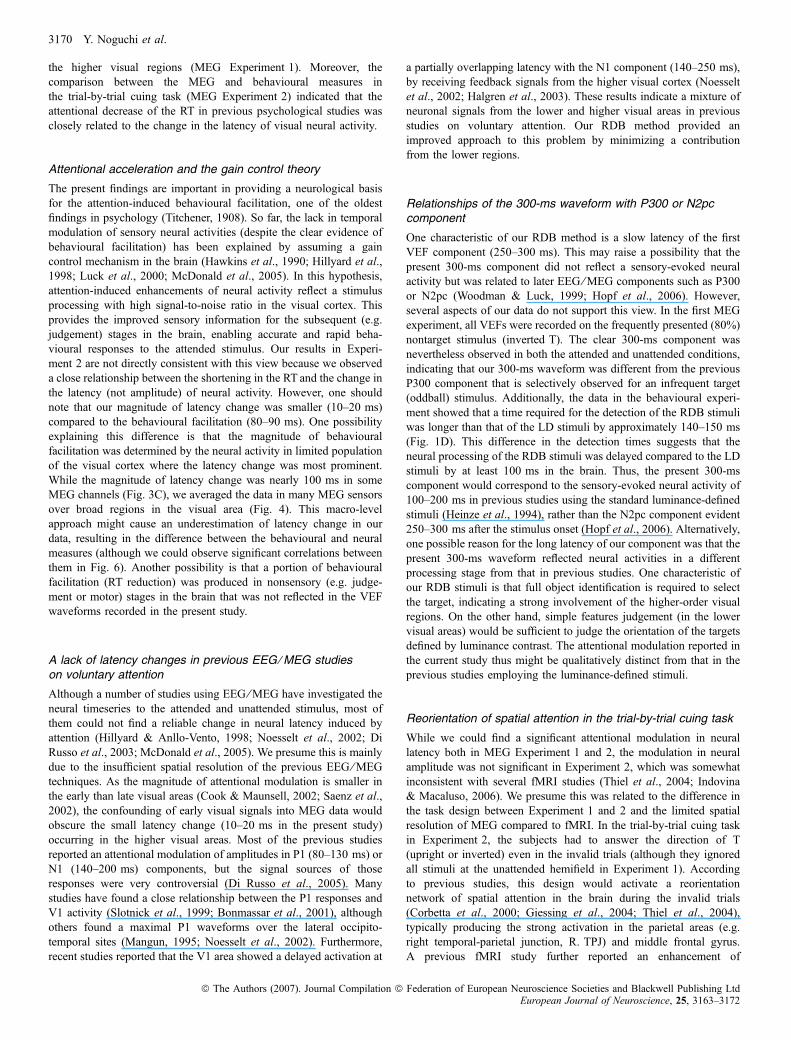
Fig. 1. Random-dot blinking (RDB) method. (A) Schematic illustration ofthe RDB. While each dot in the field is vibrating at 60 Hz in the resting period(left), the dynamic-static segregation of dots elicits a perception of visualpatterns in the presentation period (middle). The actual density of the dot is alsoshown (right). (B) Brain responses to the presentation of luminance-defined(LD) and RDB letters measured by fMRI. Note that while the activities in thelower visual areas (e.g. BA 17 ⁄ 18) were greatly attenuated in the RDBcompared to LD stimuli, neural responses in the higher-visual regions such asthe fusiform gyrus (FG) were mostly identical. (C) Comparisons of mean (andSE across subjects) neural activity of the lower (BA 17 ⁄ 18) and higher (FG)visual areas. Talairach coordinates of each region are given in the parenthesis.(D) Reaction time (mean ± SE across subjects) of the detection and discrim-ination tasks to the LD and RDB stimuli. **P < 0.01.
3164 Y. Noguchi et al.
ª The Authors (2007). Journal Compilation ª Federation of European Neuroscience Societies and Blackwell Publishing LtdEuropean Journal of Neuroscience, 25, 3163–3172
angle, 75�; field of view, 192 · 192 mm2; resolution, 3 · 3 mm2). Ina single run, 98 volumes were obtained following five dummy images.A three-dimensional whole-head structural brain image of each subjectwas also obtained using a magnetization-prepared rapid-acquisitiongradient echo sequence (Mugler, III & Brookeman, 1990) withthe following parameters; repetition time, 2500 ms; echo time,4.38 ms; flip angle, 8�; field of view, 230 · 230 mm2; resolution, 0.9 ·0.9 mm2.
The first five EPI volumes of each session were eliminated to allowfor the stabilization of the magnetization, and the remaining 98 vol-umes per session (a total of 392 volumes per participant for foursessions) were used for analysis. Preprocessing and statisticalestimation were performed using SPM2 (Wellcome Department ofCognitive Neurology, London, UK) on MATLAB (Math Works,Natick, MA). After realigning EPI volumes for motion correction, thewhole-head structural image volume was coregistered with the EPIvolume of first scan. Then, the whole-head image was normalized tothe Montreal Neurological Institute (MNI) T1 image template using anonlinear basis function. The same parameters were applied to all EPIvolumes. The EPI volumes were spatially smoothed in threedimensions using an 8-mm full-width half-maximum Gaussian kernel.Brain responses to either the LD or RDB stimuli were estimated foreach subject using a general linear model with a boxcar waveformconvolved with a canonical haemodynamic response function. Groupanalysis (random-effects model) of each stimulus condition was thenperformed by entering contrast images into one-sample t-test (Fristonet al., 1999). Statistical threshold was set at an FDR of P < 0.05,corrected for multiple comparisons.
Behavioural experiment
Using the same stimuli as the fMRI session, we conducted abehavioural experiment to estimate a difference in detection times forthe LD and RDB stimuli. During a run of one minute, four types of thetask stimuli (left upright, right upright, left inverted, and rightinverted) were randomly presented at a mean rate of 3 s per stimulus(20 stimuli in each run). The duration of each stimulus was 300 msand interstimulus intervals (ISIs) between adjacent stimuli werevariable (1.5–3.9 s). The subjects were required to do two differenttasks on those stimuli; detection and discrimination. In the detectiontask, they pressed a button as quickly as possible when each stimulusappeared. Both positions and directions (upright or inverted) of thestimuli were irrelevant to this task. In the discrimination task, on theother hand, they had to judge whether the presented ‘T’ was upright orinverted (presentation ratio of upright : inverted T, 1 : 1), regardlessof the position of the stimulus (the same task as the fMRI experiment).They pressed one button as quickly as possible when it was uprightand another when inverted. Four conditions, produced by thecombination of two stimuli (LD and RDB) and two tasks (detectionand discrimination), were tested in separate runs. Each experimentcontained eight runs (two runs per condition), with the order of thefour conditions counterbalanced across subjects.
Stimuli and task (MEG Experiment 1)
We then applied the RDB method into MEG experiments. During theMEG measurements, subjects maintained a fixation on a centre of therandom-dot field (60 · 60 dots, 8 · 8 degrees). In Experiment 1, taskstimuli are either upright or inverted ‘T’ (Noesselt et al., 2002)depicted by the RDB method, and presented unilaterally to thelocations in the upper left or right visual field (a centre-to-fixation
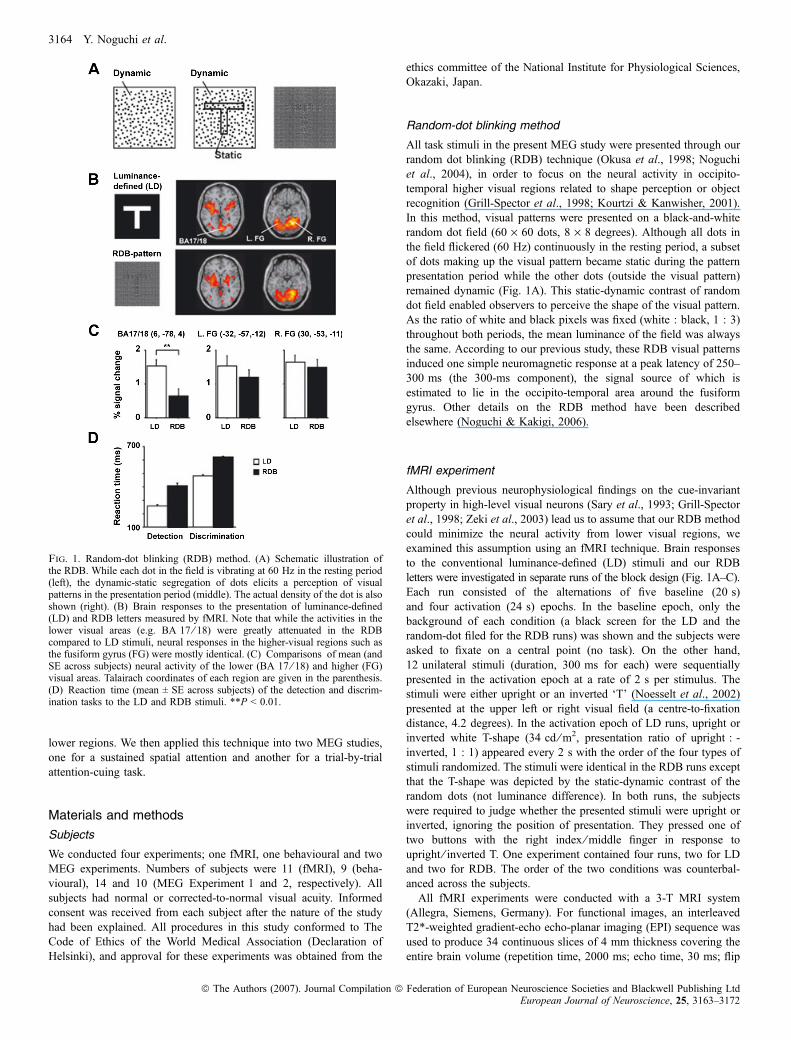
distance, 4.2 degrees). The locations where the stimuli could appearwere demarcated continuously by four small dots (Fig. 2). Each trialblock began with an attention-directing cue (duration, 1 s) at thecentral point (either a left arrow, a right arrow, or a neutral cueindicated by a diamond), followed by a sequence of ten unilateral taskstimuli. Each task stimulus lasted 300 ms and ISIs between adjacentstimuli was 1000–1400 ms. Four types of the task stimuli (left orright · upright or inverted) were randomly intermixed in eachsequence, with a constraint that an overall presentation ratio ofupright and inverted T was 2 : 8.In the blocks with the left or right arrow cues, the task of the
subjects was to covertly direct attention to the indicated visual fieldand press a button as quickly as possible when the upright T waspresented at the attended hemifield (target detection). They wereinstructed to neglect all stimuli presented at the opposite visual field.On the other hand, in the neutral blocks with the diamond cue, theypressed a button to the target (upright T) regardless of whether it waspresented in the left or right visual field. The subjects performed a totalof 54 blocks in one experiment, with the order of three types of blocks(18 for each) randomized. A total of 108 and 432 stimuli were givenas the target (upright) and nontarget (inverted), respectively.
Data analyses (MEG Experiment 1)
Visual-evoked fields (VEFs) in response to the task stimuli wererecorded with a helmet-shaped 306-channel MEG system (Vectorview,ELEKTA Neuromag, Helsinki, Finland), which comprised 102 iden-tical triple sensor elements. Each sensor element consisted of twoorthogonal planar gradiometers (one for measuring latitudinal mag-netic fields and another for longitudinal fields) and one magnetometer,providing three independent measurements of the magnetic fields. Inthe present study, we used MEG signals recorded from 204-channelplanar-type gradiometers. The signals from these sensors are strongestwhen the sensors are located just above local cerebral sources(Nishitani & Hari, 2002). To prevent neuromagnetic artifacts inducedby eye blinking, a brief interval (5 s) was interposed every ten stimuliand subjects were asked to blink their eyes within that period. Eyeposition was also monitored using an infrared eye tracker (Iscan
Fig. 2. The target detection task in MEG Experiment 1. One block began withan attention-directing cue (left arrow, right arrow, or diamond indicating theneutral condition) at the fixation, followed by ten task stimuli (upright orinverted T at the right or left upper field). The subjects pressed a button asquickly as possible to the upright T presented at the attended hemifield (bothhemifields in the neural conditions). All visual patterns were depicted by theRDB method in Fig. 1.
Attentional modulation in the temporal domain 3165
ª The Authors (2007). Journal Compilation ª Federation of European Neuroscience Societies and Blackwell Publishing LtdEuropean Journal of Neuroscience, 25, 3163–3172
Pupil ⁄ Corneal Reflection Tracking System, Cambridge, MA), whichensured no systematic eye movements affecting the MEG data in bothexperiments. The MEG signals were recorded with 0.1–200 Hzbandpass filters and digitized at 600 Hz.In Experiment 1, we focused on the VEFs to the inverted T letter
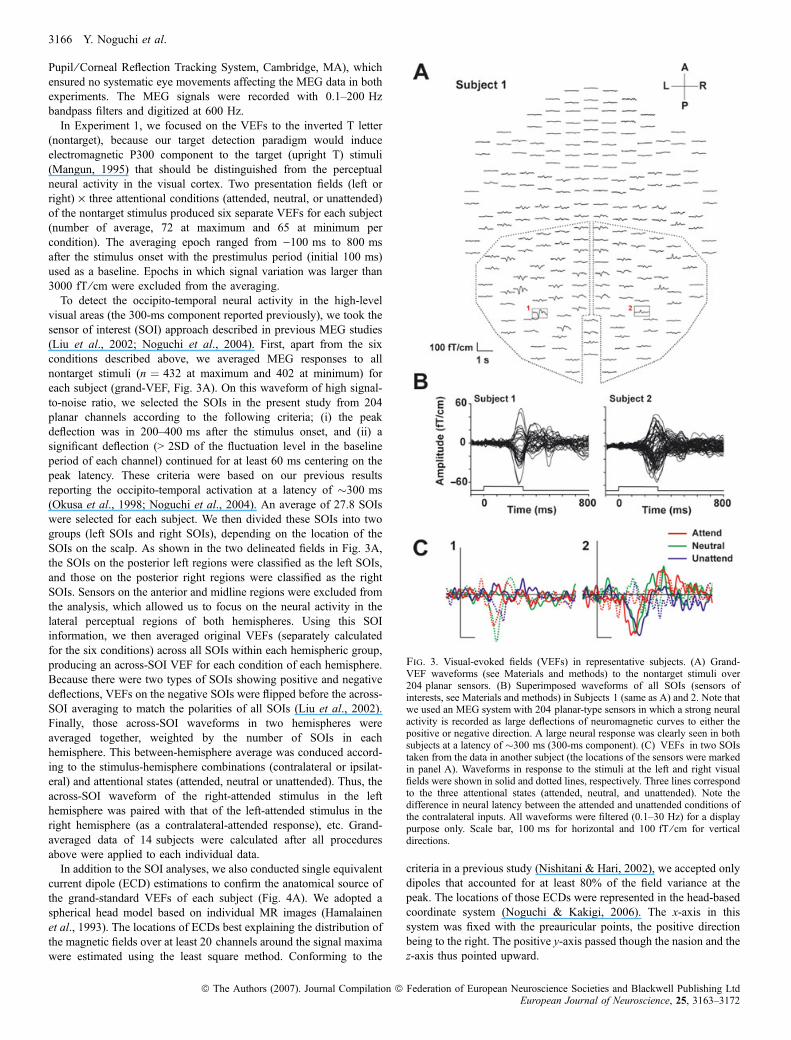
(nontarget), because our target detection paradigm would induceelectromagnetic P300 component to the target (upright T) stimuli(Mangun, 1995) that should be distinguished from the perceptualneural activity in the visual cortex. Two presentation fields (left orright) · three attentional conditions (attended, neutral, or unattended)of the nontarget stimulus produced six separate VEFs for each subject(number of average, 72 at maximum and 65 at minimum percondition). The averaging epoch ranged from )100 ms to 800 msafter the stimulus onset with the prestimulus period (initial 100 ms)used as a baseline. Epochs in which signal variation was larger than3000 fT ⁄ cm were excluded from the averaging.To detect the occipito-temporal neural activity in the high-level
visual areas (the 300-ms component reported previously), we took thesensor of interest (SOI) approach described in previous MEG studies(Liu et al., 2002; Noguchi et al., 2004). First, apart from the sixconditions described above, we averaged MEG responses to allnontarget stimuli (n ¼ 432 at maximum and 402 at minimum) foreach subject (grand-VEF, Fig. 3A). On this waveform of high signal-to-noise ratio, we selected the SOIs in the present study from 204planar channels according to the following criteria; (i) the peakdeflection was in 200–400 ms after the stimulus onset, and (ii) asignificant deflection (> 2SD of the fluctuation level in the baselineperiod of each channel) continued for at least 60 ms centering on thepeak latency. These criteria were based on our previous resultsreporting the occipito-temporal activation at a latency of �300 ms(Okusa et al., 1998; Noguchi et al., 2004). An average of 27.8 SOIswere selected for each subject. We then divided these SOIs into twogroups (left SOIs and right SOIs), depending on the location of theSOIs on the scalp. As shown in the two delineated fields in Fig. 3A,the SOIs on the posterior left regions were classified as the left SOIs,and those on the posterior right regions were classified as the rightSOIs. Sensors on the anterior and midline regions were excluded fromthe analysis, which allowed us to focus on the neural activity in thelateral perceptual regions of both hemispheres. Using this SOIinformation, we then averaged original VEFs (separately calculatedfor the six conditions) across all SOIs within each hemispheric group,producing an across-SOI VEF for each condition of each hemisphere.Because there were two types of SOIs showing positive and negativedeflections, VEFs on the negative SOIs were flipped before the across-SOI averaging to match the polarities of all SOIs (Liu et al., 2002).Finally, those across-SOI waveforms in two hemispheres wereaveraged together, weighted by the number of SOIs in eachhemisphere. This between-hemisphere average was conduced accord-ing to the stimulus-hemisphere combinations (contralateral or ipsilat-eral) and attentional states (attended, neutral or unattended). Thus, theacross-SOI waveform of the right-attended stimulus in the lefthemisphere was paired with that of the left-attended stimulus in theright hemisphere (as a contralateral-attended response), etc. Grand-averaged data of 14 subjects were calculated after all proceduresabove were applied to each individual data.In addition to the SOI analyses, we also conducted single equivalent
current dipole (ECD) estimations to confirm the anatomical source ofthe grand-standard VEFs of each subject (Fig. 4A). We adopted aspherical head model based on individual MR images (Hamalainenet al., 1993). The locations of ECDs best explaining the distribution ofthe magnetic fields over at least 20 channels around the signal maximawere estimated using the least square method. Conforming to the
criteria in a previous study (Nishitani & Hari, 2002), we accepted onlydipoles that accounted for at least 80% of the field variance at thepeak. The locations of those ECDs were represented in the head-basedcoordinate system (Noguchi & Kakigi, 2006). The x-axis in thissystem was fixed with the preauricular points, the positive directionbeing to the right. The positive y-axis passed though the nasion and thez-axis thus pointed upward.
Fig. 3. Visual-evoked fields (VEFs) in representative subjects. (A) Grand-VEF waveforms (see Materials and methods) to the nontarget stimuli over204 planar sensors. (B) Superimposed waveforms of all SOIs (sensors ofinterests, see Materials and methods) in Subjects 1 (same as A) and 2. Note thatwe used an MEG system with 204 planar-type sensors in which a strong neuralactivity is recorded as large deflections of neuromagnetic curves to either thepositive or negative direction. A large neural response was clearly seen in bothsubjects at a latency of �300 ms (300-ms component). (C) VEFs in two SOIstaken from the data in another subject (the locations of the sensors were markedin panel A). Waveforms in response to the stimuli at the left and right visualfields were shown in solid and dotted lines, respectively. Three lines correspondto the three attentional states (attended, neutral, and unattended). Note thedifference in neural latency between the attended and unattended conditions ofthe contralateral inputs. All waveforms were filtered (0.1–30 Hz) for a displaypurpose only. Scale bar, 100 ms for horizontal and 100 fT ⁄ cm for verticaldirections.
3166 Y. Noguchi et al.
ª The Authors (2007). Journal Compilation ª Federation of European Neuroscience Societies and Blackwell Publishing LtdEuropean Journal of Neuroscience, 25, 3163–3172
MEG Experiment 2
In Experiment 2, a representative task of spatial attention (Posneret al., 1980) was reproduced using the same stimulus set asExperiment 1. Each trial consisted of a pair of a cue and a taskstimulus (target). After the presentation of the cue (left or right arrow,300 ms) at the central field, unilateral task stimulus (upright orinverted T, 500 ms) appeared at the upper left or right visual field witha cue-target delay of 600–800 ms. A presentation rate of upright andinverted T was 1 : 1 in this experiment. In 75% of the trials, the taskstimulus occurred in the field indicated by the arrow cue (valid trials),while it was presented at the opposite field in the remaining 25%(invalid trials). The task was to report whether the T was upright orinverted by pressing one of two buttons (presentation ratio, upright : -inverted, 1 : 1). An important point of Experiment 2 was that thesubjects had to respond even when the task stimuli were presented atthe unattended field (invalid trials). By investigating the difference inreaction times (RTs) between the valid and invalid trials, we couldacquire a behavioural measure of the temporal facilitation by spatialattention. In one experiment, 432 and 144 task stimuli were given asthe valid and invalid targets, respectively.
Basic procedures for data analyses were identical to Experiment 1.The VEFs in response to the task stimuli (both upright and inverted T)were calculated (average epoch, )100 to 800 ms), using prestimulusperiod as a baseline. Two presentation fields of the target and twotypes of trials (valid and invalid) produced four VEFs; left-valid(number of averages, n ¼ 216), left-invalid (n ¼ 72), right-valid(n ¼ 216), and right-invalid (n ¼ 72). Numbers of presentationbetween the upright and inverted T were equated within eachcondition so that differences among four VEFs could not be attributedto those in visual features of the stimuli. To evaluate the neural activityin the higher visual regions, the across-SOI waveforms were alsocalculated, using the grand-VEF (n ¼ 576) and the same criteria asExperiment 1. The VEFs in the four conditions were initially averagedacross SOIs within each hemisphere, and then collapsed acrosshemispheres taking the numbers of SOIs into account.A main purpose of Experiment 2 was to compare the magnitudes of
attentional modulation in behavioural and MEG measures. To this end,we calculated an index of attentional modulation (IAM) using the datain the valid and invalid conditions of each subject.
IAM ¼ ðinvalid � validÞ=ðinvalid + validÞ
These IAMs were obtained for each of three measures (MEGamplitude, latency, and behavioural RT), and their relationships wereinvestigated by correlation analyses.
Results
fMRI experiment
As shown in Fig. 1B, the LD stimuli induced significant activities inbroad regions of the lower visual cortex such as Brodmann area (BA)17 or 18. As expected, those activities were substantially attenuated inRDB condition, although a small portion of V1 area was found to besignificantly activated. On the other hand, activation patterns in thehigher visual areas (e.g. fusiform gyrus, FG) were almost identicalbetween the two conditions (Fig. 1B, right). Percentages of BOLDsignal changes in the lower and higher visual regions are shown inFig. 1C. In the BA 17 ⁄ 18, neural activity in the RDB condition wasgreatly attenuated and became approximately 40% of the LDcondition (mean ± SE across the subjects, LD, 1.53 ± 0.19%, RDB,0.64 ± 0.21%, t ¼ 3.76, P ¼ 0.0037). In contrast, activities in the FGwere relatively preserved and there were no significant difference ofthe BOLD signal changes between the LD and RDB in bothhemispheres (t ¼ 0.95, P ¼ 0.37 for left hemisphere and t ¼ 0.62,P ¼ 0.55 for right hemisphere), showing the cue-invariant activationpattern. These results were consistent with previous studies (Saryet al., 1993; Mysore et al., 2006) and provide the evidence that ourRDB method can attenuate the activation in the lower visual areaswhile retaining the activity in the higher visual regions.
Behavioural experiment
In the detection task, all subjects showed 100% accuracy in both theLD and RDB conditions. Accuracies of the discrimination tasks(mean ± SE across the subjects) were 98 ± 0.7% for the LD and96 ± 1.0% for the RDB, and there was no significant differencebetween the two conditions (t ¼ 1.80, P ¼ 0.11). On the other hand,the RT data were highly differentiated among the four conditions(Fig. 1D). Means ± SEs across the nine subjects were 258 ± 9(detection, LD), 410 ± 17 (detection, RDB), 480 ± 11 (discrimination,LD), and 621 ± 8 ms (discrimination, RDB). These results indicate
Fig. 4. Anatomical source locations of the 300-ms neuromagnetic response.(A) The equivalent current dipole (ECD) locations estimated at the peak of the300-ms component in the grand-VEF. The mean coordinates across the subjectswere plotted on the MR image of a representative subject. (B) The distributionof 389 SOIs (190 latitudinal and 199 longitudinal) across the 14 subjects inExperiment 1. The number of SOIs in each measurement position was summedacross all subjects and colour-coded on a contour map depicted over thetopographical layout of 102 sensor positions. Because two types of planarsensors (one for latitudinal and another for longitudinal) were not discrimin-ated, the maximum SOI number in each position was 28 (two sensors perposition · 14 subjects). (C) Same as B, but a distribution of SOIs inExperiment 2 was shown. Note that all figures show a concentration of the300-ms component around the occipito-temporal regions of both hemispheres.
Attentional modulation in the temporal domain 3167
ª The Authors (2007). Journal Compilation ª Federation of European Neuroscience Societies and Blackwell Publishing LtdEuropean Journal of Neuroscience, 25, 3163–3172
that the time required for the detection of the RDB stimuli was longerthan that of the LD stimuli by approximately 140–150 ms.
MEG Experiment 1 (sustained attention)
Detection rates and RTs of the target (mean ± SE across the subjects)were 92.7 ± 1.9% and 625 ± 21 ms when it was presented at theattended field, and 91.7 ± 1.7% and 621 ± 22 ms when presented atthe neutral field (data of one subjects could not be recorded due to atechnical reason). No significant differences were observed betweenthe attended and neutral targets (detection rate, t ¼ 0.53, P ¼ 0.61;RT, t ¼ 0.47, P ¼ 0.64).Figure 3A shows the grand-VEF (mean VEF across the six
conditions) for one subject over the 204 MEG sensors. Clear MEGresponses were observed mainly in sensors on the lateral sides of bothhemispheres. Deflections of the MEG signals around the occipital polewere relatively small, indicating that neural activities in the earlyvisual areas were successfully inhibited by the RDB stimulus.Figure 3B shows the superimposed waveform of all SOIs in twosubjects. Consistent with our previous study (Okusa et al., 1998), alarge neuromagnetic component was observed at a latency of�300 ms (note that, in the planar-type MEG sensors we used, astrong neural activity is represented as large deflections of neuromag-netic curves to either the positive or negative direction). Presentedin Fig. 3C are the waveforms of two sensors taken from the data inanother subject (their locations were encompassed in Fig. 3A), one inthe left and another in the right hemispheres. All six conditions wereexhibited and waveforms in response to the task stimulus at the leftand right visual fields are shown in the solid and dotted lines,respectively. In addition to the laterality (a greater activity in thecontralateral than ipsilateral conditions) of the data, a clear attentionalmodulation of neural latency was observed in those sensors. Theattended stimulus elicited a neuromagentic response with the fastestpeak latency, followed by the neural and then the unattendedconditions.The results of dipole analyses indicated that all ECDs (equivalent
current dipoles) calculated on the grand-VEFs were estimated in thevicinity of the occipito-temporal cortex around the fusiform gyrus,which also confirmed our previous results (Okusa et al., 1998). InFig. 4A, a mean dipole location of each hemisphere across subjectswas shown on the MR image of a representative subject. According toour head-based coordinate system (Noguchi & Kakigi, 2006), themean coordinates (x, y, z) were ()38, )24, 51) for left and (41, )26,51) for right hemispheres. No significant difference of the ECDlocations was observed between the two hemispheres (x, t ¼ 0.71,P ¼ 0.50; y, t ¼ 0.10, P ¼ 0.92; z, t ¼ 0.01, P ¼ 0.99). When theselocations were transformed into the Montreal Neurological Institute(MNI) coordinates, neuromagnetic sources were ()41, )58, )4) in theleft and (42, )62, )2) in the right hemispheres, both of whichcorresponded to the BA 37. These results on the VEF sources wereconsistent with another topographic map plotting a distribution of389 SOIs of all 14 subjects (Fig. 4B). This map shows how manytimes the sensor (either latitudinal or longitudinal) in a certain positionwas selected as SOI across all subjects. We found that the SOIs wereconcentrated over occipital-temporal regions of both hemispheres anddistributed equally to the left and right hemispheres (193 in the leftand 196 in the right).Fig. 5 shows the across-SOI VEFs (absolute-mean waveforms
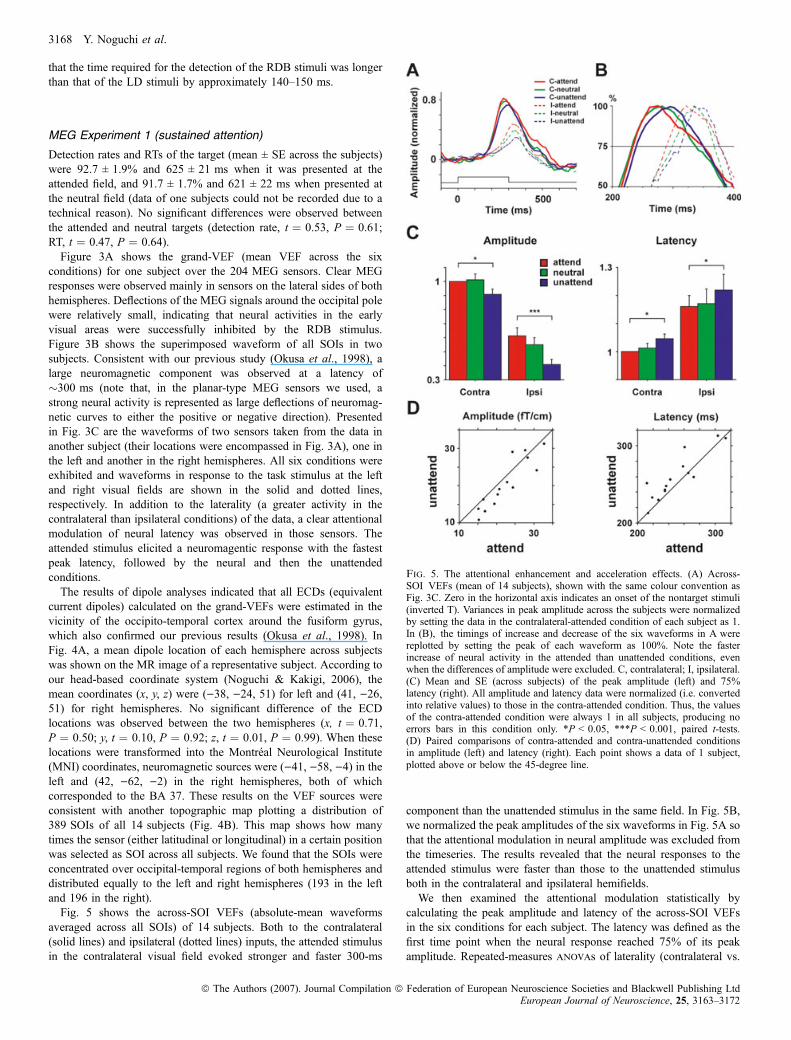
averaged across all SOIs) of 14 subjects. Both to the contralateral(solid lines) and ipsilateral (dotted lines) inputs, the attended stimulusin the contralateral visual field evoked stronger and faster 300-ms
component than the unattended stimulus in the same field. In Fig. 5B,we normalized the peak amplitudes of the six waveforms in Fig. 5A sothat the attentional modulation in neural amplitude was excluded fromthe timeseries. The results revealed that the neural responses to theattended stimulus were faster than those to the unattended stimulusboth in the contralateral and ipsilateral hemifields.We then examined the attentional modulation statistically by
calculating the peak amplitude and latency of the across-SOI VEFsin the six conditions for each subject. The latency was defined as thefirst time point when the neural response reached 75% of its peakamplitude. Repeated-measures anovas of laterality (contralateral vs.
Fig. 5. The attentional enhancement and acceleration effects. (A) Across-SOI VEFs (mean of 14 subjects), shown with the same colour convention asFig. 3C. Zero in the horizontal axis indicates an onset of the nontarget stimuli(inverted T). Variances in peak amplitude across the subjects were normalizedby setting the data in the contralateral-attended condition of each subject as 1.In (B), the timings of increase and decrease of the six waveforms in A werereplotted by setting the peak of each waveform as 100%. Note the fasterincrease of neural activity in the attended than unattended conditions, evenwhen the differences of amplitude were excluded. C, contralateral; I, ipsilateral.(C) Mean and SE (across subjects) of the peak amplitude (left) and 75%latency (right). All amplitude and latency data were normalized (i.e. convertedinto relative values) to those in the contra-attended condition. Thus, the valuesof the contra-attended condition were always 1 in all subjects, producing noerrors bars in this condition only. *P < 0.05, ***P < 0.001, paired t-tests.(D) Paired comparisons of contra-attended and contra-unattended conditionsin amplitude (left) and latency (right). Each point shows a data of 1 subject,plotted above or below the 45-degree line.
3168 Y. Noguchi et al.
ª The Authors (2007). Journal Compilation ª Federation of European Neuroscience Societies and Blackwell Publishing LtdEuropean Journal of Neuroscience, 25, 3163–3172
ipsilateral) · attentional states (attended vs. unattended) with theGreenhouse-Geisser correction indicated greater amplitude(F ¼ 27.1, P < 0.001) in the attended compared to unattendedconditions (Fig. 5C, left), which was consistent with the manyprevious studies reporting an attentional enhancement. Moreover, ourdata showed that the neural latency to the attended stimuli wassignificantly shorter than the unattended (F ¼ 11.2, P ¼ 0.002),demonstrating a temporal effect of attention in the higher visualcortex (Fig. 5C, right). The results were not changed when the peak(not 75%) latency were compared between the attended andunattended conditions (F ¼ 17.4, P < 0.001). Figure 5D shows apaired comparison of the contralateral-attended and contralateral-unattended conditions in 14 subjects. In peak amplitude, 12 of the 14subjects showed higher values in the attended condition and locatedbelow the 45-degree line (left, panel), whereas most data wereconcentrated on the upper field (unattended > attended) in neurallatency (right panel).
MEG Experiment 2 (trial-by-trial attention-cueing task)
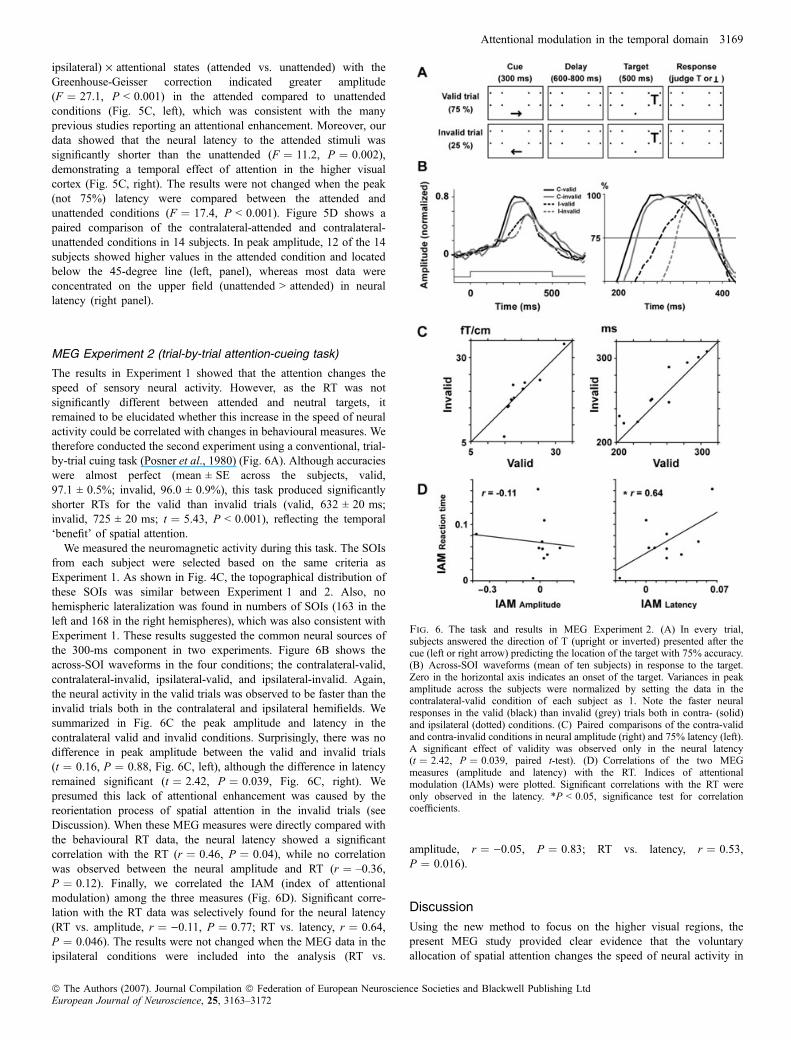
The results in Experiment 1 showed that the attention changes thespeed of sensory neural activity. However, as the RT was notsignificantly different between attended and neutral targets, itremained to be elucidated whether this increase in the speed of neuralactivity could be correlated with changes in behavioural measures. Wetherefore conducted the second experiment using a conventional, trial-by-trial cuing task (Posner et al., 1980) (Fig. 6A). Although accuracieswere almost perfect (mean ± SE across the subjects, valid,97.1 ± 0.5%; invalid, 96.0 ± 0.9%), this task produced significantlyshorter RTs for the valid than invalid trials (valid, 632 ± 20 ms;invalid, 725 ± 20 ms; t ¼ 5.43, P < 0.001), reflecting the temporal‘benefit’ of spatial attention.
We measured the neuromagnetic activity during this task. The SOIsfrom each subject were selected based on the same criteria asExperiment 1. As shown in Fig. 4C, the topographical distribution ofthese SOIs was similar between Experiment 1 and 2. Also, nohemispheric lateralization was found in numbers of SOIs (163 in theleft and 168 in the right hemispheres), which was also consistent withExperiment 1. These results suggested the common neural sources ofthe 300-ms component in two experiments. Figure 6B shows theacross-SOI waveforms in the four conditions; the contralateral-valid,contralateral-invalid, ipsilateral-valid, and ipsilateral-invalid. Again,the neural activity in the valid trials was observed to be faster than theinvalid trials both in the contralateral and ipsilateral hemifields. Wesummarized in Fig. 6C the peak amplitude and latency in thecontralateral valid and invalid conditions. Surprisingly, there was nodifference in peak amplitude between the valid and invalid trials(t ¼ 0.16, P ¼ 0.88, Fig. 6C, left), although the difference in latencyremained significant (t ¼ 2.42, P ¼ 0.039, Fig. 6C, right). Wepresumed this lack of attentional enhancement was caused by thereorientation process of spatial attention in the invalid trials (seeDiscussion). When these MEG measures were directly compared withthe behavioural RT data, the neural latency showed a significantcorrelation with the RT (r ¼ 0.46, P ¼ 0.04), while no correlationwas observed between the neural amplitude and RT (r ¼ –0.36,P ¼ 0.12). Finally, we correlated the IAM (index of attentionalmodulation) among the three measures (Fig. 6D). Significant corre-lation with the RT data was selectively found for the neural latency(RT vs. amplitude, r ¼ )0.11, P ¼ 0.77; RT vs. latency, r ¼ 0.64,P ¼ 0.046). The results were not changed when the MEG data in theipsilateral conditions were included into the analysis (RT vs.
amplitude, r ¼ )0.05, P ¼ 0.83; RT vs. latency, r ¼ 0.53,P ¼ 0.016).
Discussion
Using the new method to focus on the higher visual regions, thepresent MEG study provided clear evidence that the voluntaryallocation of spatial attention changes the speed of neural activity in
Fig. 6. The task and results in MEG Experiment 2. (A) In every trial,subjects answered the direction of T (upright or inverted) presented after thecue (left or right arrow) predicting the location of the target with 75% accuracy.(B) Across-SOI waveforms (mean of ten subjects) in response to the target.Zero in the horizontal axis indicates an onset of the target. Variances in peakamplitude across the subjects were normalized by setting the data in thecontralateral-valid condition of each subject as 1. Note the faster neuralresponses in the valid (black) than invalid (grey) trials both in contra- (solid)and ipsilateral (dotted) conditions. (C) Paired comparisons of the contra-validand contra-invalid conditions in neural amplitude (right) and 75% latency (left).A significant effect of validity was observed only in the neural latency(t ¼ 2.42, P ¼ 0.039, paired t-test). (D) Correlations of the two MEGmeasures (amplitude and latency) with the RT. Indices of attentionalmodulation (IAMs) were plotted. Significant correlations with the RT wereonly observed in the latency. *P < 0.05, significance test for correlationcoefficients.
Attentional modulation in the temporal domain 3169
ª The Authors (2007). Journal Compilation ª Federation of European Neuroscience Societies and Blackwell Publishing LtdEuropean Journal of Neuroscience, 25, 3163–3172
the higher visual regions (MEG Experiment 1). Moreover, thecomparison between the MEG and behavioural measures inthe trial-by-trial cuing task (MEG Experiment 2) indicated that theattentional decrease of the RT in previous psychological studies wasclosely related to the change in the latency of visual neural activity.
Attentional acceleration and the gain control theory
The present findings are important in providing a neurological basisfor the attention-induced behavioural facilitation, one of the oldestfindings in psychology (Titchener, 1908). So far, the lack in temporalmodulation of sensory neural activities (despite the clear evidence ofbehavioural facilitation) has been explained by assuming a gaincontrol mechanism in the brain (Hawkins et al., 1990; Hillyard et al.,1998; Luck et al., 2000; McDonald et al., 2005). In this hypothesis,attention-induced enhancements of neural activity reflect a stimulusprocessing with high signal-to-noise ratio in the visual cortex. Thisprovides the improved sensory information for the subsequent (e.g.judgement) stages in the brain, enabling accurate and rapid beha-vioural responses to the attended stimulus. Our results in Experi-ment 2 are not directly consistent with this view because we observeda close relationship between the shortening in the RT and the change inthe latency (not amplitude) of neural activity. However, one shouldnote that our magnitude of latency change was smaller (10–20 ms)compared to the behavioural facilitation (80–90 ms). One possibilityexplaining this difference is that the magnitude of behaviouralfacilitation was determined by the neural activity in limited populationof the visual cortex where the latency change was most prominent.While the magnitude of latency change was nearly 100 ms in someMEG channels (Fig. 3C), we averaged the data in many MEG sensorsover broad regions in the visual area (Fig. 4). This macro-levelapproach might cause an underestimation of latency change in ourdata, resulting in the difference between the behavioural and neuralmeasures (although we could observe significant correlations betweenthem in Fig. 6). Another possibility is that a portion of behaviouralfacilitation (RT reduction) was produced in nonsensory (e.g. judge-ment or motor) stages in the brain that was not reflected in the VEFwaveforms recorded in the present study.
A lack of latency changes in previous EEG ⁄ MEG studieson voluntary attention
Although a number of studies using EEG ⁄ MEG have investigated theneural timeseries to the attended and unattended stimulus, most ofthem could not find a reliable change in neural latency induced byattention (Hillyard & Anllo-Vento, 1998; Noesselt et al., 2002; DiRusso et al., 2003; McDonald et al., 2005). We presume this is mainlydue to the insufficient spatial resolution of the previous EEG ⁄ MEGtechniques. As the magnitude of attentional modulation is smaller inthe early than late visual areas (Cook & Maunsell, 2002; Saenz et al.,2002), the confounding of early visual signals into MEG data wouldobscure the small latency change (10–20 ms in the present study)occurring in the higher visual areas. Most of the previous studiesreported an attentional modulation of amplitudes in P1 (80–130 ms) orN1 (140–200 ms) components, but the signal sources of thoseresponses were very controversial (Di Russo et al., 2005). Manystudies have found a close relationship between the P1 responses andV1 activity (Slotnick et al., 1999; Bonmassar et al., 2001), althoughothers found a maximal P1 waveforms over the lateral occipito-temporal sites (Mangun, 1995; Noesselt et al., 2002). Furthermore,recent studies reported that the V1 area showed a delayed activation at
a partially overlapping latency with the N1 component (140–250 ms),by receiving feedback signals from the higher visual cortex (Noesseltet al., 2002; Halgren et al., 2003). These results indicate a mixture ofneuronal signals from the lower and higher visual areas in previousstudies on voluntary attention. Our RDB method provided animproved approach to this problem by minimizing a contributionfrom the lower regions.
Relationships of the 300-ms waveform with P300 or N2pccomponent
One characteristic of our RDB method is a slow latency of the firstVEF component (250–300 ms). This may raise a possibility that thepresent 300-ms component did not reflect a sensory-evoked neuralactivity but was related to later EEG ⁄ MEG components such as P300or N2pc (Woodman & Luck, 1999; Hopf et al., 2006). However,several aspects of our data do not support this view. In the first MEGexperiment, all VEFs were recorded on the frequently presented (80%)nontarget stimulus (inverted T). The clear 300-ms component wasnevertheless observed in both the attended and unattended conditions,indicating that our 300-ms waveform was different from the previousP300 component that is selectively observed for an infrequent target(oddball) stimulus. Additionally, the data in the behavioural experi-ment showed that a time required for the detection of the RDB stimuliwas longer than that of the LD stimuli by approximately 140–150 ms(Fig. 1D). This difference in the detection times suggests that theneural processing of the RDB stimuli was delayed compared to the LDstimuli by at least 100 ms in the brain. Thus, the present 300-mscomponent would correspond to the sensory-evoked neural activity of100–200 ms in previous studies using the standard luminance-definedstimuli (Heinze et al., 1994), rather than the N2pc component evident250–300 ms after the stimulus onset (Hopf et al., 2006). Alternatively,one possible reason for the long latency of our component was that thepresent 300-ms waveform reflected neural activities in a differentprocessing stage from that in previous studies. One characteristic ofour RDB stimuli is that full object identification is required to selectthe target, indicating a strong involvement of the higher-order visualregions. On the other hand, simple features judgement (in the lowervisual areas) would be sufficient to judge the orientation of the targetsdefined by luminance contrast. The attentional modulation reported inthe current study thus might be qualitatively distinct from that in theprevious studies employing the luminance-defined stimuli.
Reorientation of spatial attention in the trial-by-trial cuing task
While we could find a significant attentional modulation in neurallatency both in MEG Experiment 1 and 2, the modulation in neuralamplitude was not significant in Experiment 2, which was somewhatinconsistent with several fMRI studies (Thiel et al., 2004; Indovina& Macaluso, 2006). We presume this was related to the difference inthe task design between Experiment 1 and 2 and the limited spatialresolution of MEG compared to fMRI. In the trial-by-trial cuing taskin Experiment 2, the subjects had to answer the direction of T(upright or inverted) even in the invalid trials (although they ignoredall stimuli at the unattended hemifield in Experiment 1). Accordingto previous studies, this design would activate a reorientationnetwork of spatial attention in the brain during the invalid trials(Corbetta et al., 2000; Giessing et al., 2004; Thiel et al., 2004),typically producing the strong activation in the parietal areas (e.g.right temporal-parietal junction, R. TPJ) and middle frontal gyrus.A previous fMRI study further reported an enhancement of
3170 Y. Noguchi et al.
ª The Authors (2007). Journal Compilation ª Federation of European Neuroscience Societies and Blackwell Publishing LtdEuropean Journal of Neuroscience, 25, 3163–3172
functional connectivity during the invalid trials between the TPJ andventral occipital cortex corresponding to the unexpected (unattended)hemifield (Indovina & Macaluso, 2004). Altogether these studiessuggest that, in the invalid trials of Experiment 2, the reorientationmechanisms of the brain induced some additional activation in thehigher visual regions contralateral to the invalid target. Indeed, thenumber of SOIs in our Experiment 2 (33.1 per subject) was slightlylarger than that in Experiment 1 (27.8 per subject), suggesting thatbroader regions in the visual cortex were activated in Experiment 2.Although a fine spatial resolution of fMRI enabled the previousstudies to focus on smaller regions where the attentional enhance-ment (a greater activity in the valid than invalid trials) was retained,the limited spatial resolution of MEG and our macro-level approach(grand-averaging across all SOIs) might make it difficult todistinguish these subregions, which allowed the confounding ofthose additional activities and produced the lack in attentionalenhancement consequently.
Acknowledgements
We thank Dr T. Okusa for development of the computer software to presentvisual stimuli, and Mr O. Nagata and Mr Y. Takeshima for their technicalsupport. This work was supported by grants from the Japan Society for thePromotion of Science for Young Scientists to Y.N.
Abbreviations
BA, Brodmann area; ECD, equivalent current dipole; EEG, electroencepha-lography; EPI, echo-planar imaging; FG, fusiform gyrus; fMRI, functionalmagnetic resonance imaging; LD, luminance-defined; MEG, magnetoenceph-alography; RDB, random-dot blinking; RT, reaction time; SOI, sensor ofinterest; VEF, visual-evoked field.
References
Bonmassar, G., Schwartz, D.P., Liu, A.K., Kwong, K.K., Dale, A.M. &Belliveau, J.W. (2001) Spatiotemporal brain imaging of visual-evokedactivity using interleaved EEG and fMRI recordings. Neuroimage, 13,1035–1043.
Carrasco, M. & McElree, B. (2001) Covert attention accelerates the rate ofvisual information processing. Proc. Natl Acad. Sci. USA, 98, 5363–5367.
Chaudhuri, A. & Albright, T.D. (1997) Neuronal responses to edges definedby luminance vs. temporal texture in macaque area V1. Vis. Neurosci., 14,949–962.
Cook, E.P. & Maunsell, J.H. (2002) Attentional modulation of behavioralperformance and neuronal responses in middle temporal and ventralintraparietal areas of macaque monkey. J. Neurosci., 22, 1994–2004.
Corbetta, M., Kincade, J.M., Ollinger, J.M., McAvoy, M.P. & Shulman, G.L.(2000) Voluntary orienting is dissociated from target detection in humanposterior parietal cortex. Nature Neurosci., 3, 292–297.
Desimone, R., Wessinger, M., Thomas, L. & Schneider, W. (1990) Attentionalcontrol of visual perception: cortical and subcortical mechanisms. ColdSpring Harb. Symp. Quant. Biol., 55, 963–971.
Di Russo, F., Martinez, A. & Hillyard, S.A. (2003) Source analysis of event-related cortical activity during visuo-spatial attention. Cereb. Cortex, 13,486–499.
Di Russo, F., Pitzalis, S., Spitoni, G., Aprile, T., Patria, F., Spinelli, D. &Hillyard, S.A. (2005) Identification of the neural sources of the pattern-reversal VEP. Neuroimage, 24, 874–886.
Di Russo, F. & Spinelli, D. (2002) Effects of sustained, voluntary attention onamplitude and latency of steady-state visual evoked potential: a costs andbenefits analysis. Clin. Neurophysiol., 113, 1771–1777.
Friston, K.J., Holmes, A.P. & Worsley, K.J. (1999) How many subjectsconstitute a study? Neuroimage, 10, 1–5.
Giessing, C., Thiel, C.M., Stephan, K.E., Rosler, F. & Fink, G.R. (2004)Visuospatial attention: how to measure effects of infrequent, unattendedevents in a blocked stimulus design. Neuroimage, 23, 1370–1381.
Grill-Spector, K., Kushnir, T., Edelman, S., Itzchak, Y. & Malach, R. (1998)Cue-invariant activation in object-related areas of the human occipital lobe.Neuron, 21, 191–202.
Halgren, E., Mendola, J., Chong, C.D. & Dale, A.M. (2003) Cortical activationto illusory shapes as measured with magnetoencephalography. Neuroimage,18, 1001–1009.
Hamalainen, M., Hari, R., Ilmoniemi, R., Knuutila, J. & Lounasmaa, O.V.(1993) Magnetoencephalography-theory, instrumentation, and applicationsto noninvasive studies of the working human brain. Rev. Mod. Phys., 65,413–497.
Hawkins, H.L., Hillyard, S.A., Luck, S.J., Mouloua, M., Downing, C.J. &Woodward, D.P. (1990) Visual attention modulates signal detectability.J. Exp. Psychol. Hum. Percept. Perform., 16, 802–811.
Heinze, H.J., Mangun, G.R., Burchert, W., Hinrichs, H., Scholz, M., Munte,T.F., Gos, A., Scherg, M., Johannes, S. & Hundeshagen, H.& (1994)Combined spatial and temporal imaging of brain activity during visualselective attention in humans. Nature, 372, 543–546.
Hillyard, S.A. & Anllo-Vento, L. (1998) Event-related brain potentials inthe study of visual selective attention. Proc. Natl Acad. Sci. USA, 95,781–787.
Hillyard, S.A., Vogel, E.K. & Luck, S.J. (1998) Sensory gain control(amplification) as a mechanism of selective attention: electrophysiologicaland neuroimaging evidence. Philos. Trans. R. Soc. Lond. B Biol. Sci., 353,1257–1270.
Hopf, J.M., Luck, S.J., Boelmans, K., Schoenfeld, M.A., Boehler, C.N., Rieger,J. & Heinze, H.J. (2006) The neural site of attention matches the spatial scaleof perception. J. Neurosci., 26, 3532–3540.
Indovina, I. & Macaluso, E. (2004) Occipital–parietal interactions during shiftsof exogenous visuospatial attention: trial-dependent changes of effectiveconnectivity. Magn. Reson. Imaging, 22, 1477–1486.
Indovina, I. & Macaluso, E. (2006) Dissociation of stimulus relevance andsaliency factors during shifts of visuospatial attention. Cereb. Cortex, inpress.
Kourtzi, Z. & Kanwisher, N. (2001) Representation of perceived object shapeby the human lateral occipital complex. Science, 293, 1506–1509.
Liu, J., Harris, A. & Kanwisher, N. (2002) Stages of processing in faceperception: an MEG study. Nature Neurosci., 5, 910–916.
Luck, S.J., Woodman, G.F. & Vogel, E.K. (2000) Event-related potentialstudies of attention. Trends Cogn. Sci., 4, 432–440.
Mangun, G.R. (1995) Neural mechanisms of visual selective attention.Psychophysiology, 32, 4–18.
McDonald, J.J., Teder-Salejarvi, W.A., Di Russo, F. & Hillyard, S.A. (2005)Neural basis of auditory-induced shifts in visual time-order perception.Nature Neurosci., 8, 1197–1202.
Motter, B.C. (1993) Focal attention produces spatially selective processing invisual cortical areas V1, V2, and V4 in the presence of competing stimuli.J. Neurophysiol., 70, 909–919.
Mugler, J.P. III & Brookeman, J.R. (1990) Three-dimensional magnetization-prepared rapid gradient-echo imaging (3D MP RAGE). Magn. Reson. Med.,15, 152–157.
Mysore, S.G., Vogels, R., Raiguel, S.E. & Orban, G.A. (2006) Processing ofkinetic boundaries in macaque V4. J. Neurophysiol., 95, 1864–1880.
Nishitani, N. & Hari, R. (2002) Viewing lip forms: cortical dynamics. Neuron,36, 1211–1220.
Noesselt, T., Hillyard, S.A., Woldorff, M.G., Schoenfeld, A., Hagner, T.,Jancke, L., Tempelmann, C., Hinrichs, H. & Heinze, H.J. (2002)Delayed striate cortical activation during spatial attention. Neuron, 35,575–587.
Noguchi, Y., Inui, K. & Kakigi, R. (2004) Temporal dynamics of neuraladaptation effect in the human visual ventral stream. J. Neurosci., 24,6283–6290.
Noguchi, Y. & Kakigi, R. (2006) Time representations can be made fromnontemporal information in the brain: An MEG study. Cereb. Cortex, 16,1797–1808.
Okusa, T., Kaneoke, Y., Koyama, S. & Kakigi, R. (1998) Random dotsblinking: a new approach to elucidate the activities of the extrastriate cortexin humans. Neuroreport, 9, 3961–3965.
Posner, M.I., Snyder, C.R. & Davidson, B.J. (1980) Attention and the detectionof signals. J. Exp. Psychol., 109, 160–174.
Reynolds, J.H. & Chelazzi, L. (2004) Attentional modulation of visualprocessing. Annu. Rev. Neurosci., 27, 611–647.
Saenz, M., Buracas, G.T. & Boynton, G.M. (2002) Global effects offeature-based attention in human visual cortex. Nature Neurosci., 5,631–632.
Attentional modulation in the temporal domain 3171
ª The Authors (2007). Journal Compilation ª Federation of European Neuroscience Societies and Blackwell Publishing LtdEuropean Journal of Neuroscience, 25, 3163–3172
Sary, G., Vogels, R. & Orban, G.A. (1993) Cue-invariant shape selectivity ofmacaque inferior temporal neurons. Science, 260, 995–997.
Schuller, A.M. & Rossion, B. (2005) Spatial attention triggered by eyegaze enhances and speeds up visual processing in upper and lower visualfields beyond early striate visual processing. Clin. Neurophysiol., 116, 2565–2576.
Slotnick, S.D., Klein, S.A., Carney, T., Sutter, E. & Dastmalchi, S. (1999)Using multi-stimulus VEP source localization to obtain a retinotopic map ofblank;human primary visual cortex. Clin. Neurophysiol., 110, 1793–1800.
Thiel, C.M., Zilles, K. & Fink, G.R. (2004) Cerebral correlates of alerting,orienting and reorienting of visuospatial attention: an event-related fMRIstudy. Neuroimage, 21, 318–328.
Titchener, E.N. (1908) Lectures on the Elementary Psychology of Feeling andAttention. Macmillan, New York.
Woodman, G.F. & Luck, S.J. (1999) Electrophysiological measurement of rapidshifts of attention during visual search. Nature, 400, 867–869.
Zeki, S., Perry, R.J. & Bartels, A. (2003) The processing of kinetic contours inthe brain. Cereb. Cortex, 13, 189–202.
3172 Y. Noguchi et al.
ª The Authors (2007). Journal Compilation ª Federation of European Neuroscience Societies and Blackwell Publishing LtdEuropean Journal of Neuroscience, 25, 3163–3172
Related Documents