DETUROPE – THE CENTRAL EUROPEAN JOURNAL OF REGIONAL DEVELOPMENT AND TOURISM Vol. 9 Issue 3 2017 ISSN 1821-2506 0 Volume 9 Issue 3 2017 Czech Republic Hungary Serbia

Welcome message from author
This document is posted to help you gain knowledge. Please leave a comment to let me know what you think about it! Share it to your friends and learn new things together.
Transcript

DETUROPE – THE CENTRAL EUROPEAN JOURNAL OF REGIONAL DEVELOPMENT AND TOURISM Vol. 9 Issue 3 2017 ISSN 1821-2506
0
Volume 9 Issue 3 2017
Czech Republic Hungary Serbia

DETUROPE
THE CENTRAL EUROPEAN JOURNAL OF REGIONAL DEVELOPMENT AND TOURISM
Volume 9, Issue 3
2017

DETUROPE – the Central European Journal of Regional Development and Tourism is an international online open-access scientific journal publishing results of theoretical and applied research in the fields of regional and rural development and tourism. The articles published in this journal pass through a double-blinded peer reviewing process. Editorial board Editor in chief: Sándor Somogyi, professor, Regional Science Association of Subotica Members: Zsuzsanna Bacsi, associate professor, University of Pannonia Ernő Kovács, associate professor, University of Pannonia Zsuzsanna Lőke, assistant professor, University of Pannonia Josef Navrátil, associate professor, University of South Bohemia Imre Nagy, professor, University of Novi Sad; Kaposvar University Kamil Pícha, associate professor, University of South Bohemia András Ricz, dipl. ing. , Regional Science Association of Subotica Dagmar Škodová Parmová, associate professor, University of South Bohemia In memoriam: Vladimír Dvořák, assistant professor, University of South Bohemia – founding Editorial board member DETUROPE is covered by Web of Science Emerging Sources Citation Index and indexed in the Scopus, ERIH plus, DOAJ (Directory of Open Access Journals), MTMT (The Hungarian National Scientific Bibliography), and the KoBSON (Serbian Consortium for Coordinated Acquisition of Electronic Resources) databases.
Published by the Regional Science Association of Subotica, Serbia in co-operation with the University of South Bohemia, Faculty of Economics and University of Pannonia, Georgikon Faculty, Kesthely, Hungary. Address of the contact information: DETUROPE. Regionális Tudományi Társaság Szabadka/Društvo za Regionalne Nauke, Corvin Mátyás/Matije Korvina 9. 24000 Szabadka/Subotica, Serbia, [email protected] ISSN 1821-2506

3
TABLE OF CONTENTS EDITORIAL ............................................................................................................................ 5 THE ROLE OF SMALL AND MEDIUM SIZED CITIES IN REGIONAL DEVELOPMENT – REPORT ON THE 14TH ANNUAL MEETING OF THE HUNGARIAN REGIONAL SCIENCE ASSOCIATION Sándor Zsolt Kovács, Szilárd Rácz ............................................................................................ 8 Original scientific papers: INTEGRATED LAND-USE MODELS FOR SPATIAL PLANNING SUPPORT: COUNTRY-SPECIFIC SOLUTIONS Vilja Vaszócsik, Erzsébet Vajdovich–Visy.............................................................................. 12 COMPARATIVE RESEARCH OF THE RESULTS OF FUNCTIONAL REGIONALIZATION METHODS – BY THE NETWORK OF COMMUTING IN HUNGARY János Pénzes, Gábor Pálóczi .................................................................................................... 29 THE CONNECTION OF EU SUPPORTS AND THE TAXABLE INCOME PER CAPITA IN THE NORTHERN HUNGARIAN REGION, FOR THE 2007-2013 PERIOD Dóra Szendi .............................................................................................................................. 42 SPATIAL IMBALANCES IN THE UNITED KINGDOM AFTER THE MILLENNIUM: A FOCUS ON THE CITIES Zsuzsanna Zsibók ..................................................................................................................... 61 SERVICES OF ECONOMIC DEVELOPMENT ORGANISATIONS IN GYŐR Adrienn Reisinger, Petra Kecskés, Katalin Czakó ................................................................... 85 SERVING INNOVATION WELL? – MISMATCH BETWEEN THE SUPPLY AND DEMAND SIDE OF SERVICES BY INNOVATION INTERMEDIARY ORGANIZATIONS IN HUNGARY Éva Gajzágó ........................................................................................................................... 101 KISÚJSZÁLLÁS, ‘THE CULTURAL CAPITAL OF GREAT CUMANIA’ – SHRINKAGE, RESILIENCE AND CULTURE-BASED URBAN DEVELOPMENT IN EAST HUNGARY Tibor Kovács .......................................................................................................................... 122 Professional papers: CHANCES OF EFFECTIVE URBAN POLICY IN HUNGARY UNDER THE INFLUENCE OF THE EUROPEAN COHESION POLICY Edit Somlyódyné Pfeil ........................................................................................................... 141 CULTURAL AMBITIONS OF CITIES IN CENTRAL AND EASTERN EUROPE IN THE LIGHT OF TWO CITIES' - TALLIN AND MARIBOR - CASE STUDIES Szabolcs Morvay .................................................................................................................... 162

4
THE ROLE OF RURAL CITIES’ FESTIVALS IN THE DEVELOPMENT OF REGIONS Katalin Ásványi, Melinda Jászberényi ................................................................................... 177 THE POTENTIALS OF RURAL TOURISM IN DEVELOPING RURAL AREAS IN ALBANIA Henrietta Nagy, József Káposzta, Bledar Meta ...................................................................... 188 IMMIGRATION AND COMPETITIVENESS – SOME METHODOLOGICAL QUESTIONS Tünde Patay ............................................................................................................................ 207 Book review: BASICS OF ROMOLOGY Hajnalka Izsák, Ferenc, Szilágyi ............................................................................................ 221 CHALLENGES AND DEVELOPMENT PATHS OF CENTRAL AND EASTERN EUROPEAN LOCATIONS IN THE GLOBALISED WORLD – REPORT ON THE FIRST INTERNATIONAL SMART COMMUNITIES ACADEMY György Áldorfai, Viktória Józsa, József Káposzta, Henrietta Nagy, Adrienn Varga-Nagy .. 229

5
EDITORIAL
Dear Reader,
Welcome to the next issue of the international, peer-reviewed DETUROPE (Central European
Journal of Tourism and Regional Development) journal. This special edition includes selected
articles based on presentations at the 14th Annual Meeting of the Hungarian Regional Science
Association (HRSA) at Partium Christian University in Oradea, on 15-16 September 2016.
Global processes shaping our life raise several spatial questions, one of which is ‘The Role of
Small and Medium-Sized Cities in Regional Development’ that was the theme of the
international conference. The fact, that this timely and relevant topic has not received
sufficient research interest previously, was reflected in the high number of presentations at the
annual meeting, that was organised for the third time across the border. The plenary speakers
of the annual meeting were the following reputed scholars and practitioners:
- Manfred Kühn, Senior Researcher, Leibniz Institute for Research on Society and Space;
- Nataša Pichler-Milanović, Senior Researcher, University of Ljubljana; - Zoltán Pogátsa, Associate Professor, University of West Hungary; - Mihály Lados, Senior Research Fellow, HAS CERS Institute for Regional Studies; - János Rechnitzer, Professor, President of HRSA; - Áron Kincses, Deputy Head of Department, Hungarian Central Statistical Office; - Edit Somlyódyné Pfeil, Associate Professor, Széchenyi István University; - Ferenc Szilágyi, Associate Professor, Partium Christian University.
Following the plenary sessions, more than hundred presentations were delivered in twelwe
thematic sessions in the following themes:
- Theoretical and Methodological Questions of Urban Analysis; - Regional Innovation Systems; - Urban Development, Planning and Management, Public Services; - Urban Ecology, Climate Change, Smart and Sustainable Cities; - Regional processes in the Partium; - Urban–Rural Relations - Urban Sociology, Local Community, Territorial and Social Capital; - Small Cities and Declaration of New Towns; - Cities, Spatial Structures, Networks; - City Marketing, Culture, Tourism, Hungaricums; - Borders and Cities; - The Role of Small and Medium Sized Cities in Regional Development.
The first paper in the current issue is a thorough report on the outstanding scientific content
and presenters of the meeting, prepared by two dedicated colleagues, the main organisers of
the event, Sándor Zsolt Kovács and Szilárd Rácz.

6
The last paper in this special edition is also a report on another special occasion, the first
international Smart Communities Academy for scientists and practitioners, that was organised
in one of the most disadvantaged area in Hungary, in Legénd village, Nógrád county. The
expressive report was prepared by a special team of authors including a PhD student, an
adjunct, associate professors and a practitioner, that illustrates well one of the main objectives
of the event: to provide a platform for intersectoral communication. The authors are György
Áldorfai, Viktória Józsa, József Káposzta, Henrietta Nagy and Adrienn Varga-Nagy.
The two reports on these international events form a perfect frame for the 13 articles from 20
authors, and a very interesting book review on the Basics of Romology edited by Anna Orsós
that was prepared by Hajnalka Izsák and Ferenc Szilágyi. The reviewers welcome the much-
needed volume and highlight its importance in three fields, as widening the subject area;
teaching and research and development; and the provision of a complete picture of the history,
culture, habits, problems and successes of the Roma, especially those living in Hungary.
The order of the papers is based on their main focus, and based on that, three groups could be
formed. The first four papers examine recent challenges and tendencies of regional and local
level policies, their potential practical implications and impact assessment.
Edit Somlyódiné Pfeil examines the chances of effective urban policy in Hungary after 2010,
with special respect to the influence of the European Cohesion Policy, co-operations between
towns and their regions, and the reform of public administration on public policy processes.
As a practical counterpart of the same question, Vilja Vaszócsik and Erzsébet Vajdovich-Visy
presents a recent achievement in the field of integrated land-use models for spatial planning
support; the Hungary Spatial Decision Support model, that was developed to incorporate
scientific knowledge in the decision-making process. The same purpose is served, but through
another methodological approach by János Pénzes and Gábor Pálóczi, whose paper on
functional regionalisation - centres and hinterlands - demonstrates some of the possible
delimitation methodologies, and their comparison, based on commuting to work dataset from
the 2011 census in Hungary. Arriving to impact assessment, Dóra Szendi addresses in her
study territorial, social and economic inequalities and concludes the connection of EU
supports and the taxable income per capita in one Hungarian region for the 2007-2013 EU
programming period, with the aim to examine spatial patterns and identify regional hot spots.
The second group of papers examine the local level from different dimensions, as economic
development; research and development and innovation; culture; and tourism.
Zsuzsanna Zsibók presents a very good starting point with the examination of the long-
standing spatial imbalances in the United Kingdom with a strong geographic focus on the

7
cities, and a temporal focus on the post-millennium and the challenges posed by the Brexit
decision. Adrienn Reisinger, Petra Kecskés and Katalin Czakó narrows the scope to local
economic development services by a thorough examination of recently collected primary data
in Győr city (Hungary), with the aim to identify the services and the characteristics of
linkages and cooperation of the economic development organizations (EDOs) that could be
generalised in the future to other locations. Éva Gajzágó follows the same research avenue
with a strong focus on the possible measurement techniques, to answer the question if
innovation intermediary organisations are serving innovation well, or if there is a mismatch
between the supply and demand side of innovation. Culture is an important aspect of the
development and revitalisation of local society and economy, as it is well-illustrated in the
study of Szabolcs Morvay, focusing on the presentation of cultural ambitions in two Central
and Eastern European cities participating in the European Capital of Culture program. Katalin
Ásványi and Melinda Jászberényi go even beyond the term by examining different types of
the very popular festival tourism, that on one hand could make cities and regions incredibly
attractive for tourists, but on the other hand, could generate regional impacts also, attributing
to the development of a region. Tibor Kovács raises an interesting question in the same
research field; if new approaches to mobilize endogenous resources - for example culture-
based urban development - could reverse, prevent or slow down negative local processes, as
shrinkage and decreased resiliency. As an interesting and recent international benchmark case
study, Henrietta Nagy, József Káposzta and Bledar Meta not only present conventional
tourism in Albania, but focus on two specific case studies in rural tourism, as a new
component in the tourism portfolio of the country, and provide some possible solutions for
current challenges, as unemployment, low living standards and the consequent depopulation.
Two very timely and increasingly important topics stayed for the last, as climate change and
migration. Zoltán Agg summarises the main findings of a questionnaire-based survey in the
Balaton region from a practical perspective, and highlights issues as the change of value
systems, especially environmental values, the role of schooling, township and age in the
awareness and attitude towards climate change and environmental sensitivity. Tünde Patay is
one of the early birds in Hungary to examine the relationship of immigration and
competitiveness, more specifically the controversies of labour market and the inclusion of
immigrants, mainly from the methodological point of view. Thus, she draws attention to the
importance of data quality, processing and interpretation, together with the possible
‘stumbling stones’ in migration studies.
I wish you good reading, Dr. Viktória Józsa.

DETUROPE – THE CENTRAL EUROPEAN JOURNAL OF REGIONAL DEVELOPMENT AND TOURISM Vol. 9 Issue 3 2017 ISSN 1821-2506
8
The Role of Small and Medium Sized Cities in Regional Development – Report on the 14th Annual Meeting of the
Hungarian Regional Science Association
Sándor Zsolt KOVÁCSa, Szilárd RÁCZb
a Junior research fellow. Hungarian Academy of Sciences Centre for Economic and Regional Studies Institute for Regional Studies. [email protected] a Scientific secretary. Hungarian Academy of Sciences Centre for Economic and Regional Studies Institute for Regional Studies. [email protected]
The Annual Meeting of Hungarian Regional Science Association was organised for the third
time in 2016 across the border. The venue of the XIVth Annual Meeting taking place between
the 15th and 16th of September was the Partium Christian University of Oradea, the main
theme of the event was the role of small and medium sized cities in regional development.
More than a hundred presentations were given discussing various aspects and fields of urban
development. As usual, the General Meeting of HRSA was held during the first morning,
where the activities of the past year and the plans for 2017 of HRSA were presented to the
members, and the report of the Audit Committee mentioned as a permanent feature the
financial stability of the organisation. The co-organiser of the event was the Partium Institute
for Spatial Research (PTKI).
The opening lecture was given by Manfred Kühn, Senior Researcher of the Leibniz
Institute for Research on Society and Space titled „Small and Medium Sized Cities – Driving
Forces of Peripheralisation”. The focus of the lecture was on the changing distribution of
tasks among cities, the main beneficiaries were metropolican centers to the detriment of small
and medium sized cities. In the case of these former, three factors contributed to the
aggravation of peripheralisation: their dependence on metropolitan areas; a lack of access to
innovation, transportation and social infrastructure and networks; and the outward migration
of the young and skilled workforce. These processes may be reversed by the availability of
strong local governance and decision-making capacities, and the well-suited business policies
of local enterprises.
Natasa Pichler-Milanović, Senior Researcher of the University of Ljubljana presented a
lecture on the perspectives of Small and Medium Sized Towns in Central Europe. The results
of several large-scale research (ESPON, INTERREG, etc.) demonstrate a shifting focus on
cooperation, and more particularly, international cross-border cooperation encouraged by the
EU would be a possible development alternative for cities’ without central functions. This

Kovács, S. Z., Rácz, S.
9
alternative, however, would imply a simultaneous consideration of multi-level (EU, national
and local) approaches and regulations.
Zoltán Pogátsa, Associate Professor of the University of West Hungary began his
presentation by an evaluation of the Barca Report on the paradigm change and reform of the
European Union. His criticism was centered on the political anomalies and deficiences of
social cohesion, emphasising that the anomalies were to a large extent responsible for the
moderate convergence effect of funds. Despite all criticisms, the Barca Report played a non-
negligible role in the transformation of Cohesion and Structural Policies.
Mihály Lados, Senior Research Fellow of HAS CERS Institute for Regional Studies gave a
lecture on smart city models, their roots and modes of implementation, with a view on the
adaptive opportunities and practices of small and medium sized cities. The smart cities
concept aims to respond to global problems such as urban population growth and the
increasing carbon-dioxide emission it entails, climate change and migration waves.
The first presenter in the Hungarian language plenary session was János Rechnitzer,
Professor of Széchenyi István University, who began his lecture by reviewing the main phases
of urban research performed by the domestic research community focusing on the role of
small and medium sized cities in the transforming Hungarian urban network: research on
large cities, the analysis of the urban network and functions, the urban system, space and
society. The city as an object of scientific research is far from being exhausted, and the area to
be explored remains vast in the field of governing the city and the metropolitan area, smart
city concepts, city use, and further areas of research may extend to the role of human capital,
culture, higher education, factors of creativity, new economic stakeholders and spatial
linkages on urban development.
The presentation of Sándor Illés, President of Active Society Foundation and Áron
Kincses, Deputy Head of Department of Hungarian Central Statistical Office titled
„Migration, Settlement Networks in the Carpathian Basin” was based on 2001 and 2011
Population Census databases, whose results indicate that 1) The migration area of Hungary is
continuosly extending, with a maintained yet foreseeably declining predominance of the
neighbouring countries. 2) The data assembled between the two Population Censuses support
the thesis of the shifting role of Hungary from local to global migration. 3) The spatial
distribution of foreign citizens is different from that of the Hungarian population with national
scale effects significantly lagging behind the influence on their areas of preference (Central
Hungary, border districts and Balaton region).

Kovács, S. Z., Rácz, S.
10
Edit Somlyódyné Pfeil, Associate Professor of Széchenyi István University gave a
summary on the opportunities of efficient urban governance in light of EU requirements and
the new strategic directions of the amelioration of public administration. The effort to comply
with EU standards and achieving territorial cohesion might upgrade the role of small and
medium sized cities outside metropolitan areas, however, they are encouraged to cooperate in
order to create a polycentric structure based on reciprocity, or self-governing functional urban
areas in order to achieve economies of scale and thus emerge as possible competitors of
metropolises. This requires a reform of the current practice by implementing multi-level
governance, adopting the place-based approach and organising the efficient cooperation
between sectoral or territorial policies.
The closing speech during the plenary session was presented by Ferenc Szilágyi, Associate
Professor of Partium Christian University, Director of PTKI who discussed the urban
development of Partium and its cross-border urban connections. On the basis of the
investigation of the fields of force in the proximity of the border it can be stated that along the
major section of the common border (194 kms) the dominance of Romanian large cities
(Arad, Oradea, Satu Mare) can be observed in the area of cooperations, while on a 141 km
long section the predominance of Hungarian cities prevails (Békéscsaba, Debrecen, Szeged),
and on the remaining section of 88 kms, neither of the two groups exert a significant
influence.
The plenary session was followed by the ceremony of granting the awards founded by
HRSA. The Pro Regional Science Award was granted by the unanimous vote of the general
assembly of the Association to József Nemes Nagy, Professor of the Eötvös Loránd
University Faculty of Science, former Deputy President of the Hungarian Regional Science
Association in order acknowledge his outstanding research, educational and school founding
activities in the area of regional science. The Honorary Certificate was awarded for first time
to members who, following the Constitution of HRSA, by their outstanding scientific results,
exemplary professional and social activities were deemed eligible. The award was granted to
Béla Baranyi, Professor Emeritus of the University of Debrecen, Former Leader of the North
Great Plain Division of HRSA, and Attila Korompai, Retired Professor of the Corvinus
University of Budapest, former President of the Audit Committee of HRSA. The call for
proposals of the Excellent Young Regionalist Prize was announced for the eighth time, which
HRSA in collaboration with the Heads of the Division of HRSA granted to Balázs István
Tóth, Senior Lecturer of the Faculty of Economics of West Hungarian University in order to
recognize his valuable contributions to the advancement of regional science.

Kovács, S. Z., Rácz, S.
11
After the plenary presentation, the Annual Meeting continued in twelve thematic (one
English-language) sections. A total number of almost a hundred presentations were delivered
in the various sections:
Theoretical and Methodological Questions of Urban Analysis (Chair: Tamás Dusek
Professor, Széchenyi István University);
Regional Innovation Systems (Chair: Attila Varga Professor, University of Pécs);
Urban Development, Planning and Management, Public Services (Chair: László
Faragó Professor, Senior Research Fellow, HAS Institute for Regional Studies);
Urban Ecology, Climate Change, Smart and Sustainable Cities (Chairs: Imre Nagy
Professor, University of Novi Sad and Richárd Ongjerth Managing Director,
Hungarian Urban Knowledge Centre);
Regional processes in the Partium (Chair: Ferenc Szilágyi Associate Professor,
Partium Christian University);
Urban–Rural Relations (Chair: János Schwertner President, Academic Society for the
Development of the Micro-regions);
Urban Sociology, Local Community, Territorial and Social Capital (Chair: Zoltán
Csizmadia Associate Professor, Széchenyi István University);
Small Cities and Declaration of New Towns (Chair: András Trócsányi Associate
Professor, University of Pécs);
Cities, Spatial Structures, Networks (Chair: György Csomós Professor, University of
Debrecen);
City Marketing, Culture, Tourism, Hungaricums (Chair: Gábor Kozma Associate
Professor, University of Debrecen);
Borders and Cities (Chair: Tamás Fleischer Senior Research Fellow, HAS Institute of
World Economics);
The Role of Small and Medium Sized Cities in Regional Development (Chair: Attila
Korompai associate professor, Corvinus University of Budapest).
Presentations and photo albums are available on the website of the Hungarian Regional
Science Association: http://www.mrtt.hu/vandorgyules2016nagyvarad.html

DETUROPE – THE CENTRAL EUROPEAN JOURNAL OF REGIONAL DEVELOPMENT AND TOURISM Vol. 9 Issue 3 2017 ISSN 1821-2506
12
Original scientific paper
INTEGRATED LAND-USE MODELS FOR SPATIAL PLANNING
SUPPORT: COUNTRY-SPECIFIC SOLUTIONS
INTEGRÁLT TERVEZÉS-TÁMOGATÓ TERÜLET-FELHASZNÁLÁSI
MODELLEK: ORSZÁG-SPECIFIKUS MEGOLDÁSOK
Vilja VASZÓCSIKa, Erzsébet VAJDOVICH–VISYb
a Lechner Nonprofit Ltd., [email protected] b Budapesti Műszaki és Gazdaságtudományi Egyetem, [email protected]
Cite this article: Vaszóczik, V., Vajdovich-Visy, E. (2017). Integrated land-use models for spatial planning support: country-specific solutions. Deturope, 9(3): 12-28.
Abstract
A mai világban a tervezés szűkülő erőforrások közepette kénytelen működni és választ keresni a kor kihívásaira. A fejlett térségekben és különösen a nagyvárosok környékén intenzív a területért folyó verseny , mert a szuburbanizáció gyors ütemben alakítja át a település hálózatot és a terület felhasználást . A területi tervezés ilyenkor, a területi tervezésért folyó küzdelem során a mediátor hálátlan szerepét tölti be, irányítani próbálja a fejlesztés folyamatát és közben igyekszik védeni a szabad területeket az egészséges életfeltételek és a természeti értékek megóvása érdekében. A kétezres években az integrált döntéseket segítő rendszerek (DSS) egyre népszerűbbek lettek a területi tervezők és döntéshozók körében. Segítenek abban, hogy a döntési folyamatokban a tudományos ismeretek jobban érvényesüljenek. A legutóbbi években a Lechner Tudásközpont munkatársai a magyarországi feltételekhez adaptált döntés segítő módszert fejlesztettek ki, az u.n. Magyar Területi Döntés-segítő Modellt. A jelen tanulmány ezt a modellt mutatja be és azt, hogy a modell hogyan hasznosítható a területi tervezésben és a döntéshozásban. Kulcsszavak: területi tervezés, döntés-támogató rendszer, területfelhasználás modellezése, regionális tervezés, városi beépített területek terjeszkedése
Abstract
The key issue of contemporary planning is that it has to work within and respond to the scarcity of resources. The competition for land is particularly intense in growth areas, especially around cities, where suburbanisation is accelerating and causes fundamental change of the evolved settlement pattern and the structure of land use. Planning in this situation must perform the difficult role of mediator in the competition for land, guiding the growth process and at the same time saving and protecting the open spaces which are indispensable for healthy living and are significant natural heritage. The integrated decision support systems (DSS) are more and more popular among spatial planners and decision makers since 2000. These systems facilitate to incorporate scientific knowledge in the decision making process. During the last years in the unit for spatial planning of the Lechner Knowledge Centre we developed for a country specific spatial decision support, the Hungary Spatial Decision Support model. This study introduces this model and how it can assist territorial planning and decision making. Keywords: spatial planning, decision supporting system, land use modelling, regional planning, urban expansion

Vaszóczik, V., Vajdovich-Visy, E.
13
INTRODUCTION
The purpose of this paper is to present a model estimating the changing process of land use in
response to the change of other factors occurring in the city structure over time, and to
demonstrate its uses in spatial and city planning.
The key issue of contemporary planning is that it has to work within and respond to the
scarcity of resources. In this strained situation the special concern of spatial planners is the
limited availability of land, which is an object of competition of various development needs
and aspirations, while it is also natural resource to be protected. The competition for land is
particularly intense in growth areas, especially around cities, where suburbanisation is
accelerating and causes fundamental change of the evolved settlement pattern and the
structure of land use. Urban sprawl is a contemporary process, when urban growth goes
beyond the city boundaries without or with little or ineffective control.
Planning in this situation must perform the difficult role of mediator in the competition for
land, guiding the growth process and at the same time saving and protecting the open spaces
which are indispensable for healthy living and are significant natural heritage.
Urban sprawl is an increasing world-wide challenge, it can be well observed in Hungary
too. The process involves a variety of environmental and social problems; one of these is the
issue of the long term maintenance of resources. Urban sprawl is a threat for the condition of
the arable land, water resources, and special habitats and for the protection of floodplains. The
uncontrolled urban sprawl and the involved problems are especially serious in areas where the
regulatory power of spatial planning is inadequate. (Vajdovich-Visy 2006)
In Hungary spatial planning at regional and local levels take efforts to mitigate urban
sprawl. The plans, however, with all the concern to take an integrated approach and long-term
view, are often inefficient to respond to the on-going processes and maintain a long-term
perspective at the same time. Therefore the greatest challenge for the planners is to predict,
analyse, evaluate and demonstrate before the public and the decision makers the consequences
of the evolved trends and the various, inter-related impacts of the development plans and
planning regulations. An important aid in this effort is the application of spatial decision
support systems (DSS). The software that allows for the development of DSS is capable of the
complex management of the various inputs – data, development priorities and regulative
measures – and through a series of simulations assesses their social, economic and
environmental impacts and makes future visible on the map. Integrated approach from the
beginning of the planning process facilitates to develop alternative proposals and then to
Vaszóczik, V., Vajdovich-Visy, E.
14
identify a decision which is acceptable for the majority of the agents (Mrs. Jaschitz 2012).
The article will present the Hungarian Spatial Decision Support System developed in the
spatial planning unit of the Lechner Knowledge Centre and its potential application.
Planning system in Hungary
Planning has traditionally been a complex, inter-related exercise, an effort to facilitate the
delivery of some desirable – economically productive or visually magnificent – state or else
the improvement of the devolved physical and social conditions. By now, in a pluralistic and
complex society which is exposed to a multitude of external effects, planning has
tremendously grown in complexity while compelled to face and deal with many inter
connected and contradictory challenges. It is therefore necessary and advisable for planning to
seek the support of conventional as well as contemporary approaches and techniques
proposed for instance by information technology.
As a matter of fact, the use information technology is indispensable in this world the
immense data sets to be managed.
In Hungary there has been a rationally thought out, double faced spatial planning system
arranged in a hierarchical set adapted to the country’s administrative structure. The vertical
layers consist of the national level, the regional level (of the 19 counties and the capital city)
and the local level of the urban municipalities (cities and towns) and district level if the
municipality is subdivided into districts. At times the need emerges to prepare a spatial plan
for an area the borders of which cut across administrative boundaries, in such a case a so
called special plans are prepared. The approval of the plans corresponds to the administrative
level, that is, the national government or the national assembly, the county authority or the
county assembly and the local authority etc. are responsible for approval. The double face
follows from the fact that socio-economic and physical plans are distinguished. Both are
arranged in the same hierarchical system. This system is determined and enforced by law. The
lower level and more detailed plans must be in line with and specify the directions outlined in
the upper levels.
This clear cut, logical and rigid planning structure is suitable for centralized, monolithic
systems; though even in such cases unexpected changes, unforeseen trends may occur, which
undermine the smooth operation of the rational, top-down planning process.
At an early stage of the use of information technology the rational comprehensive
mathematical models, which this technology offered suited to the evolved hierarchical
planning system. The approach offered a logical and deliberative framework identifying and

Vaszóczik, V., Vajdovich-Visy, E.
15
quantifying problems, objectives, predicting and projecting outcomes, testing plans of action
and considering a range of alternatives and ensureding that the best plan of action is chosen.
In this way it helped the consolidation of authority and power. It placed power and trust in the
hands of the planner and decision maker who is seen as an expert bearing all the information
required to solve problems.
The use of rational comprehensive mathematical models was a contemporary,
sophisticated disguise of the fundamentally conservative planning system.
During the recent decades the complexities, uncertainties, the interplay of economic and
social processes have come more and more into the limelight of concerns. Furthermore, the
spatial processes underwent fundamental transformations in Hungary just as all over the
world. The linear trends gave way to multiple dependencies and interrelations. The transition
to market economy and political democracy were only the forerunners of change followed by
changing demographic trends, the globalisation of the economy, culture and mobility,
environmental threats and multiple dependencies on transnational influences and domestic
expectations.
Planning accustomed to setting magnificent long-term visions objectives and managing
growth and development while struggling with the scarcities of the present day, including the
scarcity of reliable data, is now made responsible for the failure of the forecasts and is
compelled to face unexpected challenges, manage uncertainties while maintaining a
cautiously positive if not optimistic attitude. Data and expert forecasts of all kinds are
available in abundance, but they are many times mutually contradicting and therefore very
difficult to find the right way and make the right assumptions. Without the expertise of
information technology it would be impossible to cope with the profusion of numbers, ratios,
and interdependencies.
Within the new context the overall, statutory framework of planning remained.
Nevertheless, there have been fundamental changes in attitudes, interrelations and approaches.
The rigidity of the hierarchical order gave gradually way to flexibility and interactions.
Plan making has traditionally been a multi-disciplinary and multi-actor procedure. In the
process of plan making several experts were involved, like architects, transport engineers,
cartographers, and later economists and environmental experts. The various disciplinary tasks
were distributed among the experts, each worked out the chapter on his/her theme like the
transport system, the parks and urban open spaces, housing, manufacturing etc. and usually
the architect planner was responsible to summarize and work out the land use plan as well as
the zoning plan and building regulations. The procedure was similar in the preparation of the

Vaszóczik, V., Vajdovich-Visy, E.
16
development plan; in this case either an architect planner or an economist was responsible for
the summary. The participants of the procedure were obliged to consider the work of their
colleagues, adhere to the decisions contained in the plans of the upper levels and take account
of the plans of the same level (for instance the plans of the neighbouring municipality) and the
lower levels. Responsible planner was the title of the head of the team in both cases. Finally,
the plans of both kinds were submitted to the commissioning (local, regional or national). The
procedure ended with a formal meeting. Active cooperation authority was not required,
though it took place on a voluntary basis due to the intellectual preferences of the participants.
The need for active cooperation of all actors emerged and increased when the actual role of
planning – instead of producing sets of official documents – was more and more recognized
as a tool of guiding development and change and as a response to known and newly arising
challenges. The planners wanted to discuss their concerns with the others, they were
interested to see how a problem or a potential appears from the point of view of another
discipline or at another spatial level. The number as well as the quality of formal informal
discussions has been growing, just as those of local, national and transnational conferences.
The professional associations like the Hungarian Society for Urban Planning played an
important part in this change of awareness. The cooperative approach is now a natural,
integral feature of planning in this country too.
Another process, which had fundamental impact on planning, began in the 1980’s already.
It was the beginning of the “city protection movement” concerned with the saving of the local
environmental assets. As a matter of fact, in Hungary this was the first voluntary, social
initiative. It was born in Budapest and rapidly extended to the other local communities, both
urban and rural. In this movement the citizens found the way to express their views,
preferences and concerns with the conditions of the place where they lived. The city
protection movements were the incubators of public participation. Gradually the movement as
well as the social climate thus created made it unavoidable to listen to the local public view on
the needed and planned changes in the local environments. Saving the local heritage as well
as the landscape assets and protesting against arbitrary decisions, preventing undesirable
changes are on the banners of this movement. Public consultation of plan proposals and the
need for listening to the people’s views were largely promoted by this movement.
The planners today are no longer critical bystanders viewing the sphere of reality from
their elevated professional position, but are part of the world full of contradictions and
concerns. They need the support of tools offered by information technology rather than
overall comprehensive models.

Vaszóczik, V., Vajdovich-Visy, E.
17
Spatial decision support systems
The integrated decision support systems (DSS) are more and more popular among spatial
planners and decision makers since 2000. These systems facilitate to incorporate scientific
knowledge in the decision making process (H. Van Delden 2011). For the decision support
system, to be capable of supporting the decision making process it is indispensable to adapt to
the available methods and procedures rather than displacing the current practice (McIntosh et
al 2007).
For supporting the spatial decision these integrated systems must be capable of modelling
the complex interactions between the social and environmental processes. During the last ten
years the focus has been on the complex linkage of models of different disciplines, and the
improvement of software capacities enabled to build decision support systems incorporating
integrated models (H. van Delden 2011).
The different spatial decision support systems or named as integrated modelling systems
for spatial planning support have a number of common characteristics (H. van Delden 2011).
The system is:
able to support policy relevant questions,
pays particular attention to long-term problems and strategic issues,
aims to explicitly facilitate group interaction and discussion,
applicable to complex and ill-structured decision domains, characterized through a
large number of actors, factors and relations, a high level of uncertainty and
conflicting interests of the actors involved,
is user friendly in entering input, viewing output and analysing results,
harmonizes actual data and process knowledge from different disciplines,
can operate on different scales and resolutions when required,
may be fully dynamic with feedback loops between individual models,
is built as a flexible component-based system that can be extended with additional
modules over time.
During the last years in the unit for spatial planning of the Lechner Knowledge Centre we
developed for a country specific spatial decision support, the Hungary Spatial Decision
Support model with the above mentioned characteristics. It has been developed using the
Geonamica software platform with the help of RIKS (Research Institute for Knowledge
System).
Vaszóczik, V., Vajdovich-Visy, E.
18
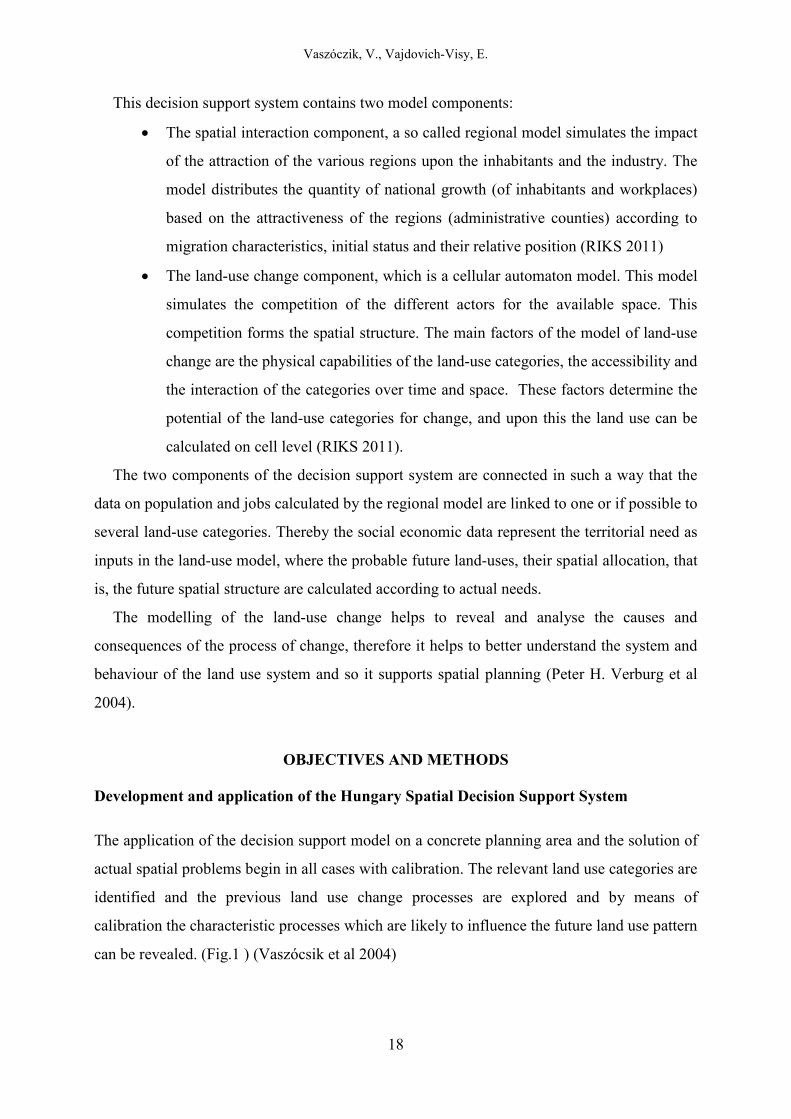
This decision support system contains two model components:
The spatial interaction component, a so called regional model simulates the impact
of the attraction of the various regions upon the inhabitants and the industry. The
model distributes the quantity of national growth (of inhabitants and workplaces)
based on the attractiveness of the regions (administrative counties) according to
migration characteristics, initial status and their relative position (RIKS 2011)
The land-use change component, which is a cellular automaton model. This model
simulates the competition of the different actors for the available space. This
competition forms the spatial structure. The main factors of the model of land-use
change are the physical capabilities of the land-use categories, the accessibility and
the interaction of the categories over time and space. These factors determine the
potential of the land-use categories for change, and upon this the land use can be
calculated on cell level (RIKS 2011).
The two components of the decision support system are connected in such a way that the
data on population and jobs calculated by the regional model are linked to one or if possible to
several land-use categories. Thereby the social economic data represent the territorial need as
inputs in the land-use model, where the probable future land-uses, their spatial allocation, that
is, the future spatial structure are calculated according to actual needs.
The modelling of the land-use change helps to reveal and analyse the causes and
consequences of the process of change, therefore it helps to better understand the system and
behaviour of the land use system and so it supports spatial planning (Peter H. Verburg et al
2004).
OBJECTIVES AND METHODS
Development and application of the Hungary Spatial Decision Support System
The application of the decision support model on a concrete planning area and the solution of
actual spatial problems begin in all cases with calibration. The relevant land use categories are
identified and the previous land use change processes are explored and by means of
calibration the characteristic processes which are likely to influence the future land use pattern
can be revealed. (Fig.1 ) (Vaszócsik et al 2004)

Vaszóczik, V., Vajdovich-Visy, E.
19
Figure 1 Scheme of the operation of the decision support system
Source: RIKS 2011
At the beginning of the development of Hungary Spatial Decision Support System the land
uses pertaining to the three sub-systems were identified. The space for the operation of the
social sub-system is provided by the settlements (cities and rural communities). A significant
part of the economic sub-system is also located in the settlements, within the built-up areas,
where the extensive areas needed for the operation of the manufacturing and service sectors
can be delimited and identified as manufacturing and commercial areas. Agriculture is the
section within the economic sub-system that has the greatest area need consisting of different
cultivation areas, like arable land, orchards, vineyards. The extensive forest areas belong
partly to the economic subsystem, but in their natural condition they belong to the ecological
sub-system. Other important constituent parts of the ecological sub-system are the land uses
such as natural habitats, which can be identified as woodland, natural grassland, wetland,
water surface. Information on these land uses is available in the land cover data bases. For the
whole territory of Hungary the data base of the Corine Land Cover is available for a series of
time periods. The Corine Land cover contains and offers quantified, comparable data for the
whole European territory at 1:100,000 scale. The size of the smallest interpreted object is 25
hectares, the minimum width is 100 m (Mari I. 2010).
By means of the available data we identified the relevant land uses for the decision support
system, and produced for the initial country map with 250m x 250m grids.

Vaszóczik, V., Vajdovich-Visy, E.
20
For modelling the land-use changes we compared the overtime changes of the data at our
disposal and identified the national level process of the land-use changes. For the model
building, for calibration we mapped these processes.
Through calibration we revealed the inertia of certain land-uses, the direction of their
transformation, regularities and their mutual attraction or repulsion. The time and
spatial interaction of the different land-uses is known as neighbourhood impact, which
is applied by several land-use change models as neighbourhood rule (Hagoort,
Geertman and Ottens, 2008). Consequently, in our Hungarian model we also
determined the neighbourhood rules relating to different land uses.
For identifying the land-use potential exposition, soil characteristics, height and
habitat features can be considered. In the course of tuning we set a separate rule for
each factor which, by means of the adequate combination method leads to the
formulation of the map of the land-use potential of a given use, that is, the optimal
location in terms of natural endowments.
Accessibility represents the impact of infrastructure networks on land-uses. The
impact of road- and railroad network on the location of the new built up areas was
modelled first of all.
In the last phase of calibration the content and impact of regional and local
(development and physical) planning regulations as well as other regulations and their
long-term influence on land uses were built in the model. The hierarchy of the
different zoning regulations determines the combined zoning regulation.
Modelling of spatial interactions
For the spatial allocation of population and economic activities the model analyses a
so called standard potential: each region is in competition with all the others for new
residential areas and for the attraction of economic activities on the basis of their
relative geographical position, activity rate, size of population, number and type of
existing activities, relative access to public and private transport systems (RIKS,
2011).
For calibration we analysed first of all the distribution of the number of
population/workplaces among the regions (administrative counties) and explored the
migration trends. By means of the historic range of data we calibrated the

Vaszóczik, V., Vajdovich-Visy, E.
21
attractiveness of the area units, spatial stability of population/workplaces and the main
inter-regional migration flows.
As a final step of calibration we supervised – by means of running for a long-term
period – the operation of the model: we analysed whether the distribution of
population and workplaces, as set in the model, was realistic enough, we explored the
causes of eventual extremities and refined the setting, where it was necessary.
Finally, we linked both components of the decision support system and specified the area
need corresponding to the number of population/workplaces. The regional activities can thus
be interpreted as spatial requirements, that is, for the location of an activity in a certain region
specific conditions are to be met. The model of land-use change allocates the spatial
requirements in compliance with the attractiveness of the cells, which depends on the
availability of good quality land, position of the area in the zoning system and relative
accessibility to waters, roads, public transport network.
As a result of calibration a so-called initial scenario was worked out, which models the
future land-use system in accordance with the evolved trends.
Figure 2 Developing scenarios for the land-use model
source: RIKS 2011
For the support of decision making, in the course of modelling further, alternative
scenarios can be developed at definite decision making points and the possible directions of

Vaszóczik, V., Vajdovich-Visy, E.
22
the process (Figure 2). The output maps modelled following the scenarios facilitate the
selection of the course of action which best leads to the stated objectives.
The alternative scenarios depend on the policy actions and regulations and the probable
processes, which can be built into the system. These may be the following:
Change of the socio-economic environment: predictions of population and
employment change, quantified development targets (e.g. selection of
development poles1, population forecast (Földházi 2015).
Change of land use requirements: future change of the extension of a land-use
category (e.g. afforestation strategy2, reform for greening agriculture3)
Development of the infrastructure network: alternative routing of the planned
lines, time-phasing of implementation.
Change of zoning regulations: incentives for certain land-uses, enforcement of
restrictions or mitigation of restrictions (e.g. new zoning regulations).
The alternative scenarios and the corresponding modelled output maps are essential tools
of consultation with developers, decision makers as well as all stakeholders. The output maps
and the visualized process of land use changes following from alternative decisions are
convincing tools for attaining consensus and selecting the most appropriate scenario.
RESULTS
For demonstrating and testing the role of spatial planning and the application of the spatial
decision support model in safeguarding those areas which may be important in adaptation to
climate change we have selected the case of chief town of Győr-Moson-Sopron county (Győr)
and its urban region (Agglomeration of Győr). We also modelled the impact of the
introduction of new zoning regulations. Győr Agglomeration is in the north-western part of
Hungary, covering an area 1607 km.2 The city and the surrounding belt have a total of 257
thousand inhabitants. In Hungarian relation Győr is a dynamically developing industrial
centre with fast growing residential and industrial areas. Between 2000 and 2012 – according
to the Corine Land Cover database – industrial areas increased by 30%, the urban area
expanded by 4%. According to the estimation and the results of our modelling of the future
land development this growth will continue in the coming decades. However, Győr is situated
at the confluence of rivers and surrounded by a flood prone area. The river banks are
important habitats, parts of the National Ecological Network as ecological corridors.

Vaszóczik, V., Vajdovich-Visy, E.
23
Substantial part of the arable land has very high quality in terms of plant production and has
excellent water management properties. The above mentioned areas play very important role
in climate change adaptation; therefore it is essential to protect them from urban sprawl. In
this area the impact assessment of spatial plans on land use are particularly important. It is
fundamental that spatial plans should have an influence on the control of area growth. We
formulated some recommendations regarding the possible land management roles of spatial
plans as well.
By means of land use change modelling we analysed the probable directions of the growth
of built up areas in the Győr urban region. The comparison of the outcomes of three scenarios
highlighted the future conflicts and the impact of the proposed regulations.
First we analysed the impacts of current regulation. In the case of the “no regulation”
scenario the simulation of future land-uses pointed out conflicts in several parts of the urban
area. The high quality arable land suffered the most extensive damage due to the growth of
built up areas. (Fig. 3 and 4)
Figure 3 Conflict areas in the high quality arable land
Source: own editing using the TEIR database

Vaszóczik, V., Vajdovich-Visy, E.
24
Figure 4 Conflict areas in the high quality arable land
Source: own editing using the TEIR database
The growth of built up areas would also affect some minor parts of the ecological network
in the case of no regulation.
We wanted to find out whether these areas, which are essential for adaptation to climate
change, are protected enough with regulations, to attain that the growth of built up areas can
be limited or avoided. Another question is about the alternative locations for building
development. Therefore a scenario was worked out assuming regulations for the limitation of
built up area growth.
In a conflict area next to the city the modelling of building development indicated the
growth of built up area in spite of the current regulation, though at a lesser rate than in the
case of no regulation.
At another place a little further away from the central city building development was
averted by the force of regulation, and therefore the ecological network avoided the risk (Fig.
5).

Vaszóczik, V., Vajdovich-Visy, E.
25
Figure 5 Long term land use pattern under the current regulation in the ecological network
Source: own editing using the TEIR database
The comparison of building development in both scenarios indicates that in case of
regulation in force the growth of built up areas will continue though at a limited rate in the
urban region of the city of Győr (Fig. 6).
Figure 6 Comparison of the consequences of no regulation and current regulation
Source: own editing using the TEIR database

Vaszóczik, V., Vajdovich-Visy, E.
26
In the elaboration of the third scenario we assumed that climate change would involve
more robust floods than so far, and then the currently flood-proof, deep lying areas will be
more vulnerable, because the dams would not be able to channel the more abundant flow of
water. We also relied on the domestic results of flood risk mapping. In this scenario we
assume the launch in the endangered areas further regulative measures of flood risk
management, which restrict the development of new built up areas. Under the impact of the
proposed measures the location of new industrial areas forecast for 2045 significantly differs
from the one evolving in case of the continuation of current regulations (figure 7).
Figure 7 Impact of the new restricted regulation on long term land use structure
Source: own editing using the TEIR database
The comparison of the location of new industrial areas in both scenarios demonstrates that
the further land use regulation measures of flood risk management restrict the development of
new industrial areas in the direct vicinity of the city of Győr (purple colour), but there is
ample potential for new investment somewhat farther from the river (turquoise colour).
DISCUSSION
The adaptation to climate change would require an approach to land use regulation which
is appropriate for the character and role of specific areas. These areas are basically of three
kind:

Vaszóczik, V., Vajdovich-Visy, E.
27
areas of green infrastructure which mitigate the adverse impacts and promote the
migration of the species
areas which gain added value under the impact of climate change (e.g. high quality
arable land)
the areas suffering natural risks (e.g. areas with increasing frequency and magnitude of
flood risk)
A more sophisticated land use regulation (which involves the restriction of building
development and the enhancement of ecological land cover) might involve consequences in
the economic and social urban structures, which need further consideration. For the
appropriate functioning of the specific areas additional interventions are needed (e.g.
afforestation, wet land rehabilitation).
CONCLUSION
The proposed land use regulation does not only restrict, but also promotes particular land uses
of some crucial areas:
the suitable land cover of areas of potential green infrastructure - serving for
mitigating the adverse impacts of uncontrolled water flow, habitat fragmentation and
soil degradation - can be grassland or woodland;
the high quality arable land, should be under special protection with the help strips of
woodland
the areas exposed to highly frequent and robust floods need water resilient land cover
such as swamp forest, wetlands, and even temporary water surfaces
The proposed regulation and recommendations would contribute to a more natural land use
structure and enhance the connectivity of habitats, reduce the runoff and the potential
damages of climate change. In consequence,, the overall land use, including the urban
structure would change. The area allocated for industrial and urban investments will be
scattered, but the advanced industrial technologies and transport links will easily adapt to such
new conditions.
The application of the Spatial Decision Support System and the model developed for the
context in Hungary has proved to be a useful tool by forecasting the land-use change process
in different regulatory frameworks. The visualisation of the alternative processes and
consequences of change helped to come to appropriate conclusions and demonstrate the

Vaszóczik, V., Vajdovich-Visy, E.
28
alternative futures before decision makers and all stakeholders in the course of planning
consultations.
REFERENCES
Biesbroek, G.R., Swart, R. J., & Van Der Knaap, W. G. M. (2009). The mitigation-adaptation dichotomy and the role of spatial planning. Habitat International, 33(3), 230-237
Council of Europe Conference of Ministers responsible for Spatial/Regional Planning (CEMAT) (2011). Basic texts 1970-2010 Territory and landscape, No. 3. Council of Europe Publishing
Földházi, E. (2015). A népesség szerkezete és jövője. In: Monostori Judit – Őri Péter – Spéder Zsolt (szerk.): Demográfiai portré 2015. KSH Népességtudományi Kutatóintézet, Budapest: 213-226.
Hagoort, M., Geertman, S., & Ottens, H. (2008). Spatial externalities, neighborhood rules and CA land use modeling. Annals of Regional Science, 42, 39–56.,
Jaschitzné Cserni, T. (2012). TICAD SDSS – A tervezés új dimenziója, http://www.terport.hu/webfm_send/2805
McIntoch, B., Seaton, R.A.F., & Jeffrey, P. (2007). Tools to think with? Towards understanding the use of computer-based support tools in policy relevant research. Enviromental Modelling and Software, 22(5), 640-648.
Verburg, P. H., Schot, P. P., Dijst, M. J., & Veldkamp, A. (2004). Land use change modelling: current practice and research priorities. GeoJournal, 61(4), 309-324.
RIKS (2011). Metronamica documentation, RIKS, Maastricht, The Netherlands The Parlimentary Act XXVI of 2003 on the National Spatial Plan Vajdovichné Visy, E. (2006). A területi tervezés alapfogalmainak értelmezése- A nemzetközi
gyakorlat in: Váti Magyar Regionális Fejlesztési és Urbanisztikai Kht. Stratégiai Tervezési és Értékelési Igazgatósága: Egységes tervezési rendszer szakértői előkészítése. Budapest,
van Delden, H., Seppelt, R., White, R., & Jakeman, A.J. (2011). A methodology for the design and development of integrated models for policy support. Environmental Modelling and Software,
van Delden, H., Seppelt, R., White, R., & Jakeman, A. J. (2011) A methodology for the design and development of integrated models for policy support. in Enviromental Modelling & Software 26(3), 266-279.
van Delden, H., Göncz, A., Hurkens, J., Nagy, Z., Tacheci, P., Vaneček, S., ...Vaszocsik, V. (2012). Integrating hydrology, land use and socioeconomics in supporting spatial planning for the Tisza basin. in Seppelt, R., Voinov, A.A., Lange, S. & Bankamp, D. (Eds.) (2012). International Congress on Environmental Modelling and Software Society (iEMSs) 2012. Proceeedings from International Congress on Environmental Modelling and Software Managing Resources of a Limited Planet: Pathways and Visions under Uncertainty, Sixth Biennial Meeting, Leipzig, Germany pp. 2809-2816
Vaszócsik, V. (2016). Hazai tájhasználat változási folyamatok modellezése in: Horváth, G. (2016) (szerk.) Tájhasználat és tájvédelem – kihívások és lehetőségek Eötvös Loránd Tudományegyetem Földrajz- és Földtudományi Intézet Környezet-és Tájföldrajzi Tanszék Budapest.
White, R., & Engelen, G. (1993). Cellular automata and fractal urban form: a cellular modelling approach to the evolution of urban land use patterns. Environment and Planning A, 25(8), 1175–1199.

DETUROPE – THE CENTRAL EUROPEAN JOURNAL OF REGIONAL DEVELOPMENT AND TOURISM Vol. 9 Issue 3 2017 ISSN 1821-2506
29
Original scientific paper
COMPARATIVE RESEARCH OF THE RESULTS OF FUNCTIONAL
REGIONALIZATION METHODS – BY THE NETWORK OF
COMMUTING IN HUNGARY
János PÉNZESa, Gábor PÁLÓCZIb
a University of Debrecen, H-4032 Debrecen, Egyetem tér 1., [email protected] b University of Debrecen, H-4032 Debrecen, Egyetem tér 1., [email protected]
Cite this article: Pénzes, J., Pálóczi, G. (2017) Comparative Research of the Results of Functional Regionalization Methods – By the Network of Commuting in Hungary. Deturope. 9(3): 29-41
Abstract
The paper deals with the topic of functional regionalization and demonstrates some of the possible delimitation methodologies on the basis of commuting to work dataset provided by the 2011 census in Hungary. The main objective of the study is to compare the results of the different methods on the basis of the resulted territorial divisions, their centres and hinterlands. The method of local labour systems (LLS), the method of labour market areas (LMA) – called as EURO method – and the CURDS measure are introduced, applied and compared. The results of the calculations clearly demonstrate the different characters of the methods. The results of the LLS method are characterized by major disparities with an extremely extended Budapest LLS district. The EURO method results in a less extending central region around Budapest, however, the CURDS measure causes the most moderate inequalities among the functional regions with the smallest number of units. The differing character of the methods can be discovered in the centres as well. LLS centres indicate the polarizing character of the method preferring the largest centres, at the same time it gives possibility to the smaller centres to be delimited. The centres of the EURO method appear with the largest frequency and it gives the possibility that those centres are located in the surroundings of dominant centres. The CURDS measure is the ‘strictest’ one from this respect. The comparative results drew the attention to the differing character of centres in each part of Hungary. Keywords: commute, employment centre, local labour systems, labour market area, territorial division
INTRODUCTION
The concepts and definitions of functional regions
The delineation of territorial units based on functional relations is an increasingly exciting and
actual issue in regional science, human geography and regional development planning.
Formal and functional regions were created during the last decades on the basis of various
approaches and methodologies. The term ‚functional region’ has been introduced into human
geography by American geographers (e.g. Philbrick, 1957, Nystuen–Dacey, 1961).
In order to study the structure of a given territorial system, an analysis of social-economic
movements is required at first (the channels along which movements occur). The movements

Pénzes, J., Pálóczi, G.
30
create interactions and flows, networks, nodes and hierarchical organization that as a complex
system ultimately forms spatial patterns and surfaces. The concept of ‚functional region‘ is an
abstract spatial feature, which is the reason why there is no sole correct procedure to delimit
such regions and why different analyses of the same dataset can provide considerably
differing results (Laan & Schalke, 2001).
Functional regions generally refer to territorial units where intense economic interactions,
including the use of services, trade or commuting to work are typical (Karlsson-Olsson,
2006). Labour market interactions are most commonly used in functional region delineations
(e.g. travel-to-work flows, particularly with daily periodicity). Commuting to work is
regarded as the most frequent and stable regular movement of the population with a daily
periodicity (Bujdosó et al., 2013), so these flows are appropriate to represent functional
relations. Functional regions based on the daily travel-to-work flows are referred to as local
labour market areas (LLMA) or travel-to-work areas (TTWA).
The objective of the delineation of functional regions is to maximize and minimize the
ratio of within-region and that of inter-regional flows respectively, so the analysis is based on
relational datasets (Haggett, 1965; Klapka et al., 2014). A labour commuting dataset is
appropriate from this respect as it generally contains detailed territorial relational values for
the employed population (in some cases modifications and corrections are required – Pálóczi
et al., 2016). Numerous quantitative methodologies were developed to detect and delineate
functional regions, but most of them tend to favour three approaches:
- clustering methods using numerical taxonomy (e.g. Smart, 1974);
- graph theory procedures (e.g. Nystuen & Dacey, 1961; Karlsson & Olsson, 2006);
- multistage (or rule-based) procedures (e.g. the approach developed by the Centre for
Urban and Regional Development Studies [CURDS] in Newcastle, UK – see Coombes
et al., 1986 and Coombes–Bond, 2008 for more information).
In the current analysis, three multistage methods are studied comparatively on the example
of Hungary and the focus is on the centres and hinterlands of the functional regions. Due to
the limited extent of the paper, only the number of settlements and number of population are
used as descriptive statistics.
OBJECTIVES AND METHODS
Possibilities to delineate functional regions
Three multistage methods are introduced and applied in the current analysis. The objective of
this paper is to highlight the different results of the given methods and their differing

Pénzes, J., Pálóczi, G.
31
characteristics assessing their advantages and limitations by the centres and functional regions
themselves. The second objective of this study is to position the different results in the spatial
pattern of a country and to give a summary about the results according to counties of Hungary
(NUTS 3 level). These results may be useful for regional planning activities providing
empirical information about the employment centres.
The concept of local labour systems (LLS) is the first methodology that is important to be
taken into consideration. The local labour systems of Hungary were delimited for the first
time on the basis of the 2001 census dataset as part of a European research project
(Radvánszki–Sütő, 2007). The original methodology was modified in the updated
investigation including the results for 2011 as well (Pénzes et al., 2015).
As part of this two-step method, labour centres were chosen at first. The settlements with
more than 1,000 people employed locally were taken into account. Only those settlements
were regarded as centres that attracted at least one settlement from where the majority of the
commuters worked in the given centre. In the next phase, the settlements from where more
than 10% of the employees commuted to another centre were removed from the range of
centres (exceptions were the settlements mutually attracting each other, in this case centre-
pairs have been identified while the towns were considered independent centres from where
the proportion of people commuting was less than 20%, the number of people employed
locally was more than 5,000, and there was a daily labour force account).
During the second step of the delimitation process, catchment areas were created around
centres according to the most important destination (to the listed centres) of the commuting of
employees. Sub-centres were merged with their dominating centre and their entire catchment
area was attached also. The spatial continuity of hinterlands was formed according to the
affiliation of the most important centre of attraction.
The concept of labour market areas (LMA) is applied by the so-called ‘EURO method’ as
it has been tested by the EUROSTAT and several research groups in Europe. The objective of
the EUROSTAT is to provide harmonized basis for regional taxonomy in the countries of the
EU in order to detect and evaluate the processes of the labour market. In the followings, we
refer to this method and its result as ‘EURO method’, because this version (Ichim, 2016) was
applied during the current analysis.
The EURO method is a multivariate calculation developed originally by the CURDS
research group. The applied and introduced method is based on the CURDS algorithm using

Pénzes, J., Pálóczi, G.
32
the symmetrizing measure proposed by Smart (1974) – see [1]. The referred methodology
became the most successful and acknowledged approach to functional regional taxonomy
with considerable results from numerous countries (inter alia Casado-Díaz, 2000; Flórez-
Revuelta, Casado-Díaz, & Martínez-Bernabeu, 2008; Persyn & Torfs, 2011).
During the running process of the algorithm (supported by the statistical program R)
(Ichim, 2016) the settlements are grouped as basic units. These groups are evaluated by their
size (number of the economically active population) and their self-containment (the lower
value from the demand and the supply side self-containment), where demand side self-
containment (DSSC) is the ratio of intra-regional flows and the volume of incoming
commuting flow, supply side self-containment (SSSC) is the ratio of intra-regional flows and
the volume of outgoing commuting flow. The size and self-containment (SC) of every created
settlement group (LMAs or individual settlements in this phase) are evaluated by the validity
function (in which the minimum size, the target size, the minimum self-containment and the
target self-containment are included). Optimization is ensured by the function as small size
LMAs (above the minimum size criteria) must fulfil the criteria of higher SC. The filtered
groups are disaggregated by the algorithm and the settlements are merged into the dominant
group or put onto reserve list. The dominant group is identified by the following measure [1]
(it is applied to make the original commuting dataset symmetrical and relativized):
[1] Smart’s measure:
� ���2�∑ ���� ∗ ∑ ���� � + ���2
�∑ ��� ∗ ∑ ����� �
where Tij denotes the flow from spatial zone i to spatial zone j, and Tji from j to i, ∑kTik
denotes all outgoing flows from i, ∑kTkj denotes all ingoing flows to j, ∑kTjk denotes all
outgoing flows from j, and finally ∑kTki denotes all ingoing flows to i.
Smart’s measure can be regarded as mathematically the most correct way to transform the
interaction data (Halás, Klapka, Tonev, & Bednář, 2015). This measure decreases the
dominance of larger centres and it can support the principle of spatial equity (Michniak,
2003).
The concept of functional regions (FR) is similar to the EURO method, however, it
produces significantly different results. The cited studies (Klapka et al., 2014; Halás et al.,
2015) refer to the method as ‘CURDS measure’ and this form is used in the current text.

Pénzes, J., Pálóczi, G.
33
The main difference between the EURO method and the CURDS measure is found at the
beginning of the algorithm. The process of the algorithm of the CURDS measure calculating
the regional taxonomy is divided into three stages including four steps and several operations.
The identification of proto-regions (identification of potential cores and identification of
multiple cores by critical values of the interaction measure) is followed by the assignment of
spatial zones to the proto-regions by interaction measure maximization. In the last step, the
assessment of the validity of the solution is made by the application of the constraint function
and iterative dissolution is applied for the regions not meeting the criteria set by the constraint
function [for more details about the process see Klapka et al. (2014), Halás et al. (2015) and
Pálóczi et al. (2016)].
In the regionalization process the constraint function is used in the following step to set a
minimum size and self-containment criteria for the obtained regions (a continuous curve was
applied during the delimitation process determined by four parameters – lower and upper
limits of the self-containment, lower and upper limits of the size). The size of a region is
regarded as the most general feature of a region (e.g. the number of employed people), which
is a standard and easily accessible indicator. Self-containment is a vital parameter, and its
value cannot be allowed to drop under 0.5 – this means that at least 50% of all interactions
(commuters) to a region should occur within the region itself. The most essential outputs of
the regionalization are considered by these parameters and the constraint function.
The CURDS measure was used with the demonstrated methodology for example in the
case of the Czech Republic (Halás et al., 2015), Slovakia (Halás, Klapka, Bleha, & Bednář,
2014) and Hungary (Pálóczi et al., 2016).
RESULTS
The three illustrated methodologies give more or less different aspects to the delimitation
issue of functional regions on the basis of the commuting dataset of the census in 2011. The
objective of the current study is to make a comparative research covering the three introduced
methodologies focusing on the number of the obtained functional regions, especially their
centres and hinterlands. It is important to emphasize that finding the optimal division is not
included in this paper, so this parallel comparison does not make any attempt to indicate the
‘best’ division for Hungary. This issue could be the core problem of a more extended study.
According to the LLS methodology 123 districts were delineated. (Fig. 1)

Pénzes, J., Pálóczi, G.
34
Figure 1 The territorial division of Hungary based on the local labour systems (LLS) with the centres and sub-centres, 2011
Source: by Pénzes et al. 2015, Fig. 4., p. 77.
The same parameters were applied in the case of the EURO method (Fig. 2) and the
CURDS measure (Fig. 3) in order to ensure the comparative approach [these parameters were
the lower (3,500 employed people) and the upper limits of the size (20,000 employed people)
and the lower (0.60) and upper limits of the self-containment (0.65)]. The same variants of
parameters provided the possibility to reveal the most important territorial differences
between the obtained divisions (Tab. 1).
Table 1 The descriptive statistics of the results of the three methods
Method Number of functional
regions
Average number of settlements
Maximum number of settlements
Minimum number of settlements
LLS method 123 26 213 2 EURO method* 143 23 116 1 CURDS measure* 114 28 129 1
*calculated on the basis of the parameters detailed in the text Source: calculated by the authors on the basis of the census data

Pénzes, J., Pálóczi, G.
35
Figure 2 The territorial division of Hungary using the EURO method, 2011
Source: edited by the authors on the basis of the census data
Figure 3 The territorial division of Hungary using the CURDS measure, 2011
Source: edited by the authors on the basis of the census data

Pénzes, J., Pálóczi, G.
36
Table 2 The centres and number of population of the largest and smallest functional regions according to the results of the three methods, 2016
Method
The largest functional region’s
The smallest functional region’s Relative
deviation centre
number of population
centre number of population
LLS method Budapest 2,995,463 Szany 2,554 344.1 EURO method* Budapest 2,639,888 Villány 10,568 324.5 CURDS measure* Budapest 2,751,570 Soltvadkert 11,031 300.6
*calculated on the basis of the parameters detailed in the text Source: calculated by the authors on the basis of the HCSO and census data
The major differences between the applied methods could be detected in the occurrence of
smaller centres and in the extension of the largest towns’ hinterlands. (Table 2 and Fig. 4)
Unambiguously, Budapest produced the largest functional region by all of the methods,
however, it contains 213 settlements using the LLS method (with almost 3 million
inhabitants) and only 116 when the EURO method is applied (with more than 2.64 million
inhabitants). The smallest functional regions were represented by Szany according to the LLS
method, Villány using the EURO and Soltvadkert using the CURDS measure. Due to the
most extreme values produced, largest disparity was calculated from the LLS results
(applying the method of relative deviation).
Figure 4 The boundaries of functional regions obtained using the three compared methods, 2011
Source: edited by the authors on the basis of the census data

Pénzes, J., Pálóczi, G.
37
The functional regions were assumed as nodal regions (apart from a few exceptional cases,
the dominant part of them is a real nodal region) for the purpose of indicating one centre in
every functional region. In the case of the LLS division sub-centres were neglected and only
one centre was highlighted. Only one central settlement was identified (the largest one) in the
EURO method and CURDS measure in order to make a simplified comparison.
Figure 5 The centres of the functional regions obtained using the three compared methods, 2011
Source: edited by the authors on the basis of the census data
The centres of the functional regions demonstrated a complex territorial pattern (Fig. 5).
The centres of the EURO method – as it was stated – appeared with the largest frequency.
Those centres were regarded more dominant that were delimited by all of the methods. This
list contained 96 centres – each centre had a town rank (by the Hungarian administrative
division) including Budapest and the county seats (in 2016).
28 centres were indicated by two of the methods (all of them were delimited by the EURO
method) – Recsk is a large village from them. 36 centres appeared in the results of only one of
the methods. The CURDS measure produced only those centres that were delineated by at
least one more method.
The different characters of the methods were clearly demonstrated by the obtained maps
(Fig. 4 and Fig. 5). The appearance of the LLS centres indicated the polarizing character of
the method resulting in an outstanding dominance of the largest centres (first of all to

Pénzes, J., Pálóczi, G.
38
Budapest and the largest towns as well), at the same time it gave possibility to the smaller
centres to be delimited. Centres in the peripheral areas (e.g. Abaújszántó, Baktalórántháza,
Komádi, Nyírmada, Sellye, Szendrő) or in territories without large centres (e.g. Jánosháza,
Harta, Solt, Szany) might also appear.
The EURO method characteristically gave the possibility for those centres to appear
locating them in the surroundings of dominant centres (e.g. in the agglomeration of Budapest,
Debrecen or Tatabánya). Balmazújváros, Dabas, Derecske, Hernád, Kaba, Kiskunlacháza,
Oroszlány, Tata, Csorna and Kőszeg are the most typical examples.
The CURDS measure was the “strictest” one – for instance Pest, Fejér, Komárom-
Esztergom and Nógrád counties (in the neighbouring territories in the proximity of Budapest)
contained only three centres, including the capital city itself.
The NUTS 3 units of Hungary (19 counties and Budapest) could be described very varied
from the aspect of the summarized results of the centres. Some of the counties were
absolutely homogeneous considering the delimited centres – all of the three methods gave the
same results regarding centres in the case of Fejér, Tolna and Veszprém counties. The results
for Nógrád, Somogy and Zala counties could be regarded as stable enough. However, the
remaining counties represented more or less significantly differing spatial patterns that made
the comparative analysis difficult and the selection of the appropriate method expressively
complicated (or almost impossible).
DISCUSSION
Territorial division based on labour market relations can be realized with various methods and
variants within them. The demonstrated methods are all applicable in a given context for
Hungary, however, the resulted territorial divisions and centres might be ambiguous.
The appropriate method should produce a territorial division that reflects the geographical
characteristics, the settlements’ structure, the number of relations and the intensity of flows.
The LLS methodology is too ‘rigid’ to give more alternative variations of the results, in
contrary to the EURO and CURDS measures.
It is important to keep the objective of the delimitation in mind. Several delimitations are
determined by previous divisions or by the number or boundary of administrative units
(Casado-Diaz, 2000). The extent of the obtained functional regions can also be limited by
intervals (ISTAT 2014). The aim of the research could be to find an optimal solution after a
heuristic and iterative process. The selection is most frequently based on the given set of

Pénzes, J., Pálóczi, G.
39
descripting indicators. However, this problem is the most significant disadvantage of the
EURO and CURDS measures (Thorsen, 2017).
The tested and compared methods all provide reasonable results that can be appropriate in
given conditions. The characteristic behaviour of the methods can be traced in the occurrence
of centres and their hinterland boundaries. However, not only the methods can be tested in
this way but the role of the centres can also be investigated. The role of towns is a complex
and always actual issue (Demeter–Radics, 2009; Nagy, 2010; Csomós, 2015; Bujdosó et al.,
2016). This approach contains only the nodal role of centres (primarily towns) from the aspect
of commuting to work, however, the results may significantly overlap with other town ranks
(this issue is not included into the current study).
CONCLUSION
The current paper demonstrated three different territorial divisions on the basis of the LLS
method, the EURO method and the CURDS measures. The differing characters of the
calculations demonstrate the polarizing character of the LLS method. The EURO method
results in less extended functional regions in the case of the larger centres compared to the
CURDS measure using the same set of parameters.
The centres of the delimited functional regions are primarily nodal centres as well. The rest
can be unambiguously defined as important employment centres because all of the methods
indicated their important role. The methods of functional regionalization differ from each
other in the different ‘treating’ of peripheral areas with limited flows and in the extent of
functional regions with large centres (e.g. Budapest). The investigation also indicates the
counties with relatively stable centres and functional regions around them.
The current study is very specific due to the basic dataset and methodology that is why the
demonstrated results should be interpreted only in this context.
SUMMARY
The current paper deals with the topic of functional regionalization and demonstrates some of the possible delimitation methodologies on the basis of commuting to work dataset provided by the 2011 census in Hungary. The main objective of the study is to compare the results of the different methods based on the delimited territorial divisions and the centres occurred. The method of local labour systems (LLS) is a two-step hierarchical methodology giving special emphasis on the nodal approach, in which the centres are clearly identified. The EURO method and the CURDS measure are also based on the flows of employees but nodal centres are defined only by the most populous settlements within the functional regions. These methods seem to be similar but after going into details significant differences can be discovered. The results of the calculations clearly demonstrate the different character of the methods.

Pénzes, J., Pálóczi, G.
40
The LLS method results in 123 units with major disparities significantly polarizing the outlined spatial units with Budapest LLS including almost 3 million inhabitants. The EURO method results in the less extending central region around Budapest, however, the CURDS measure causes the most moderate inequalities among the functional regions with the least number of units. The differing character of the methods can be discovered in the centres as well. The occurrence of the LLS centres indicates the polarizing character of the method resulting in the outstanding dominance of the largest centres, at the same time it makes the delimitation of smaller centres possible. Centres in the peripheral areas or in territories without large centres may also occur. The centres of the EURO method occur with the largest frequency because this method characteristically makes the delimitation of centres located in the surroundings of dominant centres possible. The CURDS measure is the ‘strictest’ one from this aspect. There is a significant overlap in the results – 96 centres are delimited by all of the three methods and 64 by one or two of the methods. Some of the Hungarian counties are absolutely homogeneous regarding the delimited centres, every method give the same result about centres in the case of Fejér, Tolna and Veszprém counties. Each method provide appropriate results from a given perspective, however, the calibration of the methods with four parameters (EURO method and CURDS measure) are not among the objectives of the current study.
Acknowledgement
The current research was supported by the project of the Eurostat and the Hungarian Central Statistical Office (project number: 08141.2015.001-2015.500)
REFERENCES
Bujdosó, Z., Dávid, L., & Uakhitova, G. (2013). The effect of county border on the catchment area of towns on the example of Hajdú-Bihar County – methodology and practice. Bulletin of Geography. Socio-economic Series, 22(22): 21-33.
Bujdosó, Z., Kovács, T., Szűcs, C., & Branbauer, Z. (2016). “New” direction of urban development from a Central European perspective. Theoretical and Empirical Researches in Urban Management, 11(2): 55-64.
Casado-Díaz, J. M. (2000). Local Labour Market Areas in Spain: A Case Study. Regional Studies, 34 (9): 843-856.
Coombes, M., Green, A. E., & Openshaw, S. (1986). An Efficient Algorithm to Generate Official Statistical Reporting Areas: The Case of the 1984 Travel-to-Work Areas Revision in Britain. The Journal of the Operational Research Society, 37(10): 943-953.
Coombes, M., & Bond, S. (2008). Travel-to-Work Areas: the 2007 review. London: Office for National Statistics
Csomós, G. (2015). The ranking of cities as centres of the Hungarian economy (1992-2012). Regional Statistics, 5(1): 66-85.
Demeter, G., & Radics, Z. (2009). Centrumok és perifériák a Monarchia szétesése után – az új határok racionalitásának vizsgálata gravitációs modellek alapján [Centres and peripheries after the disintegration of the Dual Monarchy]. Közép-európai Közlemények, 2(2-3): 151-160.
Flórez-Revuelta, F., Casado-Díaz, J. M., & Martínez-Bernabeu, L. (2008). An Evolutionary Approach to the Delineation of Functional Areas Based on Travel-to-work Flows. International Journal of Automation and Computing, 5 (1): 10-21.
Haggett, P. (1965). Locational analysis in human geography. London: Edward Arnold. Halás, M., Klapka, P., Bleha, B., & Bednář, M. (2014). Funkčné regióny na Slovensku podľa
denných tokov do zamestnania [Functional regions in Slovakia according to daily travel-to-work flows]. Geografický časopis/Geographical Journal, 66 (2): 89-114.

Pénzes, J., Pálóczi, G.
41
Halás, M., Klapka, P., Tonev, P., & Bednář, M. (2015). An alternative definition and use for the constraint function for rule-based methods of functional regionalisation. Environment and Planning A, 47: 1175-1191.
Ichim, D. (2016). The R package LabourMarketAreas. [Presentation]. Retrieved from: https://ec.europa.eu/eurostat/cros/system/files/the_r_package_labourmarketareas.pdf
ISTAT (2014). Nota metodologica. Sistemi Locali del Lavoro [report]. Retrieved from: http://www.istat.it
Karlsson, C., & Olsson, M. (2006). The Identification of Functional Regions: Theory, Methods, and Applications. The Annals of Regional Science, 40(1): 1-18.
Klapka, P., Halás, M., & Tonev, P. (2013). Functional Regions: Concept and Types. In, 16th International Colloquim on Regional Science. Conference Proceedings (Valtice 19–21.6.2013). Brno: Masarykova Univerzita: 94-101
Klapka, P., Halás, M., Erlebach, M., Tonev, P., & Bednář, M. (2014). A Multistage Agglomerative Approach for Defining Functional Regions of the Czech Republic: The Use of 2001 Commuting Data. Moravian Geographical Reports, 22(4): 2-13.
Laan van der, L., & Schalke, R. (2001). Reality versus Policy: The Delineation and Testing of Local Labour Market and Spatial Policy Areas. European Planning Studies, 9(2): 201-221.
Michniak, D. (2003). Dostupnosť okresných miest na Slovensku [Accessibility of district centres in Slovakia]. Geografický časopis, 55(1): 21-39.
Nagy, Z. (2010). The Development of Regional Centres in Hungary in the past two decades. European Integration Studies, 8(1): 107-131.
Nystuen, J. D. & Dacey, M. F. (1961). A graph theory interpretation of nodal regions. Regional Science Association, Papers and Proceedings, 7, 29-42.
Pálóczi, G., Pénzes, J., Hurbánek, P., Halás, M., & Klapka, P. (2016). Attempts to delineate functional regions in Hungary based on commuting data. Regional Statistics, 6(1): 23-41.
Pénzes, J., Molnár, E., & Pálóczi, G. (2015): Local Labour System after the turn of the millennium in Hungary. Regional Statistics, 5(2): 62-81.
Persyn, D., & Torfs, W. (2011). Functional Labour Markets in Belgium: Evolution over time and intersectoral comparison. Discussion Paper 17. Leuven: Katholieke Universiteit, Vlaams Instituut voor Economie en Samenleving.
Philbrick, A. K. (1957). Principles of areal functional organization in regional human geography. Economic Geography, 33(4): 299-336.
Radvánszki, Á., & Sütő, A. (2007). Hol a határ? Helyi munkaerőpiaci rendszerek Magyarországon – Egy közép-európai transznacionális projekt újdonságai a hazai településpolitika számára [Where is the border? Local Labour Systems in Hungary – Novelties of a Central-European transnational project to the Hungarian settlement policy]. Falu Város Régió, 14(3): 45-54.
Smart, M. W. (1974). Labour market areas: uses and definition. Progress in Planning, 2(4): 239-353.
Thorsen, T (2017). Labour Market Areas in Denmark. [Presentation] LMA Meeting in Paris. 26-27. January 2017.

DETUROPE – THE CENTRAL EUROPEAN JOURNAL OF REGIONAL DEVELOPMENT AND TOURISM Vol. 9 Issue 3 2017 ISSN 1821-2506
42
Original scientific paper
THE CONNECTION OF EU SUPPORTS AND THE TAXABLE INCOME
PER CAPITA IN THE NORTHERN HUNGARIAN REGION, FOR THE
2007-2013 PERIOD
EU TÁMOGATÁSOK ÉS JÖVEDELMEK KAPCSOLATA A 2007-2013-
AS IDŐSZAKBAN, AZ ÉSZAK-MAGYARORSZÁGI RÉGIÓBAN
Dóra SZENDIa
a University of Miskolc, Faculty of Economics, Institute of World and Regional Economics, 3515 Miskolc-Egyetemváros, [email protected]
Cite this article: Szendi, D. (2017) The Connection of EU Supports and the Taxable Income Per Capita in the Northern Hungarian Region, for the 2007-2013 Period. Deturope. 9(3):42-60
Abstract
The territorial social and economic inequality is one of the most fundamental characteristics of space economics. There are not two points in the space which have the same characteristics, because their economic, social and cultural parameters are different. The existence of territorial inequalities is a significant problem also in the case of Hungary with special regards on the settlements of the Northern Hungarian region. The aim of my research is to examine the spatial patterns of the EU supports and the income per employee in the case of the Northern Hungarian region’s settlements and to analyze what kind of effect the supports have on the dispersion of the settlements’ income. According to the results, I can state that there are more hot spots in the region based on the EU supports, than by the income per capita, so the pattern is more heterogeneous. Consequently, there is observable a greater gap among the settlements based on the supports by the inequality measures. The Local Moran clusters forming through the analysis of EU supports and income per employee show significant similarity, 93.48% of the small- and medium-sized cities, and 96.16% of the settlements of the most disadvantaged areas can be grouped into the same cluster according to both indicators. Keywords: territorial inequalities, Northern Hungarian region, income, EU supports.
Absztrakt
A területi szintű társadalmi, gazdasági egyenlőtlenség a térgazdaságtan egyik alapvető jellemzője. Nincs a térnek két olyan pontja, mely azonos tulajdonságokkal rendelkezne, mert a gazdasági, társadalmi, és kulturális paramétereik különbözőek. A területi egyenlőtlenségek fennállása komoly probléma Magyarország esetében is, különös tekintettel az Észak-magyarországi régió településeire. Tanulmányom célja az Észak-magyarországi régió települései körében annak vizsgálata, hogy az EU támogatásainak és az egy főállású foglalkoztatottra jutó jövedelmek eloszlásában milyen térbeli mintázatok azonosíthatók, illetve hogy a támogatások milyen hatást fejtenek ki a települések jövedelmi helyzetére. Az eredmények alapján elmondható, hogy a régió településeinek körében az uniós támogatások eloszlása heterogénebb képet mutat, mint a jövedelemé, ugyanis esetében több kiugró érték definiálható. Következésképpen, az EU támogatások eloszlása jelentősebb differenciákat mutat az egyenlőtlenségi mérőszámok alapján is. Az egy főállású foglalkoztatottra jövedelmek és az egy főre jutó EU támogatások eloszlásában a kialakuló Local Moran klaszterek jelentős hasonlóságot mutatnak, a kis és középvárosok az esetek 93,48%-ában, míg az LHH térségek települései az esetek 96,16%-ában mindkét mutató alapján ugyanabba a csoportba sorolhatók. Kulcsszavak: területi egyenlőtlenségek, Észak-magyarországi régió, jövedelmek, EU támogatások.

Szendi, D.
43
INTRODUCTION
The territorial social and economic inequality is one of the most fundamental factors of space
economics (Nemes Nagy, 1990; Nagyné Molnár, 2007). There are not two points in the space
which have the same characteristics, because their economic, social and cultural parameters
are different (Nagyné Molnár, 2007; Benedek-Kurkó, 2011). The scale of difference can vary
in time and space. According to some researchers’ opinion, there are two special positions in
the space: the centre and the periphery (Nemes Nagy, 2005). Most of the peripheral regions
are not only based on some economic indicators (like GDP or the number of enterprises)
disadvantaged, but also in the quality of life and migration. That is why the decrease of the
territorial inequalities and the catch up of peripheries is an important issue for the economic
policy.
The analysis of spatial inequalities has high priority also in the European Union. The
reason: with the increasing number of EU member countries the economic and social
disparities were also increasing. The EU examines the territorial inequalities since almost
more than 20 years. According to the latest dates of the Eurostat (2016), there is a 54-fold
difference between the richest Inner London and the poorest Severozapaden (Bulgaria) region
(in purchasing power-parity 20-fold) in terms of GDP per capita. The difference was in 2000
between the richest Inner London and poorest Extremadura (Spain) region only 13-fold (in
purchasing power-parity 8.25-fold).
The territorial inequalities are current also in Hungary, where the Northern Hungarian
region is in one of the worst situation among the regions based on some economic and social
indicators (e.g., 7th, last place in GDP/capita ranking; 6th in unemployment rate; 6th in research
and development expenditures; and 6th in the income of households in 2015). In this recent
research, I will analyze the spatial patterns of the EU supports and the income per employee
in the case of the Northern Hungarian region’s settlements. The aim of the research is to
examine what kind of intraregional disparities can be verified in the region (which patterns
can be identified among the settlements) and whether the role of space is a significant factor
in the distribution of dates. Through the analysis, I have defined two specific settlement
categories on which I have made a deeper focus, as I thought these could be the extreme
points of the analysis. These areas are the region’s small- and medium-sized cities and the
settlements of the most disadvantaged areas which need a complex development program.

Szendi, D.
44
THEORETICAL BACKGROUND AND EMPIRICAL EXPERIENCES
Theories of convergence and the role of space
The analysis of territorial inequalities is not new; several researchers have examined the
positive convergence chances of the peripheries (e.g., nation states convergence process by
Barro and Sala-i-Martin, 1992; Mankiw et al., 1992; Romer, 1994; Sala-i-Martin, 1995; Quah,
1996). The empirical analysis of convergence dates back to the 1960s. In that time the
neoclassical growth theories (such as Solow) were in the foreground of the analyses. In these
theories the territorial inequalities are disappearing in the long run, hence the income levels of
the poorest economies will be converging to the richer ones because they tend to have higher
growth rates than the richer ones (Barro, 1991, p. 407). From the 1930s, besides the
neoclassical school, there was another school existing parallel, which is named after Keynes.
The Keynesian models’ main aim is on understanding divergence. According to their
assumptions there is not an initial condition beside which the flow of factors brings the
economy to equilibrium. The differences in the regions’ growth rates will be not decreasing in
the long run, but they will increase further (Harrod, 1939; Domar, 1946; Capello, 2007).
Up to the 1990s the mainstream economics did not pay great attention to the spatial
connections of economic activities. Based on the neoclassical and endogenous growth
theories, the national economic policies and the country specific factors have a significant
effect on the regional convergence (Kertész, 2003). Hence, the socio-economic activities are
localizable, and each has an exact geographic location; the locational characteristics have a
significant effect on their dispersion (Benedek – Kocziszky, 2013). The analysis of spatial
economics and location theories has got long past (Krugman, 1999). Von Thünen’s isolated
city theory is contemporaneous with Ricardo’s comparative advantages theory, and the other
location theories also have got long history. As a consequence of the spatial factors’
significance, new approaches have appeared from the 1990s to explain the process of regional
economic growth and convergence (like the new economic geography as a new issue in
spatial economics) which brought significant changes in the examination of spatial
distributions.
There was an increasing need for measuring the role and effects of spatial connections
from that time. The spatial econometrics is a part of econometrics which examines the spatial
aspects (interactions, autocorrelation, and spatial structures) in cross-sectional, time series and
panel models (Anselin, 1999). In this research I also wanted to examine the spatial patterns of
given indicators (income and EU supports) and check the significance of spatial connections;
that is why I have also applied spatial econometric methods through the analysis.

Szendi, D.
45
Former research statements, empirical evidences
In the above-mentioned theoretical convergence models the researchers have made analyses
mainly on country or regional level, but there is a need also for measuring lower levels of
inequalities. Before the regional level analysis, I have made some country level examination
about the spatial dependency of given indicators (Szendi, 2015a; 2015b; 2016) to see the
significance of the spatial models. I have examined the spatial patterns of territorial income in
Hungary for 2012-2013, based on micro regional level data, and have made a statement that
the territorial concentration of income is observable. The income dispersion shows
homogenous, high developed north – north-western path (Vas, Győr-Moson-Sopron,
Komárom-Esztergom, Fejér and Pest counties, and the capital), and there is a highly
developed Budapest-Miskolc, Budapest-Győr, Budapest-Szeged, Budapest-Keszthely, and
Budapest-Pécs axis. Along these axes the territorial income is the highest. The least developed
territories can be found in the north-eastern – northern part of Hungary (Borsod-Abaúj-
Zemplén, Nógrád, Szabolcs-Szatmár-Bereg counties), and in Békés county. These territories
are in terms of accessibility and of the western capital-intensive enterprises peripheral ones, in
several cases, only the county centre has significant economic potential (Szendi, 2016). Also,
Pénzes (2011) has stated that the spatial border line of development and lag can be found
along the Balassagyarmat- Békéscsaba axis. So, I think that the analysis of the Northern
Hungarian region is an actual issue.
I have also analyzed the spatial autocorrelation, and the role of spatial connections in the
case of the country level territorial income, also based on micro regional data. In Hungary, the
taxable income per capita showed medium strong, positive spatial autocorrelation among the
micro-regions in 2013 (similar to the analysis of Dusek, 2004). It can be verified by the low
value of pseudo-p (0.001) and the high value of z-score (12.79). According to the Local
Moran analysis, 117 of the examined 168 micro-regions did not show significant
autocorrelation. The members of the high-high cluster can be found mainly in the Central
Hungarian and Central Transdanubian region. These are highly developed territories
according to the income per capita. To the low-low cluster, 22 territories can be clustered,
with much lower income than the average, and their neighbours are also underdeveloped
areas. They are mostly in South and North-eastern Hungary (this last class can be underlined
also by the analysis of Jakobi, 2011). The high-low cluster, which indicates emerging areas,
has two parts (both county centres), in Hajdú-Bihar County the micro-region of Debrecen and
in Szabolcs-Szatmár-Bereg County the micro-region of Nyíregyháza (Szendi, 2016). The
spatial outlier role of these two micro-regions can be verified also by the settlement-level
analysis of Tóth and Nagy (2013).
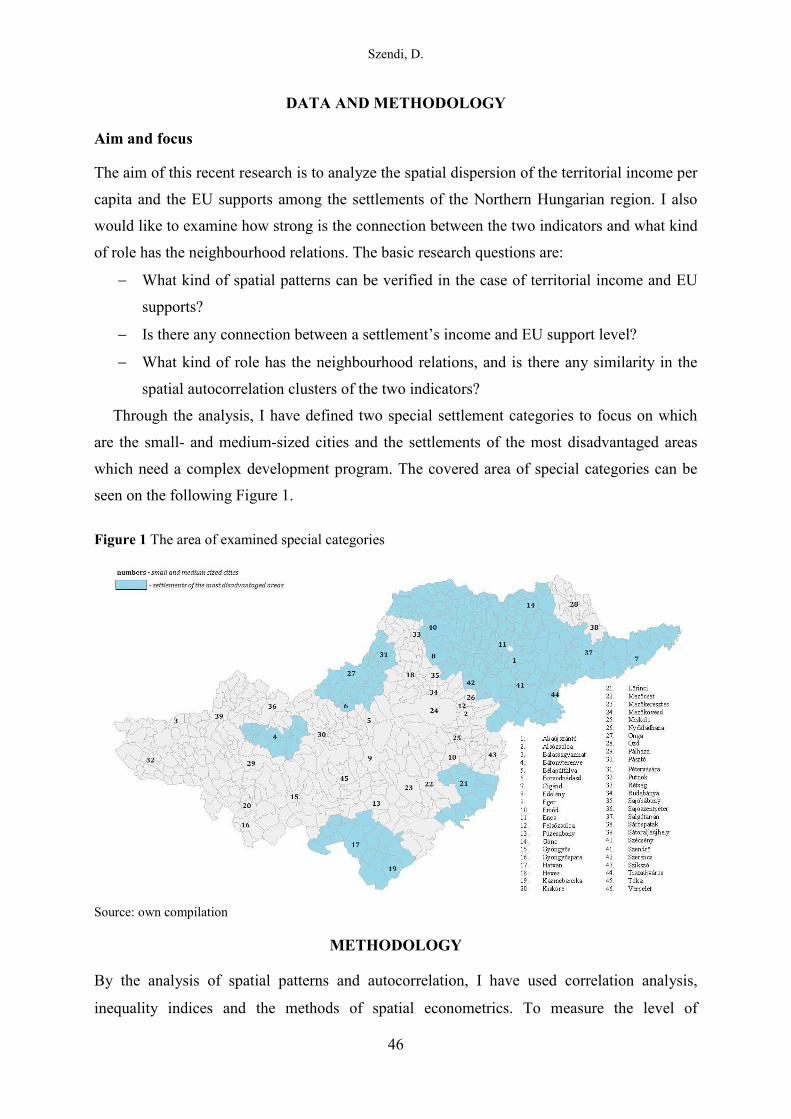
Szendi, D.
46
DATA AND METHODOLOGY
Aim and focus
The aim of this recent research is to analyze the spatial dispersion of the territorial income per
capita and the EU supports among the settlements of the Northern Hungarian region. I also
would like to examine how strong is the connection between the two indicators and what kind
of role has the neighbourhood relations. The basic research questions are:
What kind of spatial patterns can be verified in the case of territorial income and EU
supports?
Is there any connection between a settlement’s income and EU support level?
What kind of role has the neighbourhood relations, and is there any similarity in the
spatial autocorrelation clusters of the two indicators?
Through the analysis, I have defined two special settlement categories to focus on which
are the small- and medium-sized cities and the settlements of the most disadvantaged areas
which need a complex development program. The covered area of special categories can be
seen on the following Figure 1.
Figure 1 The area of examined special categories
Source: own compilation
METHODOLOGY
By the analysis of spatial patterns and autocorrelation, I have used correlation analysis,
inequality indices and the methods of spatial econometrics. To measure the level of

Szendi, D.
47
inequalities, I have applied the Dual indicator and the Hoover index. The Dual indicator is a
measure of spatial polarity and can be calculated as follows:
���� ��������� = ���� �� ������ ����� � � �����!����� �� ������ ����" � � �����!�
The Hoover index (also known as Robin Hood index) measures the differences of the
spatial income distribution. It measures the share of a given community’s income that would
have to be redistributed (taken from the richer part of the population and given to the poorer
part) for reaching income equality (UN, 2015). It is also known as the longest vertical
distance in the Lorenz curve. The Hoover index can be calculated as follows:
= ∑ |$� − ��|��&' (
where $� is the share of region “i” from the value of a given “x” variable, �� is the share of
region “i” from the value of a given “f” variable, Σ$�= 100 and Σ��= 100.
Spatial autocorrelation is a method for examining spatial interactions. It will be analyzed in
this method whether the spatial distribution of dates is random or it follows some regular
pattern (Dusek, 2004). Autocorrelation means that “high or low values for a random variable
tend to cluster in space (positive spatial autocorrelation), or locations tend to be surrounded by
neighbours with very dissimilar values (negative spatial autocorrelation)” (Anselin-Bera,
1998, p. 241).
The Moran I index (elaborated by Moran, 1950) is one of the most often used measurement
methods of spatial autocorrelation. The index can be calculated with the help of the following
equation:
) = * +∑ ��,- ∗ ∑ ∑.$� − $/0 ∗ �$, − $/� ∗ ��,∑.$� − $/0(
where is ��, the matrix of neighbourhood connections, and N the number of territories. When
) > 2'+2' then there is positive; when ) < 2'
+2' there is a negative spatial autocorrelation, and
when ) = 2'+2' there is no autocorrelation among the territories (Dusek, 2004).

Szendi, D.
48
The Local Moran I index is the local measure of spatial autocorrelation; it gives an exact
value for each of the examined territories. The negative values of the index show negative
while the positive values indicate positive spatial autocorrelation. It also draws up where the
high and low values are concentrating in space (hot and cold spots) and where are the so-
called spatial outliers (Tóth-Nagy, 2013).
In the literature, it is well-known that the correct choice of the spatial weights’ matrix is
critical (Harris-Kravtsova, 2009). It expresses the assumed spatial structure of variables in the
model (Gerkman – Ahlgren, 2011, p. 1). According to Bhattacharjee and Jensen-Butler (2013,
p. 618): “the choice of weights is frequently arbitrary, there is substantial uncertainty
regarding the choice, and empirical results vary considerably according to the choice of
spatial weights.”
Several methods in the literature define the spatial weights matrix. The simplest matrix is
when the neighbouring territories are marked with 1, and the territories which are not
neighbours of each other are marked with 0. It contains less distortion when we use row-
standardized matrices, where the sum of values in a row is equal to 1 (Nemes Nagy, 2005).
By the analysis of grids, two types of matrices can be defined: rook and queen contiguity. The
basic difference between these is that by rook contiguity the territories are sharing common
borders, while by the queen contiguity beside the common borders also common points are
permitted as neighbourhood criteria.
There are also other methods to define neighbourhood connections, like the threshold
distance, or nearest neighbour method, or the Euclidean distance based methods. In the
practice the most commonly used methods are the queen contiguity (38%), then the distance
based methods (29%), after the combination of these two (14%), and other methods, like the
nearest neighbour method (Abreu et al. 2005).
Data
In my research, I have made the analysis for 2014, which was the latest year where I had all of
the dates available. By the analyses, my basic data sources were the data base of the
Hungarian Central Statistical Office, the dates of the Unified Monitoring Information System,
and the dates of the National Regional Development and Spatial Planning Information
System. The sources of the applied data can be seen in a more detailed way on the following
Table 1.

Szendi, D.
49
Table 1 Applied data sources of the analysis
Indicator Measure Data source
Taxable income per capita/ per employee
HUF/capita
Hungarian Central Statistical Office: Dissemination database
National Regional Development and Spatial Planning Information System
Obtained EU support per capita HUF/capita
Unified Monitoring Information System – National Development Agency, Hungary
palyazat.gov.hu
Population number of inhabitants
Hungarian Central Statistical Office
Source: own compilation
RESULTS
Spatial distribution of the indicators
In this recent research, I have analyzed the spatial distribution of the taxable income per
capita and the obtained EU support per capita among the settlements of the Northern
Hungarian region. According to the results a statement can be made that in the case of the
incomes, the most developed territories can be found mainly in the central part of the region,
on the one hand along the path of the motorway and on the other hand in the county centres
and their agglomeration. In these areas, the per capita income is relatively high. Among the
county centres, Miskolc has outstanding position hence, in this case, is the most extensive the
highly developed circle around the city. This highly developed area reaches on the north to
Sajószentpéter, on the south to Harsány and Emőd, on the east to Szikszó and on the western
part to Répáshuta and Bükkszentkereszt (about almost 20-kilometre radius around the centre
of Miskolc). This area is in the case of Eger relatively smaller because it reaches on the north
to Felsőtárkány, on the south to Maklár, on the east to Noszvaj and on the western part to
Egerszólát (about 11.5-kilometre radius around the centre of Eger). The highly developed area
is the smallest in the case of Salgótarján, where only Karancsalja and Somoskőújfalu belong
to it (only 8-kilometre radius).
The highest income in the region can be identified in the following eight settlements:
Pálosvörösmart, Markaz, Szarvaskő, Teresztenye, Kistokaj, Sajószöged, Sajóörös and
Tiszaújváros, which common character is that not only the income of inhabitants is very high,
but also the employment rate. The situation of Teresztenye is somehow specific; hence it is a
very small village (it had only 28 inhabitants in 2014) in the micro-region of Cserehát, where
the extremely high income can be the result of good rural tourism activity. The settlement can
be from this aspect a good example in this relatively underdeveloped, peripheral area.

Szendi, D.
50
Figure 2 Distribution of the taxable income per capita (settlements of the Northern Hungarian region), 2014
Source: own compilation
The lowest income of the region can be observed in Gadna and Csenyéte villages, where
also the number of full-time employees among the population is the lowest (in both cases
below 20%). Besides these two small villages, the income is the lowest in the rural area of
Cserehát and Zemplén, 60% of the settlements with the lowest values can be found in these
territories. Also, Pénzes (2011, p. 186) has made a statement that there are several peripheral
settlements in the Cserehát micro-region, where this underdeveloped situation can be the
result of the many small villages existing in the area, of the aging society, of the relatively
high unemployment rate, and the increase of roma population.
In the case of the obtained EU supports there are more hot spots in the region as observed
by the income of settlements. There is a sum of 57 so-called upper outliers in the space where
the obtained amount of EU support is relatively high (emerging areas). Although the supports
are concentrating mainly in the cities, the small villages of Abod and Alsóregmec have
received the most EU grant in the region in per capita relation. The obtained amount was
18100 and 29978 thousand HUF per capita respectively. The reason for this can be that these
settlements have only 258 and 224 person population in 2014, but they have received some
big projects (Abod 6 and Alsóregmec 3). As a result of it, the support amount per capita is
very high.
In the region, the average amount of EU grants per capita reaches almost 575 700 HUF,
instead of the fact that there are 52 settlements in the Northern Hungarian region which did
not obtain EU support in the period.

Szendi, D.
51
Figure 3 Distribution of the EU supports per capita (settlements of the Northern Hungarian region), 2014
Source: own compilation
By the examination of the so-called special categories I could make a statement that the
small- and medium-sized cities have a significant role in the distribution of supports. 47 cities
from the summa 610 settlements (7.7%) got the 68.6% of all supports in the given time period
which shows an unequal distribution. The relatively lower absorption capacity of the
peripheral regions of Cserehát and Zemplén can be observed in the pattern of the supports;
hence almost 30% of the settlements with zero EU support belong to these areas. It is also
observable that the gained EU supports are not always concentrating in the biggest/most
populated cities; hence several smaller settlements got relatively high support amount per
capita (like Tiszadorogma, Tiszabábolna, Kisköre, Alsógagy, or Szakácsi). It would be also
notable to see, how many projects these settlements received, to compare the dates. I have
taken a closer look at this question for the Top 5; most supported settlements in the region,
which general character is that they are villages, with relatively low population numbers.
From the dates, I could identify that in two villages from the Top 5 (Alsóregmec and
Szakácsi) the number of supported projects is very low, 3 and 2 respectively. It means that
here the average support amount per project is relatively high: 1.271 billion and 0.589 billion
HUF. This amount is a bit lower in the case of the three remaining settlements from the Top
5, as here the number of projects is higher (Abod: 6; Hollókő and Bodroghalom: both 8
projects). The average support amounts per project are respectively 1.114 billion, 0.342 and
1.215 billion HUF. It is significant to mention that because of the qualitative differences of

Szendi, D.
52
EU grants the purely quantitative analysis is not always adequate to differentiate the
settlements’ situation, but in this recent research I did not deal with the qualitative aspects.
It is an interesting fact that there are some similarities in the ranking of settlements based
on their income level and EU grant absorption capacity (Table 2). Hence, four of the last ten
settlements in the ranking belong from both aspects into the worst, most underdeveloped
group. In these settlements, not only the income levels are very low, but also the
communities’ initiatives are not so effective, hence they could not get EU supports. In the
case of Gadna and Kiscsécs, the number of applied projects was zero in the period, while in
Bódvalenke and Csenyéte there were 1 and 2 project applications, but they did not receive any
support.
Table 2 Ranking of settlements based on their income level and EU support absorption capacity
Ranking based on the territorial income level
Ranking based on the obtained EU grants
No. Settlement Income
(HUF/capita) No. Settlement
EU grants (HUF/capita)
1 Sajóörös 2 863 236 1 Abod 29 978 283 2 Teresztenye 2 739 693 2 Alsóregmec 18 169 638 3 Markaz 2 682 870 3 Hollókő 7 772 160 4 Pálosvörösmart 2 603 557 4 Szakácsi 7 703 015 5 Tiszaújváros 2 557 807 5 Bodroghalom 6 883 414 6 Sajószöged 2 553 715 6 Füzér 6 742 653 7 Kistokaj 2 498 535 7 Demjén 6 495 474 8 Szarvaskő 2 493 445 8 Regéc 5 891 011 9 Visonta 2 422 040 9 Apc 5 702 187
10 Gyöngyössolymos 2 391 321 10 Jósvafő 5 333 879 … …
601 Terpes 743 646 601 Márkháza 0 602 Nyésta 741 019 602 Pere 0 603 Tornanádaska 737 848 603 Beret 0 604 Kiscsécs 734 856 604 Szászfa 0 605 Fáj 692 806 605 Pusztaradvány 0 606 Szakácsi 691 566 606 Pamlény 0 607 Bódvalenke 618 257 607 Kiscsécs 0 608 Felsőregmec 585 062 608 Bódvalenke 0 609 Gadna 564 607 609 Gadna 0 610 Csenyéte 403 973 610 Csenyéte 0 Source: own compilation
From the connection observed by the ranking of settlements, I have assumed that there
might be some relation/connection between the two indicators, that is why I have examined
the correlation between the settlements’ income and EU grants per capita. The results are
summarized in the following Table 3.

Szendi, D.
53
Table 3 Correlation of income and EU grants
Hungary LAU1
Gained EU grants per capita
Income per capita
Pearson Correlation -0.208**
Sig. (2-tailed) 0.006
N 175
Northern Hungarian region LAU2
Gained EU grants per capita
Income per capita
Pearson Correlation 0.21
Sig. (2-tailed) 0.599
N 610
**. Correlation is significant at the 0.01 level (2-tailed). Source: own compilation
In the Hungarian micro regional level there is a significant, but weak negative correlation
between the income per capita and the gained EU grants, at the same time this is not
significant in the case of the Northern Hungarian region’s settlements. I have taken a closer
look at the “special categories” and have seen that in the case of the small- and medium-sized
cities there is also a negative correlation between the two indicators (-0.116), and it was also
non-significant. By the settlements of the most disadvantaged areas there was a significant but
very weak negative correlation between the indicators (-0.009*), so in this case, there might
be some connection between the income and EU grants.
I have also examined the territorial inequality indices in the region to see what kind of
differences can be observed by the two indicators. I have calculated the Dual indicator and the
Hoover index of 2013.
a) By the Dual indicator there is a 1.472-fold difference between the average of the
more developed (income is higher than the mean) and less developed (income is
lower than the mean) territories in case of income. This ratio is even higher by the
EU grants, hence an 11.084-fold difference can be observed among the
settlements.
b) This tendency can be noticed also by the analysis of the Hoover index, which value
is 8.83 by the income per capita and 34.2 in the case of gained EU grants. It means
that by the EU supports, 34.2% of all supports would have to be redistributed from
the more developed to the least developed areas to achieve a state of perfect
equality.

Szendi, D.
54
So the above-examined values of inequality measures have shown a greater gap among the
settlements based on their EU supports.
Spatial autocorrelation
I have also analyzed the role of spatial interactions in the Northern Hungarian region to see
whether the spatial autocorrelation has significance in the distribution of indicators. I have
made the examination with the use of two different neighbourhood matrices to prove the
validity of the analysis: the queen-contiguity and the nearest neighbours’ method (with six
neighbours). I have made both calculations with 999 permutations to eliminate the random
error, and have tested the methods of LISA. By the exact analysis, I have focused on the
results of the 6 nearest neighbours’ matrix.
Table 4 Local Moran clusters of income and EU grants
income per capita EU grants per capita
queen contiguity nearest neighbours
method (6) queen contiguity
nearest neighbours method (6)
Moran I 0.333748 0.318045 0.04491 0.053027 pseudo-p value 0.001 0.001 0.021 0.018
z score 13.7783 14.1122 2.1682 2.8926 Local Moran
clusters HH: 76; LL: 56; LH: 17; HL: 14.
HH: 70; LL: 63; LH: 17; HL: 24.
HH: 15; LL: 33; LH: 25; HL: 4.
HH: 32; LL: 48; LH: 18; HL: 16.
Note: HH – high-high; LL – low-low; LH – low-high; HL – high-low. Source: own compilation
Based on the model values, there is a weak, positive and significant spatial autocorrelation
among the Northern Hungarian region’s settlements in the case of the income, so the high-
and low-income values are clustering in the space.
Taking a closer look at the Local Moran clusters of the income per capita, I could identify
that the elements of the High-high cluster are clustering mainly in the central zone of the
region, along the path of the M3 motorway, while the members of the Low-low cluster are
grouping principally in the northern and north-eastern periphery of the region (Figure 4). 63%
of the settlements in the Cserehát and Zemplén micro-region belong to this cluster (mainly in
the districts of Cigánd, Gönc, Encs, Szikszó and Edelény).

Szendi, D.
55
Figure 4 Local Moran clusters of income per capita, Northern Hungarian region, 2014.
Source: own compilation
The parts of the High-low and Low-high cluster are concentrating mainly in the peripheries
of the High-high and Low-low clusters. Some members of the High-low cluster are emerging
areas like Edelény, Homrogd, Alsóregmec, Szécsény or Hevesvezekény, while members of
the Low-high cluster are settlements with relatively lower-income than their neighbours, like
Aggtelek, Sajókaza, Kesznyéten, Egerbakta or Parád.
In the case of the EU grants, the spatial autocorrelation is also significant but relatively
weaker than observed by the income. So here the neighbourhood connections have a smaller
effect on the dispersion of dates.
According to the comparison of the Local Moran patterns, there is a great similarity among
the clusters of income and EU supports, hence the 93.48% of the small- and medium-sized
cities can be ruled into the same cluster according to both indicators (mainly to the High-high
cluster), while in the case of the most disadvantaged areas’ settlements 96.16% of the
territories belong to the same group according both indicators (basically to the Low-low, or
High-low cluster). So, the differences between the most and least developed territories
observed by the income per capita can be verified also in the case of gained EU supports,
hence the areas characterized by small villages and aging societies in Zemplén and Cserehát
have relatively low absorption capacity, which strengthens their peripheral situation.
The above-mentioned similarity of Local Moran clusters can be seen in the case of small-
and medium-sized cities on the following Table 5 in a more detailed way. There are only three
cities where the cluster membership or the spatial autocorrelation’s significance differ from
each other regarding the income and EU supports, and the remaining 93.48% of the region’s

Szendi, D.
56
cities belong to the same class by both indicators. The three outlier cities’ situation is as
follows: Mezőkövesd and Tiszaújváros: there is no significant local autocorrelation by the
income, but by the EU supports they can be grouped into the High-high cluster, so these two
cities and their neighbours also have very successful application activity. The case of Cigánd
is a little different. In this city, the income’s spatial autocorrelation is also non-significant, but
based on the EU support it belongs to the High-low cluster; because its application activity is
quite good (83 project applications, from which 43 successful). With this success ratio,
Cigánd can emerge from its neighbourhood.
Table 5 Similarity of Local Moran clusters by the small- and medium-sized cities
City Clusters of
income Clusters of EU support
City Clusters of
income Clusters of EU
support Abaújszántó
Miskolc
Alsózsolca
Nyékládháza HH HH
Balassagyarmat
Onga
Bátonyterenye
Ózd
Bélapátfalva
Pálháza
Borsodnádasd
Pásztó
Cigánd
HL Pétervására
Edelény HL HL Putnok
Eger HH HH Rétság
Emőd
Rudabánya
Encs
Sajóbábony
Felsőzsolca HH HH Sajószentpéter
Füzesabony
Salgótarján
Gönc
Sárospatak
Gyöngyös HH HH Sátoraljaújhely
Gyöngyöspata HH HH Szécsény HL HL
Hatvan HH HH Szendrő LL LL
Heves
Szerencs
Kazincbarcika
Szikszó
Kisköre
Tiszaújváros HH
Lőrinci HH HH Tokaj
Mezőcsát
Verpelét HH HH
Mezőkeresztes HH HH
Mezőkövesd
HH Source: own compilation
Starting from the results of the Local Moran patterns I have computed the so-called
conditional maps in the case of the Northern Hungarian region which can describe and
compare graphically the dispersion of variables with the use of a coordinate system. “The

Szendi, D.
57
purpose of conditioning is to assess the extent to which there is a suggestion of systematic
differences in the variable distribution among the sub-regions.” (Anselin, 2005, p. 91). A
conditional map consists of 9 micro maps; each computed for a subset of the observations.
Three intervals for each variable define the subsets (Anselin, 2005, p.70).
In the case of this recent research, the horizontal axis contains the income per capita dates
and the vertical axis the gained support amount per capita. The category variable is the
population size of a given settlement, which determines the territories’ clusters
(Figure 5).
Figure 5 Conditional map of variables (2014)
Source: own compilation
At the first overview of the maps, it is observable that the bigger cities can be found mainly
in the cluster, where both the income per capita and the gained support amount is the highest
(right upper group); all county centres (Miskolc, Eger, and Salgótarján) can be found in this
class. The small- and medium-sized cities are concentrating most of the cases also in this
cluster or in that where the income is about the average of the region, but the support amount
reaches the highest level (central upper group). There are only some exceptions from small-
and medium-sized cities which are not members of these two clusters like Sajószentpéter and
Putnok (members of the cluster where the income and the support amount are also average –
central group), or Emőd and Tiszaújváros (members of the right central cluster where the
income level belongs to the highest class but the support amount is about the average).

Szendi, D.
58
66% of the settlements of the most disadvantaged areas belong to the clusters where the
gained EU support per capita varies from the lowest to the highest level, but their income
level is relatively low (left three clusters). There are only a few settlements of this special
category where the gained support amount reaches the highest levels and common character
of these is that they have bigger population size. Only some small villages of the most
disadvantaged areas could reach high support amounts (like Lak, Felsővadász, Nagyrozvágy,
Krasznokvajda or Abaújlak which have on the average 6-7 supported projects).
SUMMARY
In this recent research, I have analyzed the territorial differences of the per capita income and
the gained EU supports in the Northern Hungarian region, to see what kind of differences or
inequalities can be verified in these indicators.
Regarding the results, the existence of territorial inequalities is a significant problem also
in the case of Hungary with special regards on the settlements of the Northern Hungarian
region. The Local Moran clusters forming through the analysis of EU supports and income
per capita show significant similarity, 93.48% of the small- and medium-sized cities, and
96.16% of the settlements of the most disadvantaged areas can be grouped into the same
cluster according to both indicators. I could state that in the areas with significant spatial
autocorrelation most of the cities can be grouped into the High-high cluster, while the greatest
part of the settlements of the most disadvantaged areas belongs to the Low-low or High-low
clusters.
So, the difference of the incomes can be observed also in the level of EU supports, the
territories of Cserehát and Zemplén characterized by small villages, and aging population
have relatively weak absorption capacity, which strengthens their peripheral situation. The EU
supports’ distribution is unequal also in the city-rural dimension in the Northern Hungarian
region, hence 47 cities of the sum 610 settlements got the 68.6% of area’s EU support in the
given time period.
REFERENCES
Abreu, M., De Groot H. L. F., & Florax, R. J. G. M. (2005). "Space and Growth: A Survey of Empirical Evidence and Methods." Tinbergen Institute Discussion Paper, No. 04-129/3.
Anselin, L. (1999). Spatial econometrics. In B. Baltagi (Ed.), Companion in theoretical econometrics (pp. 310-330). Oxford: Basil Blackwell.
Anselin, L. (2005). Exploring Spatial Data with GeoDaTM: A Workbook. University of Illinois: Center for Spatially Integrated Social Science.

Szendi, D.
59
Anselin, L., & Bera, A. K. (1998). Spatial dependence in Linear Regression Models with an Introduction to Spatial Econometrics. Statistics textbooks and monographs, 155, 237-290.
Barro, R. J. (1991). Economic Growth in a Cross Section of Countries. The Quarterly Journal of Economics, MIT Press, 106(2), 407-43.
Barro, R. J., & Sala-i-Martin, X. (1992). Convergence. Journal of Political Economy, 100(2), 223- 251.
Benedek, J., & Kocziszky, Gy. (2013). Bevezetés a regionális politikába. [Introduction to regional policy.] Miskolc: Miskolci Egyetemi Kiadó.
Benedek, J., & Kurkó, I. (2011). Evolution and Characteristics of Territorial Economic Disparities in Romania. Theory Methodology and Practice, 7(1), 5-15.
Bhattacharjee, A., & Jensen-Butler, Ch. (2013). Estimation of the spatial weights matrix under structural constraints. Regional Science and Urban Economics, 43(4), 617–634.
Capello, R. (2007). Regional economics. Routledge, Taylor and Francis group. Domar, E. D. (1946). Capital Expansion, Rate of Growth, and Employment. Econometrica,
14(2), 137-147. Dusek, T. (2004). A területi elemzések alapjai. [Basics of spatial analysis.] Regionális
tudományi tanulmányok 10. Budapest: ELTE Regionális Földrajzi Tanszék, MTA-ELTE Regionális Tudományi Kutatócsoport.
European Commission (2016). Eurostat regional yearbook 2016. Luxembourg: Publications Office of the European Union.
Gerkman, L., & Ahlgren, N. (2011). Practical Proposals for Specifying k-Nearest Neighbours Weights Matrices. Hanken School of Economics, Working Papers 555.
Harris, R., & Kravtsova, V. (2009). In Search of ’W’. SERC: Discussion Paper 17. Harrod, R. F. (1939). An Essay in Dynamic Theory. The Economic Journal, 49(193), 14-33. Jakobi, Á. (2011). Examining Neighbourhood Effects in Regional Inequalities of Hungary: A
GIS-based approach from topological relations to neighbourhood heterogenity. Romanian Review of Regional Studies, VII.(1), 53-62.
Kertész, K. (2003). Felzárkóznak-e a kevésbé fejlett országok az Európai Unióban…? [Can the less developed contries converge in the European Union?] Budapest: ICEG Európai Központ, Nr. 5.
Krugman, P. (1999). The Role of Geography in Development. International Regional Science Review, 22, 142-161.
Mankiw, N. G., Romer, D., & Weil, D. N. (1992). A Contribution to the Empirics of Economic Growth. The Quarterly Journal of Economics, MIT Press, 107(2), 407-437.
Moran, P. A. P. (1950). Notes on continuous stochastic phenomena Biometrika, 37. 17-23. Nagyné Molnár, M. (2007). A területi egyenlőtlenségek főbb összefüggései. [Main
connections of territorial inequalities.] In J. Káposzta (Ed.), Regionális gazdaságtan (pp. 166-205). Debrecen: Debreceni Egyetemi Kiadó.
Nemes Nagy, J. (1990). Területi egyenlőtlenségek dimenziói. [Dimensions of territorial inequalities.] Tér és Társadalom, 4(2), 15-30.
Nemes Nagy, J. (2005). Regionális elemzési módszerek. [Regional anaysis methods.] Regionális tudományi tanulmányok 11. Budapest: ELTE Regionális Földrajzi Tanszék, MTA-ELTE Regionális Tudományi Kutatócsoport.
Pénzes, J. (2011). Északkelet-Magyarország jövedelmi térszerkezetének változásai a rendszerváltás után. [Changes in the Spatial Income Structure of North-eastern Hungary After the Change of Regime.] Területi Statisztika, 14(2), 181-193.
Quah, D. T. (1996). Empirics for economic growth and convergence. European Economic Review, 40, 1353–1375.

Szendi, D.
60
Romer, P. M. (1994). The Origins of Endogenous Growth. Journal of Economic Perspectives, American Economic Association, 8(1), 3-22.
Sala-i-Martin, X. (1995). The classical approach to convergence analysis. Economics Working Papers 117, Barcelona: Universitat Pompeu Fabra, Department of Economics and Business.
Szendi, D. (2015a). Differences in the spatial patterns of selected German (NUTS3) economic factors, with special regards on GDP, unemployment and enterprises. Miskolc: MicroCad Conference Paper.
Szendi, D. (2015b). A lokális humán fejlettségi index eloszlása és területi autokorrelációja Németország és Magyarország esetében. [Distribution and spatial autocorrelation of the local HDI in Germany and Hungary.] Területi Statisztika, 55(6), 556-591.
Szendi, D. (2016). Perifériák felzárkózásának esélyei, különös tekintettel Kelet-Közép-Európa két térségére. [Convergence chances of peripheral regions, with special regards on two territories from East-Central Europe.] Miskolc: Miskolci Egyetem, Vállalkozáselmélet és gyakorlat Doktori Iskola, PhD disszertáció.
Tóth, G., & Nagy, Z. (2013). Eltérő vagy azonos fejlődési pályák? A hazai nagyvárosok és térségek összehasonlító vizsgálata. [Different or similar development pathes? Comparative analysis of the national big cities and areas.] Területi Statisztika, 53(6), 593–612.
UN (2015). Inequality Measurement. United Nations: Development Issues No. 2.

DETUROPE – THE CENTRAL EUROPEAN JOURNAL OF REGIONAL DEVELOPMENT AND TOURISM Vol. 9 Issue 3 2017 ISSN 1821-2506
61
Original scientific paper
SPATIAL IMBALANCES IN THE UNITED KINGDOM AFTER THE
MILLENNIUM: A FOCUS ON THE CITIES
Zsuzsanna ZSIBÓKa
a Research fellow. Hungarian Academy of Sciences Centre for Economic and Regional Studies Institute for Regional Studies. [email protected] Cite this article: Zsibók, Z. (2017). Spatial imbalances in the United Kingdom after the Millennium: a focus on the cities. Deturope, 9(3):61-84.
Abstract
During the recovery after the economic crisis, much academic and policy attention was diverted to the role of cities as growth hubs all over Europe and the world. Significant economic disparities are a long-standing problem for the United Kingdom as a whole, which have been growing for decades and are remarkably high among the most developed OECD and EU countries. To investigate recent spatial processes, the methodology of our research relies on comparative spatial data analysis and literature review. Our analyses will cover the issue of a spatially more balanced development based on the “northern powerhouse” initiative which builds upon the collective strength of the cities in the North. Addressing the ‘national’ problem of regional inequalities, spatial rebalancing is assumed to be inevitable, especially in the light of the new economic and regional challenges posed by the Brexit decision. Keywords: regional inequalities, cities, metropolitan areas, United Kingdom
INTRODUCTION
Cities are often described as engines of economic growth in political rhetoric, economic
policy debates and popular press, and therefore, there is an increased interest in the economic
role of the cities (Hildreth and Bailey, 2013). The United Kingdom is a relatively developed
nation amongst the member states of the European Union,1 but regional inequalities are a
long-standing phenomenon: they have been present since the industrial development with
swinging intensity (Zsibók, 2017). The development gap seems to steadily widen since the
1980s (Marshall, 1990, Gudgin and Schofield, 1993, Gardiner et al., 2013), particularly, the
extent and the trends of spatial disparities are now considered to be a ‘national problem’ in the
United Kingdom, and deserve special policy attention (McCann, 2016). Place-based, local
growth oriented policy approaches shifted the focus on the cities to solve this problem
(Hildreth and Bailey, 2013).
1 According to EuroStat data, its per capita GDP was around 130 per cent of the EU average between 2000 and 2014, but it deteriorated a lot during and after the financial and economic crisis (from 146 per cent to 127 per cent).

Zsibók, Z.
62
There has long been a debate whether there is a trade-off between spatial disparities and
national growth in an economy, that is, whether policies seeking to reduce regional economic
inequality hinder national growth or not (Martin, 2008, Dijkstra, 2013). The theoretical bases
of the New Economic Geography imply that uneven geographical development may create
higher rates of national growth through the spatial agglomeration of economic activities and
the increasing returns effects (Gardiner et al. 2013). This approach favours the spatial
concentration of investments into the core regions. Although this line of reasoning is deeply
present in current policy thinking, several research efforts questioned its actual relevance
(Dijkstra, 2013). Martin (2008) emphasises the need for a detailed and intensive research to
ascertain whether and to what extent spatial agglomeration increases local and national
economic growth. All in all, different courses of economic policy placed different emphasis
on promoting a regionally balanced economic growth in the UK. Gardiner et al. (2013) argue
that spatially unbalanced development and growth may bias or even compromise national
economic policy, which was the case in the UK during and after the economic crisis in the
second half of the 2000’s. The Brexit process poses further challenges for the national
economy through the weakening of economic (trade) linkages with the Continent and losing
EU supports, therefore highlights policy attention towards the catching-up of less buoyant
regions.2
In this paper we intend to examine that to what extent the UK’s economy is imbalanced
and how the position of the metropolitan areas changed after the Millennium. The empirical
analysis will be completed at a fairly aggregated, regional level. In the second section we
outline the two main features of the United Kingdom’s regional problem, the North-South
divide and London’s overly dominance. The third section focuses on the empirical findings
concerning the cities in the North and the South of the UK and highlights some opportunities
for rebalancing the UK’s economy. Then, the last section summarises our findings.
The regional problem of the United Kingdom
Spatial economic imbalance in the UK is a long-standing problem and it appears in several
aspects: in addition to spatial disparities, there is a sectoral imbalance, since the UK economy
as a whole is over-dependent on financial services, and in certain parts of the nation,
employment is largely based on the public sector, and there is also an imbalance in the
allocation of power, resources and responsibilities between the centre (Whitehall) and the rest
of the country, such as the cities or regions (HM Government, 2010, Hildreth and Bailey,
2 The website of the Regional Studies Association presents rich information content on the regional issues of the Brexit process: http://brexit.regionalstudies.org/.

Zsibók, Z.
63
2013, Gardiner et al. 2013). Two important features of the ‘regional problem’ are the well-
known North-South divide and the excessive dominance of London and the South East. Over
the past few decades there have been a gradual shift in the balance of population and
economic activity towards the southern part of mainland Britain (Rowthorn, 2010). Both the
differential regional impacts of globalisation processes and the unusual extent of governance
centralisation contributed to the phenomenon that McCann (2016) depicts as the UK’s
interregional decoupling, dislocating and disconnecting. Actually, the UK can be considered
to consist of three different economies: London and its hinterland (South East, East of
England and South West), Scotland and the rest (McCann, 2016).
The North-South divide
The UK obviously has a two-speed economy which is prevalent even after the economic crisis
(Zsibók, 2017). The concept of the North-South divide is present in current economic policy
debates in the UK and it has deep historical roots (Baker and Billinge 2004). Regional
disparities in economic and social conditions have been a persistent feature of the UK since
the middle of the 19th century (Martin et al 2015). Gardiner et al. (2013) highlights the role of
distinctive regional patterns of industrial specialization and that at the end of the 19th century,
the northern industrial regions tended to have the most unstable economies and most frequent
periods of high unemployment as a consequence of their dependence on export trade. The
South has suffered less from the decline of manufacturing and mining employment (the ‘old
economy’) and it has gained a much greater share of the new jobs in some dynamic areas,
such as financial and business services (the ‘new economy’) (Rowthorn, 2010, Gardiner et al.,
2013). Proximity to the sources of raw materials is no longer a crucial locational factor for
industry; instead, the immense pool of creativity and talent are the ones that matter the most
(Osborne, 2014).
To characterize the UK economy with the North-South divide is, certainly, a
simplification, but in broad terms, the divergence between the two major areas is undeniable
(Martin et al. 2015). Gardiner et al. (2013) presents that in some cases, the existence of a
North-South divide is questioned, since local areas of economic depression and deprivation
can be found in the South, while areas of growth and prosperity can be found in the North. Of
course, the picture is more complex at the local level than it is at the regional scale, even
London has some areas of high unemployment and poverty (Hackney and Tower Hamlets,
just to mention two of them). However, the basic argument behind the North-South divide is
that the South as a whole has been more dynamic than the North in recent decades. As a

Zsibók, Z.
64
consequence, employment and incomes in the North are boosted by fiscal transfers from the
South which makes the North especially vulnerable to fiscal austerity measures, whereas the
South is even more vulnerable to higher taxes (Rowthorn, 2010).
According to the classification of Gardiner et al. (2013) the North consists of the following
regions: West Midlands, Wales, Yorkshire and the Humber, North West, North East and
Scotland, while the South consists of London, South East, South West, East of England and
East Midlands (see Fig 1). Geographically, the dividing line is usually drawn between the
Wash and the Severn Estuary. The concentration of the economic potential in the South East
is constantly increasing, which is illustrated by the fact that Gudgin and Schofield (1993)
classified the whole Midlands in the ‘South’ and considered that the economic problems of
the West Midlands had been only temporary. As the UK’s economy has “gone South”
(McCann 2016 p. xxvii), West Midlands have lost its position of being part of the prosperous
South, and, in some aspects, the East Midlands’ situation is also ambiguous now.
Figure 1 The regions of the “North” and the “South” in the United Kingdom
Source: Author’s elaboration based on Gardiner et al. (2013)
In the following paragraphs, we investigate the North-South divide through some basic
economic indicators, the per capita GDP series, the employment and the unemployment data

Zsibók, Z.
65
provided by EuroStat. Table 1 presents the NUTS 1 level per capita GDP relative to the
national average, employment rates and unemployment rates after the Millennium.
Table 1 Average per capita GDP, employment rates and unemployment rates between 2000 and 2015 in the United Kingdom at the NUTS 1 level
NUTS Code NUTS Name
Per capita GDP (UK =
100)* Employment
rate, % Unemployment
rate, %
UKC North East 73.58 66.18 7.96 UKD North West 85.16 69.07 6.26 UKE Yorkshire-Humber 82.09 69.73 6.59 UKF East Midlands 82.38 72.23 5.63 UKG West Midlands 82.91 69.45 6.82 UKH East of England 94.93 74.71 4.84 UKI London 163.35 68.48 7.51 UKJ South East 108.30 75.58 4.56 UKK South West 89.92 74.70 4.48 UKL Wales 70.85 67.67 6.32 UKM Scotland 92.05 71.16 6.31 UKN Northern Ireland 78.93 65.50 5.85
UK United Kingdom 100.00 71.03 5.99 * Per capita GDP data are available between 2000 and 2014 Source: Author’s elaboration based on EuroStat data.
In most of the regions, the evolution of the regional per capita GDP was more or less stable
in time over the period between 2000 and 2014 in relation to the national average, but there
are also some exceptions. London constantly advanced (from 163 to 171 per cent)3, and also,
the North East, the North West and Scotland improved their position with around 2 to 3
percentage points.4 The largest deterioration was observed in the West Midlands (from 87 to
80.5 per cent), in Northern Ireland (from 80 to 75 per cent) and in the East of England (from
97 to 92 per cent). As Martin (2015) states, the long boom between the early-1990s and 2007
reinforced regional inequalities. And so did the financial and economic crisis after 2008. In
the UK, spatially unbalanced growth is recognized politically both as having contributed to
the economic crisis and also as a hindrance to future economic stability (Martin 2015). The
coefficient of variation regarding the relative per capita GDP at the NUTS 1 level is around
30 per cent and around 70 per cent at the NUTS 2 level, while it has an increasing trend,
implying a cross-sectional divergence.
As expected, the picture is more mixed at a more disaggregated level regarding the average
per capita GDP between 2000 and 2014. At an average, these values range between 62 per 3 Nevertheless, there have been significant internal inequalities at the NUTS 2 level. 4 Especially, North Eastern Scotland improved a lot from 117.5 per cent in 2000 to 150 per cent in 2014, while the other two NUTS 2 regions of Scotland nearly stagnated.

Zsibók, Z.
66
cent (West Wales and the Valleys) and 464 per cent (Inner London – West)5 of the national
average. Out of the 40 regions at the NUTS 2 level, only ten regions have a per capita GDP
above the national average, and two of them can be found in the ‘North’ (North Eastern
Scotland, 133 per cent and Cheshire, 111 per cent).
Employment data firmly supports the North-South region classification of Gardiner et al.
(2013) depicted above. Typically, the South East, the South West, the East of England, East
Midlands and Scotland are above the national average (71 per cent) employment rate, while
London is, at an average, significantly below this level (Fig. 2). The economic and financial
crisis resulted in a 2 percentage points’ drop in the average employment rate by 2011,
however, the indicator recovered to nearly 73 per cent by 2015 and it is permanently
increasing since 2012. The relative position of the regions at the NUTS 1 level has not
changed much after the crisis, excepting Scotland, which improved a lot from 68.5 per cent in
2000 to 73.4 per cent in 2015 (Zsibók, 2017)6.
Figure 2 The evolution of the employment rates between 2000 and 2015 in the United Kingdom
Source: Author’s elaboration based on EuroStat data.
5 The average value for Inner London is 316.26 per cent and computed as the average of Inner London West (=464.22 per cent) and Inner London East (=168.29 per cent). The average value of Outer London is 92.69 per cent which is computed as the average of Outer London East and North East (=75.00 per cent), Outer London South (=92.87 per cent) and Outer London West and North West (=110.19 per cent). 6 The highest employment rate was measured in North Eastern Scotland (77.2 per cent) and in the Highlands and Islands region (74.6 per cent), while Eastern Scotland (72.5 per cent) and South Western Scotland (67.9 per cent) have lower rates.

Zsibók, Z.
67
Concerning unemployment rates, spatial differences have been relatively high in the
regions of the United Kingdom after the Millennium, though they decreased until the
economic crisis, and have increased again during the recovery phase (see Table 2). The worst
performing NUTS 2 regions are the North East, London, West Midlands and Yorkshire and
the Humber, while the lowest average unemployment rates were measured in the South West
and South East. During the economic crisis, the regions of both the South and the North were
hit by the job losses in the industry. In broad terms, the South was able to restore its labour
market relatively soon, but since incomes and employment in the North are largely dependent
on the public sector, the austerity measures during the recovery hindered the catching-up in
these regions. According to Rowthorn (2010), London’s labour market is characterised by a
large surplus of unqualified workers which reflect the consequences of its industrial past and
international migration. Although the growth of the ‘new economy’ resulted in extra demand
for labour in certain sectors, it was not able to counterbalance the huge loss of manufacturing
and related jobs (Rowthorn, 2010). This means that London’s economy is not exempt from
structural problems which contribute to a continued internal social polarisation.
Table 2 Unemployment rates in the United Kingdom between 2001 and 2015 at the NUTS 1 level
NUTS name 2001 2003 2005 2007 2009 2011 2013 2015
London 5.8 6.6 7.0 6.8 9.0 9.8 8.6 6.2 South East 2.9 3.7 3.8 4.4 5.8 6.0 5.8 4.0 South West 3.5 3.6 3.6 3.8 6.1 6.3 6.1 3.9 East of England 3.5 3.8 3.9 4.6 6.2 6.6 6 4.2 East Midlands 4.8 3.9 4.3 5.2 7.1 7.9 7.3 4.6
West Midlands 4.9 5.5 4.7 6.2 9.6 9.0 9.1 5.8 North East 7.4 6.5 6.1 6.1 9.1 10.7 10 8.0 North West 5.0 4.7 4.6 5.8 8.3 8.4 8 5.4 Yorkshire-Humber 4.7 5.3 4.7 5.5 8.5 9.3 8.7 6.2 Wales 5.5 4.4 4.5 5.2 8.0 8.6 7.6 5.9 Scotland 5.7 5.3 5.3 4.7 6.9 8.0 7.2 5.7 Northern Ireland 6.1 5.2 4.7 3.8 6.4 7.2 7.5 6.1
United Kingdom 4.7 4.8 4.8 5.3 7.5 8.0 7.5 5.3 Source: Author’s elaboration based on EuroStat data.
The most notable feature of the North-South divide is the productivity gap. During the
recovery after the financial and economic crisis, the UK were not able to solve the
productivity puzzle, that is, the persistently stagnant productivity performance. Many of the
UK cities are less productive than their European counterparts (Bessis, 2016). According to
The Northern Powerhouse Independent Economic Review (SQW, 2016), the performance gap

Zsibók, Z.
68
is mainly driven by the skills gap, which influences both productivity and the employment
rate. The widening of the gap between North and South can be attributable to the outmigration
of skilled workforce from northern areas in search of better job opportunities. The review
considers other causes behind the performance gap such as underinvestment, low enterprise
rates, a lack of agglomeration and poor connectivity. In contrast to the expectations, the
review states that the North’s sectoral mix accounts for very little of the productivity gap.
Also unexpected is the fact that in the Northern regions, even cities cannot realize
productivity premiums (McCann, 2016).
The ‘London problem’
London’s dominance over the rest of the country, in other words, the issue of ‘London versus
the rest’ attracts much attention in recent public discourses.7 The ‘London problem’ highlights
the question that how much the other parts of the UK benefits from the prosperity of the
capital city, and whether the concentration of increasing public and private resources in
London have any beneficial spillover effect outside the Southeastern corner of the country vis-
à-vis a more even allocation of resources (see the contrasting views in, for example, Overman,
2013 and McCann, 2016).
Table 3 Population, employment and GDP of the NUTS 1 regions in the United Kingdom, 2014
Population Employment GDP
1000 people Share
Yearly growth
rate, 2000-14
1000 people Share
Yearly growth
rate, 2000-14
Million euros Share
Yearly growth
rate, 2000-14
North East 2 614.8 4.06% 0.19% 1 143.3 3.87% 0.67% 66 700 3.00% 1.75%
North West 7 120.4 11.06% 0.36% 3 143.8 10.64% 0.37% 209 557 9.43% 1.58% Yorkshire-Humber 5 356.7 8.32% 0.55% 2 408.7 8.15% 0.62% 148 869 6.70% 1.36%
East Midlands 4 614.0 7.17% 0.74% 2 132.9 7.22% 0.60% 133 084 5.99% 1.35%
West Midlands 5 691.3 8.84% 0.55% 2 478.4 8.38% 0.40% 160 458 7.22% 0.87%
East of England 5 981.7 9.30% 0.79% 2 819.3 9.54% 0.68% 194 081 8.73% 1.06%
London 8 477.3 13.17% 1.18% 4 157.1 14.06% 1.54% 509 402 22.91% 1.79%
South East 8 828.3 13.72% 0.73% 4 170.2 14.11% 0.43% 335 161 15.07% 1.29%
South West 5 396.7 8.39% 0.69% 2 488.4 8.42% 0.60% 169 288 7.61% 1.48%
Wales 3 095.1 4.81% 0.46% 1 320.3 4.47% 0.65% 75 976 3.42% 1.42%
Scotland 5 337.5 8.29% 0.37% 2 509.7 8.49% 0.75% 172 744 7.77% 1.67%
Northern Ireland 1 837.3 2.86% 0.64% 787.6 2.66% 1.27% 48 078 2.16% 0.91%
United Kingdom 64 351.2 100.00% 0.65% 29 559.7 100.00% 0.70% 2 223 398 100.00% 1.43% Source: Author’s calculation based on EuroStat data.
7 See, for example the „Mind the gap” BBC television programme broadcast in 2014.

Zsibók, Z.
69
After the recession, London and the South East hold more than a quarter of the population
and the employment, and 38 per cent of the GDP of the whole UK (Table 3). Back in the
middle of the previous century, the Barlow Report (Report of the Barlow Commission on the
Distribution of the Industrial Population, 1940) raised concerns that the concentration of
economic activity and growth in London and the South East could lead to problems of
congestion, urban sprawl and inflation. The report proposed a recommendation which would
actively intervene in the spatial allocation of economic potential, investments and
employment between the different parts of the nation. The Commission argued that the
control of London’s growth was necessary to reduce the disparities between North and South,
and that measures should be taken to (re)locate fast growing industries to the slow growing
regions. Contesting this position, Martin (2015) argues that there is not some fixed amount of
economic growth or activity that has to be distributed across the national economy through
holding back prosperous areas in order to promote activity in the less prosperous cities and
regions. Actually, the major shortcomings arise in the governance system (see also McCann,
2016). In order to ensure that the less prosperous areas are able to realize their full economic
potential, proper and fair access to the public and private resources are needed for them
(Martin, 2015). However, the cities and regions outside London feel that the national policy is
London-centric and ignores their needs and conditions (Wilcox et al. 2014). Some kind of
relocation ideas appeared at higher governmental levels, though, which view public sector
employment as a device for promoting economic development in lagging regions: the review
of Smith (2010) suggests that there is considerable scope for rebalancing government activity
between London and the rest of the country through the relocation of civil servant jobs.
According to the review, a robust and self-sustaining relocation programme should produce a
measurable and permanent shift of activity from London. It is intended to “give significant
cost savings to the taxpayer, contribute to the economic vibrancy of the rest of the UK and
through links with the private sector, help create centres of excellence that help build clusters
of international competitiveness.” (p5). Of course, such programme would presume a strong,
persistent government commitment.
The excessive concentration of economic power in the capital city has, among others, two
general consequences that co-exist. The economy of London and its hinterland generates
demand for goods and services in the rest of the UK, and London is a major contributor to the
taxes which help fund welfare payments and public spending across the whole nation (City of
London Corporation, 2011, Martin, 2015). At the same time, London’s economy seems to be

Zsibók, Z.
70
rather detached from the economic processes elsewhere in the country in terms of its level of
prosperity, economic growth, global orientation and cyclical behaviour (Martin, 2015). The
economy of London and the South East proved highly resilient during and after the economic
crisis (Bell and Eiser, 2015), and recently, this region leads the recovery while the northern
regions are left behind. The recent knowledge-based economic environment prefers the spatial
clustering of businesses. Being a global economic hub, London undeniably benefits much
from the self-reinforcing agglomeration economies, and, as a consequence, it sucks
businesses, investments and human capital from the rest of the country (as well as Europe and
the world), referred to as being a ‘black hole’ (Sturgeon 2014). As a result, the permanent
transfer of economic potential from the slow-growing regions towards the most prosperous
areas damages the economic power of the source regions, leave labour and capital resources
underutilized, and, therefore, is inefficient for the nation as a whole (see Rowthorn, 2010,
Gardiner et al., 2011). At the same time, congestion and high property prices pose local
challenges in London, but have an effect on the whole country, as well, through for example,
location and internal migration decisions (see Fothergill and Houston, 2016 for a comparison
of the advantages of the cities versus the non-city areas).
The excessive dominance of London over the rest of the UK is certainly not an outcome of
pure market forces. The UK is characterised by one of the most centralized national political
and financial systems amongst the OECD countries, and London receives huge amounts of
public expenditures on infrastructure, transport8, education, health services and cultural
institutions. These kinds of public investments undeniably prioritise the capital city on the
grounds of efficiency arguments. Gordon (2016) finds that the financial sector proved both
the most resilient in the economic downturn and the most dynamic in the upturn. He explains
this process partly with the fact that London’s financial sector received massive state support
for bank bail-out and quantitative easing. Martin (2015) highlights that the forces behind
spatial economic imbalance in the UK have become institutionalized, embedded in the
national political economy, spatially concentrated in and controlled from London. This means
that the UK’s political, administrative and governance system is far from being neutral from
an economic geographical point of view.
8 The most notable recent transport investment is the Crossrail railway construction programme connecting the east and the west parts of London which is underway, and expected to open in December, 2018, costing around 15 billion pounds.

Zsibók, Z.
71
Cities in the focus of spatial rebalancing in the UK
In the UK, around three quarters of the population live in cities and their surrounding areas.
HM Treasury (2015) describes the role of cities in the UK’s economy as they attract high
value firms and skilled workers, help to boost the productivity of those that locate there, as
well as cities provide deep markets for labour, vibrant competition between firms, and enable
the rapid diffusion of new ideas.
In response to the financial and economic crisis, the UK government assigned key
importance to the need to spatially rebalance the economy, to reduce its dependence on
London and the South East by powering up northern cities (Martin, 2015). There is currently
much interest in this issue not only at the central government level, but also within the major
cities, regions and nations of the country (Martin et al., 2015). Important policy initiatives
appeared such as Local Enterprise Partnerships, Enterprise Zones, city deals as steps towards
the devolution of powers, northern high speed rail developments (HS2 and HS3)9, the
Northern Powerhouse initiative, the Regional Growth Fund (launched in 2010, operating in
six rounds between 2011 and 2017) and the Midlands Engine Strategy (HM Government,
2017) but their actual effectiveness is questionable (Hildreth and Bailey, 2013). Martin (2015)
is quite pessimistic stating that at best the impact of such policies is expected to be small,
since such measures remain piecemeal, ‘add-on’ and marginal to the basic structures and
workings of the UK’s national system of fiscal, monetary and economic management, which
favours London and its environs.
“Powering up” northern cities
In the UK, city size is not directly related to better productivity performance, rather,
productivity benefits appear in the Southern regions, even in smaller settlements (McCann,
2016). The weaker performance of many of the northern cities has attracted government
attention in the past few years. The ‘Northern Powerhouse’ initiative was introduced by
Chancellor George Osborne in 2014, stating that the cities of the North (Manchester,
Liverpool, Leeds and Newcastle) are individually strong, but collectively not strong enough.
With fiscal powers, a collection of northern cities, sufficiently close to each other would be
able to rebalance the economy (Osborne, 2014). Northern cities are going through a modern 9 High Speed Rail 2 is planned to be a Y-shaped, south-west railway line to connect London, Birmingham, Manchester, Sheffield and Leeds. High Speed Rail 3 or Northern Powerhouse Rail is a proposed east-west railway line crossing the Pennine, which is designed to connect Liverpool, Manchester, Leeds, Sheffield and Hull. Under a „North First” policy approach, the HS3 development should take priority over HS2 and Crossrail in order to best serve the spatial rebalancing after the Brexit decision (see IPPR urges government to prioritise HS3 link).

Zsibók, Z.
72
transformation through physical renewal, cultural revitalisation, health and education
investments and the improvement of the quality of life (Rowthorn, 2010, Osborne, 2014,
Fothergill and Houston, 2016).
Osborne is firm on the view that the excessive and increasing dominance of London is not
healthy for the UK economy. The northern powerhouse is expected to be able to grow up with
the South East, however, the growth of London is not hindered in any way (Martin 2015).
Through increasing jobs and incomes for the people living in the North, it would be possible
to redress the North-South divide and increase national productivity. In the spirit of the
northern powerhouse, it is essential for the government to be committed to focus investment
in key Northern city regions as growth hubs. The main elements of the programme would be
the development of modern transport connections10, supporting science, universities, creative
clusters, and giving the cities local power and control (elected mayors) (Osborne, 2014). The
suggestions laid down by Osborne have appeared in a report of the Treasury (HM Treasury,
2015) demonstrating the commitment of the government towards spatial rebalancing.
The Cities and Local Government Devolution Act 2016 opens the way to have elected
mayors for the combined authority areas. Established by the Parliament, combined authority
areas11 are partnerships of two or more councils to collaborate and take collective decisions
which can take advantage of powers and resources devolved to them from national
government. In the middle of 2017, there are nine combined authorities:
Greater Manchester Combined Authority
Liverpool City Region
North East Combined Authority
Sheffield City Region
Tees Valley Combined Authority
West Midlands Combined Authority
West Yorkshire Combined Authority
Cambridgeshire and Peterborough Combined Authority
West of England Combined Authority.
In addition, there are some more areas that are considering a combined authority and some
proposals have failed. However, Martin (2015) emphasises that fiscal devolution is a
10 A radical transport plan would ensure that „travelling between cities feels like travelling within one big city” (Osborne, 2014). 11 Information about combined authority areas are retrieved from the Local Government Association: http://www.local.gov.uk/topics/devolution.

Zsibók, Z.
73
necessary condition, but not a sufficient one for spatial balance, since it could favour the very
largest cities and penalize less-prosperous cities, and it not necessarily translates into effective
and successful local economic growth and development.
Metropolitan areas
In this section we extend our previous empirical analyses, and focus on the metropolitan
areas. The presented data are provided by the OECD urban data set which defines ‘urban’
according to contiguous development patterns and commuting behaviour. According to the
OECD methodology, metropolitan urban areas are larger cities and their commuting zones
with a total of over 500 thousand inhabitants (McCann, 2016).
Table 4 Shares of the metropolitan areas in the total population, GDP, labour force, employment and unemployment of the UK, 2014 (%).
Population GDP Labour force Employment Unemployment London 19.28 28.39 19.95 19.88 21.14 Birmingham 3.04 2.68 2.76 2.67 4.16 Leeds 1.86 1.88 1.83 1.80 2.28 Bradford 0.90 0.60 0.78 0.77 1.06 Liverpool 1.48 1.25 1.44 1.38 2.26 Manchester 3.01 3.01 2.90 2.86 3.47 Cardiff 1.03 0.88 1.00 0.98 1.20 Sheffield 1.43 1.06 1.39 1.35 2.02 Bristol 1.30 1.47 1.34 1.34 1.39 Newcastle 1.68 1.27 1.63 1.60 2.12 Leicester 1.08 0.90 1.03 1.03 1.02 Portsmouth 0.92 0.97 0.94 0.96 0.66 Nottingham 1.34 1.12 1.29 1.27 1.63 Glasgow 1.50 1.62 1.44 1.41 2.02 Edinburgh 1.19 1.48 1.20 1.22 0.91
Source: Author’s elaboration based on OECD data.
The data presented above reflects the fact that the economic space of the UK is “spiky”
(see Hildreth and Bailey, 2013), that is, the only significant “spike” is London, whereas the
other parts of the country are relatively flat. Birmingham and Manchester emerge as second-
tier cities, but they are even together too small to counterweight the capital. Furthermore, this
holds if we sum up all the other metropolitan areas (Table 4).
During the recovery after the financial and economic crisis, the potential of the UK’s
“biggest cities as genuine drivers of economic growth” gained particular interest (HM
Government, 2010). Besides the Northern Powerhouse approach which concentrates on the
Northern ‘mega-city-region’, the City Growth Commission (2014) take a more polycentric

Zsibók, Z.
74
view, and identify 15 metropolitan areas12 around the UK as candidate economic hubs of
major city regions. The report emphasises that for the country it is better not to rely only on a
few growth hubs, but cities all across the UK need to be empowered to unleash their creativity
and innovation potential, improve their connectivity and boost their productivity. The central
elements of the Commission’s recommendations are a more decentralised political system that
creates fiscal and financial flexibility for the city-regions, as well as supply-side policies that
enhance connectivity, housing, skills and innovation at the scale of city-regions.
Figure 3 indicates that the highest population growth rates tend to appear in the smaller,
Southern cities (Milton Keynes, Peterborough, Swindon and Cambridge), while many of the
largest Northern cities tend to have smaller population growth after the Millennium. The
fastest-growing Northern cities include Manchester, Nottingham, York, Leicester and Cardiff.
Close to or below zero population growth was reported in Blackpool, Sunderland,
Middlesbrough and Dundee.
Figure 3 Population and population growth in the largest 50 cities of the North and the South (without London)
Source: Author’s elaboration based on www.citypopulation.de data (UK National Statistics, General Records of Scotland, The Northern Ireland Statistics and Research Agency).
12 London Metro, Greater Manchester Metro, West Midlands Metro, West Yorkshire Metro, Glasgow Metro, Merseyside Metro, Tyne and Wear Metro, South Yorkshire Metro, East Midlands Metro, South Hampshire Metro, Edinburgh Metro, Cardiff Capital Region Metro, Bristol Metro, Belfast Metro and Leicester Metro.
-0,005
0
0,005
0,01
0,015
0,02
0,025
0 200 400 600 800 1000 1200
Ave
rage
pop
ulat
ion
grow
th r
ate
betw
een
2001
and
201
5
Population in 2001 (thousand people)
North
South

Zsibók, Z.
75
The most well-known feature concerning city size is the so-called Zipf’s Law, or rank-size
rule (Zipf, 1949). This rule states that the population of a city is inversely proportional to its
rank. According to this, the second largest city in a country would have half the population of
the biggest city; the third largest city would have one third the population, and so on (see Fig.
4).
Figure 4 Zipf’s law in the United Kingdom: the relationship between city size and rank, 2014
Note: Blue: actual size; Red: city size predicted by Zipf’s Law Source: Author’s calculations based on OECD data.
As indicated by Figure 4, the city size distribution of the UK not corresponds to the Zipf’s
Law: the second and the third largest cities would not, even combined, reach the half of
London’s population. Is London too big for the country or the second-tier cities prove too
small? It would be a challenge to disentangle which aspect is the truth: should the growth of
the global capital city be constrained? It is, unfortunately, an ambiguous question,
furthermore, the empirical regularities expressed in Zipf’s Law cannot hold strictly, while its
theoretical underpinnings are not researched extensively (see McCann, 2016). In general,
London is indeed too big for the UK, but not too big in comparison to its global competitors.
The underlying question is that whether a more balanced city-size distribution within the UK
would improve or deteriorate the overall competitiveness of the country. In international

Zsibók, Z.
76
comparison, the UK’s second-tier cities prove even relatively large amongst several OECD
countries (McCann, 2016). It is also visible on Figure 4 that the actual city size distribution
corresponds better to the law in the case of smaller metropolitan areas. The rank-size rule
largely holds across all of the UK’s smaller towns and settlements with populations of over
5000 people (McCann, 2016), or below the top 25 cities (Overman, 2013). Since the second-
tier cities are located relatively close to each other in northern England, their large-scale
growth is constrained, and urban planning restrictions sometimes have a similar effect
(Overman, 2013)13. The current UK city size patterns are attributable to deep and long-
standing historical roots, as well as the effects of modern globalisation, and cannot be
regarded a primary result of the post-2004 EU immigration from Eastern Europe (McCann,
2016). A plausible way for enhancing national performance would be a flatter but more
spread-out distribution of economic growth which relies on the potential of various types of
areas, from city centres to rural places, all over the country.
To what extent can the recovery of the growth potential rely on the large cities in the UK?
According to Martin et al. (2016), the growth paths of the cities are divergent, since the broad
geographical pattern of city growth is that northern cities are growing more slowly than most
southern ones, and a number of northern cities have shrunk in employment terms after the
1980s. Contradicting the expectations, most of Britain’s principal cities have lagged behind
smaller cities, especially behind those in the South. The majority of the so-called ‘Core
Cities’14 (many located in the North) have not kept pace with the national growth rate in
employment or output (Fig. 5 and Fig. 6). The differences can be explained by the fact that
not all cities were able to shift their industrial structure from manufacturing and production
towards fast-growing knowledge intensive industries (Martin et al., 2016). Cities in the North
have small shares of business services jobs, low levels of patent activity and large numbers of
residents with few or no formal qualifications, which means that these cities struggle to attract
high-skilled investments (Bessis, 2016). After the Millennium, the cities which grew faster
13 McCann (2016) counters this latter view by stating that UK city-size distributions have always been characterised by second tier cities which are ’too small’ relative to London, even in periods without land-use planning restrictions and greenbelt policies. Moreover, restrictions have been relatively more biting in London and the southern cities than in cities in other regions of the UK. 14 The Core Cities Group was formed in 1995 as a partnership of eight city councils, with the aim of promoting the role of the participating cities in creating a stronger, fairer economy and society. ’Core Cities’ are Birmingham, Bristol, Leeds, Liverpool, Manchester, Newcastle, Nottingham and Sheffield in England, Cardiff in Wales and Glasgow in Scotland (https://www.corecities.com/cities).

Zsibók, Z.
77
than the national performance in terms of per capita GDP were London, Edinburgh, Bristol,
Glasgow, Portsmouth, Leeds and Manchester.
Figure 5 Differential growth of GDP and per capita GDP differential compared to the national average in the main metropolitan areas of the United Kingdom
Note: Northern metropolitan areas: green colour, Southern metropolitan areas: blue colour. Zero values represent national average. Source: Author’s elaboration based on OECD data.
In terms of employment, only London was able to grow faster than the national average
both before and after the economic crisis. After 2008, the national average employment
growth rate dropped to 0.67 per cent from the pre-crisis level of 0.81 per cent per year. After
the crisis, amongst the provincial metropolitan areas, only Cardiff and Sheffield were able to
reach an above average employment growth rate, while Birmingham and Edinburgh were
close to the national growth rate. Leeds, Nottingham and Liverpool performed well below the
national average in the second half of the studied period.
-15000 -10000 -5000 0 5000 10000 15000 20000
-1,5%
-1,0%
-0,5%
0,0%
0,5%
1,0%
London
Birmingham
Leeds
Bradford
Liverpool
ManchesterCardiff
Sheffield
Bristol
Newcastle
Leicester
Portsmouth
Nottingham
GlasgowEdinburgh
Per capita GDP differential (in 2000, US$)
Gro
wth
dif
fere
ntia
l (av
erag
e be
twee
n 20
00 a
nd 2
013)

Zsibók, Z.
78
Figure 6 Differential growth of employment between 2000 and 2007 and between 2008 and 2014
Source: Author’s elaboration based on OECD data.
Note: Northern metropolitan areas: green colour, Southern metropolitan areas: blue colour. Zero values represent
national average.
Our data and the literature raise doubts over the new conventional wisdom that the big
cities are the engines of growth in the UK. Before 2000, big, provincial cities were regarded
the main centres of job loss and population decline in Britain, whereas smaller towns and
rural areas were seen as the main locations of growth. Novel researches point out that city
size, per se does not guarantee growth (Martin et al., 2016, Fothergill and Houston, 2016).
Even the largest provincial cities differ in their success in attracting knowledge-intensive
industries, therefore a very different approach is required in different places (Centre for Cities,
2017a).
In 2013, the average labour productivity was 78 296 US$ in the UK according to the
OECD data, which means that London, Edinburgh, Glasgow, Bristol, Manchester, Leeds and
Birmingham performed better than the national average. Figure 7 verifies the previously
mentioned statements that there is no straightforward relationship between productivity and
city size in the United Kingdom. Analysing the data without London, the statistical link
between the two variables becomes even weaker. Actually, the best performers behind
-0,15% -0,10% -0,05% 0,00% 0,05% 0,10% 0,15% 0,20%-1,0%
-0,8%
-0,6%
-0,4%
-0,2%
0,0%
0,2%
0,4%
0,6%
0,8%
1,0% London
Birmingham
Leeds
Bradford
Liverpool
Manchester
CardiffSheffield
Bristol
Newcastle
Leicester
Portsmouth
Nottingham
Glasgow
Edinburgh
Employment growth differential 00-07
Em
plo
yme
nt g
row
th d
iffe
ren
tia
l 0
8-1
4

Zsibók, Z.
79
London were Slough, Reading, Aldershot and Milton Keynes, all located in the vicinity of the
capital city, while the only northern city was Aberdeen amongst the top 10 areas in terms of
GVA per worker. The weakest productivity was measured in Blackpool, Blackburn, Stoke,
Hull and Swansea, while even Sheffield is amongst the 10 cities with the lowest GVA per
worker (Centre for Cities, 2017b). This phenomenon poses challenge for future regional
economic stabilisation in the United Kingdom, since the main driver of long-run economic
development is productivity. From a policy point of view, cities need to improve their ability
to create new ideas and spread information, and the access they give businesses to many
highly-skilled workers (Bessis, 2016).
Figure 7 Population (persons) and labour productivity (US$) in the main metropolitan areas of the United Kingdom in 2013
Note: Northern metropolitan areas: green colour, Southern metropolitan areas: blue colour. Source: Author’s elaboration based on OECD data.
McCann (2016) explains that the geography-productivity, geography-inequality story of
the UK is much more of a regional core-periphery issue rather than it is an urban issue, that is,
the performance of cities is largely dependent on the performance of the region in which they
are located. The reason behind this is that the various linkages between London and the rest of
the UK economy are both very weak and largely limited to the Southern regions of England
0 2000000 4000000 6000000 8000000 10000000 12000000 14000000
50000
60000
70000
80000
90000
100000
110000
120000
London
Birmingham
Leeds
Bradford
Liverpool
Manchester
Cardiff
Sheffield
Bristol
Newcastle
Leicester
Portsmouth
Nottingham
Glasgow
Edinburgh
Population
La
bo
ur
pro
du
ctivi
ty

Zsibók, Z.
80
(p. 357). For this reason, relying purely on the spillover effects of the buoyant South East
would not solve the problems of the North, furthermore, some even argue that there are no
such positive effects, at all.
CONCLUSION
The high level of regional inequalities in the United Kingdom poses the question whether the
concentration of the economic prosperity in one corner of the country is good or bad for the
nation as a whole. The economic policies are seeking the options to drive the country out of
the recession after the second half of the 2000s, placing special emphasis on the issue of
regional re-balancing. London is obviously leading the recovery and the growth of the whole
national economy, but also the issue of unleashing the potentials of the cities and regions
outside the Southeastern core areas have come to the fore again. Our study highlighted that in
the UK, city size is not directly related to better productivity performance, rather, productivity
benefits appear outside the largest Northern cities, mainly in the Southern regions.
As a consequence of the Brexit decision, the UK faces further economic challenges, and it
has implications for the regions, as well. Concerning the geography of the EU referendum, the
‘leave’ campaign dominated mainly in the big northern cities of England, in Wales, across the
Midlands, as well as the south and east of England. The vote for ‘remain’ had a high share in
London, Scotland and Northern Ireland (see Fig. A2 in the Annex). These results reflect that
not all regions of the country enjoy the advantages of globalisation. A positive shift in
national policy can be detected after the referendum, since economic policy turned towards
place-based strategies and emphasise the need for the growth everywhere around the country.
Politicians articulated commitment towards the Northern Powerhouse and the Midlands
Engine strategy, which is a favourable shift from former space-blind policies.
Our study reaffirms the view that relying purely on the spillover effects of the buoyant
South East would not solve the problems of the North, furthermore, some even argue that
there are no such positive effects, at all. Our conclusion is that current literature researches
properly revealed the main problems behind the sub-optimal national economic performance
and regional inequalities in the UK, and assigned proper directions to improve them.
However, despite important economic policy initiatives and steps towards devolution, current
measures are not effective enough since they do not transform the basics of the UK’s
economic model.

Zsibók, Z.
81
Acknowledgement
This study has been prepared with the support of the project No. K_120004 of the Hungarian National Research, Development and Innovation Office. The author is grateful for the two anonymous referees for their useful comments.
REFERENCES
Baker, A. R. H., & Billinge, M.D. (eds.) (2004). Geographies of England: the North-South Divide – Imagined and Material. Cambridge, Cambridge University Press
Bell, D. N. F., & Eiser, D. (2016). Migration and fiscal policy as factors explaining the labour-market resilience of UK regions to the Great Recession. Cambridge Journal of Regions, Economy and Society, 9, 197–215
Bessis, H. (2016). Competing with the continent. How UK cities compare with their European counterparts. Centre for Cites
Centre for Cities (2017a) Why don’t we see growth up and down the country? [pdf] Retrieved from: http://brexit.regionalstudies.org/custom/uploads/2017/04/Centre-for-Cities-Why-dont-we-see-growth-up-and-down-the-country.pdf
Centre for Cities (2017b) Cities Outlook 2017. Retrieved from: http://www.centreforcities.org/wp-content/uploads/2017/01/Cities-Outlook-2017-Web.pdf
City Growth Commission (2014). Unleashing Metropolitan Growth. Royal Society for the Arts, London.
City of London Corporation (2011). London’s Competitive Place in the UK and Global Economies. Research Report, City of London Corporation, London.
Dijkstra, L. (2013). Why investing more in the capital can lead to less growth. Cambridge Journal of Regions, Economy and Society 6, 251–268
Fothergill, S., & Houston, D. (2016). Are big cities really the motor of UK regional economic growth? Cambridge Journal of Regions, Economy and Society, 9, 319-334.
Ganesh, J. (2015). Disunited kingdom: London in a world of its own, The Financial Times, 2 March, The Financial Times: London.
Gardiner, B. – Martin, R. – Sunley, P. – Tyler, P. (2013). Spatially unbalanced growth in the British economy. Journal of Economic Geography 13, 889-928.
Gardiner, B., Martin, R., & Tyler, P. (2011). Does spatial agglomeration increase national growth? Some evidence from Europe, Journal of Economic Geography, 11 (6), 1-28.
Gordon, I. (2016). Quantitative easing of and International Financial Centre: how central London came so well out of the post-2007 Crisis. Cambridge Journal of Regions, economy and Society, 9, 336-353.
Gudgin, G., & Schofield, A. (1993). The Emergence of the North-South Divide and its Projected Future. In: Harrison, R.T. – Hart, M. (eds.) Spatial Policy in a Divided Nation. Regional Policy and Development Series 2. Regional Studies Association, Jessica Kingsley Publishers Ltd., London
Hildreth, P., & Bailey, D. (2013). The economics behind the move to ‘localism’ in England. Cambridge Journal of Regions, Economy and Society, 6, 233-249.
HM Government (2010). Local Growth: Realising Every Place’s Potential, Cm 7961. HM-Government.
HM Government (2017). Midlands Engine Strategy. Department for Communities and Local Government, March 2017
HM Treasury (2015). Fixing the foundations: Creating a more prosperous nation. July, 2015 Retrieved from: http://dera.ioe.ac.uk/23490/1/Productivity_Plan_web.pdf

Zsibók, Z.
82
IPPR urges government to prioritise HS3 link. 8 August 2016. BBC News. Retrieved from: http://www.bbc.com/news/uk-england-37011839
Magnifico, G. (1973). European Monetary Unification. New York: John Wiley. Marshall, M. (1990). Regional alternatives to economic decline in Britain's industrial
heartland: industrial restructuring and local economic intervention in the West Midlands conurbation. In: Stöhr, W.B. (ed.) Global challenge and local response – Initiatives for economic regeneration in contemporary Europe. London, Mansell, pp. 163-198.
Martin, R. (2008). National growth versus spatial equality? A cautionary note on the new ‘trade-off’ thinking in regional policy discourse. Regional Science, Policy & Practice 1 (1), 3 – 13.
Martin, R. (2015). Rebalancing the Spatial Economy: The Challenge for Regional Theory. Territory, Politics, Governance, 3 (3), 235-272.
Martin, R., Pike, A., Tyler, P., & Gardiner, B. (2015). Spatially rebalancing the UK economy: The need for a new policy model. Regional Studies Association, March 2015
Martin, R., Sunley, P., Tyler, P., & Gardiner, B. (2016). Divergent cities in post-industrial Britain. Cambridge Journal of Regions, Economy and Society, 9, 269-299.
McCann, P. (2016). The UK Regional-National Problem. Geography, Globalisation and Governance. Routledge, Abingdon and New York
Osborne G. (2014). We Need a Northern Powerhouse. Speech delivered in Manchester 23 June. Retrieved from: https://www.gov.uk/government/speeches/chancellor-we-need-a-northern-powerhouse, accessed 06 September 2016)
Overman, H. G. (2013). The Economic Future of British Cities. Centerpiece, Summer. Rowthorn, R. (2010). Combined and Uneven Development: Reflections on the North–South
Divide, Spatial Economic Analysis, 5:4, pp. 363-388 Smith, I. R. (2010). Relocation: Transforming Where and How Government Works. HM
Treasury, London. SQW (2016). The Northern Powerhouse Independent Economic Review. Retrieved from:
http://www.transportforthenorth.com/wp-content/uploads/Northern-Powerhouse-Independent-Economic-Review-Executive-Summary.pdf
Sturgeon, N. (2014). Speech to Scotland’s Business Sector, SSE Business Offices, Glasgow, Scottish Government 1 December, 2014.
Wilcox, Z., Nohrova, N., & Bidgood, E. (2014). City views: How do Britain’s Cities See London? Centre for Cities, London.
Zipf, G. (1949). Human Behavior and the Principle of Least Effort, Addison-Wesley, New York
Zsibók, Z. (2017). Continuing divergence after the crisis: long-term regional economic development in the United Kingdom. Regional Statistics, 7(1), 17-42.

Zsibók, Z.
83
Annex 1 Figure A1. The map of the United Kingdom’s cities with a population of more than 100
thousand people.
Source: Elaborated by Tamás Szabó, HAS-CERS based on the digital maps of Gfk GeoMarketing GmbH.

Zsibók, Z.
84
Figure A2 The map of the EU referendum results concerning the UK leave the EU.
Note: blue colour: leave; yellow colour: remain. Source: http://www.bbc.com/news/politics/eu_referendum/results.

DETUROPE – THE CENTRAL EUROPEAN JOURNAL OF REGIONAL DEVELOPMENT AND TOURISM Vol. 9 Issue 3 2017 ISSN 1821-2506
85
Original scientific paper
SERVICES OF ECONOMIC DEVELOPMENT ORGANISATIONS IN
GYŐR
A GAZDASÁGFEJLESZTÉSI TEVÉKENYSÉGET FOLYTATÓ
SZERVEZETEK SZOLGÁLTATÁSAI GYŐRBEN
Adrienn REISINGERa, Petra KECSKÉSb, Katalin CZAKÓc
a Széchenyi István University, Hungary, Győr, Egyetem tér 1. [email protected] b Széchenyi István University, Hungary, Győr, Egyetem tér 1. [email protected] c Széchenyi István University, Hungary, Győr, Egyetem tér 1. [email protected]
Cite this article: Reisinger, A., Kecskés, P., Czakó, K. (2017). Services of Economic Development Organisations in Győr. Deturope, 9(3):85-100.
Abstract
Economic development of a municipality is highly depended on organizations and institutions, which services target local entrepreneurs and other economic actors. In the summer of 2015 we have collected and mapped the services of organizations with the function of economic development in the Hungarian city, Győr. Through our research we could identify the services and the characteristics of linkages and cooperation of the economic development organizations (EDOs). Most important findings of the study are the followings: activity of the organizations has a wide range. Some of them are presented in more organizations at the same time. Level of diversification is quite low. Directions of cooperation are mainly based on personal or ad hoc relations. We conducted that EDOs know about each other, despite of this fact the number of linkages is low. In this paper we provide findings about Győr, but the results can be used for other settlements’ economic development, too. Keywords: local economic development, economic development organisations (EDOs) services, supply, cooperation
Összefoglaló
Egy település, térség gazdaságfejlesztéséhez nagy mértékben hozzá tudnak járulni azok a szervezetek is, melyek szolgáltatásaikkal segíteni tudják a helyi vállalkozások és egyéb gazdasági szereplők fejlődését. 2015 nyarán egy konkrét megyei jogú város – Győr – esetében feltérképeztük a gazdaságfejlesztési tevékenységet folytató szervezeteket, majd interjúk segítségével azonosítottuk a megkérdezett szervezetek szolgáltatásait és együttműködési jellemzőit. A tanulmány legfontosabb megállapítása, hogy a megkérdezett szervezetek tevékenysége széles körű, de sok esetben párhuzamosan több szervezetnél is előfordulóak, illetve nem diverzifikáltak. A szervezetek közötti kapcsolattartás főként személyekhez kötődik, a szereplők tudnak egymásról, de az együttműködési felületek száma kevés. Eredményeinek Győr kapcsán mutatjuk be, azonban az itt szerzett tapasztalatok hasznosíthatók más települések gazdaságfejleztő tevékenysége során is. Kulcsszavak: helyi gazdaságfejlesztés, gazdaságfejlesztő szervezetek, szolgáltatás, kínálat, együttműködés

Reisinger, A., Kecskés, P., Czakó, K.
86
INTRODUCTION
Organizations which support the local firms and other economic actors with their services can
contribute to the economic development of a given settlement and region. Such organizations
are the economic development organizations (EDOs). The objective of this study is to explore
these organizations, to introduce and process their services and to describe their cooperation
attributes through on a given case in the town of Győr, Hungary.
There is a need to discuss and evaluate the role and efficiency of EDOs in any region of
Hungary. Our case is the city of Győr, which can be a representative field of research. Győr is
not in the capital region of Hungary, but due to its dynamically growing economic atmosphere
it is worth to elaborate details of the above mentioned topic. Győr has prosperous industry,
mainly focuses on the automotive sector but also famous for its lively cultural and sport life.
Beside this the presence of the university is getting continuously stronger. According to
Rechnitzer (2016) the city’s size, its historical and industrial area and its milieu itself make it
possible to have deeper insight to the issues connected to local businesses. Just to highlight
the related academic data: the city has about 130 thousand inhabitants and more than 40
thousand firms are operating in Győr. According to current statistical summary of Czakó
(2017) region15 of Győr has outstanding values in the following fields:
unemployment rate;
gross monthly earnings of full-time employees;
the number of registered enterprises per thousand inhabitants;
investments per capita;
industrial production per capita;
construction per capita production;
decrease in the number of registered partnerships.
In 2014 the business tax could be reduced by 10%, for 2016 the increase was realized by
11%. Rate of the Hungarian owned companies are 89%. Due to the above mentioned data,
this region can take special potentials supporting the effective operation of local EDOs.
A semi-structured interview survey was implemented with EDOs in the town of Győr, in
the framework of a research program. The focus of the research was the analysis of the supply
15 Based on statistics of West Transdanubian Region.

Reisinger, A., Kecskés, P., Czakó, K.
87
side of the local development services. In other words: to represent the supply map of the
local development services.
In the framework of this research 14 organizations took part on a detailed interview.
According to the research conditions we could reach all EDOs in Győr. The research and its
findings can provide a sample to other settlements and/or other regions to foster economic
growth by expanding the supply activities of EDOs.
In the first section, a brief theoretical overview will be demonstrated about local economic
development, relating to its means and actors, and the role of EDOs. It should be highlighted
that the aim of the study is not to describe the theoretical background of the topic in details,
but to focus on the specific findings of the conducted research as case studies. The foremost
statement of the paper is that the activities of the interviewed organizations are extensive;
however, activities are often offered parallel by several organizations. Contacts between
EDOs are influenced by personal relations and are less formal; the actors know each other but
the number of cooperation interfaces is limited; deeper understanding on the demand side of
development services can improve the outcome.
LITERATURES ABOUT LOCAL ECONOMIC DEVELOPMENT
Theory of local economic development - relevant approaches
There are a number of definitions of local economic development (e.c.: Bajmócy, 2011;
Mezei, 2006a; Lengyel, 2010; Swinbrun et al., 2004; Kane, 2004; Nafziger, 2012; Pike et al.,
2006; Canzanelli, 2001). In summary, local development is a process through which
participants contribute to improve the economic performance of a local region through
various tools.
Local economic development is implemented as conscious intervention that affects the
operation of the local economy. Local actors have roles as initiatives, targets, supporters or
modifiers (Mezei, 2006b, 414). Its goal is to build up the economic capacity of a given
territory in order to ensure the appropriate quality level of live for the local society and to
ensure the future of the local economy. We can say that local economy is the continuous
improvement of the local quality of life (Swinbrun et al., 2004). Local means a given territory
and its surroundings (e.g.: districts). When we define the strategy of local economic
development we should highlight that local economic development is not independent of the
socio-political environment of the local region. It is necessary to account for the local,

Reisinger, A., Kecskés, P., Czakó, K.
88
regional, and national legal systems, taxation policies, environmental protection laws, and
other global factors and prevailing trends (Swinbrun et al., 2004).
The primary goal of local development can be the economic growth, but – as we
mentioned at the beginning – there are several other that should be addressed, as listed below:
(Mezei, 2006a; Czene et al., 2010):
solving political and social problems,
improving the quality of life,
increasing the access to services,
improving the relation of urban and rural territories,
increasing the population retention capacity,
activate local communities.
According to Bajmócy (2011) economic development may adopt any or all of the
following strategic directions: creation of new workplaces, the improvement of the innovation
capacity, changing the related institutional structure. To this list we would like to add the
entrepreneurship development16 and the formation of the local financial and law systems.
Other notable aspect is that local economic development affects the whole economy in
general and effects local enterprises (Bajmócy, 2011). For instance, consider the following:
General effects on the economy: creation of workplaces, increasing GDP, improving
business environment, innovation skills, increasing salaries, number of firms.
Effects on enterprises: increasing the value of the firm, income and number of
employees, improving the business culture.
Tools and actors of local economic development
There are several authors, who have stated that it is a difficult task to identify the system of
tools of the local economy, because these tools are diverse and there are several combinations.
Tools appropriate for a given territory depend on the condition of its economy, the
qualification of the local actors, the disposable time, and the financial and HR resources. In
this paper we provide a short overview of the tools and the actors, without getting into
details.17 Table 1 shows a grouping of potential tools (Kullman, 2009).
16 Development of enterprises is not equal to economic development. Development of enterprises is the part of economic development. Its goal is the improvement of the operation and capacity of enterprises. 17 Detailed introduction is beyond the scope of this paper.

Reisinger, A., Kecskés, P., Czakó, K.
89
Table 1 Grouping of tools of economic development
Pri
mar
y to
ols
Benefits
Tax benefits for investments
Duty free zones
(free) Enterprise zones
Tax benefits for investments
Supports Grant
Financial Tools
Soft loan Microcredit Credit guarantee Interest subsidy Venture capital
Special Tools
Investments of public organizations Governmental purchases Local trademark
Infrastructure of firms
Industrial park Incubator Science park Innovation centre
Sec
ond
ary
tool
s
Cluster
Regional development program
Source: Kullmann, 2009, p. 10–12
Using Kullmann’s grouping we developed the following tools which can be significant in
the development process of a given territory:
Financial instruments
Supply of sites
Education and vocational education
Business breakfasts
(Business) coaching
Development of tourism
Development of enterprises
There are additional issues to be addressed. For example, who will be the initiator and the
implementer of the developing process? The potential candidates can include the follows
based on our context: state, local government, enterprises (local, foreign), non-profit
organizations, educational institutions, industrial parks, clusters, other organizations. There
are common characteristics in these actors. Their normal activities effect local economic
development. Beside them, there are organizations, which were created right up to use
specific tools and apply concrete methods which lead to local economic development. These
are the group of EDOs.

Reisinger, A., Kecskés, P., Czakó, K.
90
There are particular organizations belonging to this group, which are coordinating other
local developer actors. They are transferring legal, financial and technical information as a
forum of local economy. This role is useful, because the level of duplication among
development services can be reduced. So the rationalization of the local development can be
achievable in a given territory. EDOs can function as firms or non-profit organisations
depending on the activity and the types of services they offer.
Other important issue is the way of analysing the activity of EDOs. Empirical studies have
already taken place in cities of similar size to Győr. Thus we can observe the methodology of
the analysis about Ingolstadt automotive centre (Fekete 2014) or about the Rhein-Neckar
metropolitan region (Schmitz 2005). Based on them, semi-structured interviews, strategic and
descriptive operational documents are used as analysing tools.
ECONOMIC DEVELOPMENT ORGANIZATIONS (EDOS) IN GYŐR
Methodology
We have taken a comprehensive overview about relevant actors dealing with economic
development activities in the town of Győr, Hungary and explored their service activities
provided to economic actors. As it was mentioned in the introduction we have made semi-
structured interviews with 14 actors (EDOs) between May and August 2015.
The interviews were conducted orally and were recorded; also, additional information was
obtained from the webpage of organizations.
Aim of the research was reached successfully as the interviewed organizations accounted
for all EDOs in Győr in 2015. These organizations included economic and nonprofit
organizations, and local governmental organizations regarding their organizational forms.
The interview questions took into consideration the following dimensions18:
1. Supply map: information about functions and provided services of the organizations.
2. Relations of EDOs: tools were collected and categorized, which are applied by EDOs
in order to contribute to the local economic development. They answered for the
question that what kind of cooperation and relation they possess with other actors of
the settlement.
3. Opinion about the local economic development of Győr;
4. Information about human trainings and scientific background.
18 There was no database about economic development organizations functioning in the town of Győr, therefore, the list was created by direct observations, pilot interviews and suggestions made by other EDOs.

Reisinger, A., Kecskés, P., Czakó, K.
91
Services of EDOs in Győr
Based on the interviews, we classified EDOs’ activities into 5 categories (in case on two
categories subcategories were also defined), which are the main supply groups of the
economic development organizations (see Table 2). Categories were conducted based on the
answers given by EDOs, some of them are not in the defining literature.
Table 2 Offer of economic development services in Győr by categories
Categories How many organizations provide the given service
(from 14)? 1. Training 1. Training 3
2. Financing 2.1. Refundable financing (lending) 1
2.2. Non-refundable financing (EU and
central sources) 3
3. Services supporting
current activities
3.1.
Services improving the quality/volume of
trade/manufacturing activities 11
3.2. Services fostering business relations
6
3.3. Services supporting initial/young
business activities 5
3.4. Consulting (strategic, financial,
accounting, etc.) 9 4. Project
management 4. Project management
3 5. Events 5. Organization of events 3
Source: own table based on interviews in 2015
It can be stated that services they improve, the quality/volume of trade/manufacturing
activities and consulting activities (strategic, financial, accounting, etc.), are provided by most
organizations. There were five organizations that did not offer their services directly to
companies. Their functioning can be defined as indirect economic development activities.
Relations of the EDOs and their opinions about local economic development
Main statements regarding EDOs in Győr and their supply are listed in the following points19:
Organizations provide a wide-range of services.
Financial services are offered by only a few organizations (N=3), however,
consulting and services improving the quality/volume of trade/manufacturing
activities are offered by almost all of them (N=9 and N=11).
The majority of services are not differentiated according to e.g. company size,
activities or ownership (family business, ratio of foreign ownership). 19 We think that a list form of introducing the main statements are an appropriate style.

Reisinger, A., Kecskés, P., Czakó, K.
92
Local government provides its coordinating role.
There are organizations in which the role of local government or government is
significant, e.g. local government acts as an owner in many EDOs. It should be
highlighted that EDOs also have ownerships in other economic development
organizations in the town.
The vocational education and higher education contribute considerably to the
development of Győr economy by providing supply adjusted to the demand.
However, previous studies show (e. g. Kovács–Reisinger 2014) that family sample is
more important for students studying in higher educational institutions than trainings
in institutions.
The EDOs suggest that the biggest problem of Győr and its region is the lack of
qualified workforce; and they do not know any solutions yet. Several organizations
did former steps (e.g. attracting workforce from other parts of the country) but with
limited success. They faced that if somebody comes to Győr from Eastern Hungary,
will move to Austria or Germany by taking into account higher income opportunities.
The Industrial Park of Győr is a determinate actor in the town with more than 100
settled companies and extensive services.
The collaboration of EDOs with other actors is characterized by informal ties and in
many cases ad hoc initiatives. The cooperation is related rather to persons and not to
organizations.
Almost every organization possesses different relations with the Széchenyi István
University.
The congruent opinion of EDOs is that Győr and its development proceeds in the
right direction, though there are factors which should be brought to the fore in the
future:
There is a need for closer collaboration of the town and its region.
It would be expedient to establish a coordinating institution of economic
development activities.
The presence of Audi offers on one hand positive factors (job creation,
relations, suppliers’ network, etc.), on the other hand its workforce drain effect
is significant and smaller firms are unable to compete with the multinational
company regarding wages.
The problem of generation change is present in family businesses in the town;
however, only one organization mentioned it.

Reisinger, A., Kecskés, P., Czakó, K.
93
Opinion of EDOs about human trainings and scientific background
Beside the evaluation of the supply services offered by EDOs, we wanted to recognize the
EDOs’ opinion about personnel trainings and scientific background in Győr. Two dimensions
were defined:
How important would the given factor be from the aspect of Győr’s economic
development?
How satisfied are EDOs with the given service in Győr?
This topic is relevant as the status of human resources is a key milestone in the
improvement of economic development activities. It could offer support for both companies
and training institutions. Table 3 shows the judgement of the interviewed EDOs (8
organizations answered these questions) regarding human trainings and scientific background.
Table 3 Attitudes of the economic development organizations towards human training and scientific background, 1 = not at all; 5 = fully
Factors
How important would the given factor be from
the aspect of Győr’s economic development?
Mean
How satisfied are you with the given service in Győr?
Mean
Difference between means
Vocational training 4.75 4.00 0.75 Technical higher education 4.75 4.38 0.38 Leadership and economic trainings and further trainings 4.00 3.29 0.71 Trainings specialized in automotive industry 4.38 4.00 0.38 Foreign language trainings specialized in automotive industry 4.00 3.29 0.71 Competence development trainings (communication, conflicts management, presentation, debate culture, project management) 3.88 3.29 0.59 General foreign language trainings 4.75 3.29 1.46 R&D services in the region available for companies (involving researchers acknowledged on international level) 4.13 2.88 1.25 Access of companies to international quality laboratory devices for marketable price 4.38 2.63 1.75 Support of marketable start-ups 4.50 2.63 1.88 Source: own table based on interviews in 2015

Reisinger, A., Kecskés, P., Czakó, K.
94
Based on the interviews, the most important factors are vocational training, technical
higher education and general foreign language trainings regarding the economic development
of Győr (mean=4.75); the less important is competence development trainings. Although this
factor has the lowest mean (=3.88), its importance is not negligible. Moreover, it can be one
of the most relevant factors since the development of competencies (through trainings,
workshops or business coaching) can be influenced by the competitiveness of the business
sphere and in the economic development.
Regarding the satisfaction, the interviewed organizations are the most satisfied with
technical higher education, and the least satisfied with the support marketable start-ups and
the access of companies to international quality laboratory devices for marketable price.
The average difference is 1 between the importance of the given factor and its present
status. The biggest difference is seen between reality and importance in the case of support
marketable start-ups. The importance of this factor is 4.50; the reality is 2.63, thus, the
support of start-ups need improvement. An effective institution system will be useful; this is
highlighted in the final section of this article. The support of start-ups and business activities
based on creative ideas has bigger chance in a dynamically developing economic area of
Győr.
There is also a significant difference between the access of companies to international
quality laboratory devices for marketable price and how important it would be. The lowest
difference is in two cases, technical higher education and trainings specialized in the
automotive industry. The interviewed EDOs has recognized and identified the opportunities,
which cover special personnel trainings. In most of the cases they classify these trainings
significant in further and sustainable economic development in Győr. However, EDOs are not
satisfied with the given infrastructure; it should be improved.
SWOT ANALYSIS OF ECONOMIC DEVELOPMENT SUPPLY
Based on the collected information we defined items of a SWOT analysis. It is important to
review the strengths and weaknesses by which the potential of actively participating actors in
the local economic development can be determined. Opportunities and threats will be
presented both on the short and long run. We provide the SWOT analyses as a part of our
results not as a conclusion. Our statements are referred to the city of Győr, but some of them
can be appropriate to other settlements, too.

Reisinger, A., Kecskés, P., Czakó, K.
95
Strengths:
Primary and secondary tools categorized by Kullmann (2009) are present in
economic development services.
Years of experience on the own service field.
Every organization is able to identify its opportunities and threats.
Relation with higher educational institutions is close and live.
Active benchmarking activity.
Organizations related to local government possess strong coordinating functions.
There are services that support directly the companies’ manufacturing and/or trading
activities.
Weaknesses:
Isolated functioning of organizations – lack of building cooperation and networks.
Lack of communicational interfaces.
Intensity of communication, type and strength of relations.
Ad hoc contacts.
Although organizations are aware of their opportunities and threats they do not take
effective steps or are unable to take steps.
Lack of an organization uniting EDOs.
Overlaps between service supply – parallelism.
In the toolkit of economic development there are special services which are missing
in the services provided by EDOs in Győr or of which presence is weak (e.g.
business coaching).
Alternative services are missing which deal with special problems of firms (e.g.
generation change, search for appropriate workforce, lack of services offered to
micro firms).
Personal relations are dominant regarding collaborations; thus, services of EDOs do
not reach uniformly every actor in the business sector.
Opportunities – Short-term20:
Building relationships between EDOs.
Forming communication channels between EDOs and between EDOs and
companies.
20 Even there are similarities in the long and short term list we hold it important to make differences between them.

Reisinger, A., Kecskés, P., Czakó, K.
96
Building relations with foreign companies.
Differentiated communication based on company size.
An intermediary and coordinating institution would support interviewed EDOs to
work more effectively.
Opportunities – Long-term:
Building relationships between EDOs.
Forming communication channels between EDOs and between EDOs and
companies.
Building relations with foreign companies.
Strengthening cross-border interactions.
Differentiated communication based on company size.
Formation of an institution which converge every EDO.
An intermediary and coordinating institution would support interviewed EDOs to
work more effectively.
Preparing a detailed local ‘company map’ would support the improvement of EDOs’
services by methodizing the functioning companies in Győr.
Threats – Short-term:
Lock-in – organizations keep in touch with past relations; therefore, obstruct
themselves from opportunities, development and new relations.
Overlaps between service supplies.
The majority of EDOs do not deal with the problem of generation change or other
specific problems in family businesses.
Foreign companies will remain unknown if EDOs do not map them.
The long-term effective functioning of business development organizations could
become difficult as they offer ad hoc and project-related service packages.
The effectiveness of EDOs could decrease if there will not be any coordinating
institutions.
Threats – Long-term
Lock-in – organizations keep in touch with past relations; therefore, obstruct
themselves from opportunities, development and new relations.
Overlaps between service supplies.
The majority of EDOs do not deal with the problem of generation change or other
specific problems in family businesses.

Reisinger, A., Kecskés, P., Czakó, K.
97
Some organizations’ functioning will be impossible (e.g. organizations offering few
services).
There are only a couple of EDOs of which services are related to micro firms. The
improvement of significant micro business base could foster and multiply the
economy. The lack of it could slow down this process.
The effectiveness of EDOs could decrease if there will not be any coordinating
institutions.
CONCLUSION AND RECOMMENDATIONS
The aim of our paper was to analyse the kinds of local development services available in
Győr, Hungary, and to process their context. Such a survey has not been made in this region
before. We set out to contribute to the literature of local economic development by
representing the regional supply map.
In order to this we made detailed interviews with 14 organizations in the summer of 2015.
We defined the services, depicted the cooperative attributes of EDOs, and described the
context of their services. Based on this and our previous experiences we could make the
SWOT analyses of the supply of local development services. In order to keep the strengths,
explore the opportunities, fix the weaknesses and avoid the threats in the following points we
concluded the following suggestions21:
Although all organizations provide a range of local development services, these are
not complementing each other; they lead to competitive situation. Decreasing the
level of duplication would be an important goal in the future. Restructuring of the
supply map would be necessary for appropriate division of labour among these
organizations.
The service range offered by EDOs addresses a broad range of companies, but due to
the fact that companies are highly heterogeneous - especially in aspect of sectoral
classification, scope of activity, location and size - it would be necessary to segment
them. Through segmentation, the demand side of local economic development,
especially the development of enterprises, can be more visible. This could ease the
effective development processes. Segmentation among size is suggested in the
theory. Micro, small and medium sized companies often create one group. Our
opinion is that this methodology cannot be applied successfully in the research of the
21 We interpret them in a list form.

Reisinger, A., Kecskés, P., Czakó, K.
98
local development services. Micro enterprises need different services than small and
medium ones. We can say that they need different EDOs. With respect to a given
EDO, it would be important to diversify services according to given variables: size,
location, performance, industrial sector.
The organizations involved in the research are aware of the available local
development services in Győr. They know each other. There is less formal
cooperative activity between them. Networking and cooperative activities are
necessary in order to realize dynamic development in the future. Although the
majority of these organizations evaluate their relation very well with educational
institutions, concrete cooperation did not happen between them.
Liaison between the organizations is most frequently among persons. It is limited to
communication. Unfortunately the organizational-level dialogue is seldom reached.
This is needed, especially between the leaders of the organizations.
There is a lack of dialogue observed, not only among economic development
organizations, but also with the target audience - companies and firms.
Communication to existing customer base is properly going on, but there is more
potential on the demand side. It means, the demand is bigger and more differentiated.
These are the organizations that are outside the scope of the vision of EDOs. Facility
of the communication with them is minimal. This was acknowledged by several
participants as well.
Communication is needed for building up relations, realizing cooperation, and the
appropriate division of labour. Increasing communicational platforms would help.
This would ensure the meeting point of organizations for personal and online
interactions as well. Beside these on one hand we can name platforms like different
forums, special conferences targeting EDOs and workshops, where these actors can
share own experiences and have the opportunity to find solutions for the potential
problems and difficulties, or finding some new opportunities. On the other hand
other important platform of communication would be the virtual world. Creating an
online platform would have two main advantages: it would linked EDOs, which are
operating with similar activities. Other important advantage would be, that through
the virtual platform EDOs and their services would be more visible for companies
and firms. This visibility would connect the supply to the demand.

Reisinger, A., Kecskés, P., Czakó, K.
99
Helping start-ups is an important factor because it is dynamically developing
economy of Győr, increasing the chances of rapid development in entrepreneurial
activities based on creative ideas. Creation of a company is regularly supported in the
framework of EU projects. Support of start-up companies, by itself, is not a
profitable service. We do not suggest providing such support under one EDOs
framework. A supplementary service is needed, which can be one of the functions of
higher education institutions.
Ongoing analysis, consistent management and the coordination targeting EDOs
should have a complex function. Based on Győr’s case we would suggest this
function for universities. Higher education institutions are central actors, reaching a
lot of people from the labour supply and demand side alike. With this function higher
education would carry out a mediator role between the two before mentioned sides,
the EDOs and the companies.
Acknowledgement
This paper is based on the following project: „Győr Megyei Jogú Város Integrált Területi Programja (ITP) megvalósítása előkészítésének szakmai támogatására, valamint Győr Megyei Jogú Város gazdaság és innováció fejlesztési tevékenységeit megalapozó tanulmányok és koncepciók elkészítésére – TÁMOP–4.2.1.C–14/1/KONV–2015-0005”
REFERENCES
Bajmócy, Z. (2011). Bevezetés a helyi gazdaságfejlesztésbe. (Introduction of the local economic development.) Szeged: JATEPress.
Canzanelli, G. (2001). Overview and Learned Lessons on Local Economic Development, Human Deveopment, and Decent Work. ILO Working Paper, Geneva. www.ilo.org Downloaded: 11. 04. 2008.
Czakó, K. (2017). Vállalkozásfejlesztés és a területi tőke relációja - A felsőoktatási intézmények szerepe. (Relation of Entrepreneurship Development and Territorial Capital - Role of Higher Education Institutions.) Benyújtott doktori értekezés. Győr: Széchenyi István Egyetem.
Czene, Zs., Horkay N., & Ricz J. (2010). Röviden a helyi gazdaságfejlesztésről. (Shortly about the local economic development.) In Czene Zs., Ricz J. (Eds.), Helyi gazdaságfejlesztés (pp. 13-28). Területfejlesztési füzetek (2). Budapest: Nemzeti Fejlesztési Minisztérium, Nemzetgazdasági Minisztérium, VÁTI.
Fekete, D. (2014). Gazdaságfejlesztés az ingolstadti járműipari központban.(Economic development in the automotive centre of Ingolstadt.) Tér és társadalom, (28)2, 176–187.
Kane, M. (2004). Public-Sector Economic Development: Concepts and Approaches. Northeast-Midwest Institute. Retrieved from http://www2.econ.iastate.edu Downloaded: 10. 05. 2015.
Reisinger, A., Kecskés, P., Czakó, K.
100
Kovács N., & Reisinger A. (2014). Felsőoktatási hallgatók karrierelvárásait befolyásoló tényezők feltérképezése. (A survey of the influential factors of students’ entrepreneurial career choice expectations.) Társadalomkutatás, (32)3, 278–294.
Kullmann, Á. (2009). A regionális gazdaságfejlesztés eszközrendszere és magyarországi alkalmazása. (The tools of the regional economic development and its applying in Hungary.) Doktori értekezés. Budapest: Eötvös Loránd Tudományegyetem, Természettudományi Kar.
Lengyel, I. (2010). Regionális gazdaságfejlesztés. (Regional economic development.) Budapest: Akadémiai Kiadó.
Mezei, C. (2006a). A helyi gazdaságfejlesztés fogalmi meghatározása. (Definition of the local economic development.) Tér és Társadalom, (20)4, 85–96.
Mezei, C. (2006b). A települések versenyképességét befolyásoló helyi gazdaságfejlesztési gyakorlat Magyarországon. (Practice of local economic development in Hungary affecting the competitiveness of settlements.) In Horváth Gy. (Ed.), Régiók és települések versenyképessége (pp. 413–442). Pécs: MTA RKK.
Nafziger, E. W. (2012). Economic Development. Oxford: Cambridge University Press. Pike, A., Rodriguez-Pose, A., & Tomaney, J. (2006). Local and Regional Development.
London and New York: Routledge. Rechnitzer, J. (2016). A területi tőke a városfejlődésben - A Győr Kód. (Territorial Capital
and urban develpoment - Code of Győr) Budapest-Pécs: Dialog Campus Kiadó. Schmitz, G. (2005). Metropolregion Rhein-Neckar - Modellregion für einin kooperativen
Föderalismus. Ramuforschung und Raumordnung, 5. 360366. Swinburn, G., Goga, S. & Murphy, F. (2004). A helyi gazdaságfejlesztés kézikönyve.
(Handbook of local economic development.) Washington, D.C.: The World Bank; London: Bertelsmann Stiftung.

DETUROPE – THE CENTRAL EUROPEAN JOURNAL OF REGIONAL DEVELOPMENT AND TOURISM Vol. 9 Issue 3 2017 ISSN 1821-2506
101
Original scientific paper
SERVING INNOVATION WELL? – MISMATCH BETWEEN THE
SUPPLY AND DEMAND SIDE OF SERVICES BY INNOVATION
INTERMEDIARY ORGANIZATIONS IN HUNGARY
JÓL SZOLGÁLJÁK AZ INNOVÁCIÓT? – ELTÉRÉSEK AZ
INNOVÁCIÓS KÖZVETÍTŐ SZERVEZETEK SZOLGÁLTATÁSAINAK
KERESLETI ÉS KÍNÁLATI OLDALÁBAN
Éva GAJZÁGÓa
a Tomori Pál College, 1223 Budapest, Művelődés u. 21-27., [email protected]
Cite this article: Gajzágó, É. (2017). Serving Innovation Well? – Mismatch between the Supply and Demand Side of Services by Innovation Intermediary Organizations in Hungary. Deturope, 9(3):101-121.
Abstract
Innovation intermediary organizations play a significant role in the national innovation systems as they provide services for the actors of the innovation network. Their main goal is to connect these actors to promote knowledge exploitation and -transfer. In the past 12 years intermediaries were founded and developed in Hungary, however, the effectiveness of their service was not measured comprehensively. This paper presents the main results of an analysis examining the effectiveness of their offered services. Keywords: innovation intermediary organizations, effectiveness, services
Abstract
Az innovációs közvetítő szervezetek fontos szerepet játszanak a nemzeti innovációs rendszerben, mivel az ebben a rendszerben résztvevőknek nyújtják szolgáltatásaikat. Főbb céljuk a tudásteremtők, tudásfelhasználók, illetve az üzleti szféra összekapcsolása a tudáshasznosítás és –transzfer érdekében. Az elmúlt 12 évben Magyarországon megalakultak az innovációs közvetítők, fejlesztették őket, de szolgáltatási hatékonyságuk átfogó felmérésére nem került sor. Ebben a cikkben egy magyar innovációs közvetítők szolgáltatásainak hatékonyságát vizsgáló kutatás eredményeit mutatjuk be. Kulcsszavak: innovációs közvetítő szervezetek, hatékonyság, szolgáltatások
INTRODUCTION
Organizations like the innovation intermediary organizations play a significant role in the
National Innovation Systems (NIS) (like Freeman (1987) and Capello (2006) emphasized).
Freeman (1987) in his work about the Japan innovation system mentions that the NIS is
composed of public and private institutions (such as intermediaries) working in the field of
introducing, applying and spreading inventions. Capello (2006) describes several influencing
factors of innovation like organizations participating in the innovation process.

Gajzágó, É.
102
Intermediary organizations provide services for the actors of the innovation process in which
cooperation and trust-based connections are crucial. They are also significant in regional,
subnational and local level (Hewitt-Dundas–Roper 2011) as they can influence local
innovation factors – such as innovation milieu, knowledge creation and networks or
knowledge capital – which contribute to the development of regional competitiveness
(Johnson–Lehmann 2006, Lengyel 2010, Enyedi 1997)
In the last decade, after Hungary joined the EU, Hungarian innovation system was
developed dynamically. Since 2004 Hungarian national and EU strategic decisions and
financial support fostered the establishment and development of the institutions serving the
innovation process. Institutional background of the Hungarian NIS was founded and from
2006 till 2013 organizations serving the innovation process received more than Forints 120
billion from the calls of the Baross Gabor Program (national support), the New Hungarian
Development Plan’s and New Szechenyi Plan’s Operative Programs (EU co-financed
support) (Gajzágó - Gajzágó 2016).
Innovation Union key initiatives22 foster the market impact and social scope of supported
projects, and also Hungarian Innovation Strategy23 aims to increase the social and economic
sustainability of innovation investments. The strategy lists demand and supply side assets24 to
achieve goals of innovation policy and to give a solution to the difference between the high
amount of support and the low effectiveness. The document emphasizes the development of
intermediaries but does not mention the details (e.g. projects) of this development or the
improvement of the effectiveness of organizations.
As stated above, Hungarian intermediaries received large amounts from national and EU
funds. Recent (2014) country profile about innovation performance of Hungary also indicates
that according to the effective innovation system indicators25‚ ‘Hungary is below the EU
average in most of the areas‘. However, the rate of business enterprise expenditure on R&D
(BERD) financed by EU funds is significantly higher than the EU average. Hungarian and EU
innovation strategies aim to use these supporting funds properly and increase the effectiveness
of innovation projects. The effectiveness of promoted organizations implementing innovation
projects influences the achievements of goals of these higher levels strategies.
Higher level strategies emphasize the importance of effectiveness in innovation
development and they allocate resources to gain it. However, effectiveness is also important at
the organizational level. Service effectiveness of an organization – such as innovation
22 http://ec.europa.eu/research/innovation-union/index_en.cfm?pg=key 23 http://nkfih.gov.hu/szakpolitika-strategia/nemzeti-kfi-strategia/befektetes-jovobe-kfi 24 http://nkfih.gov.hu/szakpolitika-strategia/nemzeti-kfi-strategia/befektetes-jovobe-kfi, pp. 46. 25 http://ec.europa.eu/research/innovation-union/pdf/state-of-the-union/2014/countries/hungary.pdf, pp.3.

Gajzágó, É.
103
intermediaries – is closely connected to the management efficiency and influences their
success (Ostroff–Schmitt 1993, Gaertner–Ramnaravan 1983).
The research introduced in this article examined the effectiveness of services of Hungarian
innovation intermediary organizations. The main goal of the research was to reveal whether
Hungarian innovation intermediaries ‘serve’ the innovation system effectively and whether
their services are effective. Research results introduced below unfolded a mismatch between
the supply and demand sides of the services of these bridging organizations. The empirical
research had a quantitative approach and the paper intends to introduce its result by a
descriptive method.
After the summary of the relevant literature about innovation intermediaries and
effectiveness, including a model of effectiveness and briefly introducing the research
methods, the paper represents the results of a research about the services of intermediaries.
The last chapter contains a synopsis of and some solutions for the revealed problems.
THEORETICAL BACKGROUND
Characteristics of the innovation process and the (national) innovation systems are described
in details in several articles – see e.g. Freeman (1987) as above mentioned or Lundvall
(1992), and Nelson (1993). Based on these characteristics Arocena and Sutz (2002) explains
that the examination of the innovation process and its actors give possible assets for exploring
the economic effectiveness and elaborating specific directives.
Many articles (e.g. Guana–Chen 2012) emphasize national economic policies should focus on
increasing innovation potential and governments need to introduce strategies – like the above-
mentioned innovation strategy of Hungary - and promoting instruments for the development
of the national innovation systems (Flanagan at al. 2011, Lundvall 1995) as the investment in
innovation can increase national and regional economic competitiveness. The establishment
and development of innovation interemdiaries and their services are one of these instruments.
Innovation intermediary organization offer services to the actors of the innovation process
but these services differ according to the types or place of organizations in the innovation
process (Lokshina et al. 2011). Their main goal is to connect knowledge producers with
knowledge users, e.g. researchers and companies or educational and business areas in order to
facilitate and promote knowledge exploitation and – transfer. These bridging organisations
work as agents in the innovation process between different parties involved (Howells 2006).
Through providing specific services, they are also the enablers of innovation, improving

Gajzágó, É.
104
innovation directly (enabling the innovation of firms) or indirectly (increasing the innovative
capacity of regions, nations, or sectors – national and sub-national process) (Buzás 2007).
The tasks and the role of intermediaries – especially in higher educational institutes – are
defined and listed in articles like Jain et al. (2010), Howlett (2010), Stamm (2003) or
Filippetti–Archibugia (2011). In the research introduced in this article, we used a list of
services elaborated by these literature. Filippetti and Archibugia (2011) emphasize that
systems and organizations which influence the cooperation aiming innovation – thus the tasks
of intermediaries – directly influence company innovation. Stamm (2003) lists 8 important
factors which influence the tasks and services of intermediaries. These factors – like the time-
frame, technology, knowledge, financial resources, actors, processes, cultural aspects, and
consumers and markets – are significant for the management these organizations. Howlet
(2011) mentions groups of knowledge transfer activities referring to the HE-BCI research26
measuring higher educational institutes’ innovation services annually according to categories
like research contracts, consultancy, intellectual property, patent applications, established
spin-offs, specific courses, etc. Jain et al. (2010) also classify the task of intermediaries and
list the services of the three main groups of the organizations such as goal oriented, scientific
and academic organizations.
The research presented in the chapters below was focusing on the participant of the
Hungarian national innovation system, on intermediaries in particular. The Hungarian
national and regional (subnational) innovation systems and its actors were examined by
several Hungarian researchers. Their researches focused on a specific region of Hungary
(Dőry 2000, Inzelt–Szerb 2003, Márton 2004, Szépvölgyi 2006, Bajmócy 2006, Csizmadia–
Grosz 2008), examined one group of organizations such as industrial or scientific parks (Barta
2002 and Buzás–Lengyel 2002) or innovation system and networks and cooperation
(Csizmadia–Grosz 2002, 2011, Lengyel–Leydesdorff 2008 and 2011, Parag–Varga 2009).
However, the overall measurement of the effectiveness of services of innovation
intermediaries was not carried out in Hungary before the research presented in this paper.
Defining the effectiveness of intermedaries is a complex task and can be based on several
scientific fields like physics, economics, management or marketing. In physics and technical
sciences effectiveness – or energetical efficiency – is defined as the quotient of outputs and
inputs (Büki 2013, Frischherz et al. 2010). Economics and management theories (Samuelson-
Nordhaus 2012, Varian 2005, Ostroff–Schmitt 1993, Mahoney–Weitzel 1969, Hoy–Hellriegel
1982) also uses the ratio of outputs and inputs for defining the effectiveness of companies and
their profitability. Management scientists also emphasize that the effectiveness depends on 26 Higher education-business and community interaction survey

Gajzágó, É.
105
factors of inner organizational and management. Mahoney and Weitzel (1969) examined 114
factors separately while Hoy and Hellriegel (1982) classified inner and external effectiveness
indicators in their research.
Marketing theories of the effectiveness of service companies are closely connected to the
topic of the research introduced in this paper. Kotler and Andreasen (1987) analyze the
marketing strategies of nonprofit companies and reveal the importance of strategic planning in
the effectiveness of the organization. Hughes and Luksetich (2010) also examined nonprofit
copmanies’ effectiveness and resulted that the accomplishment of the goals of these
organizations is closely connected to the needs of target groups and the effectiveness of
services. However, defining the effectiveness and quality of services is difficult and strongly
influenced by the interpretation of the customer and by the trust based characteristics of the
services (Nádor 2007).
For measuring the effectiveness of the services of intermediaries and based on the above-
mentioned literature and the research results, a three-dimensional model containing indicators
was elaborated by the author. The model was also based on other relevant literature of
efficiency in physics (Frischherz et al. 2010), effectiveness in economics and management
(Koopmans 1951) and project and innovation management effectiveness (as Eilat et al. 2008,
Fisher 2011, Parast 2011, Sundqvist et al. 2014, Csiszér 2016).
Figure 1 Effectiveness model of innovation intermediary organization
Resource: own edition by Csiszér (2016)

Gajzágó, É.
106
Input dimension of the model is represented by external regional factors – like financial
support, development level of the region, etc. – promoting or hindering the management of
intermediaries. The output dimension is also measured by external data which indicate the
effects of innovation intermediary organization to their surroundings. Output dimension
contains indicators like the satisfaction level of the consumers of the intermediaries’ services
or the innovation potential of the region where the intermediary is settled.
In this present article, the author summarizes the research results focusing on the ‘inner’
dimensions of this model. Choosing only the inner dimension does not give an overall result
of the effectiveness of the organizations but is able to highlight management and strategic
problems of innovation intermediaries. The inner dimension contains the effectiveness of the
management and strategic decision making of the intermediaries including the effectiveness
of offered services and communication. The shortage of this inner dimension– e.g. a
mismatch between the demand and supply of services –, the low level of the inner
dimensional indicators can cause effectiveness problems for the organizations.
OBJECTIVES AND METHODS, BASICS OF THE RESEARCH
Incited of the above-mentioned lack of overall measurement of the services of intermediaries
and based on the relevant literature, the research aimed to reveal the effectiveness of these
organizations. Research questions focused on the activity and services, cooperation and
communication of the bridging organizations and the hindering factors of their success.
Measurement of services, communication and organizational factors is connected to the inner
dimension of the above-mentioned effectiveness model. The analysis of services focused on
data as the types and the frequency of offered services or the target groups of the
intermediaries’ services. Using these data the researcher was able to position the respondent
organizations in the innovation process too.
The empirical research intended to find an answer for the problem that several Hungarian
intermediaries enlists a high number of services, but doesn’t provide all of them in reality. We
were also interested in where services of innovation intermediaries can be positioned
regarding the stages of the innovation process. Furthermore, the research wanted to reveal the
differences between the offered services of intermediaries and the needs of their target groups.
The research was elaborated on three levels, containing a national, a regional and a local
analysis. The national level research surveyed the intermediary organizations, while regional

Gajzágó, É.
107
and local researches were focusing on target groups of services of intermediaries like
researchers and companies. 129 organizations answered the national level questionnaire, the
regional survey measured 300 companies and 30 experts in the Central-Transdanubian Region
of Hungary while the local research resulted 131 answers (53 researchers and 78 companies)
in the sub-region of Dunaújváros, Hungary.
This paper focuses on the results of the national level research and uses regional and local
data supplementing these results with the data representing the opinion and motivation of the
target groups of innovation services. Local data was collected in a middle-sized city of
Hungary, in Dunaújváros. However local research cannot significantly be compared to
national level results, there are several fields of effectiveness in which local factors give a
more subtle aspect.
As stated above, this present paper describes only those research results which are
connected to the inner dimension of the model in Figure 1. Both national and subnational
level researches contained information according to this dimension. However reviewing one
dimension can not give an overall picture of the effectiveness of the organizations, examining
inner management of intermediaries gave an answer to several research questions stated
above – e.g. questions about positioning and about the difference of the offered and demanded
services.
Based on the relevant literature about innovation intermediary organizations and their
services (like Jain et al. 2010, Nagaoka et. al 2009, Guana–Chen 2012 or Filippetti–
Archibugia 2011), in the national research we defined and questioned the following types of
innovation intermediary organizations:
Table 1 Types of innovation intermediaries
Type of the organization Number of respondents in the
national level research
technology transfer offices (TTO) 25 chambers of commerce (chamber) 59 regional innovation agencies (RIA) – nonprofit companies 7 business or company development foundations (BDF) – companies and civil organization
21
members of Hungarian Innovation Association (HIA) – civil organization
17
Resource: own compilation

Gajzágó, É.
108
The research aimed to reach all innovation intermediary organization of Hungary in these
groups but did not examine profit-oriented companies participating in the innovation process
as intermediaries. The respondent rate of the questionnaires sent to the organizations listed in
Table 1 was more than 75 percent.
Spatial distribution and types of the analyzed innovation intermediary organizations are
visualized on the following figure:
Figure 2 Spatial distribution of the respondent Hungarian innovation intermediaries (number of organizations)
Resource: own compilation, http://www.chartle.net/embed?index=81208
Most of the intermediaries are located in the Central-Hungarian Region. In Northern-
Hungary, Western-Transdanubia and Southern-Great-Plain Region the number of
organizations – especially chambers – are also significant. This spatial distribution of the
organizations is significantly connected to the distribution of financial resources mentioned in
the introduction chapter. The Southern-Great-Plain and Northern-Hungary Regions received
more support for their innovation project than other regions – except the Central-Hungarian
Region.
The number of organizations working in or near higher educational institutes and chambers
was high in the sample and the fewer answers arrived from profit-oriented companies and
civil organizations. Respondent organizations were mainly founded after 2005 and employ
less than 10 employees.
The research examined 31 services that innovation intermediaries offer. The list contained
7 main groups of services:
1. consultancy
2. education

Gajzágó, É.
109
3. knowledge and technology transfer
4. establishment of cooperation and networks
5. involvement of resources (like applications and tenders)
6. activities regarding protection of intellectual property rights
7. other innovation activities
National level data collection was implemented by questionnaires sent directly to all
Hungarian organization in the above mentioned five groups.
MAIN RESULTS OF THE RESEARCH
The national level research examined the services of intermediaries in details according to the
31 types of services. Examining the rate of organizations offering the listed services, the TOP
10 rank of services (Figure 3) are the following:
Figure 3 TOP 10 rank of services offered by Hungarian intermediaries (percent of intermediaries)
Resource: own compilation
Figure 3 reflects that for the intermediaries the involvement of resources – 5th group of
services in the above-mentioned list - is crucial (three of the TOP 10 services are connected to
financing). Lack of financing as a barrier to innovation has also been indicated in surveys
published by the authors Csizmadia–Grosz (2011), or Dőry (1996).
The target group of the services of innovation intermediary organization was examined by
the data of the national level research. In this article, we only present the results about the two
main target groups – companies and researchers.

Gajzágó, É.
110
The research indicated that most of the intermediaries (nearly 58%) offer the 5th group of
services (involvement of resources like applications and tenders) for the target group of
companies. Other important services offered to this group are the establishment of
partnership, education and other, innovation marketing services. However these services do
not aim the target group of companies, rather the organization itself or other partner
organization (finding resources) or the group of researchers (innovation marketing).
To the target group of researchers, most of the respondent intermediaries (65%) offer other
innovation services like marketing or organizing events. Other important offered services for
researchers are the protection of intellectual property rights and involvement of resources.
Comparing these results to the needs of the target groups (analyzed in the regional and
local research) our results indicated problems of marketing segmentation of the
intermediaries. Defining the proper target group and offering services which they need is
crucial for an organization (Veres, 2002). Contrary to the preferred services of intermediaries
companies do not need services like the involvement of resources or focusing on the
establishment of partnership as they have their own network and can easily manage their
cooperation. The target group of researchers would need information about local projects and
wishes to participate in more R&D possibilities. Both national and subnational research
indicated that there is a mismatch between the offered services and the needs of the target
group of intermediaries.
The national level research also analyzed the positioning of innovation services by
comparing the measured services to the stages of innovation process (based on the model of
Rothwell, 1994). The results showed (in Fig. 4.) that Hungarian intermediaries are not
specialized on a specific stage of the innovation process. More specifically, most of them
serve mainly the ‘starting’ stages of the innovation process (i.e. ideation, invention or R&D
phase) and only less than 60% of the respondent organizations offer services in the ‘ending’
commercialization phase. Focusing on the first stages means that intermediaries lose to obtain
incomes from patenting or implementation.

Gajzágó, É.
111
Figure 4 Types and services of intermediaries vs. innovation process
Resource: own compilation
The overemphasized scale of ‘other’ services (see the ‘other’ columns of the above
diagram) – like innovation marketing or services regarding tenders – also indicate the
marketing positioning problems of intermediaries. These services cannot be closely connected
to one specific stage of the innovation process. Besides, intermediaries usually do not offer
tender services to other organizations but try to involve resources for their own operation.
Comparing the results of the above analysis and the types of organizations it is clear that
Technology Transfer Offices (TTOs) position themselves well in the innovation process,
offering several types of services but mainly supporting the knowledge creation phase.
However, industrial chambers which are closely connected to companies in Hungary – due to
a regulation about the obligatory registering – and have a huge network of partnership, seem
not to utilize this advantage and do not focus on the market placement phase.
Communication problems and weaker impact of communication can also have an effect on
the effectiveness of innovation intermediary organization. Communication and the motivation
of the participants of the communication process (as the element of social capital) are specific
local factors and influence the local innovation system (Enyedi 1997). Therefore the results of
local and regional level survey examining the communication of the intermediaries can give a
more subtle result representing the local relations and milieu. The research revealed that
companies could be considered as well informed about the activities and services provided by
innovation intermediary organizations. However, only one-quarter of them knows to whom
they can turn to get information about innovation problems. Besides, less than 22% of the
companies reported having a living contact with intermediaries. Similar or less percent (10-
0,00
20,00
40,00
60,00
80,00
100,00
120,00
company nonprofit
company
chambers civil TTO
Services of intermediaries compared to the innovation
process
(average % of intermediaries)
needs ideas R&D, manufacturing marketing and sales market placement other

Gajzágó, É.
112
18%) of cooperation was highlighted in the publication of Csizmadia and Grosz (2011) and
Bodas Freitas et al. (2013), thus these results correspond with other European and Hungarian
researches. However, according to the results of our research, the percent of cooperation will
drastically decrease in the next 3 years as less than 10% of the respondents intend to have a
partnership with intermediaries.
About the communication channels used by the target groups, our local research indicated
that online sources and personal connections are the most important ones. Most of the
Hungarian intermediaries have their own websites (more than 56%) or can be found on the
webpage of the hosting higher educational institute but still, many of these sites do not
contain proper or specific information – e.g. about offered services – which the target group
requires.
CONCLUSION
The introduced research results clearly indicate the ‚inner‘ management and service problems
of Hungarian innovation intermediaries. There is a significant mismatch between the services
they offer and the needs of their target groups and the positioning of intermediaries‘ services
is erroneous too.
In consequence, inner management problems of the innovation intermediary organizations
negatively influence their effectiveness. If they offer services which the target groups do not
need, these services will be unsaleable and the target group will not cooperate with them in
the future. The false positioning of services forces intermediary organizations to have an
unreasonably wide service portfolio and implement more activities than they are capable of
(e.g. not closely connected to the innovation process). Both cases implicate management and
financial problems.
There can be a number of issues behind these problems. During the last decade, basic
changes were made in the Hungarian system of institutions and also in the national innovation
system (NIS). The main innovation institutions were founded in the early 2000s but since then
the system was continuously changing. For instance, since 2004 one of the main organizations
which is responsible for the coordination of the R+D+I (research and development and
innovation) process in Hungary, the NKTH (National Research and Development Office)
became the NIH (National Innovation Office), then changed to NKFIH (National Research
and Development and Innovation Office).

Gajzágó, É.
113
The system of grants supporting innovation has also been transformed continuously. The
role of the government financing the innovation process has been gradually decreased but this
reduction influenced the system of organizations only to a small extent. The structure of the
NIS is extended and some of the organizations have parallel functions. Decentralization and
networking – emphasized in the EU – have already begun but hindered. In the few last years,
the financing of the organizations (like intermediaries) was de-emphasized.
Intermediary organizations face many difficulties because of the unstable, project-centered
and non-continuous financing, therefore they are forced to focus on the involvement of
resources. Financing of innovation is a part of the input dimension of the model mentioned in
the theoretical background chapter and was also examined by the author during to the above-
mentioned national research. In Hungary, intermediaries can apply for several EU co-financed
and national calls. However, these sources do not support the whole management and
operation of innovation intermediaries as they only promote specific projects – like improving
the licensing process or the establishment of start-ups. Besides, financing methods of
applications do not give a stable financial background to the organizations as the sum and
spatial distribution of the resources change according to time. In the beginning of the
financing period more support are distributed to several regions but at the end of the period,
only a few organization in some regions can receive grants. For instance, larger state aid was
received by intermediaries in the first year (2006) of the national Baross Gábor Program, 70%
of the total four year budget was spent then.
This unsuitable financing method and the fact that most of the services and activities of the
intermediaries (e.g. licensing) do not result immediate profit multiplicatively increase the
financial burden and liquidity problems of the organizations. Besides, involving investors in
Hungary – e.g. for research projects – is also difficult due to the low level of trust (Research
results about trust in the Hungarian innovation system are mentioned in Inzelt’s (1998)
article.)
Financial and liquidity problems drive intermediaries to provide all kind of services and
run projects that contribute to their survival. Importing more activities into the offered group
of services to involve resources also causes dispositioning of the organizations in the
innovation process. Industrial chambers, for instance, now need to focus on educational
services to gain more prompt incomes rather than utilizing their wide range network and
offering more ‘ending phase’ innovation services (positioned to the marketing phase of the
innovation process) to the companies.

Gajzágó, É.
114
Solutions for the problems revealed in the presented research should be complex and need
to use system approach. Implementation of long-term goals of innovation strategies, stable
institutional and financial system can decrease financial burden of organizations and increase
the trust of the participants of the innovation process in their partners. Trust-based
cooperation of intermediaries with their target groups is also necessary for their development.
Besides of these ‘input’ dimensional changes, intermediaries also need to focus on the
development of their inner management facilities and methods. Offering their services for the
target groups which need it, positioning themselves clearly in the innovation process and
increasing the effectiveness of their communication would result more operational
effectiveness.
The above-mentioned problems of Hungarian innovation intermediaries influence not only
of their organizational and service effectiveness. Inappropriate services, less effective
communication result law cooperation of companies and researchers with intermediaries thus
negatively influence the innovation process and the innovation potential of Hungarian
regions. Therefore solving these problems is crucial for actors and decision makers
participating in the Hungarian innovation system.
SUMMARY
Innovation intermediary organizations play a significant role in national innovation systems as they provide services for the actors of the innovation network. Their effectiveness influences the innovation potential of national or regional innovation system too. The main goal of intermediaries is to connect the actors of innovation network to promote knowledge exploitation and -transfer. In the past 12 years intermediaries were developed in Hungary, however, their effectiveness was not measured comprehensively. Our survey examined the services of Hungarian innovation intermediary in details. The main question was whether Hungarian innovation intermediaries ‘serve’ the innovation system effectively. Our results highlighted several ‘inner’ management problems of these organizations like the significant mismatch between the provided services and the needs of the target groups or the positioning of intermediaries’ services. The problems have affected not only on their effectiveness but negatively influence the innovation process.
REFERENCES
Arocena, R., & Sutz, J. (2002). Innovation Systems and Developing Countries, DRUID Working Paper No 02-05, letöltve: http://www3.druid.dk/wp/20020005.pdf, 2012.05.14., 14:10
Bajmócy, Z. (2006). Egyetemi üzleti inkubáció lehetőségei elmaradott térségekben, Tér és Társadalom, 2006/3., 31-47. p.
Barta, Gy. (2002). Tudományos parkok: intézményesült tudásközösségek a térségfejlesztésben, Buzás-Lengyel (szerk.) Ipari parkok fejlődési lehetőségei: regionális gazdaságfejlesztés, innovációs folyamatok és klaszterek. JETEPress, Szeged, 109-124. p.

Gajzágó, É.
115
Bodas Freitas, I. M., Geuna, A., & Rossi, F. (2013). Finding the right partners: Institutional and personal modes of governance of university-industry interactions, Research Policy, 42, 50-62. p.
Büki, G. (2013). Energiarendszerek jellemzői és auditálása, PI Innovációs Kft., Szentendre, ISBN 978-615-5093-05-0
Buzás, N. (2007). Innovációmenedzsment a gyakorlatban (Innovation management in practice), Akadémiai Kiadó, Budapest, 360. p.
Buzás, N., & Lengyel, I. (2002). Ipari parkok fejlődési lehetőségei: regionális gazdaságfejlesztés, innovációs folyamatok és klaszterek, 5. fejezet: Technológiatranszfer-szervezetek és szerepük az innovációs eredmények terjedésében, SZTE GTK, JATEPress Szeged, 93-108. o., letöltve: http://www2.eco.u-szeged.hu/region_gazdfejl_szcs/pdf//konyv1/05_TTsz_innov_BN.pdf, 2011-10-03., 10:00
Capello, R. (2006). Regional Economics. Routledge, London Csiszér, T. (2016). FAR model - the ‘Rubik’s cube’ of process and project monitoring,
Monitoring indicator structure for projects and processes with repetitive production or service activities, jegyzet, Edutus Főiskola
Csizmadia, Z., & Grosz, A. (2002). Szervezet-központú hálózatok: az ipari parkok térségi-intézményi kapcsolatrendszerének és együttműködési aktivitásának szerkezeti jellemzői, Tér és Társadalom, 16. évf., 2002/2., 53-80. p.
Csizmadia Z., Grosz, A. (2008). Innovációs folyamatok egy régióban és annak struktúrái, Tér és Társadalom 22. évf. 2008/2. 87-102. p.
Csizmadia, Z., & Grosz, A. (2011). Innováció és együttműködés, A kapcsolathálózatok innovációra gyakorolt hatása (Innovation and cooperation, Effects of cooperation networks on innovation), MTA Regionális Kutatások Központja, Pécs-Győr
Dőry, T. (1996). A kutatás-fejlesztés egyes jellemzőinek területi szerkezete (Spatial structure of some characteristics of research and development), Tér és Társadalom, 10:(2-3) 157-165. p.
Dőry, T. (2000). Vállalkozások innovációs tevékenysége a Közép-Dunántúlon, Tér és Társadalom, XIV. évf., 2000/2-3., 53-62. p.
Eilat, H. et. al. (2008). R&D project evaluation: An integrated DEA and balanced scorecard approach, The International Journal of Management Science, 36(5), 895–912.
Enyedi, Gy. (1997). A sikeres város, Tér és Társadalom, 1997/4, 1-7 Filippetti, A., & Archibugia, D. (2011). Innovation in times of crisis: National Systems of
Innovation, structure, and demand, Research Policy, 40(2), 179–192. Fisher, E. (2011). What practitioners consider to be the skills and behaviours of an effective
people project manager, International Journal of Project Management, 29(8), 994-1002.
Flanagan, K., Uyarraa, E., & Laranjab, M. (2011). Reconceptualising the ‘policy mix’ for innovation, Research Policy, 40(5), 702–713.
Freeman, C. (1987). Technology and Economic Performance: Lessons from Japan, London, Pinter,155. p.
Frischherz, A., Dax, W., Gundelfinger, K., Häffner, W., Itschner, H., Kotsch, G., & Staniczek, M. (2010). Fémtechnológiai táblázatok, B+V Kiadó
Gaertner, G. H., & Ramnaravan, S. (1983). Organizational Effectiveness: An Alternative Perspective, Academy of Management Review, 8(1), 97. p.
Gajzágó, É., & Gajzágó, G. (2016). Grants supporting in novation intermediary organizations, Deturope: Central European journal of tourism and regional development, 8(2), 35-47. (2016)

Gajzágó, É.
116
Guana, J., & Chenc, K. (2012). Modeling the relative efficiency of national innovation systems, Research Policy, 41(1), 102–115.
Hewitt-Dundasa, N., Roperb, S. (2011). Creating advantage in peripheral regions: The role of publicly funded R&D centres, Research Policy, 40(6), 832–841.
Howells, J. (2006). Intermediation and the role of intermediaries in innovation. Research Policy, 35: 715-728.
Howlett, R. J. (ed.) (2010). Innovation through Knowledge Transfer, 2010. Springer-Verlag, Berlin–Heidelberg.
Hoy, F., & Hellriegel, D. (1982). The Kilmann and Harden Model of Organizational Effectiveness Criteria for Small Business Managers, The Academy of Management Journal, 25(2), 308-322.
Hughes, P., & Luksetich, W. (2010). Modeling nonprofit behavior, in Handbook of Research on Nonprofi Economics and Management (ed. Seaman-Young), Edward Elgar Publishing Limited
Inzelt A. (1998). Bevezetés az innovációmenedzsmentbe, Műszaki Könyvkiadó – Magyar Minőség Társaság, Budapest
Inzelt A., & Szerb L. (2003). Az innovációs aktivitás vizsgálata ökonometriai módszerekkel, Közgazdasági Szemle, Műhely, L. évf., 2003. november, 1002-1021. p.
Jain, R. K., Triandis, H. C., & Weick, C. W. (2010). Managing Research, Development and Innovation: Managing the Unmanageable, John Wiley & Sons, Inc
Johnson, B., & Lehmann ,M. (2006). Sustainability and Cities as System of Innovation, DRUID Working Paper No. 06-07, letöltve: http://www3.druid.dk/wp/20060017.pdf, 2011.04.27., 12:30
Koopmans, T. C. (eds.) (1951). Activity Analysis of Production and Allocation, Proceedings of a Conference, Cowles Commission Monograph, No. 13. John Wiley, New York
Kotler, P., & Andreasen, A. R. (1987). Strategic marketing for nonprofit organizations, 3rd edition, Prentice-Hall Inc., New Jersey
Lengyel B., & Leydesdorff, L. (2011). Regional Innovation Systems in Hungary: The Failing Synergy at the National Level. Regional Studies, 45(5), 677–693. p.
Lengyel B., & Leydesdorff, L. (2008). A magyar gazdaság tudásalapú szerveződésének mérése: az innovációs rendszerek szinergiáinak térbelisége. Közgazdasági Szemle, LV, június, 522-547. p.
Lengyel, I. (2010). Regionális gazdaságfejlesztés, Versenyképesség, klaszterek és alulról szerveződő stratégiák, Akadémiai Kiadó, Budapest
Lokshina, B., Hagedoorna, J., & Letterie, W. (2011). The bumpy road of technology partnerships: Understanding causes and consequences of partnership mal-functionin. Research Policy, 40(2), 297–308.
Lundvall, B.-Å. (Ed.) (1992). National Systems of Innovation, London, Pinter Publisher, Lundvall, B-Å (2002). The University in the Learning Economy, letöltve:
http://www3.druid.dk/wp/20060006.pdf, 2011.04.27., 13:10 Mahoney, T., & Weitzel, W. (1969). “Managerial models of organizational effectiveness”,
Administrative Science Quarterly, 14(3), 357-365. Márton Gy. (2004). Innovációs potenciál felmérés tanulságai egy elmaradott régióban, Tér és
Társadalom, XVIII. évf., 2004/3., 127-149. p. Nagaoka, S., Kondo, M., Flamm, K., & Wessner, C. (2009). 21st Century Innovation System
for Japan and the United States, Comparative Innovation Policy, The National Academic Press, Washington, D.C.
Nádor, É. (2007). Az üzleti tanácsadás marketingje, Akadémiai Kiadó, Budapest Nelson, R. R. (Ed.) (1993). National Innovation Systems: A Comparative Analysis, Oxford
University Press, Oxford

Gajzágó, É.
117
Ostroff, C., & Schmitt, N. (1993). Configurations of Organizational Effectiveness and Efficiency. Academy of Management Journal 36(6), 1345-1361. p.
Parag A., & Varga A. (2009). Egyetemi tudástranszfer és a nemzetközi kutatási hálózatok szerkezete, Közgazdasági Szemle, Tanulmány, LVI. évf., 2009. április, 343—358. p.
Parast, M. M. (2011). The effect of six sigma projects on innovation and firm performance. International Journal of Project Management, 29(1), 45-55.
Project Management Institute. (2008a). A guide to the project management body of knowledge: (PMBOK® guide). (4th ed.). Newtown Square, Pa.: Project Management Institute, Inc.
Project Management Institute. (2008b). Organizational project management maturity model (OPM3) (2nd ed.). Pennsylvania, US
Rothwell, R. (1994). Industrial Innovation: Success, Strategy, Trends in The Handbook of Industrial Innovation (Dodson M, Rothwell, R), 41. p.
Samuelson, P. A., & Nordhaus, W. D. (2012). Közgazdaságtan (Economics), Akadémiai Kiadó, ISBN: 9789630591607
Stamm, B. (2003). Managing Innovation, Design and Creativity, London Business School Sundqvist, E., Backlund, F., & Chronéer, D. (2014). What is project efficiency and
effectiveness? Social and Behavioral Sciences, 119, 19 March 2014, 278-287. p. Szépvölgyi, Á. (2006). A tudásközvetítés és –felhasználás helyi hálózatai a Közép-
Dunántúlon (Knowledge transfer and usage networks in Central-Transdanubea), Tér és Társadalom 20(4), 145-159.
Varian, H. R. (2012). Mikroökonómia középfokon, Akadémiai Kiadó, ISBN: 9789630591805 Vekinis, G. (2014). Technology Transfer in practice: from Invention to Innovation - a step-
by-step guide for Researchers and Inventors, ISBN-10: 9609358551, ISBN-13: 978-9609358552, 285. p.
Veres, Z. (2002). Szolgáltatásmarketing (Service marketing), Budapest: Műszaki Kvk., 344. p.
NOTES
QUESTIONAIRE OF THE NATIONAL LEVEL RESEARCH
Questionnaire for innovation intermediary organizations
1. Address of the headquarter of the organization: _____________________________
2. When was the organization established? a) before 1989 b) between 1990 and 1995 c) between 1996 and 2000 d) between 2001 and 2005 e) after 2006
3. Legal form of the organization:
a) for-profit company b) non-profit company c) sole entrepreneur d) chamber e) civil organization f) other: ……….

Gajzágó, É.
118
4. Please indicate your position in the organization!
a) owner b) top manager c) middle manager d) employee e) other: ……….
5. Number of employees of the organization:
a) 0 b) 1-9 c) 10-49 d) 50-249 e) more than 250
6. Please indicate the target group of the services of your organization. (More answer is possible)
a) companies i. micro and small size companies
ii. medium size companies iii. large companies
b) researchers c) higher educational institutes d) civil organizations e) innovation intermediaries f) networks and clusters g) other advisory organization (not intermediaries) h) other private persons i) I do not know. j) other: -------------------------
7. Please indicate the three main – most important – target groups of your organization – to which you
offer the most of your services. (Three answer is possible) a) companies
iv. micro and small size companies v. medium size companies
vi. large companies b) researchers c) higher educational institutes d) civil organizations e) innovation intermediaries f) networks and clusters g) other advisory organization (not intermediaries) h) other private persons i) I do not know. j) other: -------------------------
8. Does your organization have any service directly connected to innovation?
a) yes b) no c) I do not know.
9. What kind of services does your organization offer to its target groups? (More answer is possible)
a) advisory b) educational c) knowledge and technology transfer d) establishment of partnerships and networks e) involvement of resources (e.g. tenders and applications) f) protection of intellectual property rights g) other innovation services

Gajzágó, É.
119
10. How frequently your target groups demand (use) the below-mentioned ADVISORY services?
Services daily weekly monthly several times a
year rarely never
advises about innovation in general
management advises
financial advises
advises about intellectual property rights
advises about starting a company
advises about starting a spin-off
other advisory: …………………
11. How frequently your target groups demand (use) the below-mentioned EDUCATIONAL services?
Services daily weekly monthly several times a
year rarely never
organizing and implementation of courses of knowledge and technology transfer
organizing company development and spin-off courses
other courses: …………………
12. How frequently your target groups demand (use) the below-mentioned KNOWLEDGE AND
TECHNOLOGY TRANSFER services?
Services daily weekly monthly several times a
year rarely never
scientific and innovation marketing
scientific dissemination activity (e.g. research catalogues, laboratory brochures, etc.)
organizing innovation exhibitions
organizing other events about innovation
organizing other scientific events
elaboration and maintenance of knowledge maps
incubation and management of spin-off companies
organizing innovation or idea competitions
organizing business plan competitions
13. How frequently your target groups demand (use) the below-mentioned PARTNERSHIP AND
NETWORK ESTABLISHING services?
Services daily weekly monthly several times a
year rarely never
development of company partnership
connecting and partnership with VCs and business angels
building an international scientific partnership

Gajzágó, É.
120
membership in international knowledge and technology transfer or innovation organizations (e.g. ASTP)
participation in the events of international knowledge and technology transfer or innovation organizations
14. How frequently your target groups demand (use) the below-mentioned RESOURCE INVOLVEMENT
services?
Services daily weekly monthly several times a
year rarely never
writing applications and tenders
management of applications’ and tenders’ projects
searching for resources for innovation projects
searching for investors for the use of intellectual property or for inventions
15. How frequently your target groups demand (use) the below mentioned INTELLECTUAL
PROPERTY RIGHTS services?
Services daily weekly monthly several times a
year rarely never
evaluation of intellectual property
registration of intellectual property (with procurators)
management of industrial property protection
participation in the process of distributing incomes from intellectual property rights and in handling conflicts about it
advisory about intellectual property
advisory about the use of intellectual property
16. How frequently your target groups demand (use) the below mentioned OTHER INNOVATION
services?
Services daily weekly monthly several times a
year rarely never
searching for R&D results
research about the current state of technology
elaboration of company research agreements
management of incubator
17. How effective do you think the knowledge and technology transfer services of your organization are?
1 not effective
at all
2 less
effective
3 moderately
effective
4 quite
effective
5 very
effective

Gajzágó, É.
121
18. How effective do you think your organization are in general?
1 not effective
at all
2 less
effective
3 moderately
effective
4 quite
effective
5 very
effective
19. Please esteem the time (how many % of your working hours?) that you and your colleagues spend with
offering knowledge and technology transfer services. a) 0-10% b) 10-30 % c) 30-50% d) 50-70% e) 70-100% f) I do not know.
20. How much income (Ft) does your organization have annually? (Consider the average of the previous 3
years incomes). a) under 10 million b) between 10-25 million c) between 25-50 million d) between 50-100 million e) above 100 million f) I do not know.
21. How many percent of your income comes from the services of knowledge and technology transfer and
innovation? a) 0-10% b) 10-30 % c) 30-50% d) 50-70% e) 70-100% f) I do not know.
DETUROPE – THE CENTRAL EUROPEAN JOURNAL OF REGIONAL DEVELOPMENT AND TOURISM Vol. 9 Issue 3 2017 ISSN 1821-2506
122
Original scientific paper
KISÚJSZÁLLÁS, ‘THE CULTURAL CAPITAL OF GREAT CUMANIA’
– SHRINKAGE, RESILIENCE AND CULTURE-BASED URBAN
DEVELOPMENT IN EAST HUNGARY
Tibor KOVÁCSa
a PhD, habil., associate professor, geophilosopher; Eszterházy Károly University, 3300 Eger, Eszterházy Square 1., Hungary, e-mail: [email protected]
Cite this article: Kovács, T. (2017). Kisújszállás, ‘the Cultural Capital of Great Cumania’ – Shrinkage, Resilience and Culture-Based Urban Development in East Hungary. Deturope, 9(3):122-140.
Motto
“Cultural matters are integral parts of the lives we lead. If development can be seen as enhancement of our living standards, then efforts geared to development can hardly ignore the world of culture.”
(Amartya Sen)
Abstract
Demographic changes (population decline) and their (urban) consequences are a real challenge for the small and medium-sized towns of Europe and Hungary. The research question concerning this phenomenon is: how to deal with urban shrinkage and is there any proper and overall answer to this process? Although there is no universal cure for the maintenance and development of these towns, nor for stopping demographic shrinkage, resilience and local culture can provide good conditions to deal with the urban issues raised. Kisújszállás, the cultural capital of Great Cumania can be a good example of how the function-extending renewal of a historical building of the town can strengthen its retaining power and how it can also contribute to increasing the attractiveness of the settlement, all in all, making it a more attractive and viable place to live in. Keywords: Kisújszállás as a shrinking town; resilience; endogenous resources; new approach: culture-based urban development
INTRODUCTION
The problem of shrinking towns in Hungary and Europe
‘Towns decline not because their industries disappear but because there are no new industries
to be created instead of the old ones.’ (Jacobs, 1969)
In the post-modern era in most parts of Europe (including Hungary), besides the de-
industrialisation and de-economisation of certain regions and settlements the above motto can
be connected and completed with the demographic transformation and decline of towns
(population shrinkage, migration, aging population), which can be characterised by the
dilemma of ‘decreasing population – decreasing abilities (?)’, let alone the issue of
maintaining, developing and making viable such small towns in the middle and the long run.

Kovács, T.
123
We can find diverse international literature related to worldwide shrinkage (e.g. Bernt,
2009; Bernt et al., 2012; Couch et al., 2012; Martinez-Fernandez et al., 2012; Neill &
Schlappa, 2016; Reckien & Martinez-Fernandez, 2011, etc., and the author of this article also
has some publications concerning demographic shrinkage in towns, e.g. Kovács, 2014;
Kovács, 2016), shrinkage is average and complex at the same time, each and every settlement
has its own set of problems, however, the unique problem of how to be viable is closely
connected with a really fashionable theory (and potential practice) of present days, the so-
called resilience, adaptable to settlement development as well, the use of which in urban
development can give the answer how to handle shrinkage and its complex negative
consequences.
In order to overcome the inherited and still constantly generated problems of how to run
and develop settlements, the majority of the Hungarian (small) towns, having their serious
social-economic problems mentioned above, was involved in efficient (yet not always useful
and sustainable) activities of gaining sources from the European Union. They have focused
mainly on physical-material developments, overshadowing the development of local human
resources, which seems to be a rather short-sighted approach.
At the same time, the future-oriented, new strategic way of thinking, planning and
implementation focuses not only on material developments with an engineering aspect but it
has a complex socio-philosophic approach as well. It would consciously plan the potential
penetration points of the town taking into account the special qualities, endogenous resources,
local intellectual potential and the capital involved in the existing cultural symbols and man-
made heritage of the given settlement. As Ghilardi stresses: ‘cultural planning has to be part
of a broader strategy of local development and to create linkages with urban planning,
economic policy, industrial policy etc’ (Ghilardi, 2005). More precisely and holistic, as
Tamás Lukovich wrote in a perfect way in 2001: ‘Planning a town is planning its culture.’
In my study I will mention physical developments, too, but my main approach of culture-
based urban development is to analyse the town as a symbol (as the term involves this kind of
approach). To justify and prove this approach let me give an adequate definition: ‘a town is
not a mere collection of dimensions given mostly by measurable parameters, perceptible and
extended in time and mostly in space, [but] also a separate entity, not or partly comparable
with something else, a closed universe which can be comprehended only by its unique
qualities.‘ (Gyáni, 1995)

Kovács, T.
124
As we see, Kisújszállás, the typical town of Great Cumania27, ‘comprehended by its unique
qualities’ can also be a ‘good example’, a positive case study, at least partly. The town sees it
clearly that ‘with the disappearance of the patterns related to the industrial periods there is a
way to reform the once existed ‘immaterial’ role’ (Frey 1993, Drennan 2002), thus the town
can start its way to become an attractive, viable, sustainable and resilient town in the middle
and the long run, with the developments based mostly on the town’s cultural qualities.
Adopting conscious, culture-based urban development Kisújszállás wishes to become the
leading settlement of the region, in the field of culture (i. e. in Great Cumania, which is also a
symbol). Several strategic developments concerning culture have already been accomplished
according to this new concept; the study below gives an outline of this process.
Culture as a tool of the 21st century urban development
The postmodern period requires the existence and adaptation of different resources compared
to the economy of the previous period of Fordism. Nowadays, the conditions for local and
regional development do not depend only upon hard infrastructures but on soft infrastructures,
among which culture occupies a privileged position. Today, motors of competitiveness and
sustainable development are parameters like: quality of life, natural environment, social
solidarity, cultural activities and services and the broad participation in them by social groups,
protection and innovative valorization of heritage, the creation of ‘cultural clusters’: such
clusters is advisable to be developed around cultural heritage resources (Arvanitaki 2007, 7).
Especially since 2000 – from local to international-scale, and involving scholars,
practitioners, planners, and policy-makers at various government levels – culture is gradually
becoming recognized in principle as a cross-cutting issue in local/urban sustainable
development (Duxbury et al. 2016, 7) (see Fig. 1.).
27 It is one of the typical cultural-ethnic regions of Hungary on the Great Plain, east of the river Tisza. Its ancient inhabitants were the originally nomadic Cuminians who might have settled more than 300 years after the Hungarians in the country badly stricken by the Mongolo-Tatarian invasion. Today agriculture plays an important role in its economy, it is above the average in the Hungarian national economy. As for its socio-economic development index as a whole, it is a semi-peripheral region, below the national average.

Kovács, T.
125
Figure 1: How culture contributes to development
Source: URL 1
Culture-led development also includes a range of non-monetized benefits, such as greater
social inclusiveness and rootedness, resilience, innovation, creativity and entrepreneurship for
individuals and communities, and the use of local resources, skills, and knowledge (URL 1,
4).
From the point of view of urban development it is a central issue and it will still be in the
future that cultural economy is one of the most dynamically increasing, typical element of the
(post)modern urban economy (Süli-Zakar et al. 2006). Today, many cities use cultural
heritage and cultural events and institutions to improve their image, stimulate urban
development, and attract visitors as well as investments (URL 1, 4). It must be recognised that
‘culture is a huge business. It is one of the leading sectors of the post-Fordist economic
revolution and the base of several programmes related to town renewal’ (Scott, A., quoted by
Süli-Zakar et al. 2006).
Creating urban culture in a planned, thoughtful way and its effective marketization can be
a significant base regarding the viability, sustainability, resilience and future providing of the
very often shrinking settlements as cultural economy has different components, can be utilised
in a complex way (traditional cultural services; cultural-products industry) (Süli-Zakar et al.
2006).

Kovács, T.
126
Local traditions, festivals, ethnographic attractions can mean the enhancement of tourism
and the handicraft activities which were less successful in the period of industrial mass
production can revive as well (Süli-Zakar et al. 2006). Due to the symbolic, image-creating
and image-enhancing feature of cultural economy it is able to generate such appeal which has
an impact on the society and economy of the town.
It is worth mentioning that urban cultural economy is especially sensitive to the quality of
the local society, i.e. to the quality of the human resources base.
Another key element of the development of cultural economy is the active politics in this
field of the local government, the representative of the local community. The prime role of
‘smart’ local public administration can be overstressed, as well as the creation of inclusive
partnerships. At this point, the contribution of culture is considered a key factor in mobilizing
local structures and building up social consensus (Arvanitaki 2007, 7). It is obvious that the
conception and implementation of a strategic cultural policy linked to the development of a
city stems mainly form enlightened and dynamic local leaderships (Parkinson & Biankini
1994).
It can be for instance raising cultural expenditures, reorganising the cultural institutions of
the town, increasing their efficiency, growing the number and quality of cultural events and
revitalising man-made heritage using extended functions (Süli-Zakar et al., 2006),
contributing to the improvement of the living standard of the town.
The promotion of culture by the towns, as a public policy serving both social and
development targets, has become an imperative of our times: how to link local development
with culture, this is what Cultural Planning is about (Arvanitaki, 2007, 7). The more the
cultural sector is organically and heuristically integrated into strategic urban policies the
better it can help the latter in achieving its objectives (Arvanitaki, 2007, 4).
Resilience – a fashionable term in settlement development
Each and every era has their own trendy words, so does science: new expressions emerge, old,
forgotten ones come to the front or terms which were used in other disciplines penetrate and
become legitim in the fields where prior the given term was unfamiliar.
Such an expression in social sciences is the so-called ‘resilience’. Without explaining it
and its background content in detail (Holling, 1973; Bourbeau, 2013; Chandler, 2013; Joseph,
2015; Neocleous, 2013; do it very often, sometimes arguing with each other, Fejérdy &
Karvalics, 2015, Kuslits 2015, Székely 2015 also, quoting them), a brief analysis has to be
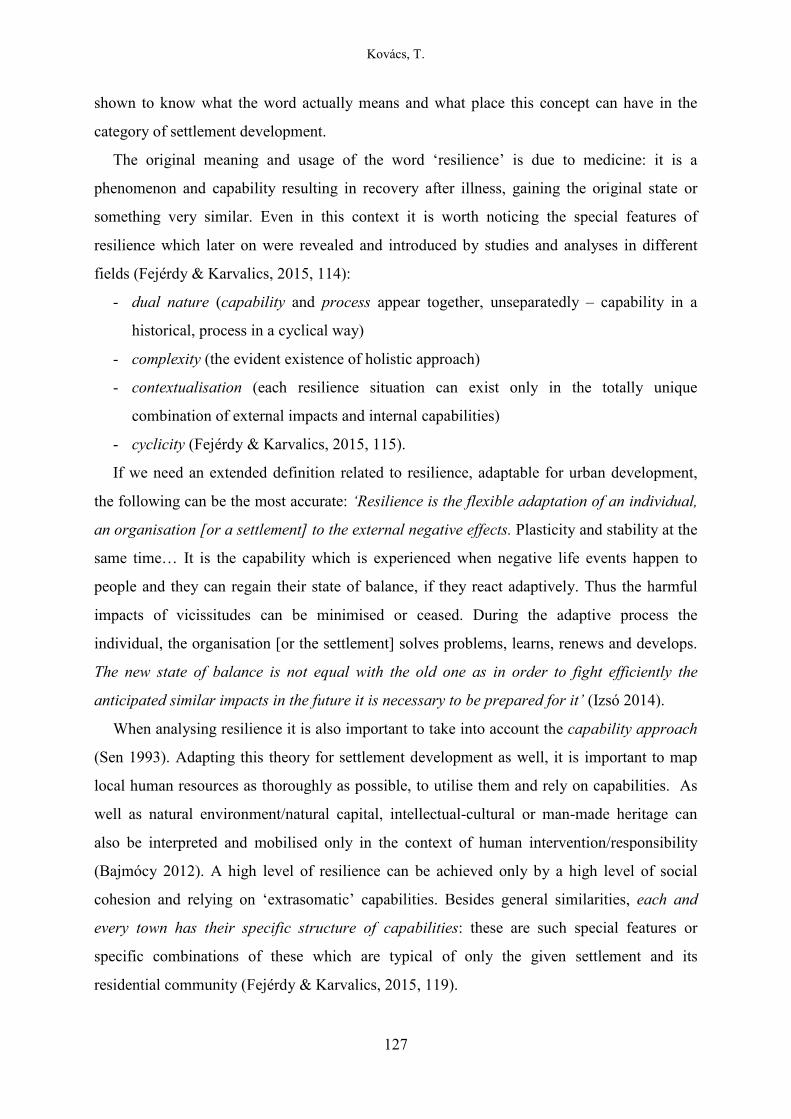
Kovács, T.
127
shown to know what the word actually means and what place this concept can have in the
category of settlement development.
The original meaning and usage of the word ‘resilience’ is due to medicine: it is a
phenomenon and capability resulting in recovery after illness, gaining the original state or
something very similar. Even in this context it is worth noticing the special features of
resilience which later on were revealed and introduced by studies and analyses in different
fields (Fejérdy & Karvalics, 2015, 114):
- dual nature (capability and process appear together, unseparatedly – capability in a
historical, process in a cyclical way)
- complexity (the evident existence of holistic approach)
- contextualisation (each resilience situation can exist only in the totally unique
combination of external impacts and internal capabilities)
- cyclicity (Fejérdy & Karvalics, 2015, 115).
If we need an extended definition related to resilience, adaptable for urban development,
the following can be the most accurate: ‘Resilience is the flexible adaptation of an individual,
an organisation [or a settlement] to the external negative effects. Plasticity and stability at the
same time… It is the capability which is experienced when negative life events happen to
people and they can regain their state of balance, if they react adaptively. Thus the harmful
impacts of vicissitudes can be minimised or ceased. During the adaptive process the
individual, the organisation [or the settlement] solves problems, learns, renews and develops.
The new state of balance is not equal with the old one as in order to fight efficiently the
anticipated similar impacts in the future it is necessary to be prepared for it’ (Izsó 2014).
When analysing resilience it is also important to take into account the capability approach
(Sen 1993). Adapting this theory for settlement development as well, it is important to map
local human resources as thoroughly as possible, to utilise them and rely on capabilities. As
well as natural environment/natural capital, intellectual-cultural or man-made heritage can
also be interpreted and mobilised only in the context of human intervention/responsibility
(Bajmócy 2012). A high level of resilience can be achieved only by a high level of social
cohesion and relying on ‘extrasomatic’ capabilities. Besides general similarities, each and
every town has their specific structure of capabilities: these are such special features or
specific combinations of these which are typical of only the given settlement and its
residential community (Fejérdy & Karvalics, 2015, 119).

Kovács, T.
128
It is characteristic that everyday problems and tasks of urban management in a routine-like
world of idealess reflections to the changes in ‘statistics’ population data (e.g. demographic
shrinkage) the never-ceasing exploration, evaluation and re-evaluation (depending on
changing circumstances) of ‘capabilities’ are neglected.
At the same time, the strategic aim of how to enhance retaining power and resistance can
be seen in slogans rather than in consciously composed middle-term programmes (Fejérdy &
Karvalics, 2015, 119).
Yet it can be easily understood that even one single (!) citizen’s special ‘capability’, a
‘capability’ based on one single historic building or one single specific natural resource –
characteristic only of the given settlement – can be the starting point or buoyant force of
strengthening resilience and creating new strengths. To achieve this aim it is not enough to
think in point-like capabilities, it is inevitable to base on processes, recognising their cyclic
nature and identifying properly the essential characteristics of particular cycle stages (Fejérdy
& Karvalics, 2015:119).
Combining culture and resilience – focusing on urban historic buildings
‘All urban communities, whether they have developed gradually over time or have been
created deliberately, are an expression of the diversity of societies throughout history.’– it is
stated in the very first sentence of the introduction in the international charter acknowledged
in 1987 of Protecting Historical Towns (Washington Charter 1987). As (man-made) cultural
heritage and resilience started to be incorporated in the scientific and pragmatic development
discussion next to each other, combined with preparations for catastrophies and renewals after
them, combining material and social aspects – existing mutually – can be said almost evident
here (Fejérdy & Karvalics, 2015, 123): ‘… just like biological diversity increases the
resilience of natural systems, similarly, cultural diversity is also able to enhance the resilience
of social systems. Preserving cultural diversity for the future together with all the knowledge,
innovation and prospects it offers will increase the capacity of human systems which enables
them to adapt to changes or to live together with them. Cultural heritage as the key element of
cultural diversity is a crucial aspect in defining the strategies serving the development of
community resilience… Resilience is meant both for men both man-made and natural
environment; it is shaped by physical and social factors as well.’ (URL 2)
Not only was resilience put into the dictionary of heritage protection, but it also became a
trendy topic immediately (Ripp 2013). What has been thought over during the past few years

Kovács, T.
129
in connection with historic buildings as an outstanding element of how to create urban image
and identity sounds especially exciting (Fejérdy & Karvalics, 2015, 123).
In the life of towns and their communities individual identity consciousness has a
determining role; their adaptation cycles can go on being in action, in other words, we can
talk about renewal only if this specific identity exits and has its influence. Historic buildings
are the most important visible (in addition, feasible for different functions) attributes of this
identity – due to their physical existence, stability, real and symbolic meanings (Fejérdy &
Karvalics, 2015, 123). Physical existence includes significant ‘inertness’. It is even expressed
in the word ‘immovable (estate)’. For resilience it is a kind of stabilising power similar to the
ballast of the well-known toy (tumbler) which always puts the figure into its vertical (normal)
position, thus turning on its peg. This effect – under certain circumstances – predominates
even if the physical state of the given buildings is not satisfactory or they have partly or
completely been obsoleted: the values they represent cannot be materialised and will not cease
to affect in this case either. Physical and moral obsolescence of historic buildings must have
been one of the best indicators of the fact that resistence started weakening and time has ripen
for activating the factors strengthening resilience (Fejérdy & Karvalics, 2015, 123).
To treat the complexity of the problems in Kisújszállás as a shrinking small town new
ways have to be found based on the above introduced theories. It is true for this town as well
that in the field defined by the complex processes of overall social-political-economic
changes (together with the decreasing EU sources) it is becoming more and more important
for the town what kind of local social (material and intellectual) cultural reserves it can
mobilise and how it will be able to maintain and provide in the future the welfare or well-
being its citizens expect to have (Gébert 2012).
OBJECTIVES AND METHODS
The research question
As we could see above, demographic changes (population decline) and their (urban)
consequences are a real challenge for the small and medium-sized towns of Europe and
Hungary. The research question concerning this phenomenon is: how to deal with urban
shrinkage and is there any proper and overall answer for everyone to this process?

Kovács, T.
130
The aim of the research
Trying to give an answer to the question, the aim of this research is to introduce the
demographic changes of the past decades of a typical Hungarian country town by the example
of Kisújszállás, the reasons of its shrinkage, the problems it has caused and the urban
development alternatives which might solve these problems, focusing on the intellectual and
material cultural heritage of the town as developmental fund.
According to it my aim is to examine – at least give an outline of – the resilience capability
of the town (focusing on the man-made heritage, historic buildings); the possibilities and
results the town has for its culture-based development and what future challenges it can face
in this traditionally Great Cumanian town.
Research methodology
During the research I used the following methods:
- processing the related national and international bibliography
- analysing the Hungarian central and the local normative controls concerning urban
development
- collecting, analysing and applying the related central and local statistical data (data
service of KSH (Hungarian Central Statistical Office), Mayor’s Office of Kisújszállás)
- analysing relevant local developmental documents and their plans (current economy
development programme, urban design, the analysis of a proposal on local sustainability
concept and analysing the plans of tourism marketing)
- assessing tender documents
- questionnaires (on cultural habits of Kisújszállás’ inhabitants – non-representative due
to the extremely low willingness of respondants…)
- prominence examinations (interviews: mayor, full-time vice-mayor, notary, vice-notary,
CEOs of Redoute (Vigadó) and Kumánia Thermal Bath Ltd.)
- ‘experienced geography’ – the method of ‘mingling with common people’.
RESULTS
Problems, reasons and consequences of the town shrinkage in Kisújszállás
Kisújszállás, the subject of this study, is a Hungarian settlement, a typical country town lying
150 kilometres east of Budapest and 80 kilometres west-south west of Debrecen, which is the

Kovács, T.
131
second largest town in Hungary. It boasts with its man-made and intellectual cultural heritage
and the colourful Great Cumanian traditions – partly living today.
During the research I had to state that Kisújszállás (adapting to the population trends of
certain European regions, including Hungary as well) has had severe demographic
vulnerability, population problems for several decades (both in quantity and quality).
Analysing the demographic data of the settlement we can state that the population of the
town reached its peak in the 20th century, in 1930, with inhabitants of 14 532 (Vincze 2004) –
since then up to now this number has been falling: in the year of the regime change there were
13 159 inhabitants yet today there are only 11 092 (see Tab. 1).
Table 1: Population decline in Kisújszállás in the last decade
Year 2007 2008 2009 2010 2011 2012 2013 2014 2015 2016 Nr. of inhabitants (head)
12 032
11 738
11 611
11 500
11 367
11469 11
384 11
249 11
143 11
092
Source: KSH, Mayor’s Office of Kisújszállás
The reasons can be different – European and Hungarian social-political traumas, economic
problems, culture-based changes in fertility rates, etc. From the analysis of statistical data we
can see that in Kisújszállás during the past decades the number of population has decreased by
3000 people (what further worsens the situation is that certain inhabitants registered in the
town are not habitually residents). Besides, ageing index was high even in 2000, 80,4%, and
it rose to one and a half times in 2013: 130,9%.
The population shrinkage which can be seen clearly from the above data can have the
following main reasons: the negative balance of natural growth and migration difference
(almost every year since 1990); fertility instability/imbalance; migration of young(er), (more)
qualified workforce into larger towns or into the capital city; ageing. In addition, the
increasing reproduction or settling from other places into Kisújszállás of the declassed layers
i.e. people at the edge of the society or those totally marginalised can mean a potential risk of
danger for the town population.
As a conclusion: comparing the relevant demographic data I could state that among the
settlements of Karcag district the demographic processes of Kisújszállás are the most
disadvantageous (see Fig. 2) – at least regarding its quantitative indicators.

Kovács, T.
132
Figure 2: Changing number of population in the Karcag microregion (1990-2011)
Source: KSH
Barriers of urban development and its future prospects
Besides the above demographic data which are well-measured by statististical figures,
though leave the qualitative side in the background, unfortunately, there are certain typically
Hungarian and local characteristic features counteracting a western-European type of
grassroots, iterative and productive urban development, which could handle even shrinkage.
These problems are the following:
- applying mostly traditional urban planning/developing methods (which cannot be
innovative enough due to the national regulatory constraints, not to the local ones)
- conflicts of interests between certain determining persons in urban development (in
politics, economics, on all fronts)
- mistrust of actors potentially interested in urban development
- entrepreneurial slowness, disability of renewal, lack of will combined with a kind of
retrograde incomprehension
- incomprehension of local inhabitants or their acquired helplessness (e.g. the town has a
vivid craft activity, producing typical local goods, yet only l’art pour l’art as their
marketisation is negligible since there is not an umbrella organisation to co-ordinate
these activities and it lacks the proper marketing activity either)
- a developing yet still inappropriate urban and tourism marketing activity

Kovács, T.
133
- as a summary, inadequate quality of local human resources.
As a result of these complex social-demographic difficulties the problem of local shrinkage
is registerable today and – if present tendencies go on like this – will increase in the future,
that is
- infrastructure, the maintenance of man-made environment and the ageing local society
will become more and more expensive (‘decreasing population – decreasing
capabilities’?)
There is a threat of the following:
- creating a malformed local society which is declining demographically, morally (social
anomia) and economically (as it is impoverishing, financially vulnerable, reproduces
poverty many times) and unable to maintain itself
- a complex urban social-economic-environmental decline
- overall depopulation.
Reactions to the emerging urban challenges
In order to set the sustainable demographic development of the local society on the right track
the settlement (including the local government, enterprises, civilians, everybody) has to face
the facts: i.e. to recognise and accept the fact of shrinkage itself and according to it handling it
based on local co-operation.
From the point of view of demographic renewal the following could mean a factual
solution to the settlement: retaining (highly qualified) young people, attracting them to the
town and bestowing them as high labour market competences as possible, providing
workplaces to employ them, stimulating fertility rate, offering preferential housing. However,
these are rather complex expectations, very often beyond the competences of the local
government and solutions should not always be expected from the management. During my
research it was revealed that a part of the urban population, mostly low-skilled, uncompetitive
even on the periphery, has no idea of how to develop – they show little willingness to learn
and work.
Though the town leadership does not want to ‘surrender’ to the anticipated future crisis
caused by the complex problems outlined above. To solve the problems it has had a strategy
of urban development for more than a decade which regards the development of culture such
priority that can become one of the most efficient tools of fighting shrinkage and creating a
viable and resilient town, ready for renewal. This development of culture can include
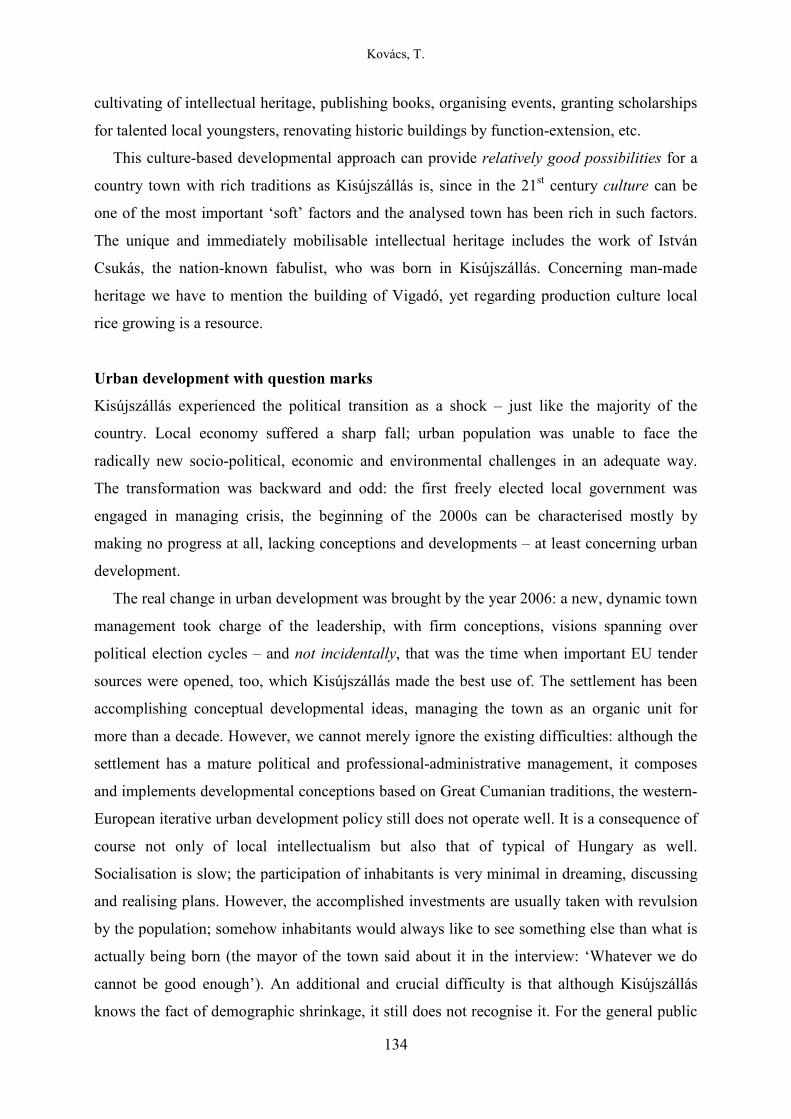
Kovács, T.
134
cultivating of intellectual heritage, publishing books, organising events, granting scholarships
for talented local youngsters, renovating historic buildings by function-extension, etc.
This culture-based developmental approach can provide relatively good possibilities for a
country town with rich traditions as Kisújszállás is, since in the 21st century culture can be
one of the most important ‘soft’ factors and the analysed town has been rich in such factors.
The unique and immediately mobilisable intellectual heritage includes the work of István
Csukás, the nation-known fabulist, who was born in Kisújszállás. Concerning man-made
heritage we have to mention the building of Vigadó, yet regarding production culture local
rice growing is a resource.
Urban development with question marks
Kisújszállás experienced the political transition as a shock – just like the majority of the
country. Local economy suffered a sharp fall; urban population was unable to face the
radically new socio-political, economic and environmental challenges in an adequate way.
The transformation was backward and odd: the first freely elected local government was
engaged in managing crisis, the beginning of the 2000s can be characterised mostly by
making no progress at all, lacking conceptions and developments – at least concerning urban
development.
The real change in urban development was brought by the year 2006: a new, dynamic town
management took charge of the leadership, with firm conceptions, visions spanning over
political election cycles – and not incidentally, that was the time when important EU tender
sources were opened, too, which Kisújszállás made the best use of. The settlement has been
accomplishing conceptual developmental ideas, managing the town as an organic unit for
more than a decade. However, we cannot merely ignore the existing difficulties: although the
settlement has a mature political and professional-administrative management, it composes
and implements developmental conceptions based on Great Cumanian traditions, the western-
European iterative urban development policy still does not operate well. It is a consequence of
course not only of local intellectualism but also that of typical of Hungary as well.
Socialisation is slow; the participation of inhabitants is very minimal in dreaming, discussing
and realising plans. However, the accomplished investments are usually taken with revulsion
by the population; somehow inhabitants would always like to see something else than what is
actually being born (the mayor of the town said about it in the interview: ‘Whatever we do
cannot be good enough’). An additional and crucial difficulty is that although Kisújszállás
knows the fact of demographic shrinkage, it still does not recognise it. For the general public

Kovács, T.
135
and for politicians it can mean only a negative context, a kind of loss, it does not have any
positive perception in common talk. The town has several modern, developmental documents
being implemented conceptually, yet that one does not exist, the starting point of which would
be population shrinkage and which would talk about the developmental ideas reacting to this.
Despite the above constraints of facts, the lack of civilian mentality, the very few
grassroots initiatives and the shortcomings of local material resources, Kisújszállás was able
to reach spectacular results in the EU developmental period of 207-2013: it gained different
developmental applications one after the other. The biggest and most spectacular part of these
was the three-stage town centre rehabilitation project which was completed in 2015. I would
like to analyse the most important project and the results of the investment in the next part.
How to become the centre of social interaction from a blight place – urbanistic renewal in the name of culture
The city centre of Kisújszállás was renovated using about 1,2 billion forints (cca. 3,9 million
euros) in the 2010s: these were spectacular, ‘aestheticising urban developments’ according to
many. It is a fact yet these involved not only the development of immovable estates but also
the renovation of the parks and green areas in the city centre, let alone the accomplishment of
cost-effective energetic developments.
The most important – and at the same time the most debated, most expensive and most
time-consuming – investment was the renovation of the former Theatre and Redoute
(Vigadó), one of the emblematic buildings in the city centre. The Art Nouveau style building
was erected in 1911-12 and had several functions even that time: it served as a theatre, a
cinema, housing different social events. Later on theatrical performances were ceased, after
the 1950 nationalisation its main profile was the cinema. Sometimes the plays of local troupes
were performed and school celebrations, assemblies were also held in the great hall.
Following the change of the political regime, the building once significant not only in
Kisújszállás but also in the wider area, suffered from long agony and unworthy functions.
Finally its calvary resulted in making the building one of the shameful places of the town and
it was closed in 2000. Its Cinderella-dream lasted one and a half decades and there was only
very little missing to demolish it physically…
However, the town leadership functioning since 2006 did not let this unrivalled value be
vanished and taking the advantage of tendering they renovated the building bringing back or
even surpassing its former glory. The management based on the Great Cumanian self-
consciousness, the unique and rich traditions of the town, the culture as retaining power on the

Kovács, T.
136
whole and on the long-term concept according to which Kisújszállás as the 6th biggest town in
Jász-Nagykun-Szolnok county and the 2nd biggest of Great Cumania should become the
‘cultural capital’ of the region.
It is important to emphasise that besides the physical renovation of the building it was a
crucial aspect to make the Redoute (Vigadó) the multifunctional cultural centre of
Kisújszállás and its wider region: according to it the building has a theatre and a concert hall,
a 3D-cinema, a TV studio, children’s area for activities, a dance hall, a bowling alley, a
canteen and a café.
During the research I stated that since the opening of the Redoute of Kisújszállás in 2015
the following theses have been proved (based on Fejérdy & Karvalics, 2015, 124):
- the building represented the continuity of the Great Cumanian self-consciousness in
Kisújszállás and the symbol of what the cultural desire of the local peasant-civilian
society of the last century was able to create, thus the building as a physical asset and as
knowledge, experience and creativity accumulated on the spot enhanced the local
capability of resilience
- being a significant historic building it was incorporated in the mind and intellectual
heritage of consecutive generations; locals did not let it be lost but as ‘resilience-
potential’ long-time dormant, revitalised it the first time they had the opportunity to do
so
- the renovation of the Redoute was not an ‘aetheticising’ building renovation project
simply for itself, the town did not handle it as a museum. During the renovation it was
partly reinterpreted and due to its multifunctionality it can provide space both for
satisfying the really diverse popular and highbrow cultural needs
- the building gives a place for the great many cultural events of the town and its region
not only in its physical form: it has a symbolic overplus announcing and establishing the
slogan according to which ‘Kisújszállás wishes to become the cultural capital of Great
Cumania’ even in the short-run in the region, moreover, in the Szolnok-Debrecen region
- utilising the knowledge and experience of the building, keeping them alive by
appreciating and maintaining the values, Kisújszállás – at least partly– reacted in a
resilience-increasing way to the challenges of demographic processes of the present and
the future – knowing that it is far from the best solutions to the complex problems of
urban shrinkage but still a landmark on the way towards creating a ‘viable and
sustainable’ town.

Kovács, T.
137
Concerning this function-extending investment it can be stated that the town has actually
accomplished a development which corresponds theoretical-scientific demands as well, i.e.
the town has found one of its cultural resilience-centres of gravity which has been renovated
properly and utilised to make the place more attractive and viable.
DISCUSSION
How would it be possible to go on in formulating the sustainable and developmental
possibilities of a shrinking town which focus on and use local cultural heritage in a broad
sense?
Applying the following scientific and practical methods and tools seem to be reasonable:
Scientific methods promoting urban development:
- KRAFT-methodology (it is not sufficient itself, but combining it with a resilience
research it can provide appropriate points to formulate real developmental conceptions
based on local capacity and possibilities):
o surveying social creativity features
o surveying and identifying social capital and network potential (quantity,
intensity, features and quality)
o analysing sustainability potential
- carrying and extending resilience-tests
- applying capability approach in planning
- using the long tail model: exploring the ‘global capital’ role of Kisújszállás in any
fields of social-economic life
- finding and utilising niche in order to strengthen resilience: further exploration and
analysis of historic buildings, local rice growing and the work of István Csukás,
utilising them in order to develop the town and retain population.
Tasks of the practical side to make urban development more efficient and successful:
- involving local large enterprises, creating win-win situations
- continuous, ‘forced’ communication with the inhabitants – finding the influential
opinion leaders, having dialogues with them.

Kovács, T.
138
CONCLUSION
One of the biggest and ever increasing challenges of Hungary and Great Cumania is how to
develop (or simply maintain) small- and medium sized towns in a general social-economic
environment which tends to be rather negative. As a conclusion we can state that there is no
final and overall solution concerning the urban population’s shrinking – every settlement has
to find its own path towards the solution which is absolutely individual and unique.
However, agreeing with the view of Rem Koolhas (‘All that has been left for us is the
city’), Kisújszállás can perceive (yet does not approve at political level) the complexity of the
problems caused by shrinkage. Although a complex and mature town strategy having
definitely shrinkage as its starting point is still not available for the settlement, a conceptual
urban development process has been in progress for more than a decade to make Kisújszállás
a more viable and attractive place to live in. In this process the Great Cumanian traditions and
the local culture as a symbolic developmental overplus are emphasised.
As a part of the cultural heritage Kisújszállás (defining itself ‘The cultural capital of Great
Cumania’ since 2016) possesses such historic buildings which can form the basis of the town
resilience-capability and the accomplishment of the urban development activity based on it. In
the past few years the town has renovated the building of the iconic Redoute (Vigadó) within
the framework of the function-extending renewal of the town centre, thus it has become the
multifunctional cultural centre of the settlement. Though the building has been open for the
public only for two years, it seems to be a success story: it has become an attractive centre not
only for the inhabitants of Kisújszállás but also for those of the region. It helps the town to
fulfil the vindicated title of the slogan of ‘Cultural capital of Great Cumania’ with real content
and on the whole, to create the town a resilient, more viable and attractive settlement.
REFERENCES
Arvanitaki, A. (2007). Urban Development Planning and Culture. ECCM Symposium: ‘Productivity of Culture’, Athens, 18-20 October 2007.
Bajmócy, Z. (2012). A képesség-szemlélet alkalmazásának lehetőségei a regionális tudományban. In: Rechnitzer, J. & Rácz, Sz. (szerk.). Dialógus a regionális tudományról. Széchenyi István Egyetem Regionális Gazdaságtudományi Doktori Iskola – Magyar Regionális Tudományi Társaság, Győr, pp. 18-30.
Bernt, M. (2009). Partnerships for Demolition: The Governance of Urban Renewal in East Germany’s Shrinking Cities. International Journal of Urban and Regional Research 3., pp. 754–769.
Bernt, M., Cocks, M., Couch, C., Grossmann, K., Haase, A. & Rink, D. (2012). Shrink Smart. Policy Response, Governance and Future Directions. Research Brief No. 2, Helmholtz Centre for Environmental Research – UFZ, Leipzig.

Kovács, T.
139
Couch, C., Cocks, M., Bernt, M., Grossmann, K., Haase, A., & Rink, D. (2012). Shrinking Cities in Europe. Town & Country Planning, pp. 264–270.
Drennan, M. (2002). The Information Economy and American Cities. Baltimore, MD: Johns Hopkins Press.
Duxbury, N., Hosagrahar, J. & Pascual, J. (2016). Why Must Culture Be at the Heart of Sustainable Urban Development? United Cities and Local Governments (UCLG), www.agenda21culture.net (downloaded: 11 September 2017)
Fejérdy, T., & Karvalics, L. Z. (2015). Kis- és közepes városok kulturális reziliencia-súlypontjai. Replika (94), 2015/5. szám, pp. 113-127.
Frey, W. H. (1993). The New Urban Revival in the United States. Urban Studies, 30(4/5), 741–774.
Gébert, J. (2012). A jólét mérésének elméleti alapjai és problémái. In: Bajmócy és tsai (szerk.). Regionális innovációs képesség, versenyképesség és fenntarthatóság. JATE Press, Szeged, pp. 303-317.
Ghilardi, L. (2005). ‘Culture at the Centre: Cultural Planning, a Strategic Approach to Successful and Sustainable Community-based Regeneration in Scotland’, Noema Research and Planning Ltd, London
Gyáni, G. (1995). Bevezető. In: Gyáni, G. (szerk.) A modern város történeti dilemmái. Csokonai Kiadó Kft., Debrecen, ISSN 1219 1086, ISBN 963 260 074 6, p. II.
Izsó, G. (2014). Human Dynamics – Aug. 28. http://humandynamics.hu/index.php?option =com_content&view=article&id=84:resilience-azaz-reziliencia&catid=39:vezetoi-coaching (downloaded: 20 April 2017)
Kovács, T. (2014). A városfejlődés „új“ iránya közép-európai nézőpontból. Magyar Tudomány, 175(8), 966-973
Kovács, T. (2016). Demographic Changes and Their Spatial-Settlement Consequences: Lessons from East Germany and Hungary. Deturope, 8(3), 108-123.
Kuslits, B. (2015). Reziliencia társadalmi és ökológiai rendszerekben. Alkalmazott Pszichológia, 2015, 15(1), 27-41. DOI: 10.17627/ALKPSZICH.2015.1.27
Lukovich, T. (2001). A posztmodern kor városépítészetének kihívásai. Pallas Stúdió, Budapest, 193 p.
Martinez-Fernandez, C., Kubo, N., Noya, A., & Weyman, T. (eds.) (2012). Demographic Change and Local Development: Shrinkage, Regeneration and Social Dynamics. OECD Working Papers, Paris, OECD/LEED.
Neill, W.J.V. & Schlappa, H. (eds.) (2016). Future Directions for the European Shrinking City. RTPI Library Series, Routledge Taylor & Francis Group, London.
Parkinson M. & Biankini, F. (eds.) (1994). ‘Cultural Policy and Urban Regeneration’, Manchester, University Press
Pirisi, G. & Máté, É. (2014). Zsugorodó kisvárosok – kincstári optimizmus. In: László M. (főszerk.). Területfejlesztés és Innováció, 8(2), 28-39 http://www.terinno.hu/szamok/ teruletfejlesztes_es_innovacio_2014_2.pdf
Reckien, D. & Martinez-Fernandez, C. (2011). Why Do Cities Shrink? European Planning Studies 8., pp. 1375–1397.
Ripp, M. (2013). Crisis: an Opportunity for Historical Cities – Built Cultural Heritage as a Factor of Urban Resilience. HERMAN Project Report. http://www.herman-project.eu/outcomes/other-documents.html (downloaded: 20 April 2017)
Sen, A. (1993). ‘Capability and Well-Being’. In: Nussbaum, M. & Sen, A. (eds). The Quality of Life, Clarendon Press, Oxford, pp. 30-53.
Süli-Zakar, I., Ekéné, Zamárdi I., Kozma, G., & Teperics, K. (2006). Debrecen kulturális gazdagsága és gazdasága. In: Kókai S. (szerk.). Földrajz és turizmus. Nyíregyházi

Kovács, T.
140
Főiskola Természettudományi Főiskolai Kar Földrajz Tanszéke, Nyíregyháza, ISBN 963 7336 31 1, pp. 313–334.
Székely, I. (2015). Reziliencia: a rendszerelmélettől a társadalomtudományokig. Replika (94), 2015/5. szám, pp. 7-23.
URL 1: UNESCO (2012). Culture: a Driver and an Enabler of Sustainable Development. Thematic Think Piece. http://www.un.org/millenniumgoals/pdf/Think%20Pieces/2_culture.pdf (downloaded: 11 September 2017)
URL 2: Fourth Session of the Global Platform on Disaster Risk Reduction (Geneva, 18-23 May 2013) http://icorp.icomos.org/images/documents/Heritage%20and%20Resilience%20Book%20for%20GP2013%20Disaster%20Management.pdf (downloaded: 20 April 2017)
Vincze, S. (2004). Hogyan változott Kisújszállás népessége és iskolázottsága az elmúlt században – főként annak második felében? In: Ducza L. és tsai (szerk.). Kisújszállási Nagykun Kalendárium a 2004-es szökőévre. Kisújszállás, pp. 267–277.
Washington Charter (1987) (Charter for the Conservation of Historic Towns and Urban Areas), https://www.icomos.org/charters/towns_e.pdf (downloaded: 20 April 2017)

DETUROPE – THE CENTRAL EUROPEAN JOURNAL OF REGIONAL DEVELOPMENT AND TOURISM Vol. 9 Issue 3 2017 ISSN 1821-2506
141
Professional paper
CHANCES OF EFFECTIVE URBAN POLICY IN HUNGARY UNDER
THE INFLUENCE OF THE EUROPEAN COHESION POLICY
Edit SOMLYÓDYNÉ PFEILa
a Széchenyi István University, Faculty of Economics. Győr, Egyetem tér 1. H-9026; [email protected]
Cite this article: Somlyódyné Pfeil, E. (2017). Chances of Effective Urban Policy in Hungary under the Influence of the European Cohesion Policy. Deturope, 9(3):141-161
Abstract
The goal of the paper is to search for the state environmental conditions for an effective urban governance by the analysis of the Hungarian processes of the last six years. The survey is focused, on the one hand, on Hungarian towns considered as small and medium-sized towns by European scales; on the other hand, the conditions for the birth of co-operations between these towns and their regions, and among the different sectors are also emphasised. This is the viewpoint from which the paper tries to grab the content and tools of Hungarian urban policy, and the special features of this policy. It is also crucial in this respect how the reform programme of public administration influences governance chances of cities both as regards the location of tasks and the organisational system; and also how much the cohesion policy of the EU and its urban dimension affects the public policy processes. Keywords: urban policy, governance, territorial integration, medium-sized cities, centralisation
INTRODUCTION
The relationship between nation states and their cities and city regions has changed since their
having been activated as economic policy instruments. The European urban network has
become the target of EU Cohesion Policy, since its main emphasis is on the competitiveness
factor. The role of cities is to maximise their economic opportunities and successes, the most
important conditions of which are determined by the frameworks provided by national
governments. Therefore, the risk of organisations institutionalising the urban region is their
functional limitation (Herrschel, Newman, 2003). Unless they are granted sufficient political
and financial power, they are threatened by a loss of economic position and decreasing
attractivity of their sites from the aspect of capital, labour force and external firms as well.
That is, national framework conditions may support or block co-operations, since the central
government is the owner of regulatory and controlling instruments. Therefore, the
development path from the hierarchical state has led to the birth of the co-operative state. The
emergence of new types of co-operative structures (network governance) justifies that the
concentration of forces and collaboration are of key importance even in the most competitive
Somlyódyné Pfeil, E.
142
economies resulting in the evasion of competition and the coordination of diverse interests in
view of achieving an economic goal (Joye, Leresche, 2004).
The economic actors and social sector force the state to make its own operation more
effective and change its traditional administrative methods. On the part of the economy there
is a demand for the harmonisation of economic, social, ecological and cultural development
and for the decrease of the transactional costs. Similarly, the significance of coordination
among sectoral policies, and also of conflict management has increased. This can be
complemented with the fact that in the field of managing socio-economic problems there is a
visible shift from administrative boundaries during state interventions, which induces some
changes in the view of space by the state. It is necessary to eliminate the fragmentation of
functional spaces which are now broken down into municipal entities, for administrative
considerations, as is the abolition of competition among autonomous actors. The way to
achieve this can be common planning activity and the definition of joint development
perspectives. Non-hierarchical governance (Mayntz, 2004) also expresses political and
economic coordination implemented at the scale of urban areas, urban regions.
The theoretical framework for the paper is on the one hand marked by the concept that a
city is made what it is by its functions offered for its region, its hinterland (Beluszky, 2004),
consequently the concept of urban administration cannot be narrowed down to the city as a
single-point spatial pattern. If we start from urbanisation, it shows the economic footprint of
big cities, social and economic flows penetrating beyond the administrative boundaries of the
city core, which creates a set of administratively separate but functionally networked towns
and villages in the hinterland. This, according to Harrison (2012) also means that city in its
traditional approach is an obsolete entity, as it is not able to address fundamental social and
economic relations. In relation to this concept, the development of cities is seen differently in
the frameworks of the post-Fordist economy and in the era of globalisation. The way this was
summarised by the Leipzig Charter a decade ago (2007), issued that the precondition of
economic spatial development in Europe are the cities. Since then the EU’s new ‘Territorial
Agenda 2020’ (2011) about an inclusive, smart and sustainable Europe set out the common
goals of the future, which stresses – among other priorities – the promotion of polycentric
spatial development and encourages integrated development in cities, rural and specific
regions. Urban dimension got a significant emphasis under the roof of the current cohesion
policy and urban-rural linkages should be made by partnerships and co-operations
highlighting the mutual independency in a given space for making its implementation
effective (Farole, Rodriguez-Pose, Storper (2011). The territorial approach is strengthened by

Somlyódyné Pfeil, E.
143
the European Commission proposed new institutions in the field of urban development, like
the Integrated Territorial Investment, the Community Led Local Development and the use of
multi-fund programmes for the ERDF and ESF (Altus 2016). According to this expectation,
the sustainable urban development suggests the building of urban development platforms and
the promotion of capacity building with help of horizontal principles (EC 2014).
In the light of all this the goal of the paper is, taking the previous thoughts into
consideration, to search for the state environmental conditions for an effective urban
governance by the analysis of the Hungarian processes of the last six years. The survey is
focused, on the one hand, on Hungarian towns considered as small and medium-sized towns
by European scales; on the other hand, the conditions for the birth of co-operations between
these towns and their regions, and among the different sectors are also emphasised. This is the
viewpoint from which the paper tries to grab the content and tools of Hungarian urban policy,
and the special features of this policy. It is also crucial in this respect how the reform
programme of public administration influences governance chances of cities both as regards
the location of tasks and the organisational system; and also how much the cohesion policy of
the EU and its urban dimension affects the public policy processes.
MAIN FEATURES OF THE HUNGARIAN URBAN POLICY SINCE 2012
The responses of the Hungarian state to new challenges of urban development
It is evident that developed countries have witnessed changes in their urban policy due to their
incorporation into the national policy agenda. The typology of countries has been around for
quite a while which makes a distinction between countries with an explicit or an implicit
urban policy (Berg, Braun, Meer, 2007, Harding, 2007, d’Albergo, 2010). We can talk about
explicit urban policy when the spatial focus of the state policy has an urban character both
during the formulation and implementation of the policy. In contrast, in the case of implicit
urban policy, economic and social changes in cities are effected by the measures and
interventions of various public policies of a specific country, i.e. these changes are only
secondary consequences (d’Albergo, 2010, p. 3.).
On the basis of the analytical system of d’Albergo (2010, p. 4.), direct urban policy means
that public urban policy exerts its influence without the inclusion of additional stakeholders in
the process of implementation, it relies solely on the co-operation between the central and
local governments. Indirect urban policy means that the objective of central decision-makers

Somlyódyné Pfeil, E.
144
is to create an environment and institutional, legitimisation, financing, cognitive conditions
which enable local actors to effect changes in urban matters through their own policies.
National urban policies show a high degree of variance. The new member states were
lacking such policy until the very recent period, only a few countries (e.g. Poland, Romania)
strive to develop an urban policy under EU impetus. If we compare Hungary with the rest of
the EU member states, it is evident that no explicit urban policy has been formulated since the
transition. Nonetheless, the National Spatial Development Concept (hereinafter NSDC, 2005)
was adopted during the previous European planning cycle with a spatial approach to the
absorption of EU funds.28 So an implicit urban policy emerged in the form of a planning
document which situated the future vision of urban network within the scope of regional
policy. If we continue to seek the further characteristic features of urban policy, than their
lack will become evident, since the NSDC has neither attained the level of communication,
nor the realisation of its content. The ten visions concerning the development of the urban
network have not been realised, for the most part, it was the physical reconstruction of city
centres which was targeted from EU funds.
The 2014–2020 EU planning period has started, and in the framework of the preparations,
the Parliament adopted the Concept replacing the NSDC under the title of National
Development and Spatial Development Concept (hereinafter OFTK). A unique feature of the
strategy is that, sectoral policies and spatial objectives targeting the development of the
country were integrated in a single plan.29 The situational analysis of OFTK lays down that
the ideas about spatial cohesion have not been realised during the past seven years, spatial
inequalities have increased in Hungary and the excessive dominance of Budapest still
prevails.
The creation of a „competitive, innovative economy” is featured between mid-term
sectoral policy objectives, while the creation of an „urban network guaranteeing a polycentric
spatial structure” features among the territorial objectives. These are added to the so-called
regional strategic areas ensuring long-term development which are the following:
The macro-regional leading role of Budapest,
urban network and urban policy,
modern cities which guarantee high quality of life,
the global development of cities and urban areas based on urban network co-
operations,
28 Gov. Decree No. 97/2005. on the National Spatial Development Concept 29 Gov. Decree 1/2014 (3 January) on National Development 2030 – on the National Development and Spatial Development Concept.

Somlyódyné Pfeil, E.
145
the economic and cultural modernisation of rural areas, the renewal of relationships
between cities and rural areas, etc.
It can be declared that the new strategy reproduces the objectives of the previous NSDC in
several respects, and it emphasises the multi-dimensional development of the urban network.
In light of the negative experiences, it declares that it is vital to encourage the elaboration of
integrated urban development concepts and strategies and the joint planning of urban areas.
When approving the cited OFTK, Hungarian development policy expressed unconditional
adaptation to the requirements of the Union. However, as time passed and planning activity
was done in the respective territorial units (counties, cities with county rank, district seat
towns), the intention for the application of the integrated approach and the connection of
towns with their hinterlands faded away.30 The strategy back in January 2014 defined the
promotion of the joint planning activity of towns and their hinterlands, making it clear that the
basic units of spatial developments would be urban areas built on the co-operation of towns
and the rural areas, consisting of towns/cities and their hinterlands. This was supplemented by
the intention of the strengthening of integrated planning. We have to add that these urban
areas are not institutionalised either from administrative or development policy aspects, i.e.
they should have been created during the planning procedure. This would have harmonised
with the new functional approach promoted by the Union in relation to urban areas that
supports so-called interventions at the right scale, i.e. actions that may penetrate from
neighbourhood areas through regions right to functional areas, depending on the respective
member state (Böhme, Doucet, Komornicki, Zaucha, & Światek, 2011).
Less than one year later, in December 2014 a government decree was issued on the
foundation of a single territorial operational programme, the Territorial and Settlement
Development Operational Programme. In the creation of integrated territorial programmes
two levels were defined, distinguishing county level and the level of towns with county rank,
which was a break from the focus on urban regions. In addition, the Government allocated
approximately five per cent of territorial development resources for community led local
developments (CLLD). Accordingly, towns with county rank and counties were given
preliminarily set allocations of recourses, separate from each other. (The county self-
governments designed planning activities of all towns and villages in their counties, except
for towns with county rank.) At that time the specification of Priority six of the Operational
30 A preliminary of the OFTK was the Government Decree No. 1181/2013 on the principles of the designation of integrated urban area programmes, the implementation of which was neglected. This decree ordered that “Joint urban area planning and co-operations, and also joint developments must be promoted by adequate supports.” [Art. 1.)].

Somlyódyné Pfeil, E.
146
Programme itself (“Sustainable urban development in towns with county rank”) made the
territorial scale of the OP absolutely clear.
What is in the background of the process is that the government had meanwhile changed
LAU1 level, abolishing micro-regions used as development and planning units by the
previous governments, substituting them with the so-called districts newly created as state
administrative units. The districts, established for administrative functions, exclusively, have
no representative organs and so cannot articulate territorial interests. The central towns of the
districts were given no territorial development competency, so they lack any integrating
power for their hinterlands and had no ambitions, either, to carry out coordinating tasks in
planning. Consequently, in the 2014–2020 planning period the cohesion force of the meso-
level must be provided by the county self-governments which the legislator deprived of all
their public service functions. Accordingly, they were weakened in their administrative
capacities, in some counties a staff of 30-40 people should be able to harmonise the planning
and development activities of 60-350 separate municipalities, and create the cohesion of the
meso-level. Unfortunately, joint developments by municipalities are rare exceptions, given
their previous experiences.
To sum it up we can say that the practice of the use of the development resources has
receded from the strategic goals, towns and their hinterlands are now separate from each
other. This problem concerns both Territorial Development Operational Programme and Rural
Development Operational Programme at the same time. Although counties are responsible for
both territorial development and rural development, the decision-making mechanism in effect
does not allow counties to carry out coordination between the two operational programmes
(e.g. the advantage coming from financing from several operational programmes – multi-fund
financing), and have no information and influence on the allocation of rural development
resources.
According to the methodology of the EU, county self-governments approved their
integrated territorial programmes but these features different concepts, depending on the
subjective interpretation of the respective counties: e.g. development area to be managed as a
single unit, poles, or industrial poles. This does not allow the systematic approach to
intervention areas at national scale. The Territorial Development Operational Programme is
basically adjusted to the administrative boundaries of the counties, and so county-based
resource allocation fails to handle cross-county developments. The negligence of urban area
centred view means that this rigid approach cannot be changed.

Somlyódyné Pfeil, E.
147
The Modern Cities Programme as a new tool of urban policy
In urban development the Hungarian government has some backlog; no national resources
have been allocated for this purpose for one decade. The action called “Modern Cities
Programme” seems to make up for this deficiency, implemented from Hungarian resources. It
is interesting that towns with county rank are eligible (separated from their hinterlands) for
selected support from the Structural Funds and the Modern Cities Programme is also designed
especially for these 23 towns. This programme that lacks any programme-like summary was
launched by the Government in 2015. A more in-depth analysis reveals its planning
background in the OFTK that positioned a total of 27 towns and cities, with another emphasis.
It is a known fact that Hungary has only one metropolitan agglomeration in international
terms, namely the metropolitan area of Budapest. At the same time, the second level of the
urban hierarchy, – the category of large towns with a population of 300 000-500 000 is totally
lacking. The next category of towns are qualified only as medium-sized towns according to
EU standards. The eight outstanding large cities constituting this category from the aspect of
the Hungarian urban network have 100 to 200 thousand inhabitants and are lacking
international visibility. This category of cities is explained by intensive suburbanisation. And
including the mentioned eight cities, 23 city possesses a special county status.
The national strategy defines as a specific territorial goal the creation of polycentric urban
network, which it links to the establishment of a decentralised and networked spatial structure.
From a strategic point of view the following areas of intervention were defined in 2014:31
development of big cities by strengthening their regional centre and spatial
organisational functions;
developments aiming at the spatial equalisation of the urban network;
development of the towns in accordance with their economic profiles;
strengthening of the urban-rural linkages.
It slightly contradicts the above-listed goals that the definition of the strategic future
scenarios of cities is made in relation to the capital city, Budapest. According to this towns
and cities make the inner and the outer urban ring of the Hungarian capital city, and the inner
ring is made by 12 economically dynamic towns that take the burden off Budapest.32 In
relation to these towns the document envisages the construction of a “Budapest Business
Region”, and these towns are identified as the agglomeration of Budapest. On the other hand,
31 Parliament Decision No. 1/2014 (3 January): 3.1.4.2 Development of a multi-centred urban network. 32 Towns of the inner urban ring are: Tatabánya, Dunaújváros, Salgótarján, Vác, Szolnok, Székesfehérvár, Kecskemét, Eger, Veszprém, Jászberény, Esztergom and Gyöngyös.

Somlyódyné Pfeil, E.
148
the 15 towns of the outer urban ring33 – according to the concepts – implement a complex
economic development programme with a themed focus, as a government objective of utmost
importance in this present planning period is economic development. The concept built on the
multiplier development impacts of towns is in line with the international mainstream; what
would make this urban strategy complete is to integrate these areas by the provision of access
and mobility, done via transport development.
The Modern Cities Programme as a tool for the practical implementation of the strategy
shows significant alterations compared to the objectives. First, the hinterland of the selected
towns are not mentioned, second, financing and control of the programme is done in national
competency – and so in the OFTK, within the sets of territorial goals the implementation of
the elements of the urban strategies related to the EU 2020 strategy cannot be guaranteed.
The main features of the programme can be briefly summarised as follows: unique, very
short and formal co-operation agreements were signed between the government and the
respective towns, for 13 towns with county rank until the end of 2016 in the first phase. The
interests of the urban regions are neglected, with no sign of any intention to involve
stakeholders outside the sector of public administration, or to create any social partnership.
(The only exception from this is the city of Miskolc, an old industrial city of Hungary for
which research and development and also innovation projects aiming at the increase of the
competitiveness of the city and its region are featured in the programme.)
The investments specified in the agreements and the course of their implementation
(financial support) is scheduled by the government in individual government decrees issued
for the respective cities. In the majority of the cases it is the developments in the city core,
with complex economic development programme specified in the case of the city of Sopron.
It is promising, on the other hand, that the improvement of the accessibility of these cities,
their integration into the network of speedways is widely supported by this government
action. A committee consisting of three members delegated by ministries makes decisions on
the exact sums of the supports, based on the applications for supports by the cities, and then
actual payment takes place under the coordination of the minister leading the Prime Minister’s
Office.34 The list of the planned development interventions in the concrete cities is under
33 Towns of the outer urban ring are: Győr, Miskolc, Debrecen Szeged, Pécs, Nyíregyháza, Szekszárd, Székesfehérvár, Kaposvár, Békéscsaba, Zalaegerszeg, Sopron, Nagykanizsa, Szombathely and Ózd. 34 The Hungarian Government has planned 11 billion EURs in the complete execution of the Modern Cities Programme in the period from 2016–2022. In 2016 168 million, while in 2017, 490 million EURs are being spent on the programme. Furthermore, a planned amount of 3226 million EURs will be spent for the year 2018

Somlyódyné Pfeil, E.
149
constant modification. As opposed to the accounting rules relevant for EU projects, the full
amounts of the investments are transferred in one lump sum to the bank accounts of the city
administrations, and no detailed expenditure account is done. It is striking that the inclusion of
sectoral ministers was decided by the government in the implementation phase of the
investments.
Finally we may rightly ask whether the co-operation agreements inaugurated by Hungarian
urban policy are compatible with the criteria of planning contracts, contract of objectives or
programme agreements, successfully applied in other countries (France, Italy, Poland,
Switzerland etc.). The institution to be briefly called planning contract hereinafter is a public
law contract by its content, the motivation of which is to make the operation of the state more
effective, i.e. the linking the use of the state resources to planning activities. The objective of
such contracts is taking responsibility by contracting parties, mobilisation of local resources,
and at the end of the day the implementation of interventions with regional/territorial impacts.
They also manifest modernisation of public administration inasmuch as they are built on the
harmonisation of the territorial community and the development objectives of the central state
(Somlyódyné Pfeil, 2005; 2014).
A positive side of the interventions is that it is the first time since the regime change that
developments at the level of the urban network are initiated. The Hungarian urban policy tool
in its present form, however, only partially meets the important requirements against planning
contracts. A considerable shortcoming is the lack of guarantees for this contractual relationship,
and the experiences collected during the use of Structural Funds are not applied, either. The
rules specified do not satisfy the criteria of transparency and accountability, and even the
volumes of support are obscure. We may add that no financial contribution and the mobilisation
of their own resources is required by the cities, also, the time span of the programme has not
been specified. It is only the state budget that reveals it is planned for three years. Finally, the
demand for interventions with regional impacts is hard to outline, because although every city
was obliged to approve a new integrated urban development strategy in the recent years, these
strategies do not have a territorial view. And so the question is still open whether these
planning documents are going to found the list of the planned investments, as the strategic
foundation of the programme is not visible.
and another 3226 million for the next year (http://hirlevel.egov.hu/tag/modern-varosok-program/, accessed August 25, 2017).

Somlyódyné Pfeil, E.
150
THE IMPACT OF THE HUNGARIAN PUBLIC ADMINISTRATION REFORM ON
THE TOWN SELF-GOVERNMENTS
Main orientations of the administrative reform as seen from the side of the active state
In Hungary a change of governance and a turn in the style of government occurred in 2010,
resulting in fundamental institutional reforms in the public sector after twenty years. The PAR
(Public Administration Reform) has been going on for half a decade, founded since 2015 by
the Public Administration and Public Service Development Strategy of the Government of
Hungary.35 A specific feature of the document is that between the two sectors of the dual state
administration its focuses one-sidedly on the territorial organisational structure of central
public administration, and only concerns the self-government sector to a minimum extent. In
state administration an organisational development called integration is continuously
progressing, leading to centralisation.
The selected objectives are summarised as a professional, cost-effective and well-
organised servicing state in the defined future scenario. The new direction of the strategy
emphasises, that the main task of public administration is the promotion of the
competitiveness of the economy – assistance instead of hindrances, and a deregulation and
simplification of the administrative proceedings should take place in order to decrease over-
regulation. The principal of integration should not mislead the reader, as it is definitely related
to the strengthening of the institutional system of territorial state administration at county and
district level. The administrative reform of the last four years had a clear-cut organisational
focus, hallmarked by the organisation of the system of government offices consisting of 19
territorial units at county level. During the process called integration of the administrative
state agents, conglomerates under the leadership of one single juridical person – the County
Government Office – were created by the integration of 17 and then three more sectors.
The implementation of an administrative system favouring centralised public
administration was started, i.e. the significance of the municipalities sector, which had
represented decentralisation in the relatively balanced dual administrative model since 1990,
lessened. The weakening of the self-governmental sector can be interpreted from several
aspects: the nationalisation of a part of the properties of the municipalities, the deprival of
them of their authority and public service tasks, the cutting of their provisions from the central
budget and the withdrawal of some of their own revenues and the concomitant shrinking of
their autonomy. This can be supplemented by the weakening in their political interest
35 Government Decree No 1052/2015. (16 February) Public Administration and Public Services Development Strategy

Somlyódyné Pfeil, E.
151
representation positions, as after the amendment of the electoral law the major’s title now
conflicts the member of the Parliament position.
We have to admit, at the same time, that the increase of the operational efficiency of the
organisational system of state administration, including the application of modern
management tools (planning, control, evaluation, monitoring), and also taking the
introduction of planning culture here, are interventions of utmost importance in the
modernisation of Hungarian public administration as well. The document seemingly aims at
the implementation of all good governance principles typical of the EAS (European
Administrative Space). One principle, however, is definitely neglected; this is the
participation in public affairs saying that social problems must be solved with the inclusion of
the citizens and the civil society and so they must be encouraged to participate in decision-
making on public policy issues. A fundamental problem from the aspect of effective state is
that it does not consider the mobilisation of organisational capacities as a resource.
The concept of consultancy with the clients is provided, which should not be mistaken with
the inclusion of citizens and non-governmental and business organisations in the making of
public policy. Using a single methodology, the assessment of the satisfaction of the clients
was introduced, as was the survey of the needs of the clients, furthermore, in order to
safeguard the standard quality of services client charts will be used.
It can be added that as an effect of the financial and economic crisis starting in 2008,
rearrangements have occurred in public administration all over Europe. The appearance of the
ideal of “good state” accelerated the penetration of expectations for efficiency and
effectiveness, but, in addition to thriftiness, flexibility and efforts for co-operations can also
be seen in the various systems of administration. In fact, socio-economic organisational
function and co-operations have appeared in the working methods of the organs responsible for
the local representation of the central governments (Frey, 2003, Balázs, 2015). As we can see,
the construction of the Hungarian state turned to another direction that can also be tested
through the amendments of the co-operative relations of the municipal self-governments.
The new trajectory of co-operation among municipalities in the shadow of their weakening role
We can say that the strategy of public administration does not use the concept of
decentralisation, and lacks its basic elements as well. Standardisation and uniformisation has
in some cases created inoperable, large national institution maintenance organisations.
Analysers also warn us (Hegedűs, Péteri, 2015) that the concentration of public utility
companies and some communal services to national public service complexes has deprived

Somlyódyné Pfeil, E.
152
the local self-governments of their important internal organisational and skills capacity, on the
one hand, and the economic pillars of the decentralised self-governmental system were badly
weakened, on the other hand. The state took over public schools and education, and
professional and specialised pedagogical services from the municipalities, depriving thereby
municipalities of the most important tasks from local policy and financing aspects. Formerly
this field of public policy had undeniably been the greatest motivation of co-operations, in
addition to spatial development.
For the small-sized Hungarian local governmental system – in which the principle of ‘one
settlement, one self-government’ still prevails – co-operation among the municipalities is a
sensitive issue. Achievement of a size of service area or number of clients that is economical
often only possible by joint implementation of services by several municipalities. The
regulatory frameworks of co-operation have changed, too, as the opinions of the experts had
been taken into consideration and the new Constitution coming into effect in 2012 empowers
the legislator to order the compulsory establishment of associations for inter-municipal co-
operation. On the basis of this Hungarian local public administration is linked to all
settlements from the aspect of political representation, but the organisation of the local offices
has moved away from that.
In addition, the intensity of co-operations among the local self-governments has
considerably decreased since 2010, the reasons for which are manifold:
the principle of locating tasks in a differentiated way,
taking over of the municipal governmental tasks by the state,
reduction and limitation of the regulation of associations for spatial development and
planning activities, due to the liquidation of the former supra-local spatial unit (the
micro-region).
After a colourful institutionalisation of co-operations, the Act on local governments in
effect broke the organic development path; the legislator regulates one single type of
association, the association with legal entity, with a joint decision-making organ – the type
most closely binding the municipalities. The aim of the introduction of the complicated
regulatory framework was to favour the service organisational activity of the municipalities in
central position, and to stimulate the establishment of associations with large number of
participating municipalities and covering extended geographical areas.
The act ordered municipalities with less than 2,000 inhabitants to operate in joint local
government offices. These administrative zones, however, are becoming the framework for
local public services as well, as from 2016 on the legislator transferred children’s welfare and
family assistance services in the field of local social affairs to the competency of that

Somlyódyné Pfeil, E.
153
municipality which is the centre of the local government office, and they are responsible for
the provision of the task in the total territory of the zone. But, due to the alignment with the
administrative zones, even if the respective municipalities want to choose other means for the
provision of the service, the ones that belong to the same basic level service zone must join
the same provider of the task – i.e. the right of free association is limited. Simultaneously,
towns that are district centres were given professional and methodology centre functions in
connection with these services.
When empowering the central municipality, the legislator uses the principle of so-called
differentiated location of competencies, assigning more tasks to the municipalities with
stronger organisational capacities, which from that time on regulate and implement the
respective tasks for the whole of the service zone. The raison d’être of this measure cannot be
questioned from the aspect of professional rationale and service quality; on the other hand, it
might generate conflicts among the settlement responsible for the task and the local
municipalities gradually deprived of their functions. It is a delicate issue if the latter are able
in the future to influence the tasks that are relevant for their inhabitant, as there are no
regulated mechanisms for the channelling in of their interests.
Due to the mentioned modifications there are scarce institutionalised arenas for horizontal
co-operation, and unfortunately this is true not only for rural areas but even more so for urban
regions. The missing practice of co-operation raises serious problems for the implementation
of strategic planning that is irreplaceable also in public administration, as planning is a
substantial field for the realisation of governance, incorporating the communication and joint
learning process among the actors of different sectors and levels.
Co-operation in urban areas in the light of an empirical survey
In order to test the impacts of the regulation in effect in practice, I made a data collection for
the examination of the situation of the municipal associations – for this snapshot I chose
Győr-Moson-Sopron County as a sample area.36 The source of the processed data is the
database of the County Government Office.
The number of population in the county – featured as NUTS 3 spatial category in the
statistical system of the European Union – was 452 thousand on 1 January 2016.
Administratively the county consists of seven districts and 183 municipalities, among the
latter twenty have their own sovereign mayor’s offices, and 47 joint municipal offices are
maintained by the other 163 municipalities. The county has 12 municipalities with town rank.
36 I express hereby my gratitude to the Government Office of Győr-Moson-Sopron County for their professional assistance and the data that they made available for me.

Somlyódyné Pfeil, E.
154
Municipalities co-operate in the frameworks of a total of 52 associations, with 12
municipalities on the average in one association.
The topics on which the associations are organised well reflect the regulatory changes in
the background. In the largest proportion, the implementation of the only task that remained at
local level in the field of public education – kindergarten education – takes place jointly. This
is followed in frequency by the joint provision of a service belonging to another important
area: child protection and family assistance service in the area of social services. The
associations concentrating on these two human resources services make 60% of all co-
operations till January 2016. Complex associations or ones related to several sectors are
exceptional, their proportion is 10% (Fig. 1).
Figure 1 Topics on which the associations are organised in Győr-Moson-Sopron county, January 2016
Source: Author’s own calculation (database of the County Government Office).
It is an important issue, on the other hand, what happened to the multi-purpose micro-
regional associations eliminated centrally in 2013, which had comprehensively
institutionalised the co-operation of municipalities at LAU 1 level both in the provision of
Maintainance of kindergartens
Provision of child protectionand family assistance
Potable water and sewagemanagement
Spatial development
Complex assotiation
Provision of dental services
Coordination of settlementdevelopment
Regional waste management

Somlyódyné Pfeil, E.
155
public services and spatial development and planning. The multi-purpose regional
associations were part of the institutional system of spatial development liquidated since then,
and so these horizontal co-operations also joined in the vertical branch of governance from
the aspect of representation ((Somlyódyné Pfeil, 2010, 2014). In the examined county
presently seven (micro)regional associations exist as legal successors and only two of the
seven associations co-operate in spatial development and one in the harmonisation of the
development of the settlements. Typically only those associations operate in the hinterlands of
the cities that are no different in their content from the co-operations of rural areas. This is
also true for Győr, a city with county rank, but this county seat city seceded from the
successor organisation of the multi-purpose association and does not try to integrate its
region.37 The majority of the associations have adapted to the changes and their main activity
is the provision of special services for their members, or the maintenance of kindergarten or
medical services.
On the other hand local self-governments, are obliged, anyway, in accordance with the Act
on Built Environment to create their settlement development concept and integrated
settlement development strategy.38 The result is that plans only tangentially concerning the
settlements in the hinterlands were made. In the background of this process we find the fact
while in 2010 the act included, in a progressive manner, that the integrated settlement
development strategies (may) serve joint planning of several settlements, since then in 2012
the legislator has annihilated this decree.
It is worrying in the light of the situation described above that in the co-operations of the
municipalities, joint planning activity is not pursued all, and neither is interest representation
towards other state organs or maybe other sectors. The new institutions of regional
development have been built out at national and county level. In the National Interest
Reconciliation Forum for Regional Development ministries, county self-governments, towns
with county rank, and the capital city and its districts have representations, municipalities and
their interest representation associations do not. The central actor in regional development is
the sub-national level, the directly elected county self-governments that were assigned with
the coordination of the development objectives of municipalities and the economic and non-
governmental sector. However, the interest integration of the municipal self-governments has
37 Győr formalises co-operation in the Hungarian-Slovakian cross-border area and is the lead partner of Arrabona EGTC, which territory differs significantly from the hinterland of the city. 38 Act No LXXVIII of 1997 on the development and protection of the built environment Par. 15. (1) Municipal self-governments may associate for the provision of their tasks in construction affairs, and can also implement their tasks jointly.

Somlyódyné Pfeil, E.
156
no regulated mechanism for the time being, and the assertion of the principle of partnership
must be provided by each of the county self-governments in a way on their free choice.
As it is well known the EU introduced several new tools for the present planning period
with the objective of sustainable urban development, in the case of which integrated approach
is given a special emphasis. The government of Hungary, however, omitted Integrated
Territorial Investment (ITI) in their Partnership Agreement made with Brussels, so the
application of that will not take place in the present programming period. According to the
Union’s guideline, in the framework of CLLD (Community Led Local Development) the
experiences of the previous Leader programme will be extended to the urban regions, and it
will also be an important tool for the strengthening of the urban-rural relationships. In
Hungary the government relies upon CLLD as a tool for the revitalisation of the local and
regional societies. The call announced requires the establishment of action groups in the field
of culture and community building inside of territory of cities.
We can thus conclude that the integration of territorial interests faces several difficulties,
especially in cities with their hinterlands. There is no authorisation and financial support by
the state which would stimulate the integration of resources and the elimination of
competition among territorial stakeholders. This situation contradicts, anyway, the objective
of the administrative reform which says that the state intends to promote the competitiveness
of the economy. Besides the creation of horizontal relations, the establishment of a vertical
co-operation would be just as important among the central level and the territorial and local
administrative organs. A direct contractual relationship seems now to serve this purpose
between the towns with county rank and the government, but this branch of interest
representation is not palpable in the case of all other towns. The county self-governments
authorised for the coordination of territorial interests operate on the assignment of the
electors, while the representation mechanism of the municipalities is not built out either at
meso- or central level. This relationship works in an informal way, which does not guarantee
transparency. Interestingly enough it is often members of the Parliament to play a key role as
coordinators or lobbyists, MPs whose electoral districts also differ from the hinterlands of the
cities.
CONCLUSION
Urban focus is continuously strengthening in the cohesion policy of the European Union, and
it must be applied by the member states during the use of community supports as well. In this

Somlyódyné Pfeil, E.
157
respect the compliance with administrative structures is not a requirement. The ministers of
the member states responsible for urban affairs agreed in the Pact of Amsterdam (2016) on the
approval of the Urban Agenda for the Union. An important reason of this is the fact that while
within cohesion policy urban areas are emphasised and most requirements concerning the use
of supports are relevant for the urban areas, at the level of the member states we are faced with
ambiguous implementation and low efficiency (Pact of Amsterdam, 2016). This paper
verified this anxiety to some extent in relation to Hungary. The survey conducted, along two
principles dominant for the operation of public administration – public governance and the
principle of good governance, expressing the normative orientation of the former –, sought the
answer to the question what conditions the environment defined by the state provides for
Hungarian urban governance. Do the reform objectives set by the state and the tools applied
harmonise with each other? In the assessment of the situation the cohesion policy of the EU
and some processes of the European administrative space were taken into consideration.
The White Paper on European Governance issued by the European Commission (2001)
expressed that the community policies and institutions must get close to the citizens, i.e. the
communities at different levels of the society, economic partners and interest representation
bodies must be widely included in the making and implementation of public policies. In fact,
the integration of the public policies is necessary with a territorial approach, which cannot be
achieved if the mechanisms and structures of the territorial integration of society are absent.
As consequence of this, multi-level governance is the system in which policy making and
execution is divided among different governance levels and local institutions with special
purposes (partnerships of the public and private sector), and in which the power
“disintegrated” during decentralisation can be integrated again (Böhme at al. 2011).
So far we have reviewed the situation of urban policy from the aspect of the state in
Hungary, on the basis of which it has become quite clear that strategic planning is not
integrated with the structure of implementation, furthermore, the state does not even strive to
position the major and medium-sized cities in the European competition of cities. No
pragmatic concept exists for the elimination of the fragmentation of urban areas, and local
stakeholders are apparently not interested in the concentration of forces and co-operation
excluding competition. The co-operative propensity of local authorities striving for autonomy
in Hungary is rather low, there is a continuous absence of territorial thinking.
In practice, co-operative organisations between Hungarian largest cities (with except of the
capital city) and their hinterland cover a small number of co-operations with a narrow content,
mostly designed for the common provision of some human public services. Frequently, there

Somlyódyné Pfeil, E.
158
is no comprehensive institutionalised co-operation between the local governments of the
urban core and its hinterland. These cases mostly reveal the existence of a direct urban policy
since the government does not encourage urban development co-operation between various
levels and sectors.
After the turn of the millennium the cohesion policy of the Union was supplemented by the
concept of multi-level governance (hereinafter: MLG), focusing on the territorially flexible
decision-making mechanism. Territorial cohesion especially requires coordination among
territorial tiers and sectoral policies both vertically and horizontally. MLG is not a threat to
the state, as it implements governance driven by the public sector (Börzel, Heard-Lauréote,
2009). To the opposite, in unitary states the conditions for the operation of the mechanisms of
multi-level governance are usually missing. As our analysis done for Hungary highlighted, at
subnational and supra-local level in territorial development and municipal self-governance
several forms of institutionalised interest integration were eliminated in 2012. Since then the
formation of space has been done with normative tools, exclusively, which is connected to the
reinforcement of the administrative boundaries, and this is not favourable for the development
of city regions, their becoming single governance units.39
As regards coordination among sectors, comprehensive analyses point out that it is still
problematic in Hungary, with hardly any existing institutional structures (Finta, 2015). There
are no meso-level sectoral policies at all, for which there are two explanations. On the one
hand, the territorial organs of state administration have been integrated, apart from a few
exceptions, into the county government offices, their organisational sovereignty was
liquidated. On the other hand, at the meso-level the county self-governments have no public
policy making competency left, their activities are now narrowed down to regional and rural
development and also to spatial planning.
Coming from the paragraphs above, in the absence of power decentralisation and parallel to
the shrinking of the public policy making competency of the municipal self-governments, the
low efficiency of urban governance is forecasted in an etatist administrative environment
besides a direct urban policy, despite the strategic objective of the state. The management of this
urban policy orientation that is becoming explicit, anyway, is in the competency of the Prime
Minister’s Office, even though it has no designated organisational unit within the ministry. This
urban policy lacks any coordination mechanism; it does not build partnerships with sectors 39 The Act on Regional Development and Spatial Planning also regulates an association type, called spatial development municipal association. Regional development associations can be voluntarily established with the exclusive participation of municipalities, but they were not given any sui generis right by the legislator. It is a fact that the boundaries of the associations are defined by the co-operating parties; furthermore, as opposed to the previous situation they do not make a unit of spatial planning. It is a question then how the territorial interest that they represent is integrated into the development agenda created by the central state.

Somlyódyné Pfeil, E.
159
outside public administration and does not promote the co-operation and collaboration of cities
and their regions, either. Shrinking spaces of co-operation and coordination can be seen.
The application of the normative principles of good governance required by the
international financial organisations is still a timely issue, among other things because they
define basic standards of the operation of the public sector that determine the performance of
the economy. These values have been taken over by the EU as well. Surveys have justified so
far that the six principal elements in the new member states are not adequately applied. The
principle of accountability and the rule of law is asserted formally, while there are constant
problems with transparency and forward vision. The biggest problems are caused by the
requirements of efficiency and effectiveness, and responsiveness. (Ágh 2013, p. 56-57.).
Our analysis reveals that a turn has occurred in Hungary in the government attitude
concerning the public sector, and now organic parts of the Hungarian public administration
development strategy are strategic thinking, effective governance, quality of the regulation of
public administration, creation of integrity in the fight against corruption, i.e. several
important principles of good governance. We also have to add a criticism, however, that the
conceptual basis of the strategy is restricted to public administration, within that the internal
relations of state administration, it has an organisational and human side approach and does
not consider the self-government sector, and the economic and non-governmental sector as
resources. The all-pervading centralisation leads to introversion, and so the strategy wants to
solve almost all tasks with central state tools. In fact, it seems to be obvious that the strategic
objectives and certain elements of the implementation are conflicting each other. It is my firm
belief that for the municipal self-governments it will cause bigger loss to abandon co-
operation as a tool promoting creativity and innovation than the gain the state achieves by the
central organisation and organisational rationalisation etc. state-centred public administration
is also a break not only with the methods of NPM but also with governance.
Acknowledgement
The paper was made with the support of Széchenyi István University (Internationalization, initiatives to establish a new source of researchers and graduates, and development of knowledge and technological transfer as instruments of intelligent specializations at Széchenyi University. Project Nr. EFOP-3.6.1-16-2016-00017).
REFERENCES
Ágh, A. (2013). Progress Report on the New Member States: Twenty Years of Social and Political Developments. Together for Europe Series, No. 17. Budapest: Budapest College of Communication and Business.

Somlyódyné Pfeil, E.
160
Altus (2016). The use of new provisons during the programming phase of the European Structural and Investment Funds. Final Report to the Directorate-General for Regional and Urban Policy. European Commission, May 2016. (accessed August 26, 2017).
Balázs, I. (2015). Az államigazgatási hatósági szolgáltatások közigazgatás-szervezési modelljei (Administrative organisational models of state auhority services). Új Magyar Közigazgatás (8) 3, 2–13.
Beluszky P. (2003). Magyarország településföldrajza. Általános rész (Settlement geography of Hungary. General part). Budapest–Pécs: Dialóg Campus Kiadó.
Berg, L. van den – Braun, E.– Meer, J. van den (2007). (eds.) National Policy Responses to Urban Challenges in Europe. Aldershot: Ashgate Publishing Limited.
Böhme, K., Doucet, P., Komornicki, T., Zaucha, J., & Światek, D. (2011). How to strengthen the territorial dimension of ‘Europe 2020’ and the EU Cohesion Policy. Report based on the Territorial Agenda 2020. Prepared at the Request of the Polish Presidency of the Council of the European Union. Warsaw. January 16, 2015 from http://ec.europa.eu/regional_policy/sources/docgener/studies/pdf/challenges2020/2011_territorial_dimension_eu2020.pdf (accessed January 16, 2015).
Börzel, T. A., & Heard-Lauréote, K. (2009). Networks in EU Multi-Level Governance: Concepts and Contributions. Journal of Public Policy. 29(2), 135–151, Networks in European Union Governance. Retrieved November 02, 2016 from http://www.jstor.org/stabel/40542335
d’Albergo, E. (2010). Urban issues in nation-state agendas. A comparison in Western Europe. Urban Research and Practice, 3(2), 138-158. Retrieved January 07, 2013 from http://www.eukn.org/E_library/Urban_Policy/Urban_issues_in_nation_state_agendas_a_comparison_in_Western_Europe
EC (2014) Investment for jobs and growth. Promoting development and good governance in EU regions and cities. Six report on economic, social and territorial cohesion. July 2014. Brussels: EC Regional and Urban Policy. http://ec.europa.eu/regional_policy/sources/docoffic/official/reports/cohesion6/6cr_en.pdf (accessed January 16, 2015).
European Governance. A White Paper. Commission of the European Communities. Brussels, 25.7.2001 COM (2001) 428 final.
Farole, Th., Rodriguez-Pose, A., & Storper, M. (2011) Cohesion Policy in the European Union: Growth, Geography, Institutions. Journal of Common Market Studies. 49(5), 1089–1111.
Finta, I. (2015). Az integrált terület- és vidékfejlesztés eszközei és korlátai Magyarországon. (The Tools and Limitations of Integrated Regional and Rural development in Hungary.) Tér és Társadalom, 29 (1), 132–148.
Frey, R. L. (2003). Regional Governance zur Selbststeuerung territorialer Subsysteme (Regional Governance as self-administration of territorial subsystems). Informationen zur Raumentwicklung 8–9. 451–462.
Harding, A. (2007). Globalization, spatial economic change and urban policy. In: Proceedings of the OECD Conference on What policies for globalizing cities? Rethinking the urban agenda. Madrid 29–30 March. Retrieved July 02, 2014 from http://www1.oecd.org/gov/regional-policy/49680222.pdf
Harrison, J. (2012). Life after Regions. The Evolution of City-Regionalism in England. Regional Studies (46) 9, 1243-1260.
Hegedűs, J., & Péteri, G. (2015). Közszolgáltatási reformok és a helyi önkormányzatiság (Public services reforms and local self-governance). Szociológiai Szemle 2. 88–119.

Somlyódyné Pfeil, E.
161
Herrschel, T., & Newman, P. (2003). Die governance europäischer Stadtregionen (Governance of European city regions). Informationen zur Raumentwicklung, 9–10, 543–555.
Joye, D., Leresche, J-P. (2004). Local government versus metropolitan government: the example of the Lake Geneva region. In: Jouve, B., Lefèvre, Ch. (eds.) Local Power. Territory and Institutions in European Metropolitan Regions. London-Portland, OR: Frank Cass. 128-152.
Leipzig Charter (2007). Territorial Agenda of the European Union. Towards a More Competitive Europe of Diverse Regions. (To be presented for adoption by Ministers responsible for Territorial Development on the occasion of the Informal Ministerial Meeting to be held in Leipzig on 25 May 2007.)
Mayntz, R. (2004). Governance in modernen Staat (Governance in modern cities). In: Benz, Arthur (Hrsg.) Governance – Regieren in komplexen Regelsystemen. Eine Einführung. Wiesbanden: VS Verlag für Sozialwissenschaften. 65–75.
Somlyódyné Pfeil, E. (2005). A tervszerződés intézménye bevezetésének időszerűségéről és szükségességéről (On the timeliness and necessity of the introduction of the institution of planning contracts). In: A tervszerződés rendszerének hazai adaptálási lehetőségei (Final Research Report). Megbízó: Magyar Terület- és Regionális Fejlesztési Hivatal. Témavezető: Somlyódyné Pfeil E. MTA Regionális Kutatások Központja, Pécs.
Somlyódyné Pfeil, E. (2014). The End of Regionalism in Hungary? An Assessment of Local Governance Before and After. In: Pálné Kovács I., & Profiroiu C. M. (eds.) Regionalisation and Regional Policy in Central and Eastern Europe: Selected Revised Papers from the 21st NISPAcee Annual Conference May 16-18, 2013 Belgrade, Serbia. Bratislava: NISPAcee. 87–107.
Somlyódyné Pfeil E. (2014a). A városrégiók pozícionálásának eszközei Svájcban (Tools of the positioning of city regions in Switzerland). Hardi T., & Somlyódyné Pfeil, E. (eds.) Városfejlődési trendek és állami szerepek. A győri járműipari körzet, mint a térségi fejlesztés új iránya és eszköze c. kutatás monográfiái 2. Universitas-Győr Nonprofit Kft. 136–150.
Somlyódyné Pfeil, E. (2010). Hungarian Public Service Reform: Multipurpose Microregional Associations. In: Swianiewicz, P. (ed.) Territorial Consolidation Reforms in Europe. Budapest: Local Government and Public Service Reform Initiative Open Society Institute. 255–264.
Pact of Amsterdam (2016). Urban Agenda for the EU. Agreed at the Informal Meeting of EU Ministers Responsible for Urban Matters on 30 May 2016 in Amsterdam, The Netherlands. Retrieved January 30, 2017 from http:/urbanagendaforthe.eu.
Territorial Agenda of the European Union 2020. (2011) Towards an Inclusive, Smart and Sustainable Europe of Diverse Regions. Agreed at the Informal Meeting of EU Ministers Responsible for Spatial Planning and Territorial Development on 19th May 2011. Gödöllő, Hungary. http://www.nweurope.eu/media/1216/territorial_agenda_2020.pdf.

DETUROPE – THE CENTRAL EUROPEAN JOURNAL OF REGIONAL DEVELOPMENT AND TOURISM Vol. 9 Issue 3 2017 ISSN 1821-2506
162
Professional paper
CULTURAL AMBITIONS OF CITIES IN CENTRAL AND EASTERN
EUROPE IN THE LIGHT OF TWO CITIES' - TALLIN AND MARIBOR
- CASE STUDIES
KULTURÁLIS AMBÍCIÓK KELET-KÖZÉP-EURÓPA VÁROSAIBAN
KÉT VÁROS – TALLIN ÉS MARIBOR - ESETTANULMÁNYÁNAK
TÜKRÉBEN
Szabolcs MORVAYa
a Széchenyi István University, Faculty of Economics. Győr, Egyetem tér 1. H-9026; [email protected]
Cite this article: Morvay, S. (2017). Cultural Ambitions of Cities in Central and Eastern Europe in the Light of Two Cities' - Tallin and Maribor - Case Studies. Deturope, 9(3):162-176.
Abstract
The cities of Central and Eastern Europe have recognized those trends, which are already visible in the Western Europe on cultural sphere. The Western European cities generate development of society and economy based on culture. These trends came up with the age of knowledge-based economy. The cultural economy and the creative economy are spreading more and more in the Western Europe. The progress is helped by the European Union through several cultural project. For example the European Capital of Culture program. Participation in this process has become a strategic weapon for cities seeking to attract cultural visitors. Nowadays, the event has certainly developed beyond its cultural origins. It is becoming a part of urban economic and cultural revitalization. Since 2007 Central and Eastern European cities also can be the title holder of the European Capital of Culture. The first city was Sibiu in Romania in Central and Eastern Europe. I examine the impacts of the European Capital of Culture program on the local economy and society in the cities in Central and Eastern Europe.
Keywords: culture, economic development, cities, Central and Eastern Europe, European Capital of Culture
Kivonat
Kelet-Közép-Európa nagyvárosai felismerték azokat a trendeket, amelyek Nyugat-Európában figyelhetőek meg a kulturális szférában. A nyugat-európai városok társadalmi és gazdasági fejlődést a kultúra bázisán építenek. A trendet egy új kor, a tudás alapú gazdaság kora hozta magával. A kulturális gazdaság és kreatív gazdaság egyre nagyobb mértékben bontakozik ki a nyugati országokban. A folyamatot segíti az Európai Unió kulturális politikája is különböző programokkal, projektekkel. Az egyik kiemelendő projekt az Európa Kulturális Fővárosa cím birtoklása. A projektben való részvétel szinte már-már stratégiai „fegyverré” vált a városok kezében abból a célból kifolyólag, hogy látogatókat vonzanak kulturális attrakciókkal. Manapság, az esemény túlmutat a kulturális értékén. Része a városok gazdasági és kulturális megújulásának. 2007 óta kelet-közép-európai városok is pályázhatnak a címre. Az első e térségbeli város Nagyszeben volt. A tanulmányban a cím birtoklásából fakadó kulturális boom hatásait vizsgáljuk gazdasági és társadalmi vonatkozásban a kelet-közép-európai nagyvárosok esetében.
Kulcsszavak: kultúra, gazdasági fejlődés, városok, Kelet-Közép-Európa, Európa Kulturális Fővárosa

Morvay, S.
163
INTRODUCTION
The course of history economic development has brought changes of employment structure.
This development can be divided into three phases: the pre-industrial, industrial and post-
industrial. The division is at tributed to Daniel Bell, an American sociologist, who is the
famous researcher of the post-industrial era, their works are classic on the topics. The process
of development marginalized the dominance of agricultural sector, initially created the
expansion of the industry, and later the service. So the post-industrial stage is the age of
service society, such as Bell explains. (Bell, 2001)
The post-industrial era or post-industrial society emerged in the Western societies. This
social transformation can be explained not only with changing technology, but primarily with
the change of consumer behavior. The consumer society brought the expansion of the cultural
sphere. Likewise the demand for cultural goods has also increased. The global processes have
replaced the Fordist mass production with the post-Fordist economy. The investment on
material capital, the raw material-based economy contribute not fully to the competitiveness
of countries, research and development, innovation, creativity, appreciation of human capital
are the driving force of development. We observe the rapid emergence of new trends in the
western developed countries – increasing rate of growth of the creative economy and cultural
economy. Mainly Western European and North American regions tended to counteract the
degraded industrial sectors by cultural investment and establishment of research institutions.
It can be mentioned Birmingham educational and cultural complexes, Pittsburgh's cultural
institutions, or the Ruhr region as an example. (Enyedi, 2005; Florida, 2002)
In addition transformation can be observed in the government policy, because began to
prevail active public service, promoting local development policies instead of passive
enforcement of state policy. The development of so-called creative cities has become a part of
a strategy by which they were able to attract investors and highly educated, highly qualified
professionals who Richard Florida calls the creative class. This strategy included the
implementation of an elitist policy which favored, facilitated the so-called gentrification. In
this strategy, it started the revitalization of cities, on a broad base of architectural projects and
cultural institutions. (Bianchini, 1993)
Spectacular events began to enrich the cultural life of the cities and started build-up the
creative and cultural-industrial clusters. The process brought the creation of modern
infrastructure. Dynamic local milieu facilitated the unfolding of a wide range of entertainment
options, restaurants and night life. (Rius-Ulldemolins, 2014)

Morvay, S.
164
The cultural strategies focused initially on cultural tourism and boosting of consumption,
and the cities tried to improve the city’s image, the picture of city by creating large, iconic
cultural project, art districts and places of entertainment. In the 1990's increasingly recognized
the role of human capital and innovation in the urban growth, at the same time the political
discourses turned toward the art and media activities, which were traditionally separate
spheres. (Flew, 2012)
The cities of Central and Eastern Europe have recognized these trends, which are already
visible in the Western Europe on cultural sphere. The Western European cities generate
development of society and economy based on culture. These trends came up with the age of
knowledge-based economy. The cultural economy and the creative economy are spreading
more and more in the Western Europe. The progress is helped by the European Union through
several cultural project. For example the European Capital of Culture program. Participation
in this process has become a strategic weapon for cities seeking to attract cultural visitors.
Nowadays, the event has certainly developed beyond its cultural origins. It is becoming a part
of urban economic and cultural revitalization. Since 2007 Central and Eastern European cities
also can be the title holder of the European Capital of Culture. The first city was Sibiu in
Romania in Central and Eastern Europe.
I examine the impacts of the European Capital of Culture program on the local economy
and society in two cities in Central and Eastern Europe. This cities are Tallinn and Maribor,
because I deal former with Pécs (a city in Hungary), which city was European Capital of
Culture in 2010, and in the following years, in 2011 and 2012 Tallinn and Maribor were the
title holders. Thus these two cities I examine in with respect to project, economic and social
impacts of the ECC title. I highlight the goals of the cities, which they want to reach by
culture, and I describe the achieved results.
THE CONCEPT OF CULTURE
The concept of culture is important in this study, because the study examine the impacts of
certain cultural programs, that is we must understand what is culture, what include the cultural
programs, how to characterized the subject of these programs? Why special the impacts of
cultural projects?
The term is derived from the Latin 'colere' word, which is related to the agriculture, the
expression means cultivation, nursing and care, thus actually word meant cultivation of the
land. Presumably, also the human spirit wishes cultivation, thus makes sense the use of the
Morvay, S.
165
original expression to “polishing” of the human mind and thoughts. This brings us to the Latin
"culture" that encompasses the cultivation of intellectual and artistic activity and the artworks,
which derived from this kind of activity. (Williams, 2003)
However, the concept of culture is much wider; literatures on the subject accept a broader
interpretation of the topic. This means that not only examine the content of high culture - as I
have defined the term "culture" above - but also the concept sets out in its meaning
accumulated knowledge, value systems, models of behavior, habits and beliefs. (Kroeber,
1997)
A number of disciplines addressed with the concept of culture, a result of which many
concepts were born. Kroeber and Kluckhohn counted 165 definitions, which they collected
their own work: Culture. A Critical Review of the Concepts and Definitions. (Kroeber &
Kluckhohn, 1952)
However, can be managed the abundance of definitions with designation of two lines. The
first interpretation represents the anthropological approaches, the second one represents the
normative approaches. Anthropology ascribes culture to human specificities. However, the
normative interpretation understands below culture the products of human's creative activities.
At the same time the narrow interpretation of the culture exists, which means high value
intellectual performance, such as art, literature, philosophy, science. And the broad
interpretation of culture is such cultural communication, which is found in many spheres of
society. (Ács, 2008)
Unified concept - which is accepted by all researchers, who deal with the subject - did not
develop. Basically, the content of the phenomenon of culture is highly complex. And
definitional issues are difficult due to the fact that different disciplines approach the topic
under different respects. (Hrbácsek-Noszek, 2011)
In case of regional science analyses and economic analysis we cannot interpret the concept
as a comprehensive content. Because, different cultural contents influence the spaces and
using of spaces in different ways. Actually, the type of cultural manifestation is in the focus,
when the approach is the spatiality. So in this case we understand under culture the cultural
activities, such as music, painting, sculpture, gallery, museum, etc. In the following parts of
paper we examine that this activities how to contribute to the economy of a city.
THE ANALYSIS OF THE ECONOMIC IMPACT OF CULTURE
It is important to dealing with the economic impact of culture. As the ECC project’s expected
impact should be to the economy of the city. There are requirements that the ECC programs

Morvay, S.
166
have long-term (positive) consequence to the economy. Whether there are at all any impacts
of the cultural activities to the economy of a region or city?
According to traditional approach – culture is costly - cultural activities have a negative
impact on the economy, we must this state so understand that it not produce profit. Basically
lack of equilibrium between supply and demand causes anomalies – that is the supply exceeds
the demand of culture. This is because of the fact the cultural activity has proven to be
deficient. That is to say that the deficit of the budget of the cultural activities is typical. To
the market balance contribute the government support. The view does not enjoy great
popularity and many economists (for example Richard Florida) say that culture creates large
numbers of jobs and major income. There is also a statement that culture is one of the variety
industries and it has neutral impact on the economy. The culture economy can be expanded to
creative industry and the result is a wider set. It must be separated from direct, indirect and
spillover impacts if you want to get a full picture of the economic impact of culture.
(McCarthy, 2004)
In Hofstede's early work (Hofstede, 1980), among the cultural values, individualism, or
compassion, power distance, and morality have become one of the variables, one of which is
positively influenced by one of the variables on economic growth. A 1991 research (Franke,
Hofstede, & Bond, 1991) states that cultural differences (as independent variables) affect the
economic growth of countries. They took into account the impact of political culture on
growth (Jackman & Miller, 1996), which is the conclusion that the relationship between
political culture and growth is negligible. Political culture is based on elements - without the
need for completeness - as authors, as the support of the existing order, the level of political
dialogue, the support of revolutionary changes, or the trust between people. Cultural elements
have also been captured and analyzed, such as performance motivation and postmaterial
values. With their authors in Granato, in 1996, the two variables have a significant influence
on economic growth and emphasize that economic and cultural factors stimulate growth
together. Edwards and Patterson make this exactly the opposite in their 2009 study. (Kapás,
2016)
In addition the historical determinism can be incorporated into the analysis. Because the
post-industrial society brings the changes of employment structure, as a result of this
nowadays the heavy industrial sectors create fewer jobs than the various branches of creative
industry, such as the audiovisual sector. Let's examine the indirect impacts. We can consider
that the spread of creative sectors can give new ideas and technologies to other sectors.

Morvay, S.
167
Culture presents these new ideas in the economy, because the artistic sector an integral part of
the economy, an innovative system for the entire economy. (Greffe, 2016)
It can be said that the art’s activities are also an attraction in the tourism sector, such as
cultural activities and tourism generate mutually beneficial impacts. The more and more
expanding consumption and entertainment possibility become increasingly available for
tourists. It means that the supply become clearer by the development of info-communication
technology, information will be available to the demand, in addition the development of
transportation infrastructure contributes to overcoming physical barriers. Reciprocity is also
reflected that the growth of the tourism industry strengthens the financial viability of cultural
activities and it increases the possibility of patronage as well. (Torre & Scarborough, 2017)
The tourism is an advancing sector in Europe considering the growth rate of this sector. As
direct economic impact we can mention the creation of many new jobs in the sector. The
attractiveness of the region influence the number of tourists, visitors and this is influenced by
the value and quantitative and qualitative criteria of tourist attraction as well as their
presentation ability. The tourism is an important source of revenue for the regions and it has a
major role as regards the employment in many other regions in Europe. In addition,
competitive factors as well. The European Union attributed to legitimate importance to the
sector, which contributes to sustainable social and economic goals. However, the sector was
faced with many challenges by the global economic crisis and the increased competition with
other sectors and the consequences of climate change can be mentioned as well. The culture
come up here by it, that we interpret the tourism industry in the context of culture, that is the
culture is actually the object of tourism. That is the role of culture tourism will be discussed.
One the highlighted cultural element is the cultural heritage in this discussed aspect. If a
region has a unique cultural value, it can appear in the tourism market, this can contribute to
employment growth. A region or some city can form its identity, character, image by their
cultural heritage. (Petronella, 2016)
Cultural values of the region can be interpreted as a form of territorial capital as a source of
development. This is experience not only for tourists but also for local people, generating
social, economic and environmental impacts. The economic value measured by the gross
added value and it has multiplier impact in the economy, tourists visit and consumption in the
region bring income from other regions. (Mateja, David, & Primoz, 2015)
The spill-over impacts of the arts to economy can be classified into four pillars. The
primary impacts should search in direct commercial value. Secondly the spending on the arts
will generate multiplier impacts. Thirdly the arts contribute to birth of industrial idea and

Morvay, S.
168
innovation and the fourth can be mentioned as an effective contribution to quality of life,
identity and plurality. (Heng, 2003)
CULTURE IS TERRITORIAL CAPITAL
Culture can be exploited as a territorial capital of a city or region if it has unique or high-
quality cultural values. But, what is territorial capital?
Pierre Bourdieu extended the capital concept of economics, he takes stock all its
manifestations, which are the following. The capital appears as accumulated labor, which
form may be material or embodied. Depending on the area in which function and in concern
of transformation costs the capital may be three manifestations. Economic capital, which
immediately and directly convertible into cash and can be institutionalize in the form of
property rights. The second aspect is the cultural capital, which is converted into economic
capital under certain conditions and can be and institutionalize in the form of education.
Finally there is social capital which constitutes social obligations and relationships. It
transforms to the economic capital, under certain conditions, or may institutionalize, for
example in the form of noble titles, ranks, titles. According to Bourdieu cultural capital can
also take three forms. The first form: in the embodied state it is interpreted as a long-term
disposition of spirit and body. The second form: the objectified form of the culture appears as
cultural goods, such as paintings, books, tools. The third form: the institutionalized form of
cultural capital that is legally recognized by titles. (Bourdieu, 1986)
Bourdieu is the major researcher of the subject. But among the statement of Bourdieu we
must deal with further statement, which connect to the cultural context. In the concept of
territorial capital we can be found the intangible capital stock. The inta ngible assets of a
nation can describe by such elements as knowledge, level of culture, traditions, national
morale. The competitiveness of the country is more and more determined by their invisible,
specific, unique, intangible values, which are increasingly important for foreign investors.
Investment in research, development, innovation is the most important source of development
of cities, and this investment contributes to growth of knowledge capital and intellectual
capital. All these are conditions of value creation, even if we talk about corporate or regional
aspect. European Union countries and regions try to implement the national and regional
innovation strategies, to achieve the Lisbon objectives, which intend to raise Europe’s
economy to the most competitive knowledge-based economy. (Rusu-Tanasa, 2015)

Morvay, S.
169
Florida's theory of the economic success of cities and regions includes the activating of
internal resources of cities and regions. As a result of activation of internal resources, the
development of the city may bring new developmental elements such as inflows of creative
workers into area. According to Florida this latter process depends on the city what extend
developed in such factors, as technology, talent management, tolerance to attitudes of creative
people. (Florida, 2002) Investigations which were adapted for Europe with regard to the
above show to the Scandinavian countries are in the lead and the Western European countries.
Countries of Central and Eastern Europe are only in the second ten groups. (Ságvári, &
Dessewffy, 2006)
EUROPEAN CAPITALS OF CULTURE
The research question the role of culture in the regional development. The European Capitals
of Culture program contributes to the regional development by the cultural programs. In the
former parts of this paper I show the impacts of culture theoretic way. Now, let see the
practical way.
One of the key themes of cultural programs of the European Union is the European Capital
of Culture. The title awarded to some city of the European Union for a period of one year,
which included the presentation of the city's cultural life and cultural developments. In 1985,
when the European Community Culture Ministers accepted the invitation of the Greek
minister of culture to Athens, born the idea that culture receives the same importance in the
European Community, as the economy or trade. Namely there is economic policy, there is
trade policy, let be cultural policy of the European Union. The European Capital of Culture
event provides an opportunity for European cities to show their cultural program for one year,
which highlight the richness of European culture, diversity and commonalities. (Csekő,
Mesterházy, & Zongor, 2004)
The program started in 1985 with Athens and since then the organizers choose Europe's
cultural capital every year. The period covers other processes that are related to culture, such
as cultural heritage, appreciation of uniqueness. In the beginning the goal was none other than
the variety of European culture to become well-known to all. In the following years more and
more target added to the original idea. The program includes not only festivals, but also

Morvay, S.
170
professional dialogues, forums and consultations and involvement of wider audience into
debates of culture. 40
The major cities of Central and Eastern European countries can be ECC-title holders since
2007, in which these cities can organize cultural programs. In 2007 Sibiu (Romania) was a
Capital of Culture; in 2008 was not city in this macro-region Capital of Culture. In 2009,
Vilnius (capital of Lithuania), chronological order Pécs, Tallinn (Estonia), Maribor
(Slovenia), Kosice (Slovakia), Riga (Latvia), Plzen (Czech Republic), Wroclaw (Poland) were
the title holders. 41
TALLINN AND MARIBOR
Tallinn is the capital and largest city of Estonia. The number of its inhabitants can be over
400,000, one third of which is a Russian ethnicity. Its territory is 159.2 km2 and in the
northern part of Estonia is the coast of the Gulf of Finland. Tallinn is the most important and
largest provider, commercial and financial center of the country. Highly developed
information and communication technology infrastructure and IT sector in Tallinn. Tallinn is
the driving force of Estonia, the development of which has a significant impact on other
regions as well.42
Slovenia's second largest city after Ljubljana is Maribor, with about 119071 people. The
development of the city is largely determined by its geographical position as it lies on one of
the important urban development axes, which stretches from Kopert to Maribor. Rings around
the two big cities in Slovenia include sixths of the country's settlements and 52% of its
population. Maribor and its surroundings is the most urban area in the eastern part of the
country.43
In the following parts I examine these two cities in the context of ECC project, because I
am seeking the benefit impacts of the cultural activities.
TALLINN IS CULTURE CAPITAL OF EUROPE
The Council of Ministers of the European Union designated the 2011 European Capital of
Culture (ECC) holders by the decree of 2006, the cities of Estonia and Finland. In Estonia
40 European Communities, 2009 European Capitals of Culture: the road to success from 1985 to 2010, Belgium 41 www.uneecc.org 42 Tallinn Annual Report 2011, Tallinn City Office 43 Ex-post Evaluation of 2012 European Capitals of Culture, ECOTEC

Morvay, S.
171
took place the national contest in two rounds. In the first round in 2005, were launched the
following cities: Haapsalu, Pärnu, Rakvere, Tartu and Tallinn. In the second round there were
only two cities competing, Tallinn finally won the title. 44
The objectives or cultural ambitions of Tallinn we can read in its applications. The city
formulates the following:
Create such urban environment, that focuses further opportunities and development of
creative activities and initiatives of the citizens.
Provide resources for development of cultural infrastructure to meet the growing
cultural needs of the citizens.
Provide guidelines for the creative economy to be able to integrate into Tallinn's
business community.
Promote cultural communication between Estonia and other European nations art
communities.
Create new projects and collaborations in order to Tallinn to become an open,
multicultural city and help existing and future community events with financial and
development plans.
Access to the city to become an important market in European dimension and an
attractive place for tourists.
The question is whether the objectives have been achieved? We can see that there are
economic aims and social aims, aims about development of tourism, infrastructure, creative
economy, cultural communication. The ECC has failed to fulfill the original vision, but it still
generated economic and urban development. Due to the reduced budget the infrastructure
investment decreased. However, some specific developments can be highlighted. For example
the seaside investment, which the cities today able to live better it’s this aptness. Coastal areas
have been chosen in new ways not only in the context of the European Capital of Culture, but
then it was an important venue for the events. Developments in the area also took place in
2013 as well. The ECC is a specific way to shed light on this previously abandoned and
neglected parts to imaginative reuse, exploit the inherent potential. Furthermore, it can
highlight the cultural sector players have gained international relations, as well as have
intensified cooperation between the various branches of the arts and other sectors. In
connection with the social development it is important to note that managed to increase
44 Report from the Commission to the European Parliament, the Council, the European Economic and Social Committee and the Committee of the Regions, Brussels, 2013

Morvay, S.
172
participation in the culture for the inhabitants side. More results are that the former industrial
areas managed to create a better state, thus these could serve as a location for cultural events.
A series of programs during the year in these industrial spaces, 40,000 visitors visited here.
The program includes 251 projects and more than 7,000 events. The whole event has attracted
some two million visitors. 17% increase in the number of foreign tourists in 2011 compared to
2010. 22% increased the number of overnight stays in the same period in Tallinn. 12% more
domestic tourists traveled to Tallinn in 2011th.45
MARIBOR IS CULTURE CAPITAL OF EUROPE
Maribor was owned by European Capital of Culture title in 2012 together with four partner
cities, which are: Murska Sobota, Novo Mesto, Ptuj, Slovenj Gradec and Velenje. The
Government of Slovenia launched the submit applications process in 2006. Maribor built the
application around the theme of "clean energy", this was the key concept, and referring to the
role of region in the energy production and referring to that the "generated energy" spend on
culture in 2012. The developmental stages were constant changes in management and staff.
There was no agreement on the institutional form and financing and investment into
infrastructure. Finally, in 2010, it founded the European Capital of Culture agency: Maribor
2012 Public Institution. This agency recruited the key people, and made new concept and
slogan. The final program was presented to the public and the media in October 2011, so it
had very little time to organize support activities (international promotion).46
In case of Maribor in application the following objectives have appeared47:
Integrated approach mean in the application, that the concepts such as creativity,
heritage, education, research, digital literacy, cultural tourism, economy, ecology all
together given the philosophy of "clean energy".
Aim is the sustainable development in the region, creating new jobs, economic
growth, increasing the region's competitiveness.
Further aims are the creative use of modern information and communication
technologies, exploitation of renewable energy sources.
Building collaborations within the region and outside.
45 Tourism in Tallinn 2011; Tallinn City Tourist Office & Convention Bureau, 2012; Ex-post evaluation of 2011 European Capitals of Culture, ECORYS, 2012 46 Ex-post Evaluation of 2012 European Capitals of Culture 47
MARIBOR 2012 – The European Capital of Culture

Morvay, S.
173
Enhancing the local identity and the access to culture for local residents, cooperation
with politicians, building the information society.
International awareness of Maribor, development of international cooperation,
strengthen the cohesion of the eastern region of Slovenia.
Cooperation with non-profit organizations and the commercial sector.
Establish the conditions for creativity through the development of cultural
infrastructure.
The renovation of cultural heritage, the fostering of existing assets.
Important to develop the tourism sector offerings by the expansion and development
of transport and the opportunities of recreation.
Digital culture should create new virtual contents.
Stimulate dialogue between different cultures, ethnic minorities, and religious
communities.
Develop educational programs.
Integrate all social groups, especially the most vulnerable (the elderly, the homeless,
the unemployed, young people, people with disabilities).
In the application was originally great importance the impacts of ECC project to
possibilities of development of city, ability which result social and economic development.
However, did not succeed a number of investments to implement, but nevertheless managed
to incorporate elements of urban development into content of program, any core objectives,
which are achieved by the culture, can take success. Among others managed to give to the
city a new impulse, they were able to build deeper trust among the local population and new
connections have been established, all these result social and economic development. The
demand increased for culture by the local population. The city center managed to revive. The
circulation of the whole city started, since the cultural heritage projects were several place in
the city. Most direct economic impact that the supply of tourism sector developed. The main
element of the strategy that the city havs built is cooperation with the Slovenian Tourist Board
and local governments, as well as trade partners such as bus operators, tourist offices. New
information points have been established in Maribor and Ljubljana. Due to the ECC identified
a number of activities, which are based on the relationships between culture, creativity and
other areas. For example, the Maribor University conducts researches with other university
faculties. In Eastern Slovenia happened noticeable economic and cultural growth by the
program series. 3.8 million people were participating in cultural events, which is tourism

Morvay, S.
174
boom. In 2012 more than 700 thousand nights spent in the city 900 thousand foreign visitors.
Estimated profit was 1 million euro as a result of marketing. 600 new jobs have been created
the end of the project. The organizers have implemented 405 projects, of which 308 at
Maribor, 97 created the partner cities and 38 public / networking project. The projects
contained 5624 events themselves, in which in 2012 3.1 million people took part, including a
couple of years prior to 2012 as well 4, 5 million people visited the events.48
CONCLUSION
The cities of Central and Eastern Europe have recognized those trends, which are already
visible in the Western Europe on cultural sphere. The Western European cities generate
development of society and economy based on culture. These trends came up with the age of
knowledge-based economy. The idea spread to cities of CEE. The progress is helped by the
European Union through several cultural projects. For example the European Capital of
Culture program. Participation in this process has become a strategic element for cities
seeking to attract cultural visitors. Since 2007 Central and Eastern European cities also can be
the title holder of the European Capital of Culture. After Pécs title holders were Tallinn and
Maribor, in 2011 and in 2012. The cities formulated their ambitions, that is, what wish to
reach by culture. I examined, what managed to reach of these objectives. The impacts realized
mostly in the tourism sector. We can said, that happened tourism boom in the years of the
project. In addition there were social impacts also, for example managed to increase
participation in the culture for the inhabitants side and managed to give to the cities a new
impulse by the culture. In these cities the cultural programs included several specific events,
which were all built on international cooperation.
During these events counless extra ordinary and excellent artist and performers did their
extra mile for the sake of arts.
Therefore Mariborer and Talliner artworld established the future fundamentals of the
internetional social network and reputation.
Along the realization of the project a management has been formed, which gathered
sufficient amount of experience about the local cultural sphere and the city council have got a
better insight of the regional cultural life.
48 Ex-post Evaluation of 2012 European Capitals of Culture, ECOTEC

Morvay, S.
175
Both the privat asset and individuels sponzors performed weakly in the finance of ECC
project. Based on my experience all the maecenas were absent, so we should find a way to
lure in them in the future, it is not the most visual method yet.
Infrastructure investment have revealed new spaces in the city, gave new impulses to the
city. The number of visitors was generally 1.4-2 million persons. This is tourism boom.
REFERENCES
A Bizottság jelentése az Európai Parlamentnek, a Tanácsnak, az Európai Gazdasági és Szociális Bizottságnak és a Régiók Bizottságának, A 2011-es Európa Kulturális Fővárosa (Tallinn és Turku) eseménysorozat utólagos értékelése. Brüsszel, 2013
Ács, M (2008). A kultúra helye és szerepe az Európai Unió regionális politikájában. In: Pap Norbert (szerk.): Kultúra – Területfejlesztés Pécs – Európa Kulturális Fővárosa 2010-ben, Imedias Kiadó, pp.: 15-35. Pécs
Bell, D. (2001). Az információs társadalom társas keretrendszere. Elektronikus Periodika Archívum, 1(1), 1-31.
Bianchini, F. (1993). Urban Cultural Policy in Britain and Europe: Towards Cultural Planning. pp. 214.
Bourdieu, P. (1986). „The Forms of Capital”. In: Imre Szeman – Timothy Kaposy (szerk.) (2011). Cultural Theory An Anthology. Wiley-Blackwell, A John Wiley & Sons, Ltd., Publication. United Kingdom
Csekő, S., Mesterházy, B., & Zongor, A. (2004). Európa Kulturális Fővárosa, Kultúrpont Enyedi, Gy. (2005). A városok kulturális gazdasága. In: Enyedi Gy., & Keresztély K. (szerk.):
A magyar városok kulturális gazdasága. MTA TKK, Budapest, pp. 13–31. European Communities, 2009 European Capitals of Culture: the road to success from 1985 to
2010, Belgium Ex-post evaluation of 2011 European Capitals of Culture, ECORYS, 2012 Ex-post Evaluation of 2012 European Capitals of Culture, ECOTEC Flew, T. (2012). The creative industries: Culture and policy. London: Sage Publications. Florida, R. (2002). The Rise of the Creative Class. New York: Basic Books. Franke, R. H., Hofstede, G., & Bond, M. H. (1991): Cultural Roots of Economic
Performance: A Research Note. Strategic Management Journal, 12, Special issue: 165-173
Greffe, X. (2016). From culture to creativity and the creative economy: A new agenda for cultural economics. City, Culture and Society 7. pp.: 71-74.
Heng, T. M., Choo, A., & Ho, T. (2003). Economic Contribution of Singapore’s Creative Industries, Economic Survey of Singapore First Quarter.
Hofstede, G. (1980): Culture’s Consequences: International Differences in Work-Related Values. Beverly Hills, CA: Sage Publictions
Hrbácsek-Noszek Magdaléna (2011). Regionális tudat az iskolában. Ab-Art, Pozsony Jackman, R. W., & Miller, R. A. (1996). A Rennaissance of Political Culture? American
Journal of Political Science, Vol. 40, No. 3: 623-659. Kapás, J. (2016). A kultúra szerepe a gazdasági növekedésben: összefoglalás, kritika és
továbblépési utak. Competitio XV. évf., 2. szám, 22-44. o. Kroeber, A. L. (1997 ). A kultúra fogalma a tudományokban. In: Bohannan P. é Glazer, M.
(szerk.): Mérföldkövek a kulturális antropológiában. Panem Kft., Budapest

Morvay, S.
176
Kroeber, A. L., & Kuckhohn, C. (1952) Culture. A Critical Review of the Concepts and Definitions, Papers of Peabody Museum of Archeology and Ethnography
London: Institute for Cultural Policy Studies. MARIBOR 2012 – The European Capital of Culture Retrieved from
http://www.maribor2012.info/wp-content/uploads/2015/04/From-Challenges-to-Results.pdf
Mateja, S. H., David, B., & Primoz, P. (2015). Sustainable Heritage Management: Social, Economic and Other Potentials of Culture in Local Development. Procedia - Social and Behavioral Sciences 188, 103–110.
Mccarthy, K., Ondjatee, E., Zakaras, L., & Brooks, A. (2004). Gifts of the muse: Reframing the debate about the benefits of arts, rand research division. Santa Monica: California
Report from the Commission to the European Parliament, the Council, the European Economic and Social Committee and the Committee of the Regions, Brussels, 2013
Rius-Ulldemolins, J. (2014). Culture and authenticity in urban regeneration processes: Place branding in central Barcelona. Urban Studies 51, 3026–3045
Rusu-Tanasa, M. (2015). Economic Prospects in the Context of Growing Global and Regional Interdependencies”, IECS 2015 Intellectual Capital a Strategic Factor of Socio-Economic Development of Regions and Countries. Procedia Economics and Finance 27, pp. 369 – 374.
Ságvári, B., & Dessewffy, T. (2006). A kreatív gazdaságról — Európa és Magyarország a kreatív korban. Demos Magyarország, Budapest.
Tallinn Annual Report 2011, Tallinn City Office Torre, A., & Scarborough, H. (2017). Reconsidering the estimation of the economic impact of
cultural tourism. Tourism Management 59 (April 2017), 621-629 Tourism in Tallinn 2011; Tallinn City Tourist Office & Convention Bureau, 2012 Retrieved
from https://www.muurileht.ee/en/the-rooftop-cinemas-5th-season-is-about-to-start/ Tudorache, P. (2016). The importance of the intangible cultural heritage in the economy.
Procedia Economics and Finance 39, 731 – 736 Williams, R. (2003). Kultúra. In: Wessely, A. (szerk.): A kultúra szociológiája. Osiris-
Láthatatlan Kollégium, Budapest, pp. 28-32. www.uneecc.org

DETUROPE – THE CENTRAL EUROPEAN JOURNAL OF REGIONAL DEVELOPMENT AND TOURISM Vol. 9 Issue 3 2017 ISSN 1821-2506
177
Professional paper
THE ROLE OF RURAL CITIES’ FESTIVALS IN THE DEVELOPMENT
OF REGIONS
A VIDÉKI VÁROSOKBAN RENDEZETT FESZTIVÁLOK SZEREPE A
RÉGIÓK FEJLŐDÉSÉBEN
Katalin ÁSVÁNYIa, Melinda JÁSZBERÉNYIb
a Corvinus University of Budapest, 1093, Budapest, Fővám square 8., [email protected] b Corvinus University of Budapest, 1093, Budapest, Fővám square 8., [email protected]
Cite this article: Ásvanyi, K., Jászberényi, M. (2017). The Role of Rural Cities’ Festivals in the Development of Regions. Deturope, 9(3):177-187
Abstract
Festival tourism is a dynamically developing area of tourism which is supported by the growing number of festival tourists and by the strengthening of traveling motivations to festivals. The festivals have become very important attractions of the cities and regions. The number of rural cities’ festivals which are mainly for the local communities, is growing by leaps and bounds, but the number of festivals specifically for tourists is also high. The tourist impacts of festivals could be analyzed at economical, physical, environmental, social and cultural levels, but the socio-cultural impact is an under-researched field. In this study we analyzed rural cities’ festivals. We evaluated them on the basis of information available on their websites according to a predetermined criterion. The points of interest from the aspect of regional impacts were highlighted. Our research aims to show the best practices, so how the festival could attribute to the development of the regions. Keywords: festival tourism, local community, regional cooperation
Abstract
A fesztiválturizmus egy dinamikusan fejlődő ágazata a turizmusnak, melyet a növekvő fesztivállátogatók száma és az ezen okból történő utazási motivációk erősödése is alátámaszt, valamint az egyes városok és régiók számára is egyre nagyobb vonzerőt jelentenek. A helyi közösségek számára megrendezett vidéki fesztiválok száma ugrásszerűen megnőtt, ugyanakkor a kifejezetten turisták számára létrehozott fesztiválok száma is magas. A fesztiválok turisztikai hatásait gazdasági, fizikai, környezeti, társadalmi és kulturális szinten is vizsgálható, azonban a társadalmi-kulturális hatásokat kevesen kutatják. Jelen tanulmányban vidéki városokban rendezett fesztiválokat vizsgáltunk, a honlapjaikon elérhető információk alapján értékeltük őket egy előre meghatározott szempontrendszer szerint, és rávilágítottunk a régiós hatások szempontjából sarkalatos pontokra. Kutatásunk célja a pozitív példák bemutatása, vagyis, hogy a fesztiválok milyen módon tudnak hozzájárulni a a régiók fejlődéséhez. Keywords: fesztiválturizmus, helyi közösség, regionális együttműködés
INTRODUCTION
Festival tourism is one of the most dynamically growing areas of tourism. It is proved by the
European Eurobarometer Committee’s research which mentions the festivals as the

Ásvanyi, K., Jászberényi, M.
178
motivation for travelling since 2009, and the festivals also mean a major attraction in
destinations (IPK, 2008). The economic impacts of festivals have been researched since the
1960s, however, the sociocultural effects have not been analysed expect some research (Rátz,
1999; Kundi, 2013).
The aim of our research is to highlight the best practices of regional cooperation in festival
tourism, and to examine how the festivals could contribute to the development of small and
medium cities and also the region. In some cases negative impacts were also mentioned, but
the positive examples were in the focus of our research. It was analysed by content analysis of
the festivals’ websites.
Our main research question was how the festivals could affect the locations directly, and
how they could influence the regional development and cooperation.
OBJECTIVES AND METHODS
The relationship between festivals and tourism goes back for a long time. By the 21st century
these events became one of the most important forms of celebration culture (Szabó, 2012).
Besides the events organized for the locals, recently the number of festivals aimed to target
tourist has risen so much, it would be hard to keep count of them (Smith, 2009).
Many researchers examine the concept of festivals; nevertheless, there is not any definition
which is commonly accepted. According to Getz (1997) the festival is identified as attraction,
image builder, and the animator of static attractions and the catalyst of development. The
definition of the Hungarian Festival Association has more concrete points: all the cultural,
artistic, gastronomical, sport or other series of events could be named festivals which are
themed (one or more themes, organized regularly in one or more locations, have a previously
announced program and it aims to provide an experience that has high quality, transmits
values an knowledge but also it is an enjoyable leisure social activity (Inkei, 2010).
According to the data from 2011 and 2014, art festivals are dominant in Hungary. The
most common is to find festivals with a few thousands or a few 10 thousands visitors. The
ration of foreigners decreases, which means that the festival tourism is becoming a more and
more important motivational factor for travelling in the aspect of domestic tourism (Ásványi
& Márta, 2016).
The festivals aimed to target the local people, not tourists are important because of
building communities and influencing on life quality. Organizing a festival could renew
culture and/or strengthen local identity and acquiring facilities (organizing, cooperation),

Ásvanyi, K., Jászberényi, M.
179
which could be very useful in the field of economic life (Smith, 2009). It is an interesting
question that events meant to attract locals they have touristic significance or not (McKercher
Mei, & Tse, 2006).
It is quite common that a festival for locals is changed to be attractive for tourists as well.
In this case, there could be problems about the loss of authenticity, the giving up of artistic
value and the misesteem of culture (Smith, 2009). Meaning, the balance between the interest
of the local community and the tourists is needed to find. The pressure of sponsors and mass
tourism could also appear to be a danger factor, since it can make the festival one-sided. At
the same time, the lack of tourist could cause the end of the event (Smith, 2009).
The location of the festival might be a critical point, as well as the handling of the
development of such location. Due to the fact that mostly common areas give home the
events, there is always a dependents relationship between the event and the authorities which
leads to long licence procedures. The date changes also have the same critical characteristics
which expect flexibility from the different stakeholders. Getz (1997) points out the difficulties
of the negative image and successful management of publicity. He claims that a number of
destinations do not recognize the benefits of festivals because of these failure factors (Getz,
1997) which cause economic unsustainability.
Although Tanford and Jung (2017) highlight that the satisfaction of the festival is strongly
related to the loyalty which is important for the local community and also for the regional
cooperation.
The festivals has a regional impact as create a positive image for the destination, stimulate
the tourism demand, as more and more people come to the region because of festivals, so
festivals could be tourism catalizator. These events also expand the tourist seasons, mainly if
they are not in the summer. They also could enhance the life and pride of local community
and people of the region, and they mean a way to reinforce social cohesion within the regional
communities. (Akhoondnejad, 2016) Hjalager and Kwiatkowski (2017) analysed rural
festivals in Denmark, so it can be claimed, that festivals have business opportunities for the
region.
The effects of festivals could be examined in an economic, physical, environmental, social
and cultural level. While the economic impact of festivals is a widely-researched area
(Jászberényi, 2016), the socio-cultural effects are under-researched (Ásványi & Jászberényi,
2017).

Ásvanyi, K., Jászberényi, M.
180
The tourist arriving to the particular festival and destination, and the locals greeting them,
and their relationship play an important role in the socio-cultural impact of festivals, and the
touristic development of the destination also affects it (Kundi, 2013).
While examining the socio-cultural impacts, our aim was to demonstrate from the aspect of
regional development, how the festivals could affect the locations directly, how they could
influence the regional development and cooperation. As the focus was the social-cultural
impacts, seven categories were used (Rátz, 1999) to analyse these regional aspects:
▪ the quality of locals’ life,
▪ change and enlargement of employment structures,
▪ change of value-system
▪ development of individual, family and social relationship,
▪ expression of creativity,
▪ local community organizations,
▪ change and preservation of traditions.
While analysing these factors, the embeddedness to local communities was a key point, as
the residents’ participation in local festivals influence their quality of life and well-being
(Yolal et al., 2016). In other words, what the locals’ attitude is towards the festival, how much
they support is, how much it means the possibility of preserving the local traditions and
culture, how it contributes to the change of value-system, how it strengthens the family and
social relations, how it helps the creativity and the organizations of the local community and
how it changes the employment structure. All of the seven criteria from the regional point of
view were examined and valued by the regional development and cooperation opportunities.
Our research was divided into two parts. The first phase of the research was made in a
university course (Event management), Tourism and catering third year students (50 people)
chose a festival and they interpreted the festival website along the seven criteria. The
qualitative content analysis was used because it is a flexible research method to analyse
documents and written materials (Babbie, 2003; Hoffman, Wilson, Martinez, & Sailors,
2012). From festivals selected by the students 40 festivals’ websites contain information for
each criterion. Most of the information could be found in the news/information/archives part
of the websites. In the second phase of our research these 40 festivals’ websites were
analysed. Content analysis were also conducted, in which the theoretical codes were
determined along the seven criteria and the open codes were applied to highlight festivals’
role in regional development.

Ásvanyi, K., Jászberényi, M.
181
In our present research the social-cultural impacts of festivals were aimed to explore along
the principles of regional development and cooperation. It was not our goal to generalize the
results, but rather to highlight the positive examples.
RESULTS
Presenting the results of content analysis the dominant answers were highlighted along the
seven criteria considering regional aspects.
In the respect of the quality of local life there are positive and negative impacts. The
services improves and needs more and more, it is a good way for the local enterprises to show
their products and services to people who do not meet them any other places, so the festivals
are also a good chance to local and regional enterprises, they could come every year and it
could serve them a current income in the days of the festivals. One of its main positive
impacts is that festivals provide opportunities for regional cooperation. It also means over
return for the settlement (village or town) which they can use for development and investment
as Sopron does due to the Telekom Volt Festival. The festival is a good marketing tool for the
settlements, it encourages their image and it can cause recreation for the city or the whole
destination in the region. The festival warm the local people’s life, it is a good way for
relaxing and having fun, at the same time it also enhances the togetherness. Festivals
invigorate the lives of local people; they give them entertainment and relax facilities, which
good for social networking. In more festivals locals give accommodation for the guest of
festivals, which can be a plus income, as Ördögkatlan Festival in Nagyharsány, more people
have money to fuel due to the festival.
Although the festivals have negative impacts to the locals’ lives. It causes loud noise, the
settlement is dirty after the event, and it also destruct the environment. On the Komárom Days
Festival (Komáromi Napok) year to year the organizers try to expand and make more
beautiful the green areas of the city and before the festival they develop the physical
environment of the event site as asphalting and renovating the buildings). During the festival
the transportation is overcrowded and there are traffic jams, which makes locals’s life harder
in their every day, and also the capacity of the place of the settlement is not enough big for so
many people. Now there are festivals which are outside the settlement to avoid this negative
impact. For example the Voluta International Watercarneval (Voluta Nemzetközi
Vízikarnevál) in Mosonmagyaróvár, which is outside the city, so it does not hold up the traffic
and does not disturb the tranquillity of locals. To prevent or solve the negative impacts, it
sometimes causes positive impact, as the Ozora Festival, where the environment awareness is

Ásvanyi, K., Jászberényi, M.
182
an objective and verifiable as the area is clean and surprisingly high order and the slag
material of the environmentally friendly flush toilets replaces about 80 percent of fertilizer
used on the surrounding soil.
The impact on employment structure appears on more fields, the festivals have a bit more
and deeper impacts for the settlement than for the region. The festivals cause positive impact
on more industries, as they generate the tourism industry in the whole region; the
accommodations are nearly 100 % full of guests in the city and also in the settlements close to
the festival, and hospitality also well-utilized during the festivals. A lot of local people are
involved in the security service as in Fishing on Orfű. For local and regional businesses these
festival days mean the biggest rate of the whole year income, as they could sell most of their
products during the festivals. On the website of Szigliget Walleye festival (Szigligeti
Süllőfesztivál), there are recommendations to catering, accommodations and wineries, and
they employ local and regional handicrafts as the festival aims to extend the tourist season to
boost local businesses. Local NGO-s (non-governmental organizations) could help more on
festivals and could appear better, but rarely could we also find NGOs from the region. The big
difference is in the permanent job, as for people from the region working on the festival it is
only a seasonal job. In Savaria Historical Festival (Savária Történelmi Fesztivál) the number
of permanent jobs also grows. Most of the festivals have volunteers especially students or
retiring people as in Water-Music-Flower Festival (Víz-ZeneVirág Fesztivál), where also
mainly due to the graduation requirement a lot of students volunteer at the event. The
Győrkőc Festival also known as almost all the people who work there are volunteers. Being a
volunteer in a festival is really important for locals, as it is a tradition in Hollókő Easter
Festival. The festival also impact the employment structure geographically, as not just the
local people, but also people from the region could show their products during the festival, as
Vac Wordly Gaiety (Váci Világi Vigalom), where at first just the local residents sold their
wares but now tradespeople come from all over the country.
The change of value system realizes from more aspects. Most of the festivals highlight the
knowledge and love of the culture, which change people mind about the culture and show
them how beautiful it could be There are values which promotes an approach to different
ages, as the kid-centric Győrkőc festival in Győr show that this type of events also can be a
good relaxing program for kids not just for adults, and the family member can enjoy
themselves together very well on festivals too. There are a lot of festivals where the guests
can donate blood which raises awareness of the help of others as in Hungarikumok festival in
Szeged where the opportunity of blood donation is given every day of the event. The festival
also can serve others’ help but in another way, as embracing young musicians. The Veszprém

Ásvanyi, K., Jászberényi, M.
183
Street Music Festival (Veszprémi Utcazene Fesztivál) provides an opportunity both local,
regional and other undiscovered young musicians to familiarize them. In the heart of the city
there is space anywhere to play music. For locals the festival is particularly important, a large
proportion of the population (mainly 15-30 years) participate in at least one day to see their
friends’ performance. The local identity is also a good value which can be strengthened by the
festivals, and as it means local people like to live and work in their settlement and in their
region. In the Szombathely Savaria Historical Festival (Szombathelyi Savária Történelmi
Fesztivál) the local patriotism appears, people are proud of their city and worthy celebrate its
creation. More and more festivals incite people to do sport activities. The Szeged Wine
Festival organizes dragon boat race and half marathon. The values of gastronomy appear on
festivals in several ways, for example Sweat Days in Győr (Édes Napok) we can see the
countless ways of the use of chocolate. The Szigliget Walleye Festival draws the attention of
the Hungarian wines, lake fiches and the importance of fish consumption. The environment
and the awareness of environment as values can be found for example on Szeged Youth Days
(SZIN-Szegedi Ifjúsági Napok), which also obtained the International Greener Festival
Award.
The development of individual, family and social relationship can be experienced in every
festival. The festivals could be family celebrations also, the locals invite their distant relatives
and it strengthens the family relations. This type of event is also suitable for interacting
people, people can have new friends, and they can be together on the festival next year or they
can also meet other days of the year in the settlement. In Summerfest the locals have new
friendship with foreigners too. Some people knew their love and come back later as a family,
so children also will be traditional festival guests and for example on Szeged Youth Days
(SZIN) there was a marriage proposal in 2015. On Beach Festival in Zamárdi (Strand
Fesztivál) there are forums on website, where people can find a car, a free tent, almost
everything, so anybody can go alone, he or she can be sure to find people with whom they can
have fun. On Tokaj Wine Festival (Tokaji Borfesztivál) the leaders marching along with local
people, they can have better relation, and people will be more loyal to the city. The residents
of the surrounding settlements also know each other better, so for example The Pumpkin
Festival (Tökfesztivál) has a strong community building impact in the region.
The expression of creativity could appear in three ways, as imaginative installations and
works, as programs or in the field of gastronomy. One of the best example for creative
installations on Volt Festival there is a Volt Art Zone, where in front of the eyes of the public
they form furniture from pallet involving adventurous people. The programs are various in
festivals, but the creative ones could be parades for example in baroque costume in Vác, or

Ásvanyi, K., Jászberényi, M.
184
shows/exhibitions as falconer show and Old-timer exhibition in Hungarikumok. The creativity
in gastronomy is expressed as interactive pastry making in Hugarikumok or cooking fish soup
in a giant cauldron in International Tisza Fish Festival (Nemzetközi Tiszai Halfesztivál). The
programs and gastronomy examples serve mainly the regional cooperation.
The local community organizations could be an important part of festivals, which is an
essential element from regional aspect. Typically the following organizations participate as
organizer in festivals: the local government, the local and regional NGOs, the educational
institutions, the local and regional media-partners, the local and regional sponsors and wine
makers. But there also organizations who are performers on the festival: local music groups
and bands in classical and pop music, dance clubs and tradition preserving associations.
Although there are organizations which are informal, just provide the opportunity for visitors
to be together with the others: the blood donation in (Szekszárdi Szüreti Napok), the
competitions as the Powerful Man Competition in, the parades in Pálinka and Little Pig Picnic
in Zalaegerszeg (Pálinka and Mangalica Majális), and to collect donations as visitors could
give donation in Szigliget Walley Festival to the SOS Kidvillage in Kecskemét.
The last criteria is to change and preserve the traditions. There are traditions related to
gastronomy, folklore or culture. The main gastronomy traditions which appear on festivals are
for example the gastrotours (wine, ramson), the cooking competitions, the pig slaughter, the
vintage parade. There are folklore programs as folk bands or Swabia folk traditions and other
authentic programs. We can meet cultural or historical programs which also preserve
traditions as archery and horse-riding program in Water-Music-Flower Festival or the
baroques parade.
As the analysed festivals is organized since more years, the locals and people from the
region is waiting and preparing for it, and they make inquiries about the program and tickets,
it is really important from the social sustainability part. Most of the time the festival mean the
primary income for locals and local enterprises in the summer as locals could give guests
accommodation and SMEs (small and medium enterprises) realize their products and services
which encourages the regional development economically.
DISCUSSION AND CONCLUSION
Analysing the socio-cultural impacts of festivals, we highlighted the main actors and the
fields in which the regional development and cooperation could implemented due to the
festivals: services, tourism, marketing, economy and society.

Ásvanyi, K., Jászberényi, M.
185
For local and regional enterprises the festivals could be a very good opportunity to show their
products and services. People from the region could meet them and buy from them. The
festivals also give chance for local and regional NGOs, they can appear with a stand and
people get know their activities. Regional bands could play music and get more audience.
Dance club could dance and people from the region might take a fancy to join to the club. Due
to the festivals there is a growing demand to the private and commercial accommodations and
also the restaurants and other hospitality service suppliers. These days are the most reserved
days of the year for the accommodations in the festival cities and also in the surrounding
settlements.
As social impact the festivals facilitate the community building of the region, people get
know each other. The surrounding settlements work and entertain together. As local
communities like to live in their region, they will not move anywhere, they want to work and
live in their region.
There are also some economic impacts which help the regional development. Due to the plus
income which realized in the cities and the regions, there are more infrastructural
developments and investments. The region could be attractive to new investors and
companies, so the positive effects could be realized in regional level.
From the marketing aspect the festivals rise the image of the city and the region, it is good for
revitalize the destinations and the whole region might became well-known.
Our main research question could be answered by the results of content analysis. The
festivals mainly have positive impacts on the locations, and they could also positively
influence the regional development and cooperation so we could claim that the festival
tourism is a good chance to regional cooperation and development on more levels.
However, the festivals also raise a number of dilemmas. The internationalizations and the
continuous increase in the number of visitors might affect the loss of authenticity and culture,
and the abandonment of the art fair. These priorities are hard to be reconciled as the aim of the
analysed festivals is to preserve tradition by involving the local community and also attracting
tourists. There are further research fields in this topic such as the effect of increase in’ number
visitors for authenticity or the change in relationship between local inhabitants and tourists
which also influence the regional impact of the festivals.
REFERENCES
Akhoondnejad, A. (2016). Tourist loyalty to a local cultural event: The case of Turkmen handicrafts festival, Tourism Management, 52, 468-477.

Ásvanyi, K., Jászberényi, M.
186
Ásványi, K., & Jászberényi, D. (2017). The effects of the festivals in the light of sustainability, Sustaining sustainabilities – Tourism 2017, cultural heritage and cultural capital, Conference proceeding, Veszprém, 3th-6th, May, 2017 ((in press))
Ásványi, K., & Márta, I. (2016). VI. A hazai fesztiválpiac kínálata [The supply of the Hungarian festivals], in: Jászberényi, M. – Zátori, A. – Ásványi, K. (szerk). Fesztiválturizmus (Festivaltourism), Akadémia Kiadó, Budapest. 82-96.
Babbie, E. (2003). A társadalomtudományi kutatás gyakorlata. [The practice of social science research] Balassi Kiadó: Budapest.
Getz, D. (1997). Event Management and Event Tourism. Cognizant Communications Cororations, New York.
Golnhofer, E. (2001). Az esettanulmány. [The case study] Műszaki Kvk., Budapest Hjalager, A. & Kwiatkowski, G. (2017). Entrepreneurial implications, prospects and
dilemmas in rural festivals, Journal of Rural Studies, in Press Hoffman, J.V., Wilson, M.B., Martinez, R.A., & Sailors, M. (2012). Content analysis: The
past, present, and future. In: Duke, N., & Mallette, M. (Eds.). Literacy Research Methodologies, Second Edition New York: Guilford, 28-49.
Inkei, P. (2010). A magyarországi fesztiválok minősítési rendszere. [The qualification system of Hungarian Festivals] Magyar Fesztivál Regisztrációs és Minősítési program füzet., Budapest. 2010
IPK (2008). European Travel Monitor 2008, IPK International, Munich Jászberényi, M. (2016). II. A fesztiválok gazdasági hatása [The economic impact of festivals],
in: Jászberényi, M. Zátori, A., & Ásványi, K. (szerk). Fesztiválturizmus, Akadémia Kiadó, Budapest. 34-43.
Kundi, V. (2013). Fesztiválok városokra gyakorolt gazdasági és társadalmi-kulturális hatásainak elemzése, A győri Magyar Táncfesztivál és a Miskolci Operafesztivál példáján keresztül [The analysis of economic and socio-cultural impacts of festivals, The Hungarian Dance festival in Győr and the Miskolc Opera festival], PhD disszertáció, Győr.
McKercher, B., Mei, W.S., & Tse, T.S.M. (2006). Are Short Duration Cultural Festivals Tourist Attractions? Journal of Sustainable Tourism, 2006/1, 55-66.
Rátz, T. (1999). A turizmus társadalmi-kulturális hatásai [The socio-cultural impacts of tourism], PhD disszertáció, Budapesti Közgazdaságtudományi Egyetem, Budapest.
Smith, M. (2009). Fesztiválok és turizmus. Lehetőségek és konfliktusok. (Festivals and tourism. Opportunities and conflicts). Turizmus Bulletin, 2009/3. Budapest.23-27.
Szabó, J.Z. (2012). A turisztikai fesztiválok látogató-összetétele. [The visitors of touristiv festivals] In: Juhász, E. – Chrappán, M (szerk.) (2012). Tanulás és művelődés, Debrecen: Debreceni Egyetem. 535-540.
Tanford, S., & Jung, S. (2017). festival attributes and perceptions: A meta-analysis of relationships with satisfaction and loyalty, Tourism Management, 61, 209-220 (in press)
Yolal, M., Gursoy, D., Uysal, M., Kim, H., & Karacaoglu, S. (2016). Impacts of festivals and events on residents’ well-being, Annals of Tourism Research, 61, 1-18.
Annex 1 Analysed websites (Download in March-May 2016):
1. Badacsonyi borhetek http://www.badacsony.com/esemenyek/badacsonyi-borhetek-201107160731.html
2. Balaton Sound http://sziget.hu/balatonsound/
3. Bánkitó Fesztivál http://bankitofesztival.hu/?lang=en
4. Barokk Esküvő http://www.mufegyor.hu/hu/esemenyek/25-barokk-eskuvo
5. Boglári Szüreti fesztivál http://www.boglariszuret.hu

Ásvanyi, K., Jászberényi, M.
187
6. Debreceni Campus Fesztivál http://www.campusfesztival.hu/
7. DUDIK http://dudik.hu/
8. Dunakeszi Feszt http://www.dunakeszifeszt.hu/
9. Édes Napok - Győr http://edesnapok.hu/gyor-2017/
10. Efott http://efott.hu/
11. Egerszeg Fesztivál https://www.egerszegfesztival.hu/
12. Egri Bikavér Ünnep http://www.bikaverunnep.hu/
13. Fehérvári Lecsófőző Vígazság http://www.fehervarilecso.hu/
14. Fishing On Orfű http://www.fishingonorfu.hu/
15. Győrkőc Fesztivál, Győr http://www.gyorkoc.hu/
16. Gyulai Kolbász-és Sódarmustra http://www.sodarmustra.hu/
17. Komáromi Napok http://komarominapok.eu/
18. Közgáz évzáró http://evzaro.kozgaz.net/
19. MEN http://www.mehok.uni-miskolc.hu/men/
20. Mohácsi Busójárás http://www.mohacsibusojaras.hu/
21. Nagymarosi Sváb-és Szüreti fesztivál http://www.nagymaros.hu/
22. Ozora Fesztivál, Dádpuszta https://ozorafestival.eu/
23. Őrségi Tökfesztivál http://www.orsegitokfesztival.hu/
24. Pálinka és Mangalica Majális - Zalaegerszeg
http://zgke.hu/majalis/
25. PEN http://www.pecsiegyeteminapok.com/
26. Savaria Történelmi Fesztivál, Szombathely
http://www.karnevalsavaria.hu/2017/
27. Strand Fesztivál http://strandfesztival.com/
28. Summerfest https://summerfest.com/
29. Szegedi Borfesztivál http://szegediborfesztival.hu/
30. Szegedi Hungarikumok Fesztivál http://hungarikum-fesztival.hu/
31. Szegedi Nemzetközi Tiszai Halfesztivál
http://www.halfesztival.szegedihalaszcsarda.hu/
32. Szekszárdi szüreti fesztivál http://www.szekszardiszuretinapok.hu/index.php?action=kezdolap
33. Szigligeti süllőfesztivál http://www.sullofesztival.hu/
34. SZIN http://szin.org/
35. Tokaji Borfesztivál http://www.tokaj-turizmus.hu/Tokaji-Bornapok
36. Váci Világi Vigalom http://vacivigalom.hu/
37. Veszprémi Utcazene Fesztivál, Veszprém
http://www.utcazene.hu/
38. Víz-zene-virág Fesztivál http://vizzenevirag.hu/
39. VOLT Fesztivál http://volt.hu/
40. Voluta Nemzetközi Vízikarnevál, Mosonmagyaróvár
http://www.voluta.hu/

DETUROPE – THE CENTRAL EUROPEAN JOURNAL OF REGIONAL DEVELOPMENT AND TOURISM Vol. 9 Issue 3 2017 ISSN 1821-2506
188
Professional paper
THE POTENTIALS OF RURAL TOURISM IN DEVELOPING RURAL
AREAS IN ALBANIA
Henrietta NAGYa, József KÁPOSZTAb, Bledar METAc
a Szent István University, 2100 Gödöllő, 1 Páter K. str., Hungary, [email protected] b Szent István University, 2100 Gödöllő, 1 Páter K. str., Hungary, [email protected] c Szent István University, 2100 Gödöllő, 1 Páter K. str., Hungary, [email protected]
Cite this article: Nagy, H., Káposzta, J., Meta, B. (2017). The potentials of rural tourism in developing rural areas in Albania, Deturope 9(3):188-206.
Abstract
The inspiration that drove us to this study is that conventional tourism in Albania is focused more on promoting seaside, cultural tourism, luxury resorts, etc. which has demonstrated a good trend. At the same time, specific parts of the country have been abandoned due to their underdeveloped situation. Given their assets as constructed and indigenous habitat, they progressively appear as regions for rural tourism development. It could provide good development opportunities in remote mountainous areas that every day more are abandoned by the population because they do not have enough employment opportunities. But as for other rural areas which have a great potential for development of rural tourism, they are not preferred by the population either to live because they do not have developed agriculture. They do not provide the opportunity to earn enough money to live on at the appropriate standard. So the development of rural tourism would help the population in such areas to diversify their activities and earn some extra income, motivating inhabitants to stay in their own areas. Overall, it would contribute to the balanced development of the regions of Albania. Keywords: regional development, rural areas, tourism, rural tourism, Albania
INTRODUCTION
Albania has very favourable conditions for tourism, including rural and agrotourism. It is
located in the Southeast part of Europe and Southwestern of Balkan Peninsula (Fig. 1).
Albania is a small European country covering a territory of around 28,700 square kilometers
with a population nearly three million people. Boundary of Albania is 1094 km long
altogether, out of which 316 km-border along the sea, a 73 km-long lake border, 48 km-long
river banks border and 657 km-long terrestrial border. It is in the border with Montenegro to
the North, with Kosovo to the Northeast, with Macedonia to the East and with Greece to the
South. In the West and Southwest, Albania is bordering on the Mediterranean Sea. Albania
shares the Adriatic Sea with Italy to the Western part and to the Southwestern part it shares
the Ionian Sea with Greece. Most of the territory of Albania is a mountainous place, with
Mediterranean climate where temperatures reach very high values in summer and very low in
winter.

Nagy, H., Káposzta, J., Meta, B.
189
Figure 1 Map of Albania
Source: https://en.wikivoyage.org/wiki/Albania#/media/File:Albania_Regions_map.png
Albania is divided into three major regions as follows:
Coastal Albania: the long narrow strip between about 10 and 30 km wide along the whole
Albanian coast, bordering both the Adriatic Sea and Ionian Sea
Northeastern Albania: the inland region to the North of the Shkumbin River, bordering
Montenegro, Kosovo and Macedonia
Southeastern Albania: the inland region to the South of the Shkumbin River bordering
Macedonia and Greece, and including the great border lakes, Lake Ohrid and Lake Prespa
(https://en.wikipedia.org/wiki/Albania).
Based on the favourable conditions for tourism in general, including rural tourism, the
Albanian government has started to advance rural tourism so as to manage nearby economies
and to improve work and development opportunities. Rural tourism is viewed as a new
component of the Albanian supply of tourism, providing opportunities for little villages and
rural regions of the country as mountains, hills, rivers, lakes, farms etc. In this study we
intended to collect information on rural tourism, to review tourism attempts and strategies, to
give an overview on the current situation through analyzing two interviews in two case
studies. Based on the favourable conditions for tourism in general, including rural tourism, the
Albanian government has started to advance rural tourism so as to manage nearby economies
and to improve work and development opportunities. Rural tourism is viewed as a new
component of the Albanian supply of tourism, providing opportunities for little villages and

Nagy, H., Káposzta, J., Meta, B.
190
rural regions of the country as mountains, hills, rivers, lakes, farms etc. In this study we
intended to collect information on rural tourism, to review tourism attempts and strategies, to
give an overview on the current situation through analyzing two interviews in two case
studies.
LITERATURE REVIEW
In Albania there are two nationwide strategies that are to be implemented until 2020 with the
aim to develop rural areas directly and indirectly. One of them is the National Strategy for
Development and Integration 2015-2020, including a subchapter about regional
development mentioning that the main challenge is to ensure a balanced development
between regions of the country, and to increase the cohesion of the country's development in
relation to other EU countries, through the consolidation of an effective system of regional
planning and development. Specifically:
- Uneven development between regions of the country and in the international
context. Development between regions of the country, between the municipalities and
communes, but also between rural and urban areas, as well as between peripheral
coastal and mountainous areas of the country remain uneven. Migration both within
and outside the country is still a critical issue. There is an overpopulation in developed
areas and depopulation of some areas, leading to inefficient use of infrastructure and
services (schools, health centers, roads, water supply, etc.).
- Incomplete policy framework and capacity constraints. The policy framework
should be consolidated, and the capacities for regional development management
should be further developed. Powers of the regions regarding regional development
management remain limited. The relationship between different levels of strategic
planning and implementation at national, regional and local level remains weak.
Project management capabilities in regional administrations remain limited.
According to the content in the agriculture and rural development subchapter of the
abovementioned strategy, the challenges in this sector include:
- enhance competitiveness of agriculture and agro-processing in national, regional and
global markets;
- enhance farm size through land consolidation and land market development;
- improve the technology and innovation transfer system through extension services;
- further improve infrastructure in agriculture towards sustainable use and management
of natural resources and mitigation of climate change;

Nagy, H., Káposzta, J., Meta, B.
191
- improve basic and recreational services, and diversify the activities that generate
income in rural areas.
As for tourism development, as a result of infrastructure investment and improved service
quality, the tourism sector share in the economy has grown considerably in recent years.
Direct contribution of the travel and tourism sector in GDP in 2016 stood at 8.4% (is
forecasted to increase by 5.2% by 2017), while total contribution to GDP in economy was at
26% (is expected to rise by 5.3% by 2017). Tourism in 2016 supported directly 85,500 jobs or
7.7% of total employment and indirectly 267,000 jobs or 23.9%. Visitor exports generated
56.1% of total exports in 2016 (https://www.wttc.org/-/media/files/reports/economic-impact-
research/countries-2017/albania2017.pdf).
Challenges in tourism sector include: improve the image of tourism through enhanced
promotion and marketing; perfect the certification system and standards in order to increase
the quality, as well as human capacity building to improve tourism services; improve the
climate business and encourage private investment; organise data collection and analysis at
local, regional and national level according to international standards.
According to the strategic plan, the priorities and objectives of the sector are as follows:
1. Develop the tourism sector by increasing:
- Direct contribution to GDP by 0.2% annually; contribution to total employment from
19.7% in 2011 to 20.3% in 2020; and the number of non-resident foreign nationals by
50% compared to 2011.
- Promotion and marketing to improve Albania's tourism image as a tourist destination
of special interest, through: participation in international fairs, distribution of
promotional materials, online promotion, development and transmission of TV spots;
- Establishment of tourism promotion offices that promote tourist values and resources
in the international markets targeted for attracting foreign tourists.
2. Diversify tourism products extended in the whole territory to ensure integrated
tourism development:
- Expand the season beyond the actual 3-month period;
- Upgrade infrastructure and access to objects classified as cultural monuments in order
to double the number of visitors;
- Establish a National Register of tourist resources and create new tourist routes in rural
areas rich in natural and cultural resources
- Support the creation of tourist destination management organizations with the
involvement of public stakeholders, business and tourism community.

Nagy, H., Káposzta, J., Meta, B.
192
3. Perfect the system of certification and standards in tourism in order to increase
the quality and strengthen data collection and processing capacity:
- Strengthen human capacity in the tourism sector through: promotion and certification
of professional training courses in colleges and universities, award of national prizes
or success/excellence awards in tourism services; Train employees in tourist service
offices in 9 regions and sea entry points on the tourist data processing standards of the
World Tourism Organisation;
- Train tourist operators in at least 4 regions regarding the collection, processing and
entry of tourism data, in collaboration with the Tourist Service office.
The other relevant national strategy is the Strategy of Tourism Development in Albania
2014-2020 that aims to promote the sector in the country. According to the strategic direction
of nature and rural tourism 2014-2020, in selected destinations with attractive potential
natural and traditional villages with an authentic lifestyle there is an attractive tourist product
range of special interest. Offers in tourism and rural nature are well-known and consolidated
in the main markets of resources.
1. Economic objectives
- Increase the contribution of nature and rural tourism in income and economic impact;
- The nature and rural tourism contributes to poverty reduction and revenue growth in
different destinations of the country.
2. The objectives regarding market
- Nature and rural tourism is an integral part of the offer cultural and natural tourism to
foreign tourists (increase (triple) the number of international tour operators that offer
nature-based tourism);
- Tourism nature, especially natural active tourism, an increased number of domestic
tourists.
3. Strategic measures to create product of nature and rural tourism, institutions,
planning, standards
- Determination of functional responsibilities at the national level for nature and rural
tourism;
- The destination management support to 10 destinations for natural and rural tourism;
- Support for marketing development of natural and rural tourism destination.
4. Environment and attractive atmosphere to destinations
- Supporting environmental improvement and attractive atmosphere in the natural and
rural tourism destinations;
- Accommodation support in villages.

Nagy, H., Káposzta, J., Meta, B.
193
5. Access
- Support the planning and realization of a signaling system to inform and guide
tourists;
- Support improved ease of entry in natural and rural destinations and transportation
within the areas.
6. Business support services
- Support the establishment of advisory services and support to businesses
7. Support for the organization of supply and activities
- Support the development of rural tourism;
Support traditional local activities,
Support traditional farms,
Support the creation of agro-biodiversity products related to tourism,
Intertwined support for rural development projects.
- Supporting the tourism product creation to travel on foot (hiking);
- Support the creation of tourism cycling in mountains;
- Support measures for the creation of the offer for tourism in natural parks;
- Support measures for the development of winter tourism;
- Supporting the development of rafting as a tourist offer;
- Support the creation of mountaineering as tourist offer;
- Creating tourist offer of the special nature for sport: (flying with parachute gliding,
fishing as a sport, etc.);
- The creation and implementation of security standards for each natural and rural sub-
product;
- Measures to ensure and improve the quality of bids for natural and rural tourism.
8. Support for investment
- Pilot center a resting place for skiing;
- The combined measures.
Regarding the abovementioned strategies, their aim is to sustain and develop sustainable
agriculture and rural tourism, to develop necessary infrastructure as well as to widen the
supply of tourism services. Reviewing the above strategies gives us the opportunity to see the
government's approach towards the development of these two sectors parallel.
Many studies have different definitions of referring to tourism activity taking place in rural
areas; some of these definitions qualify as agro-tourism, soft tourism, alternative tourism,

Nagy, H., Káposzta, J., Meta, B.
194
farm tourism, etc. But in several countries these definitions have different meanings. The term
rural tourism is adopted by the European Union, and refers to all tourism activities that take
place in a rural area (Hall and Page, 2002).
Another definition of rural tourism can be as an experience in a given country or area with
a variety of attractions in agricultural areas in which developed specific activities which are
not developed in urban areas. Involved in wide space is an essential feature of this type of
tourism, where development is at low levels compared to urban areas. In this way, visitors can
experience the agricultural or natural environments directly. To create a clearer idea of rural
tourism should be characterized by (Lane, 1994):
- Should be taken place in rural areas;
- Rural should be working – to have space, to have contact with nature, to have
respected traditions and habits, enterprises should be small-scale which is also
characteristic of rural areas;
- To be in rural level – as seen by the place where they live also the characteristic of
style buildings;
- Traditional character that prevails, farming organically from families that reside there.
Rural tourism is interpreted in various ways by authors in different countries. For example
in Italy, it covers all activities related to the countryside either it is a weekend spent in a hotel
for 100 people or walking on a wine route. In the Netherlands, village tourism is rather a
holiday in a camping next to a farm, in which the most popular activities are going on
excursions, cycling and horse-riding (Turner, 1993). In Greece, e.g. the major service
provided in rural tourism is „bed and breakfast”, i.e. accommodation in traditionally furnished
rooms and breakfast made from home-made traditional products. Additional services might be
offered by restaurants; other cultural and recreational programs may also be available. In
Finland, village tourism is rather the rent of a holiday home, usually without catering (Rátz &
Puczkó, 1998). In Hungary, there is no generally accepted definition for village tourism. It
covers activities from the simple village accommodation to a complex product with multiple
elements.
The definition by EURTER French Institute is broadly accepted and applied: rural tourism
is defined by the valorisation through tourism of agrarian spaces, natural resources, cultural
heritage, rural housing, local popular traditions and products through specially labelled
products that reflect the regional identities and cover the needs of the consumer for
accommodation, gastronomy, leisure activities, animation, and other services, with the

Nagy, H., Káposzta, J., Meta, B.
195
objective of a local sustainable development and an adequate answer to the needs of leisure of
the modern society within a new social solidarity between city and countryside.
If we look at it as a whole, rural tourism is considered to be a sustainable, multi-functional
activity based on local resources and related traditional agricultural, cultural and natural
resources (OECD, 1994; EC, 2000; UNWTO, 2002). It is noteworthy that tourism is in many
cases an additional activity that provides significant support to the traditional rural economy,
made up primarily of agriculture, forestry, crafts and other activities (Moric, 2013).
New forms of tourism, such as rural tourism, with all its types and varieties, require many
micro and small-scale businesses, family-owned, dispersed and located in rural areas. In this
way the economic effects of tourism rest and spread inside the local community, the
multiplier is increased, and leakages of tourism income are decreased compared to other types
of tourism destinations. Rural tourism obviously generates new employment opportunities and
helps to sustain the existing business and creates the new ones. Hence, the key role of rural
tourism in rural development may be seen in diversification of economic activities and
income in rural regions. Apart from this, protection and preservation of cultural heritage in
rural areas, better opportunities for women and disabled people, protection of the environment
and biodiversity, etc. are very important (Moric, 2013).
Based on the abovementioned it can be stated that rural tourism is related to rural areas,
mainly dominated by agricultural activity that are usually considered underdeveloped regions
(Bujdosó, Dávid, Wéber, and Tenk, 2015). Albania has various attractions in rural areas,
which give to visitors and tourists different emotions and feelings. Since the territory of the
country is unique, tourists and visitors can find there a mix of attractions from the high
mountains at 2764 m (Korab’s mountain) to the sea level, beautiful mountains, hills, rivers,
lakes, waterfalls, canyons, and more and more natural attractions.
Therefore, exploring the potentials of rural tourism in countries with rich natural and
cultural heritage and with unfavourable economic and social conditions is really important
and inevitable in sustainable and long-term economic development.
OBJECTIVES AND METHODS
Our aim was to explore the current situation of rural tourism in Albania and to discover the
challenges and the possibilities. To achieve the purposes of this study we used primary and
secondary data. As for primary research, two interviews have been conducted for two case

Nagy, H., Káposzta, J., Meta, B.
196
studies. One case study is about "Uka" farm, which is located about 10 kms away from Tirana
in the central area. The target of the other case study was "Farma Sotira" located in the
country's Southeast zone. Both businesses are considered successful in rural tourism, though
they have different farm size. Uka farm operates successfully only on 2 hectares of land,
while Farma Sotira is a mixed farm that offers various services in the field the rural tourism
and operates in a one land area of more than 10 hectares. They prove that success is not in
direct relation with farm size in rural tourism.
In addition to the interviews, information has been received from a questionnaire survey,
containing 21 questions, sent to 25 businesses operating in the field of rural tourism. This has
been done to get information about the entities operating in this field, in order to obtain
information about the problems that they face every day, to see whether they offer services in
competent professional way, if they have the proper training regarding rural tourism, if they
operate based on tourism, agriculture and rural policy of the country. The questionnaires were
completed anonymously by the businessmen, which were selected in different areas of the
country (in the Northern, Central and in the Southern part) to get an overall information
throughout the country. The questionnaires were completed in February-March 2017, while
interviews and visits to the two farms operating in the field of rural tourism were done in
August 2016. Secondary data was obtained from the Institute of Statistics of Republic of
Albania, Ministry of Agriculture and Ministry of Tourism to support the results obtained from
interviews and questionnaires. In this paper we intended to primarily focus on the results and
conclusions of the interviews not detailing with the secondary and questionnaire data much.
However, in order to see the increasingly important role of tourism in Albania, some national
statistics need to be shown, though statistics about rural tourism are not available. That is
why it was necessary to use primary data for rural tourism. As it is seen on Fig. 2., there has
been a sharp increase in the number of foreign citizens over the last 15 years from 317.000 to
4.131.000.

Nagy, H., Káposzta, J., Meta, B.
197
Figure 2 Arrivals of foreign citizens to Albania, 2000-2015
Source: http://www.instat.gov.al/en/Home.aspx
If we look at the numbers regarding the arrivals to the country and the data about the
arrivals in hotels (Fig. 3), we can see that only approx. 10% of the total arrivals stayed in
hotels in 2015, while the rate in 2000 was nearly 50%. It means that alternative
accommodations, e.g. rural accommodations have been getting more and more importance.
Figure 3 Arrivals of foreigners and Albanians in hotels (in thousand), 2000-2015
Source: http://www.instat.gov.al/en/Home.aspx
It is really interesting to compare the data of Fig. 3 to Fig. 4, because it shows the number
of beds in hotels increasing over the years. While in 2000 there were nearly 6,000 hotels bed,
in 2015 there were almost 16,000. However, this figure can be considered still insufficient to
receive the total number of tourists.
0
500 000
1 000 000
1 500 000
2 000 000
2 500 000
3 000 000
3 500 000
4 000 000
4 500 000
20
00
20
01
20
02
20
03
20
04
20
05
20
06
20
07
20
08
20
09
20
10
20
11
20
12
20
13
20
14
20
15
Europe Total
050
100150200250300350400450
2000
2001
2002
2003
2004
2005
2006
2007
2008
2009
2010
2011
2012
2013
2014
2015
Foreigners Albanians

Nagy, H., Káposzta, J., Meta, B.
198
Figure 4 Number of hotel beds in Albania, 2000-2015
Source: http://www.instat.gov.al/en/Home.aspx
RESULTS AND DISCUSSION
Introduction of “Uka Farm”
“Uka Farm” started to be built in 1996. It is considered a multicultural farm; the farm lies on
an area of about two hectares of land and is located in the village of Laknas in Tirana district
(Fig. 5).
Figure 5 Uka Farm
Source: Bledar Meta’s own photo, 2016.
The owner did not take other land by rent, everything is operated on two hectares. There are
about 30-40 different cultures - e.g. apples, peaches, pears, plums, cherries, citrus and olive
groves etc. even kiwi. The farm also produces many different vegetables. The farm has been
created because of scientific purpose and research and from the passion of the owner, who is a
professor at the Agricultural University of Tirana, to offer to the students valuable practical
02 0004 0006 0008 000
10 00012 00014 00016 00018 00020 000
2000
2001
2002
2003
2004
2005
2006
2007
2008
2009
2010
2011
2012
2013
2014
2015

Nagy, H., Káposzta, J., Meta, B.
199
content in their studies and a place where students can work on their thesis in areas related to
agriculture and arboriculture. Somehow this farm is a natural vegetation laboratory and an
ecological habitat where different birds and various insects can live. Dr. Professor Rexhep
Uka has started to build this farm for his own study in entomology and plant protection, with
the main goal to attract as many as insects as possible to the farm, to study biological war
between insects and produce organic products in natural growth, without using pesticides.
From the standpoint of this farm, the real business operation started a few years later, when
a winery was built at the end of the farm. The good performance of the winery (from both
qualitative and financial point of view) has motivated the owner to build also a restaurant on
the farm. Thus, by the construction of winery and the restaurant, the farm has become
complete and it was a pretty lucrative business. The scientific purpose of the farm was very
interesting, however, farms with only this purpose are not preferred by many visitors and
tourists. The few tourists who visited the farm arrived with scientific purpose but it was not
enough to derive sufficient profits. The farm at this time was financed by salaries of members
of the family. In the beginning, the wine production has been export-oriented and also sold on
the domestic market. But when one of the sons of the owner Flori, completed his master
studies in Italy for Oenology, together they decided to build the restaurant in 2014, where they
can sell wine and other products produced on the farm. In this way they will earn more and
will have the possibility to offer not only relaxing natural environment on the farm, but also
organic products produced on the farm, cooked and served in professional way to visitors and
tourists. Visitors and tourists visiting Uka Farm are various, both foreign and domestic
tourists and guests. Uka farm has been also booked for various family celebrations, business
lunches and dinners, birthdays etc. The environment created on the farm is very relaxing for
all age groups from all children to the elderly. Visitors and domestic tourists are mainly from
Tirana and surrounding areas because it is in a short distance, about 10 kms from Tirana, but
they also come from other parts of Albania. Many tourist agencies orient foreign tourists to
visit Uka Farm to enjoy traditional Albanian dishes, wonderful and quality wine, which are
produced from organic products grown on the farm and in the surrounding area. During
weekends the farm is mainly frequented by families who come with their children to rest, to
enjoy cthe cuisine and to relax in the green nature. Products that are served are mainly those
which are produced on the farm because the farm operates with the concept "from farm to
table", but it is unable to produce all its own products.
The farm cooperates with local farmers and buy their products that are cooked and served
in the farm restaurant. Most of these products also grown organically. In this way the farm
serves as a selling point for products from the local farmers, helping them earn some extra

Nagy, H., Káposzta, J., Meta, B.
200
income without spending more money on their transport. Regarding financing the costs of the
farm, it has been rather private funding in cooperation with banks by taking loans from them,
but also with some support from the government. Flori, the son, mentioned that the farm has
benefited from government funds only to inconsiderable extent. He also expressed concern
about bureaucratic access to benefit from government subsidies, so he believes that it is worth
to obtain loans from banks than lose a lot of time and energy to benefit from small amount
subsidies. Flori also stated that if the government eased the bureaucracies and shortened the
time spent to apply for subsidies, it would indeed be a very big help for such businesses. It
would be a strong motivation to work more, to expand further their farm and to make things
of better quality in the future. On the farm including the restaurant 20 people were employed
full-time in different professions according to business needs until 2016.
Regarding the goals for the future, the owners do not wish to change many things because
they want to remain loyal to organic production on the farm with zero use of pesticides. The
only thing they can make compromise in it is to increase further the quality of organic
products through scientific research on the farm. They plan to invest more in the direction of
tourism, building small wooden villas which can also offer accommodation for tourists and
different visitors. Dr. Professor Rexhep Uka and his sons plan to build a private agricultural
university next to the farm where the farm will serve as a laboratory and scientific research
center. Flori said that this plan could be realized if they were able to find sufficient financial
support. It shows that if the government supports them in this direction, which would be a
very big support for them, they would build the first private Agricultural University in
Albania. They have the experience in this regard, they have energy, passion and very strong
motivation, things that will direct them to a secure success.
Introduction of “Farma Sotira”
Farma Sotira is located between Erseka and Leskovik towns in a valley called Sotire, which
extends beneath the mountains of Omit, Pogonica and Çuka. Farma Sotira was built in 1998.
Its owner, Elton Hida, immigrated to Greece before 1998. When he returned, he decided to
create a fishpond to grow trout fish because in that area there is clean water and abundant. To
build such a business he signed a contract with the local government to take the area for rent
because the area was owned by the state. Then he started to work on the systematization of
the area and surrounding waters because the conditions were not suitable to start building this
business; it needed prior adjustment. After the area disposition, he began the construction of
rainbow trout fishponds because these waters were suitable for this kind of trout due to their

Nagy, H., Káposzta, J., Meta, B.
201
cold temperature. So he ranked 4-5 among the first businesses in growing trout in Albania. He
indicated that this kind of business at that time was very profitable. He got large profit from it
because the competition was very small compared with the ever-growing demand of trout
meat.
Figure 6 Farma Sotira
Source: Bledar Meta’s own photo, 2016.
After some time, the area began to be recognized by visitors as the fish farm. Main buyers
of trout were from the city of Korca, which is located 80 kms from the farm and the
surrounding areas. Clients who came to buy and eat cooked fish recommended the owner to
build rooms to accommodate them and other visitors, since the area was in the mountains and
they could stay there all the day to relax, enjoy the cooked trout in the traditional way. So the
owner started to build several small wooden houses. Elton, the owner of the farm, showed that
he was always a step back in comparison with the number of tourists and visitors in meeting
their requirements.
Stunning nature and environment, very calm and safe place, brought to the farm even more
tourists and visitors from different foreign countries of the world, but mainly German and
French tourists. Foreign tourists began arriving even though they had not yet offered
accommodation so they use their recreational vehicle to sleep on the farm. It shows that
tourists are very surprised with the quiet environment, stunning views, and traditional food
which are cooked in a tradition way - mainly from organic farm products. Noting that the
number of domestic and foreign tourists has increased more and more, the owner decided to
invest more to make that area reflecting the appearance of a more attractive tourist
destination.
Until August 2016, there were about 300 sheep, 130 cows of different breeds that suit
mountainous terrain and about 80-90 calves. All cows left in free-grazing in the natural
environment of the farm and no additional food is given. Calves usually go on sale or
slaughter for meat in different areas of the country and also for tourists meat served. Farma

Nagy, H., Káposzta, J., Meta, B.
202
Sotira is a mixed farm, because cows, bred goats, rabbits, pigs, chickens, ducks & gooses,
bees, horses can be found there. There are several cultivated vegetables on the farm such as
tomatoes, peppers, beans, cabbage, garlic, eggplants, okra, potatoes, and many other
vegetables that fit the climate zone. Fruits like grapes which are used to make wine, rakia,
juice, jam, etc., as well as other fruits like apples, pears, plums, walnuts, chestnuts, cherry etc.
are also produced. In addition, there are also wild fruits such as nuts, wild strawberries, wild
blackberries, cornelian, wild blueberries etc. All of these cooked in the traditional way to be
served to tourists.
Farma Sotira has 5 wood cabins for families and 5 small wood cabins for single person or
couple. Also on the farm is the restaurant with a capacity about 30-40 people at the same time,
but in its exterior environment can be served on wooden tables with wooden umbrellas that
offer a convenience and a comfort in nature. Farma Sotira also offers open pools during the
summer period, entertainment places for children, different games in nature, such as
volleyball, soccer etc. Elton indicates that when tourists come they are very surprised by the
nature that offer surrounding mountains and ask them in order to do guides in the mountains
and doing hiking, others prefer to take their bike and cycling along the motorway that
connects town of Erseka with Leskovik and enjoying the wonderful nature that offers areas
along the way (Fig. 7). To entertain tourist, farm cooperates with folklore groups of the area,
offering music, song and traditional dance of the region where it is located. The special
traditional dishes, cooked in the traditional way are another added value of Farma Sotira,
because the feedback they got from tourists is they are very satisfied so they wish to return to
visit the farm again. If the tourists want to catch the fish in fishponds by themselves which
they want to consume, it is also possible. Camping, hiking, swimming, horse riding, fishing,
and barbecue, cycling, and hunting are also offered on the farm and its surroundings.
Figure 7 The location of Farma Sotira
Source: https://www.google.hu/maps

Nagy, H., Káposzta, J., Meta, B.
203
The farm lies on a territory of about 10 hectares but the surrounding areas and mountains
are rented from the state or the owners and used by the owner of the farm. The farm also
offers participation in different processing works on the farm for tourists who are interested
and can get discount from accommodation cost in return. The owner of the farm said that the
restaurant and tourism activities of the farm contribute a lot to the farm income and he thinks
that step by step they wish to invest more in this direction.
The farm has been financed mostly from personal finances in combination with bank loans.
Regarding government support, he said that they have not had adequate support and benefited
little from such support. The many bureaucracies and criteria that are set by the government to
benefit from various grants or subsidies shall make him almost impossible to be the
beneficiary of those funds. According to the owner, if the government would support him
through various grants and subsidies, it would be really good support and strong motivation
for him and his family to increase the capacity and quality of services and products that the
farm offers.
CONCLUSION
Albania is a small country but has variety of resources. The presence of these resources
makes the country to have great potential for its further development. Thus tourism sector
provides increasingly important contribution to the country's economy. Statistics clearly show
that the number of tourists sharply increased over the last 15 years. As Albania has a variety
of natural resources ranging from the Alps in the North to the Ionian Sea coast in the South of
the country, it has a great potential to develop tourism further focusing on rural tourism.
Based on the interviews, based on the analysis of the answers, obtained from
questionnaires and statistical data we should state that the current situation of rural tourism is
quite weak, and in its infancy. Entities that currently offer rural tourism face many problems
of different natures. The rural tourism development and its support by the government will
give a very positive effect on the development of rural areas but also beyond. The rural
tourism development provides important contribution to the creation of new jobs, keeping
jobs for the population and increases their interest to stay in that region and creates new
business opportunities. Rural tourism also provides more opportunities for youth in rural areas
and motivates them to stay and not leave the area to find the best opportunity of living in
urban areas or abroad.
The community diversification, revitalization of social and cultural life in rural areas, and
the revival of community pride, are also positively affected by the rural tourism development.

Nagy, H., Káposzta, J., Meta, B.
204
So revitalization of life in general in rural areas is another positive effect that comes as a
result of developing rural tourism. While also maintaining, culture and heritage in rural areas,
traditional art and craft works. This means the creation of art secure market to sell local
products without spending much money on transportation costs, maintenance and their
preservation, but also increase the value of agricultural products, avoiding traders and giving
farmers a source of significant farm income. Preservation and improvement of environment,
preservation of natural landscapes and historical sites will be additional importan benefits of
the rural tourism development. Community involvement in rural tourism makes it a successful
sector, giving a positive impact on product development to grow up infrastructure, and
activities. The success of rural tourism lies in the regions‘ quality growth, their ethics,
growing partnership, establishment of centers for visitors and cultural heritage, increase
funding in rural areas which up to this day is at low levels. All of the above may result in
higher economic benefits in rural areas but not only. Increased contribution in GDP of tourism
in general and rural tourism in particular, more employment, more prosperity in rural areas,
contribution to the development of agriculture are all expected outcomes.
During the analysis of the responses from questionnaires and interviews, we noticed
several problems that entities operating in the rural tourism sector face. The poor road
infrastructure in rural areas makes the development of agriculture and rural tourism stumble.
Poor financing from banks to agriculture as well as the strit requirements mean other
challenges for agriculture and rural tourism. Information about state strategies for agriculture
and tourism, laws and rules that are in effect for these sectors do not really have strong
relation with the practice in rural areas. This has led to a private initiative that deals with the
development of rural tourism, sometimes not complying with the national strategies and
sometimes not supported by the government. Education and training in the rural tourism
sector - to be familiar with the best practices of this sector – is also at very low levels, with the
exception of some subjects which are trained by international institutions that operate some
small scale projects in this sector. Another problem that was mentioned by both famers in the
interview is the complicated procedure to benefit from state subsidies or grants, the long time
it takes to receive these funds, and the numerous bureaucracies that exist for fund generation
to benefit in question.
On the basis of the analysis conducted we can list up some solutions for the existing
problems. First, the support of sustainable agriculture and diversification could motivate
farmers to expand their activites and link the agricultural production with rural tourism (as it
was proven by two different farms in the interviewing). Second, the two sectors must be

Nagy, H., Káposzta, J., Meta, B.
205
supported by different state funds – not to increase production but to achieve integrated
development in the rural areas based on the rich natural resources. This would promote
quality products and services in both sectors and will make them more sustainable. The
simplification of the application process is also inevitable. Third, the extension service and
relevant institutions should be more active, in terms of giving information related to rural
tourism and training. This would bring an awareness of farmers and the rural population about
economic importance and opportunities that come from the rural tourism development. Based
on the results of the survey, farmers would be really interested in such trainings, so the
demand for getting more knowledge is really high. It would be recommended to set up
training centers for rural tourism with low cost or relevant government institutions could
provide such trainings directly on the field. This would help to educate farmers and the rural
population better understanding the importance of this sector and stimulate them to develop it.
Fourth, investing in road infrastructure in rural areas would make them easily accessible by
visitors and tourists that would boost rural tourism development.
SUMMARY
In general terms, the national strategies detailed in the paper are important but not enough. The government and its institutions should play more active role to support and promote the development of rural tourism hand in hand with agriculture. If the various and valuable conditions are used properly, the sectors would contribute to the development of rural areas, to the economy as a whole, to the reduction of unemployment in rural areas, to curbing immigration. They would stop the depopulation of rural areas, increase the standard of living in rural areas, and have impact on the development of agriculture too. In such a way it could become simultaneously an additional source of farm income for those who would offer this kind of tourism, but also could create or boost local market for local traditional and organic products (as it was shown in the case studies). In addition to economic benefits, rural tourism also contribute to the development of society by developing human resource as well as the preservation of cultural values and promote environment-friendly approaches.
REFERENCES
Bujdosó, Z., Dávid, L., Wéber Z., & Tenk, A. (2015). Utilization of Geoheritage in Tourism Development, Procedia – Social and behavioral sciences, Vol. 188
European Commission (2000). Towards quality rural tourism: Integrated Quality Management (IQM) of Rural Tourist Destinations, Brussels: Enterprise Directorate-General Tourism Unit Hall, C. M. & Page, S.J. (2002). The geography of tourism and recreation: environment, place and space, London Routledge
Lane, B. (1994). What is rural tourism?, Journal of sustainable tourism, Volume 2, No.7 Institute of Statistics of the Republic of Albania. Retrieved from
http://www.instat.gov.al/en/Home.aspx Map of Albania. Retrieved from https://www.google.hu/maps OECD (1994) Tourism Strategies and Rural Development, General Distribution, OECD / GD
(94) 49, 013927, Paris

Nagy, H., Káposzta, J., Meta, B.
206
Moric, I. (2013). The Role and Challenges of Rural Tourism Development in Transition Countries: Montenegro Experiences, TURIZAM | Volume 17, Issue 2, 84-95
Rátz, T., & Puczkó, L. (1998): Rural Tourism and Sustainable Development in Hungary. Paper presented in "Rural Tourism Management: Sustainable Options" Conference. September 9-12, 1998. The Scottish Agricultural College (SAC), Ayr, Scotland.
Regions of Albania. Retrieved from https://en.wikivoyage.org/wiki/Albania#/media/ File:Albania_Regions_map.png
Republic of Albania, Council of Ministers (2013). National Strategy for Development and Integration, Retrieved from https://shtetiweb.org/wp-content/uploads/2014/06/NSDI_2014-2020_version_JUne-2013.pdf
Smith, V., & Eadington, W. (1992). Tourism alternatives, potentials and problems in the development of tourism, Wiley, Chichester
Turner, G. (1993): Tourism and the environment: the role of the seaside, Insights: A 125-31 UNWTO (2004). Rural Tourism in Europe: Experiences, Development and Perspectives,
Madrid: UNWTO World Bank (2002). “Rural Development Strategy for Albania”, World Bank, November
2002,78 http://siteresources.worldbank.org/INTALBANIA/Resources/AlbaniaRuralStrategyAlbanian.pdf.
World Travel & Tourism Council (2017). Travel & Tourism Economic Impact 2017 Albania, Retrieved from https://www.wttc.org/-/media/files/reports/economic-impact-research/countries-2017/albania2017.pdf

DETUROPE – THE CENTRAL EUROPEAN JOURNAL OF REGIONAL DEVELOPMENT AND TOURISM Vol. 9 Issue 3 2017 ISSN 1821-2506
207
Professional paper
IMMIGRATION AND COMPETITIVENESS –
SOME METHODOLOGICAL QUESTIONS
Tünde PATAYa
a PhD-candidate, Szechenyi Istvan University, Doctoral School of Regional and Economic Sciences, Györ, Egyetem ter 1. Hungary – [email protected]
Cite this article: Patay, T. (2017). Immigration and Competitiveness – Some Methodological Questions. Deturope 9(3):207-220.
Abstract
Immigrants can contribute significantly to the economic and social development of regions or urban areas. Some key figures on migration are thus traditionally used in studies on local development. Beyond the usual description of migratory movements, two research fields are often in the centre of controversies, namely the labour market and the inclusion of immigrants. Comparing the European regions, the phases of urban development as well as the relevant internal and external factors present a mixed picture in Europe. At the same time, the dynamics of migratory movements and the reactions of national and subnational policies also vary. The Member States of the European Union aim to harmonise their definitions and data on migration issues, however, the daily practice leads us to the questions of reliability and comparability of migration statistics; and the interdisciplinary character of migration research offers the use of variable research methods. The aim of this study, as a part of a presentation at a conference on urban development, is to describe some key methodological issues of migration research exploring the typical questions. The first part of the paper calls attention to the importance of data quality, processing and interpretation, describing the research methods mainly used in studies on immigration. The second part summarizes the significance of immigration in regional competitiveness, pointing out the possible “stumbling stones” in the relevant migration studies. Some of these factors, the areas that are mainly in the centre of scientific and political debates, are discussed in this paper, namely the labour market challenges and issues relating to the different aspects of segregation. Keywords: data quality, development, immigration, labour market, methodology
INTRODUCTION
Migration is one of the main factors that shape and accelerate the development of nations or
urban areas, although the dynamics and combined effects of migratory movements, national
policies and the roles of local authorities present a mixed picture in Europe.
Immigrants bring experiences, knowledge, or their pure workforce with, besides their
demographical, cultural characteristics or international connections. In contrary, migratory
movements have their negative effects, too: labour market conflicts, expenditure of the
welfare system, segregation and deprivation. According to the statistics of the Eurostat 3.8
million people immigrated in 2014 to the EU-28 Member States: 1.3 million third-country-
nationals, 1.6 million people with citizenship of another EU-Member State and 870 thousand
returning migrants. Since the 1980s European states have been facing the challenge, how to

Patay, T.
208
include immigrants in on different stages. It is because, like Fassmann and Münz in their book
also present (1996), the illusion of temporary migration has disappeared, guest workers stayed
in their new homeland. New migratory groups have been arriving: new work force,
entrepreneurs, family members, students, refugees and illegal migrants as well. The
framework conditions of the national migration and integration policies and tasks are based on
the relevant policies and goals of the European Union, and each European state has been
developing a national strategy. Beyond these levels, most of the West-European regions and
cities have already recognised the impacts of the migratory movements and the importance of
perception and reaction.
The current migration policies that exist in Europe are, despite of the European goals, often
based on specific or non-harmonised definitions. Migration research, just like other
disciplines, operates thus with different methods. Methods and methodology are often in
focus of controversies, from the basic questions like harmonised definitions of phenomena,
data sampling, data processing or evaluation (Longhi et al., 2005; Van der Mensbrugghe,
Roland-Holst, 2009 and Abel, Sander, 2014).
Beyond migration statistics, the measurement and interpretation of issues relating to
migration are generally built up on widely used concepts. These old concepts were, however,
developed along individual national phenomena at their time, without taking into account the
results of other studies (Haas, 2007). Furthermore, this interdisciplinary character of
migration research requires and offers a wide range of research methods. Studies on migration
and competitiveness emphasize the importance of migration and the mobility of workforce.
Thus, as Papdemitriou (2009) also points out, in case of analysing the performance of the
labour market at national or regional level, the specific migratory features of the labour force
– beyond the usual sets – pay an important role. Considering immigrants as labour force, it is
essential to realise the variety of factors while analysing the labour market (Maruszewska,
Przybylska, 2009; Flügel 2010; or Georgi, 2014). Besides labour market issues, integration of
immigrants and segregation are also often discussed, depending on the goals and interest of
the stakeholders. Furthermore, I agree with Angenedt (2000) that social issues and the
integration of immigrants play an important role in the local competitiveness. Therefore the
exploration of issues relating to segregation and the interpretation of integration should also
be approached from different aspects. Immigration, its consequences and the interference
between migration and regional development will continue to be an important part of
discussions and decisions. Beyond the legislative background, which is still not able to
provide harmonized rules and instructions, the administrative practices of executive

Patay, T.
209
authorities also vary even at regional or local level, as regards implementation of policies or
adding reliable values to future strategies.
Beside the political aspects, research projects on immigration and integration of
newcomers also require comparable data, harmonized terms and well-structured findings. The
topic methodology can thus refer to several questions, some of them are particularly important
both from a practical as well as from a scientific viewpoint. The term “method” refers to
techniques for investigating phenomena, acquiring, testing or modifying hypotheses, whilst
the term “methodology” can be described as a research strategy. At the same time, after
Berriane and de Haas, the methodological way chosen for a migration research has basic
consequences for the choice of methods (2015).
RESULTS
Data Quality and Data Evaluation
Figures on migratory movements, percentages on the foreign population or labour market
indices are suitable to characterise Europe and the European states in general, regarding
migration.
Beyond presenting the usual data on migration (Tab. 1), it is also essential to recognise the
various impact factors and ways of interpretation behind the first results and conclusions.
Table 1 Key Data on Selected Countries (2015)
Country
Non-nationals in % of the population
EU citizens (1.000)
3. nationals (1.000)
Luxembourg 43,2 191 30
Austria 12,3 352 555
Spain 12,3 2.329 3.325
Belgium 10,6 749 414
Ireland 9,2 292 69
Germany 9,1 2.628 4.571
Italy 8,5 1.335 3.235
United Kingdom 8,2 2.061 2.425
Sweden 6,7 270 352
Hungary 2,1 127 82
Source: Eurostat – own calculation

Patay, T.
210
Availability, reliability and comparability are the main criteria that are often criticised here,
similar to other statistical topics. Regarding availability and quality, an international
consistency cannot be easy to implement even if definitions and key concepts are already
harmonised and a number of recommendations have been introduced. The attitude, discipline
and practice of migration offices vary, even within a sub-national unit, as for the
implementation of the migration policy or reporting towards legislative bodies. Further
challenge researchers meet, that there is no common data system, which can be useful both for
the sending and the host country to reveal exact figures about the number of people affected.
As Sander (2014) also calls attention, the existing data on global migration flows are not yet
really complete and comparable – and the Hungarian Statistical Office intensively agrees with
this statement as well (KSH, 2012).
As practice has shown, migration offices and thus national databanks have only
information on the intended duration of stay which is, in addition, based on the declaration of
immigrants and the given legal options. Thus, the identification and evaluation of migratory
flows depends, beyond the European harmonising endeavour, on the rules and administrative
practices of a country. As Raymer and Willekens also emphasize (2009), some variables are,
even if essential, maybe hard to define and collect in some countries, whilst other variables,
having only little impact, are available. In some cases it is impossible to characterise the
foreign population of a country, however, the statistical practice of the European countries
vary. In Austria there can be accessed data on religion (s. address registration system of
Austria), while e. g. in the United Kingdom race and ethnicity are daily used in evaluations as
well. The ground variables are available in the European countries due to the administrative
data collection and data processing. Moreover, we should rely on other data sources
(comparing them), depending on their accessibility and quality, such as censuses, statistical
surveys, surveys of local authorities and of research projects.
Definitions and data interpretation
According to mainstream studies but also to the European legal rules migration is a
phenomenon in which persons change their place of living – it means the place where these
persons spend most daily periods of rest. With other words, the place of usual residence is in
the focus, regardless of temporary absences, as it is defined in a EU-regulation of the EU
Commission on international migration (2007).
We talk thus about the mobility of the labour force or about commuting as well, within the
country or crossing the border. If a person changes the country of her or his usual residence, it
is about international migration. Studies mainly take into account the whole immigrant
population without distinguishing the data on temporary and long-term-migration or the

Patay, T.
211
purpose of stay. In case of long-term migration, legal consequences appear usually after a 12-
month-period, e.g. legal equality issues, settlement rights, welfare themes, labour market
problems. Long-term-migration is defined, as stated in a recommendation of the UN (1998),
by a period of at least 12 month and with a criterion that the person effectively changes his or
her usual residence. The Eurostat also uses this 12-month-period defining the meaning of
immigration on the base of the regulation of the EU Commission.
Statistics on migration consider besides newcomers as immigrants who are not surely
willing to stay longer than 12 month but at least for 3 months (Kováts, 2014). As for the
administrative practices, after comparing the legal definitions (see also Austria`s Aliens` Law
package), authorities and national statistics also consider new applicants as immigrants if they
intend to stay longer than 3 months – this 3-month-period is relevant in the legal rules both
for EU-citizens and 3rd country nationals. In the international statistical practice there are two
indicators preferably used by young researchers and politicians, namely the foreign-born
population (even maybe already with citizenship) and the foreign population (and maybe born
in the host country). As Tab. 2 shows, we should, however, distinguish, besides directions and
duration of migration, the legal status of immigrants and other migratory features of the
population.
Table 2 The main definitions of migration management in Europe
Dimension Terms
Direction of movements
Emigration Immigration Circular migration / Commuting Transmigration
Duration of migration Temporary stay Long-term residence
Nationality
Nationals Nationals of a Member State 3rd country nationals Persons with multiple nationality Stateless
Migrant
Nationals Foreign-born population Persons with migration background 1st and 2nd generation migrants
Legal status
Entry with or w/o visa Commuters Registration for EEC/CH-nationals Permits for 3rd country nationals Issues of asylum Illegal immigrants Naturalised migrants
Source: Aliens´Law Package of Austria - own illustration

Patay, T.
212
The statistical practice of the European countries varies. In some cases it is impossible to
characterise the foreign population of a country in details. Religion and physical
characteristics are, however, only available in countries where accepted in the society (e.g.
physical variables in the UK or the Netherlands) or legally recommended (e.g. data on
religion in Austria or Germany).
Regarding studies with migratory aspects relating to regional development, it is essential to
record further characteristics of immigrants when analysing population groups with a foreign
background. Thus studies should distinguish in particular the followings: country of birth,
current citizenship and citizenship at birth, country of previous residence, reason and aim of
migration, ethnic affiliation and attachment to a group (and these data on the parents).
Accordingly, these features shape the national and spatial pattern of the population with
migratory background, beyond stock and flow indices. We have thus various ways to interpret
the statistical data we have on the population of a country or a region relating to immigration.
Due to its interdisciplinary character surrounded with multidimensional aspects, studies on
migration should be conducted on the base of diverse forms of data, e.g. our own primary
data, contents of documents, permanently changing concepts, legal precondition, case studies
etc. beyond national statistics. I agree with Bose (2012) who points out, that figures on
migration are useful for researches, who tend to rely on numbers alone, but this perspective
only offers a limited view of the complexities of migratory phenomenon.
An additional viewpoint regarding data interpretation relates to the environment of our
evaluation including the experiences and the historical background. These environmental
factors of interpretation are internal and external variables – similar to the chapters of
integrated urban development strategies, or like it is regulated by a government decree
(314/2012 Hungarian Government Decree).
Reflections on Mixed Methods
In migration research qualitative methods have a particular role, especially while these
instruments also have multidisciplinary roots and often combined with quantitative issues.
This methodological approach is widely used in studies relating to demographic changes and
economic issues migration brings with (Fritzgerald, 2006).
Migratory phenomena do not only have demographic or economic dimensions and require
therefore more than an oversimplified explanation of a qualitative and quantitative mixture.
Migration has geographical and political aspects as well, beyond social and cultural issues.
This interdisciplinary character requires a wide range of research methods and a reliable

Patay, T.
213
combination of these. Here I have to mention the study of Tashakkori and Cresswell (2007)
on mixed methods, pointing out the importance of combined solutions that integrate both
qualitative and quantitative approaches in one study, even if projects on migration are often
based on quantitative data collection and analysis. Later, Creswell (2009) distinguishes 4
elements that shape the character of a study. These are timing, weighting, mixing and
theorising. Using these elements he identifies several types of research methods. Two
combinations of them are particularly important, in my opinion, in studies on migration. The
sequential explanatory type has a greater weight on quantitative research complemented with
a qualitative follow-up analysis. The second one, the sequential exploratory method, consists
of a range of qualitative results finding new quantitative ways to test them.
Derived from this, already in simple, exploring studies but also in advancing researches
there is a need for a more diversified approach, a logical combination of instruments. This
flexible and differentiated point of view should be used as precondition for studies, from data
collecting to ethnographic work – so summarizes Portes as well (2003, p. 889). Mixed
approaches, and a good combination of instruments are in summary more favourable and have
their roles in migration research.
Analysing the interaction between immigration and competitiveness
Concerning the definitions and impact factors of regional or national competitiveness, there is
abundant literature dealing with this topic, offering different explanations (Lengyel, 2003).
Migrants make significant contributions to competitiveness at national or local level: with
their workforce, experiences and knowledge, but with their cultural characteristics or
international connections as well. On the other side, mobility brings negative effects with:
expenditure of the welfare system, conflicts in the society, discrepancies regarding the values
and goals of the host community, and, of course, deprivation. Literature and empirical
experiences on the field of migration have not yet given us complex answers related to
migratory flows and their impacts on regional competitiveness. The results, as Ortega and Peri
(2009) also emphasize, are often contradictory.
Beyond the variety of impacts we can observe different national and regional
characteristics regarding migratory movements as well as in the field of migration
management, which can also be discovered in the research projects in these countries.
Hoffmeyer-Zlotnik (2007) also discusses in his presentation that definitions used in survey
researches depend on the political contexts and national concepts. If we compare the
European policies, some European states have restrictive migration policies. These countries

Patay, T.
214
require an intensive assimilative attitude from immigrants, the common values and the own
culture have here political priority. Other nations provide easier access to residential status,
labour market and welfare services. If they assist immigration and diversity, we could outline
them with multiculturalism. If they do not provide protections against market forces, and do
not support cultural diversity, they operate rather as a laissez-faire government regarding
migration and integration.
Perceiving and understanding migratory flows and the migrants themselves, comparing the
complex and contradictory circumstances, motivations and consequences, require deliberate
research strategies. Tables and graphs, set out in average presentations on the interaction
between migration and development, showing figures in GDP and migratory percentage,
simplistically prove the hypothesis that mobility and migration are clearly accompanied by
development. It is, however, more difficult to explore and explain linkages between indicators
of regional or national development and migratory phenomenon or relevant political
instruments.
As for the interaction between migratory phenomena and urban (regional) development,
the data evaluation from only one aspect can lead us to misinterpretation or simplified
conclusion. The dimensions of interpretation regarding the migratory impacts can be
summarized in one matrix containing a number of viewpoints. Thus, analysing the impacts of
the appearance of immigrants, we should consider which area and which migratory factor we
are getting a nearer view of. Beyond the migratory areas and factors (e.g. the high qualified
labour force within the area “knowledge, qualification, skills”) we can distinguish negative
and positive effects and, further, the point of view of the stakeholders (e.g. the local
government, the civic community, entrepreneurs, research institutions or the native labour
force). Continuing this logic, the data evaluation of one highlighted factor from a combined
dimension leads us to further issues of migration such as illegality, security, fiscal effects,
social welfare issues, norms and customs or the revision the legal system.
The performance of the labour market
Studies on demographic issues emphasize the importance of migration and the mobility of
workforce. From poorer regions migrants are forced to leave their home looking for a better
life and more possibilities (Redei, 2007).
Not only migrants, but host communities and rich countries also have to shape their
politics, strategies and all the conditions for immigration and integration. Labour markets
need workers with low qualifications as well as highly qualified or specialised employees.

Patay, T.
215
Hence, in migration research, as Köllő also points out, changes in the performance of the
labour market should be interpreted under consideration of various components relating to the
foreign workforce (2015). Further, the European Economic and Social Committee (2012)
underlines that immigrants can be characterised with their flexibility, professional and life
experiences, readiness to compromise, besides their social capital or entrepreneurial skills.
Table 3 Aspects of considering migration as answer to labour market challenges
Criteria relating to environment Criteria as for the objects
Legal equality Population with migration background
Demographic variables Economically active age groups
Probability of entering the labour market Active job-seekers
Influence of 1st generation immigrants Ethnic groups (sending region or country)
Entrepreneurial environment Groups in a region / spatial concentrated groups
Equality regarding income Obtained legal status vs. purpose of stay
Career chances Economic sector
Acceptance of qualifications Level of qualification, experiences
But can we consider each immigrant as potential labour force? As the Tab. 3 shows, we have
to take different aspects into account when analysing the labour market and the positive and
negative effects of immigration. Considering immigrants as labour force, it is essential to
realise that the environment analysing the labour market has another meaning, other factors
and effects. Moreover, we should not forget about the specific variables that are important
analysing migration regarding its forces on the labour market. These are country of origin,
skills and qualifications immigrants bring with (or qualifications the host community accepts
at all), legal status and settlement purpose of immigrants, spatial concentration of immigrants,
economic sector etc.
In case of analysing the performance of the labour market of a nation or a region, we have
to consider the migratory features of the labour force beyond the usual sets such as active,
inactive, unemployed and employed persons. These migratory characteristics are e.g.
migration motivations and backgrounds, migration purposes, skills, qualifications. This is
essential, since not all the immigrants between 15 and 65 can be considered as labour force,
and, in addition, immigrants have different career possibilities. According to the Todaro-

Patay, T.
216
theory, the success or future of settlement in a new region or country depends on the vision of
the migrant and the quality of information she or he can get, with embrace of the probability
of employment (Todaro, 1969). In addition, workers without or with low qualification have
fewer chances and are often subjected to discrimination or criminalization (Koopmanns,
2008). Migrants, who arrive on the base of forced migration, have to find their new home
involuntary, surrounded with problems such as marginalisation, exclusion, and difficulties on
the labour market.
Studies point out, that experienced and highly qualified migrants, who arrive voluntary,
have more freedom of movement and other chances on the labour market. However, Delgado
Wise and Marquez call attention to the fact that these immigrants also suffer from
discrimination on the labour market, and furthermore, migration of highly qualified persons
can also be considered as forced migration, since they are motivated to leave the country in
order to fulfil higher professional and intellectual needs (2012).
Segregation and integration
The interpretation of integration can be approached from different aspects, such as legal and
political processes, socio-economic situation and socio-cultural issues (Bijl, 2008).
From a socio-economic viewpoint, the economic interests of the society and the national
and local development have an important role. This aspect relates to methodological issues
such as labour market participation, unemployment, taxation, business life etc. but we should
take into account the spatial aspect (e.g. spatial segregation) as well. From a socio-cultural
aspect, the measurement of integration deals with social relations, conflicts, networks and the
level of acceptance of the other language, customs, norms. The following list calls attention to
the main and problematic areas regarding segregation, including collection or evaluation of
relevant data:
Spatial concentration
City, space and its functions
Lack of social integration
Equal chances and rights (education, health and social welfare)
Pillarization
Income situation (cons. discrimination, equalised income, circumstances)
Fiscal effects (cons. time series / spatial evaluation, migratory characteristics)

Patay, T.
217
Issues relating to segregation of immigrants – as perception, condition or process – can be
examined from more than one angle again. The direction of research can vary. Thus it can
target in particular the urban space (spatial segregation and concentration) or changes in urban
functions; beside, issues of equality such as social and health systems, education; labour
market discrimination including the equivalent income or fiscal effects.
Beyond spatial and economic segregation, evaluating the degree of integration (or
segregation) of immigrants, we have to emphasize the importance of the different areas of
participation. Political participation, trust in public institutions, issues of identity, civic
participation etc. can be considered as contribution to their integration and thus to social
development. The Declaration of Zaragoza (2010), targeting a harmonised evaluation of
integration issues in the European countries, also contains indicators regarding participation
of immigrants. Other statistics beyond national or European statistical tables, but results of
existing studies can also assist us understanding segregation or its background. Further,
analysing and comparing political priorities or concepts on urban or regional development can
give us complementary information about segregation and the governmental reactions.
CONCLUSIONS
This study, as a part of a presentation on issues in regional and urban development, analysed
in the first part the importance of data quality and research methods used in migration
research.
Themes such as data quality, availability, comparability and interpretation of migratory
phenomena were discussed, with particular attention to questions relating to mixed methods.
The second part of the paper highlighted – after summarizing the importance of migratory
impacts on regional competitiveness – research fields in connections with the migratory
effects on the labour market, followed by issues of segregation and integration of immigrants.
Existing studies point out, that data quality; methods and methodology are often in focus of
controversies in this research area. Students and researchers, who are interested in exploring
and explaining migration or only a tangential part of it, have to face many methodological,
ethical and practical challenges. As long as European countries and research projects keep on
using different definitions and data of diverse qualities in connection with migration and
migrants, it is not easy to compare these data. Analysing the impacts of the appearance of
immigrants, labour market performance and issues of segregation, we should consider which
area and which migratory factor we are getting a nearer view of. Beyond a simply

Patay, T.
218
interpretation of negative and positive effects studies should take into account the point of
view of the stakeholders and a wider environment. A combined dimension of evaluation leads
us thus to further issues of migration such as illegality, security, fiscal effects, social welfare
issues, norms and customs or the revision of the legal system.
The interdisciplinary character of migration research requires thus the use of variable
research methods, a good combination of instruments and a careful interpretation of various
data. This is relevant and calls for further research concerning migratory structures and
migration management – with special attention to the importance of data quality and research
methods.
REFERENCES
314/2012. (XI. 8.) Korm. rendelet a településfejlesztési koncepcióról, az integrált település-fejlesztési stratégiáról és a településrendezési eszközökről, valamint egyes településrendezési sajátos jogintézményekről. Retrieved 9. September 2016 from http://net.jogtar.hu/jr/gen/hjegy_doc.cgi?docid=A1200314.KOR
Abel, G. J., & Sander, N. (2014). Quantifying Global International Migration Flows. Science, 6178/343, 1520-1523
Angenendt, S. (2000). Globalisierung und Wanderungsbewegungen. In: Butterwegge et. al. (eds.). Zuwanderung im Zeichen der Globalisierung, Migrations-, Integration- und Minderheitenpolitik (pp 35-41) Opladen: VS Verlag für Sozialwissenschaften
Berriane, M., & de Haas, H. (2015). African Migrations Research - Innovative Methods and Methodologies. Saverance Publishing. Retrieved 2. August 2017 from https://heindehaas.files.wordpress.com/2015/05/ berriane-and-de-haas-2012-bc-new-questions-for-innovative-migration-research.pdf
Bijl, R., & Zorlu, A., Jennissen, R., & Blom, M. (2008). The integration of immigrants monitored over time: trend and cohort analyses. In C. Bonifazi et al. (eds). International migration in Europe. New trends and methods of analysis (pp 199-224). Amsterdam: University Press
Bose, P. S. (2013). Mapping movements. In Vargas-Silva, C.: Handbook of research methods in migration (pp 273-295) Cheltenham and Northampton: Edward Elgar
Council of the European Union (2010). Declaration of the European Ministerial Conference on Integration (Declaration of Zaragoza) Retrieved 28. August 2017 from: https://ec.europa.eu/migrant-integration/librarydoc/declaration-of-the-european-ministerial-conference-on-integration-zaragoza-15-16-april-2010
Creswell, J. W. (2009). Research Design: Qualitative, Quantitative and Mixed Methods Approaches. London and L.A.: Sage
De Haas, H. (2009). Mobility and Human Development. Human Development Research Paper, 1/2009, New York: UNDP
Delgado Wise, R., & Márquez, H. C. (2013). Contemporary migration seen from the perspective of political economy: theoretical and methodological elements. In Vargas-Silva, C. (ed.). Handbook of research methods in migration (pp 92-116). Cheltenham and Northampton: Edward Elgar
European Commission (2007). Regulation (EC) No 862/2007 of the European Parliament and of the Council of 11 July 2007 on Community statistics on migration and international

Patay, T.
219
protection and repealing Council Regulation (EEC) No 311/76 on the compilation of statistics on foreign workers. Retrieved 2. September 2017 from http://eur-lex.europa.eu/legal-content/EN/TXT/?uri=celex:32007R0862
European Economic and Social Committee (2012). The contribution of migrant entrepreneurs to the EU economy – own initiative opinion (Nr. 2012/C 351/04) Retrieved 9. Septebmer 2017 from http://eur-lex.europa.eu/legal-content/EN/TXT/HTML/?uri=CELEX:52012IE0638&from=DE
Fassmann, H., & Münz, R. (1996). Migration in Europa. Historische Entwicklung, aktuelle Trends, politische Reaktionen. Frankfurt am Main: Campus Verlag
Fitzgerald, D. (2006). Towards a theoretical ethnography of migration. Qualitatitve Sociology, 1/29, 1-24.
Flügel, M. (2010). Globalisierung des Arbeitsmarktes macht Stärkung der Arbeitnehmenden nötig. Travail Suisse, 21/6/2010. Retrieved 20. August 2017 from www.travailsuisse.ch/themen/arbeit/arbeitsmarkt?page=14
Georgi, F. (2014). Making Migrants Work for Britain – Gesellschaftliche Kräfteverhältnisse und Managed Migration in Grossbritannien. In Forschungsgruppe Staatsprojekt Europa (ed.). Kämpfe um Migrationspolitik (pp 113-129). Bielefeld: Transcript Verlag
Hoffmeyer-Zlotnik, J. (2007). Harmonisation of Demographic an Socio-Economic Variables in Cross-National Comparison. In Schittenhelm, K. (ed.). Concepts and Methods in Migration Research, (pp 92-111) Retrieved 2. Septembe 2016 from http://sowi-serv2.sowi.uni-due.de/cultural-capital/reader/Concepts-and-Methods.pdf
Kováts, A. (2014). Migrációs helyzetkép Magyarországon. In Taróssy I. – Glied V. – Vörös Z. (eds.). Migrációs tendenciák napjainkban (pp 329-349). Pécs: Publikon
Koopmans, R. (2008). Tradeoffs between Equality and Difference. Immigrant Integration and Multiculturalism. WZB Discussion Papers, 701/2008, Berlin
Köllő, J. (2015). A bevándorlás szerepe az európai foglalkoztatási csodákban. In Blaskó, Zs. – Fazekas, K. (szerk.). Munkaerőpiaci tükör 2015. (138-141) Budapest: MTA KRK
KSH NKI (2012). A migrációs statisztika fejlesztésének lehetőségei (Projekt EIA/2010/3.2.1.1) Retrieved 3. September 2016 from http://demografia.hu/hu/migracio/17-kutatasok-egyenkent/204-a-migracios-statisztika-fejlesztesenek-lehetosegei
Lengyel, I. (2003). Verseny és területi fejlődés. Térségek versenyképessége Magyarországon. Szeged: JATE Press
Longhi, S., Nijkamp, P., & Poot, J. (2005). The Impact of Immigration on the Employment of Natives in Regional Labour Markets: A Meta-Analysis. ISER Working Paper, 2005-10, Colchester: University of Essex
Maruszewska, K., & Przybylska, J. (2009). International migration as a factor of labour market competitiveness. Economics and Competition Policy. 5/15, 32-46. Retrieved 2. August 2017 from http://www.mikroekonomia.net/system/publication_files/135/original/2.pdf?1314882786
Ortega, F., & Peri, G. (2009). The Causes and Effects of International Migrations: Evidence from OECD Countries 1980-2005. NBER Working Papers 14833. Retrieved 27. August 2017 from https://ideas.repec.org/p/nbr/nberwo/14833.html
Portes, A. (2003). Conclusion: theoretical convergencies and empirical evidence. International Migration Review, 3/37, 874-879.
Rédei, M. (2007). Mozgásban a világ – A nemzetközi migráció földrajza. Budapest: ELTE Eötvös Kiadó
Raymer, J., & Willekens, F. (2009). International Migration in Europe – Data, Models and Estimates. West Sussex: John Wiley & Sons

Patay, T.
220
Tashakkori, A., & Creswell, J. W. (2007). The new era of mixed methods. Journal of Mixed Methods Research, 1/2007, 3-7. Retrieved 2. September 2016 from https://statistika21. files.wordpress.com/2013/03/ 1-new-era-in-mixed-methods-6.pdf
Todaro, M. P. (1969). A Model of Labor Migration and Urban Unemployment in Less Developed Countries. The American Economic Review, 59/1/1969,138-148.
United Nations Department of Economic and Social Affairs, Statistics Division (1998). Recommendations on Statistics of International Migration – Revision 1. Statistical Papers - Series M, No. 58, Rev. 1. New York. Retrieved 8. July 2016 from http://unstats.un.org/ unsd/publication/SeriesM/seriesm_58rev1e.pdf
Van der Mensbrugghe, D., & Roland-Holst, D. (2009). Global Economic Prospects for Increasing Developing Country Migration into Developed Countries. Human Development Research Paper, 50 New York: UNDP

DETUROPE – THE CENTRAL EUROPEAN JOURNAL OF REGIONAL DEVELOPMENT AND TOURISM Vol. 9 Issue 3 2017 ISSN 1821-2506
221
Book review
BASICS OF ROMOLOGY
Hajnalka IZSÁKa, Ferenc SZILÁGYIb
a Partium Christian University, Oradea, Romania, [email protected] b Partium Christian University, Oradea, Romania, [email protected]
Cite this article: Izsák, H., Szilágyi, F. (2017). Book review: Basics of Romology. Deturope. 9(3): 221-228
A romológia alapjai (Basics of Romology) By Anna Orsós (ed.). Editor: Anna Orsós ISBN: ISBN (pdf) 978-963-642-946-1 — DOI 10.15170/BTK.2015.00008 ISBN (print) 978-963-642-821-1 Name and location of publisher: University of Pécs, Faculty of Humanities, Institute of Education, Department of Romology and Sociology of Education, Wislocki Henrik College for Advanced Studies, Pécs, 2015 Number of pages: 382 pages Language of publication: Hungarian Lecturer: Forray R. Katalin
INTRODUCTION
The much-needed volume entitled Basics of Romology can be regarded as the continuation of
the two writings (Romology – Gypsyology49, 2000, and Knowledge for the Romology
Bachelor Programme50, 2006) published earlier by the Department of Romology and
Sociology of Education, Faculty of Humanities at the University of Pécs. Widening of the
subject area and the importance of disseminating the results of the research, development and
teaching work carried out within the department has justified the preparation of this
publication, which was born not only for educational purposes, but also from a concern for
readers to get a more complete picture of the history, culture, habits, problems and successes
of the Roma/Gypsies51, with particular emphasis on the situation of those living in Hungary.
The editor of the book, Anna Orsós is the head of the Department of Romani Studies and
Sociology at the University of Pécs, as well as an outstanding figure of the Hungarian
Roma/Gypsy sociolinguistic research. All the authors are academics and researchers at
prestigious institutions of higher education.
49 Original title: Romológia – Ciganológia 50 Original title: Ismeretek a romológia alapképzési szakhoz 51 In Hungary, the Roma call themselves both Roma and cigány (Gypsy). For this reason we are using the term Roma/Gypsy to refer to this population group.

Book review by Izsák, H., Szilágyi, F.
222
Summary of content
Katalin R. Forray’s introductory writing Teaching Roma/Gypsy Studies in the higher
education system52 provides detailed information about the organization and functioning of
Romology as a university specialization, its training structure and history. She also provides
data regarding the number of students who graduated from this specialization between 2003
and 2014. In the second part of her writing, the author presents the content of the volume. We
can also find out that the authors of the book discuss all issues, that could be of interest to
higher education students or to other readers interested in the topic. The first part ends with a
short dedication written by Katalin R. Forray.
The next study of the volume is Ernő Kállai’s writing entitled Gypsy groups in Europe and
Hungary53, presenting the history of Roma/Gypsy in Hungary, from historical aspects. At the
same time we can read about their origin, traditional occupations, ancient language, and
linguistic groups like Rom, Manus, Yenish, Sinti, Gitano/Caló and Voyageur. Most of the
Roma/Gypsy in Europe have been in the East region for several centuries and they have
experienced discrimination throughout history. Starting from the Dualist Era (1867-1918)
until World War II the perception of the Gypsies was characterized by a lack of social
interest, then, after 1945 they were referred to as communities living in extreme poverty, on
the margins of society, whose social integration was a very difficult task. The term „Gypsy”
started to be used in a general sense, probably due to the fact that the social status of various
groups had become similar. Since 1960 the situation of the Gypsies has been handled as a
social problem and their integration was regarded as the most important task. The author
reaches the conclusion that the Gypsies are transterritorial groups with different identities and
social status, their common features being the presumed common origin, the lack of a home
country, the minority situation resulting from this, as well as discrimination and the peripheral
social situation existing in all countries.
Csaba Dupcsik’s well-documented study, baring the title Images, frames, eras - sketch on
the history of Hungarian Gypsies54, processes a large amount of literature and is intended to
provide basics for those who wish to undertake the study of the history of these ethnic groups.
It discusses three central issues: the periodization of the Roma/Gypsies’ history in Hungary,
Roma/Gypsy and non-Roma/non-Gypsy peopleʼs perceptions of these ethnic groups, as well
as the changing relationship between these perceptions, images and the real situation in
52 Original title: A romológia egyetemi oktatásáról 53 Original title: Cigány csoportok Európában és Magyarországon 54 Original title: Képek, keretek, korszakok vázlat a magyarországi cigányok történetéhez

Book review by Izsák, H., Szilágyi, F.
223
different eras. The author presents three types of images of the Roma/Gypsies (outsider,
displaced, outcast) along with seven approaches associated with these. He also gives an
overview of the Roma/Gypsies’ history in Hungary, divided into five eras. In this overview
we are given a comprehensive description of the changing social situation of the
Roma/Gypsies in the course of history, the professions, activities which were considered to be
typical Gypsy occupations in various eras (e.g. blacksmithery, playing music, musician-
metalworker), the attempts to violent resettlement and assimilation, housing conditions, the
low educational level and the chances of employment.
Tibor Cserti Csapó’s study entitled The position of the Roma/Gypsy groups in modern
society - Sociological approaches and related issues55 focuses on the main directions,
problems and dilemmas of Romology research, and it also provides insight into a number of
research results. The major methodological dilemma of Romology research is whom and on
what basis (external features, language, culture, typical names) we call Gypsy or Roma. As in
Sociology researchers do not usually deal with the individual sub-groups, in the spirit of
fairness they mainly use the dual denomination Roma/Gypsy. The study also reviews the
ways and forms of Social Statistics, sociological interest regarding, and the methods used in
the research on Roma/Gypsy communities in different historical eras. In Hungary these
communities had mainly been explored from the perspective of ethnography, folklore and
linguistics, then, in the seventies, sociology-oriented studies started to emerge. Today,
scientific research is mainly aimed at the disadvantaged socio-economic situation of the
Roma/Gypsies and the search for solutions to this problem. The author tabulates data
described in these sociological studies, which use different approaches, and draws attention to
the basics of the scholarly method used in sociological research (regularity, comparability,
sample size, representativeness) as well as the importance of compliance with these in order
to get more accurate research results.
The next study of the volume belongs to Andrea Szalai and bears the title The languages of
the Roma/Gypsy minority: sociolinguistic aspects, in which the author outlines the varieties
and origins of the languages spoken by the Hungarian Gypsy communities (Roma, Beas56).
We can get acquainted with names, which can be traced back to occupation names, such as
čurari/csurár (grinder), kelderás/kelderár/köldörár (tinker), cerhári, colári, etc. The Romani
(also Romany) language possesses a grammatical system characteristic to that of the Indo-
55 Original title: A cigány csoportok helyzete a modern társadalomban – Szociológiai megközelítések és azok problematikája 56 also Boyash, Beash

Book review by Izsák, H., Szilágyi, F.
224
European languages, while the Beas language to that of the neo-Latin languages, and for their
speakers they are mutually unintelligible languages. Although both languages are usually
called Gypsy in Hungarian, it is important to keep in mind that they are two different
languages spoken by two different linguistic communities. According to the author it is also
important that linguistic research (pragmatics, sociolinguistics, linguistic anthropology,
discourse analysis) be carried out in the case of these two languages, too. Her article provides
an overview of the results of research into language socialization strategies, carried out in a
bilingual Roma/Gypsy community in Hungary. We can learn about the use of the Romani
language in different speech situations, the terms duma and vorba, which are the names for
the formal and informal speech in the Romani language, and we can also find out that the
curse and the conditional curse (oath, promise) is a common discursive form in the
conversation among Roma/Gypsies.
Anna Orsós’ study entitled The Beas language explores the status of the Beas language,
spoken in Hungary, which has had a written form for about twenty years. It also examines
questions related to the language use of the Beas-speaking community, presents the results of
linguistic research on Beas and Romani languages, and discusses the emergence of the subject
matter in legislation and education, along with its educational development opportunities. We
can read a detailed description of the meaning of the word beas, and of its three dialects
(Argyelan, Muncsan, Ticsan), and the clarification of the concepts bilingualism and diglossia
is also provided. Dialects of the Beas language are used in different countries, but its written
form was created in Hungary, in the early 1990s, by Katalin Kovalcsik and Anna Orsós. In
2009 the descriptive grammar of the Beas language was finalized, which is the result of Anna
Orsós’s and László Kálmán’s joint work. Research on Beas linguistics and language usage
shows, that the Beas language is becoming less widely used, but according to the author this
fact does not entail the loss of identity. The objectives of the Romani and Beas language
minority education have partially been achieved, however the University of Pécs can boast
about significant achievement in this respect, e.g. one can pursue studies in these two
officially recognized languages, within the Doctoral School of Education one has the
opportunity to take part in further training and research, and there is an accredited
examination centre as well, where one can acquire a certificate of proficiency in Beas
language. According to the author, the most important task of the Beas-speaking community
is to increase the prestige of the language, to preserve it as their mother tongue and to pass it
on.

Book review by Izsák, H., Szilágyi, F.
225
In the first part of her writing entitled The Romani language in the mirror of research and
education, Szilvia Lakatos presents the origins of the Romani language and the stages of its
development. Then she summarizes the characteristics of the conservative Romani and Para-
Romani (Anglo-Romani, Caló, Hungaro-Romani) language types. The second part of the
study presents Hancock’s, Matras’s and Tálos’s classifications of the European dialects of the
Romani language. Over the past few decades much international and domestic research has
been carried out in order to identify the dialects of the Romani language. In relation to
research conducted in Hungary, the author makes reference to the work of researchers like the
Csenki brothers (folk song collections, records related to dialects), Kamill Erdős (dialect
research), Miklós Hutterer and György Mészáros (A descriptive grammar of the Lovari Gypsy
dialect57), József Vekerdi and György Mészáros (Syntax of the Vlax Gypsy dialect in
Hungary58), Ervin Karsai (Stylistics sketch of Romani (Gypsy)59), Gyula Papp (Auxiliary
material for the development of Hungarian lingustic communicative skills of Boyash
children60), Ildikó Babos (applicability of metaphor theories) and András Márton Baló
(descriptive grammar of the Romani (Lovari) language). Research carried out on the Romani
language use in Hungary has also made use of the methods of psycholinguistics,
sociolinguistics, as well as linguistic anthropology and ethnography of communication. The
author considers it of major importance to identify and describe the two registers of the
Romani language (duma and vorba). Currently in Hungary the Lovari language is becoming
more and more prominent in standardization. One can do a state accredited language
examination in Lovari and it is also taught in some schools. The study also discusses the role
of the Romani language in education and the fact that more and more people take school
leaving examination (baccalaureate) and language proficiency examination in Romani.
Tamás Hajdu, Gábor Kertesi and Gábor Kézdi’s study entitled Roma/Gypsy young people
in secondary schools. Report from the Hungarian Life Course Survey of TARKI, waves 2006-
1261 undertakes the exploration of the causes leading to high school backwardness. The
authors present the data and the method of measuring ethnicity, then they compare the
educational career of the currently twenty-year-old generation and another generation which
was of similar age twenty years earlier. They state that the place of residence (the transport
and geographical disadvantage) itself has only got a moderate significance as far as
57 Original title: A lovári cigány dialektus leíró nyelvtana 58 Original title: A magyarországi oláh cigány nyelvjárás mondattana 59 Original title: A romani (cigány) stilisztika vázlata 60 Original title: Segédanyag beás cigány gyermekek magyar nyelvi kommunikációs készségének fejlesztésére 61 Original title: Roma fiatalok a középiskolában. Beszámoló a TÁRKI Életpálya-felmérésének 2006 és 2012 közötti hullámaiból

Book review by Izsák, H., Szilágyi, F.
226
Roma/Gypsy students’ high school backwardness is concerned. In what follows, the authors
investigate the ethnic differences manifesting in high school dropout, the type of high school
they graduated from, the results of the school leaving examination and further education at
universities. One of the conclusions they reach is that only 9% of the non-Roma/Gypsy young
people are not going to have a secondary education diploma, while almost half (48%) of the
Roma/Gypsy young people end their high school career with no success. The results of the
research are in line with the basic research findings of the international literature, according to
which the majority of the school backwardness arises in early childhood and elementary
school age.
János Zolnay, in his study bearing the title Chances of Roma/Gypsy students in public
education62, gives an overview of the schooling of the Roma/Gypsy from the theoretical
context to the specific issues. He outlines the chances of Roma/Gypsy children in public
education from 1945 until 1985, when the school inspection was abolished and the use of
alternative curricula and textbooks, then the free school choice and the establishment of
alternative schools and foundation-schools gradually became possible. The author pays
special attention to the education policy decisions of the last decade and to their impact on the
development of schooling. After the regime change the inequalities of the public education
system meant quality differences between individual schools as well, at the same time the
segregation of socially disadvantaged, poor and ethnically stigmatized students became more
and more severe. The author of the study concludes that only those Roma/Gypsy students
have the chance to get into high schools, who did not attend a Roma/Gypsy-majority,
segregated elementary school, while those who attended segregated ones, can only get into
vocational schools.
The next study in the volume is László Fórika, Tamás Török and András Magicz’s writing
entitled The system of minority rights63. The first part discusses the basic concepts of
international law and international protection of minority rights, then clarifies the concepts of
minority / nationality, identity / national identity / double identity, collective national identity
/ personal national identity, Romani/Gypsy linguistic identity, autonomy / regional autonomy
/ cultural autonomy. The second section presents the system of minority rights, including
those under international law. The European Union today is trying to answer the complex
problems of the Roma/Gipsy community through four parallelly operating mechanisms. The
third chapter deals with the organizations of the international protection of minority rights
62 Original title: A roma diákok esélyei a közoktatásban 63 Original title:A nemzetiségi jogok rendszere

Book review by Izsák, H., Szilágyi, F.
227
(Ombudsman, Equal Treatment Authority, non-governmental organizations). The Equal
Treatment Authority has worked since 2005 and is an autonomous institution, which
guarantees personal dignity, and safeguards the implementation of the principle of equal
treatment. The study will help the reader understand the meaning and operation of
jurisprudence, as well as the schooling problems and opportunities of the Roma/Gypsy
population.
Ethnography and cultural anthropology: research and mosaics on the culture of the
Roma/Gypsy groups64 is Péter Szuhay’s study, which examines the cultural heritage of the
Roma/Gypsies living in Hungary.
The first part explores the most important research areas of ethnology and ethnography in
Hungary (physical, spiritual, social ethnography). The second part contains a description of
the Roma/Gypsy linguistic and ethnic groups in Hungary. In the third part of the study we can
read the historical overview of the ethnographic research on Romani/Gypsies, beginning with
the observation method used by gypsyologists, through folklore to ethnographic research. The
author devotes a chapter to the anthropological research on the Roma/Gypsy communities, in
which he discusses in detail the elements of the anthropological method, presenting the most
important works of the outstanding researchers of the discipline. The teachability of the
Romani/Gypsy culture is the central topic of the next section. The author draws attention to
the fact that it is an enormous responsibility the extent to which we can generalize what we
teach as Roma/Gypsy culture.
The volume ends with Zoltán Beck’s study entitled Basics of the Roma/Gypsy literature
and fine arts65, in which the author presents the Roma/Gypsy belles lettres and fine arts in
Hungary. We can read about the historical evolution of the term Gypsy literature, as well as
about descriptive monographs and outstanding literary creations. The author of the first
Hungarian-language overview monograph is Dénes Csengey, who presents in his work the
Roma/Gypsy writers and poets of the Hungarian literature, while until the early 2000s the
organizer and main theoretician of the Roma/Gypsy fine arts in Hungary was István
Kerékgyártó. Together with the previous study, we can get a holistic view of the artistic
performance, with which the Roma/Gypsy population has contributed to the enrichment of
literature and arts in Hungary.
64 Original title: Néprajz és kulturális antropológia: kutatások és mozaikok a cigány csoportok kultúrájából 65 Original title: A cigány, roma irodalom és képzőművészet alapjai

Book review by Izsák, H., Szilágyi, F.
228
Conclusion
The sophisticatedly designed publication includes a total of twelve writings, the scientific
diversity, professional approach and standard of competence of which emphasize that it is a
much-needed book indeed. All of the studies included in the carefully and clearly structured
volume end with notes, including explanatory information, and a rich bibliography which
make them complete. I think, that the authors have managed to reach their goal, as throughout
these 382 pages we are offered a complex picture of the history, culture, problems and
successes of the largest minority group living in Hungary.
Overall, we can say that readers are holding a very interesting, diverse, scholarly volume in
their hand, which does not only serve to help students prepare for their exam, but is also
exciting and fun.

DETUROPE – THE CENTRAL EUROPEAN JOURNAL OF REGIONAL DEVELOPMENT AND TOURISM Vol. 9 Issue 3 2017 ISSN 1821-2506
229
Challenges and Development Paths of Central and Eastern European Locations in the Globalised World – Report on the first
International Smart Communities Academy
György ÁLDORFAI1, Viktória JÓZSA2, József KÁPOSZTA3, Henrietta NAGY4, Adrienn VARGA-NAGY5
1 assistant lecturer, Szent István University 2 managing director, Nord Consult Kft. 3 associate professor, Szent István University 4 associate professor, Szent István University 5 adjunct, Szent István University
In Autumn 2016, a reputed international project consortium submitted a project proposal
in the topic of ‘Smart Communities’ to the Interreg Slovakia-Hungary call for proposals, that
received a positive decision (SKHU/1601/4.1/210). The objective of the bilateral cooperation
project is to prove that smartness is not the privilege of cities, through the implementation of
several social innovation activities in the border region (www.smartcommunities.eu). The
project has a sound concept that formed the basis of both the selection of the consortium
partners and the range of project activities. This is to generate an attitude change in rural areas
towards smartness, mainly in the sectoral field of information communication technologies
and sustainability, from early childhood to advanced years. In order to facilitate this process, a
focus shift should be generated from the attraction of industry and foreign direct investment to
intellectual property and endogenous development factors that could be advanced by a virtual
education, research, development and innovation network. For this reason, the disadvantaged
cross-border target region should be positioned on the map of the international academic and
practitioner community.
Based on the above, as one of the first activities in the framework of the project, on 28-29
September 2017, the first international Smart Communities Academy for practitioners and
scientists was organised with the coordination of Szent István University, Faculty of
Economics and Social Sciences (Gödöllő), together with the Hungarian Regional Science
Association (Pécs) and the University of Szeged, Faculty of Economics and Business
Administration, as co-organisers. The Chair of the Scientific Committee was Prof. h.c. Dr.
József KÁPOSZTA and the Head of the Organising Committee was Dr. habil. Henrietta
NAGY. Internationally reputed scholars, Prof. Dr. János RECHNITZER, former President of
Hungarian Regional Science Association and Prof. Dr. Imre LENGYEL, Chair of Doctoral

Áldorfai, G., Józsa, V., Káposzta, J., Nagy, H., Varga-Nagy, A.
230
School of Economics at the University of Szeged were the representatives of the co-organiser
institutions.
The Academy, including the fifth Central European PhD Workshop on Regional
Economics and Business Studies, was a combination of several methodological novelties
regarding its concept, location and participants. It formed a platform for the communication
and change of ideas of actors from very different geographic and sectoral areas, all interested
in global tendencies and local answers in the field of sustainable development and smartness.
As such, it constituted a unique opportunity not only to provide a proof of concept that
international and inter-sectoral (academy and practice) conferences can be located into
disadvantaged rural communities, but also to offer several lessons-to-be-learned and
implications for the future that can be summarised as follows:
The guiding principle of the project was strictly followed in the choice of the location, as
the organisers decided to locate the Academy into the countryside, in one of the most
disadvantaged area of Hungary, in a small village, Legénd, Nógrád county. The conference
started with a plenary programme that was a good example of subsidiarity and the connection
of local and international (global) scale, starting from the local mayor, through county level
representatives to the delegate of the national government (Prime Minister’s Office). All
administrative levels of Hungary were presented, together with a project presentation and a
closing contribution from a local resident of Dutch origin, who provided a first-hand, but yet
different perspective and experience about Legénd and Nógrád county. After the plenary
programme, three thematic sessions were organised in the afternoon at different venues in the
village, ranging from the Village Hall, through the local Castle (that used to be the primary
school and now is in private property), to a traditional cob-walled country house. On the
second day, the second round of thematic sessions (3) was organised at the same venues, and
participants could visit other sessions within walking distance during the coffee breaks. As a
closure of the Academy, a plenary session was held where closing remarks and future
implications were summarised. Consequently, the Academy could provide to the more than
100 participants from 25 countries a memorable, real-life experience about the Hungarian
countryside and the everyday living conditions of the local citizens, most of them belonging
to marginalised target groups. Direct interactions between the local residents and the
participants of the Academy could be generated this way.
The scope of the participants was not limited to either practitioners or scholars, but the
objective was to ensure a balanced participation of both academics from all fields and in all
career stage (starting from MSc, through PhD students, candidates, early-careers, associate-

Áldorfai, G., Józsa, V., Káposzta, J., Nagy, H., Varga-Nagy, A.
231
and established tenured full professors) and practitioners, including mayors, civil servants,
non-profit and bridge organisations, local economic actors and interested residents. Altogether
six thematic sessions were organised in the two days, three of them in English and the others
in Hungarian.
The topics of the sessions covered all major research strands and real-life challenges, as
Smart Communities and Resiliency; New methods and approaches in local economic
development; Enterprises and Locations in the Globalised World; The Geography and
Challenges of Peripheries; Contribution of Local Actors, Place-based Policies and
Community Development; and Human Resources in the Countryside, Migration, Training and
Education. A balanced representation of the academic and practitioner community was
ensured at the level of the session chairs and the presenters (6-7 lecturers per session) also.
Following the presentations, the chair and the participants addressed specific questions and
feedbacks to the presenters, in order to generate debate, provide different insights and
facilitate further cooperation. Practitioners welcomed the presentation of the state-of-the-art in
theory and academic research, while scholars welcomed practical, actual insights (qualitative
data) and future research opportunities in the form of invitations to study visits and joint
elaboration of case studies, for example in case of the national Smart Village development
concept. A clear and declared request was formulated toward a network (platform) of
professionals and continuous information flow in this field.
Regarding the next steps and the sustainability of the Academy’s results, the conference
proceedings in English language is under preparation by the Hungarian Academy of Sciences
Centre for Economic and Regional Studies West Hungarian Research Department. The
proceedings will be made publicly available at the project homepage also
(www.smartcommunities.eu). The programme of the Smart Academy and the photo gallery
are already available at the site. Based on the success of the Academy, the Department of
Regional Sciences and Management of the Faculty of Economics at the Technical University
in Kosice, as member of the Smart Communities project consortium, will organise the second
international Smart Communities Academy in Slovakia in Spring 2018. The main organiser of
the event is Assoc. Prof. Natasa Urbancikova ([email protected]), the planned
venue is the Slovak countryside in the border region, the planned date is the last week of May,
or early June 2018. In the name of the project consortium we would like to thank all citizens
of Legénd to host the Academy and we hope to see you in 2018 in Slovakia, at the second
Smart Communities Academy.

Áldorfai, G., Józsa, V., Káposzta, J., Nagy, H., Varga-Nagy, A.
232
Special thanks to Mr. Tamás TUNKEL, Mayor of Legénd, Mrs. Anna BÍRÓ, Vice-
president of Community for the Renewal of Rural Areas, and Mr. Gerard VAN BERKUM,
citizen of Legénd.
Related Documents