DETUROPE – THE CENTRAL EUROPEAN JOURNAL OF REGIONAL DEVELOPMENT AND TOURISM Vol. 13 Issue 3 2021 ISSN 1821-2506 0 Volume 13 Issue 3 2021 Czech Republic Hungary Serbia

Welcome message from author
This document is posted to help you gain knowledge. Please leave a comment to let me know what you think about it! Share it to your friends and learn new things together.
Transcript
DETUROPE – THE CENTRAL EUROPEAN JOURNAL OF REGIONAL DEVELOPMENT AND TOURISM Vol. 13 Issue 3 2021 ISSN 1821-2506
0
Volume 13 Issue 3 2021
Czech Republic Hungary Serbia
DETUROPE
THE CENTRAL EUROPEAN JOURNAL OF REGIONAL DEVELOPMENT AND TOURISM
Volume 13, Issue 3
2021
DETUROPE – the Central European Journal of Regional Development and Tourism is an international online open-access scientific journal publishing results of theoretical and applied research in the fields of regional and rural development and tourism. The articles published in this journal pass through a double-blinded peer reviewing process. Editorial board Editor-in-chief: Kamil Pícha, associate professor, University of South Bohemia Members: Zsuzsanna Bacsi, professor, Szent István University Dávid Fekete, assistant professor, Széchenyi István University Ernő Kovács, associate professor, Szent István University Zsuzsanna Lőke, associate professor, Szent István University Josef Navrátil, associate professor, University of South Bohemia Imre Nagy, professor, University of Novi Sad; Kaposvar University János Rechnitzer, professor, Széchenyi István University András Ricz, assistant professor, Regional Science Association of Subotica Sándor Somogyi, professor, Regional Science Association of Subotica, honorary editor-in-chief Dagmar Škodová Parmová, associate professor, University of South Bohemia In memoriam: Vladimír Dvořák, assistant professor, University of South Bohemia – founding Editorial board member DETUROPE is covered by Web of Science Emerging Sources Citation Index and indexed in the Scopus, ERIH plus, DOAJ (Directory of Open Access Journals), MTMT (The Hungarian National Scientific Bibliography), and the KoBSON (Serbian Consortium for Coordinated Acquisition of Electronic Resources) databases.
Published by the Regional Science Association of Subotica, Serbia in co-operation with the University of South Bohemia, Faculty of Economics and University of Pannonia, Georgikon Faculty, Kesthely, Hungary. Address of the contact information: DETUROPE. Regionális Tudományi Társaság Szabadka/Društvo za Regionalne Nauke, Corvin Mátyás/Matije Korvina 9. 24000 Szabadka/Subotica, Serbia, [email protected] ISSN 1821-2506
3
TABLE OF CONTENTS Original scientific papers: LABOUR MARKET CRISIS MANAGEMENT – INTERVENTION EXPENDITURE AND EUROPE 2020 INDICATORS Tímea Győri ........................................................................................................................... 4 FROM LARGE-SCALE COMMUNIST AGRICULTURAL PREMISE THROUGH ABANDONED CONTAMINATED RUIN TO ORGANIC FARMING PRODUCTION: THE STORY OF SUCCESSFUL POST-AGRICULTURAL BROWNFIELD REGENERATION Petr Klusáček, Josef Navrátil, Stanislav Martinát, Klára Charvátová, Tomáš Krejčí .............. 32 EXAMINING THE VISIBILITY OF SOCIAL RESPONSIBILITY ON THE WEBSITES OF HUNGARIAN STATE UNIVERSITIES Adrienn Reisinger, Zsolt Dános ............................................................................................ 58 THE QUANTITATIVE ESTIMATION OF ETHICS: THE REGIONAL AND NATIONAL INDEX OF ETHICS [THE ETHICS PERCEPTION INDEX (ETPI) Alexander Shemetev ............................................................................................................. 73 PARTICULARITIES OF MARKETING COMMUNICATIONS IN THE FIELD OF INTERNATIONALIZATION OF HIGHER EDUCATION IN THE RUSSIAN FEDERATION Svetlana G. Pyankova, Inna V. Mitrofanova, Olga T. Ergunova, Marina E. Buyanova .......... 98 STRATEGIES OF TOURISM SERVICE PROVIDERS TO COPE WITH THE COVID-19 PANDEMIC Helena Kubíčková, Andrea Holešinská ............................................................................... 118 AUSTRALIAN PUBLIC UNIVERSITIES VICE-CHANCELLOR SALARIES AND WORKFORCE CASUALISATION: ETHICAL TENSION? Roberto Bergami ................................................................................................................ 130 PANEL DATA MODEL OF INTERNATIONAL TOURISM DEMAND FOR GREECE Athanasia Mavrommati, Konstantina Pendaraki, Achilleas Kontogeorgos, Fotios Chatzitheodoridis................................................................................................................ 142
DETUROPE – THE CENTRAL EUROPEAN JOURNAL OF REGIONAL DEVELOPMENT AND TOURISM Vol. 13 Issue 3 2021 ISSN 1821-2506
4
Original scientific paper
LABOUR MARKET CRISIS MANAGEMENT AFTER CRISIS OF 2008 –
INTERVENTION EXPENDITURE AND “EUROPE 2020” INDICATORS
Tímea GYŐRIa
a Hungarian University of Agricultural and Life Sciences, Doctoral School of Economics and Regional Sciences H-2100 Gödöllő, Páter Károly street 1. [email protected]
Cite this article: Győri, T. (2021). Labour market crisis management after crisis of 2008 – Intervention expenditure and “Europe 2020” indicators. Deturope. 13(3), 4-31.
Abstract
The primary aim of this study is to explore how the Member States of the European Union have responded to the crisis, what labour market interventions were preferred, how the structure of labour market expenditures changed between 2008 and 2018. On the other hand, examines the connections between the indicators of the Europe 2020 strategy, as well as the possibilities of condensing the indicators into principal components. Along the dimensions of the created main components, the Member States were grouped by K-mean cluster analysis. The paper also analyses the relationship between the established clusters and the labour market expenditures of each Member State. Keywords: labour market, Europe 2020, correlation analysis, principal component analysis, cluster analysis
INTRODUCTION
The financial and economic crisis that took place at the end of the first decade of the 2000s also
spread to the labour market, as a result of which the European Union's previous employment
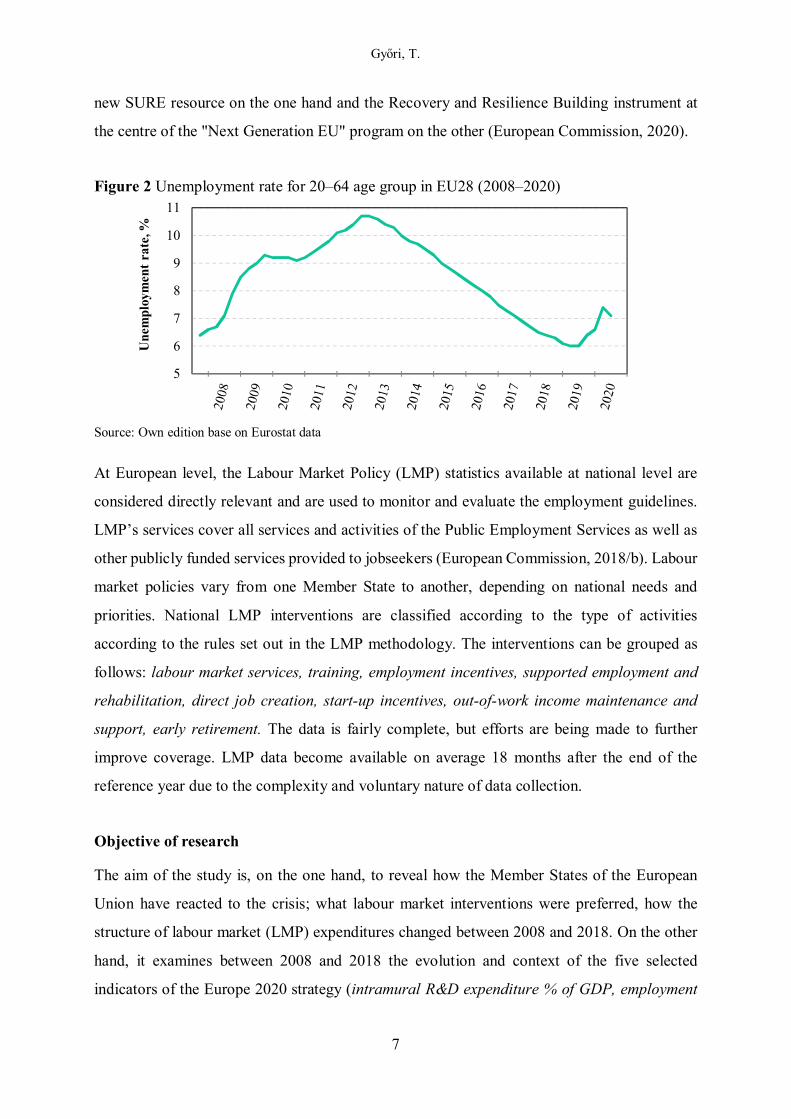
growth trend was, interrupted (European Commission, 2010). According to Eurostat Labour
force surveys in 2009, the total number of unemployed in the 27 Member States increased by 4
million. The unemployment rate (percentage of active population) of the 20–64 age groups
exceeded the 9% by the last quarter of 2009 (Fig. 2). By the first quarter of 2010, the
employment rate of the priority age group had fallen to 68% of the total population and to 75.5%
of the active age population (European Commission, 2013).
As a result of the recession, the EU's economic growth and employment rate have also lagged
behind those in the rest of the world. For a sustainable future, the European Commission has
set out its Europe 2020 strategy for smart, sustainable and inclusive growth for 2010–2020. The
Union's budget for 2014–2020 has been set in line with the objectives of the Europe 2020
strategy.
The main challenge for the Europe 2020 strategy is to be able to prevent an instinctive return
to the pre-crisis situation. The crisis has also highlighted the interdependence of our economies
Győri, T.
5
(reforms implemented in one country also affect the performance of others); and our reflection
on the crisis that we are much more effective together. It follows from the above that social and
territorial cohesion is the basis for achieving the set goals at both Member State and regional
level (European Commission, 2010). All EU Member States are committed to achieving the
objectives of the Europe 2020 strategy.
Each country has developed a differentiated set of tools to deal with the general labour
market crisis. Following the increase in unemployment, social spending increased in almost all
Member States (Kálmán, 2015). Many tools for job creation are used in the countries, which
involve significant expenditures (Ékes, 2011).
THEORETICAL BACKGROUND
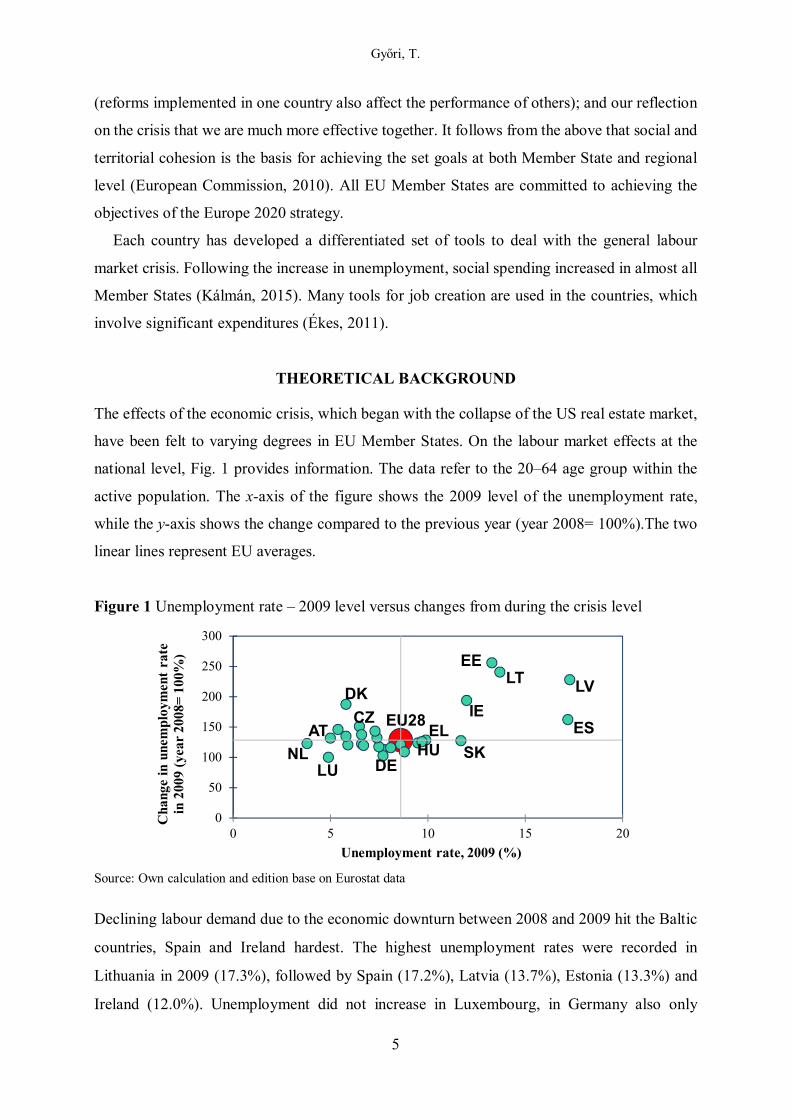
The effects of the economic crisis, which began with the collapse of the US real estate market,
have been felt to varying degrees in EU Member States. On the labour market effects at the
national level, Fig. 1 provides information. The data refer to the 20–64 age group within the
active population. The x-axis of the figure shows the 2009 level of the unemployment rate,
while the y-axis shows the change compared to the previous year (year 2008= 100%).The two
linear lines represent EU averages.
Figure 1 Unemployment rate – 2009 level versus changes from during the crisis level
Source: Own calculation and edition base on Eurostat data
Declining labour demand due to the economic downturn between 2008 and 2009 hit the Baltic
countries, Spain and Ireland hardest. The highest unemployment rates were recorded in
Lithuania in 2009 (17.3%), followed by Spain (17.2%), Latvia (13.7%), Estonia (13.3%) and
Ireland (12.0%). Unemployment did not increase in Luxembourg, in Germany also only
EU28CZ
DK
DE
EE
IE
EL ES
LVLT
LU
HUNL
AT
SK
0
50
100
150
200
250
300
0 5 10 15 20
Cha
nge
in u
nem
ploy
men
t ra
te
in 2
009
(yea
r 20
08=
100
%)
Unemployment rate, 2009 (%)
Győri, T.
6
minimally. In half of the Member States, the unemployment rate remained below the EU
average. The number of unemployed in Denmark has almost doubled, but did not exceed the
EU average.
Among the theories dealing with the economic growth and development of regions,
endogenous growth theories emphasize the importance of local conditions. Models consider
knowledge to be endogenous within an area (Romer, 1994; Capello, 2007; Lengyel, 2010).
According to Rechnitzer, Barsi, Szabó & Németh (2003), the knowledge base of the workforce
is high in successful regions. Living in a lower socio-economic area (SES) has also been linked
to poor physical and mental health outcomes, as SES indicators (e.g. income, poverty,
education) are major predictors of health and health inequalities around the world (Diez Roux,
Borrell, Haan, Jackson & Schultz, 2004; Robinette, Charles & Gruenewald, 2017).
Numerous empirical studies demonstrate that the human capital variable can explain a very
large proportion of the variance in per capita GDP between countries (Mankiw, Romer & Weil,
1992). According to experts, the most important element of the long-term solution of economic
problems is the drastic increase of the education and knowledge of the population (Jankó, 2010;
Hajdú, 2020). A higher level of education can provide better employment opportunities, and by
increasing the employment rate, poverty can decrease and well-being increases (Egri, Törőcsik
& Tánczos, 2009; Egri, 2017).
The objectives of the Europe 2020 strategy have been formulated taking into account the
factors influencing economic growth. Objectives of inclusive growth include raising the
employment rate of the 20–64 age groups to 75% and raising the share of tertiary graduates to
40% in the 30–34 age group. Furthermore, one of the EU's education priorities is to reduce the
number of early school leavers across the EU to below 10% by 2020. One of the objectives of
the Strategic Framework for European Cooperation and Training (Education and Training
2020) is that, on average, at least 15% of adults at European level should participate in lifelong
learning by 2020.
The reform efforts introduced in the EU have contributed to job-creating economic growth.
Unemployment rates for the 20–64 age group returned to pre-crisis levels in 2018 (Fig. 2), but
remained high in several Member States, for example Greece, Spain, Italy, Croatia and Cyprus
(European Commission, 2018/a). The relatively short relief period was ended by an economic
recession in the context of the coronavirus epidemic at the end of 2019. The Covid19 crisis has
had a severe impact on EU labour market outcomes and is expected to shape them in the future.
In the current economic climate, financial support has been provided to Member States by the
Győri, T.
7
new SURE resource on the one hand and the Recovery and Resilience Building instrument at
the centre of the "Next Generation EU" program on the other (European Commission, 2020).
Figure 2 Unemployment rate for 20–64 age group in EU28 (2008–2020)
Source: Own edition base on Eurostat data
At European level, the Labour Market Policy (LMP) statistics available at national level are
considered directly relevant and are used to monitor and evaluate the employment guidelines.
LMP’s services cover all services and activities of the Public Employment Services as well as
other publicly funded services provided to jobseekers (European Commission, 2018/b). Labour
market policies vary from one Member State to another, depending on national needs and
priorities. National LMP interventions are classified according to the type of activities
according to the rules set out in the LMP methodology. The interventions can be grouped as
follows: labour market services, training, employment incentives, supported employment and
rehabilitation, direct job creation, start-up incentives, out-of-work income maintenance and
support, early retirement. The data is fairly complete, but efforts are being made to further
improve coverage. LMP data become available on average 18 months after the end of the
reference year due to the complexity and voluntary nature of data collection.
Objective of research
The aim of the study is, on the one hand, to reveal how the Member States of the European
Union have reacted to the crisis; what labour market interventions were preferred, how the
structure of labour market (LMP) expenditures changed between 2008 and 2018. On the other
hand, it examines between 2008 and 2018 the evolution and context of the five selected
indicators of the Europe 2020 strategy (intramural R&D expenditure % of GDP, employment
5
6
7
8
9
10
11
Une
mpl
oym
ent
rate
, %
Győri, T.
8
rate at 20–64 aged, tertiary educational attainment at 30–34 aged, early leavers from education
and training, people at risk of poverty or social exclusion).
As part of the empirical research, I used the data from 2018 to examine how effectively the
selected indicators of the Europe 2020 strategy can be condensed into a principal component.
Furthermore, I researched whether the inclusion of other variables could create a principal
component that compresses a significant portion of the information. For the preliminary
screening of potential background variables, the set of TOP7 strongest and most correlated
background variables were compiled.
The main components produced using the 2018 data was subjected to a K-means cluster
analysis in order to form groups of Member States along these dimensions. I examined the
relationship between the established clusters and the 2018 LMP expenditures of each Member
State.
DATA AND METHODS
During the preparation of the study, the emphasis was basically on the analysis of statistical
data collected from secondary sources. The territorial basis of the analysis is the 28 Member
States of the European Union. The data used were provided by the EUROSTAT database. Due
to the temporal and spatial availability of the vast majority of the databases used (e.g. LMP
statistics); the data at the Member State level in 2008 and 2018 were processed in the study.
Data for 2008 illustrate the pre-crisis labour market situation; while 2018 already represents a
return to 2008 (unemployment reached pre-crisis levels in this year).
As a first step of the research, the changes in the level of labour market expenditures as a %
of GDP and the unemployment rate in the 20–64 age group were compared at the Member State
level. I then analysed the structure of LMP expenditures at 2008 and 2018. Data on LMP
expenditure by type of measure are not available for the United Kingdom for both years and for
Croatia in 2008. The data are given in Tables 8 and 9 in the Appendix.
In the next phase of the research, I examined the changes in the employment and
qualification indicators determining the inclusive growth of the Europe 2020 strategy between
2008 and 2018. Data for the selected indicators for 2008 and 2018 are presented in Tab. 10 in
the Appendix. The direction and magnitude of the correlations between the indicators were
revealed by Pearson's correlation analysis in both years studied. The value of the coefficient
varies between +1 and -1; the stronger the relationship is, the closer the absolute value of the
Győri, T.
9
coefficient is to 1. The coefficient is strong in absolute terms in the range of 0.7–1, medium at
0.3–0.7 intervals, and indicates a weak correlation at 0–0.3 intervals (Nemes Nagy, 2005).
Depending on the results obtained in the study, the chosen significance levels were 1% and 5%
(i.e., p= 0.01 and p= 0.05).
In the next research unit – based on the 2018 data – I researched the possibilities of
condensing the Europe 2020 indicators and background variables into a composite indicator by
factor analysis (Principal components – PCA). A basic database of 25 variables was compiled
for the analysis. I collected the variables of the basic database around the topic of the main
indicators defined in the Europe 2020 strategy, supplemented by two accessibility indicators
(Tab. 1).
Of the 25 variables included in the study, 5 lacked data for 2018 data (LMP, job vacancy rate,
people at risk of poverty or social exclusion, road/rail and navigable inland waterways
networks, individuals regularly using the internet), which totals represented 1.6% of the values.
The variables examined showed a general pattern of lack of data. In the case of a general lack
of data, the pattern has no specialty (Oravecz, 2008).
The multiple imputation (MI) proposed by Rubin (1987) was first, selected as a method to
address data gaps. Multiple imputation is one of the most widely used missing data management
techniques (Chung & Cai, 2018). The method can be applied to virtually any data structure and
model type (Allison, 2003). Ginkel, Kroonenberg & Kiers (2014) demonstrated in their study
that multiple imputation can be safely applied in the context of PCA. MI is already effective
for a small number of imputations, depending on the percentage of data missing (Allison, 1999).
In general, we can use imputation for variables where a maximum of 30–40% of the data per
variable is missing, but the lack of data in the entire database does not exceed 10–15%. To
address the lack of data, a linear regression model was developed for non-deficient observations
as predictors.
Pearson's correlation analysis was also performed to examine the variables in the base and
imputed databases. The strength of the relationships showed a minimal improvement of a few
hundredth % as a result of imputation for one or two variables. In the further stage of the
research, the basic data of the analyses were provided by the imputed database. The basic
descriptive statistics (minimum, maximum, mean, standard deviation) of the imputed basic
database are given in Tab 1.
Győri, T.
10
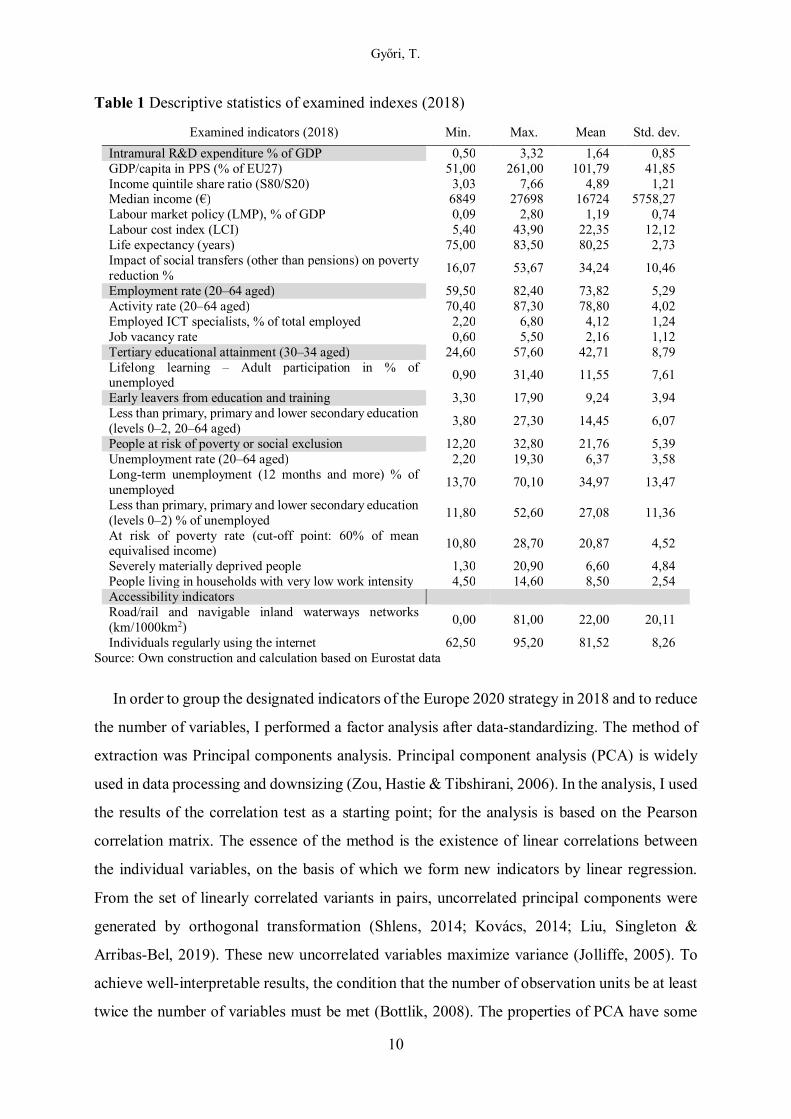
Table 1 Descriptive statistics of examined indexes (2018)
Examined indicators (2018) Min. Max. Mean Std. dev.
Intramural R&D expenditure % of GDP 0,50 3,32 1,64 0,85 GDP/capita in PPS (% of EU27) 51,00 261,00 101,79 41,85 Income quintile share ratio (S80/S20) 3,03 7,66 4,89 1,21 Median income (€) 6849 27698 16724 5758,27 Labour market policy (LMP), % of GDP 0,09 2,80 1,19 0,74 Labour cost index (LCI) 5,40 43,90 22,35 12,12 Life expectancy (years) 75,00 83,50 80,25 2,73 Impact of social transfers (other than pensions) on poverty reduction %
16,07 53,67 34,24 10,46
Employment rate (20–64 aged) 59,50 82,40 73,82 5,29 Activity rate (20–64 aged) 70,40 87,30 78,80 4,02 Employed ICT specialists, % of total employed 2,20 6,80 4,12 1,24 Job vacancy rate 0,60 5,50 2,16 1,12 Tertiary educational attainment (30–34 aged) 24,60 57,60 42,71 8,79 Lifelong learning – Adult participation in % of unemployed
0,90 31,40 11,55 7,61
Early leavers from education and training 3,30 17,90 9,24 3,94 Less than primary, primary and lower secondary education (levels 0–2, 20–64 aged)
3,80 27,30 14,45 6,07
People at risk of poverty or social exclusion 12,20 32,80 21,76 5,39 Unemployment rate (20–64 aged) 2,20 19,30 6,37 3,58 Long-term unemployment (12 months and more) % of unemployed
13,70 70,10 34,97 13,47
Less than primary, primary and lower secondary education (levels 0–2) % of unemployed
11,80 52,60 27,08 11,36
At risk of poverty rate (cut-off point: 60% of mean equivalised income) 10,80 28,70 20,87 4,52
Severely materially deprived people 1,30 20,90 6,60 4,84 People living in households with very low work intensity 4,50 14,60 8,50 2,54 Accessibility indicators Road/rail and navigable inland waterways networks (km/1000km2)
0,00 81,00 22,00 20,11
Individuals regularly using the internet 62,50 95,20 81,52 8,26 Source: Own construction and calculation based on Eurostat data
In order to group the designated indicators of the Europe 2020 strategy in 2018 and to reduce
the number of variables, I performed a factor analysis after data-standardizing. The method of
extraction was Principal components analysis. Principal component analysis (PCA) is widely
used in data processing and downsizing (Zou, Hastie & Tibshirani, 2006). In the analysis, I used
the results of the correlation test as a starting point; for the analysis is based on the Pearson
correlation matrix. The essence of the method is the existence of linear correlations between
the individual variables, on the basis of which we form new indicators by linear regression.
From the set of linearly correlated variants in pairs, uncorrelated principal components were
generated by orthogonal transformation (Shlens, 2014; Kovács, 2014; Liu, Singleton &
Arribas-Bel, 2019). These new uncorrelated variables maximize variance (Jolliffe, 2005). To
achieve well-interpretable results, the condition that the number of observation units be at least
twice the number of variables must be met (Bottlik, 2008). The properties of PCA have some
Győri, T.
11
undesirable features when the variables have different units of measurement. To overcome this
undesirable feature, it is common practice to begin the analysis by standardizing the variables
(Jolliffe & Cadima, 2016). It is worth omitting a variable from the analysis if the explained
proportion would be too low. If the communality (multiple coefficient of determination) is less
than 0.25, then the variable does not correlate moderately with any main component (Kovács,
2014). Fabrigar et al. (1999), the value of communality above 0.7 can be considered high, below
0.4 it can be considered low. One of the most important issues in factor analysis is the question
of the appropriate number of factors (principal components) to be extracted (Hakstain & Muller,
1973; Cattell & Vogelmann, 1977). This is a critical decision because the number of factors has
a direct influence on the subsequent parameter estimates and the interpretation of the solution
(Lambert, Wildt & Durand, 1990).
To ensure the validity of the factorization, both the Kaiser-Meyer-Olkin measurement and
the Bartlett spherical test were performed. The Kaiser-Meyer-Olkin (KMO) criterion is used to
judge the suitability of variables for factor analysis, with a value between 0 and 1. Kaiser (1981)
originally recommended that the baseline criterion for factorability should be 0.50. Based on
Kaiser's recommendation, I interpreted the KMO index as follows: KMO>0.9 marvellous, 0.8–
0.9 meritorious, 0.7–0.8 middling, 0.6–0.7 mediocre, 0.5–0.6 miserable, KMO<0.5
unacceptable. The basic hypothesis of Bartlett’s chi-square test is that the original variables are
independent (Arsham & Lovric, 2011), the variables are suitable for factor analysis if the
homogeneity test hypothesis can be rejected.
Principal component analysis was performed with several parameters and components. To
pre-screen the potential background variables of the analysis, a set of TOP7 strongest and most
correlated background variables was compiled. I influenced the number of significant principal
components on the one hand directly and on the other hand by giving my own values
(Eigenvalues) based on the Kaiser criterion. For a factor to have positive Kuder-Richardson
reliability (Cronbach’s alpha), it is necessary and sufficient for the associated eigenvalue to be
greater than 1 (Kaiser, 1960). Finally, to compile the principal components of the Europe 2020
indicators extended with other components, I used the group of factors for which the
Cronbach’s alpha value is greater than 0.70.
I performed a K-means cluster analysis with the principal components created during the
empirical research. Cluster analysis is suitable for arranging (clustering) data arrays into
homogeneous groups, so it essentially functions as a dimension-reducing method (Rao, 1971).
The essence of clustering is that the data within each cluster are similar in some dimension, and
Győri, T.
12
in this respect they differ from the elements of other clusters (Bardhoshi, Um & Erford, 2021).
K-means clustering (MacQueen, 1967) is a commonly used method for automatically
partitioning a data set into k groups. In the K-mean cluster analysis, the grouping of the data set
is based on the selection of the central point and the calculation of the Euclidean distance
(Bansal, Sharma & Goel, 2017). In a research with a small sample, K-means clustering can be
used successfully (Székelyi-Barna, 2005). The number of clusters needs to be given before the
analysis (Birkner, Peter & Fehérvölgyi, 2012). In the present research, the determination of the
number of clusters was based on previous analysis (hierarchical cluster analysis). There is no
clear specification for the sample elements and variables involved in the clustering study, the
researcher should be careful to consider only those criteria in the grouping procedure that can
be considered relevant based on theoretical considerations (Simon, 2006).
Our new CLU variable obtained by clustering is nominal, which allows the use of the ETA
coefficient. ETA2 in this case is the quotient of the sum of squares between the groups and the
total deviation. The discriminant power of the variables was checked in ANOVA (analysis of
variance) standard deviation resolution table. F test performed in the framework of ANOVA is
a procedure for testing the equality of standard deviations, in which the null hypothesis is that
the variance of two normally distributed samples is the same. Several studies have confirmed
that with a given experimental error rate, F test is the strongest statistical test for examining
variance (Ramsey, 1978; Harper, 1984; Ramsey & Ramsey, 2013). As a control study, the rank-
based Kruskal-Wallis test was run as an effective alternative to one-way analysis of variance
(Breslow, 1970; Vargha & Delaney, 1998; Ostertagová, Ostertag & Kováč, 2014).
RESULTS
Change in LMP expenditures 2008–2018
I first examined the extent to which unemployment increased in the first year of the crisis and,
in this context, how the level of LMP spending changed between 2008 and 2010 at Member
State level. LMP expenditure as a percentage of GDP related to crisis management measures
ranged from 0.427% (Romania) to 3.675% (Spain) in the first year of the crisis. Expenditure on
interventions has risen in all Member States after the crisis.
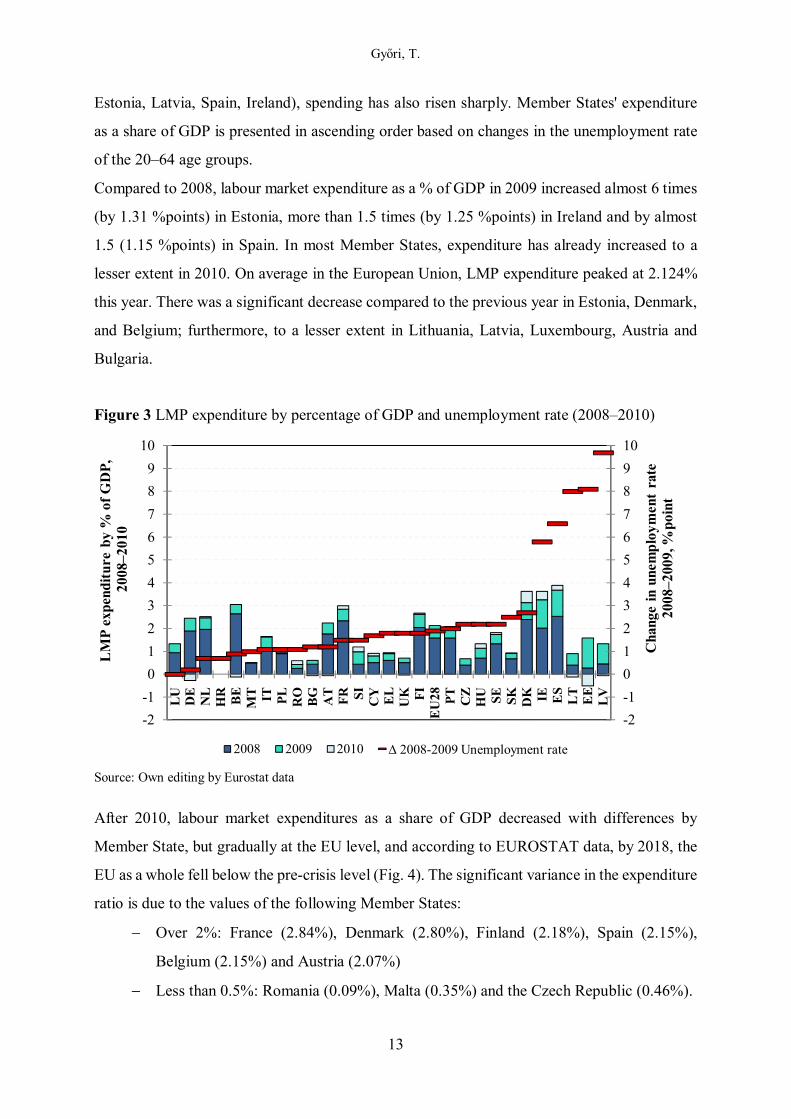
Fig. 3 illustrates the cumulative development of expenditures as a % of GDP between 2008
and 2010 and the change in the number of unemployed between 2008 and 2009, expressed in
percentage points. In those Member States where unemployment has risen sharply (Lithuania,
Győri, T.
13
Estonia, Latvia, Spain, Ireland), spending has also risen sharply. Member States' expenditure
as a share of GDP is presented in ascending order based on changes in the unemployment rate
of the 20–64 age groups.
Compared to 2008, labour market expenditure as a % of GDP in 2009 increased almost 6 times
(by 1.31 %points) in Estonia, more than 1.5 times (by 1.25 %points) in Ireland and by almost
1.5 (1.15 %points) in Spain. In most Member States, expenditure has already increased to a
lesser extent in 2010. On average in the European Union, LMP expenditure peaked at 2.124%
this year. There was a significant decrease compared to the previous year in Estonia, Denmark,
and Belgium; furthermore, to a lesser extent in Lithuania, Latvia, Luxembourg, Austria and
Bulgaria.
Figure 3 LMP expenditure by percentage of GDP and unemployment rate (2008–2010)
Source: Own editing by Eurostat data
After 2010, labour market expenditures as a share of GDP decreased with differences by
Member State, but gradually at the EU level, and according to EUROSTAT data, by 2018, the
EU as a whole fell below the pre-crisis level (Fig. 4). The significant variance in the expenditure
ratio is due to the values of the following Member States:
− Over 2%: France (2.84%), Denmark (2.80%), Finland (2.18%), Spain (2.15%),
Belgium (2.15%) and Austria (2.07%)
− Less than 0.5%: Romania (0.09%), Malta (0.35%) and the Czech Republic (0.46%).
-2
-1
0
1
2
3
4
5
6
7
8
9
10
-2
-1
0
1
2
3
4
5
6
7
8
9
10
LU
DE
NL
HR
BE
MT IT PL
RO
BG
AT
FR SI CY
EL
UK FI
EU
28 PT
CZ
HU SE SK DK IE ES
LT
EE
LV
Cha
nge
in u
nem
plo
ymen
t ra
te
2008
–200
9, %
poin
t
LM
P e
xpen
ditu
re b
y %
of
GD
P,
2008
–201
0
2008 2009 2010 ∆ 2008-2009 Unemployment rate
Győri, T.
14
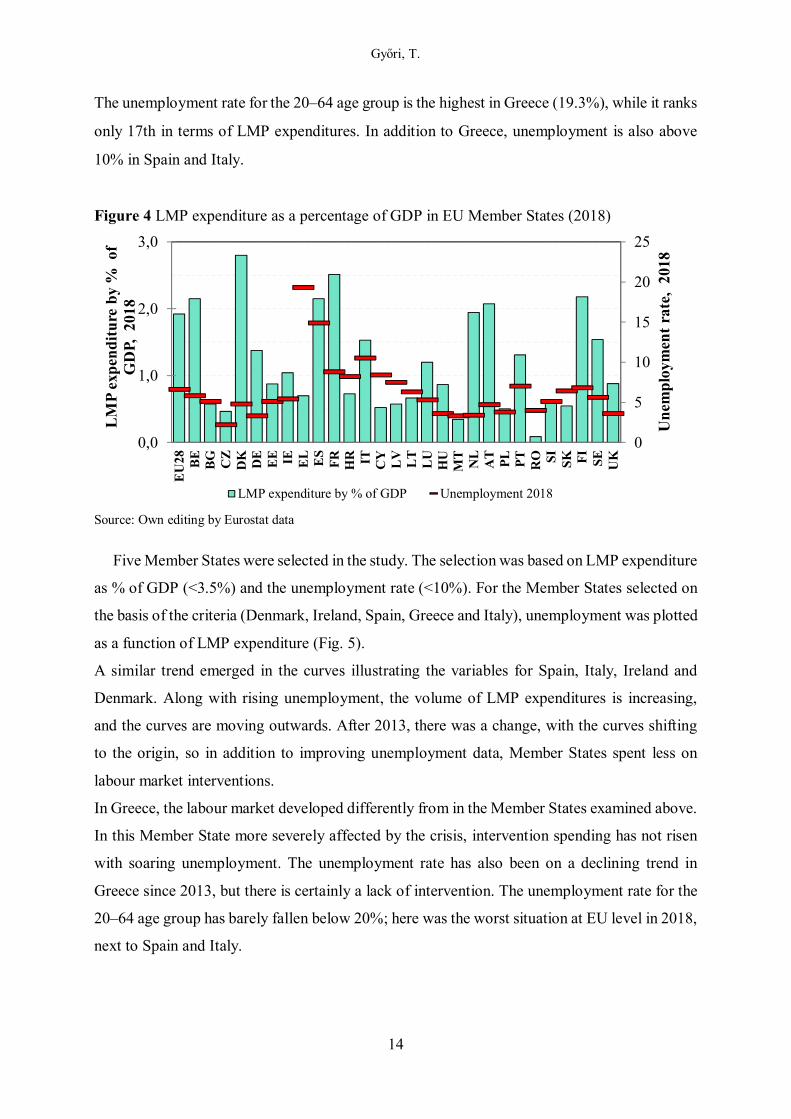
The unemployment rate for the 20–64 age group is the highest in Greece (19.3%), while it ranks
only 17th in terms of LMP expenditures. In addition to Greece, unemployment is also above
10% in Spain and Italy.
Figure 4 LMP expenditure as a percentage of GDP in EU Member States (2018)
Source: Own editing by Eurostat data
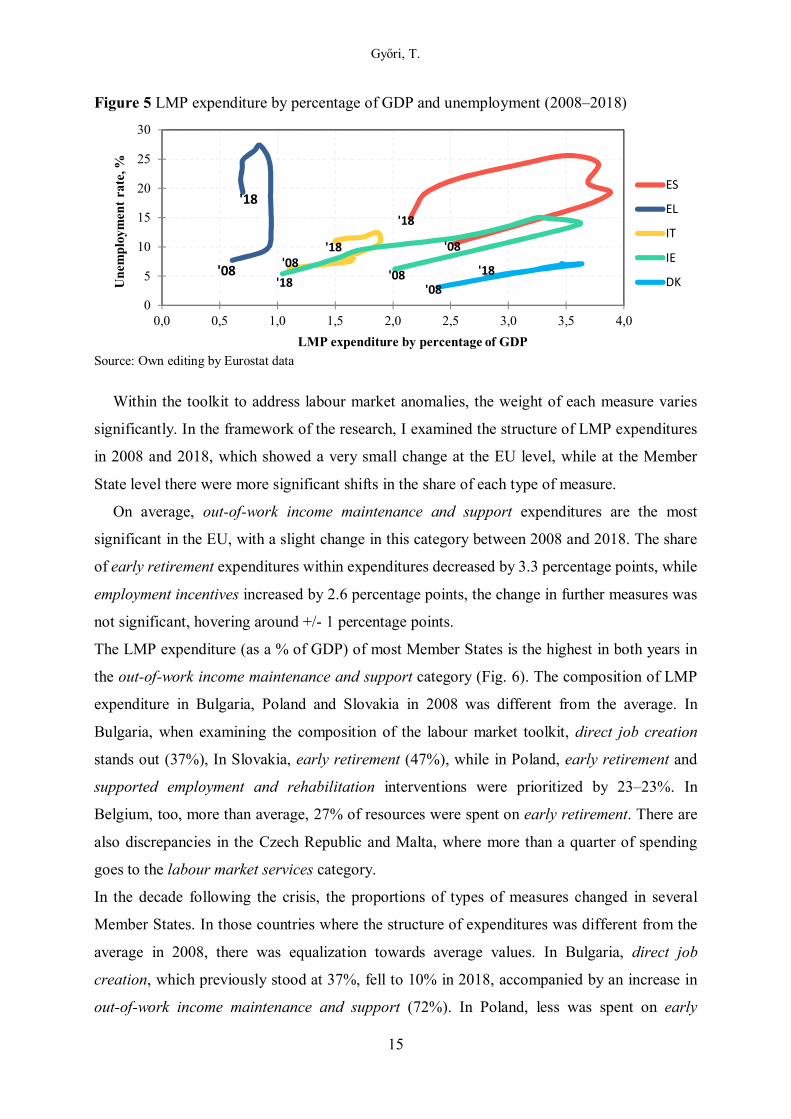
Five Member States were selected in the study. The selection was based on LMP expenditure
as % of GDP (<3.5%) and the unemployment rate (<10%). For the Member States selected on
the basis of the criteria (Denmark, Ireland, Spain, Greece and Italy), unemployment was plotted
as a function of LMP expenditure (Fig. 5).
A similar trend emerged in the curves illustrating the variables for Spain, Italy, Ireland and
Denmark. Along with rising unemployment, the volume of LMP expenditures is increasing,
and the curves are moving outwards. After 2013, there was a change, with the curves shifting
to the origin, so in addition to improving unemployment data, Member States spent less on
labour market interventions.
In Greece, the labour market developed differently from in the Member States examined above.
In this Member State more severely affected by the crisis, intervention spending has not risen
with soaring unemployment. The unemployment rate has also been on a declining trend in
Greece since 2013, but there is certainly a lack of intervention. The unemployment rate for the
20–64 age group has barely fallen below 20%; here was the worst situation at EU level in 2018,
next to Spain and Italy.
0
5
10
15
20
25
0,0
1,0
2,0
3,0
EU
28 BE
BG
CZ
DK
DE
EE IE EL ES
FR
HR IT CY
LV
LT
LU
HU
MT
NL
AT
PL
PT
RO SI SK FI
SE UK
Un
emp
loym
ent
rate
, 20
18
LM
P ex
pen
dit
ure
by
% o
f G
DP,
201
8
LMP expenditure by % of GDP Unemployment 2018
Győri, T.
15
Figure 5 LMP expenditure by percentage of GDP and unemployment (2008–2018)
Source: Own editing by Eurostat data
Within the toolkit to address labour market anomalies, the weight of each measure varies
significantly. In the framework of the research, I examined the structure of LMP expenditures
in 2008 and 2018, which showed a very small change at the EU level, while at the Member
State level there were more significant shifts in the share of each type of measure.
On average, out-of-work income maintenance and support expenditures are the most
significant in the EU, with a slight change in this category between 2008 and 2018. The share
of early retirement expenditures within expenditures decreased by 3.3 percentage points, while
employment incentives increased by 2.6 percentage points, the change in further measures was
not significant, hovering around +/- 1 percentage points.
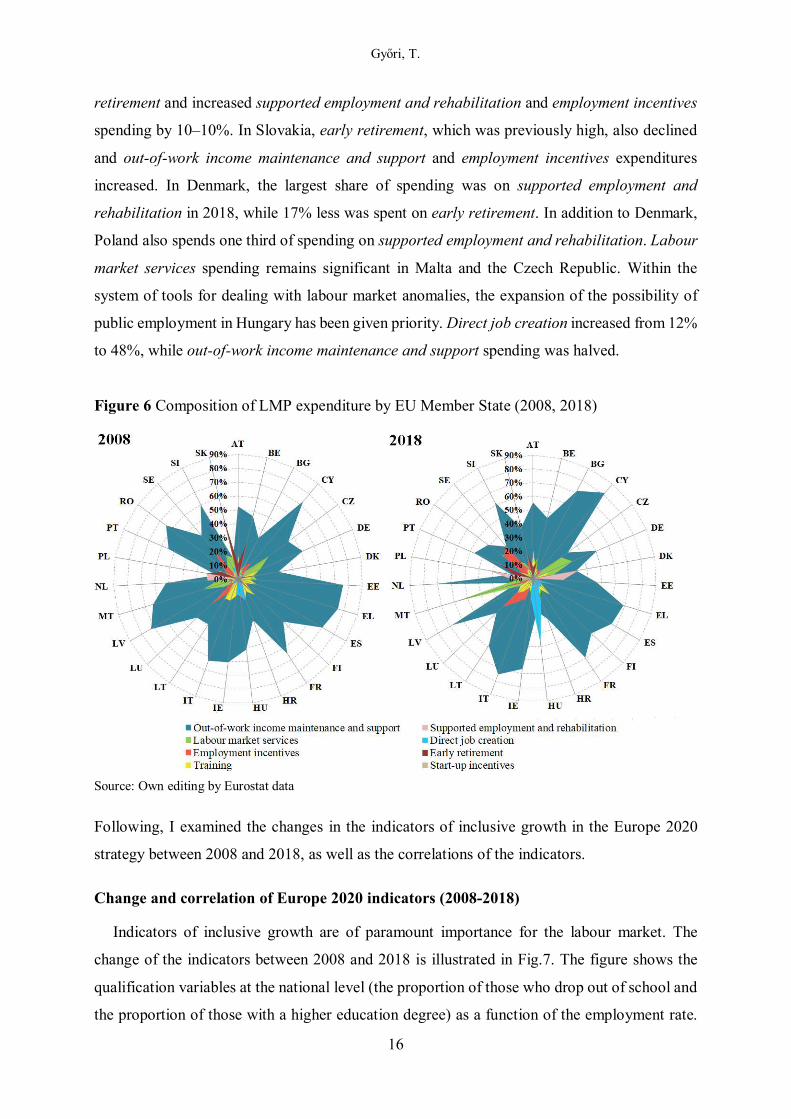
The LMP expenditure (as a % of GDP) of most Member States is the highest in both years in
the out-of-work income maintenance and support category (Fig. 6). The composition of LMP
expenditure in Bulgaria, Poland and Slovakia in 2008 was different from the average. In
Bulgaria, when examining the composition of the labour market toolkit, direct job creation
stands out (37%), In Slovakia, early retirement (47%), while in Poland, early retirement and
supported employment and rehabilitation interventions were prioritized by 23–23%. In
Belgium, too, more than average, 27% of resources were spent on early retirement. There are
also discrepancies in the Czech Republic and Malta, where more than a quarter of spending
goes to the labour market services category.
In the decade following the crisis, the proportions of types of measures changed in several
Member States. In those countries where the structure of expenditures was different from the
average in 2008, there was equalization towards average values. In Bulgaria, direct job
creation, which previously stood at 37%, fell to 10% in 2018, accompanied by an increase in
out-of-work income maintenance and support (72%). In Poland, less was spent on early
'08
'18
'08
'18
'08
'18
'08'18
'08
'18
0
5
10
15
20
25
30
0,0 0,5 1,0 1,5 2,0 2,5 3,0 3,5 4,0
Une
mpl
oym
ent
rate
, %
LMP expenditure by percentage of GDP
ES
EL
IT
IE
DK
Győri, T.
16
retirement and increased supported employment and rehabilitation and employment incentives
spending by 10–10%. In Slovakia, early retirement, which was previously high, also declined
and out-of-work income maintenance and support and employment incentives expenditures
increased. In Denmark, the largest share of spending was on supported employment and
rehabilitation in 2018, while 17% less was spent on early retirement. In addition to Denmark,
Poland also spends one third of spending on supported employment and rehabilitation. Labour
market services spending remains significant in Malta and the Czech Republic. Within the
system of tools for dealing with labour market anomalies, the expansion of the possibility of
public employment in Hungary has been given priority. Direct job creation increased from 12%
to 48%, while out-of-work income maintenance and support spending was halved.
Figure 6 Composition of LMP expenditure by EU Member State (2008, 2018)
Source: Own editing by Eurostat data
Following, I examined the changes in the indicators of inclusive growth in the Europe 2020
strategy between 2008 and 2018, as well as the correlations of the indicators.
Change and correlation of Europe 2020 indicators (2008-2018)
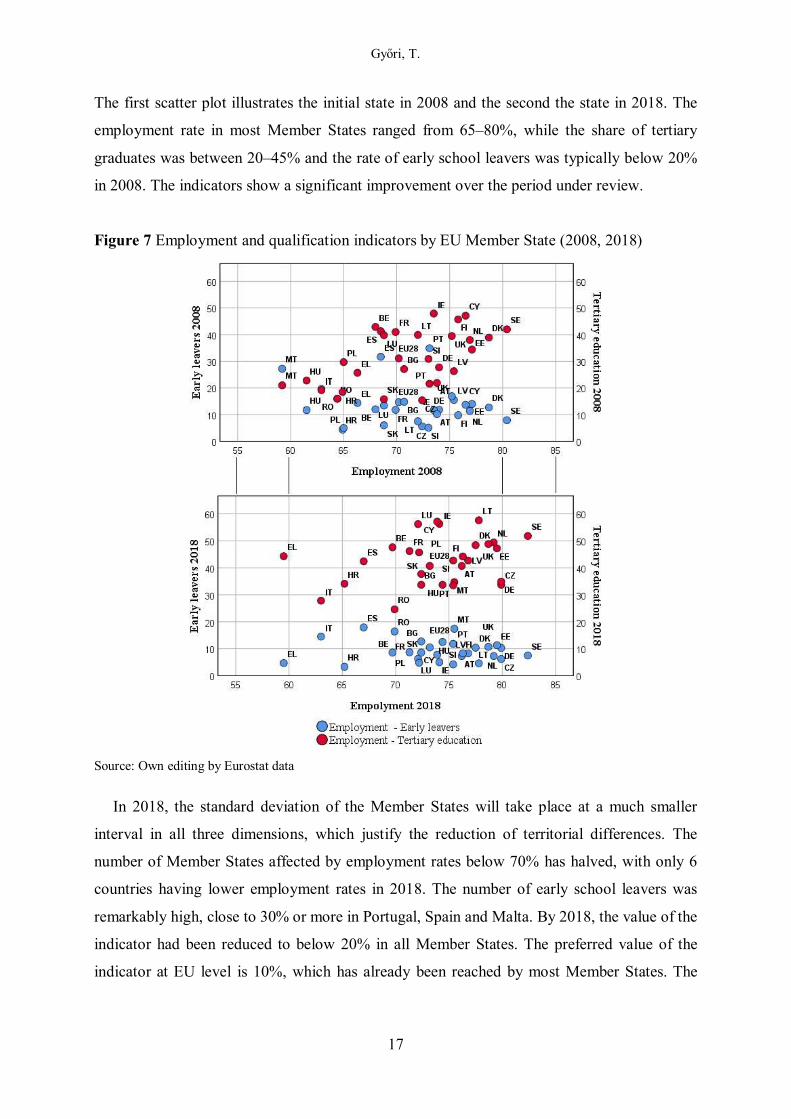
Indicators of inclusive growth are of paramount importance for the labour market. The
change of the indicators between 2008 and 2018 is illustrated in Fig.7. The figure shows the
qualification variables at the national level (the proportion of those who drop out of school and
the proportion of those with a higher education degree) as a function of the employment rate.
Győri, T.
17
The first scatter plot illustrates the initial state in 2008 and the second the state in 2018. The
employment rate in most Member States ranged from 65–80%, while the share of tertiary
graduates was between 20–45% and the rate of early school leavers was typically below 20%
in 2008. The indicators show a significant improvement over the period under review.
Figure 7 Employment and qualification indicators by EU Member State (2008, 2018)
Source: Own editing by Eurostat data
In 2018, the standard deviation of the Member States will take place at a much smaller
interval in all three dimensions, which justify the reduction of territorial differences. The
number of Member States affected by employment rates below 70% has halved, with only 6
countries having lower employment rates in 2018. The number of early school leavers was
remarkably high, close to 30% or more in Portugal, Spain and Malta. By 2018, the value of the
indicator had been reduced to below 20% in all Member States. The preferred value of the
indicator at EU level is 10%, which has already been reached by most Member States. The
Győri, T.
18
proportion of people with tertiary education has shifted upwards, ranging from 30–60% in 2018;
proportions below 30% were reported only from Italy and Romania.
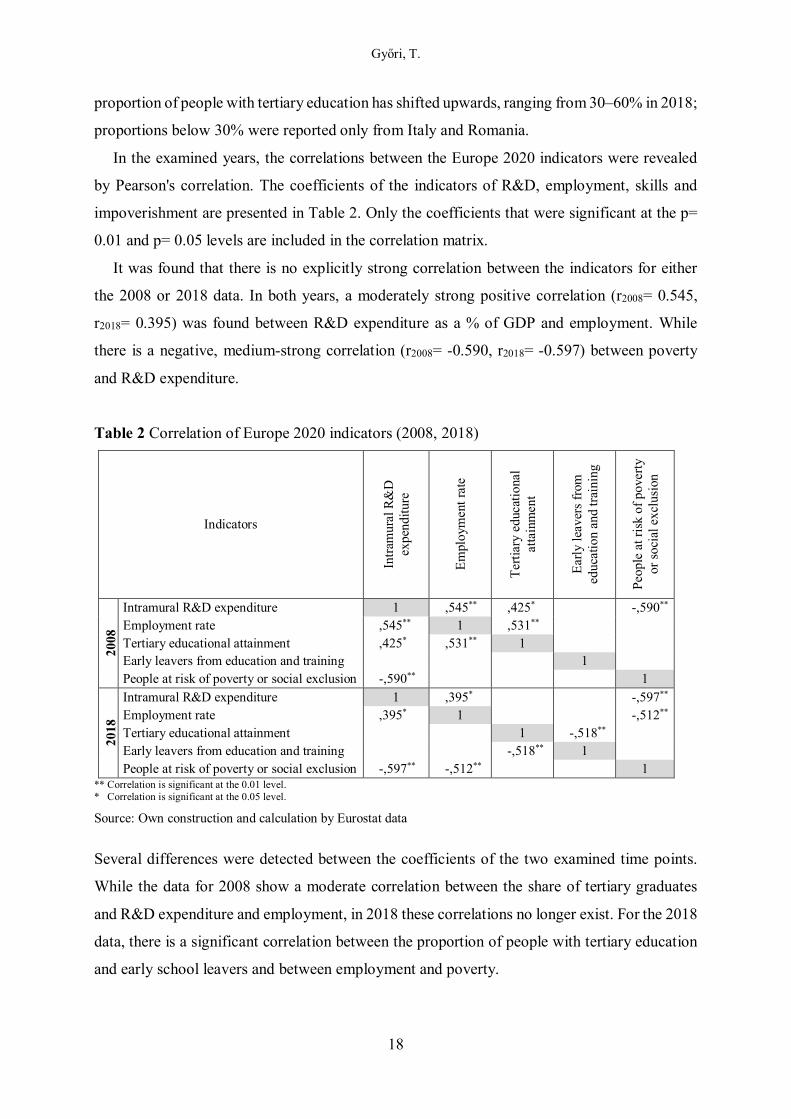
In the examined years, the correlations between the Europe 2020 indicators were revealed
by Pearson's correlation. The coefficients of the indicators of R&D, employment, skills and
impoverishment are presented in Table 2. Only the coefficients that were significant at the p=
0.01 and p= 0.05 levels are included in the correlation matrix.
It was found that there is no explicitly strong correlation between the indicators for either
the 2008 or 2018 data. In both years, a moderately strong positive correlation (r2008= 0.545,
r2018= 0.395) was found between R&D expenditure as a % of GDP and employment. While
there is a negative, medium-strong correlation (r2008= -0.590, r2018= -0.597) between poverty
and R&D expenditure.
Table 2 Correlation of Europe 2020 indicators (2008, 2018)
Indicators
Intr
amur
al R
&D
ex
pend
iture
Em
ploy
men
t rat
e
Ter
tiary
edu
cati
onal
at
tain
men
t
Ear
ly le
aver
s fr
om
educ
atio
n an
d tr
aini
ng
Peop
le a
t ris
k of
pov
erty
or
soc
ial e
xclu
sion
2008
Intramural R&D expenditure 1 ,545** ,425* -,590** Employment rate ,545** 1 ,531** Tertiary educational attainment ,425* ,531** 1 Early leavers from education and training 1 People at risk of poverty or social exclusion -,590** 1
2018
Intramural R&D expenditure 1 ,395* -,597** Employment rate ,395* 1 -,512** Tertiary educational attainment 1 -,518** Early leavers from education and training -,518** 1 People at risk of poverty or social exclusion -,597** -,512** 1
** Correlation is significant at the 0.01 level. * Correlation is significant at the 0.05 level.
Source: Own construction and calculation by Eurostat data
Several differences were detected between the coefficients of the two examined time points.
While the data for 2008 show a moderate correlation between the share of tertiary graduates
and R&D expenditure and employment, in 2018 these correlations no longer exist. For the 2018
data, there is a significant correlation between the proportion of people with tertiary education
and early school leavers and between employment and poverty.
Győri, T.
19
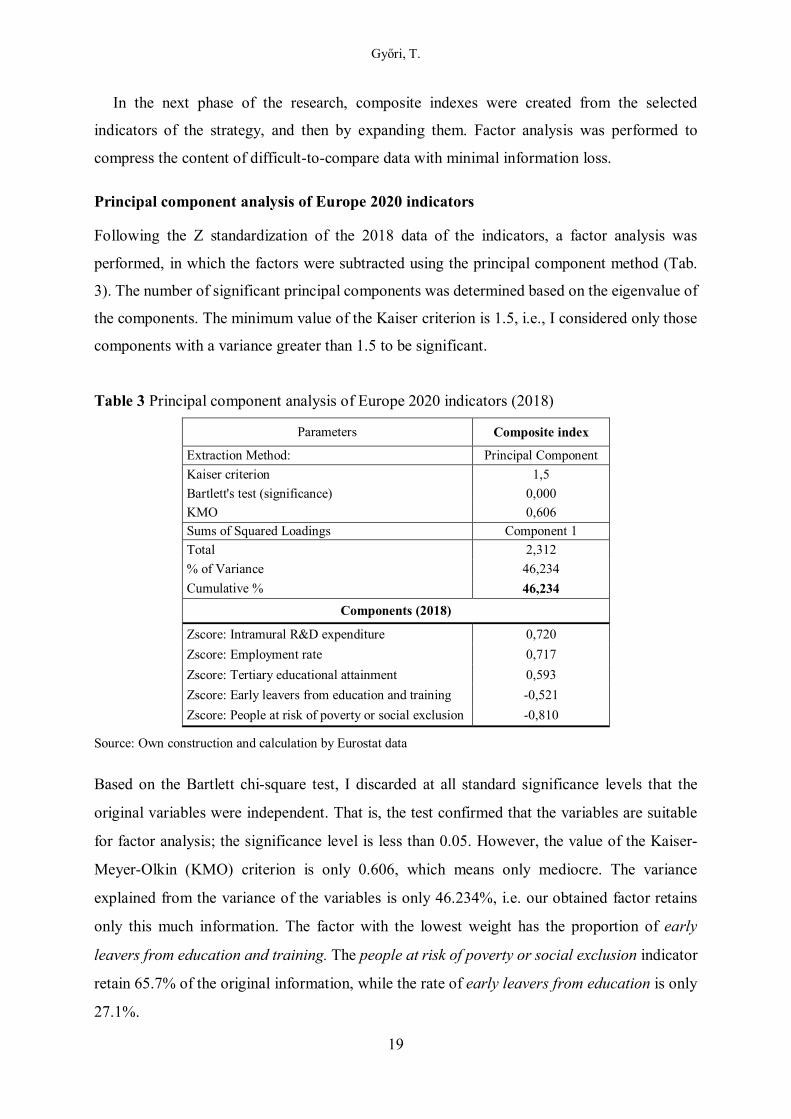
In the next phase of the research, composite indexes were created from the selected
indicators of the strategy, and then by expanding them. Factor analysis was performed to
compress the content of difficult-to-compare data with minimal information loss.
Principal component analysis of Europe 2020 indicators
Following the Z standardization of the 2018 data of the indicators, a factor analysis was
performed, in which the factors were subtracted using the principal component method (Tab.
3). The number of significant principal components was determined based on the eigenvalue of
the components. The minimum value of the Kaiser criterion is 1.5, i.e., I considered only those
components with a variance greater than 1.5 to be significant.
Table 3 Principal component analysis of Europe 2020 indicators (2018)
Parameters Composite index
Extraction Method: Principal Component
Kaiser criterion 1,5
Bartlett's test (significance) 0,000
KMO 0,606
Sums of Squared Loadings Component 1
Total 2,312
% of Variance 46,234
Cumulative % 46,234
Components (2018)
Zscore: Intramural R&D expenditure 0,720
Zscore: Employment rate 0,717
Zscore: Tertiary educational attainment 0,593
Zscore: Early leavers from education and training -0,521
Zscore: People at risk of poverty or social exclusion -0,810
Source: Own construction and calculation by Eurostat data
Based on the Bartlett chi-square test, I discarded at all standard significance levels that the
original variables were independent. That is, the test confirmed that the variables are suitable
for factor analysis; the significance level is less than 0.05. However, the value of the Kaiser-
Meyer-Olkin (KMO) criterion is only 0.606, which means only mediocre. The variance
explained from the variance of the variables is only 46.234%, i.e. our obtained factor retains
only this much information. The factor with the lowest weight has the proportion of early
leavers from education and training. The people at risk of poverty or social exclusion indicator
retain 65.7% of the original information, while the rate of early leavers from education is only
27.1%.
Győri, T.
20
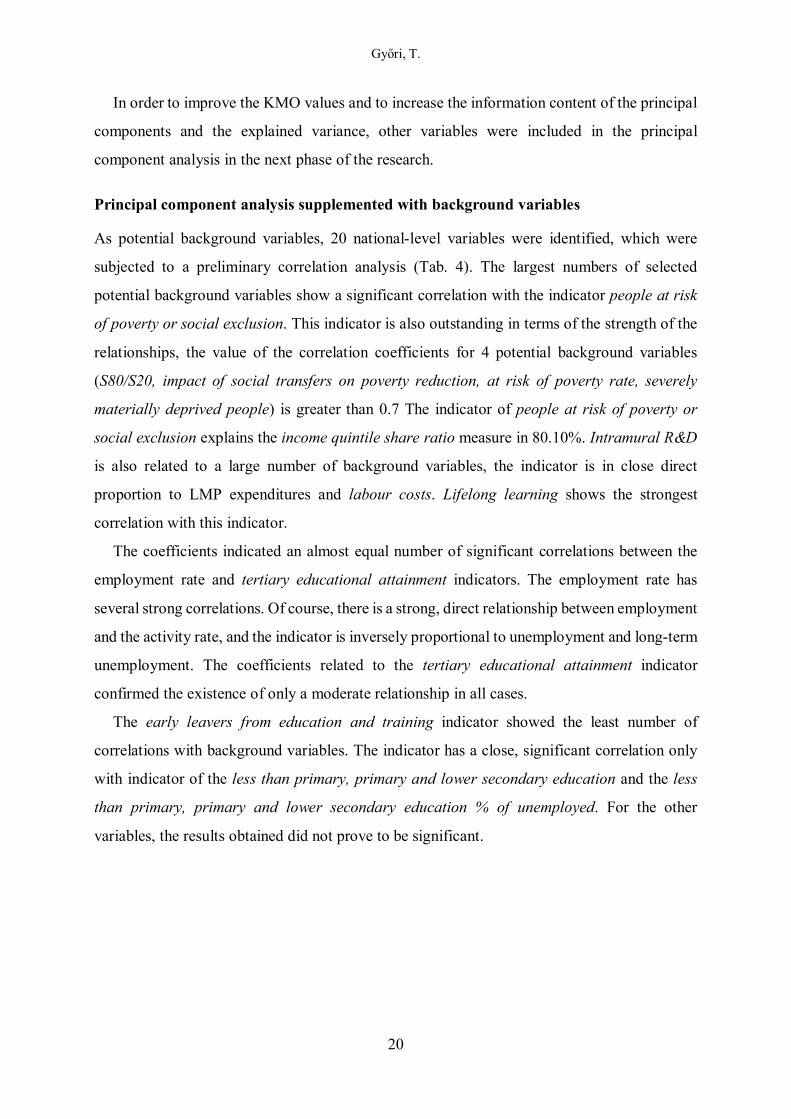
In order to improve the KMO values and to increase the information content of the principal
components and the explained variance, other variables were included in the principal
component analysis in the next phase of the research.
Principal component analysis supplemented with background variables
As potential background variables, 20 national-level variables were identified, which were
subjected to a preliminary correlation analysis (Tab. 4). The largest numbers of selected
potential background variables show a significant correlation with the indicator people at risk
of poverty or social exclusion. This indicator is also outstanding in terms of the strength of the
relationships, the value of the correlation coefficients for 4 potential background variables
(S80/S20, impact of social transfers on poverty reduction, at risk of poverty rate, severely
materially deprived people) is greater than 0.7 The indicator of people at risk of poverty or
social exclusion explains the income quintile share ratio measure in 80.10%. Intramural R&D
is also related to a large number of background variables, the indicator is in close direct
proportion to LMP expenditures and labour costs. Lifelong learning shows the strongest
correlation with this indicator.
The coefficients indicated an almost equal number of significant correlations between the
employment rate and tertiary educational attainment indicators. The employment rate has
several strong correlations. Of course, there is a strong, direct relationship between employment
and the activity rate, and the indicator is inversely proportional to unemployment and long-term
unemployment. The coefficients related to the tertiary educational attainment indicator
confirmed the existence of only a moderate relationship in all cases.
The early leavers from education and training indicator showed the least number of
correlations with background variables. The indicator has a close, significant correlation only
with indicator of the less than primary, primary and lower secondary education and the less
than primary, primary and lower secondary education % of unemployed. For the other
variables, the results obtained did not prove to be significant.
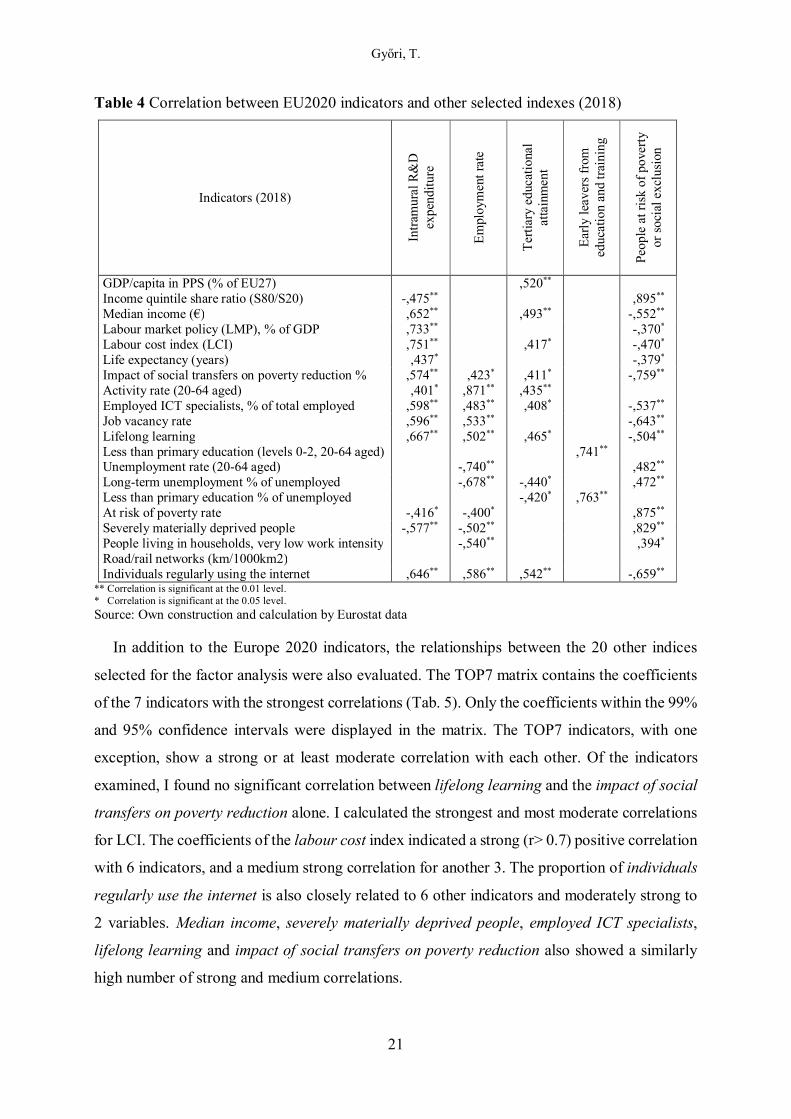
Győri, T.
21
Table 4 Correlation between EU2020 indicators and other selected indexes (2018)
Indicators (2018)
Intr
amur
al R
&D
ex
pend
iture
Em
ploy
men
t rat
e
Ter
tiary
edu
cati
onal
at
tain
men
t
Ear
ly le
aver
s fr
om
educ
atio
n an
d tr
aini
ng
Peop
le a
t ris
k of
pov
erty
or
soc
ial e
xclu
sion
GDP/capita in PPS (% of EU27) ,520** Income quintile share ratio (S80/S20) -,475** ,895** Median income (€) ,652** ,493** -,552** Labour market policy (LMP), % of GDP ,733** -,370* Labour cost index (LCI) ,751** ,417* -,470* Life expectancy (years) ,437* -,379* Impact of social transfers on poverty reduction % ,574** ,423* ,411* -,759** Activity rate (20-64 aged) ,401* ,871** ,435** Employed ICT specialists, % of total employed ,598** ,483** ,408* -,537** Job vacancy rate ,596** ,533** -,643** Lifelong learning ,667** ,502** ,465* -,504** Less than primary education (levels 0-2, 20-64 aged) ,741** Unemployment rate (20-64 aged) -,740** ,482** Long-term unemployment % of unemployed -,678** -,440* ,472** Less than primary education % of unemployed -,420* ,763** At risk of poverty rate -,416* -,400* ,875** Severely materially deprived people -,577** -,502** ,829** People living in households, very low work intensity -,540** ,394* Road/rail networks (km/1000km2) Individuals regularly using the internet ,646** ,586** ,542** -,659**
** Correlation is significant at the 0.01 level. * Correlation is significant at the 0.05 level.
Source: Own construction and calculation by Eurostat data
In addition to the Europe 2020 indicators, the relationships between the 20 other indices
selected for the factor analysis were also evaluated. The TOP7 matrix contains the coefficients
of the 7 indicators with the strongest correlations (Tab. 5). Only the coefficients within the 99%
and 95% confidence intervals were displayed in the matrix. The TOP7 indicators, with one
exception, show a strong or at least moderate correlation with each other. Of the indicators
examined, I found no significant correlation between lifelong learning and the impact of social
transfers on poverty reduction alone. I calculated the strongest and most moderate correlations
for LCI. The coefficients of the labour cost index indicated a strong (r> 0.7) positive correlation
with 6 indicators, and a medium strong correlation for another 3. The proportion of individuals
regularly use the internet is also closely related to 6 other indicators and moderately strong to
2 variables. Median income, severely materially deprived people, employed ICT specialists,
lifelong learning and impact of social transfers on poverty reduction also showed a similarly
high number of strong and medium correlations.
Győri, T.
22
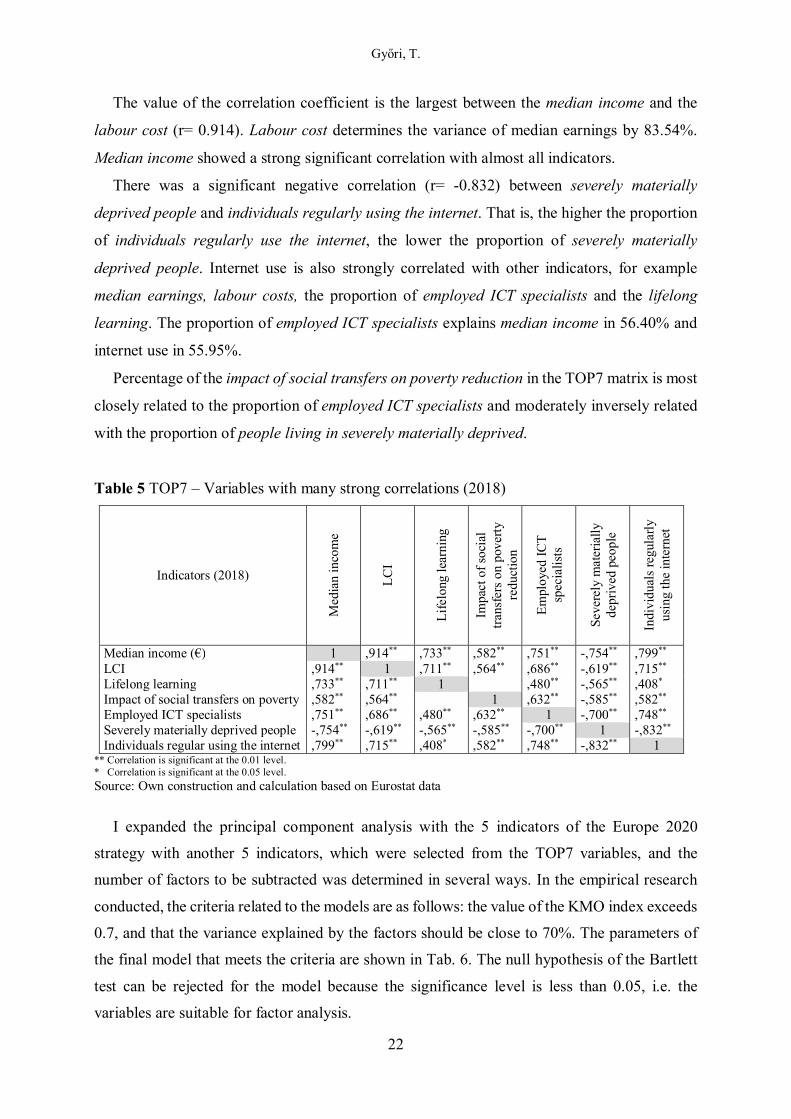
The value of the correlation coefficient is the largest between the median income and the
labour cost (r= 0.914). Labour cost determines the variance of median earnings by 83.54%.
Median income showed a strong significant correlation with almost all indicators.
There was a significant negative correlation (r= -0.832) between severely materially
deprived people and individuals regularly using the internet. That is, the higher the proportion
of individuals regularly use the internet, the lower the proportion of severely materially
deprived people. Internet use is also strongly correlated with other indicators, for example
median earnings, labour costs, the proportion of employed ICT specialists and the lifelong
learning. The proportion of employed ICT specialists explains median income in 56.40% and
internet use in 55.95%.
Percentage of the impact of social transfers on poverty reduction in the TOP7 matrix is most
closely related to the proportion of employed ICT specialists and moderately inversely related
with the proportion of people living in severely materially deprived.
Table 5 TOP7 – Variables with many strong correlations (2018)
Indicators (2018)
Med
ian
inco
me
LC
I
Lif
elon
g le
arni
ng
Impa
ct o
f so
cial
tr
ansf
ers
on p
over
ty
redu
ctio
n
Em
ploy
ed I
CT
sp
ecia
lists
Seve
rely
mat
eria
lly
depr
ived
peo
ple
Indi
vidu
als
regu
larl
y us
ing
the
inte
rnet
Median income (€) 1 ,914** ,733** ,582** ,751** -,754** ,799** LCI ,914** 1 ,711** ,564** ,686** -,619** ,715** Lifelong learning ,733** ,711** 1 ,480** -,565** ,408* Impact of social transfers on poverty ,582** ,564** 1 ,632** -,585** ,582** Employed ICT specialists ,751** ,686** ,480** ,632** 1 -,700** ,748** Severely materially deprived people -,754** -,619** -,565** -,585** -,700** 1 -,832** Individuals regular using the internet ,799** ,715** ,408* ,582** ,748** -,832** 1
** Correlation is significant at the 0.01 level. * Correlation is significant at the 0.05 level.
Source: Own construction and calculation based on Eurostat data
I expanded the principal component analysis with the 5 indicators of the Europe 2020
strategy with another 5 indicators, which were selected from the TOP7 variables, and the
number of factors to be subtracted was determined in several ways. In the empirical research
conducted, the criteria related to the models are as follows: the value of the KMO index exceeds
0.7, and that the variance explained by the factors should be close to 70%. The parameters of
the final model that meets the criteria are shown in Tab. 6. The null hypothesis of the Bartlett
test can be rejected for the model because the significance level is less than 0.05, i.e. the
variables are suitable for factor analysis.
Győri, T.
23
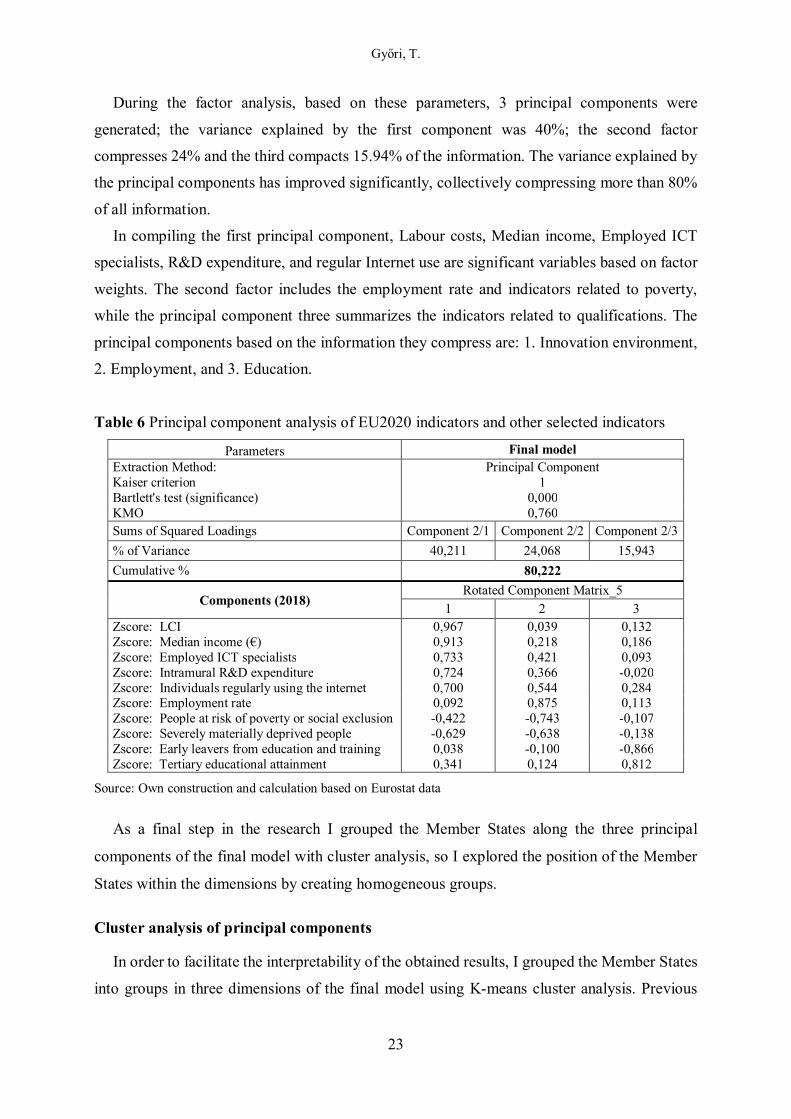
During the factor analysis, based on these parameters, 3 principal components were
generated; the variance explained by the first component was 40%; the second factor
compresses 24% and the third compacts 15.94% of the information. The variance explained by
the principal components has improved significantly, collectively compressing more than 80%
of all information.
In compiling the first principal component, Labour costs, Median income, Employed ICT
specialists, R&D expenditure, and regular Internet use are significant variables based on factor
weights. The second factor includes the employment rate and indicators related to poverty,
while the principal component three summarizes the indicators related to qualifications. The
principal components based on the information they compress are: 1. Innovation environment,
2. Employment, and 3. Education.
Table 6 Principal component analysis of EU2020 indicators and other selected indicators
Parameters Final model Extraction Method: Principal Component Kaiser criterion 1 Bartlett's test (significance) 0,000 KMO 0,760 Sums of Squared Loadings Component 2/1 Component 2/2 Component 2/3
% of Variance 40,211 24,068 15,943
Cumulative % 80,222
Components (2018) Rotated Component Matrix_5
1 2 3 Zscore: LCI 0,967 0,039 0,132 Zscore: Median income (€) 0,913 0,218 0,186 Zscore: Employed ICT specialists 0,733 0,421 0,093 Zscore: Intramural R&D expenditure 0,724 0,366 -0,020 Zscore: Individuals regularly using the internet 0,700 0,544 0,284 Zscore: Employment rate 0,092 0,875 0,113 Zscore: People at risk of poverty or social exclusion -0,422 -0,743 -0,107 Zscore: Severely materially deprived people -0,629 -0,638 -0,138 Zscore: Early leavers from education and training 0,038 -0,100 -0,866 Zscore: Tertiary educational attainment 0,341 0,124 0,812
Source: Own construction and calculation based on Eurostat data
As a final step in the research I grouped the Member States along the three principal
components of the final model with cluster analysis, so I explored the position of the Member
States within the dimensions by creating homogeneous groups.
Cluster analysis of principal components
In order to facilitate the interpretability of the obtained results, I grouped the Member States
into groups in three dimensions of the final model using K-means cluster analysis. Previous

Győri, T.
24
hierarchical cluster analysis and structure exploration analysis identified 4 clusters. Detailed
test results and descriptive statistics for clusters are shown in Table 7.
Based on the F-test and p significance level in the ANOVA table, the distinctive power of
the principal components was found to be significant over a 99% confidence interval. The
Kruskal-Wallis Test performed as an alternative to the test also gave the same result. The ETA
values calculated for the nominal index of the cluster confirmed the close positive correlation
between the individual principal components and the formed clusters, the quotient of the sum
of squares of the total difference between groups value was higher than 0.7 in all dimensions.
Based on the within-group variance, the formed clusters can be considered homogeneous in the
proportion of 83.33%. The standard deviation in 2 cases slightly exceeded the total standard
deviation.
Table 7 Summary statistical table of cluster analysis
Analysis of variance Innovation
environment Employment Education
F-test 18,671 7,821 22,791 Significance 0,000 0,001 0,000 Kruskal-Wallis Test 18,405 14,362 21,299 Asymptotic Significance 0,000 0,002 0,000 ETA 0,832 0,701 0,856
Descriptive statistics of clusters Innovation
environment Employment Education
Mean (Final Cluster Centres)
1 1,032 0,238 0,106 2 -0,713 -0,400 1,081 3 -0,323 -1,262 -1,438 4 -0,726 0,938 -0,678
Std. Deviation
1 0,400 0,633 0,566 2 0,561 1,094 0,483 3 1,147 0,384 0,441 4 0,422 0,567 0,645
Source: Own editing by own calculation
Clusters were interpreted based on a comparison of dimension means. The first cluster
included 10 Member States and the EU28, the second 8 country, the third 4 country and the
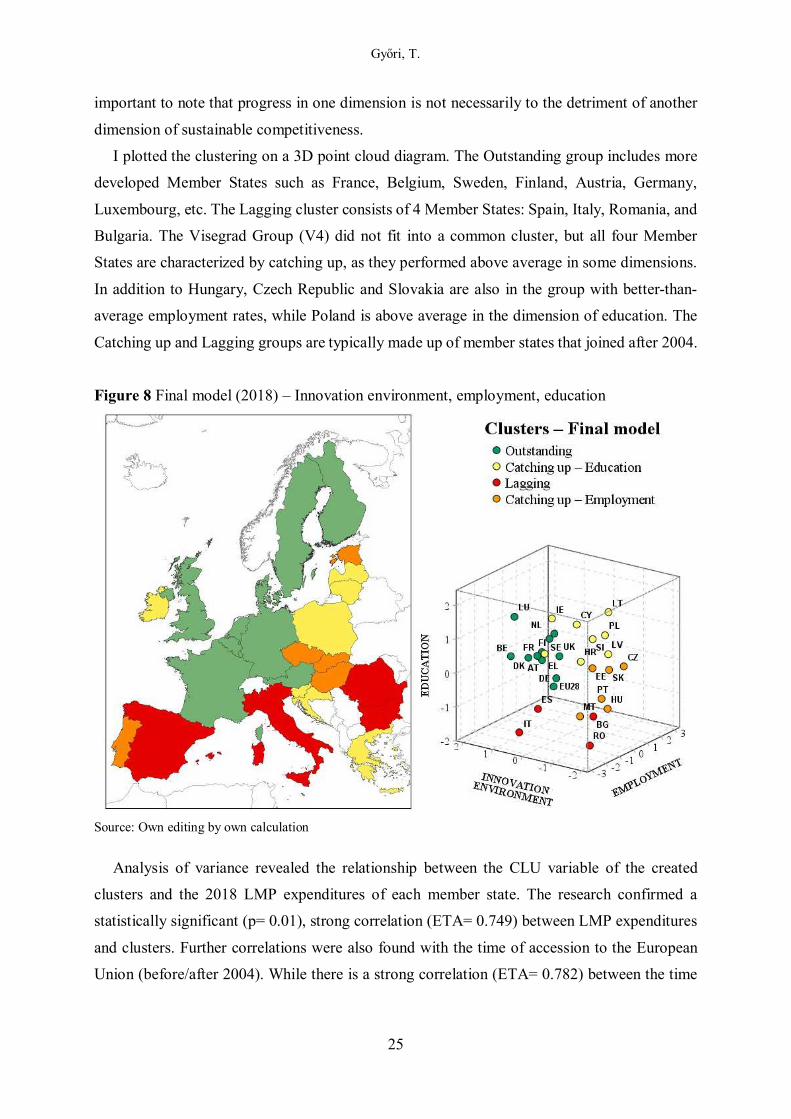
fourth 6 countries (Fig. 8). I named the clusters based on their relationship to each dimension.
The Member States in the first cluster also perform above average in terms of the innovation
environment, employment and education, which is why I named the cluster Outstanding. The
second cluster consists of countries with above-average levels of education (Catching up –
Education) but with below-average levels in the other two dimensions. The third group includes
countries that remained below average for all three composite indicators, so the group was
named Lagging. The fourth cluster includes countries where employment is above average
(Catching up – Employment) but the innovation environment and qualifications are lower. It is
Győri, T.
25
important to note that progress in one dimension is not necessarily to the detriment of another
dimension of sustainable competitiveness.
I plotted the clustering on a 3D point cloud diagram. The Outstanding group includes more
developed Member States such as France, Belgium, Sweden, Finland, Austria, Germany,
Luxembourg, etc. The Lagging cluster consists of 4 Member States: Spain, Italy, Romania, and
Bulgaria. The Visegrad Group (V4) did not fit into a common cluster, but all four Member
States are characterized by catching up, as they performed above average in some dimensions.
In addition to Hungary, Czech Republic and Slovakia are also in the group with better-than-
average employment rates, while Poland is above average in the dimension of education. The
Catching up and Lagging groups are typically made up of member states that joined after 2004.
Figure 8 Final model (2018) – Innovation environment, employment, education
Source: Own editing by own calculation
Analysis of variance revealed the relationship between the CLU variable of the created
clusters and the 2018 LMP expenditures of each member state. The research confirmed a
statistically significant (p= 0.01), strong correlation (ETA= 0.749) between LMP expenditures
and clusters. Further correlations were also found with the time of accession to the European
Union (before/after 2004). While there is a strong correlation (ETA= 0.782) between the time
Győri, T.
26
of accession and LMP expenditures, a moderate (ETA= 0.590) correlation was shown in the
context of clusters.
DISCUSSION
The aim of the study was to explore the state of the structure of labour market interventions in
the context of unemployment after the 2008 crisis before the crisis (2008) and in a priority year
for crisis management (2018). In her study, Kálmán (2015) explains that social spending
increased after the crisis and that individual countries developed a differentiated system of tools
to deal with the general crisis in the labour market.
The research confirmed that expenditure on interventions increased significantly in 2009 and
has been gradually declining at EU level after 2010. In general, spending has increased
significantly in those Member States where unemployment has risen sharply (Lithuania,
Estonia, Latvia, Spain and Ireland). With the exception of Greece, which has been hit harder by
the crisis, where intervention spending has not increased, despite a sharp rise in unemployment.
By 2018, the shares of measure types changed in several Member States compared to the pre-
crisis composition. In those countries where the structure of expenditures was different from
the average in 2008, there was equalization towards average values. However, in several
Member States a different type of measure was prioritized than in the previous period. In
Hungary, the expansion of public employment opportunities was given priority, so direct job
creation increased from the previous 12% to 48%, while out-of-work income maintenance and
support expenditures were halved.
The objectives of the Europe 2020 strategy were set on the basis of the factor influencing
economic growth. According to Jankó (2010), the most important element of the long-term
solution of economic problems is to increase the education of the population. In their study,
Mankiw, Romer & Weil (1992) highlight that several research have already demonstrated a
positive correlation between GDP per capita and human capital. The relationship between
economic development and human capital was also confirmed by the analysis, although only at
a moderate strength. In connection with the education of the population were included the
indicators tertiary educational attainment and early leavers from education and training in the
research. The proportion of people with tertiary education showed a moderate, positive
correlation with employment and R&D expenditure. The correlation analysis of other
background variables also confirmed a moderate, positive correlation (r2008= 0.481, r2018=
0.520) between the ratio of tertiary graduates and GDP/capita in PPS (% of EU27) in both years.
Győri, T.
27
According to the Employment Report of the Commission and the Council (European
Commission, 2018/a), the reform efforts introduced in the EU have contributed to job-creating
economic growth.
The analysis carried out supports the above statement, although it should be noted that the
achievement of the targets set in the Europe 2020 strategy is very diverse at the national level.
The key indicators improved significantly between 2008 and 2018. A striking positive change
can be observed in the field of employment, the employment rate for the 20–64 age group
shifted predominantly to 70–85% by 2018. The proportion of people with tertiary education has
also risen and is concentrated around 30–60%, creating a more coherent picture. Overall, the
rate of early school leavers also improved compared to 2008 and was around 10% in most
Member States.
CONCLUSION
The variance explained by the single composite index resulting from the 2018 data of the
Europe 2020 indicators is only 46.234%. Thus, the composite index cannot be considered
suitable for a significant compression of the information content of the indicators. The 3 main
components of the final model developed with the inclusion of other background variables
compress a significant part of the information, 80.222%. In the clusters formed along the
dimensions of the final model (Education, Employment, Innovation environment); the member
states were well separated based on their differences in development (Outstanding, Catching up
and Lagging). Overall, the countries of the Outstanding group are characterized by
development, the countries of the Lagging cluster are characterized by lagging behind, and the
Catching up groups are characterized by catching up. The three dimensions (Education,
Employment, Innovation environment) are interacting. However, synergy between dimensions
does not mean that progress in one dimension can only be at the expense of the other two
dimensions.
In the Catching up – Employment group (e.g. Czech Republic, Slovakia and Hungary);
economic growth was mainly extensive, based on a significant increase in employment. In order
to catch up more quickly with more developed countries the quality of resources (human
capital) also needs to be improved. The Catching up – Education group (e.g. Poland, Latvia,
Lithuania) moved towards the development of human capital, where the qualification indicators
were better than average in 2018.
A correlation can be found in several Member States between the 2018 LMP expenditures
and the established clusters. LMP expenditures in 2018 are typically the lowest in East-Central
Győri, T.
28
Europe member states (Romania, Czech Republic, Poland, Slovakia, and Bulgaria). In general,
it was below 1% in the Member States that joined the European Union after 2004.
In the context of clusters, it can be declared that those Member States where LMP expenditure
as a proportion of GDP below 1% (countries joining after 2004) typically belong to the Catching
up and Lagging clusters. Lagging group's 2018 LMP expenditures show significant
discrepancies. While Romania and Bulgaria are among the 10 least spending Member States,
Italy and Spain have labour market interventions in proportion to GDP are more significant.
The members of the Outstanding group which joined before 2004 typically have higher LMP
expenditures due to their more developed economic situation. The exceptions are Italy (1958),
Greece (1981) and Spain (1986), which joined the Union very early, yet were among the lagging
economies in 2018. Despite the fact that LMP expenditures in Spain is 2.15%, which much
higher than average and also in Italy it was well above 1%. In Greece, LMP spending is low
despite very high unemployment. The unemployment rate for the 20–64 age group fell to just
fewer than 20% by 2018, with next to Spain and Italy being the worst off at EU level in this
respect.
Strengthening territorial cohesion is an important element of the Europe 2020 strategy; in
this context, they seek to extend the benefits of economic growth to peripheral areas. In the
period under review, a small degree of equalization between the indicators can be observed,
which, with the reduction of territorial differences, has the effect of strengthening cohesion.
Overall, the EU has the capacity to act in times of crisis and to adapt its economies and
societies to change. The experience gained during crisis management can be used to plan for
dealing with recessions in the near future. Europeans today must once again prepare for
transformation in order to cope with the effects of crises, overcome the EU's structural
weaknesses and growing global challenges. It is indisputable that the coronavirus epidemic that
will appear in 2019 will have an impact on the economy of the European Union. As a result of
the economic recession caused by the epidemic, meeting more of the Europe 2020 targets will
be an even greater challenge for Member States.
REFERENCES
Allison, P. (1999). Multiple Imputation for Missing Data: A Cautionary Tale. Sociological Methods & Research, 28(3), 301-309. DOI: 10.1177/0049124100028003003.
Allison, P. (2003). ‘Missing data techniques for structural equation models’. Journal of Abnormal Psychology, 112(4), 545–557. DOI: 10.1037/0021-843X.112.4.545112
Arsham, H. & Lovric, M. (2011). Bartlett's Test. In: Lovric M. (eds.), International Encyclopedia of Statistics Science, Springer, Berlin, Heidelberg. DOI: https://doi.org/10.1007/978-3-642-04898-2_132
Győri, T.
29
Bansal, Arpit & Sharma, Mayur & Goel, Shalini. (2017). Improved K-mean Clustering Algorithm for Prediction Analysis using Classification Technique in Data Mining. International Journal of Computer Applications, 157(6), 35-40. DOI: 10.5120/ijca2017912719.
Bardhoshi, G., Um, B. & Erford, B. T. (2021). Conducting a Cluster Analysis in Counseling Research: Four Easy Steps. Counseling Outcome Research and Evaluation, 12(1), 54-62. DOI: 10.1080/21501378.2020.1768522
Birkner, Z., Peter, E. & Fehérvölgyi, B. (2012). A possible approach of the concept of ‘GLOCAL’ through innovation. Deturope, 4(3), 4-21.
Bottlik, Zs. (2008). A regionális és etnikai különbségek összefüggései Bulgáriában az ezredfordulón. Területi Statisztika, 48(3), 334-343. DOI: https://doi.org/10.1007/978-3-642-04898-2_132
Breslow, N. (1970). A generalized Kruskal-Wallis test for comparing K samples subject to unequal patterns of censorship. Biometrika, 57(3), 579–594. DOI: https://doi.org/10.1093/biomet/57.3.579
Capello, R. (2007). A forecasting territorial model of regional growth: the MASST model. The Annals of Regional Science, 41(4), 753–787. Retrieved February 20, 2021, from http://doi.org/c5wxvk DOI: 10.1007/s00168-007-0146-2.
Cattell, R. B. & Vogelmann, S. (1977). A comprehensive trial of the scree and KG criteria for determining the number of factors. Multivariate Behavioral Research, 12(3), 289–325. DOI: https://doi.org/10.1207/s15327906mbr1203_2
Chung, S. & Cai, L. (2018). Alternative Multiple Imputation Inference for Categorical Structural Equation Modeling. Multivariate Behavioral Research, 54(3), 323-337. DOI: 10.1080/00273171.2018.1523000
Diez Roux, A. V., Borrell, L. N., Haan, M., Jackson, S. A. & Schultz, R. (2004). Neighbourhood environments and mortality in an elderly cohort: Results from the cardiovascular health study. Journal of Epidemiology & Community Health, 58, 917–923. DOI: https://doi.org/10.1136/jech.2003.019596
Egri, Z., Törőcsik, V. & Tánczos, T. (2009). Regional HDI as a territorial and social differentiation index in Central Europe. In Káposzta J. (eds.), New elements and research in spatial economy, 167-180.
Egri, Z. (2017). Regional health inequalities in the European macroregion from the East Central European perspective. Regional Statistics, 7(1), 197-224.
European Commission (2010). Labour market and wage developments in 2009. In: European Economy, Brussels. DOI:10.2765/36582
European Commission (2013). Sustainable development in the European Union — 2013 monitoring report of the EU sustainable development strategy. Eurostat Statistical Books. Luxembourg: Publications Office of the European Union. ISBN 978-92-79-31155-0 DOI: 10.2785/11549
European Commission (2018/a). Draft joint employment report from the Commission and the Council. Retrieved September 27, 2021, from https://eur-lex.europa.eu/legal-content/EN/TXT/PDF/?uri=CELEX:52018DC0761&from =EN
European Commission (2018/b). Labour market policy statistics – Methodology 2018. Luxembourg: Publications Office of the European Union. ISBN 978-92-79-91299-3 DOI: 10.2767/291515
European Commission (2020). Proposal for a joint employment report from the Commission and the Council. Retrieved September 27, 2021, from https://eur-lex.europa.eu/resource.html?uri=cellar:d5c1e490-29b7-11eb-9d7e-01aa75ed71 a1.0001.02/DOC_1&format=PDF
Győri, T.
30
Ékes, I. (2011). Foglalkoztatás és munkahelybővítés - nemzetközi kitekintéssel. Statisztikai Szemle, 86(10-11), 970-994.
Fabrigar, L. R., Wegener, D. T., MacCallum, R. C., & Strahan, E. J. (1999). Evaluating the use of exploratory factor analysis in psychological research. Psychological Methods, 4(3), 272‐299.
Ginkel, J. R. V., Kroonenberg, P. M. & Kiers H. A. L. (2014). Missing data in principal component analysis of questionnaire data: a comparison of methods, Journal of Statistical Computation and Simulation, 84(11), 2298-2315, DOI: 10.1080/00949655.2013.788654
Hajdú, D. (2020). A munkanélküliség és felnőttképzés területi eloszlása az Észak-magyarországi régióban. Észak-magyarországi Stratégiai Füzetek, 17(2), 62-69. DOI: https://doi.org/10.32976/stratfuz.2020.14
Hakstian, A. R., & Muller, V. J. (1973). Some notes on the number of factors problem. Multivariate Behavioral Research, 8(4), 461-475. DOI: https://doi.org/10.1207/s15327906mbr0804_4
Harper, J. F. (1984). Peritz' F test: Basic program of a robust multiple comparison test for statistical analysis of all differences among group means. Computers in Biology and Medicine, 14(4), 437-445. DOI: https://doi.org/10.1016/0010-4825(84)90044-1.
Jankó, B. (2010). A tudás szerepe a gazdasági növekedésben — az alapmodellek bemutatása. Statisztikai Szemle, 88(1), 47-72.
Jolliffe, I. T. (2005). Principal component analysis. 2nd ed. John Wiley & Sons. New York. DOI: 10.1002/0470013192.bsa501
Jolliffe, I. T. & Cadima, J. (2016). Principal component analysis: a review and recent developments. Philosophical Transactions of the Royal Society, 374(2065), 1-16. DOI: http://dx.doi.org/10.1098/rsta.2015.0202
Kaiser, H. F. (1960). The application of electronic computers to factoranalysis. Educational and Psychological Measurement, 20, 141–151. DOI: http://dx.doi.org/10.1177/001316446002000116
Kaiser, H. F. (1981). A revised measure of sampling adequacy for factor‐analytic data matrices. Educational and Psychological Measurement, 41(2), 379‐381.
Kálmán, J. (2015). A közfoglalkoztatási programok háttere és nemzetközi tapasztalatai. In: Munkaerőpiaci tükör, 2014 (pp.42-58). MTA Közgazdaság- és Regionális Tudományi Kutatóközpont Közgazdaság-tudományi Intézet, Budapest.
Kovács, E. (2014). Többváltozós adatelemzés. Budapesti Corvinus Egyetem, Operációkutatás és Aktuáriustudományok tanszék. Typotex, Budapest. Retrieved February 20, 2021, from http://etananyag.ttk.elte.hu/FiLeS/downloads/14_KOVACS_E_Tobbvalt_ adatelemzes.pdf.
Lambert, Z. V., Wildt, A. R., & Durand, R. M. (1990). Assessing sampling variation relative to number-of-factors criteria. Educational and Psychological Measurement, 50(1), 33–48. DOI: https://doi.org/10.1177/0013164490501004
Lengyel, I. (2010). Regionális gazdaságfejlesztés. Versenyképesség, klaszterek és alulról szerveződő stratégiák. Budapest, Akadémiai Kiadó. ISBN 978-963-05-8837-9
Liu, Y., Singleton, A. & Arribas-Bel, D. (2019). A Principal Component Analysis (PCA)-based framework for automated variable selection in geodemographic classification. Geo-spatial Information Science, 22(4), 251-264. DOI: 10.1080/10095020.2019.1621549
Mankiw, N. G., Romer, D. & Weil, D. N. (1992). A contribution to the empirics of economy growth. The Quarterly Journal of Economics. Retrieved February 15, 2021, from https://eml.berkeley.edu/~dromer/papers/MRW_QJE1992.pdf 407-437. p.
MacQueen, J. B. (1967). Some methods for classification and analysis of multivariate observations. Proceedings of the Fifth Symposium on Math, Statistics, and Probability (pp. 281–297). Berkeley, CA: University of California Press.
Győri, T.
31
Nemes Nagy, J. ed. (2005). Regionális elemzési módszerek. In: ELTE Regionális Földrajzi Tanszék, Budapest. (Regionális Tudományi Tanulmányok, 11.)
Oravecz, B. (2008). Hiányzó adatok és kezelésük a statisztikai elemzésekben. Statisztikai szemle, 86(4), 365-384.
Ostertagová, E., Ostertag, O., & Kováč, J. (2014). Methodology and Application of the Kruskal-Wallis Test. Applied Mechanics and Materials, 611, 115–120. DOI: https://doi.org/10.4028/www.scientific.net/amm.611.115
Rao, M. R. (1971). Cluster Analysis and Mathematical Programming. Journal of the American Statistics Association, 66(335), 622-626. DOI: 10.1080 / 01621459.1971.10482319
Ramsey, P. H. (1978). Power Differences between Pairwise Multiple Comparions. Journal of the American Statistical Association, 73(363), 479-485. DOI: 10.1080/01621459.1978.10480038
Ramsey P. H. & Ramsey P. P. (2013). Pairwise testing of group mean vectors in MANOVA with small samples, Journal of Statistical Computation and Simulation, 83(6), 1037-1057. DOI: 10.1080/00949655.2011.648936
Rechnitzer, J., Barsi, B., Szabó, P. & Németh N. (2003). A gazdasági térszerkezet vizsgálatát elősegítő új dimenziók illetve az ezzel kapcsolatos módszerek kutatása. In: VÁTI Magyar Regionális Fejlesztési és Urbanisztikai Kht. Területfejlesztési igazgatóság, Elemző és értékelő iroda. Budapest.
Robinette, J. W., Charles, S. T. & Gruenewald, T. (2017). Neighborhood socioeconomic status and health: A longitudinal analysis. Journal of Community Healt, 42(5), 865–871. DOI: https://doi.org/10.1007/s10900-017-0327-6
Romer, P. M. (1994). The origins of endogenous growth. The Journal of Economic Perspectives, 8(1), 3–22. Retrieved January 12, 2021, from http://doi.org/bbs8mn DOI: 10.1257/jep.8.1.3.
Rubin, D. B. (1987). Multiple imputation for nonresponse in surveys. John Wiley & Sons. New York.
Shlens, J. (2014). A Tutorial on Principal Component Analysis. Retrived September 27, 2021, from arXiv: 1404.1100
Simon, J. (2006). A klaszterelemzés alkalmazási lehetőségei a marketingkutatásban. Statisztikai Szemle, 84(7), 627-651.
Székelyi, M., Barna, I. (2005). Túlélőkészlet az SPSS-hez, Typotex Kiadó. Budapest. Vargha, A., & Delaney, H. D. (1998). The Kruskal-Wallis Test and Stochastic Homogeneity.
Journal of Educational and Behavioral Statistics, 23(2), 170–192. DOI: https://doi.org/10.3102/10769986023002170
Zou, H., Hastie, T. & Tibshirani, R. (2006). Sparse Principal Component Analysis. Journal of Computational and Graphical Statistics, 15(2), 265-286. DOI: https://doi.org/10.1198/106186006X113430
DETUROPE – THE CENTRAL EUROPEAN JOURNAL OF REGIONAL DEVELOPMENT AND TOURISM Vol. 13 Issue 3 2021 ISSN 1821-2506
32
Original scientific paper
FROM LARGE-SCALE COMMUNIST AGRICULTURAL PREMISE
THROUGH ABANDONED CONTAMINATED RUIN TO ORGANIC
FARMING PRODUCTION: THE STORY OF SUCCESSFUL POST-
AGRICULTURAL BROWNFIELD REGENERATION
Petr KLUSÁČEKa, Josef NAVRÁTILb, Stanislav MARTINÁTc, Klára CHARVÁTOVÁd, Tomáš KREJČÍe
a Department of Environmental Geography, Institute of Geonics of the Czech Academy of Sciences, Drobného 28, 60200 Brno, Czech Republic, [email protected] b Department of Environmental Geography, Institute of Geonics of the Czech Academy of Sciences, Drobného 28, 60200 Brno, Czech Republic, [email protected] c Department of Environmental Geography, Institute of Geonics of the Czech Academy of Sciences, Drobného 28, 60200 Brno, Czech Republic, [email protected] d Mendel University, Faculty of Regional Development and International Studies, třída Generála Píky 2005/7, 613 00 Brno, Czech Republic, [email protected] e Department of Environmental Geography, Institute of Geonics of the Czech Academy of Sciences, Drobného 28, 60200 Brno, Czech Republic, [email protected]
Cite this article: Klusáček, P., Navrátil, J., Martinát, S., Charvátová, K., Krejčí, T. (2021). From large-scale communist agricultural premise through abandoned contaminated ruin to organic farming production: The story of successful post-agricultural brownfield regeneration. Deturope. 13(3), 32-57
Abstract
In the post-socialist period, rural areas of Central and Eastern Europe underwent a complex transformation process that resulted in creation of numerous large-scale abandoned post-agricultural premises not unlike industrial brownfields. Our study aims to reveal hidden but critical points of successful and sustainable regeneration of abandoned and contaminated ruin of the former socialistic cowshed that can be transferred to other communities dealing with a similar issue. Our case study is located in the municipality Čejkovice in the South Moravian Region, Czech Republic. By means of qualitative analysis of all available documentation and interviews with stakeholders, we followed the unique and complicated story of the 30 years lasting (between 1990-2020) regeneration. The following factors governing successful regeneration process were identified: i) orientation on pro-environmental production encompassing certified organic agriculture; ii) preserving of heritage of the site; iii) transfer of know-how and support of start-up financial capital from Austria; iv) existing external market for products; v) networking of partners and cooperation with local farmers; vi) educational activities in the field of environmentally friendly agricultural production; vii) innovation in the field of greening of production, storage and distribution of products; viii) development of tourism activities as a specific way of communication with customers and potential suppliers. Keywords: redevelopment, brownfield, post-communist transformation, environmentally friendly solutions, Czech Republic
INTRODUCTION
Countryside and agriculture in Central and Eastern Europe experienced a complex development
during the 20th century (Banski, 2018; Jancak & Gotz, 1997; Sarris et al., 1999). Both were
Klusáček, P., Navrátil, J., Martinát, S., Charvátová, K., Krejčí, T.
33
substantially influenced by numerous historical and political turbulences that led to paradoxes
that agricultural regions and systems located in similar natural conditions on the different sides
of the Iron Curtain developed differently (Veznik & Bartosova, 2004). While in some countries,
such as Austria, small family farms have been preserved and the traditional landscape structure
maintained (Penz, 1997), in other countries, such as the former Czechoslovakia, Soviet models
have been thoroughly applied in agricultural policies (Jancak et al., 2019). In other words, after
the communist takeover of power in the late 1940s, the system of small-scale, family-owned
farms was hastily replaced by the large-scale agricultural production based on collective
ownership of agricultural land and related facilities by means of communist agricultural
cooperatives (Halamska, 2008). The overall aim of the new communist agriculture was to
increase food production by using mechanization that was supported by the use of herbicides,
pesticides, insecticides, and fungicides in crop production or the creation of economically more
feasible large-scale farms. The communist rulers mainly aimed to gain control over the
countryside and rid of independent farmers as opposers of the new regime. Changes in
agriculture and rural regions that were celebrated as an extremely progressive way leading to
the creation of ‘the new world’ brought persecution to many farmers and their families (Borsa,
2012), who independently cultivated their agricultural land for decades or centuries, and led to
the liquidation of the vast majority of independent private farmers in former Czechoslovakia.
Following the collapse of communism in the late 1980s, significant changes and challenges
occurred in the agricultural sector, which deeply structurally affected and deformed the
development of rural areas (Banski, 2017; Jancak et al., 2019). While in the centrally planned
economy the emphasis was on the national self-sufficiency in food production that was
enormously supported by the central government, in the new market environment food
producers started to be exposed to cheaper food imports and consequently many of the non-
competitive agricultural production sectors simply collapsed (Csatari et al., 2019; Doucha &
Divila, 2008). This development affected especially the oversized livestock sector and, as a
result, many cowsheds, piggeries, and other agricultural premises ceased to function and
became abandoned (Svobodova & Veznik, 2009; Veznik et al., 2013). After years of
abandonment, these buildings quickly decay and their surroundings are now overgrown with
shrubs and trees (Klusacek et al., 2013). Moreover, plenty of these sites are typical by the
occurrence of contaminated soils and poor technical state of building construction does not
allow their reasonable re-use for needs of rural communities. Instead, new buildings are often
located on agricultural land. As a result, numerous abandoned post-agricultural brownfields
have spread over rural regions in Central and Eastern Europe (Krejci et al., 2021; Navratil et
al., 2019).
Klusáček, P., Navrátil, J., Martinát, S., Charvátová, K., Krejčí, T.
34
Studies show that the spatial distribution of post-agricultural brownfields is not random (Liu
et al., 2014) but it is rather dependent on the spatial unevenness of environmental and economic
factors (Filip & Cocean, 2012) that developed during the transformation process of post-
socialist rural spaces (Bezemer, 2000; Jancak et al., 2019). The presence of large-scale post-
agricultural brownfields has been shown to be an important barrier to the sustainable
development of rural areas (Klusacek et al., 2013; Skala et al., 2013). We can also look at these
sites and their location in rural communities through the lens of environmental (in)justice
(Dillon, 2014) that is intertwined with social injustice (Chan et al., 2019). The most recent
findings signal that rural communities with agricultural brownfields are usually less successful
as a result of their inability to remediate these properties (Ahmad et al., 2020). Through
snowball effects, further negative impacts of the location of post-agricultural brownfields
accumulate over time in their neighbourhoods (Liu et al., 2014) and negatively affect the well-
being of the rural population. Namely, it is soil and water contamination (Bizo et al., 2015), the
creation of illegal waste disposals (Hurley, 2016; Wendel & Mihelcic, 2009), the creation of
artificial barriers for potential development areas in villages (Antucheviciene & Zavadskas,
2008; Skala et al., 2013), or the general disturbance of aesthetic character that are all known as
the elements of the negative impacts of rural brownfields (Petrea et al., 2011). As a result,
communities with large-scale post-agricultural brownfields find themselves in a disadvantaged
competitive position (Gallagher & Jackson, 2008) and the host rural community consequently
unfairly suffers. The atmosphere of failure further deepens this disadvantage as soft factors
towards development are depleted (Berg, 2017). This problem is especially relevant in the case
of transitional economies (Gutnik & Trofimova, 2018) where development priorities often
focus on urban cores and their economic success. However, in the field of rural brownfield
regeneration, stories of best practices of their successful redevelopment play an invaluable and
inspiring role (Klusacek et al., 2018; Osman et al., 2015) for other rural communities dealing
with a similar issue.
The sustainable regeneration of the regions with numerous post-agricultural brownfields
gradually belongs to the central points of rural development strategies. There is no doubt that
there are a wide variety of possible regeneration options (Navratil et al., 2020); some options
are naturally more sustainable than others. Previous research has shown that the successful
regeneration of post-agricultural brownfields is usually centred on the local inhabitants and the
ways in which they perceive individual regeneration possibilities, what the needs of individual
communities are reflected, and how their opinions of the locals are taken into account in the
decision making (Letang & Taylor, 2012; Marian-Potra et al., 2020). However, the vast
majority of post-agricultural brownfields in the post-socialist space went through the recent
ownership change as a result of the privatization and restitution of agricultural properties
Klusáček, P., Navrátil, J., Martinát, S., Charvátová, K., Krejčí, T.
35
(Bezemer, 2000; Doucha & Divila, 2008; Skala et al., 2013) which narrows the extent and focus
of regeneration options available.
The quantitative analyses show that abandonment and regeneration of post-agricultural
premises of formerly collectivized agriculture are simultaneous processes (Navratil et al., 2020)
with a strong influence on rural development (Klusacek et al., 2021). Although the
abandonment and persistence processes of post-agricultural brownfields are spatially linked to
the particular socioeconomic determinants, on the other hand, the regeneration processes are
rather spatially random (Krejci et al., 2021). It indeed seems that sole local circumstances are
of a greater importance than overall regional processes (Haggett, 2001).
We argue that regeneration of individual derelict premises of formerly collectivized
agriculture in Central and Eastern Europe has its unique story that is substantially shaped by
many aspects of local circumstances and contexts. That is the reason why the main aim of our
study is to reveal detailed factors influencing the successful regeneration of a large-scale and
completely devastated post-agricultural brownfield into a prospering company that plays an
important role as a good-practice example and a central point of spreading the idea of
environmentally friendly agricultural production and organic farming. Our overall endeavour
is to better understand and unravel the issue of how successful regeneration builds on unique
local circumstances and what pieces of knowledge can be transferred to other communities
dealing with a similar issue.
DATA AND METHODS
Case Study Location
The case study to capture the aim of our study was selected from the extensive database of
regenerated agricultural brownfields (Navratil et al., 2020) located in the countryside in the
Czech Republic. Out of dozens of cases, five sites were selected for a deeper investigation.
After field visits to five concerned rural communities affected by successfully regenerated
brownfields after agricultural activities, the former large-scale cowshed in Čejkovice in the
eastern part of the Czech Republic (Fig. 1) that was abandoned, neglected, and devastated in
the 1990s was selected for our study. The selection of the case study was based on the following
principles:
• We were looking for regeneration located in the typical peripheral rural location far
from the regional centre.
• The community where the regeneration is located is predominantly agricultural and
is of average size in the eastern part of the Czech Republic.
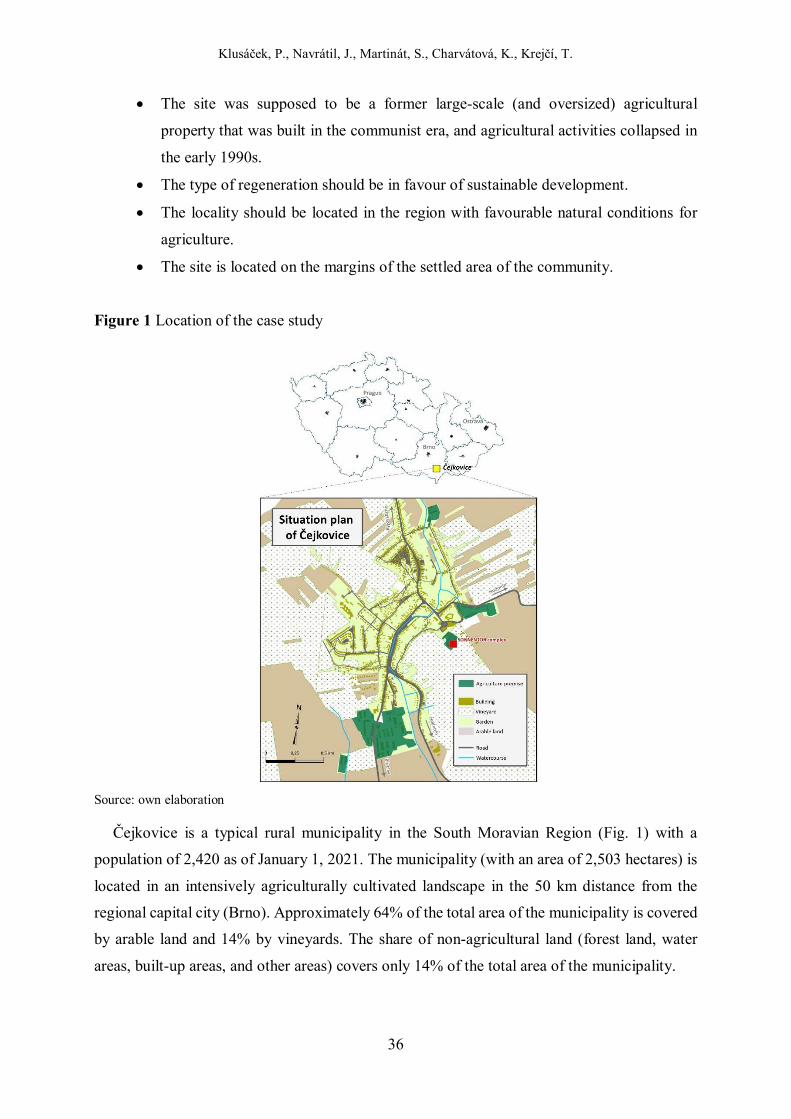
Klusáček, P., Navrátil, J., Martinát, S., Charvátová, K., Krejčí, T.
36
• The site was supposed to be a former large-scale (and oversized) agricultural
property that was built in the communist era, and agricultural activities collapsed in
the early 1990s.
• The type of regeneration should be in favour of sustainable development.
• The locality should be located in the region with favourable natural conditions for
agriculture.
• The site is located on the margins of the settled area of the community.
Figure 1 Location of the case study
Source: own elaboration
Čejkovice is a typical rural municipality in the South Moravian Region (Fig. 1) with a
population of 2,420 as of January 1, 2021. The municipality (with an area of 2,503 hectares) is
located in an intensively agriculturally cultivated landscape in the 50 km distance from the
regional capital city (Brno). Approximately 64% of the total area of the municipality is covered
by arable land and 14% by vineyards. The share of non-agricultural land (forest land, water
areas, built-up areas, and other areas) covers only 14% of the total area of the municipality.
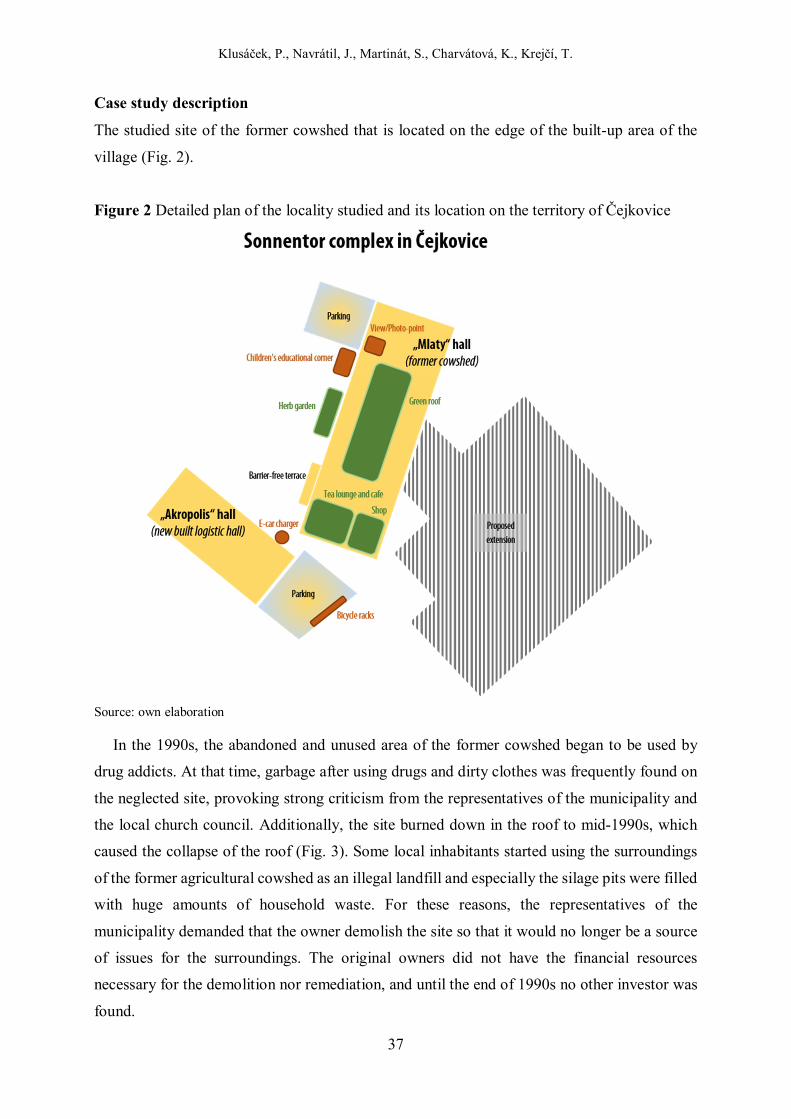
Klusáček, P., Navrátil, J., Martinát, S., Charvátová, K., Krejčí, T.
37
Case study description
The studied site of the former cowshed that is located on the edge of the built-up area of the
village (Fig. 2).
Figure 2 Detailed plan of the locality studied and its location on the territory of Čejkovice
Source: own elaboration
In the 1990s, the abandoned and unused area of the former cowshed began to be used by
drug addicts. At that time, garbage after using drugs and dirty clothes was frequently found on
the neglected site, provoking strong criticism from the representatives of the municipality and
the local church council. Additionally, the site burned down in the roof to mid-1990s, which
caused the collapse of the roof (Fig. 3). Some local inhabitants started using the surroundings
of the former agricultural cowshed as an illegal landfill and especially the silage pits were filled
with huge amounts of household waste. For these reasons, the representatives of the
municipality demanded that the owner demolish the site so that it would no longer be a source
of issues for the surroundings. The original owners did not have the financial resources
necessary for the demolition nor remediation, and until the end of 1990s no other investor was
found.
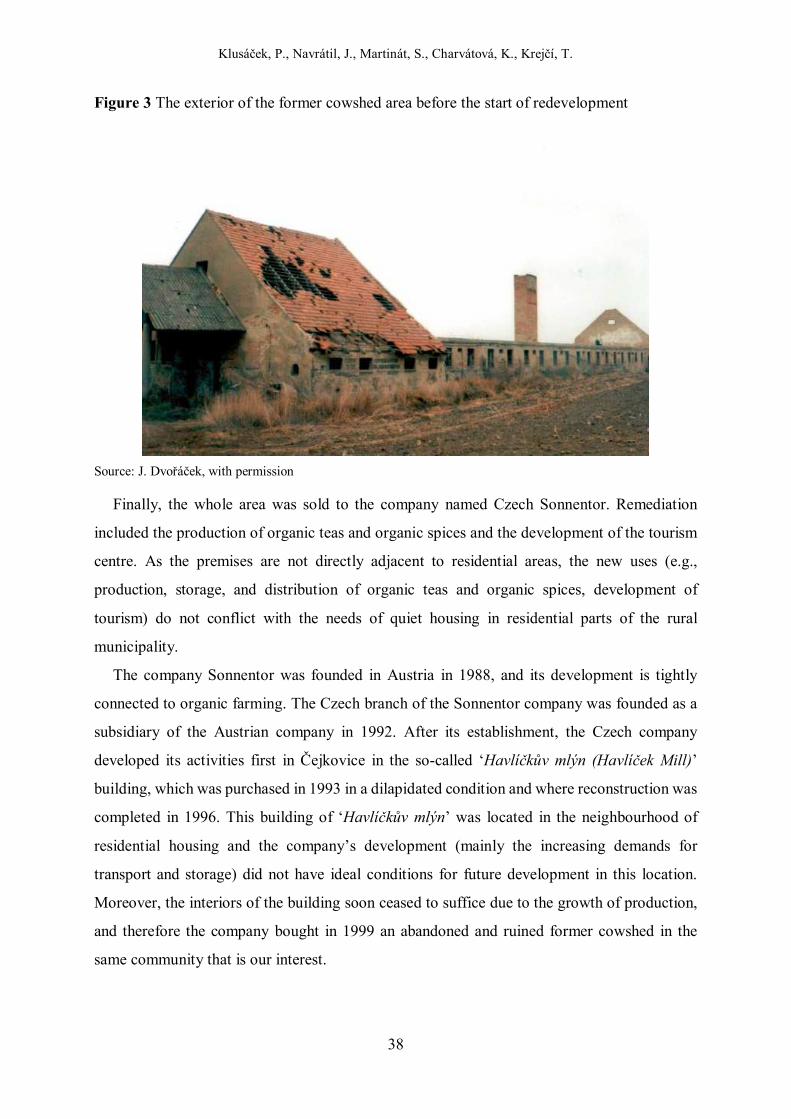
Klusáček, P., Navrátil, J., Martinát, S., Charvátová, K., Krejčí, T.
38
Figure 3 The exterior of the former cowshed area before the start of redevelopment
Source: J. Dvořáček, with permission
Finally, the whole area was sold to the company named Czech Sonnentor. Remediation
included the production of organic teas and organic spices and the development of the tourism
centre. As the premises are not directly adjacent to residential areas, the new uses (e.g.,
production, storage, and distribution of organic teas and organic spices, development of
tourism) do not conflict with the needs of quiet housing in residential parts of the rural
municipality.
The company Sonnentor was founded in Austria in 1988, and its development is tightly
connected to organic farming. The Czech branch of the Sonnentor company was founded as a
subsidiary of the Austrian company in 1992. After its establishment, the Czech company
developed its activities first in Čejkovice in the so-called ‘Havlíčkův mlýn (Havlíček Mill)’
building, which was purchased in 1993 in a dilapidated condition and where reconstruction was
completed in 1996. This building of ‘Havlíčkův mlýn’ was located in the neighbourhood of
residential housing and the company’s development (mainly the increasing demands for
transport and storage) did not have ideal conditions for future development in this location.
Moreover, the interiors of the building soon ceased to suffice due to the growth of production,
and therefore the company bought in 1999 an abandoned and ruined former cowshed in the
same community that is our interest.

Klusáček, P., Navrátil, J., Martinát, S., Charvátová, K., Krejčí, T.
39
Data collection and handling
Several data sources were utilized for our analyses. First, the information that the company
published on the Internet (e.g., the company’s website, videos and interviews on its YouTube
channel, the information from the company´s journal ‘Radost’ – ‘Joy’, the local newspapers)
about its development and the regeneration of the area with the former dilapidated cowshed was
analysed in detail. An important advantage was that the company strives for maximum
transparency of its operations, which is related to its activities in the production of organic teas
and organic spices from certified organic agriculture, where customers can expect maximum
transparency and are not tolerant of the confidentiality of information related to production
methods and their environmental impacts. On the other hand, all the information received had
to be confirmed from other sources to avoid any misinterpretation and beautification of the
regeneration story.
Then, the other data was collected by means of seven interviews with the different types of
local actors, who represent different types of stakeholders related to the redevelopment process
of the cowshed (see Tab. 1 for the overview of interviewees). First, interviews were conducted
with actors who were directly involved in the whole process of redevelopment, and in the later
stages of the research, interviews were focused on the communication partners who participated
in only part of the process. At the end of each interview, the interviewees were asked for
contacts on other stakeholders who can provide important information on the topic studied. The
interviews usually lasted around 90 minutes. Explanation of the purpose of the study was
always provided and the consent of individual participants with the use of data for our research
was ensured.
Table 1 Overview of communication partners selected for interviews (anonymous style)
Type of partner for interview Age category
Role in development process Gender
The company executive manager 41-50 years Leader of development process M
Architect 31-40 years Dealing with architectonical issues
M
Representatives of local government 41-50 years Dealing with municipal development
M
Marketing expert 31-40 years Dealing with marketing development
F
Farmer 1 31-40 years Supplier of organic herbs M
Farmer 2 51-60 years Supplier of organic herbs F
Representative of a partner store 31-40 years Sales of company products F
Klusáček, P., Navrátil, J., Martinát, S., Charvátová, K., Krejčí, T.
40
All interviews were conducted with physical participation of both parties and recorded,
which was communicated to partners beforehand; everyone agreed to be recorded (Silverman,
2018). The interviews were subsequently rewritten and their transcripts were analysed using
Atlas.ti software (Hwang, 2008). The same software was used to analyse the information from
the materials that the studied company publishes on the Internet (e.g., website, company journal,
newspapers). Data (both recordings and transcripts) were stored in the off-line repository,
anonymized, and password protected to avoid any misuse. Participants were informed of the
results of our study through individual emails and phone calls.
RESULTS
Regeneration of post-agricultural brownfield for the production of organic teas and
organic spices
At the beginning of the regeneration process, the new owner had to deal with the security of
the site, which the company executive manager commented on with the words:
“The first thing is safety and security, so we fenced it, the area, and because I was annoyed
that someone was moving here without a mandate, so I had to make signs such as private
property, or entry prohibited private land and…. since then, there has been peace.”
Due to construction work, it was necessary to negotiate with the neighbouring owner to
use a common road, and the architect commented on these negotiations in the following way:
"The access roads were not only owned by Sonnentor, but also belonged to the company
Templářské sklepy (Templar Cellars), which are an important producer of wine ..... when
heavy construction equipment such as excavators was to pass through common roads, the
company from the neighbourhood was not satisfied with it ... there was a bit of such a rivalry,
today it's fine, they live like good neighbours next to each other well ... ".
The new owner decided for the first period of remediation not to demolish the main
dilapidated building of the former cowshed but decided to use the walls to build a production
and storage hall (called ‘Mlaty’, see Figure 2) for the production of organic teas and organic
spices. The preservation of the walls proved to be financially and technically demanding for
both static and hygienic reasons. It was necessary to strengthen the walls’ foundations with a
larger amount of concrete, because the owner decided to increase the walls from 3 meters to 6
meters due to efficient work with forklifts. For hygiene reasons, it was necessary to invest in
decontamination of the walls, which was commented on by the company's executive in the
way:
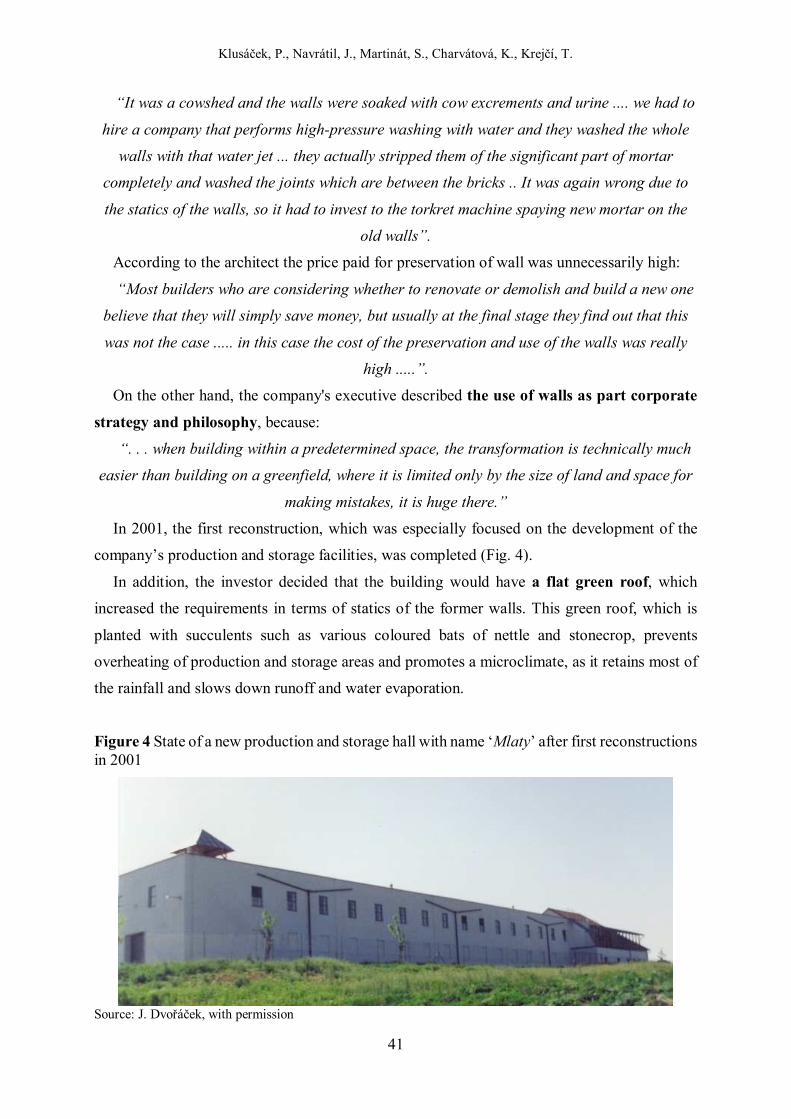
Klusáček, P., Navrátil, J., Martinát, S., Charvátová, K., Krejčí, T.
41
“It was a cowshed and the walls were soaked with cow excrements and urine .... we had to
hire a company that performs high-pressure washing with water and they washed the whole
walls with that water jet ... they actually stripped them of the significant part of mortar
completely and washed the joints which are between the bricks .. It was again wrong due to
the statics of the walls, so it had to invest to the torkret machine spaying new mortar on the
old walls”.
According to the architect the price paid for preservation of wall was unnecessarily high:
“Most builders who are considering whether to renovate or demolish and build a new one
believe that they will simply save money, but usually at the final stage they find out that this
was not the case ..... in this case the cost of the preservation and use of the walls was really
high .....”.
On the other hand, the company's executive described the use of walls as part corporate
strategy and philosophy, because:
“. . . when building within a predetermined space, the transformation is technically much
easier than building on a greenfield, where it is limited only by the size of land and space for
making mistakes, it is huge there.”
In 2001, the first reconstruction, which was especially focused on the development of the
company’s production and storage facilities, was completed (Fig. 4).
In addition, the investor decided that the building would have a flat green roof, which
increased the requirements in terms of statics of the former walls. This green roof, which is
planted with succulents such as various coloured bats of nettle and stonecrop, prevents
overheating of production and storage areas and promotes a microclimate, as it retains most of
the rainfall and slows down runoff and water evaporation.
Figure 4 State of a new production and storage hall with name ‘Mlaty’ after first reconstructions in 2001
Source: J. Dvořáček, with permission
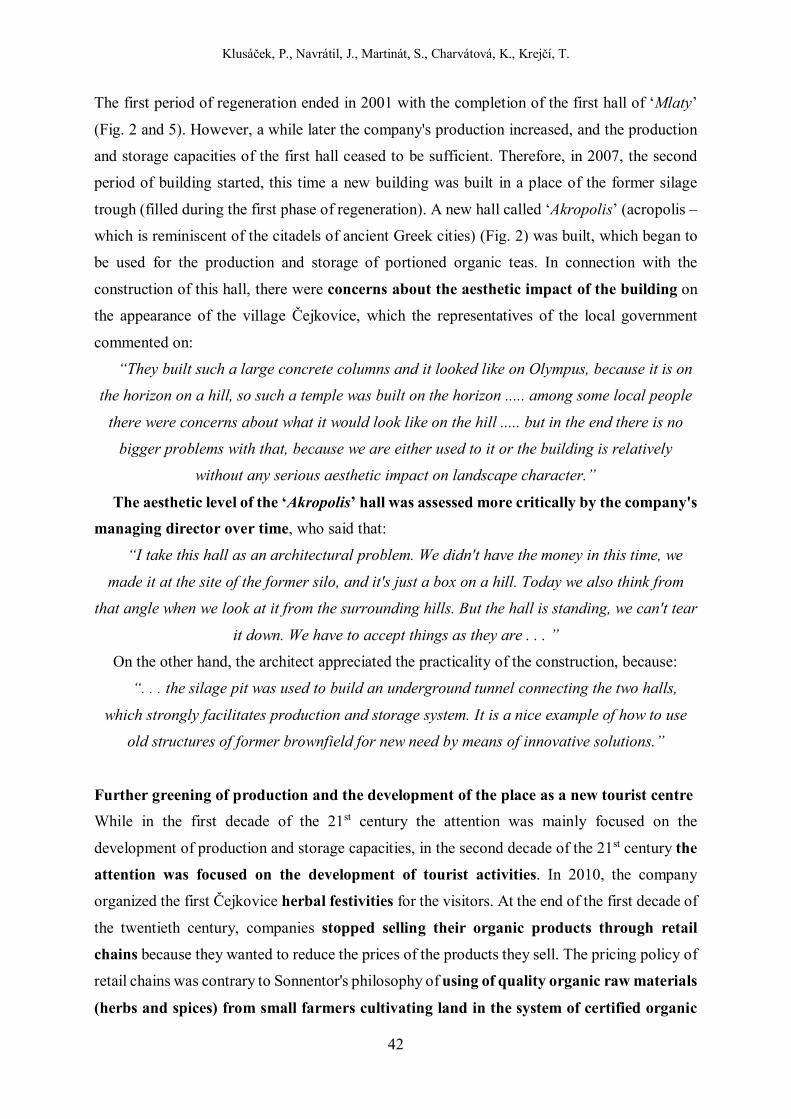
Klusáček, P., Navrátil, J., Martinát, S., Charvátová, K., Krejčí, T.
42
The first period of regeneration ended in 2001 with the completion of the first hall of ‘Mlaty’
(Fig. 2 and 5). However, a while later the company's production increased, and the production
and storage capacities of the first hall ceased to be sufficient. Therefore, in 2007, the second
period of building started, this time a new building was built in a place of the former silage
trough (filled during the first phase of regeneration). A new hall called ‘Akropolis’ (acropolis –
which is reminiscent of the citadels of ancient Greek cities) (Fig. 2) was built, which began to
be used for the production and storage of portioned organic teas. In connection with the
construction of this hall, there were concerns about the aesthetic impact of the building on
the appearance of the village Čejkovice, which the representatives of the local government
commented on:
“They built such a large concrete columns and it looked like on Olympus, because it is on
the horizon on a hill, so such a temple was built on the horizon ..... among some local people
there were concerns about what it would look like on the hill ..... but in the end there is no
bigger problems with that, because we are either used to it or the building is relatively
without any serious aesthetic impact on landscape character.”
The aesthetic level of the ‘Akropolis’ hall was assessed more critically by the company's
managing director over time, who said that:
“I take this hall as an architectural problem. We didn't have the money in this time, we
made it at the site of the former silo, and it's just a box on a hill. Today we also think from
that angle when we look at it from the surrounding hills. But the hall is standing, we can't tear
it down. We have to accept things as they are . . . ”
On the other hand, the architect appreciated the practicality of the construction, because:
“. . . the silage pit was used to build an underground tunnel connecting the two halls,
which strongly facilitates production and storage system. It is a nice example of how to use
old structures of former brownfield for new need by means of innovative solutions.”
Further greening of production and the development of the place as a new tourist centre
While in the first decade of the 21st century the attention was mainly focused on the
development of production and storage capacities, in the second decade of the 21st century the
attention was focused on the development of tourist activities. In 2010, the company
organized the first Čejkovice herbal festivities for the visitors. At the end of the first decade of
the twentieth century, companies stopped selling their organic products through retail
chains because they wanted to reduce the prices of the products they sell. The pricing policy of
retail chains was contrary to Sonnentor's philosophy of using of quality organic raw materials
(herbs and spices) from small farmers cultivating land in the system of certified organic

Klusáček, P., Navrátil, J., Martinát, S., Charvátová, K., Krejčí, T.
43
agriculture, who cannot be as cheap as large farms. The net of partner stores was created,
and the company's executive commented on the situation with the words:
”Sales fell for us, but we started to build our own stores. Now we have partner stores, all
kinds of healthy food, delicacies, organic shops, we have a corner there and we want the
customer to know our philosophy and not compare us to anonymously made tea.”
The company emphasizes both in Čejkovice and in its own stores in two largest Czech cities
(Prague, Brno) and in the partner stores in large Czech cities that these are not anonymous
nonorganic or organic products, but that they process organic products from specific small
farmers, who are cultivating the agricultural land according to rules of certified organic
agriculture. Specific farmers from different countries are also on the packaging of organic
products. In the products intended for German markets are farmers from German speaking
countries, while in the products intended for the Czech market are farmers from the Czech
Republic (Fig. 5) and there are farmers from developing countries on the packaging of spices,
which have origin in tropical countries.
Figure 5 A Czech farmer on tea packaging for Czech market (left) and an Austrian farmer on tea packaging for German speaking markets with an English slogan “We have got no stockholders. We are stickholders! Together we show there is a better way to do business.”
Source: P. Klusáček
Klusáček, P., Navrátil, J., Martinát, S., Charvátová, K., Krejčí, T.
44
In 2012, there was the second reconstruction of ‘Mlaty’ hall, which was focused especially
on the development of tourism facilities, especially the visitor centre in the front part of the
former cowshed (Fig. 6) devoted to the promotion of their products.
Figure 6 Current state of ‘Mlaty’ hall
Source: P. Klusáček
The need to promote the product is due to the fact that in the Czech Republic and in other
countries, the vast majority of points of sale are located in cities. This is not surprising, as
organic products have a higher price and more customers with higher purchasing power are
gathering in cities. Urban inhabitants are also more often involved in tourism activities in rural
regions. The company decided to use this and started to transform the area in Čejkovice for the
needs of visitors interested in organic teas and organic spices. At the beginning of the
development of tourist activities, there was a lack of experience, which the executive
commented:
"When we started tourism and made a simple shop and a square garden next door and so
many people came that we had to cancel it. We did it hastily."
The initial problems were overcome and the opportunities for visitors expanded to include
the possibility of excursions in tea production, a visit to a cafe, a visit to a viewpoint with a
photopoint, the possibility of sitting on a barrier-free terrace, the possibility of visiting the herb

Klusáček, P., Navrátil, J., Martinát, S., Charvátová, K., Krejčí, T.
45
garden of St. Hildegard, the possibility of visiting a children's educational corner with herbs
and other plants. Visitors are also offered parking spaces, lockable bicycle stands, and the
possibility of charging electric cars and e-bikes. The development of tourist activities was
also co-financed with a national subsidy, because the company received support for the
project “Herbal Paradise for all’, which was supported by the state budget of the Czech Republic
from the program of the Ministry of Regional Development of the Czech Republic. In 2019,
the last year before the Covid epidemic situation, the Sonnentor complex in Čejkovice was
visited by more than 50,000 visitors. Tourism activities are carried out continuously throughout
the year, but a large number of visitors visit the site as part of various events. These are special
events for visitors such as the pre-Easter fair, Mother's Day celebration, herbal vintage, holiday
weekends for children, Čejkovice herbal festivities (Fig. 7), the St. Nicholas Advent weekend.
Figure 7 Visitors during the herbal festivities of 2015
Source: https://www.youtube.com/watch?v=ZEOmGzhCG7M
During the development of tourist activities, further greening of production took place in
the entire complex in Čejkovice. Attention was focused on the development of cleaner energy
sources. In 2012, a small photovoltaic power plant was installed on the roof of the ‘Mlaty’ hall
and in 2019 a second one was added to the Akropolis hall. Currently, 206 panels with an output
of 29.4 kWp are installed on the Sonnentor. By producing electricity from a photovoltaic power
plant, the company will cover about 7% of total consumption. The remaining electricity
consumption for the Čejkovice site since 2012 is taken exclusively from renewable sources.
During the processing of herbs and spices, technologically unusable dust is generated; it is
actually production waste. This herbal dust is pelleted, and the pellets are used to heat the
Klusáček, P., Navrátil, J., Martinát, S., Charvátová, K., Krejčí, T.
46
company's premises. The pellets are burned in a special Petrojet 50 kW boiler designed to burn
plant pellets. Depending on the fuel used, the boiler meets the emission limits of class 4 to 5. It
is connected to a hot water tank with a volume of 3 m2, from which the hot water is distributed
throughout the Mlaty hall and is used for heating and domestic hot water. This boiler replaced
the existing main source using propane as a heating medium. The company declares that the
ratio of green energy is made up of energy from biomass, wind, biogas, water and the sun, with
preference given to solar power plants, which have panels located on the roofs of buildings over
those that stand on open land.
In 2013, the company acquired the first CNG-powered cars. Today, a total of 8 CNG cars
are running and the company has 2 electric cars (Volkswagen E-Golf and Renault Twizy).
There is also a charging station for electric cars directly in the complex. The fast-charging
station and one electric car were acquired thanks to co-financing from EU funds within the
project Support of low-carbon technologies in the company Sonnentor supported by the
Operational Program Enterprise and Innovation for Competitiveness.
Innovative, environmentally friendly, and nonchemical solutions are used in the field
of storage - for example, forms of biotechnical protection such as Trichogramma evanescens
wasps against insect pests in warehouses. Responsibility for the environment is also reflected
in waste management. Since 2016, all events for visitors in Čejkovice have been organized as
part of the ZERO WASTE concept, where such materials are used that it is possible to convert
waste from events for visitors into biological compost. Thanks to investments in minimizing
waste production, the company has achieved that 91% of its packaging is fully recyclable or
from recyclable sources and will save 20 tons of plastics and 30 tons of paper per year by
changing the material composition for bagged teas and reducing their weight. The company
presents its basic principles such as the use of ecological packaging, a high proportion of manual
work, direct trade, neutrality in CO2 production, production without palm oil on the packaging
of organic teas and organic spices (Fig. 8).
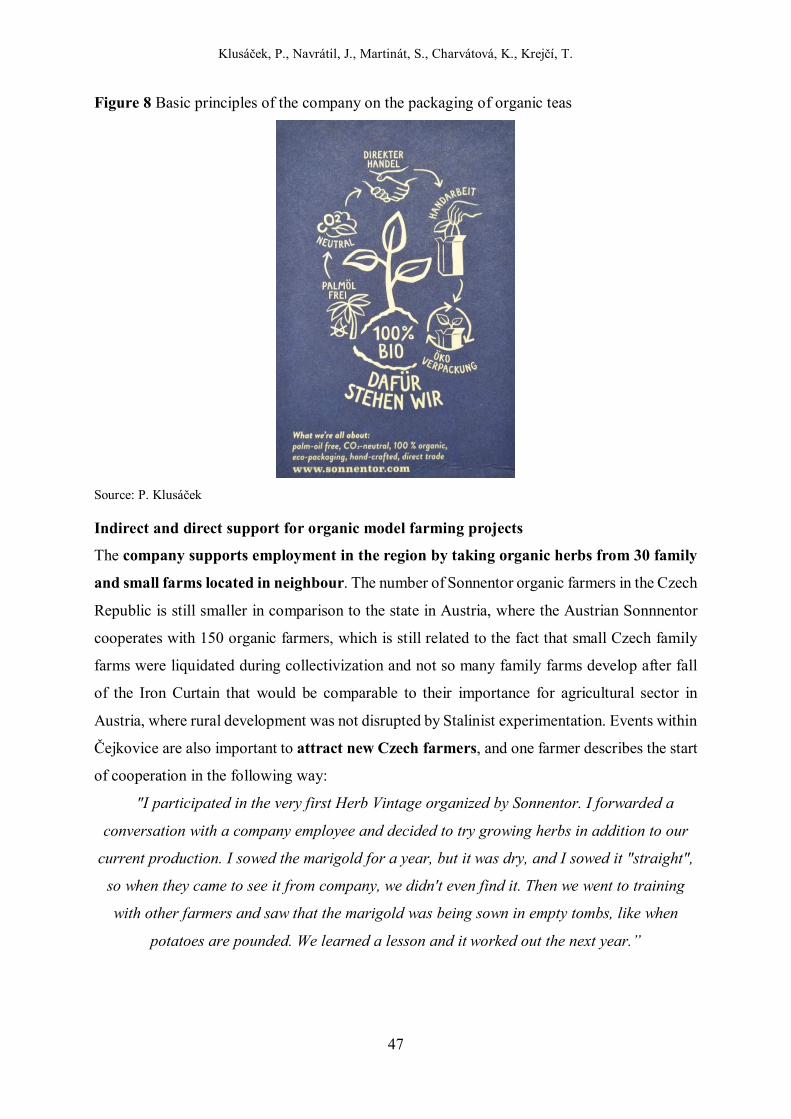
Klusáček, P., Navrátil, J., Martinát, S., Charvátová, K., Krejčí, T.
47
Figure 8 Basic principles of the company on the packaging of organic teas
Source: P. Klusáček
Indirect and direct support for organic model farming projects
The company supports employment in the region by taking organic herbs from 30 family
and small farms located in neighbour. The number of Sonnentor organic farmers in the Czech
Republic is still smaller in comparison to the state in Austria, where the Austrian Sonnnentor
cooperates with 150 organic farmers, which is still related to the fact that small Czech family
farms were liquidated during collectivization and not so many family farms develop after fall
of the Iron Curtain that would be comparable to their importance for agricultural sector in
Austria, where rural development was not disrupted by Stalinist experimentation. Events within
Čejkovice are also important to attract new Czech farmers, and one farmer describes the start
of cooperation in the following way:
"I participated in the very first Herb Vintage organized by Sonnentor. I forwarded a
conversation with a company employee and decided to try growing herbs in addition to our
current production. I sowed the marigold for a year, but it was dry, and I sowed it "straight",
so when they came to see it from company, we didn't even find it. Then we went to training
with other farmers and saw that the marigold was being sown in empty tombs, like when
potatoes are pounded. We learned a lesson and it worked out the next year.”
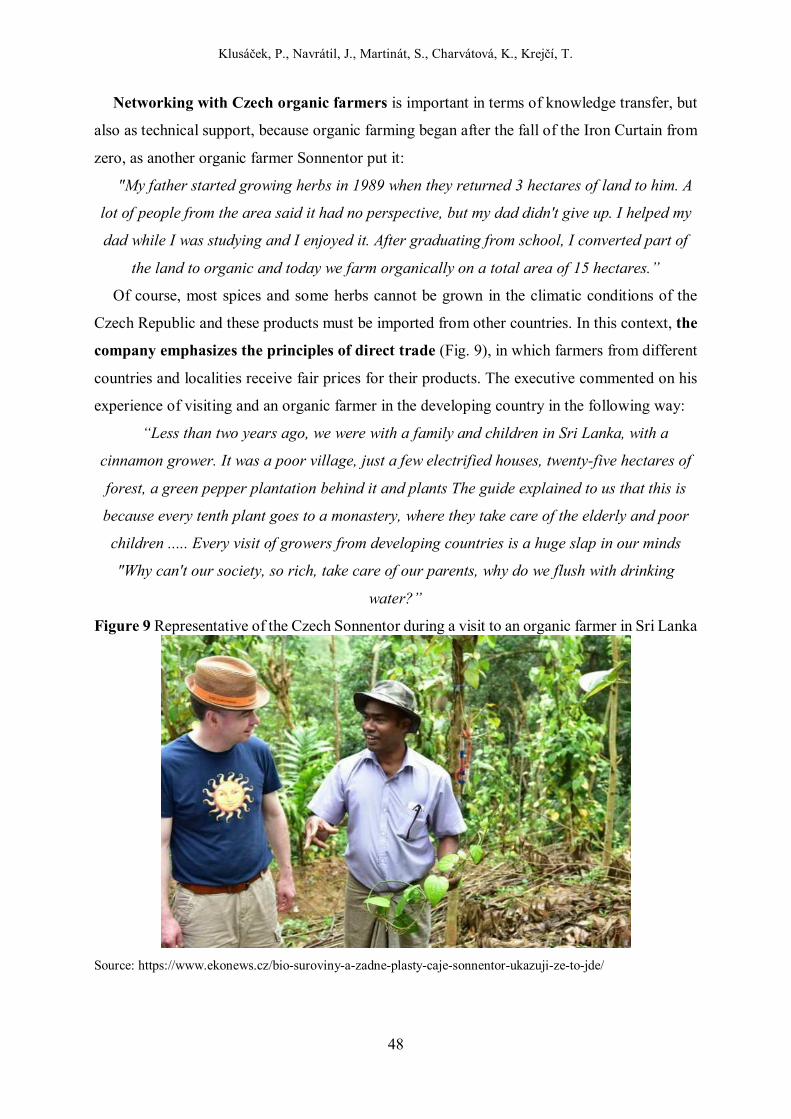
Klusáček, P., Navrátil, J., Martinát, S., Charvátová, K., Krejčí, T.
48
Networking with Czech organic farmers is important in terms of knowledge transfer, but
also as technical support, because organic farming began after the fall of the Iron Curtain from
zero, as another organic farmer Sonnentor put it:
"My father started growing herbs in 1989 when they returned 3 hectares of land to him. A
lot of people from the area said it had no perspective, but my dad didn't give up. I helped my
dad while I was studying and I enjoyed it. After graduating from school, I converted part of
the land to organic and today we farm organically on a total area of 15 hectares.”
Of course, most spices and some herbs cannot be grown in the climatic conditions of the
Czech Republic and these products must be imported from other countries. In this context, the
company emphasizes the principles of direct trade (Fig. 9), in which farmers from different
countries and localities receive fair prices for their products. The executive commented on his
experience of visiting and an organic farmer in the developing country in the following way:
“Less than two years ago, we were with a family and children in Sri Lanka, with a
cinnamon grower. It was a poor village, just a few electrified houses, twenty-five hectares of
forest, a green pepper plantation behind it and plants The guide explained to us that this is
because every tenth plant goes to a monastery, where they take care of the elderly and poor
children ..... Every visit of growers from developing countries is a huge slap in our minds
"Why can't our society, so rich, take care of our parents, why do we flush with drinking
water?”
Figure 9 Representative of the Czech Sonnentor during a visit to an organic farmer in Sri Lanka
Source: https://www.ekonews.cz/bio-suroviny-a-zadne-plasty-caje-sonnentor-ukazuji-ze-to-jde/
Klusáček, P., Navrátil, J., Martinát, S., Charvátová, K., Krejčí, T.
49
These successes in greening and social responsibility of the company's production are presented
to visitors on site or via information screens in the visitor areas or via different channel and
social media.
In 2011, a project of a model organic farm was born in Velké Hostěrádky, which is located
20 km from Čejkovice. The aim of the model organic farm project, which is provided in the
form of a civic association of supporters of organic farming and whose founder includes the
Czech Sonnentor, is to promote and support organic farming, environmental protection, and a
healthy lifestyle. The company actively participated in this project by renting part of the
agricultural land on which several types of herbs are demonstrably grown. The largest
acreage is devoted to common marigold (Calendula officinalis), which is grown as the highest
degree of propagation in organic seeds for the needs of Czech organic growers. There are also
stands of lemon balm (Melissa officinalis), peppermint (Mentha spp.), cornflowers (Centaurea
cyanus), eastern purple coneflower (Echinacea purpurea), and Tagetes plants. The last two
named cultures were established in collaboration with the Institute of Botany of the CAS for
research purposes.
The project is important for the company because it serves as research aimed at improving
techniques for growing organic herbs and is also used as a training area for potential
organic farmers, who are presented here not only techniques for growing organic herbs, but
also techniques for drying organic herbs. There are events for those interested in the type of
herb vintage, where they can collect organic herbs. The model organic farm project has the
unique potential to present the viability of organic farming in practice, as it is located in the
vicinity of several other organic farms with a total area of about 200 ha. Such a concentration
of organic farms on arable land in the centre of the South Moravian Region is a unique
phenomenon. The cultivation of organic herbs is only one of the activities of the model organic
farm and other activities include the cultivation of traditional and less traditional organic
crops, the care of organic orchards and organic vineyards, the application of various
sowing procedures and anti-erosion measures. Part of this model organic farming project is
also the breeding of pigs and sheep.
DISCUSSION
Several critical points of the regeneration of the site under study were found:
• Know-how and support of start-up financial capital from Austria
• The role as growth pole in the region
Klusáček, P., Navrátil, J., Martinát, S., Charvátová, K., Krejčí, T.
50
• Central point of transfer of pro-green technology
• Financing of the project: foreign investment, lack of money, and subsidies
Know-how and support from Austria
The project of the remediation of post-agricultural brownfield in the production of organic teas
and organic spices is not of Czech origin. It was founded as a subsidiary of Austrian company
in 1992. Its model that has been operating since 1988 in Austria has been applied in the post-
socialistic rural context. An important factor of success is the location of the site and
geographical proximity of the mother company (in nearby Lower Austria). Previously, it was
shown that diffusion of innovations from the West is extremely important for the development
of post-socialistic agriculture (Fendrychova & Jehlicka, 2018) but the lack of available
investment is behind its low intensity of spreading (Tuna & Karantininis, 2021). Foreign
investment was found to be one of the most important factors for the development of agriculture
in Eastern Europe and other development realms (Sikandar et al., 2021). This is because foreign
investment brings not only capital but also managerial and technological skills (Walkenhorst,
2000) – initial resource endowments and technology use were identified as the most important
factors of transformation changes in agriculture of Central European countries (Swinnen &
Vranken, 2010).
Geographical location is also one of the main points for successful redevelopment of derelict
and abandoned post-production sites (Frantal & Martinat, 2013). The former cowshed in
Čejkovice is not located in the central urban region, where brownfields are usually the most
attractive for investors, but it is located on the highest hill of a picturesque wine growing village
Čejkovice and the development of tourist activities could be supported by the fact that the
village was already known as the destination for wine tourism. Geographic proximity facilitates
communication with the parent company, which was reflected in the rapid development of the
business in the Czech Republic.
Another important factor is the already existing customer network in German-speaking
countries of the parent company. Production, despite massive cooperation with real and
potential customers in the Czech Republic, ends on German speaking markets (80%). The
domestic market consumes only 10% of the production made in Čejkovice. Starting the business
with the existing market is easier, especially being foreign (Kotler & Keller, 2015).
On the other hand, the investment of Austrian company in the post-socialistic Czech
Republic (in 1992, yet Czechoslovakia) was not without risk because the implementation of
Klusáček, P., Navrátil, J., Martinát, S., Charvátová, K., Krejčí, T.
51
“Western” practices has many unintended consequences, as was shown for organic farming in
Latvia (Aistara, 2009). The Austrian model is dependent on the production of a long-term
network of rather small local farmers and cultivated rural culture (Penz, 1997). The situation in
rural Czech Republic in the 1990s was completely different with the transformation of
agriculture and rural culture affected by 40 years of the collectivisation of soviet model (Jancak
et al., 2019). The transition in post-soviet realm was strongly diversified (Bezemer, 2000) and
influenced by the extent of the pre-reform distortions (Swinnen & Vranken, 2010) resulting in
many difficulties for diffusion of the Western model of agricultural production and its
processing (Fendrychova & Jehlicka, 2018) even in neighbouring regions (Bartel et al., 2018).
The role as growth pole in the region
In this case, the transfer of model was successful as investors started to cooperate with all
potential producers of organic crops with the region. First, they began to develop its activities
in the processing of organic products in the village, which was characterized by intensive
production agriculture using chemical fertilizers and herbicides, pesticides, fungicides, etc. It
was important for the company's image among the local inhabitants that it first used the ruins
of the so-called Havlíček's mill for its development, and when this location ceased to have
sufficient capacity, it used a dilapidated cowshed, which was a problem for the municipal
development. The company emphasizes its local and regional identity on the packaging of some
teas. From the point of view of local and micro-regional development, it is important that the
company also became a major employer, which in 2020 employed 150 workers, which was
almost half the number of Sonnetor employees in Austria, where there were 350 employees.
Still, the location of the company processing agricultural products induced development in
adjacent areas and has an overall impact on the agribusiness in the region. Training programs,
pilot demonstration projects, and innovative contract designs were found to secure quality raw
material supplies while inducing sector-wide improvements in agricultural productivity and
agribusiness practices (Walkenhorst, 2000). This is important especially in small communities
of the post-socialist realm with scant bottom-up innovations (Gava et al., 2021) where the
activity of stakeholders without examples of ‘best practice’ is very low (Atkociuniene et al.,
2018; Fieldsend et al., 2004) usually due to its socialist and collectivized history (Bezak &
Mitchley, 2014; Tuna & Karantininis, 2021).
Klusáček, P., Navrátil, J., Martinát, S., Charvátová, K., Krejčí, T.
52
Central point of pro-green technology transfer
The business under study has a wider impact than the enhancement of the agribusiness
environment in the South Moravian countryside. It brings innovation in the field of greening of
production, storage, and distribution of products. In the studied area is constantly invested in
greening and already implemented investments in rooftop solar power plants, electro-mobility,
waste minimization, use of production waste for hall heating or the planned investments in heat
pumps and rainwater collection systems and its reuse. Transfer of new technologies within rural
space is increasing agricultural technical efficiency, which is seen as a strategy to boost the
level of living standards in agriculture and in rural areas (Bojnec et al., 2014).
Important for the local development of organic farming (it does not matter if certified or not)
is the location of research that aims to improve techniques for growing organic herbs and is also
used as a training area for potential organic farmers. The investor also cooperates with scientific
institutions such as the Institute of Botany of the Czech Academy of Sciences. Such cooperation
is in the post-socialist realm spare but needed (Dirimanova, 2018).
All these activities are important not only in terms of economic and environmental
efficiency, but they strengthen the company's image in the eyes of potential groups of end-users
and further spreading of the idea of the environmentally friendly agricultural production and
processing of agricultural products. In the second decade of the 21st century, the company began
to systematically build an offer for visitors, with specific attention paid to groups of visitors
such as parents with children or cyclists, who can be expected to be more interested in
environmental issues and organic products. This is again important for spreading the idea of
pro-green behaviour through tourism activities.
Financing of the project – foreign investment, subsidies, and lack of money
The initial capital was important for the creation and development of the company in the 1990s,
as well as for the start of the new boom of company in the area with the dilapidated cowshed at
the beginning of the 21st century. Here, foreign investment was crucial as small farmers usually
use for development only their own capital (Gava et al., 2021).
A certain role in the development of the studied project played subsidies. Financial support
from subsidies was used especially for the development of tourist activities (the program of the
Ministry of Regional Development of the Czech Republic) and then for the construction of the
fast-charging station and the acquisition of one electric car (EU funds – the Operational
Program Enterprise and Innovation for Competitiveness). Appropriate economic policy has
been found to be of extreme importance for starting and developing business in agriculture in

Klusáček, P., Navrátil, J., Martinát, S., Charvátová, K., Krejčí, T.
53
the post-socialist realm (Anicic et al., 2021; Swinnen & Vranken, 2010), because subsidies are
important drivers of agricultural change (Sang et al., 2014). It helped increase the operating
surplus of the agricultural sector and the profitability of agricultural holdings through increasing
profitability of commodities (Pechrova, 2014). Subsidies are an important source for financing
of organic farming throughout Europe (Brzezina et al., 2017). On the other hand, subsidies
induced only low number of starting of business in rural post-socialist realm (Mack et al., 2021),
they can lead to the increased reliance on external financial support (Pechrova, 2014), and
decimate agricultures in other parts of the world where subsidies are not present (Graddy-
Lovelace & Diamond, 2017). But there is no doubt that subsidies have a positive impact on the
adoption of pro-environmental measures in agriculture (Brzezina et al., 2017).
Besides foreign investment and co-financing of the project with subsidies and funds, critical
issues rising from lack of money also rose. It is especially the case of the ‘Akropolis’ building
that was built in a period when there was a need for a new facility but money was lacking. This
resulted in a low-cost solution of this issue. This decision almost ruined the former idea of not
demolishing the old building and not building on greenfields. The aesthetics of the entire site
was severely damaged, and in recent times thoughts of demolition of this building are present.
Our research indicated here the wrong decision where a technically sufficient low-cost solution
was adopted and the philosophy of the business plan was not taken into account.
CONCLUSION
The site studied shows the transformation and diversification of post-communist agriculture.
The locality originally used for intensive Soviet-model collectivized agriculture began to decay
shortly after the fall of the Iron Curtain in the early 1990s. The regeneration of the site in the
21st century has encompassed the development of organic tea and organic spices production
using raw material from nearby small family farmers. The findings of the present study expand
our knowledge regarding micro-aspects of factors of successful regeneration of post-
agricultural brownfields, which are vastly different from urban and industrial brownfields.
Acknowledgement
This research was funded by Czech Science Foundation, grant number 19-23870S.
REFERENCES
Ahmad, N., Zhu, Y. M., Lin, H. L., Karamat, J., Waqas, M., & Mumtaz, S. M. T. (2020). Mapping the obstacles to brownfield redevelopment adoption in developing economies:
Klusáček, P., Navrátil, J., Martinát, S., Charvátová, K., Krejčí, T.
54
Pakistani Perspective. Land Use Policy, 91, Article 104374. https://doi.org/10.1016/j.landusepol.2019.104374
Aistara, G. A. (2009). Maps from Space: Latvian Organic Farmers Negotiate their Place in the European Union. Sociologia Ruralis, 49(2), 132-150. https://doi.org/10.1111/j.1467-9523.2009.00485.x
Anicic, J., Vukotic, S., Anicic, D., Petrovic, V., & Cavic, D. (2021). Investment policy factors of enterprises in Serbia - Agriculture and processing industry sectors. Ekonomika Poljoprivreda-Economics of Agriculture, 68(1), 37-52. https://doi.org/10.5937/ekoPolj2101037A
Antucheviciene, J., & Zavadskas, E. K. (2008). Modelling multidimensional redevelopment of derelict buildings [Article; Proceedings Paper]. International Journal of Environment and Pollution, 35(2-4), 331-344. https://doi.org/10.1504/ijep.2008.021364
Atkociuniene, V., Vaznoniene, G., & Aleksandravicius, A. (2018). The role of rural development administrators in rural institutions. Management Theory and Studies for Rural Business and Infrastructure Development, 40(2), 143-154. https://doi.org/10.15544/mts.2018.14
Banski, J. (2017). The consequences of changes of ownership for agricultural land use in Central European countries following the collapse of the Eastern Bloc. Land Use Policy, 66, 120-130. https://doi.org/10.1016/j.landusepol.2017.04.045
Banski, J. (2018). Phases to the transformation of agriculture in Central Europe - Selected processes and their results. Agricultural Economics-Zemedelska Ekonomika, 64(12), 546-553. https://doi.org/10.17221/86/2018-agricecon
Bartel, S., Albrecht, J., Hruska, V., Rybova, K., & Ortner, A. (2018). Transboundary spatial planning axes: Discontinuities and suggestions for harmonisation in the Elbe/Labe Euroregion. Geoscape, 12(2), 114-123. https://doi.org/10.2478/geosc-2018-0012
Berg, S. K. (2017). Cultural heritage as a resource for property development [Article]. Historic Environment-Policy & Practice, 8(4), 304-322. https://doi.org/10.1080/17567505.2017.1399582
Bezak, P., & Mitchley, J. (2014). Drivers of change in mountain farming in Slovakia: from socialist collectivisation to the Common Agricultural Policy. Regional Environmental Change, 14(4), 1343-1356. https://doi.org/10.1007/s10113-013-0580-x
Bezemer, D. J. (2000). Limitations on De-collectivisationin Central European Agriculture (Tinbergen Institute Discussion Paper, Issue.
Bizo, M. L., Levei, E. A., Kothe, E., Senila, M., Modoi, C. O., & Ozunu, A. (2015). Chemical assessment of soil quality for ecological remediation strategies [Article]. Carpathian Journal of Earth and Environmental Sciences, 10(4), 195-202.
Bojnec, S., Ferto, I., Jambor, A., & Toth, J. (2014). Determinants of technical efficiency in agriculture in new EU member states from Central and Eastern Europe. Acta Oeconomica, 64(2), 197-217. https://doi.org/10.1556/AOecon.64.2014.2.4
Borsa, S. (2012). Between Persuasion and Coercion The Collectivization of Agriculture in Romania (1949-1962). Transylvanian Review, 21, 461-471.
Brzezina, N., Biely, K., Helfgott, A., Kopainsky, B., Vervoort, J., & Mathijs, E. (2017). Development of Organic Farming in Europe at the Crossroads: Looking for the Way Forward through System Archetypes Lenses. Sustainability, 9(5), Article 821. https://doi.org/10.3390/su9050821
Chan, H. H., Hu, T. S., & Fan, P. L. (2019). Social sustainability of urban regeneration led by industrial land redevelopment in Taiwan. European Planning Studies, 27(7), 1245-1269. https://doi.org/10.1080/09654313.2019.1577803
Csatari, B., Farkas, J. Z., & Lennert, J. (2019). Agrarian and Rural Development in Hungary After 1989. In J. Banski (Ed.), Three Decades of Transformation in the East-Central
Klusáček, P., Navrátil, J., Martinát, S., Charvátová, K., Krejčí, T.
55
European Countryside (1st ed., pp. 21-54). Springer. https://doi.org/https://doi.org/10.1007/978-3-030-21237-7
Dillon, L. (2014). Race, Waste, and Space: Brownfield Redevelopment and Environmental Justice at the Hunters Point Shipyard. Antipode, 46(5), 1205-1221. https://doi.org/10.1111/anti.12009
Dirimanova, V. (2018). The role of the extension services for the development of the small-scale farms in Bulgaria. Bulgarian Journal of Agricultural Science, 24(1), 35-39.
Doucha, T., & Divila, E. (2008). Changes in Czech agriculture in the years 1990–2005. In J. Bański & M. Bednarek (Eds.), Contemporary Changes of Agriculture in East-Central Europe (pp. 73-96). Polish Geographical Society.
Fendrychova, L., & Jehlicka, P. (2018). Revealing the hidden geography of alternative food networks: The travelling concept of farmers' markets. Geoforum, 95, 1-10. https://doi.org/10.1016/j.geoforum.2018.06.012
Fieldsend, A. F., Nyizsalovszki, R., & MacAskill, J. A. (2004). Rural Renaissance - A strategy for integrated rural development in Eastern Central Europe. In L. A. Marghitas (Ed.), Bulletin of the University of Agricultural Sciences and Veterinary Medicine, Vol 60: AGRICULTURE (Vol. 60, pp. 7-12).
Filip, S., & Cocean, P. (2012). Urban industrial brownfields: Constraints and opportunities in Romania [Article]. Carpathian Journal of Earth and Environmental Sciences, 7(4), 155-164.
Frantal, B., & Martinat, S. (2013). Brownfields: A geographical perspective. Moravian Geographical Reports, 21(2), 2-4.
Gallagher, D. R., & Jackson, S. E. (2008). Promoting community involvement at brownfields sites in socio-economically disadvantaged neighbourhoods. Journal of Environmental Planning and Management, 51(5), 615-630. https://doi.org/10.1080/09640560802210971
Gava, O., Ardakani, Z., Delalic, A., Azzi, N., & Bartolini, F. (2021). Agricultural cooperatives contributing to the alleviation of rural poverty. The case of Konjic (Bosnia and Herzegovina). Journal of Rural Studies, 82, 328-339. https://doi.org/10.1016/j.jrurstud.2021.01.034
Graddy-Lovelace, G., & Diamond, A. (2017). From supply management to agricultural subsidies-and back again? The US Farm Bill & agrarian (in)viability. Journal of Rural Studies, 50, 70-83. https://doi.org/10.1016/j.jrurstud.2016.12.007
Gutnik, A. V., & Trofimova, O. E. (2018). European investment in Kaluga region: Features under sanctions [Article]. Mirovaya Ekonomika I Mezhdunarodnye Otnosheniya, 62(9), 81-87. https://doi.org/10.20542/0131-2227-2018-62-9-81-87
Haggett, P. (2001). Geography. A Global Synthesis. Prentice Hall. Halamska, M. (2008). Changing property structures in Central European agriculture in the
process of decollectivisation: The social aspects of appropriation. Eastern European Countryside, 14, 7-25.
Hurley, A. (2016). From Factory Town to Metropolitan Junkyard: Postindustrial Transitions on the Urban Periphery [Article]. Environmental History, 21(1), 3-29. https://doi.org/10.1093/envhis/emv112
Hwang, S. (2008). Utilizing Qualitative Data Analysis Software A Review of Atlas.ti. Social Science Computer Review, 26(4), 519-527. https://doi.org/10.1177/0894439307312485
Jancak, V., Eretova, V., & Hrabak, J. (2019). The Development of Agriculture in Czechia After the Collapse of the Eastern Bloc in European Context. In J. Banski (Ed.), Three Decades of Transformation in the East-Central European Countryside (1st ed., pp. 55-72). Springer. https://doi.org/https://doi.org/10.1007/978-3-030-21237-7
Klusáček, P., Navrátil, J., Martinát, S., Charvátová, K., Krejčí, T.
56
Jancak, V., & Gotz, A. (1997). Územní diferenciace českého zemědělství a její vývoj. Univerzita Karlova.
Klusacek, P., Alexandrescu, F., Osman, R., Maly, J., Kunc, J., Dvorak, P., . . . Trojan, J. (2018). Good governance as a strategic choice in brownfield regeneration: Regional dynamics from the Czech Republic. Land Use Policy, 73, 29-39. https://doi.org/10.1016/j.landusepol.2018.01.007
Klusacek, P., Krejci, T., Martinat, S., Kunc, J., Osman, R., & Frantal, B. (2013). Regeneration of agricultural brownfields in the Czech Republic – Case study of the South Moravian Region. Acta Universitatis Agriculturae et Silviculturae Mendelianae Brunensis, 61(2), 549-561.
Klusacek, P., Navratil, J., Martinat, S., Krejci, T., Golubchikov, O., Picha, K., . . . Osman, R. (2021). Planning for the future of derelict farm premises: From abandonment to regeneration? Land Use Policy, 102. https://doi.org/10.1016/j.landusepol.2020.105248
Kotler, P., & Keller, K. L. (2015). Marketing Management, Global Edition (15th ed.). Pearson Education Limited.
Krejci, T., Navratil, J., Martinat, S., Frazier, R. J., Klusacek, P., Picha, K., . . . Osman, R. (2021). Spatial Unevenness of Formation, Remediation and Persistence of Post-Agricultural Brownfields. Land, 10(3), Article 325. https://doi.org/10.3390/land10030325
Letang, S. J., & Taylor, R. (2012). Community perception of redevelopment changes and its impact on brownfields redevelopment success. OIDA International Journal of Sustainable Development, 5(11), 21-42.
Liu, Y., van Oort, F., Geertman, S., & Lin, Y. L. (2014). Institutional determinants of brownfield formation in Chinese cities and urban villages [Article]. Habitat International, 44, 72-78. https://doi.org/10.1016/j.habitatint.2014.05.005
Mack, G., Fintineru, G., & Kohler, A. (2021). Effects of EU rural development funds on newly established enterprises in Romania's rural areas. European Planning Studies, 29(2), 291-311. https://doi.org/10.1080/09654313.2020.1746243
Marian-Potra, A. C., Ișfănescu-Ivan, R., Pavel, S., & Ancuța, C. (2020). Temporary uses of urban brownfields for creative activities in a post-socialist city. Case study: Timișoara (Romania). Sustainability (Switzerland), 12(19), 1-20. https://doi.org/10.3390/su12198095
Navratil, J., Krejci, T., Martinat, S., Picha, K., Klusacek, P., Skrabal, J., & Osman, R. (2020). Abandonment or Regeneration and Re-Use? Factors Affecting the Usage of Farm Premises in Different Social Spaces of the Rural [Article]. Sustainability, 12(21), 17, Article 9124. https://doi.org/10.3390/su12219124
Navratil, J., Martinat, S., Krejci, T., Picha, K., Klusacek, P., Skrabal, J., & Osman, R. (2019). The fate of socialist agricultural premises: To agricultural 'brownfields' and back again? [Article]. Moravian Geographical Reports, 27(4), 207-216. https://doi.org/10.2478/mgr-2019-0016
Osman, R., Frantal, B., Klusacek, P., Kunc, J., & Martinat, S. (2015). Factors affecting brownfield regeneration in post-socialist space: The case of the Czech Republic. Land Use Policy, 48, 309-316. https://doi.org/10.1016/j.landusepol.2015.06.003
Pechrova, M. (2014). Impact of EU Membership on the Development of the Czech Agriculture. Proceedings of the 2nd International Conference on European Integration 2014 (Icei 2014), 545-552.
Penz, H. (1997). Modernization in agriculture: Developments in Austria after World War II. Findings of research into "agriculture" within the research focus of the FWF on "Austria - Space and society". Mitteilungen Der Osterreichischen Geographischen Gesellschaft, 139, 77-100.

Klusáček, P., Navrátil, J., Martinát, S., Charvátová, K., Krejčí, T.
57
Petrea, R., Petrea, D., & Nemes, V. (2011). The brownfield of Padurea Neagra (Crisul Redede Valley). Transylvanian Review of Administrative Sciences(33E), 233-243.
Sang, N., Dramstad, W. E., & Bryn, A. (2014). Regionality in Norwegian farmland abandonment: Inferences from production data. Applied Geography, 55, 238-247. https://doi.org/10.1016/j.apgeog.2014.09.015
Sarris, A. H., Doucha, T., & Mathijs, E. (1999). Agricultural restructuring in central and eastern Europe: implications for competitiveness and rural development. European Review of Agricultural Economics, 26(3), 305-329. https://doi.org/10.1093/erae/26.3.305
Sikandar, F., Erokhin, V., Wang, H. S., Rehman, S., & Ivolga, A. (2021). The Impact of Foreign Capital Inflows on Agriculture Development and Poverty Reduction: Panel Data Analysis for Developing Countries. Sustainability, 13(6), Article 3242. https://doi.org/10.3390/su13063242
Silverman, D. (2018). Doing qualitative research (5th ed.). Sage Publications. Skala, J., Cechmankova, J., Vacha, R., & Horvathova, V. (2013). Varios aspects of the genesis
and perspectives on agricultural brownfields in the Czech Republic. Moravian Geographical Reports, 21(2), 46-55.
Svobodova, H., & Veznik, A. (2009). To the problems of agricultural brownfields in the Czech Republic - Case study of the Vysocina region. Agricultural Economics-Zemedelska Ekonomika, 55(11), 550-556.
Swinnen, J. F. M., & Vranken, L. (2010). Reforms and agricultural productivity in Central and Eastern Europe and the Former Soviet Republics: 1989-2005. Journal of Productivity Analysis, 33(3), 241-258. https://doi.org/10.1007/s11123-009-0162-6
Tuna, E., & Karantininis, K. (2021). Agricultural cooperatives as social capital hubs-A case in a post-socialist country. Journal of Co-Operative Organization and Management, 9(1), Article 100134. https://doi.org/10.1016/j.jcom.2021.100134
Veznik, A., & Bartosova, L. (2004). Selected regional geographical differences of the Czech Republic agriculture, after the transformation processes. Agricultural Economics, 50(5), 207-216.
Veznik, A., Kral, M., & Svobodova, H. (2013). Agriculture of the Czech Republic in the 21st century: From productivism to post-productivism. Quaestiones Geographicae, 32(4), 7-14.
Walkenhorst, P. (2000). Foreign direct investment, technological spillovers and the agricultural transition in central Europe. Post-Communist Economies, 12(1), 61-75. https://doi.org/10.1080/14631370050002675
Wendel, H. E. W., & Mihelcic, J. R. (2009). Evaluating the social, economic, and environmental drivers of urban brownfields redevelopment in Santa Cruz, Bolivia. Ecosystems and Sustainable Development Vii, 122, 343-352. https://doi.org/10.2495/eco090321
DETUROPE – THE CENTRAL EUROPEAN JOURNAL OF REGIONAL DEVELOPMENT AND TOURISM Vol. 13 Issue 3 2021 ISSN 1821-2506
58
Original scientific paper
EXAMINING THE VISIBILITY OF SOCIAL RESPONSIBILITY ON
THE WEBSITES OF HUNGARIAN STATE UNIVERSITIES
Adrienn REISINGERa, Zsolt DÁNOSb
a associate professor, Széchenyi István University, Kautz Gyula Faculty of Business and Economics, e-mail: [email protected] b executive expert, Óbuda University, Rector’s Office, e-mail: [email protected]
Cite this article: Reisinger, A., Dános, Z. (2021). Examining the Visibility of Social Responsibility on the Websites of Hungarian State Universities. Deturope. 13(3), 58-72.
Abstract
The paper investigates university social responsibility at Hungarian universities by examining their websites. Although the concept of university social responsibility has existed for nearly 20 years, the scope of its research and theoretical literature still falls far short of that of corporate social responsibility. There is extant literature on the topic including case studies from around the world showing the importance of university social responsibility. Nevertheless, the scope of thematic analysis of the topic is very narrow with only a few pieces of comprehensive systematic research published so far, and the theoretical literature only highlights the work of some major researchers. Due to the complexity of the topic, the amount of previous literature attempting to explore the effects of university social responsibility is also limited. The aim of this paper is to investigate how terms relating to social responsibility appear on the websites of Hungarian universities. In autumn 2019 research was carried out involving twenty-one universities. The paper analyses how social responsibility is visible on university websites based on given keywords. The research employed quantitative content analysis. The hypothesis was that based on visibility the same university categories can be formed according to the size and profile of the institutions. According to the authors’ present knowledge no such research has been carried out in Hungary so far. There are some university website researches in different countries but with different purposes with the special focus on sustainability. So the method of the present research is an attempt to find out how to measure the social responsibility visibility of universities and how to make categorizations based on the analyses. The limitation of the research is, among others, that universities have different search engines on their websites, which can lead to the misinterpretation of results. The main findings are that the visibility of social responsibility based on website analyses depends not only on the size and profile of the institutions; therefore, the investigation of visibility can contribute to the creation of new categories proving that social responsibility is far beyond the size or profile of the universities. The findings can help institutions develop the conscious communication of their social responsibility activity, and provide assistance to the research community. Keywords: university social responsibility, Hungarian higher education, content analysis, website, visibility
INTRODUCTION
Nowadays, university missions have been amended and transformed with an unprecedented
intensity. Regarding the mission changes, it is important to highlight the concept of the so-
called academic revolutions (Etzkowitz, Webster, Gebhardt & Castiano Terra, 2000), which
enabled some university tasks to be supplemented with new functions. Thus, on the occasion
of each revolution, besides education (teaching – learning), research and then the complex third
Reisinger, A., Dános, Z.
59
mission appeared, which mostly involves the role of service provider, although its interpretation
differs in literature. One of the new approaches of this third mission is university social
responsibility which has received more attention in Hungarian higher education in recent years.
The goal of the paper is to ascertain how the term ‘social responsibility’ is visible on
Hungarian university websites. A web content analysis was carried out in autumn 2019. The
paper investigates twenty-one universities which were state-funded institutions at that time. By
the time of publication only a handful remain state universities, while the others operate in a
new form. This fact might have an effect on our results but we believe that as only a relatively
short period has passed since the transformation, significant changes may not be experienced
at the institutions. One limitation of the analysis could be that universities have different kinds
of websites with different search engines, which can lead to misinterpretable results. Despite
this fact we have chosen websites for analysis, because institutional websites are equally
accessible to anyone from anywhere in the world and are the only forum of the institutions
where they can make their activities equally visible. Institutional communication, therefore,
becomes a potential area of university social responsibility, and at the same time the most
important form of its expression. The study uses the concept of the visibility of activities by
finding keywords to illustrate how website communication contributes to university social
responsibility. The guiding principle of this idea is that communication of social responsibility
can be a part of its realization. The study may be regarded as the first attempt to measure this
visibility by finding keywords related to social responsibility.
The paper is structured as follows: First, it shows the topic of university social responsibility
then it explains the research process and outlines the methods. The second part of the paper
focuses on the results, draws conclusions and makes suggestions for the future.
THEORETICAL BACKGROUND OF UNIVERSITY SOCIAL RESPONSIBILITY
One of the milestones in the history of university social responsibility is the Magna Charta
Universitatum from 1988, which lays out the values of the European university. Although it
strongly emphasised the role of the academic sphere, it also highlighted the significance of
shaping social values. The 1998 UNESCO Decree, the World Declaration on Higher Education
for the Twenty-first Century: Vision and Action, which emphasised the social tasks of the entire
higher education, was conceived in a much more democratic spirit (Veroszta, 2010). The
document has significantly expanded the social tasks of higher education, thus greatly
Reisinger, A., Dános, Z.
60
contributing to the process of including social tasks in the third mission of higher education
institutions in addition to strengthening economic activities.
In the same vein, the 2009 ratification of the 1999 Decree (UNESCO Decree on The New
Dynamics of Higher Education and Research for Societal Change and Development – Gurria,
2009) emphasised the social responsibility of higher education. The document reaffirmed the
responsibility image of the 1998 Decree, in which the social responsibility of higher education
aimed to serve not only the transfer of knowledge, but also a broader horizon of social well-
being and development (Gurria, 2009). The 1998 Decree also greatly contributed to the spiritual
search of the Bologna Process, which was launched in 1999 and aimed to reinforce social values
with a stronger emphasis in higher education curricula (Jorge & Peña, 2017).
Although the literature on university social responsibility is becoming wider and more
diverse, the level of theoretical elaboration, in fact, is still far below the level of corporate social
responsibility (CSR) (Jorge & Peña, 2017). There is still much to be done in the modelling of
university social responsibility, regardless of the fact that numerous studies have been dealing
with various aspects of university responsibility for more than 20 years. The first appearance
of the idea of university social responsibility is linked to Boyer (1996), who created the concept
of Scholarship of Engagement, which can be considered a forerunner of university social
responsibility. He argued that universities should be engaged more in tackling social, moral
and economic problems, and suggested taking responsibility by disseminating the scholarship.
Barker (2004) also suggested the distinction of scholarships on a practical basis.
Bonnen’s work (1998) attempted to make an early interpretation. In addition, the spread of
the term ‘university (either state or private) civil engagement’ also gained ground, being used
as a kind of preliminary synonym of university social responsibility in literature (Esfijani,
Hussain & Chang, 2012). The research direction of the 2000s was mainly covered by the
interpretation of sustainability within the university framework. These works mostly attempted
to model university operation by demonstrating the aspects of sustainable development in
university strategies (Lukman & Glavic, 2007; Velazquez, Munugia, Platt & Taddei, 2006).
Similarly, the 1990 Talloires Declaration also sought to define the concept of the sustainable
university providing a basis for the models.
In addition to the model of the sustainable university, university social responsibility as an
independent concept only emerged in the 2000s, despite the fact that research on the
phenomenon covered by the concept had already existed for a number of years. The initial
models were described with respect to their similarities and differences regarding corporate
social responsibility (Jorge & Peña, 2017). On the emergence of the concept, the models drew
Reisinger, A., Dános, Z.
61
primarily on the stakeholder theory being inspired by studies on corporate social responsibility
(Jongbloed, Enders & Salerno, 2008). Soon, the relevance of traditional stakeholders (e.g.
students) was replaced by other stakeholders such as businesses (Benneworth & Jongbloed,
2010), resulting in a wide range of definitions (Lo, Pang, Egri & Li, 2017). In his study, Ford
(2004) mapped the dimensions of higher education responsibility. According to Ford’s
interpretation, responsibility has been given a very broad context which is less observable in
everyday practice, but irrespective of this, university social responsibility has a number of other
definitions (Jorge & Peña, 2017).
Having reviewed 15 years of literature, Jorge and Peña (2017) attempted to summarise the
essence of university social responsibility. These days the most widespread definition of
university responsibility seems to derive from Francois Vallaeys (2014), who can be considered
one of the fathers of the concept, and also assisted the emergence of the Latin American
university social responsibility movement in the mid-2000s. Central to the author’s approach is
the idea of ‘think globally, do locally’, local commitment and embeddedness, and democratic
knowledge production. His concept is closely linked to the idea of the green university. In his
view sustainability and the fair organisation of learning and research imply that science and
knowledge are not marketable products, because they are directly responsible for value creation.
Key institutions should have a moral responsibility in a global context. However, according to
Vallaeys, universities need to reorganise their entire system to achieve this.
In conclusion, university social responsibility may be interpreted in several ways. It can be
a strategic university organisational model, a vision, even a form of alliance interlacing
universities, or a form of (self) organisation based on university traditions directly
corresponding to social needs. In contrast, it can also involve some independent activities which
offer an opportunity to provide some feedback to society in connection with university tasks
(e.g. knowledge dissemination). In the same manner, it can cover a product which has its own
management and literature, and is essentially a university function designed to support the
relevance of university operations through marketing and PR tools, thus taking a similar form
to the phenomena attacked by CSR critics. These are, however, only possibilities for
interpretation, and we are closer to the correct interpretation if we consider university social
responsibility as a collection category of phenomena, a concept encompassing them, which
includes all segments of the university by covering its role as a social partner. Its main function
is to provide service and support, it aims at non-profit and primarily social utility, and it involves
such phenomena that cover the basic tasks of universities; however, they either go beyond its
traditional frames or take on different forms and roles.
Reisinger, A., Dános, Z.
62
According to our interpretation proposal, university social responsibility is the sum of the
modern roles of higher education institutions, which is undertaken voluntarily or exceeds the
required legal framework. University social responsibility is different from the first two basic
tasks of universities (education and research); nevertheless, it is closely related to them. It is
not linked to economic goals, but to ones that interpret social well-being in a broader sense.
DATA AND METHODS
The analysis presented in this paper is a part of an empirical research (Dános, 2021). The aim
of the research is to determine in which forms and in what way university social responsibility
manifests itself among universities in Hungary. The paper focuses on the analysis of university
websites conducted in autumn 2019. It attempts to find an answer to how often terms related to
university social responsibility appear on university websites and what the message of this
visibility could be.
The research process was as follows:
• To the best of our knowledge, to date no research with a similar methodology has been conducted in Hungary or abroad1, thus first we had to develop the methodology of the analysis.
• Then we identified universities involved in the analysis.
• We drew up a hypothesis.
• We collected those keywords which were included in the website search.
• We carried out the website search in autumn 2019, which was followed by analysing the data.
• Finally, we drew up the conclusions and put forward suggestions.
In autumn 2019 state universities in Hungary included a relatively high number of
institutions, so we decided to examine them. At the time of writing this paper only a few still
belong to this category, the others are governed in a new form called public trust funds. This
fact has imposed some limitation on our findings, in spite of the fact that not much time has
passed since this change. So we believe that the findings on universities obtained in autumn
2019 may hold true and provide guidance for university leaders.
1 At international level we have found some papers which present the results of website analyses of higher education institutions in different countries (e.g. Dade & Hassenzahl, 2013; Hasim, Hashim, Ariff, Sapeciay & Abdullah, 2018), but they have a focus on sustainability and their purpose is different from ours. So in Hungary our research is a completely new one, at international level it is a new approach how to analyse the university social responsibility visibility with the focus on creating groups from the analysed institutions based on the level of visibility.
Reisinger, A., Dános, Z.
63
According to the Act CCIV of 2011 on National Higher Education in autumn 2019 there
were 21 state universities. Their websites were involved into our research. The paper presents
the results of the content analysis of the websites with respect to the degree of visibility in terms
of university social responsibility. The research method seems to be suitable to make the
communication activity of each university’s social responsibility visible.
At first we formed groups from the analysed universities; this classification was the basis of
our hypothesis. Based on previous research by Katalin Bander (2011) the categories of
universities are as follows:
• Classical universities: University of Debrecen (DE), Eötvös Loránd University
(ELTE), University of Pécs (PTE), University of Szeged (SZTE).
• Universities with wide but different professional profile compared to the classical
universities: Budapest University of Technology and Economics (BME), University
of Kaposvár (KE)2, University of Miskolc (ME), Óbuda University (ÓE), University
of Pannonia (PE), University of Sopron (SoE), Szent István University (SZIE)3,
University of Győr (SZE).
• Relatively small universities with special profile: University of Veterinary Medicine
Budapest (ÁTE), Liszt Ferenc Academy of Music (LFZE), Hungarian University of
Fine Arts (MKE), Hungarian Dance Academy (MTE), Moholy-Nagy University of
Arts and Design Budapest (MOME), University of Theatre and Film Arts (SZFE),
University of Physical Education (TE).
• Relatively large universities with special profile: National University of Public Service
(NKE), Semmelweis University (SE)4.
Our hypothesis is that based on the analysis of the websites these categories form a relevant
group with respect to social responsibility. As a result, we supposed that based on the visibility
of social responsibility the same categories could be set up. A quantitative website analysis was
carried out in the case of each institution. Based on the universities websites’ search engines,
we examined the frequency occurrence of the given keywords with reference to the topic social
responsibility on the websites. The keywords were selected based on our former experience on
this topic. The following keywords show the English equivalent of the words searched for on
the websites of the universities:
2 In 2021 it merged with Hungarian University of Agriculture and Life Sciences (MATE). 3 In 2021 it merged with the Hungarian University of Agriculture and Life Sciences (MATE). 4 The abbreviation of each university is based on their Hungarian name.
Reisinger, A., Dános, Z.
64
• social responsibility,
• third mission,
• charity,
• sustainability,
• sustainable development,
• environmental protection,
• equal opportunity,
• voluntary,
• civil,
• indigent.
Using the search engine of the institutional websites each time meant different IT solutions
and search ranges; therefore, it affected our results. Regarding this, it must be mentioned that
in the case of some universities several thousands of website search results were generated,
while in the case of other universities belonging to the same category based on size and profile
only a minimum number of relevant content was found through the search engine, possibly less
than a hundred. All this may have had a distorting effect on the results, thus it is important to
state in advance that this methodology is only suitable for analysing visible and public content,
namely it primarily measures the transparency of university social responsibility. Consequently,
this method may not be suitable for analysing university social responsibility activities directly.
RESULTS
The results of content analysis
Following the survey and the aggregation of the data, we examined to what extent the results
in the case of each institution show a similar picture within the predetermined four categories
(based on the institutions’ size and profile). If the examination had shown similar results within
each category, this would have confirmed the adequacy of the predetermined institutional
categories. However, we had to create new categories, since the visibility of social
responsibility on the websites did not seem to merely follow the size and profile.
Table 1 shows the results of the website search in terms of the frequency occurrence of the
given keywords on the universities’ websites.
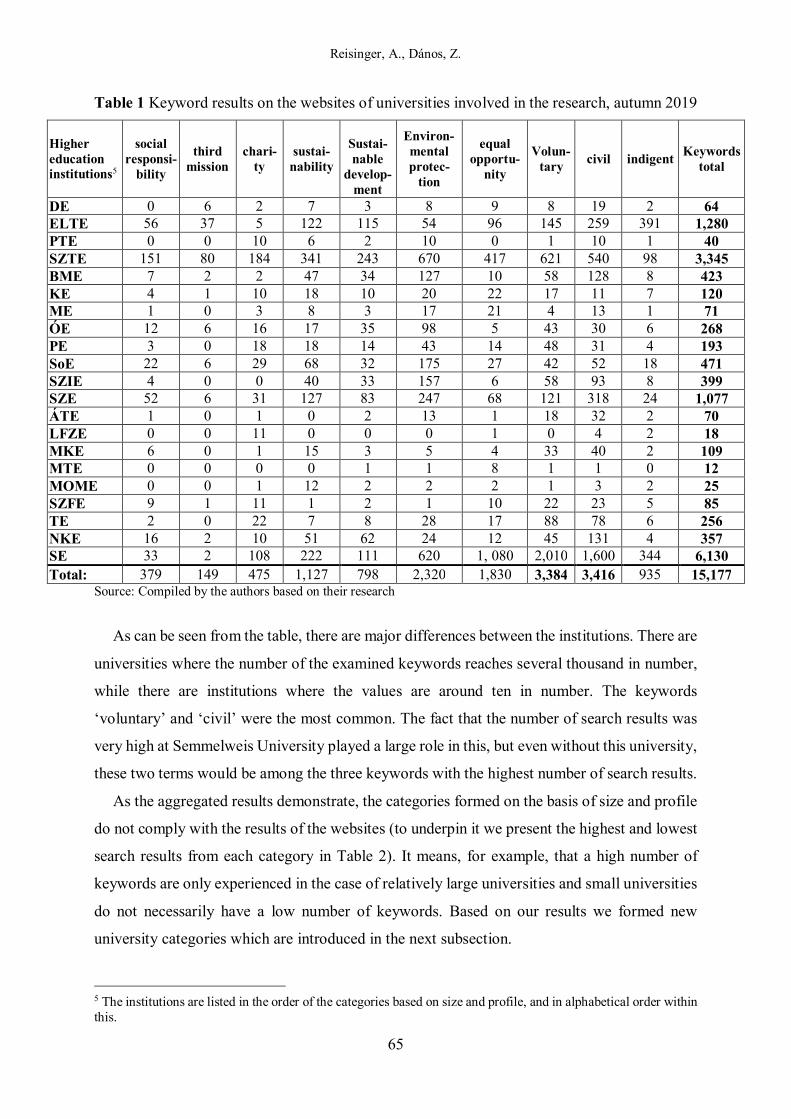
Reisinger, A., Dános, Z.
65
Table 1 Keyword results on the websites of universities involved in the research, autumn 2019
Source: Compiled by the authors based on their research
As can be seen from the table, there are major differences between the institutions. There are
universities where the number of the examined keywords reaches several thousand in number,
while there are institutions where the values are around ten in number. The keywords
‘voluntary’ and ‘civil’ were the most common. The fact that the number of search results was
very high at Semmelweis University played a large role in this, but even without this university,
these two terms would be among the three keywords with the highest number of search results.
As the aggregated results demonstrate, the categories formed on the basis of size and profile
do not comply with the results of the websites (to underpin it we present the highest and lowest
search results from each category in Table 2). It means, for example, that a high number of
keywords are only experienced in the case of relatively large universities and small universities
do not necessarily have a low number of keywords. Based on our results we formed new
university categories which are introduced in the next subsection.
5 The institutions are listed in the order of the categories based on size and profile, and in alphabetical order within this.
Higher education institutions5
social responsi-
bility
third mission
chari-ty
sustai-nability
Sustai-nable
develop-ment
Environ-mental protec-
tion
equal opportu-
nity
Volun-tary
civil indigent Keywords
total
DE 0 6 2 7 3 8 9 8 19 2 64 ELTE 56 37 5 122 115 54 96 145 259 391 1,280 PTE 0 0 10 6 2 10 0 1 10 1 40 SZTE 151 80 184 341 243 670 417 621 540 98 3,345 BME 7 2 2 47 34 127 10 58 128 8 423 KE 4 1 10 18 10 20 22 17 11 7 120 ME 1 0 3 8 3 17 21 4 13 1 71 ÓE 12 6 16 17 35 98 5 43 30 6 268 PE 3 0 18 18 14 43 14 48 31 4 193 SoE 22 6 29 68 32 175 27 42 52 18 471 SZIE 4 0 0 40 33 157 6 58 93 8 399 SZE 52 6 31 127 83 247 68 121 318 24 1,077 ÁTE 1 0 1 0 2 13 1 18 32 2 70 LFZE 0 0 11 0 0 0 1 0 4 2 18 MKE 6 0 1 15 3 5 4 33 40 2 109 MTE 0 0 0 0 1 1 8 1 1 0 12 MOME 0 0 1 12 2 2 2 1 3 2 25 SZFE 9 1 11 1 2 1 10 22 23 5 85 TE 2 0 22 7 8 28 17 88 78 6 256 NKE 16 2 10 51 62 24 12 45 131 4 357 SE 33 2 108 222 111 620 1, 080 2,010 1,600 344 6,130 Total: 379 149 475 1,127 798 2,320 1,830 3,384 3,416 935 15,177
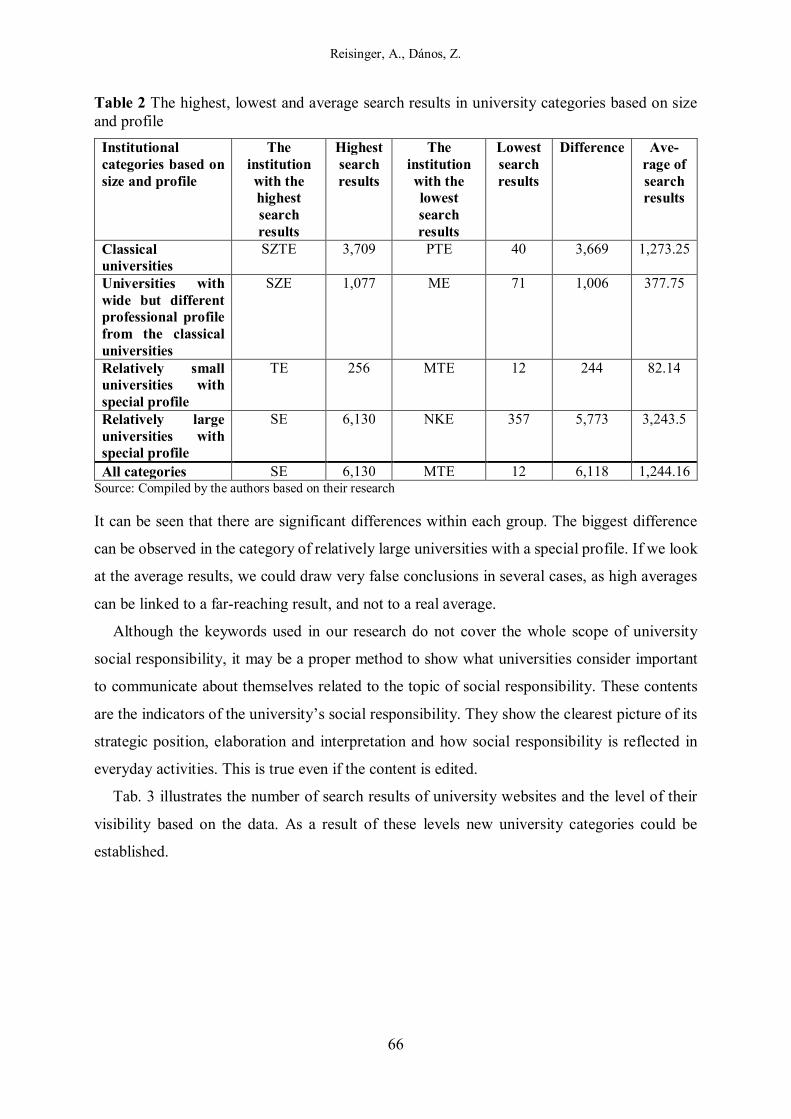
Reisinger, A., Dános, Z.
66
Table 2 The highest, lowest and average search results in university categories based on size and profile
Institutional categories based on size and profile
The institution with the highest search results
Highest search results
The institution with the lowest search results
Lowest search results
Difference Ave-rage of search results
Classical universities
SZTE 3,709 PTE 40 3,669 1,273.25
Universities with wide but different professional profile from the classical universities
SZE 1,077 ME 71 1,006 377.75
Relatively small universities with special profile
TE 256 MTE 12 244 82.14
Relatively large universities with special profile
SE 6,130 NKE 357 5,773 3,243.5
All categories SE 6,130 MTE 12 6,118 1,244.16 Source: Compiled by the authors based on their research
It can be seen that there are significant differences within each group. The biggest difference
can be observed in the category of relatively large universities with a special profile. If we look
at the average results, we could draw very false conclusions in several cases, as high averages
can be linked to a far-reaching result, and not to a real average.
Although the keywords used in our research do not cover the whole scope of university
social responsibility, it may be a proper method to show what universities consider important
to communicate about themselves related to the topic of social responsibility. These contents
are the indicators of the university’s social responsibility. They show the clearest picture of its
strategic position, elaboration and interpretation and how social responsibility is reflected in
everyday activities. This is true even if the content is edited.
Tab. 3 illustrates the number of search results of university websites and the level of their
visibility based on the data. As a result of these levels new university categories could be
established.
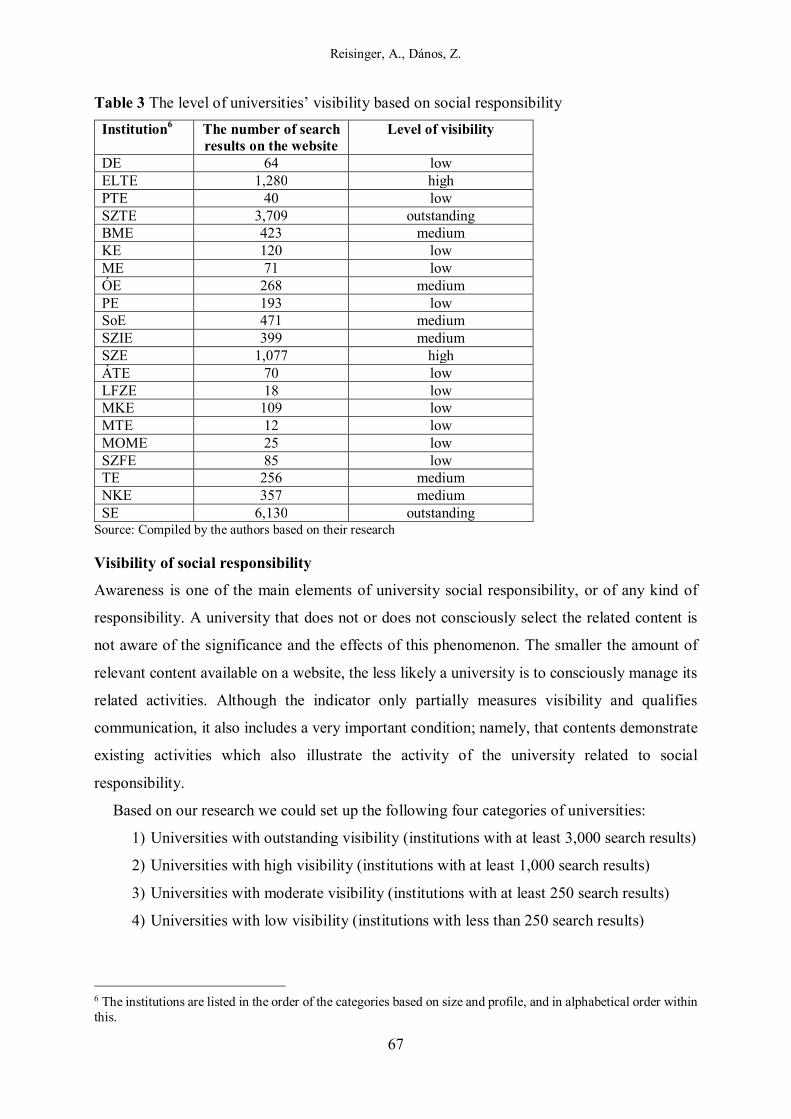
Reisinger, A., Dános, Z.
67
Table 3 The level of universities’ visibility based on social responsibility
Institution6 The number of search results on the website
Level of visibility
DE 64 low ELTE 1,280 high PTE 40 low SZTE 3,709 outstanding BME 423 medium KE 120 low ME 71 low ÓE 268 medium PE 193 low SoE 471 medium SZIE 399 medium SZE 1,077 high ÁTE 70 low LFZE 18 low MKE 109 low MTE 12 low MOME 25 low SZFE 85 low TE 256 medium NKE 357 medium SE 6,130 outstanding
Source: Compiled by the authors based on their research
Visibility of social responsibility
Awareness is one of the main elements of university social responsibility, or of any kind of
responsibility. A university that does not or does not consciously select the related content is
not aware of the significance and the effects of this phenomenon. The smaller the amount of
relevant content available on a website, the less likely a university is to consciously manage its
related activities. Although the indicator only partially measures visibility and qualifies
communication, it also includes a very important condition; namely, that contents demonstrate
existing activities which also illustrate the activity of the university related to social
responsibility.
Based on our research we could set up the following four categories of universities:
1) Universities with outstanding visibility (institutions with at least 3,000 search results)
2) Universities with high visibility (institutions with at least 1,000 search results)
3) Universities with moderate visibility (institutions with at least 250 search results)
4) Universities with low visibility (institutions with less than 250 search results)
6 The institutions are listed in the order of the categories based on size and profile, and in alphabetical order within this.
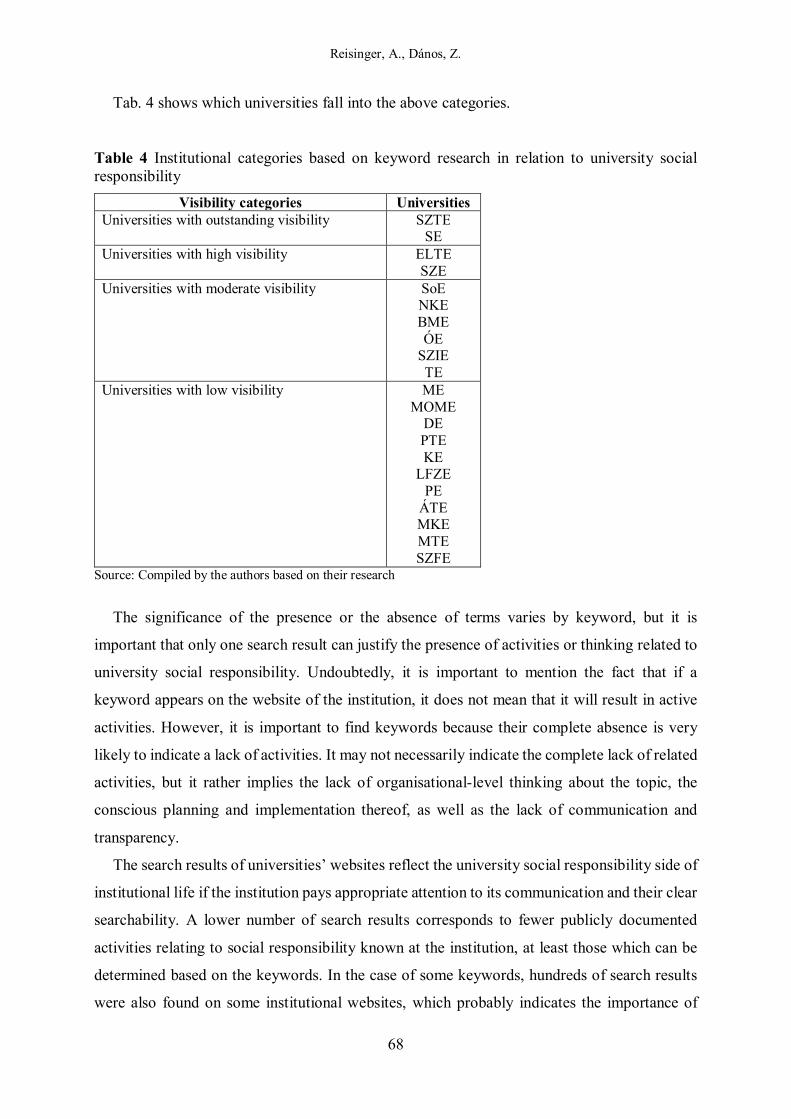
Reisinger, A., Dános, Z.
68
Tab. 4 shows which universities fall into the above categories.
Table 4 Institutional categories based on keyword research in relation to university social responsibility
Visibility categories Universities Universities with outstanding visibility SZTE
SE Universities with high visibility ELTE
SZE Universities with moderate visibility SoE
NKE BME ÓE
SZIE TE
Universities with low visibility ME MOME
DE PTE KE
LFZE PE
ÁTE MKE MTE SZFE
Source: Compiled by the authors based on their research
The significance of the presence or the absence of terms varies by keyword, but it is
important that only one search result can justify the presence of activities or thinking related to
university social responsibility. Undoubtedly, it is important to mention the fact that if a
keyword appears on the website of the institution, it does not mean that it will result in active
activities. However, it is important to find keywords because their complete absence is very
likely to indicate a lack of activities. It may not necessarily indicate the complete lack of related
activities, but it rather implies the lack of organisational-level thinking about the topic, the
conscious planning and implementation thereof, as well as the lack of communication and
transparency.
The search results of universities’ websites reflect the university social responsibility side of
institutional life if the institution pays appropriate attention to its communication and their clear
searchability. A lower number of search results corresponds to fewer publicly documented
activities relating to social responsibility known at the institution, at least those which can be
determined based on the keywords. In the case of some keywords, hundreds of search results
were also found on some institutional websites, which probably indicates the importance of
Reisinger, A., Dános, Z.
69
social responsibility at the university. This is especially the case at institutions where a large
amount of news and more informal announcements are available on the websites.
With respect to our website research the following remarks should be made:
1) IT solutions relating to the design, the accuracy and search range of the website’s
search engine can greatly influence the results; therefore, it is possible to obtain
different final results upon further investigation, both in the case of remarkably
many and extremely few search results.
2) In the case of a large number of search results, a high search result was formed out
of a vast amount of textual material. This may occur because of the large number of
students or the significant role of social responsibility activities at the institutions in
each field.
The display of social responsibility activity on websites is essential because the
communication on the website is suitable to provide everyone with the same and equally
important information about the given activities (depending, of course, on language and
accessibility constraints). Furthermore, the information presented on the website shows the
image that the institution wishes to present of itself in relation to social responsibility.
CONCLUSIONS AND SUGGESTIONS
The aim of the paper was to examine the visibility of university social responsibility on the
websites of Hungarian universities. University social responsibility means that universities
implement activities which exceed the traditional ones – namely education and research.
Universities are concerned with both their immediate environment and the broader community
and society at large. It is important for universities to not only be active in this field but also to
communicate about it. In our research we chose to analyse websites of Hungarian universities.
Examining websites is a kind of guide in terms of the interaction between society and the higher
education institution; how this relationship works and how the socially responsible higher
education institution appears to the outside world.
The demonstrated results contribute to empirical research among universities. We analysed
twenty-one Hungarian universities which were state-funded at the time of the research, in
autumn 2019. At the time of publication, however, only a few remain state universities as many
are now managed by public trust foundations. We believe that this fact does not substantially
Reisinger, A., Dános, Z.
70
influence our results, as only a short time period has passed since the transformation of the
institutions.
Our research used content analysis of university websites. To the best of our knowledge,
such a method has not been employed so far in Hungary. At international level there were some
analyses of university websites but with different focuses. This means that our method of
analysing this topic is an attempt to find out how to measure the visibility of social
responsibility. Consequently, this method may seem to be a proper one to analyse the topic.
We have supposed that based on visibility we can have the same university categories as
those based on the size and profile highlighted in the methodology part. However, we have
found new forms of categorization. We divided universities into four groups in terms of their
visibility: outstanding, high, moderate and low visibility institutions. Our results can be used
for developing the awareness of institutional communication, since it becomes visible what
institutions communicate to society about their activities.
As far as the limitation of the research is concerned, it can be noted that the results are
significantly influenced by the IT backgrounds of the institutional websites, the ways in which
they can be searched and the way in which the sub-websites are connected to each other.
Websites are less able to show the full spectrum of social responsibility of a university, but they
can describe the importance of the activities of a given institution. The limitation of the research
was not only the differences due to IT and websites editing capabilities, but also the fact that
universities make their content available at different communication levels. An interesting
question arises regarding the conscious communication strategy behind the management of
university websites and the financial resources available to the institution in this regard. Our
research was made with the above mentioned limitations in mind; as a result, we focus on
drawing conclusions from the frequency occurrence of keywords related to social responsibility
on universities’ websites.
Analyzing the communication of terms related to social responsibility can help universities
follow and organize their activities and related processes as well as drawing attention to the
social weight of social responsibility, self-image and mission of the institutions.
Communication can support the marketing activities of the institution and attracting students
by shaping the institutional image, providing additional market benefits for universities.
We put forward the following suggestions related to university social responsibility:
1) It can be important to recognize and consciously apply the importance and diverse
functions of university social responsibility which can support modern university
roles.
Reisinger, A., Dános, Z.
71
2) The communication role of university websites related to social responsibility should
be expanded, because this can provide information to the public.
3) Embracing the whole social responsibility approach can be managed by making social
responsibility management a part of university strategy.
The findings of the paper provide an opportunity for further research, e.g. the examination
of other types of institutions, and in the long run they can serve as a basis for extensive
comparative analyses both in a domestic and international environment. The findings make it
possible for institutional activities to become identifiable, collectable and unmatchable, thus
helping clarify what social responsibility of an institution means in practice.
The importance of university social responsibility will increase with the changing roles of
higher education institutions, and the focus will be for a while on defining the concept and
identifying the related elements. In addition, it is also increasingly important to research the
practical implications of social responsibility. We hope that our paper can contribute to this area
and researchers and also practitioners can retrieve some theoretical and practical information
related to university social responsibility.
REFERENCES
Bander, K. (2011). Vállalt küldetések az intézményi honlapok alapján. In: Hrubos, I. (Ed.), Műhelytanulmányok. NFKK Füzetek 8. (pp. 58–88). Budapest: Budapesti Corvinus Egyetem Nemzetközi Felsőoktatási Kutatások Központja.
Barker, D. (2004). The Scholarship of Engagement: A Taxonomy of Five Emerging Practices. Journal of Higher Education Outreach and Engagement, 9(2), 123–137.
Benneworth, P., & Jongbloed, B. (2010). Who matters to universities? A stakeholder perspective on humanities, arts and social sciences valorisation. Higher Education, 59(5), 567–588.
Bonnen, J. T. (1998). The land grant idea and the evolving outreach university. In: Lerner, R. M. & Simon, L. A. (Eds.), University-community collaborations for the 21st century: Outreach to scholarship for youth and families. (pp. 25–70). New York: Garland Press.
Boyer, E. L. (1996) The Scholarship of Engagement. Bulletin of the American Academy of Arts and Sciences, 49(7), 18–33.
Dade, A., & Hassenzahl, D. M. (2013). Communicating sustainability A content analysis of website communications in the United States. International Journal of Sustainability in Higher Education, 14(3), 254–263.
Dános, Z. (2021). A társadalmi felelősségvállalás formái a magyar felsőoktatásban. Doctoral dissertation, Győr: Széchenyi István University. 247. p. https://rgdi.sze.hu//images/RGDI/ honlapelemei/fokozatszerzesi_anyagok/Doktori%20%C3%A9rtekez%C3%A9s_ D%C3%A1nos_Zsolt.pdf
Esfijani, A., Hussain, F. K., & Chang, E. (2012). An approach to university social responsibility ontology development through text analyses. Paper presented at the IEEE 5th International Conference on Human System Interactions, IEEE-HSI-2012.
Reisinger, A., Dános, Z.
72
Etzkowitz, H., Webster, A., Gebhardt, C., & Castiano Terra, B. R. (2000). The future of the university and the university of the future: evolution of ivory tower to entrepreneurial paradigm. Research Policy, 29(2), 313–330.
Ford, D. F. (2004). The Responsibilities of Universities in a Religious and Secular World. Studies in Christian Ethics, 17, 22–37.
Gurria, A. (2009). The New Dynamics of Higher Education and Research For Societal Change and Development. Introductory Remarks. UNESCO World Conference on Higher Education. Retrieved (10 06 2020) from https://www.oecd.org/education/thenewdynamicsofhighereducationandresearchforsocietalchangeanddevelopment.htm
Hasim, M. S., Hashim, A. E., Ariff, N. R. M., Sapeciay, Z., & Abdullah, A. S. (2018). Commitment to sustainability: A content analysis of website for university organisations. IOP Conf. Series: Earth and Environmental Science, 117, 012046
Jongbloed, B., Enders, J. & Salerno, C. (2008). Higher education and its communities: Interconnections, interdependencies and a research agenda. Higher Education, 56(3), 303–324.
Jorge, M. L. & Peña, F. J. A. (2017). Analysing the literature on university social responsibility: A review of selected higher education journals. Higher Education Quarterly, 71, 302–319.
Lo, C. W–H., Pang, R. X., Egri, C. P., & Li, P. H–Y. (2017). University Social Responsibility: Conceptualization and Assessment Framework. In: Shek, D.T. L. & Hollister, R. M. (Eds.), University Social Responsibility and Quality of Life. Quality of Life in Asia, 8, (pp. 37–62). Singapore: Springer.
Lukman, R., & Glavic, P. (2007). What are the key elements of a sustainable university? Clean Technologies and Environmental Policy, 9, 103–114.
Magna Charta Universitatum (1988) Bologna, 18th of September. Retrieved (22 03 2019) from http://www.felvi.hu/pub_bin/kep/felsooktatasimuhely/magna_charta_magyar.pdf
Vallaeys, F. (2014). University Social Responsibility: a mature and responsible definition. In: Global University Network for Innovation (Ed.) Higher Education in the World 3. Higher Education: New Challenges and Emerging Roles for Human and Social Development. (pp. 88–96). Palgrave Macmillan: GUNI Series on the Social Commitment of Universities.
Velazquez, L., Munugia, N., Platt, A., & Taddei, J. (2006). Sustainable university: what can be the matter? Journal of Cleaner Production, 14(9–11), 810–819.
Veroszta, Z. (2010) Felsőoktatási értékek - hallgatói szemmel. A felsőoktatás küldetésére vonatkozó hallgatói értékstruktúrák feltárása. Budapest: Budapesti Corvinus Egyetem, Társadalomtudományi Kar, Szociológia Doktori Iskola.
World Declaration on Higher Education for the Twenty-first Century: Vision and Action (1998). Retrieved (10 06 2020) from https://unesdoc.unesco.org/ark:/48223/pf0000113779?posInSet=3&queryId=77779065-8b38-4a19-b92b-995515487455
DETUROPE – THE CENTRAL EUROPEAN JOURNAL OF REGIONAL DEVELOPMENT AND TOURISM Vol. 13 Issue 3 2021 ISSN 1821-2506
73
Original scientific paper
THE QUANTITATIVE ESTIMATION OF ETHICS: THE REGIONAL
AND NATIONAL INDEX OF ETHICS [THE ETHICS PERCEPTION
INDEX (ETPI)]
Alexander SHEMETEVa
a Prague University of Economics and Business, email: [email protected]
Cite this article: Shemetev, A. (2021). The quantitative estimation of ethics: the Regional and National Index of Ethics [The Ethics Perception Index (ETPI)]. Deturope. 13(3), 73-97.
Abstract
Ethics do not appear from the vacuum. Researchers estimate ethics intuitively. At the same time, there is no quantitative approach for measuring the overall background of ethics in the community. This research aims to present a quantitative process for measuring the general level of ethics in societies. This research aims at presenting a quantitative index of ethics. Researchers can quickly reproduce the results of this index, and it grants the understandability of its main components and the potential for applications. The suggested global index of ethics (ETPI - Ethics Perception Index) creates the basis for further quantitative analysis of the levels of ethics in each region of different countries by RETPI (Regional ETPI). This paper suggests it is crucial to apply a quantitative measure of ethics that is valid for countries and regions. It is the first global and regional index of ethics, upon the best we know. The basis for the estimation of the ethics index is the evaluation of the components related to corruption, economic freedoms, human development, education, human rights, and environmental issues (the depletion of natural resources and other parameters). In addition, this research represents the method for an ordinal estimation of the level of ethics within different subregions. Such evaluation allows comparing different countries and regions in terms of the development of ethics. It is the first global and regional index of ethics, upon the best we know. Keywords: the regional index of ethics, the national index of ethics, development of ethics, ethics, ETPI, RETPI, ethics perception index, quantitative estimation of ethics, social and economic background of ethics
INTRODUCTION
Ethics do not appear from the vacuum. Researchers estimate ethics intuitively. The overall
background forces to form all the branches of ethics in society. At the same time, there is no
quantitative approach to measuring the comprehensive background of ethics in the community.
This research aims to present a quantitative process for measuring the general level of ethics in
societies.
This research aims at presenting a quantitative measurement of ethics, and it grants the
understandability of its main components and the potential for applications. The suggested
global index of ethics (ETPI - Ethics Perception Index) creates the basis for analyzing the levels
of ethics in each region of different countries (RETPI – Regional ETPI). Researchers can
Shemetev, A.
74
quickly reproduce the results of this index. This paper suggests it is crucial to apply a
quantitative measure of ethics that is valid for countries and regions.
The basis for the estimation of the ethics index is the evaluation of the components related
to corruption, economic freedoms, human development, education, human rights, and
environmental issues (the depletion of natural resources and other parameters). In addition, this
research represents the method for an ordinal estimation of the level of ethics within different
subregions. Such evaluation allows comparing different countries and regions in terms of the
development of ethics. It is the first global and regional index of ethics, upon the best we know.
THEORETICAL BACKGROUND
The basis of many types of research is quantitative analysis. For example, a data-based approach
is vital to confirm or disprove some concept or hypothesis. For instance, economics apply
quantitative research and data from the middle of the XX century (Kuznets, 1941; Kuznets,
1941; Smith, 1942). The development of these tools allows for macroeconomic (Doepke et al.,
1999; Williamson, 2018) and microeconomic (Perloff, 1998) forecasting. At the same time,
economists often separate ethics from other disciplines from the very first works in this field
(Smith, 1761; Smith, 1998). Different approaches on ethical issues divided the researchers on
political economists (Cameron et al., 1994; Mandeville, 2011; Rayman & Rayman, 2019;
Ricardo, 2005; A. Smith, 1776), and other schools, like, for example, Marxists (Marx, 1867,
2015; Marx et al., 2012; Rjazanov, 1928; Roth et al., 2017). Nevertheless, quantitative
indicators often prevailed in choosing the proper ways of economic development. For example,
Keynesian economists prove the necessity of governmental interventions based on standard
logic and, later, on data (Beckhart & Keynes, 1936; Hein & Lavoie, 2019; Roberts, 1995; Sims
et al., 2020). The other example is that many prominent researchers applied a similar approach
based on common logic and data for proving or disproving their concepts (Friedman, 1995;
Stiglitz, 2005).
At the same time, there were no quantitative indicators of ethics. The ethical issues often
came either from logic (Hardin & Hayek, 1989; Hayek & Bartley, 2013) or from the common
sense of the borders of ethics7.
7 Prominent researchers (De Mel et al., 2008; Fuchs-Schündeln et al., 2015) describe typical examples of the experiments in economics. A narrow part of population receives some economic resource. Researchers analyze what people do with this exogenous resource. Large-scale experiments could prove any theory much better. In a perfect case, these would be random countries receiving random governments, social structures, and “treatments”; at the same time, such experiments are highly unethical (C. A. Sims, 2010). The computer-run experiments (like, for example, (Heinemann & Noussair, 2015)) are not a perfect remedy as well. People might behave differently in real life than in a computer-run environment. The population selection is another shortcoming of this approach.
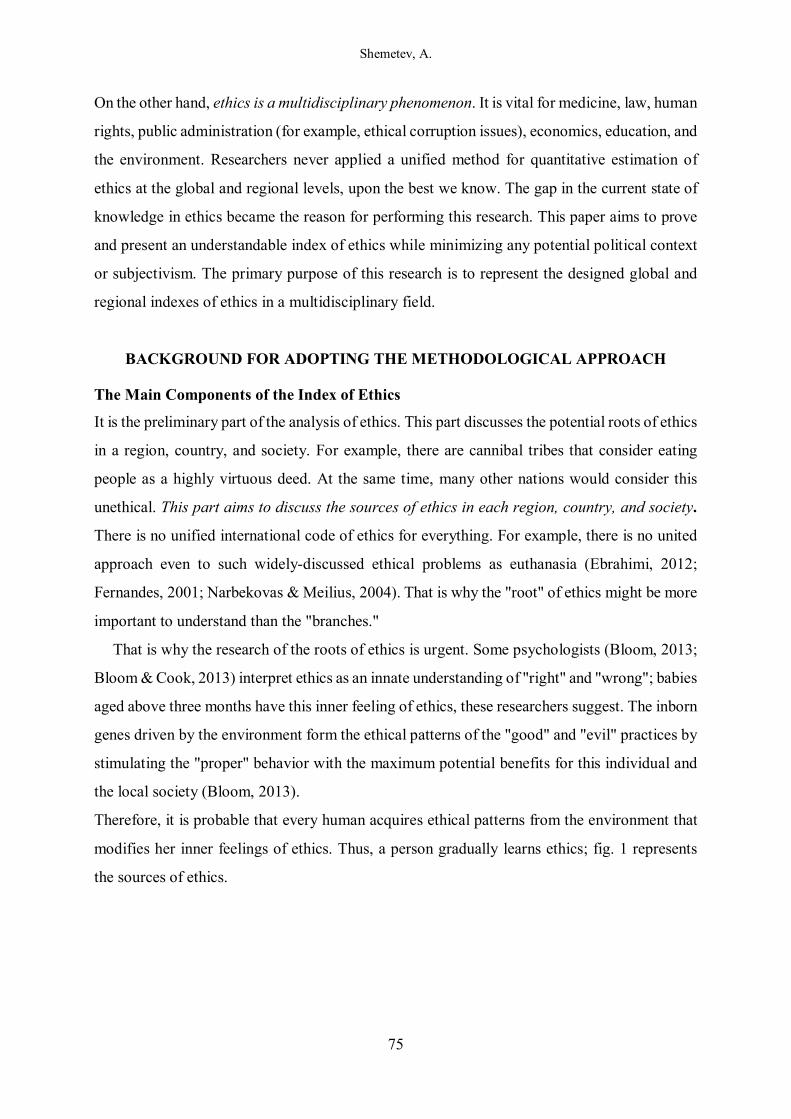
Shemetev, A.
75
On the other hand, ethics is a multidisciplinary phenomenon. It is vital for medicine, law, human
rights, public administration (for example, ethical corruption issues), economics, education, and
the environment. Researchers never applied a unified method for quantitative estimation of
ethics at the global and regional levels, upon the best we know. The gap in the current state of
knowledge in ethics became the reason for performing this research. This paper aims to prove
and present an understandable index of ethics while minimizing any potential political context
or subjectivism. The primary purpose of this research is to represent the designed global and
regional indexes of ethics in a multidisciplinary field.
BACKGROUND FOR ADOPTING THE METHODOLOGICAL APPROACH
The Main Components of the Index of Ethics
It is the preliminary part of the analysis of ethics. This part discusses the potential roots of ethics
in a region, country, and society. For example, there are cannibal tribes that consider eating
people as a highly virtuous deed. At the same time, many other nations would consider this
unethical. This part aims to discuss the sources of ethics in each region, country, and society.
There is no unified international code of ethics for everything. For example, there is no united
approach even to such widely-discussed ethical problems as euthanasia (Ebrahimi, 2012;
Fernandes, 2001; Narbekovas & Meilius, 2004). That is why the "root" of ethics might be more
important to understand than the "branches."
That is why the research of the roots of ethics is urgent. Some psychologists (Bloom, 2013;
Bloom & Cook, 2013) interpret ethics as an innate understanding of "right" and "wrong"; babies
aged above three months have this inner feeling of ethics, these researchers suggest. The inborn
genes driven by the environment form the ethical patterns of the "good" and "evil" practices by
stimulating the "proper" behavior with the maximum potential benefits for this individual and
the local society (Bloom, 2013).
Therefore, it is probable that every human acquires ethical patterns from the environment that
modifies her inner feelings of ethics. Thus, a person gradually learns ethics; fig. 1 represents
the sources of ethics.
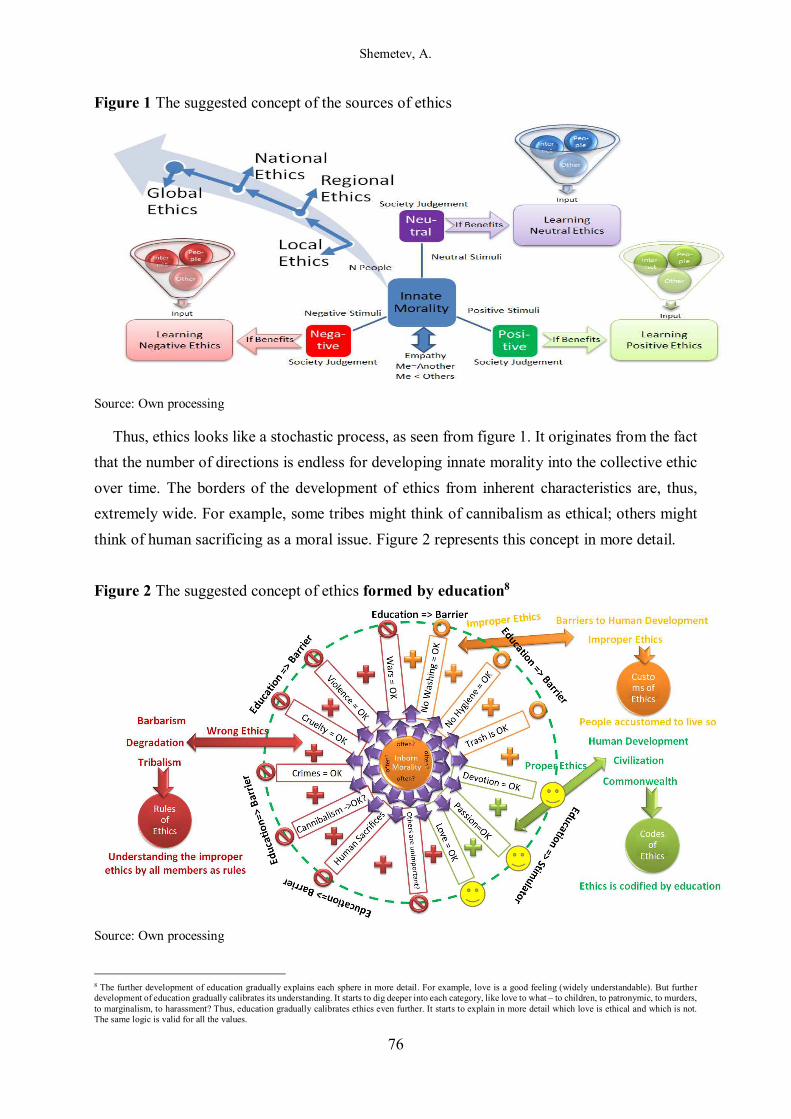
Shemetev, A.
76
Figure 1 The suggested concept of the sources of ethics
Source: Own processing
Thus, ethics looks like a stochastic process, as seen from figure 1. It originates from the fact
that the number of directions is endless for developing innate morality into the collective ethic
over time. The borders of the development of ethics from inherent characteristics are, thus,
extremely wide. For example, some tribes might think of cannibalism as ethical; others might
think of human sacrificing as a moral issue. Figure 2 represents this concept in more detail.
Figure 2 The suggested concept of ethics formed by education8
Source: Own processing
8 The further development of education gradually explains each sphere in more detail. For example, love is a good feeling (widely understandable). But further development of education gradually calibrates its understanding. It starts to dig deeper into each category, like love to what – to children, to patronymic, to murders, to marginalism, to harassment? Thus, education gradually calibrates ethics even further. It starts to explain in more detail which love is ethical and which is not. The same logic is valid for all the values.
Shemetev, A.
77
Thus, education creates a barrier for selecting the mechanisms for proper ethics; it removes the
patterns that might be highly unethical. Education is a sort of filter for selecting "good" and
"bad" practices (from the ethical side). The globalization of education creates the globalized
filter for the best ethical practices. For example, slavery was an essential source of capital for
many companies, regions, and even for some nations. People explained slavery as a common
phenomenon coming from the deep roots of society (ancient world, medieval times, and,
partially, in renaissance and the new times). The development of education distributed the
concept that slavery is highly unethical. It made the society abandon slavery on all official
levels (with some minor exceptions in some countries9 and regions).
Therefore, education creates the foundation for understanding ethics. Education can explain
that some phenomena are ethically "bad." It can also explain why some practices are morally
improper. For example, some wild tribes can practice cannibalism, human sacrifices, or similar
things; these people might not know that such practices are unethical. Moreover, such tribes
might consider similar negative phenomena as a high manifestation of the norms of ethics of
this society, growing them up from early childhood. Proper education can distinguish the
correct ethical standards and, thus, stimulate the development of a community. It can also teach
people to abandon unethical norms.
In addition, nations tend to codify basic ethical principles. These codes describe the desired
outcomes of different scenarios of unethical behavior. For example, a criminal code explains
the consequences of corrupt conduct against individuals. A country can call itself
"constitutional" only if it bases its regulations on the highest ethical standards and norms.
Otherwise, it could be just a country of law10, in the best case. People might consider fair and
well-structured legislation as a written code of ethics.
At the same time, there is no direct way for comparing the legislation of different countries
(or regions) in some cases. For example, there is no unified definition of even such standard
terms as "government" so that all the nations and people would ideally agree with this
definition. Thus, this research suggests that understanding ethics by the formal written statutes
might lead to the impossibility of comparing ethical standards on a national and regional level.
That can become possible in the future with computing and data analysis tools11.
At the same time, education can become a far better tool than just legislation in ethics
research. It forms the apperception of ethical standards in the whole society. For example, some
9 For example, Mauritania (it will gradually come to normal condition with the development of education, this study suggests). 10 „Country of law“ - is a nation that follows its legislative norms in resolving different issues no matter how ethical these statutes are. For example, law can prescribe burn the witches, and the “country of law” can follow it. However, constitutional state would never apply such a law, even if it would exist in its legislation somehow, because it is unethical. The most primitive form of the “country of law” is the “country of customs”, when the oral or written customs become laws no matter how ethical they are in reality. 11 There should be some algorithm that would be capable to read the legislation of all nations and regions and compare it on the highest professional level possible, on the one hand, and the practice of its implication, on the other hand.
Shemetev, A.
78
laws might be unethical. On the other hand, violating some ethical rules is not an offense by
law. An educated society understands ethics: it can impose moral penalties on
individuals/firms/officials who disrespect ethical norms. These moral punishments can range
from disapproving views (or remarks) to a complete boycott by the entire community.
Education is an essential tool for evaluating the development of ethical standards. The
progress of science enriches education. Scientific discussions create suitable materials for
students that improve their understanding of the world and, partially, form their ethics. The
highly advanced education can shift the behavior of the entire society in a proper direction. For
example, trading with slaves was widespread in many countries a few centuries ago. Russia, for
instance, abandoned slavery in 1861. Most of Russia's population were slaves for centuries
before that date (Troinitsky, 1858).
Another example is the Thirteenth Amendment that officially abandoned slavery in the USA
in 1865. Education development explains why certain phenomena (like slavery) are unethical.
Better education allows taking a fresh look at certain phenomena and estimating them from the
ethical position. Thus, proper education creates a solid barrier against all unethical standards in
all spheres.
The Discussion about the Potential Indexes of Ethics
There are many ethical indexes globally (mainly in the financial sphere). For example, there is
a range of Dow Jones Sustainability Indices (DJSI). These indexes list the firms with high
ethical standards (Carlos & Lewis, 2018; Chatterji et al., 2016; Lee & Faff, 2009). At the same
time, these indexes are about the financial sphere to exclude unethical firms from the lists
(Johnson, 2013; Rodgers & Rodgers, 1989; Standard Ethics, 2021).
At the same time, ethical standards do not exist at the financial markets solely to be measured
by the indexes. Ethics is a global phenomenon, and it regulates society in many dimensions:
cultural, spiritual, social, economic, political, and technological. Ethics might vary in different
cultures in various geospatial units (like regions, countries, nations). Thus, analysts should not
measure ethical standards within several large companies only.
Moreover, substantial multinational companies can have headquarters far from the actual
places where they earn their money. For example, some companies can have the US as the
primary source of their profits. At the same time, its headquarters might be somewhere in
Ireland, Bermuda, Barbados, Panama, or any other "financial paradise." Thus, it is unclear if its
high ethical standards belong to the US, Bermuda, Barbados, Panama, or other countries. How
should we share the high ethics of such companies within numerous countries they might exist?
Can society estimate its ethics by the standards of ethics at financial markets? This research
Shemetev, A.
79
suggests the concept that ethics is a broad phenomenon. At the same time, we did not find any
quantitative ethics indexes on regional and national levels, upon the best we know. The gap in
the current state of knowledge became the reason and the motivation of this research.
Another approach is an attempt to estimate the levels of freedoms (Fundación para el Avance
de la Libertad, 2019). It is a relatively new approach. It estimates freedoms (that is close to
ethics (Fundación para el Avance de la Libertad, 2019)). This approach estimates five
categories: religion, bioethics, drugs, sex, and family/gender. An ideal country should have free
faith, abortions, minimally controlled drugs, free sex, and easy approaches to family and gender.
The measurement of these characteristics is expert-based and, thus, is highly subjective. For
example, Afghanistan is at the end of this rating in 2020. However, this country can be among
the most accessible places on the planet to take drugs, probably, more accessible than at the
leader of the rating of 2020 – the Netherlands (Varlamov, 2021a, 2021c, 2021b). Thus, 1/6 of
the local component of freedom can be of a high value in 2020 (even though the lowest total
rating). The absence of a transparent and reproducible quantitative basis for estimating such
indices doesn't allow researchers to reproduce calculations and assess any potential bias. In
addition, that approach (Fundación para el Avance de la Libertad, 2019) estimates a person as
a rational consumer who maximizes her utility by consuming a more comprehensive range of
commodities provided by the broader freedoms that make her life easier. At the same time,
these authors measure the levels of ethics and freedoms beyond the questions of corruption,
ecology, healthcare, education, depletion of natural resources, and many more.
This paper suggests another approach for estimating ethics. This research estimates ethics as
a quantitative measure, and it applies an analysis of the ethical background in a region or a
nation as a whole. This way of thinking is new in scientific literature, upon the best we know.
Accordingly, the proposed method forms a unique index.
DATA AND METHODS
The first step is obtaining the data. This research utilizes seven components to estimate the
ethics perception index: corruption perception index [CPI] (Bevir & Letki, 2012; Heide, 2020;
Lambsdorff, 2017; Transparency International, 2020), economic freedom index [EFI] (Fraser
Institute, 2021), education index (EI) (United Nations Development Programme, 2021a),
human development index [HDI] (UNDP, 2020), human rights score index [HRS] (Our World
in Data, 2020), Natural resource depletion (% of GNI) (Our World in Data, 2020; United
Nations Development Programme, 2021b; World Bank, 2020), environmental performance
index (Conrad & Cassar, 2019; Wendling et al., 2020).
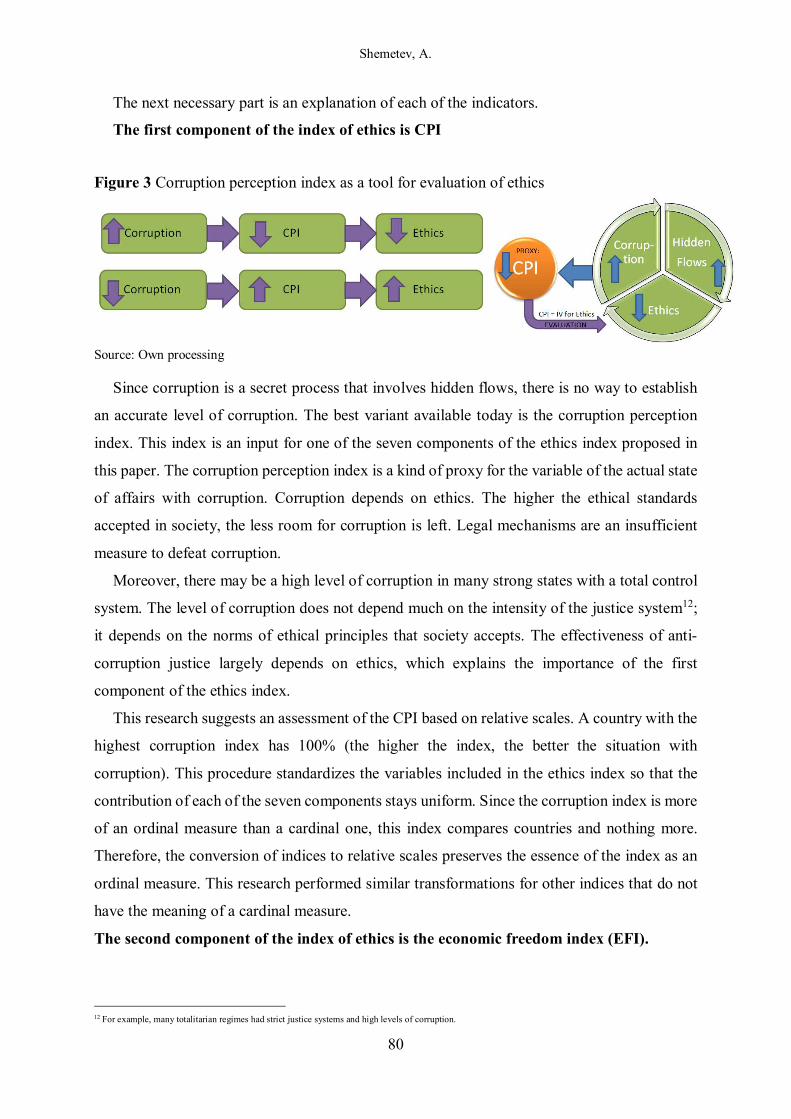
Shemetev, A.
80
The next necessary part is an explanation of each of the indicators.
The first component of the index of ethics is CPI
Figure 3 Corruption perception index as a tool for evaluation of ethics
Source: Own processing
Since corruption is a secret process that involves hidden flows, there is no way to establish
an accurate level of corruption. The best variant available today is the corruption perception
index. This index is an input for one of the seven components of the ethics index proposed in
this paper. The corruption perception index is a kind of proxy for the variable of the actual state
of affairs with corruption. Corruption depends on ethics. The higher the ethical standards
accepted in society, the less room for corruption is left. Legal mechanisms are an insufficient
measure to defeat corruption.
Moreover, there may be a high level of corruption in many strong states with a total control
system. The level of corruption does not depend much on the intensity of the justice system12;
it depends on the norms of ethical principles that society accepts. The effectiveness of anti-
corruption justice largely depends on ethics, which explains the importance of the first
component of the ethics index.
This research suggests an assessment of the CPI based on relative scales. A country with the
highest corruption index has 100% (the higher the index, the better the situation with
corruption). This procedure standardizes the variables included in the ethics index so that the
contribution of each of the seven components stays uniform. Since the corruption index is more
of an ordinal measure than a cardinal one, this index compares countries and nothing more.
Therefore, the conversion of indices to relative scales preserves the essence of the index as an
ordinal measure. This research performed similar transformations for other indices that do not
have the meaning of a cardinal measure.
The second component of the index of ethics is the economic freedom index (EFI).
12 For example, many totalitarian regimes had strict justice systems and high levels of corruption.
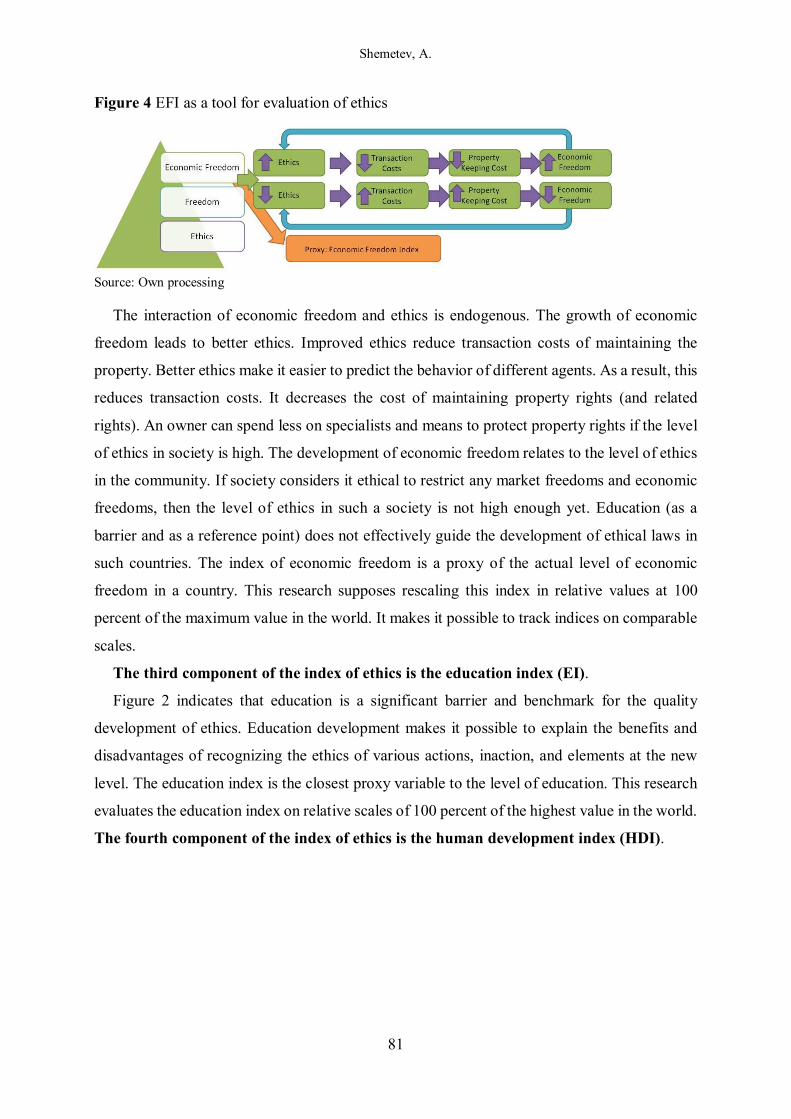
Shemetev, A.
81
Figure 4 EFI as a tool for evaluation of ethics
Source: Own processing
The interaction of economic freedom and ethics is endogenous. The growth of economic
freedom leads to better ethics. Improved ethics reduce transaction costs of maintaining the
property. Better ethics make it easier to predict the behavior of different agents. As a result, this
reduces transaction costs. It decreases the cost of maintaining property rights (and related
rights). An owner can spend less on specialists and means to protect property rights if the level
of ethics in society is high. The development of economic freedom relates to the level of ethics
in the community. If society considers it ethical to restrict any market freedoms and economic
freedoms, then the level of ethics in such a society is not high enough yet. Education (as a
barrier and as a reference point) does not effectively guide the development of ethical laws in
such countries. The index of economic freedom is a proxy of the actual level of economic
freedom in a country. This research supposes rescaling this index in relative values at 100
percent of the maximum value in the world. It makes it possible to track indices on comparable
scales.
The third component of the index of ethics is the education index (EI).
Figure 2 indicates that education is a significant barrier and benchmark for the quality
development of ethics. Education development makes it possible to explain the benefits and
disadvantages of recognizing the ethics of various actions, inaction, and elements at the new
level. The education index is the closest proxy variable to the level of education. This research
evaluates the education index on relative scales of 100 percent of the highest value in the world.
The fourth component of the index of ethics is the human development index (HDI).
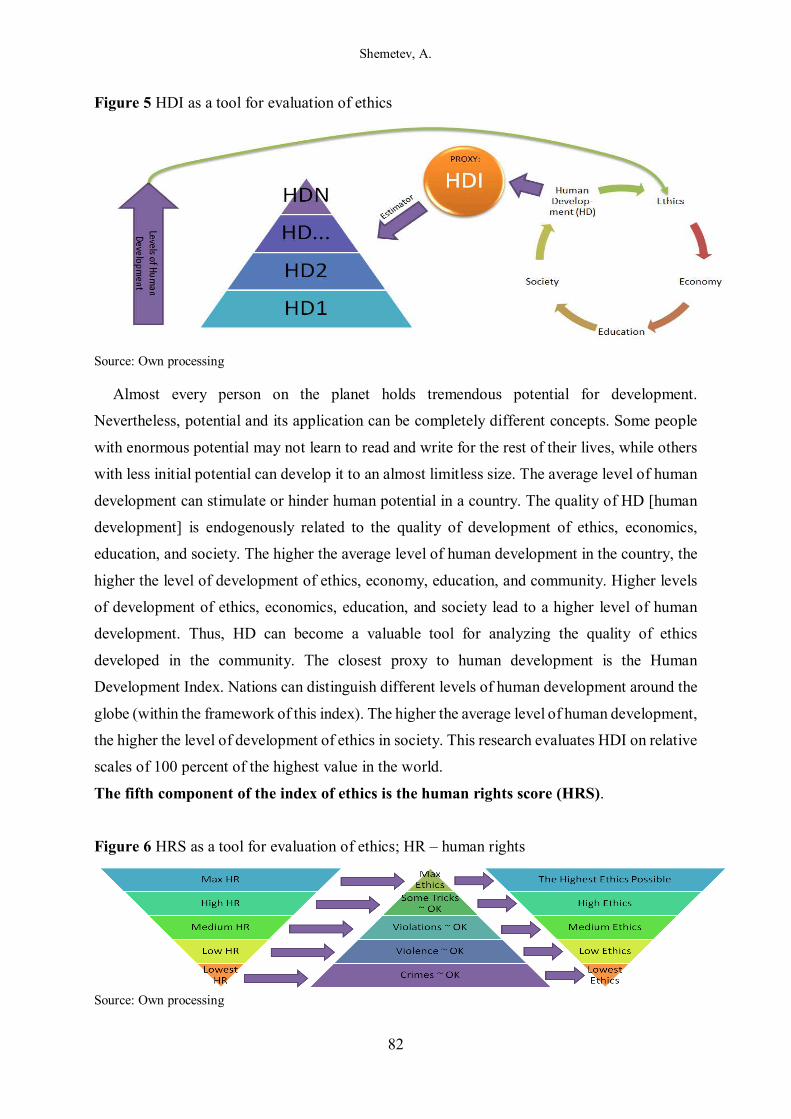
Shemetev, A.
82
Figure 5 HDI as a tool for evaluation of ethics
Source: Own processing
Almost every person on the planet holds tremendous potential for development.
Nevertheless, potential and its application can be completely different concepts. Some people
with enormous potential may not learn to read and write for the rest of their lives, while others
with less initial potential can develop it to an almost limitless size. The average level of human
development can stimulate or hinder human potential in a country. The quality of HD [human
development] is endogenously related to the quality of development of ethics, economics,
education, and society. The higher the average level of human development in the country, the
higher the level of development of ethics, economy, education, and community. Higher levels
of development of ethics, economics, education, and society lead to a higher level of human
development. Thus, HD can become a valuable tool for analyzing the quality of ethics
developed in the community. The closest proxy to human development is the Human
Development Index. Nations can distinguish different levels of human development around the
globe (within the framework of this index). The higher the average level of human development,
the higher the level of development of ethics in society. This research evaluates HDI on relative
scales of 100 percent of the highest value in the world.
The fifth component of the index of ethics is the human rights score (HRS).
Figure 6 HRS as a tool for evaluation of ethics; HR – human rights
Source: Own processing
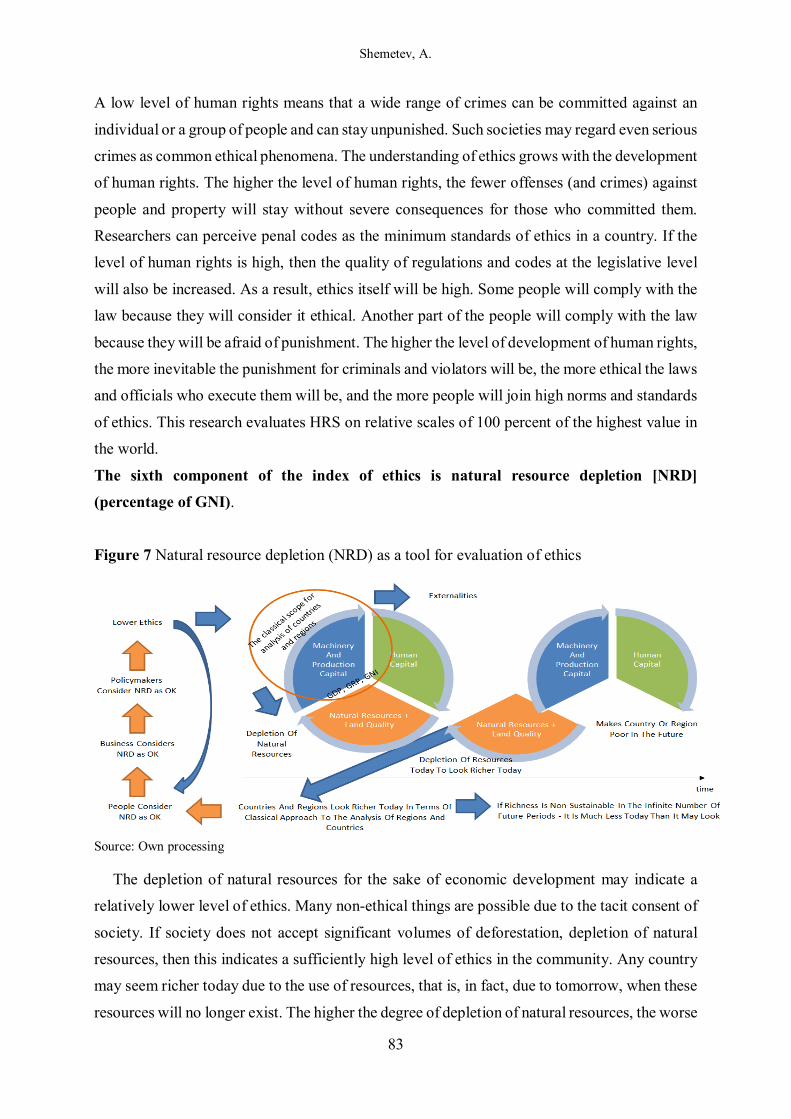
Shemetev, A.
83
A low level of human rights means that a wide range of crimes can be committed against an
individual or a group of people and can stay unpunished. Such societies may regard even serious
crimes as common ethical phenomena. The understanding of ethics grows with the development
of human rights. The higher the level of human rights, the fewer offenses (and crimes) against
people and property will stay without severe consequences for those who committed them.
Researchers can perceive penal codes as the minimum standards of ethics in a country. If the
level of human rights is high, then the quality of regulations and codes at the legislative level
will also be increased. As a result, ethics itself will be high. Some people will comply with the
law because they will consider it ethical. Another part of the people will comply with the law
because they will be afraid of punishment. The higher the level of development of human rights,
the more inevitable the punishment for criminals and violators will be, the more ethical the laws
and officials who execute them will be, and the more people will join high norms and standards
of ethics. This research evaluates HRS on relative scales of 100 percent of the highest value in
the world.
The sixth component of the index of ethics is natural resource depletion [NRD]
(percentage of GNI).
Figure 7 Natural resource depletion (NRD) as a tool for evaluation of ethics
Source: Own processing
The depletion of natural resources for the sake of economic development may indicate a
relatively lower level of ethics. Many non-ethical things are possible due to the tacit consent of
society. If society does not accept significant volumes of deforestation, depletion of natural
resources, then this indicates a sufficiently high level of ethics in the community. Any country
may seem richer today due to the use of resources, that is, in fact, due to tomorrow, when these
resources will no longer exist. The higher the degree of depletion of natural resources, the worse
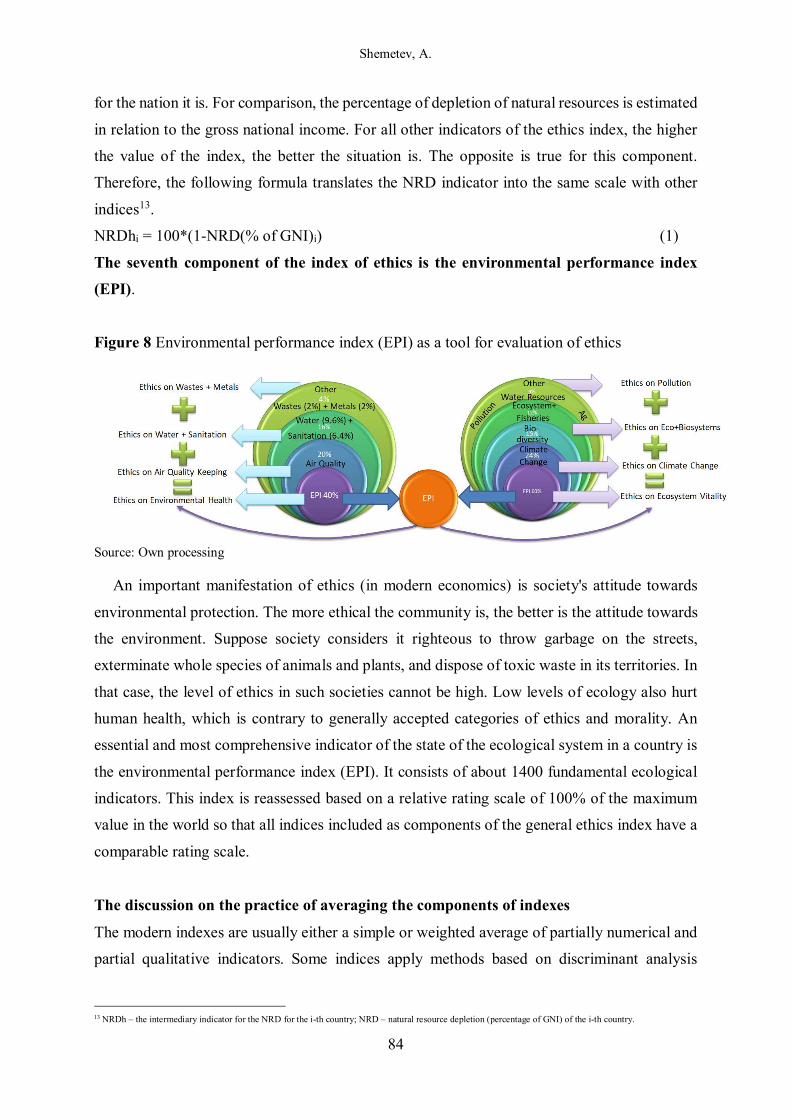
Shemetev, A.
84
for the nation it is. For comparison, the percentage of depletion of natural resources is estimated
in relation to the gross national income. For all other indicators of the ethics index, the higher
the value of the index, the better the situation is. The opposite is true for this component.
Therefore, the following formula translates the NRD indicator into the same scale with other
indices13.
NRDhi = 100*(1-NRD(% of GNI)i) (1)
The seventh component of the index of ethics is the environmental performance index
(EPI).
Figure 8 Environmental performance index (EPI) as a tool for evaluation of ethics
Source: Own processing
An important manifestation of ethics (in modern economics) is society's attitude towards
environmental protection. The more ethical the community is, the better is the attitude towards
the environment. Suppose society considers it righteous to throw garbage on the streets,
exterminate whole species of animals and plants, and dispose of toxic waste in its territories. In
that case, the level of ethics in such societies cannot be high. Low levels of ecology also hurt
human health, which is contrary to generally accepted categories of ethics and morality. An
essential and most comprehensive indicator of the state of the ecological system in a country is
the environmental performance index (EPI). It consists of about 1400 fundamental ecological
indicators. This index is reassessed based on a relative rating scale of 100% of the maximum
value in the world so that all indices included as components of the general ethics index have a
comparable rating scale.
The discussion on the practice of averaging the components of indexes
The modern indexes are usually either a simple or weighted average of partially numerical and
partial qualitative indicators. Some indices apply methods based on discriminant analysis
13 NRDh – the intermediary indicator for the NRD for the i-th country; NRD – natural resource depletion (percentage of GNI) of the i-th country.
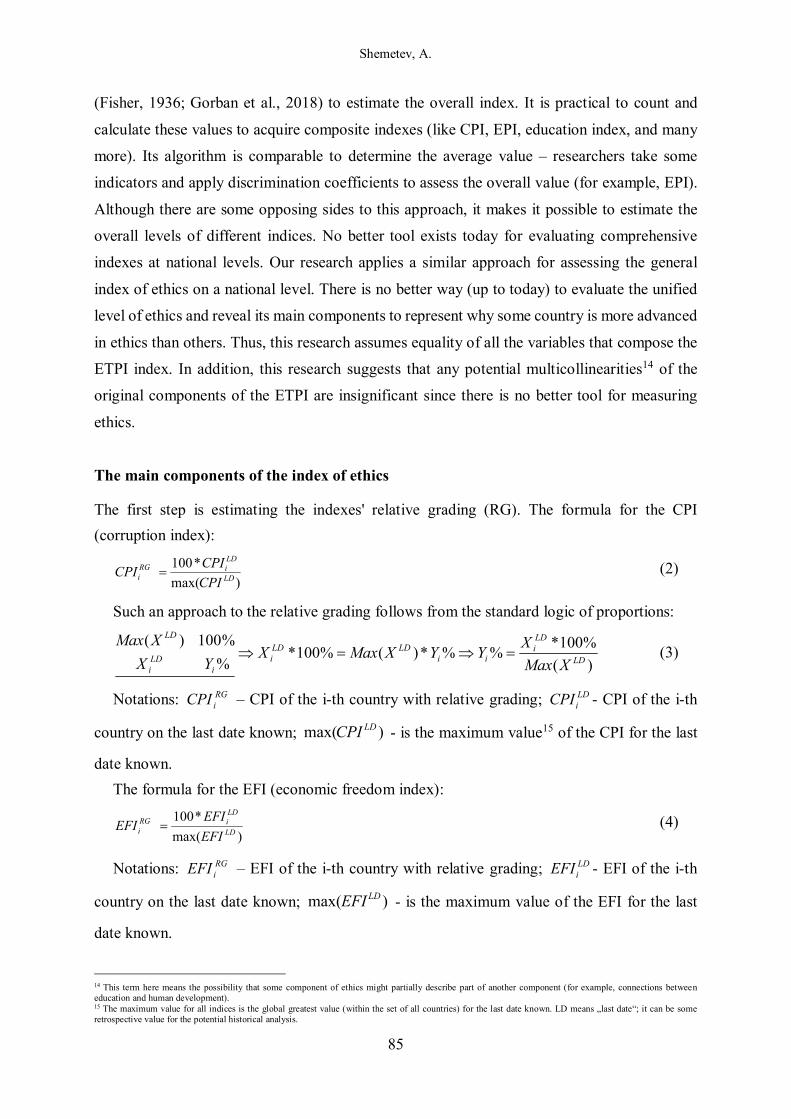
Shemetev, A.
85
(Fisher, 1936; Gorban et al., 2018) to estimate the overall index. It is practical to count and
calculate these values to acquire composite indexes (like CPI, EPI, education index, and many
more). Its algorithm is comparable to determine the average value – researchers take some
indicators and apply discrimination coefficients to assess the overall value (for example, EPI).
Although there are some opposing sides to this approach, it makes it possible to estimate the
overall levels of different indices. No better tool exists today for evaluating comprehensive
indexes at national levels. Our research applies a similar approach for assessing the general
index of ethics on a national level. There is no better way (up to today) to evaluate the unified
level of ethics and reveal its main components to represent why some country is more advanced
in ethics than others. Thus, this research assumes equality of all the variables that compose the
ETPI index. In addition, this research suggests that any potential multicollinearities14 of the
original components of the ETPI are insignificant since there is no better tool for measuring
ethics.
The main components of the index of ethics
The first step is estimating the indexes' relative grading (RG). The formula for the CPI
(corruption index):
)max(
*100LD
LDiRG
i CPI
CPICPI = (2)
Such an approach to the relative grading follows from the standard logic of proportions:
)(
%100*%%*)(%100*
%
%100)(LD
LDi
iiLDLD
ii
LDi
LD
XMax
XYYXMaxX
YX
XMax=⇒=⇒ (3)
Notations: RGiCPI – CPI of the i-th country with relative grading; LD
iCPI - CPI of the i-th
country on the last date known; )max( LDCPI - is the maximum value15 of the CPI for the last
date known.
The formula for the EFI (economic freedom index):
)max(
*100LD
LDiRG
i EFI
EFIEFI = (4)
Notations: RGiEFI – EFI of the i-th country with relative grading; LD
iEFI - EFI of the i-th
country on the last date known; )max( LDEFI - is the maximum value of the EFI for the last
date known.
14 This term here means the possibility that some component of ethics might partially describe part of another component (for example, connections between education and human development). 15 The maximum value for all indices is the global greatest value (within the set of all countries) for the last date known. LD means „last date“; it can be some retrospective value for the potential historical analysis.
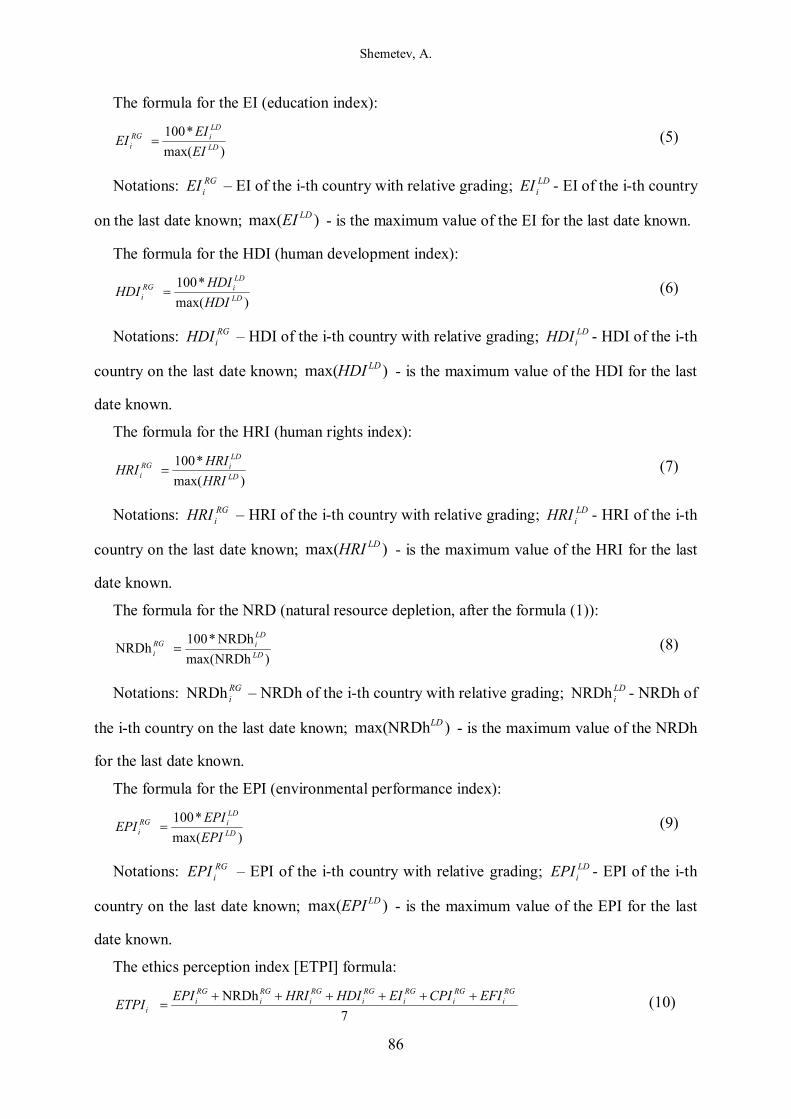
Shemetev, A.
86
The formula for the EI (education index):
)max(
*100LD
LDiRG
i EI
EIEI = (5)
Notations: RGiEI – EI of the i-th country with relative grading; LD
iEI - EI of the i-th country
on the last date known; )max( LDEI - is the maximum value of the EI for the last date known.
The formula for the HDI (human development index):
)max(
*100LD
LDiRG
i HDI
HDIHDI = (6)
Notations: RGiHDI – HDI of the i-th country with relative grading; LD
iHDI - HDI of the i-th
country on the last date known; )max( LDHDI - is the maximum value of the HDI for the last
date known.
The formula for the HRI (human rights index):
)max(
*100LD
LDiRG
i HRI
HRIHRI = (7)
Notations: RGiHRI – HRI of the i-th country with relative grading; LD
iHRI - HRI of the i-th
country on the last date known; )max( LDHRI - is the maximum value of the HRI for the last
date known.
The formula for the NRD (natural resource depletion, after the formula (1)):
)NRDhmax(
NRDh*100NRDh
LD
LDiRG
i = (8)
Notations: RGiNRDh – NRDh of the i-th country with relative grading; LD
iNRDh - NRDh of
the i-th country on the last date known; )NRDhmax( LD - is the maximum value of the NRDh
for the last date known.
The formula for the EPI (environmental performance index):
)max(
*100LD
LDiRG
i EPI
EPIEPI = (9)
Notations: RGiEPI – EPI of the i-th country with relative grading; LD
iEPI - EPI of the i-th
country on the last date known; )max( LDEPI - is the maximum value of the EPI for the last
date known.
The ethics perception index [ETPI] formula:
7
NRDh RGi
RGi
RGi
RGi
RGi
RGi
RGi
i
EFICPIEIHDIHRIEPIETPI
++++++= (10)
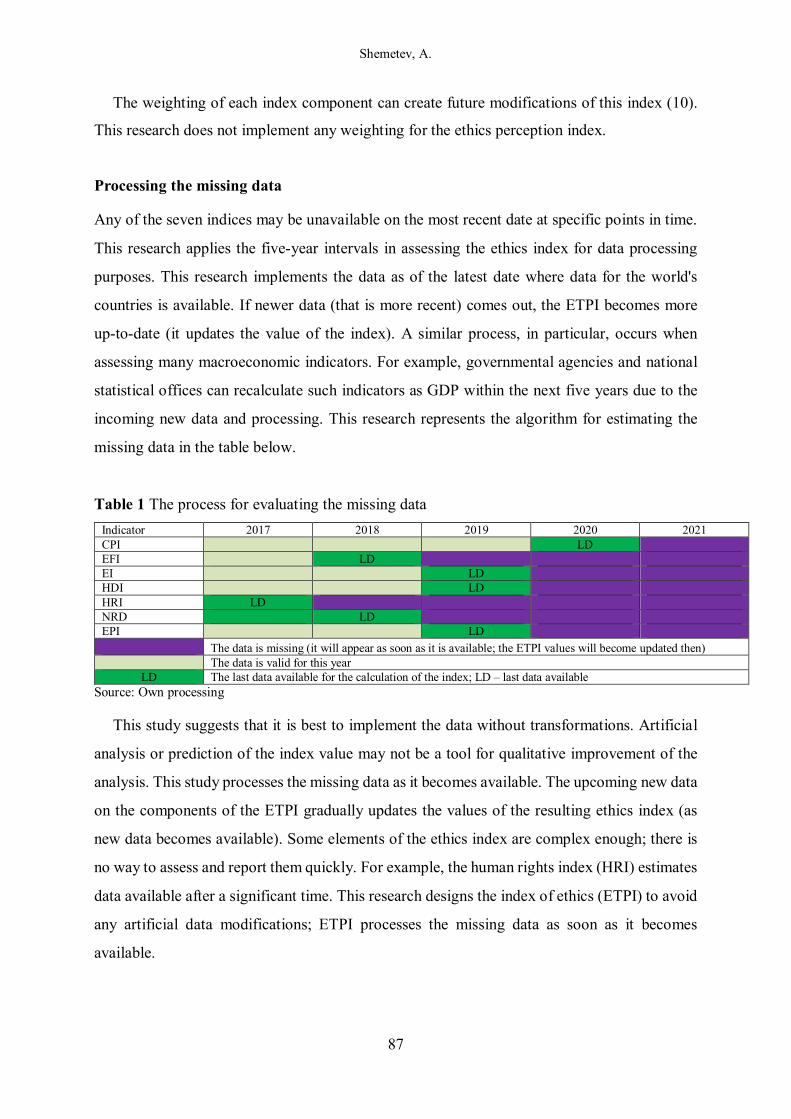
Shemetev, A.
87
The weighting of each index component can create future modifications of this index (10).
This research does not implement any weighting for the ethics perception index.
Processing the missing data
Any of the seven indices may be unavailable on the most recent date at specific points in time.
This research applies the five-year intervals in assessing the ethics index for data processing
purposes. This research implements the data as of the latest date where data for the world's
countries is available. If newer data (that is more recent) comes out, the ETPI becomes more
up-to-date (it updates the value of the index). A similar process, in particular, occurs when
assessing many macroeconomic indicators. For example, governmental agencies and national
statistical offices can recalculate such indicators as GDP within the next five years due to the
incoming new data and processing. This research represents the algorithm for estimating the
missing data in the table below.
Table 1 The process for evaluating the missing data
Indicator 2017 2018 2019 2020 2021 CPI LD EFI LD EI LD HDI LD HRI LD NRD LD EPI LD
The data is missing (it will appear as soon as it is available; the ETPI values will become updated then) The data is valid for this year
LD The last data available for the calculation of the index; LD – last data available Source: Own processing
This study suggests that it is best to implement the data without transformations. Artificial
analysis or prediction of the index value may not be a tool for qualitative improvement of the
analysis. This study processes the missing data as it becomes available. The upcoming new data
on the components of the ETPI gradually updates the values of the resulting ethics index (as
new data becomes available). Some elements of the ethics index are complex enough; there is
no way to assess and report them quickly. For example, the human rights index (HRI) estimates
data available after a significant time. This research designs the index of ethics (ETPI) to avoid
any artificial data modifications; ETPI processes the missing data as soon as it becomes
available.
Shemetev, A.
88
Estimating the ETPI (index of ethics) for the regions within each country: regional ETPI (RETPI)
Unfortunately, CPI, EFI, EPI, NRD, EI, HDI, and HRI have no estimations on the regional
levels, and we can only estimate them on the national level. Hence, it is possible to receive
ETPI on the national level only. This national-level indicator has some score valued "X" within
each country (i). It can be interpreted as 100% because ETPI and its derivative (regional ethical
index, RETPI) is ordinal, but not cardinal measure; it allows comparing different countries and
regions on the level of ethics.
The RETPI method assumes that people learn data through the internet. The internet is
gaining more and more popularity as a medium for finding the necessary information on various
topics, including ethics. This research utilizes data from search engines. The unique algorithm
in the programming language R designed for this research obtains the data. If we take the Earth
as a whole, then the most popular search engine in the world is Google (arguably). The
popularity of Google is increasing, mainly due to the growth in the number of mobile devices
globally. Many mobile devices use the Android operating system that the Google Corporation
develops. This system has an in-built search from Google and many services from Google.
Some users of other mobile devices also use Google search (as well as other Google services).
Therefore, Google search trends can serve as a proxy variable for ethics-related queries
worldwide. Google has different versions for mobile devices, personal computers, laptops, and
other systems. In addition, a significant part of the Google search queries comes from
programming languages (without using browsers and other methods).
This study suggests that Google is an essential global provider of trended data given the
above. The aggregate ethics index (the regional index of ethics) is derived from the Google
search data by category. A researcher can receive proxy variables and latent variables for further
analysis.
This research created an algorithm for extracting global data on various categories related to
ethics. This algorithm converts the data into a matrix that includes the regions of the country
and interest in ethics for specific dates (usually, the first date is the beginning of January 2004,
and the end date is the present [unless another time range is not necessary for this algorithm]).
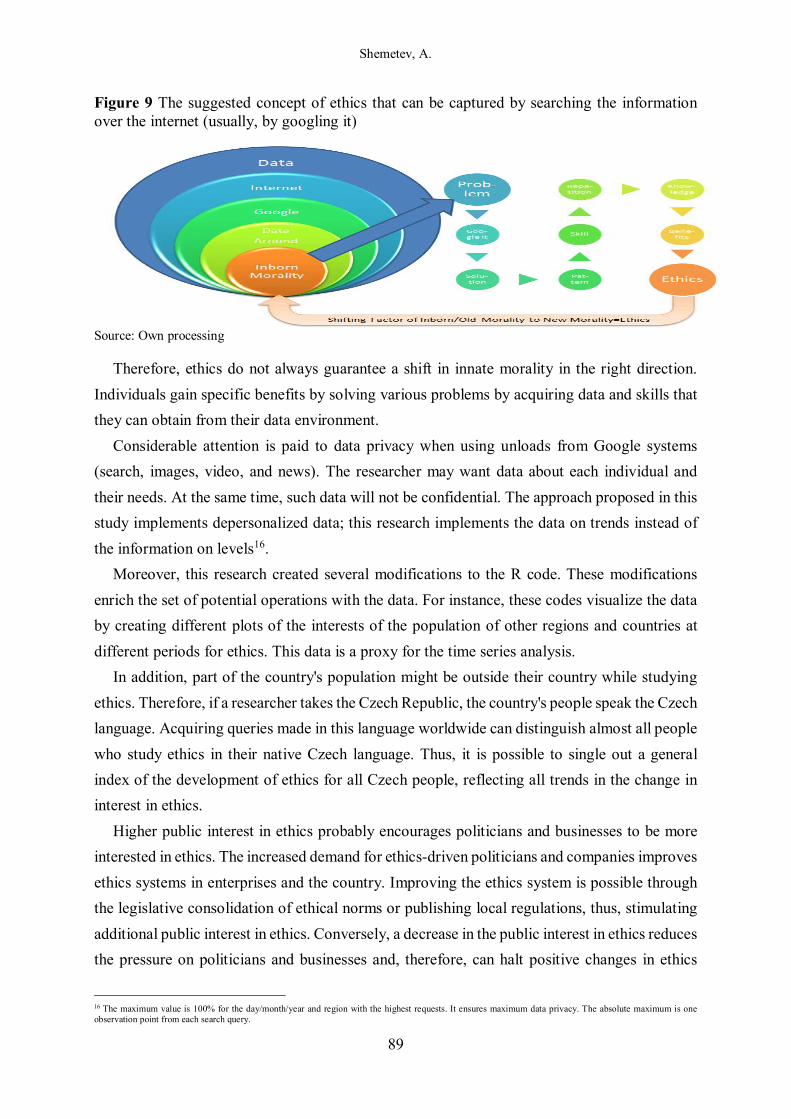
Shemetev, A.
89
Figure 9 The suggested concept of ethics that can be captured by searching the information over the internet (usually, by googling it)
Source: Own processing
Therefore, ethics do not always guarantee a shift in innate morality in the right direction.
Individuals gain specific benefits by solving various problems by acquiring data and skills that
they can obtain from their data environment.
Considerable attention is paid to data privacy when using unloads from Google systems
(search, images, video, and news). The researcher may want data about each individual and
their needs. At the same time, such data will not be confidential. The approach proposed in this
study implements depersonalized data; this research implements the data on trends instead of
the information on levels16.
Moreover, this research created several modifications to the R code. These modifications
enrich the set of potential operations with the data. For instance, these codes visualize the data
by creating different plots of the interests of the population of other regions and countries at
different periods for ethics. This data is a proxy for the time series analysis.
In addition, part of the country's population might be outside their country while studying
ethics. Therefore, if a researcher takes the Czech Republic, the country's people speak the Czech
language. Acquiring queries made in this language worldwide can distinguish almost all people
who study ethics in their native Czech language. Thus, it is possible to single out a general
index of the development of ethics for all Czech people, reflecting all trends in the change in
interest in ethics.
Higher public interest in ethics probably encourages politicians and businesses to be more
interested in ethics. The increased demand for ethics-driven politicians and companies improves
ethics systems in enterprises and the country. Improving the ethics system is possible through
the legislative consolidation of ethical norms or publishing local regulations, thus, stimulating
additional public interest in ethics. Conversely, a decrease in the public interest in ethics reduces
the pressure on politicians and businesses and, therefore, can halt positive changes in ethics
16 The maximum value is 100% for the day/month/year and region with the highest requests. It ensures maximum data privacy. The absolute maximum is one observation point from each search query.
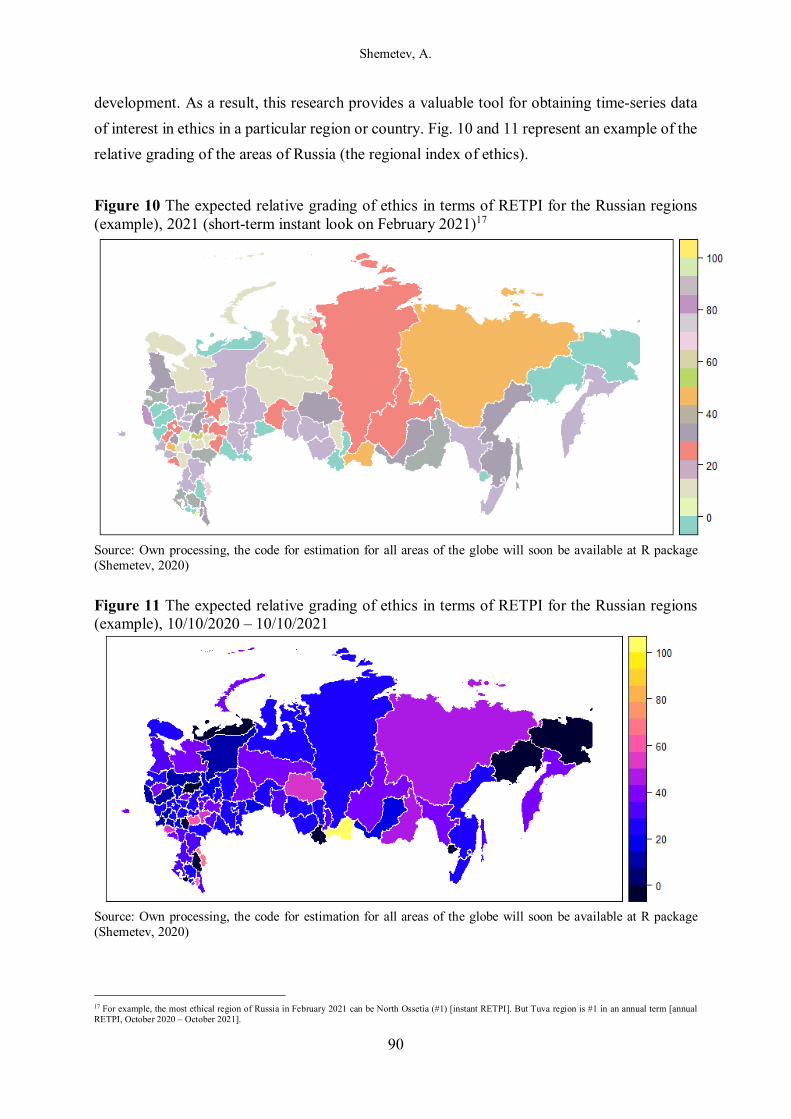
Shemetev, A.
90
development. As a result, this research provides a valuable tool for obtaining time-series data
of interest in ethics in a particular region or country. Fig. 10 and 11 represent an example of the
relative grading of the areas of Russia (the regional index of ethics).
Figure 10 The expected relative grading of ethics in terms of RETPI for the Russian regions (example), 2021 (short-term instant look on February 2021)17
Source: Own processing, the code for estimation for all areas of the globe will soon be available at R package (Shemetev, 2020)
Figure 11 The expected relative grading of ethics in terms of RETPI for the Russian regions (example), 10/10/2020 – 10/10/2021
Source: Own processing, the code for estimation for all areas of the globe will soon be available at R package (Shemetev, 2020)
17 For example, the most ethical region of Russia in February 2021 can be North Ossetia (#1) [instant RETPI]. But Tuva region is #1 in an annual term [annual RETPI, October 2020 – October 2021].
Shemetev, A.
91
We understand such an approach has shortcomings related to the scope of individuals
learning ethics from other sources than Google/Yahoo/Social networks and similar media. At
the same time, not all the regions might have stable internet access to look for new knowledge
on ethics-related issues (see, for example, the Chukotka region or far-north regions of Russia
in figures 10 and 11). At the same time, the lack of stable internet in some areas in the XXI
century provides some information for the relative grading of regions in terms of ethical issues.
The population size is not a barrier for estimating ethics. For example, the most ethical part of
Russia in 2021 can be Tuva (#1) and Astrakhan (#2) [both areas have populations below the
top-25 in Russia]. Tuva can have the highest level of instability (according to the number of
crimes or economic development). Still, it has the highest positive trends in the interest of ethics
over the internet. People there want to learn higher ethical standards and improve their lives in
the future. This study suggests that the positive trend in ethics is an essential component for
proper regional development. The RETPI index can capture this trend (daily, weekly, monthly,
or annually). Tuva and Astrakhan regions are not as populated as Moscow18 and Saint-
Petersburg19. The resulting RETPI is not cardinal but an ordinal measure that only compares
the areas in terms of ethics by a proxy20. It is the first tool for qualitative estimation of ethics
on the national and regional basis for comparisons. Estimating this variable brings a valuable
regional proxy tool for assessing the relative interest in ethics within the country's regions.
RESULTS AND DISCUSSION
It is challenging to split economic from ethics; that is why the first thoughts in applying the
macroeconomic indicators (Kuznets, 1941; Kuznets, 1941; Smith, 1942) should be continued
by adding ethics. It will improve today's classical mathematical tools for calculating and
forecasting macroeconomic (Doepke et al., 1999; Williamson, 2018) and microeconomic
(Perloff, 1998) phenomena. Splitting the ethics from the economy (famous from the first works
in economics ( Smith, 1761; Smith, 1998)) leads to biased estimators.
For example, some countries can be economically more prosperous by applying unethical
tools of development (mass violations of human rights, depletion of natural resources,
corruption, oppressing economic freedoms, diminishing human development, preventing
modern knowledge and education, and spoiling ecology). The possibility of such a development
raises criticism toward economics as a science (Eichner, 1983). The idea that everybody might
18 #23 of 83 in ethics and #1 in population 19 #21 of 83 in ethics and #4 in population 20 It is possible to estimate the regional index from daily to 5-year period basis (any term).
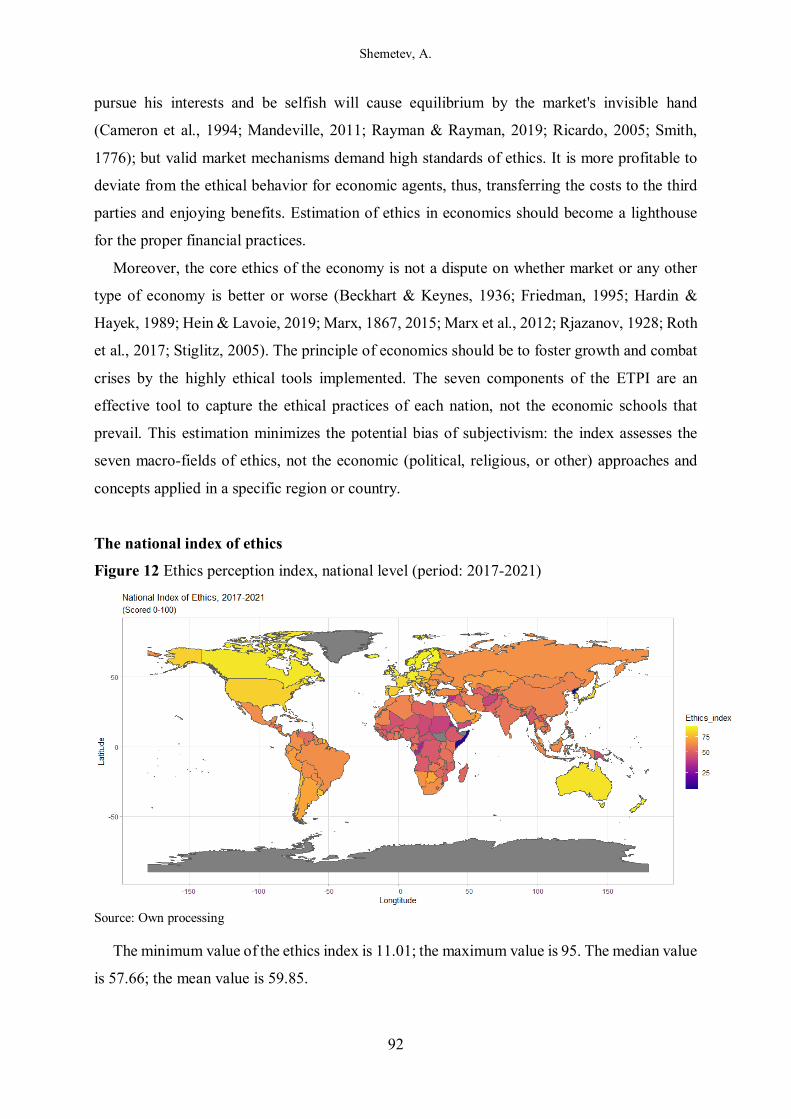
Shemetev, A.
92
pursue his interests and be selfish will cause equilibrium by the market's invisible hand
(Cameron et al., 1994; Mandeville, 2011; Rayman & Rayman, 2019; Ricardo, 2005; Smith,
1776); but valid market mechanisms demand high standards of ethics. It is more profitable to
deviate from the ethical behavior for economic agents, thus, transferring the costs to the third
parties and enjoying benefits. Estimation of ethics in economics should become a lighthouse
for the proper financial practices.
Moreover, the core ethics of the economy is not a dispute on whether market or any other
type of economy is better or worse (Beckhart & Keynes, 1936; Friedman, 1995; Hardin &
Hayek, 1989; Hein & Lavoie, 2019; Marx, 1867, 2015; Marx et al., 2012; Rjazanov, 1928; Roth
et al., 2017; Stiglitz, 2005). The principle of economics should be to foster growth and combat
crises by the highly ethical tools implemented. The seven components of the ETPI are an
effective tool to capture the ethical practices of each nation, not the economic schools that
prevail. This estimation minimizes the potential bias of subjectivism: the index assesses the
seven macro-fields of ethics, not the economic (political, religious, or other) approaches and
concepts applied in a specific region or country.
The national index of ethics
Figure 12 Ethics perception index, national level (period: 2017-2021)
Source: Own processing
The minimum value of the ethics index is 11.01; the maximum value is 95. The median value
is 57.66; the mean value is 59.85.
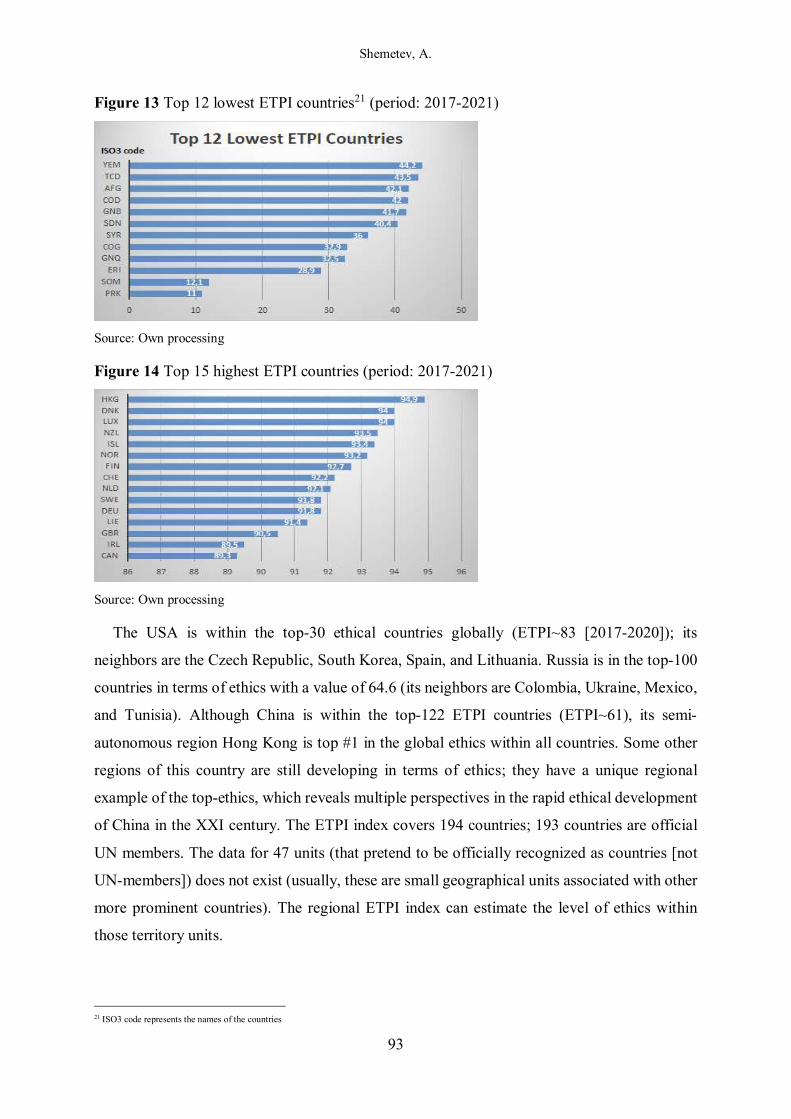
Shemetev, A.
93
Figure 13 Top 12 lowest ETPI countries21 (period: 2017-2021)
Source: Own processing
Figure 14 Top 15 highest ETPI countries (period: 2017-2021)
Source: Own processing
The USA is within the top-30 ethical countries globally (ETPI~83 [2017-2020]); its
neighbors are the Czech Republic, South Korea, Spain, and Lithuania. Russia is in the top-100
countries in terms of ethics with a value of 64.6 (its neighbors are Colombia, Ukraine, Mexico,
and Tunisia). Although China is within the top-122 ETPI countries (ETPI~61), its semi-
autonomous region Hong Kong is top #1 in the global ethics within all countries. Some other
regions of this country are still developing in terms of ethics; they have a unique regional
example of the top-ethics, which reveals multiple perspectives in the rapid ethical development
of China in the XXI century. The ETPI index covers 194 countries; 193 countries are official
UN members. The data for 47 units (that pretend to be officially recognized as countries [not
UN-members]) does not exist (usually, these are small geographical units associated with other
more prominent countries). The regional ETPI index can estimate the level of ethics within
those territory units.
21 ISO3 code represents the names of the countries
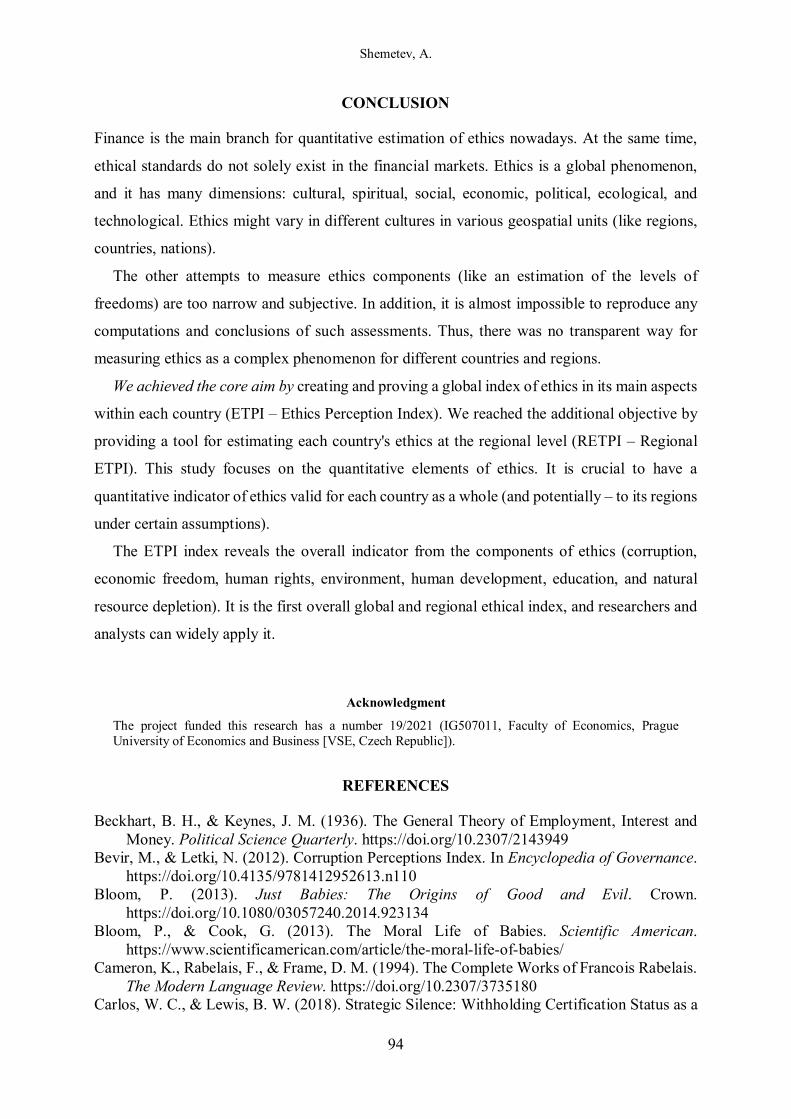
Shemetev, A.
94
CONCLUSION
Finance is the main branch for quantitative estimation of ethics nowadays. At the same time,
ethical standards do not solely exist in the financial markets. Ethics is a global phenomenon,
and it has many dimensions: cultural, spiritual, social, economic, political, ecological, and
technological. Ethics might vary in different cultures in various geospatial units (like regions,
countries, nations).
The other attempts to measure ethics components (like an estimation of the levels of
freedoms) are too narrow and subjective. In addition, it is almost impossible to reproduce any
computations and conclusions of such assessments. Thus, there was no transparent way for
measuring ethics as a complex phenomenon for different countries and regions.
We achieved the core aim by creating and proving a global index of ethics in its main aspects
within each country (ETPI – Ethics Perception Index). We reached the additional objective by
providing a tool for estimating each country's ethics at the regional level (RETPI – Regional
ETPI). This study focuses on the quantitative elements of ethics. It is crucial to have a
quantitative indicator of ethics valid for each country as a whole (and potentially – to its regions
under certain assumptions).
The ETPI index reveals the overall indicator from the components of ethics (corruption,
economic freedom, human rights, environment, human development, education, and natural
resource depletion). It is the first overall global and regional ethical index, and researchers and
analysts can widely apply it.
Acknowledgment
The project funded this research has a number 19/2021 (IG507011, Faculty of Economics, Prague University of Economics and Business [VSE, Czech Republic]).
REFERENCES
Beckhart, B. H., & Keynes, J. M. (1936). The General Theory of Employment, Interest and Money. Political Science Quarterly. https://doi.org/10.2307/2143949
Bevir, M., & Letki, N. (2012). Corruption Perceptions Index. In Encyclopedia of Governance. https://doi.org/10.4135/9781412952613.n110
Bloom, P. (2013). Just Babies: The Origins of Good and Evil. Crown. https://doi.org/10.1080/03057240.2014.923134
Bloom, P., & Cook, G. (2013). The Moral Life of Babies. Scientific American. https://www.scientificamerican.com/article/the-moral-life-of-babies/
Cameron, K., Rabelais, F., & Frame, D. M. (1994). The Complete Works of Francois Rabelais. The Modern Language Review. https://doi.org/10.2307/3735180
Carlos, W. C., & Lewis, B. W. (2018). Strategic Silence: Withholding Certification Status as a
Shemetev, A.
95
Hypocrisy Avoidance Tactic. Administrative Science Quarterly, 63(1), 130–169. https://doi.org/10.1177/0001839217695089
Chatterji, A. K., Durand, R., Levine, D. I., & Touboul, S. (2016). Do ratings of firms converge? Implications for managers, investors and strategy researchers. Strategic Management Journal, 37(8), 1597–1614. https://doi.org/10.1002/smj.2407
Conrad, E., & Cassar, L. F. (2019). The Environmental Performance Index. In Routledge Handbook of Sustainability Indicators. https://doi.org/10.4324/9781315561103-19
De Mel, S., McKenzie, D., & Woodruff, C. (2008). Returns to capital in microenterprises: Evidence from a field experiment. Quarterly Journal of Economics, 123(4), 1329–1372. https://doi.org/10.1162/qjec.2008.123.4.1329
Doepke, M., Lehnert, A., & Sellgren, A. (1999). Macroeconomics. In Macroeconomics. University of Chicago.
Ebrahimi, N. (2012). The ethics of euthanasia | Australian Medical Student Journal. https://www.amsj.org/archives/2066
Eichner, A. (1983). Why Economics Is Not Yet a Science. Journal of Economic Issues, 17(2), 507–520. https://www.jstor.org/stable/4225324?seq=1
Fernandes, A. K. (2001). Euthanasia, assisted suicide, and the philosophical anthropology of Karol Wojtyla. Christian Bioethics, 7(3), 379–402. https://doi.org/10.1076/chbi.7.3.379.6878
Fisher, R. A. (1936). The Use of Multiple Measurements in Taxonomic Problems. Annals of Eugenics, 7(2), 179–188. https://doi.org/10.1111/j.1469-1809.1936.tb02137.x
Fraser Institute. (2021). Economic Freedom of the World: 2020 Annual Report. https://www.fraserinstitute.org/studies/economic-freedom-of-the-world-2020-annual-report
Friedman, M. (1995). A Monetary and Fiscal Framework for Economic Stability. In Essential Readings in Economics. https://doi.org/10.1007/978-1-349-24002-9_19
Fuchs-Schündeln, N., Hassan, T. A., Acemoglu, D., Hsieh, C.-T., Nunn, N., Vishny, R., Wiederholt Leonhard Czerny, M., Gorea, D., & Xu, P. (2015). Natural Experiments in Macroeconomics *.
Fundación para el Avance de la Libertad. (2019). World Index of Moral Freedom. In Liberty. https://fundalib.org/wp-content/uploads/2016/04/World-Index-of-Moral-Freedom-web.pdf
Gorban, A. N., Golubkov, A., Grechuk, B., Mirkes, E. M., & Tyukin, I. Y. (2018). Correction of AI systems by linear discriminants: Probabilistic foundations. Information Sciences, 466, 303–322.
Hardin, G., & Hayek, F. A. (1989). The Fatal Conceit: The Errors of Socialism. Population and Development Review. https://doi.org/10.2307/1972446
Heide, M. (2020). Corruption Perceptions Index. In The Palgrave Encyclopedia of Interest Groups, Lobbying and Public Affairs. https://doi.org/10.1007/978-3-030-13895-0_76-1
Hein, E., & Lavoie, M. (2019). Post-Keynesian economics. In The Elgar Companion to John Maynard Keynes. https://doi.org/10.4337/9781788118569.00097
Heinemann, F., & Noussair, C. (2015). Macroeconomic experiments. Journal of Economic Studies, 42(6). https://doi.org/10.1108/JES-09-2015-0171
Johnson, D. (2013). Ethical indices: how do you measure ethics? Reuters Event: Sustainable Business, 10. https://www.reutersevents.com/sustainability/business-strategy/ethical-indices-how-do-you-measure-ethics
Kuznets, S. (1941). The Structure of the American Economy, 1919–1929. By Wassily W. Leontief. Cambridge: Harvard University Press, 1941. Pp. xi, 181. $2.50. The Journal of Economic History. https://doi.org/10.1017/s0022050700053158
Kuznets, S. S. (1941). HANSEN, ALVIN H. Fiscal Policy and Busi ness Cycles. Pp. 462. New
Shemetev, A.
96
York: W. W. Norton & Co., 1941. $3.75. The ANNALS of the American Academy of Political and Social Science. https://doi.org/10.1177/000271624121700181
Lambsdorff, J. G. (2017). Corruption Perceptions Index 2005. In Global Corruption Report 2006. https://doi.org/10.2307/j.ctt184qq53.61
Lee, D. D., & Faff, R. W. (2009). Corporate Sustainability Performance and Idiosyncratic Risk: A Global Perspective. Financial Review, 44(2), 213–237. https://doi.org/10.1111/j.1540-6288.2009.00216.x
Mandeville, B. (2011). The fable of the bees: Private vices, publick benefits. In The fable of the bees: Private vices, publick benefits. https://doi.org/10.1037/13124-000
Marx, K. (1867). Das Kapital, Volume 1. In The Marx-Engels Reader. Marx, K. (2015). Capital: A Critique of Political Economy. Progress Publishers.
https://www.marxists.org/archive/marx/works/download/pdf/Capital-Volume-I.pdf Marx, K., Engels, F., Isaac, J. C., Lukes, S., Bronner, S. E., Tismaneanu, V., & Sassen, S.
(2012). The Communist Manifesto. In The Communist Manifesto. Yale University Press. https://doi.org/10.7202/1023605ar
Narbekovas, A., & Meilius, K. (2004). Why is the ethics of euthanasia wrong? - PubMed. Med Etika Bioet., 11(3–4), 2–6. https://pubmed.ncbi.nlm.nih.gov/16294446/
Our World in Data. (2020). Our World in Data. https://ourworldindata.org/ Perloff, J. (1998). Microeconomics. Pearson. Rayman, R. A., & Rayman, R. A. (2019). Bernard Mandeville (1670- 1733). In Economics
Through the Looking-Glass. https://doi.org/10.4324/9780429444586-44 Ricardo, D. (2005). From The Principles of Political Economy and Taxation .
https://doi.org/10.1142/9789812701275_0014 Rjazanov, D. (1928). Marx-Engels Archiv, Zeitschrift des Marx-Engels Instituts in Moskau.
The American Historical Review, 33(4), 871. https://doi.org/10.2307/1838394 Roberts, J. M. (1995). New Keynesian Economics and the Phillips Curve. Journal of Money,
Credit and Banking. https://doi.org/10.2307/2077783 Rodgers, S., & Rodgers, C. (1989). Business and the Facts af Family Life. Havard Business
Review. Roth, R., Kopf, E., Vollgraf, C.-E., Schefold, B., & Hubmann, G. (2017). Karl Marx: Das
Kapital. Kritik der politischen Ökonomie. Dritter Band. In Karl Marx: Das Kapital. Kritik der politischen Ökonomie. Dritter Band. https://doi.org/10.1515/9783050063645
Shemetev, A. (2020). R Package alexandershemetev (1.0; p. 16). GitHiub. https://github.com/Alexandershemetev/alexandershemetev
Sims, C. A. (2010). But Economics Is Not an Experimental Science. Journal of Economic Perspectives, 24(2), 59–68. https://doi.org/10.1257/jep.24.2.59
Sims, E. R., Wu, J. C., & Zhang, J. (2020). The Four Equation New Keynesian Model. SSRN Electronic Journal. https://doi.org/10.2139/ssrn.3625622
Smith, A. (1761). Theory of Moral Sentiments (2nd ed.). A. Millar; A. Kincaid & J. Bell. https://books.google.com/books?id=bZhZAAAAcAAJ&q=editions%3Au_L0P5LRqXkC&pg=PP3
Smith, A. (1776). An inquiry into the wealth of nations. Strahan and Cadell, London. Smith, J. G. (1942). KUZNETS, SIMON. National Income and Its Composition, 1919-1938.
Vol. I, pp. xxx, 387; Vol. II, 388-929. New York: National Bureau of Economic Research, 1941. $5.00. The ANNALS of the American Academy of Political and Social Science. https://doi.org/10.1177/000271624222100161
Smith, V. L. (1998). The Two Faces of Adam Smith. Southern Economic Journal, 65(1), 1. https://doi.org/10.2307/1061349
Standard Ethics. (2021). Standard Ethics Index. https://www.standardethicsindices.eu/indices.html
Shemetev, A.
97
Stiglitz, J. E. (2005). The Ethical Economist. Growth may be everything, but it’s not the only thing. Review Essay of “The Moral Consequences of Economic Growth by B.M. Friedman”, Knopf, 2005. Foreign Affaires.
Transparency International. (2020). Corruption Perceptions Index (CPI). https://www.transparency.org/en/cpi/2020/index/nzl
Troinitsky, A. G. (1858). O čisle krepostnych ludej v Rossii. Typographya Ministerstva Vnitr. del. https://elib.rgo.ru/handle/123456789/227409
UNDP. (2020). United Nations Development Program: Human Development Reports. http://hdr.undp.org/en/content/human-development-index-hdi
United Nations Development Programme. (2021a). Education index. http://hdr.undp.org/en/indicators/103706
United Nations Development Programme. (2021b). Natural resource depletion (% of GNI). http://hdr.undp.org/en/indicators/97306
Varlamov, I. (2021a). Afghanskaya vojna: reportaž iz Kabula. https://www.youtube.com/watch?v=WN4ml14HkRU
Varlamov, I. (2021b). Kabul, Afghanistan: stolitsa radikalov, musora i zaborov: gorod, otkuda možno ne vernutsja živim. https://www.youtube.com/watch?v=XlWt0hxbBGQ
Varlamov, I. (2021c). Proizvodstvo problem na export: vo vse tjažkiě v žizni, a ne v seriale. https://www.youtube.com/watch?v=N5qyIt5xPaU
Wendling, Z. A., Emerson, J. W., de Sherbinin, A., & Esty, D. C. (2020). Environmental Performance Index. epi.yale.edu
Williamson, J. (2018). Macroeconomics. Pearson. World Bank. (2020). World Bank Databases. https://databank.worldbank.org/databases
DETUROPE – THE CENTRAL EUROPEAN JOURNAL OF REGIONAL DEVELOPMENT AND TOURISM Vol. 13 Issue 3 2021 ISSN 1821-2506
98
Original scientific paper
PARTICULARITIES OF MARKETING COMMUNICATIONS IN THE
FIELD OF INTERNATIONALIZATION OF HIGHER EDUCATION IN
THE RUSSIAN FEDERATION
Svetlana G. PYANKOVAa, Inna V. MITROFANOVAb, c, Olga T. ERGUNOVAd, Marina E. BUYANOVA c
a Ural State Economic University, Department of Regional, Municipal Economics and Management, Ekaterinburg, Russia. E-mail: [email protected]
b Federal Research Centre the Southern Scientific Centre of the Russian Academy of Sciences (SSC RAS), Laboratory of Regional Economics, Rostov-on-Don, Russia. E-mail: [email protected]
c Volgograd State University, Department of Economic Theory, World and Regional Economics, Volgograd, Russia. E-mail: [email protected]; [email protected] d Ural State University of Economics, Department of Tourism Business and Hospitality, Ekaterinburg, Russia. E-mail: [email protected]
Cite this article: Pyankova, S. G., Mitrofanova, I. V., Ergunova, O. T., Buyanova, M. E. (2021). Particularities of marketing communications in the field of internationalization of higher education in the Russian Federation. Deturope, 13(3), 98-117.
Abstract
The relevance of this research is determined by the need for scientific substantiation of the use of advertising and PR-technologies in the field of higher education in order to improve the management of the university in the international educational services market. Over the past ten years, the market for educational services has changed significantly: new agents and training formats have appeared, competition between universities for consumers has increased, the requirements of employers for the level and quality of education of graduates have changed significantly. Global and local market conditions are constantly changing and thus create a difficult to predict environment. In this regard, they need to develop an effective advertising and PR strategy to create competitive advantages. The development and implementation of effective advertising and PR activity requires an individual approach that takes into account the specifics of the educational institution and, above all, the specifics of the market in which they operate. The purpose of the study is to conduct a comparative analysis of the use of advertising and PR technologies used by universities in Russia on the basis of the obtained results the development of recommendations on advertising and PR technologies for the effective functioning of Russian universities on the international market of educational services. To achieve this goal, the following tasks were formulated: to study the features of advertising and PR technologies in the market of educational services; to identify relevant communication technologies used by the university in the work with the target audience. The research methodology includes the following set of empirical methods: analysis of websites of Russian on such criterions as informativeness, usability, website design, functionality and location in search results; content analysis of accounts of Russian on social networks listed on the official website of the universities with a relevant link. For the study, Russian universities included in QS World University Rankings 2020 were selected, they were classified into 4 groups: National universities with the status of “unique scientific and educational complexes, the country's oldest universities, of great importance for the development of Russian society”, National Research universities are awarded for a ten-year term on a competitive basis with the aim of creating on their basis advanced world-class research and educational centers, Federal universities and Flagship, regional universities.
Keywords: advertising and PR technologies, international market, educational services, university, social networks, website, foreign students, graduates.
Pyankova, S. G., Mitrofanova, I. V., Ergunova, O. T., Buyanova, M. E.
99
INTRODUCTION
The relevance of this research is determined by the need for scientific substantiation of the use
of advertising and PR-technologies in the field of higher education in order to improve the
management of the university in the international educational services market. Any higher
education institution aims to occupy a high market share by offering various types of
educational services. Russia is no exception among universities around the world that are
fighting seriously for the right to educate foreign students who are profitable for both
universities and the country, as well as strengthening the image of national education in the
international market. According to the UNESCO Institute for Statistics, Russia with a share of
5% of world student mobility, along with France and Germany is among the six countries in
attractiveness for foreign students, behind the USA (19%), Great Britain (8%) and Australia
(7%). According to the data indicated in the analytical report of official website on higher
education in Russia for foreigners studyinrussia.ru Russian universities are popular in the same
states, the largest number of foreign students in Russia is from the CIS countries, Asia
(Afghanistan, India, China, Mongolia, Turkey, etc.). Stable interest in Russian education is
maintained in countries of Europe (Germany, Italy, France, Hungary, Bulgaria, etc.), America
and Latin America (USA, Canada, Brazil, etc.), the Middle East (Israel, Jordan, Syria, etc.) and
Africa (Algeria, Egypt, Nigeria, South Africa, etc.). Thus, we choose universities of Russia for
a comparative analysis of advertising and PR technologies. Taking into account the wide variety
of university communication tools and the characteristics of the main target audience, our study
is more focused on online communication, namely the use of the official website and
maintaining accounts on popular social networks, as an effective tool for interaction between
universities and the target audience, play an important role in managing image and reputation
of the university in the face of fierce competition in the national and global educational market.
The aim of the article is conducting a comparative analysis of the use of advertising and PR
technologies used by universities in Russia and on the basis of the obtained results the
development of recommendations on advertising and PR technologies for the effective
functioning on the international market of educational services.
LITERATURE OVERVIEW, MATERIALS
The changes in the operating conditions of state and private enterprises and organizations, the
economy and society have led to a demand for educational services. According to many
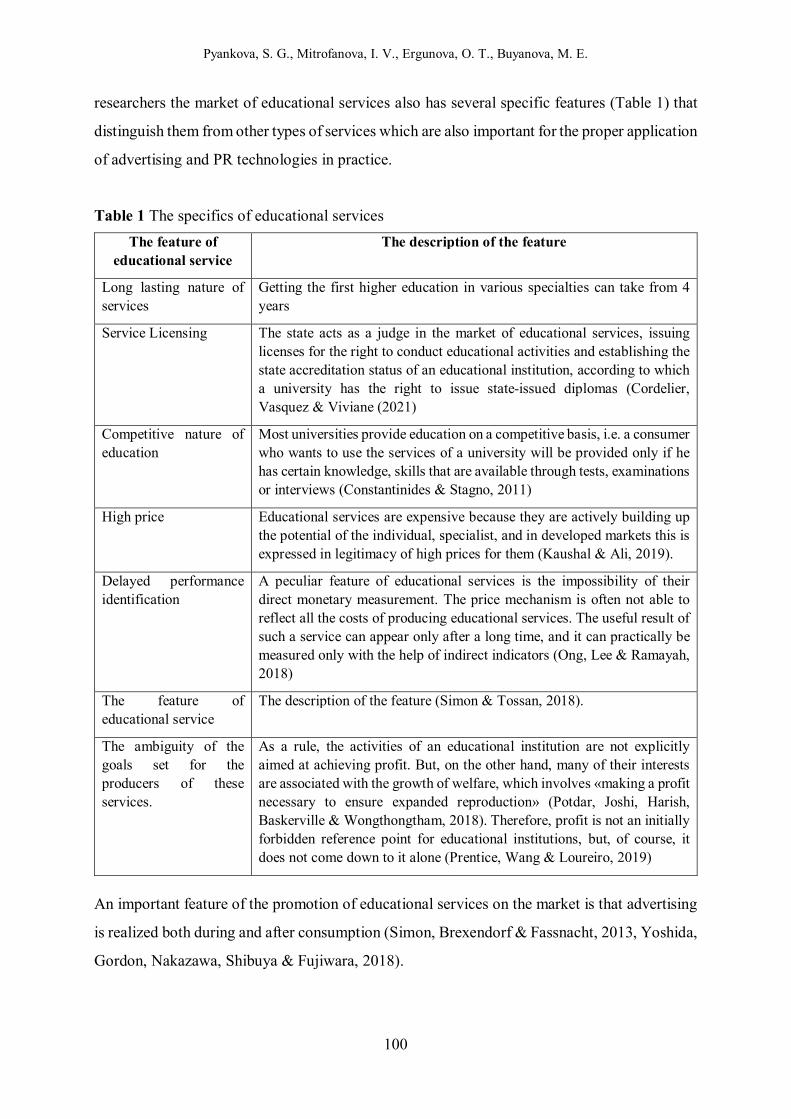
Pyankova, S. G., Mitrofanova, I. V., Ergunova, O. T., Buyanova, M. E.
100
researchers the market of educational services also has several specific features (Table 1) that
distinguish them from other types of services which are also important for the proper application
of advertising and PR technologies in practice.
Table 1 The specifics of educational services
The feature of educational service
The description of the feature
Long lasting nature of services
Getting the first higher education in various specialties can take from 4 years
Service Licensing The state acts as a judge in the market of educational services, issuing licenses for the right to conduct educational activities and establishing the state accreditation status of an educational institution, according to which a university has the right to issue state-issued diplomas (Cordelier, Vasquez & Viviane (2021)
Competitive nature of education
Most universities provide education on a competitive basis, i.e. a consumer who wants to use the services of a university will be provided only if he has certain knowledge, skills that are available through tests, examinations or interviews (Constantinides & Stagno, 2011)
High price Educational services are expensive because they are actively building up the potential of the individual, specialist, and in developed markets this is expressed in legitimacy of high prices for them (Kaushal & Ali, 2019).
Delayed performance identification
A peculiar feature of educational services is the impossibility of their direct monetary measurement. The price mechanism is often not able to reflect all the costs of producing educational services. The useful result of such a service can appear only after a long time, and it can practically be measured only with the help of indirect indicators (Ong, Lee & Ramayah, 2018)
The feature of educational service
The description of the feature (Simon & Tossan, 2018).
The ambiguity of the goals set for the producers of these services.
As a rule, the activities of an educational institution are not explicitly aimed at achieving profit. But, on the other hand, many of their interests are associated with the growth of welfare, which involves «making a profit necessary to ensure expanded reproduction» (Potdar, Joshi, Harish, Baskerville & Wongthongtham, 2018). Therefore, profit is not an initially forbidden reference point for educational institutions, but, of course, it does not come down to it alone (Prentice, Wang & Loureiro, 2019)
An important feature of the promotion of educational services on the market is that advertising
is realized both during and after consumption (Simon, Brexendorf & Fassnacht, 2013, Yoshida,
Gordon, Nakazawa, Shibuya & Fujiwara, 2018).
Pyankova, S. G., Mitrofanova, I. V., Ergunova, O. T., Buyanova, M. E.
101
The high importance of PR tools in promoting a university and the increasing role of PR in
the higher education system are due to the fact that PR helps to solve the problem of expanding
the educational space of a university and its integration into the world educational space.
Strydom, Jooste, and Cant (2000) define public relations as management through
communication or perception, and the strategic relationship between an organization and its
internal and external public. Public relations can be defined as a deliberate, planned and
sustained efforts to establish or to maintain mutual and understanding between the institute and
the customers to develop core values of the institute (Ashirbagina & Frick, 2016). This may be
in between; staff-alumni, institute-alumni, staff-schools and teachers, institute-schools and
teachers or institute-community (Bocharov & Chumikov, 2014; Levina, 2015). It creates,
develops and maintains positive image of the institute which is very effective tool of promotion
in era of competition. Institute do arrange social programs like health and medical campus,
cleanliness drive, tree plantation, computer literacy programs to develop public relation with
the community.
Various types of exhibitions are one of PR tools. They provide the opportunity for personal
contact with potential consumers and the distribution of advertising information in print
(Salgado & Vela, 2019). Salamatov et al. (2012) finds a number of advantages in the
participation of the university in exhibitions:
Maintaining the image of the university for both broad groups of the public and target
audiences (Shahsavar & Sudzina, 2017).
Providing a wide corporate message with a large number of people at the same time
combined with the possibilities of personal communications (Chapleo, 2015).
The possibility of direct interaction with potential consumers (Salamatov et al., 2012).
Interactive events such as workshops, career counseling, lotteries with prizes in the form of
corporate souvenirs help to attract as many visitors to your corner as possible, increase loyalty
to the university (Levina, 2015).
At higher education institutions the effectiveness of the use of Internet resources depends on
the focused work to promote the educational services of the university. It is also important to
realize that the promotion of educational services should be carried out in conjunction with the
positioning of the university as a producer of an educational product, as well as with measures
to support the image and recognition of the university’s brand (Belyavsky, 2014). Speaking
about Internet marketing it is necessary to note other key elements in promoting a university on
the Internet.
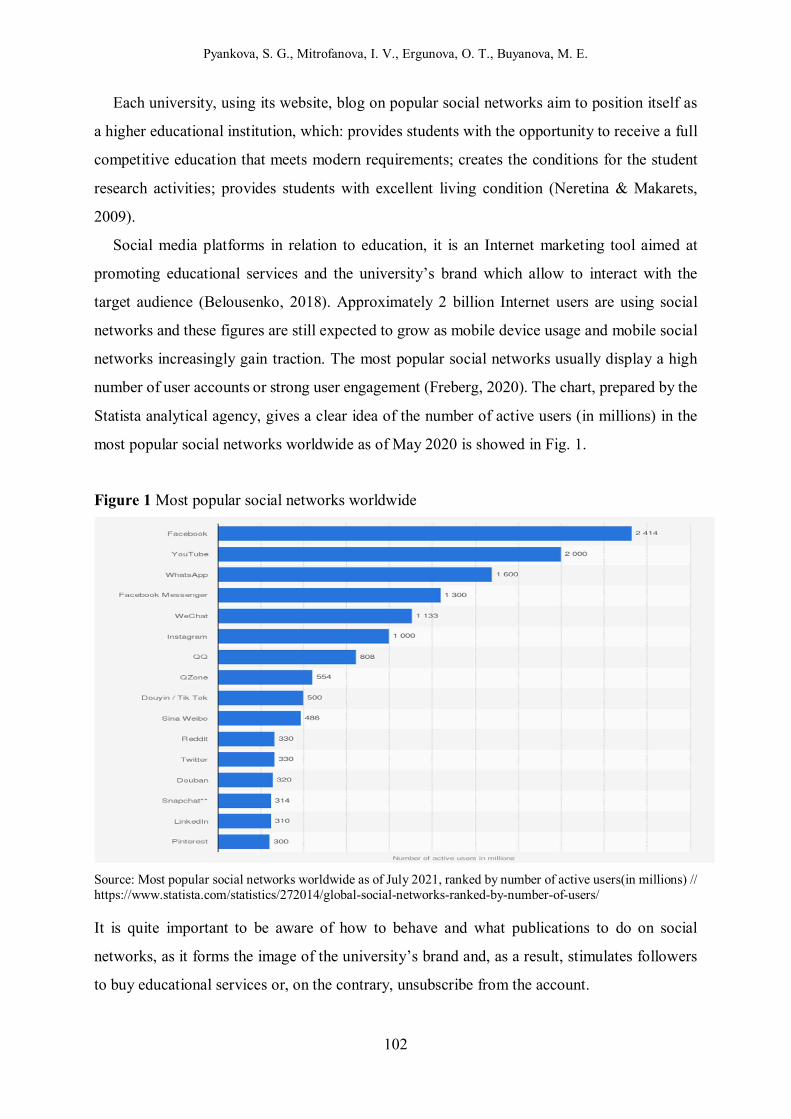
Pyankova, S. G., Mitrofanova, I. V., Ergunova, O. T., Buyanova, M. E.
102
Each university, using its website, blog on popular social networks aim to position itself as
a higher educational institution, which: provides students with the opportunity to receive a full
competitive education that meets modern requirements; creates the conditions for the student
research activities; provides students with excellent living condition (Neretina & Makarets,
2009).
Social media platforms in relation to education, it is an Internet marketing tool aimed at
promoting educational services and the university’s brand which allow to interact with the
target audience (Belousenko, 2018). Approximately 2 billion Internet users are using social
networks and these figures are still expected to grow as mobile device usage and mobile social
networks increasingly gain traction. The most popular social networks usually display a high
number of user accounts or strong user engagement (Freberg, 2020). The chart, prepared by the
Statista analytical agency, gives a clear idea of the number of active users (in millions) in the
most popular social networks worldwide as of May 2020 is showed in Fig. 1.
Figure 1 Most popular social networks worldwide
Source: Most popular social networks worldwide as of July 2021, ranked by number of active users(in millions) // https://www.statista.com/statistics/272014/global-social-networks-ranked-by-number-of-users/
It is quite important to be aware of how to behave and what publications to do on social
networks, as it forms the image of the university’s brand and, as a result, stimulates followers
to buy educational services or, on the contrary, unsubscribe from the account.
Pyankova, S. G., Mitrofanova, I. V., Ergunova, O. T., Buyanova, M. E.
103
Issues of internationalization are among the priorities in the strategic development of
universities, along with the development of science and education. According to García and
Villarreal (2014), international students provide an additional income stream for educational
institutions and contribute to the economy of their host country. The result of the increasing
involvement of higher education institutions in the system of market relations is the desire for
the financial well-being of the institution. Attracting foreign students also affects prestige, high
ratings and competitiveness. In their work, Yuzhakova and Karakchieva (2015, р. 35) note:
“The number of foreign students is one of the most important indicators in the rankings of
universities in the global market for educational services, which determines their success”.
Melikyan (2016) also indicates the importance of the presence and number of foreign students
at the university in compiling international ratings: “The number of foreign students studying
at the university is one of the indicators of external evaluation of the university’s performance
and is taken into account win the process of compiling international university ratings, which
encourages universities to develop this area”.
The accelerated dynamics of world educational processes, globalization, the creation of
international educational projects lead to the need to create conditions and implement the
processes of internationalization of universities in all countries seeking to internationally
position higher education. In the study of Schulz (2006), the process of building interaction
with potential university students is considered in the game concept, where, as in any game,
there are certain strategies and techniques necessary to achieve a winning position. Therefore,
the strategy of working with applicants should be based on a clear understanding of their
requests and flexible adaptation to selection factors (Jess, 2019).
A review of the activities of universities in attracting students shows that concentrating on
recruiting is not enough for a student to choose a particular university. Thus, the interaction of
universities with foreign students using various tools can be divided into three stages: recruiting,
integration during studying, after graduation. Arseniev, Belyaevskaya, Denisova and
Vrublevskaya (2016) claim in their work that recruitment of foreign students is the process of
finding, attracting, selecting and enrolling students in a university. It should be noted that the
first stage of working with foreign students begins long before they enter the university, for
example, at the stage of active participation of the university in international educational
exhibitions in order to inform applicants in other countries, as well as to present all the benefits
of studying in this particular university (Mahoney, 2013, Shurair & Pokharel, 2019, Sim,
Conduit, & Plewa, 2018).
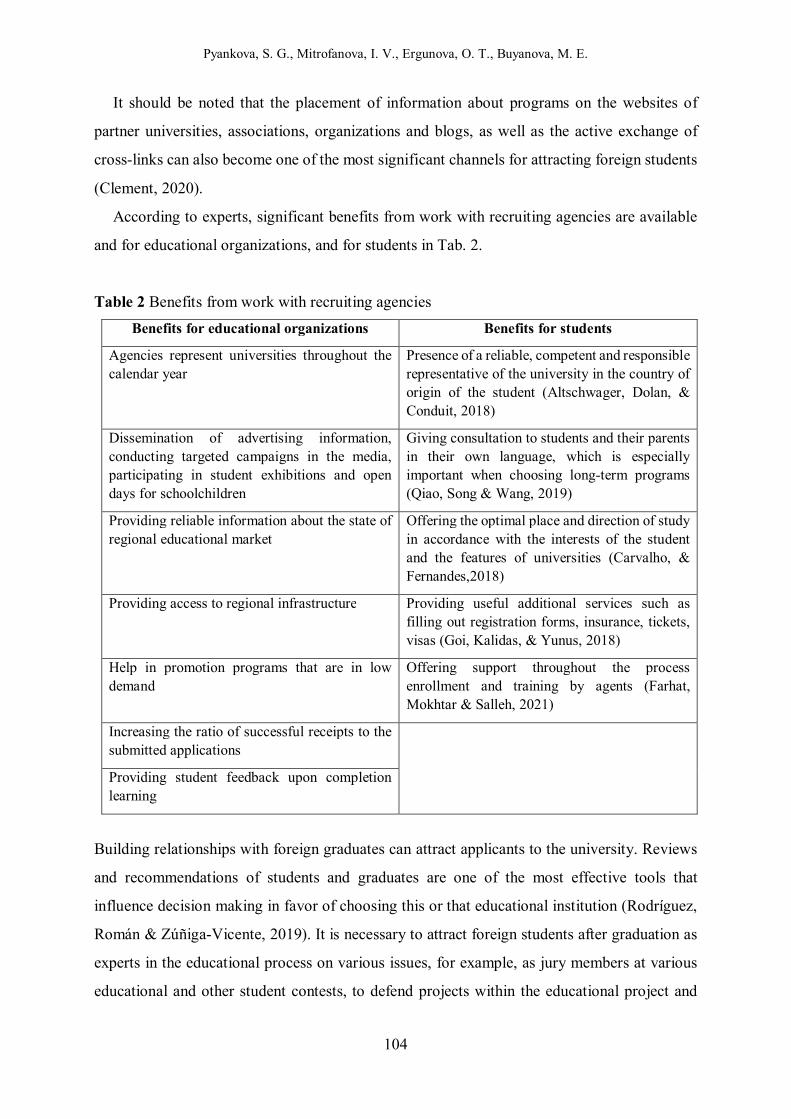
Pyankova, S. G., Mitrofanova, I. V., Ergunova, O. T., Buyanova, M. E.
104
It should be noted that the placement of information about programs on the websites of
partner universities, associations, organizations and blogs, as well as the active exchange of
cross-links can also become one of the most significant channels for attracting foreign students
(Clement, 2020).
According to experts, significant benefits from work with recruiting agencies are available
and for educational organizations, and for students in Tab. 2.
Table 2 Benefits from work with recruiting agencies
Benefits for educational organizations Benefits for students
Agencies represent universities throughout the calendar year
Presence of a reliable, competent and responsible representative of the university in the country of origin of the student (Altschwager, Dolan, & Conduit, 2018)
Dissemination of advertising information, conducting targeted campaigns in the media, participating in student exhibitions and open days for schoolchildren
Giving consultation to students and their parents in their own language, which is especially important when choosing long-term programs (Qiao, Song & Wang, 2019)
Providing reliable information about the state of regional educational market
Offering the optimal place and direction of study in accordance with the interests of the student and the features of universities (Carvalho, & Fernandes,2018)
Providing access to regional infrastructure Providing useful additional services such as filling out registration forms, insurance, tickets, visas (Goi, Kalidas, & Yunus, 2018)
Help in promotion programs that are in low demand
Offering support throughout the process enrollment and training by agents (Farhat, Mokhtar & Salleh, 2021)
Increasing the ratio of successful receipts to the submitted applications
Providing student feedback upon completion learning
Building relationships with foreign graduates can attract applicants to the university. Reviews
and recommendations of students and graduates are one of the most effective tools that
influence decision making in favor of choosing this or that educational institution (Rodríguez,
Román & Zúñiga-Vicente, 2019). It is necessary to attract foreign students after graduation as
experts in the educational process on various issues, for example, as jury members at various
educational and other student contests, to defend projects within the educational project and
Pyankova, S. G., Mitrofanova, I. V., Ergunova, O. T., Buyanova, M. E.
105
other activities. Such close cooperation will allow foreign students to leave only positive
impressions about this university (Pimonova & Fomina, 2018).
METHODS
The entry of Russia into the global educational space has made these countries need to create
an agreed strategic plan for the development of higher professional education (Alcaide-Pulido,
Alves & Gutiérrez-Villar, 2017, Butkouskaya, Llonch-Andreu & Alarcón-Del-Amo, 2019,
Ivanova & Mironova, 2012, Prentice, Wang & Loureiro, 2019).). Speaking about the
integration of Russian higher professional education into the world educational space, it is
necessary to especially note the role of the Bologna process, uniting 48 countries with different
political, cultural and academic traditions, which, step by step during the last twenty years, built
an area implementing a common set of commitments: structural reforms and shared tools Russia
joined the Bologna process in September 2003 at the Berlin meeting of European education
ministers. Russian higher education has transferred to a two-cycle system. So, according to the
Federal law “On education in the Russian Federation”, the following 2 steps can be
distinguished:
1) higher education includes 4 years of Bachelor programme and 2 years of Master
programme;
2) postgraduate education consists of three (four for certain subject areas) years for full-time
doctoral programme (aspirantura) and PhD programme.
Today, a huge role is played not by the number of universities, but by their position in world
rankings. Cowan G., Arsenault A. note that only a developed education system that meets the
requirements of innovative high-tech economy and is integrated into the international
educational and scientific space, can become one of the major competitive advantages of the
modern state in the «global competition for minds» and attract the most talented foreign
students (Arsenault & Cowan, 2008, Elken, 2019). The provision of educational opportunities
for foreign students is one of the most important instruments of soft power of the state
(Guilbault, 2018, Kerr & Kelly, 2017).
States are interested in developing special programs aimed at improving the quality of the
higher education system and to strengthen and enhance the position of their universities in
international rankings. Thus, the government of the Russian Federation introduced the project
“5-100”. The Project was launched by the Russian Ministry of Education and Science on the
Pyankova, S. G., Mitrofanova, I. V., Ergunova, O. T., Buyanova, M. E.
106
basis of a statement from Vladimir Putin on 7 May 2012 “On measures for the implementation
of state policy in the education and science field”. The goals of Project “5-100” are to maximize
the competitive position of a group of leading Russian universities in the global research and
education market and bring at least five universities from among the project participants into
the hundred best universities according to the world university rankings. The 21 participants of
Project “5-100” which receive government support were chosen through a two-stage process.
According to the information on the official website of the project, the main results expected of
Project “5-100” by 2020 are that Russia will have a group of leading contemporary universities
with an effective management structure, and a strong international academic reputation which
meets global development trends and can quickly adapt to global changes.
According to the Federal Law of December 29, 202 No. 273-ФЗ (as amended on March 7,
2018) “On Education in the Russian Federation”, foreign applicants are entitled to study in
Russia both on the basis of international agreements of the Russian Federation and
intergovernmental agreements at the expense of the Russian budget (including the established
quota), as well as under contractual agreements when paying for the cost of studying by an
individual and/or legal entity. There are three options of getting education at Russian
universities agreements at the expense of the Russian budget:
– to become the winner of Russian and specialized Olympiads which are annually approved
by the Ministry of Education and Science of Russia;
– to pass the unified state exam (USE) or entrance exams;
– to pass competitive selection for state scholarships (quota), which provides 15,000 places
for free studying for foreign citizens. Competitive selection for free studying under the quota
is organized by 95 representative offices Rossotrudnichestvo in 80 states of the world.
If we look at the data on foreign students in Russia for 2018/2019 indicated in Tab. 3, we
can see the prevailing number of foreign students in Russia from the same countries from where
they come to Kazakhstan. The choice of studying at Russian universities by foreign students
from other regions is determined by the satisfaction of foreign students with the variety of
educational programs, the material and technical condition of universities and the ratio of price
and quality of Russian education.
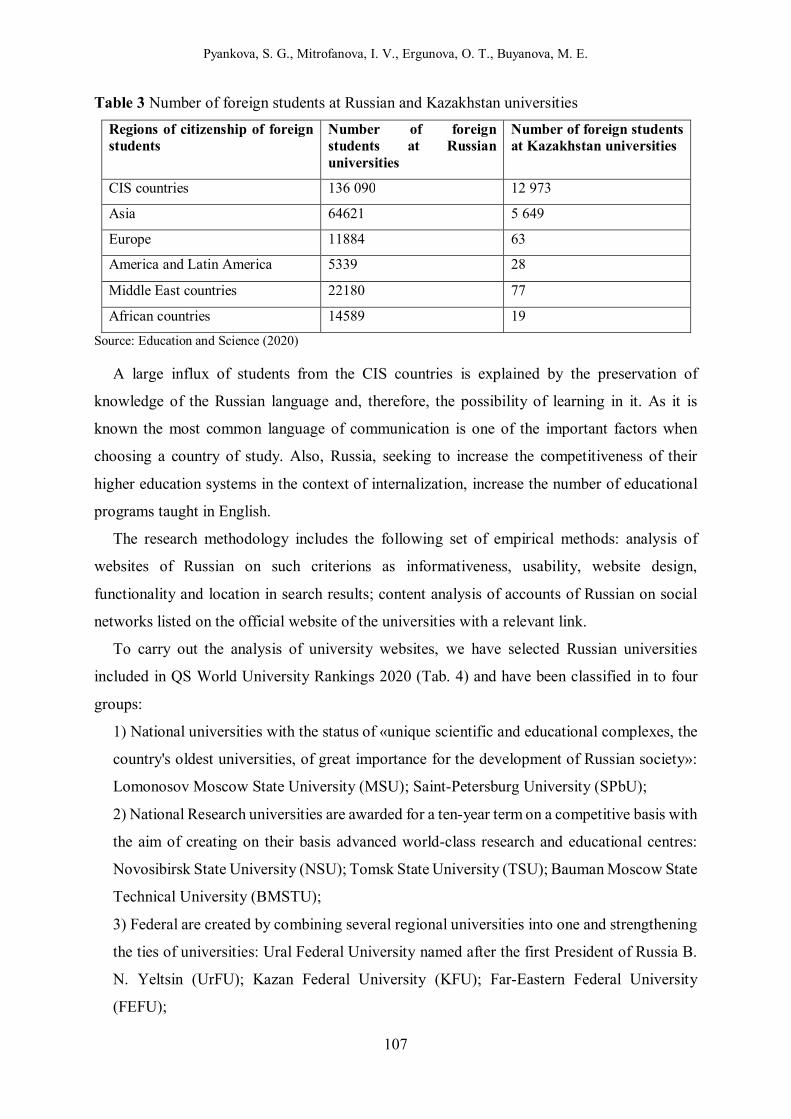
Pyankova, S. G., Mitrofanova, I. V., Ergunova, O. T., Buyanova, M. E.
107
Table 3 Number of foreign students at Russian and Kazakhstan universities
Regions of citizenship of foreign students
Number of foreign students at Russian universities
Number of foreign students at Kazakhstan universities
CIS countries 136 090 12 973
Asia 64621 5 649
Europe 11884 63
America and Latin America 5339 28
Middle East countries 22180 77
African countries 14589 19
Source: Education and Science (2020)
A large influx of students from the CIS countries is explained by the preservation of
knowledge of the Russian language and, therefore, the possibility of learning in it. As it is
known the most common language of communication is one of the important factors when
choosing a country of study. Also, Russia, seeking to increase the competitiveness of their
higher education systems in the context of internalization, increase the number of educational
programs taught in English.
The research methodology includes the following set of empirical methods: analysis of
websites of Russian on such criterions as informativeness, usability, website design,
functionality and location in search results; content analysis of accounts of Russian on social
networks listed on the official website of the universities with a relevant link.
To carry out the analysis of university websites, we have selected Russian universities
included in QS World University Rankings 2020 (Tab. 4) and have been classified in to four
groups:
1) National universities with the status of «unique scientific and educational complexes, the
country's oldest universities, of great importance for the development of Russian society»:
Lomonosov Moscow State University (MSU); Saint-Petersburg University (SPbU);
2) National Research universities are awarded for a ten-year term on a competitive basis with
the aim of creating on their basis advanced world-class research and educational centres:
Novosibirsk State University (NSU); Tomsk State University (TSU); Bauman Moscow State
Technical University (BMSTU);
3) Federal are created by combining several regional universities into one and strengthening
the ties of universities: Ural Federal University named after the first President of Russia B.
N. Yeltsin (UrFU); Kazan Federal University (KFU); Far-Eastern Federal University
(FEFU);
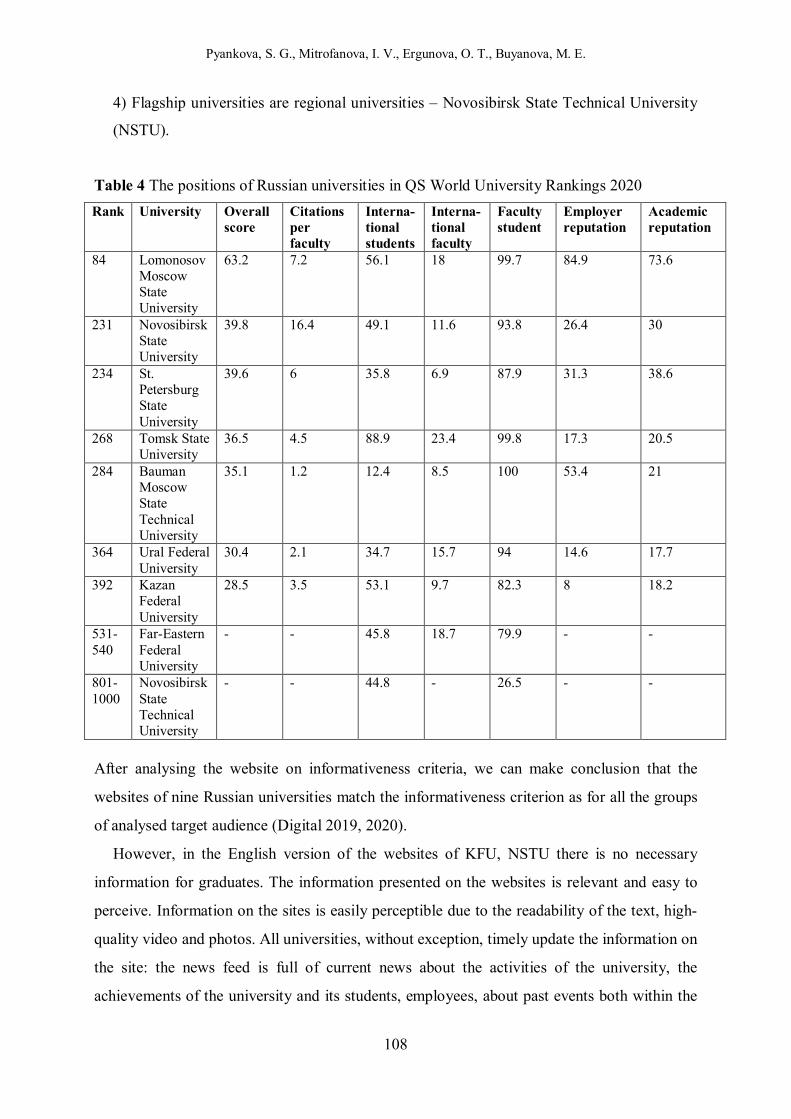
Pyankova, S. G., Mitrofanova, I. V., Ergunova, O. T., Buyanova, M. E.
108
4) Flagship universities are regional universities – Novosibirsk State Technical University
(NSTU).
Table 4 The positions of Russian universities in QS World University Rankings 2020
Rank University Overall score
Citations per faculty
Interna- tional students
Interna-tional faculty
Faculty student
Employer reputation
Academic reputation
84 Lomonosov Moscow State University
63.2 7.2 56.1 18 99.7 84.9 73.6
231 Novosibirsk State University
39.8 16.4 49.1 11.6 93.8 26.4 30
234 St. Petersburg State University
39.6 6 35.8 6.9 87.9 31.3 38.6
268 Tomsk State University
36.5 4.5 88.9 23.4 99.8 17.3 20.5
284 Bauman Moscow State Technical University
35.1 1.2 12.4 8.5 100 53.4 21
364 Ural Federal University
30.4 2.1 34.7 15.7 94 14.6 17.7
392 Kazan Federal University
28.5 3.5 53.1 9.7 82.3 8 18.2
531-540
Far-Eastern Federal University
- - 45.8 18.7 79.9 - -
801-1000
Novosibirsk State Technical University
- - 44.8 - 26.5 - -
After analysing the website on informativeness criteria, we can make conclusion that the
websites of nine Russian universities match the informativeness criterion as for all the groups
of analysed target audience (Digital 2019, 2020).
However, in the English version of the websites of KFU, NSTU there is no necessary
information for graduates. The information presented on the websites is relevant and easy to
perceive. Information on the sites is easily perceptible due to the readability of the text, high-
quality video and photos. All universities, without exception, timely update the information on
the site: the news feed is full of current news about the activities of the university, the
achievements of the university and its students, employees, about past events both within the
Pyankova, S. G., Mitrofanova, I. V., Ergunova, O. T., Buyanova, M. E.
109
university and outside it, as well as announcements of upcoming events. For the convenience
of using a newsfeed the universities use filters by date, by topic news. Sorting news by topics
is similar, mostly about science, events, achievements, local and international students,
cooperation, sport, culture, innovations, education. Universities are trying to make their sites
more user-friendly by introducing elements to improve perceptibility of information and better
understand implications. As a result of comparing the sites on usability we can note the
navigation for all the sites is quite understandable and consistent.
RESULTS
All the universities except Kazan Federal University have set the version for visually impaired
on the sites in Russian. BMSTU has it on the site in English, too. MSU, TSU and UrFU have
the version for visually impaired in both Russian and English version. Thus, by installing
elements such as a sitemap, a search form university allow users to have quick access to the
desired information without having to browse through all sections, taking into account the user's
time and efforts, which also increases website usability. For effective communicative
interaction with visitors, the main thing is to comply with the feedback principle. Universities
provide different types of communication elements not limited to indicating contact numbers,
mail, addresses and links to accounts on various social networks. For example, MSU, SPbU,
BMSTU and KFU offer to contact the Rector of the heads of University departments using their
Internet reception by sending a letter (Pyankova, Mitrofanova, Ergunova, & Zhemerikina,
2020).
According to multilingualism, three leaders can be distinguished: KFU is the absolute leader
by presenting its official website in nine languages, then UrFU with five languages. MSU,
SPbU, NSU, TSU have their sites in three languages: Russian, English and Chinese. The
websites of BMSTU, FEFU and NSTU work in two languages: Russian and English. It is
noteworthy that universities not only translate content into the declared foreign language, but
also localize it by posting data relevant to foreign citizens and skipping Russian news.
It is a well-known fact that Web design is important because it affects how the audience
perceives the brand. The impression that the site reproduces on them can make them stay on
the website and get more information or leave the site and contact a competitor. We also have
analysed the Russian universities on functionality and entered the data in Tab. 5.
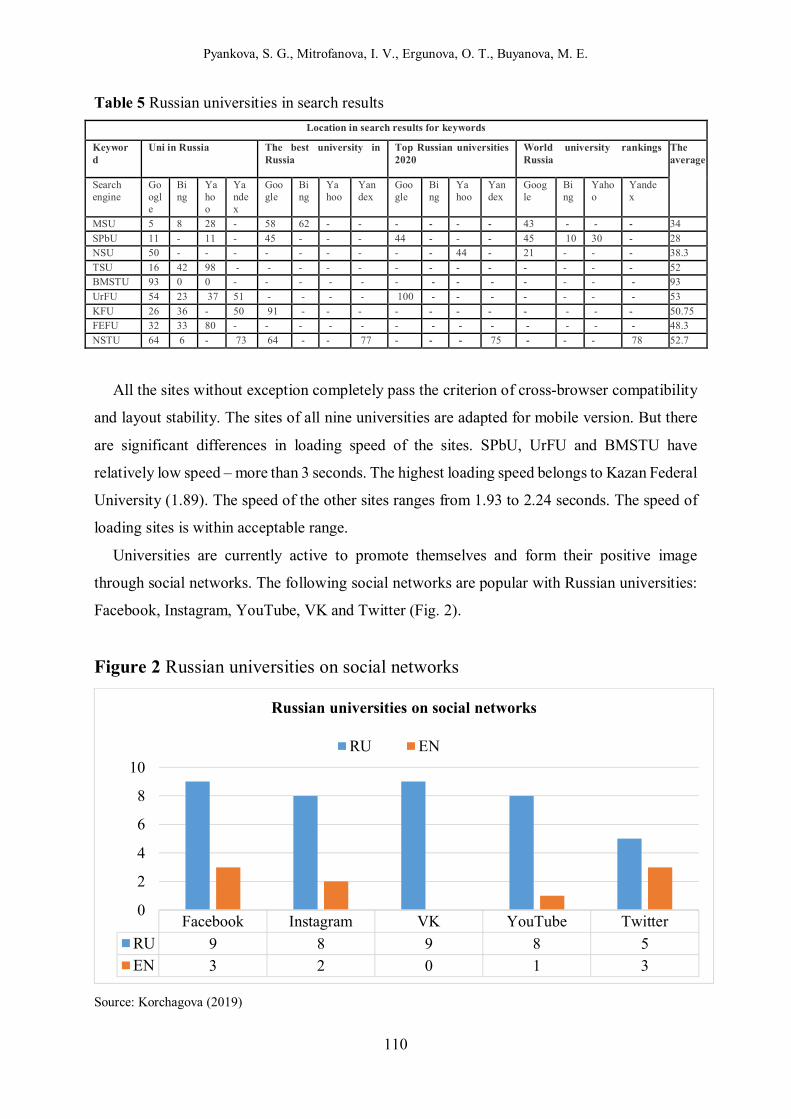
Pyankova, S. G., Mitrofanova, I. V., Ergunova, O. T., Buyanova, M. E.
110
Table 5 Russian universities in search results
Location in search results for keywords
Keyword
Uni in Russia The best university in Russia
Top Russian universities 2020
World university rankings Russia
The average
Search engine
Bing
Yahoo
Yandex
Bing
Yahoo
Yandex
Bing
Yahoo
Yandex
Bing
Yahoo
Yandex
MSU 5 8 28 - 58 62 - - - - - - 43 - - - 34
SPbU 11 - 11 - 45 - - - 44 - - - 45 10 30 - 28 NSU 50 - - - - - - - - - 44 - 21 - - - 38.3
TSU 16 42 98 - - - - - - - - - - - - - 52 BMSTU 93 0 0 - - - - - - - - - - - - - 93
UrFU 54 23 37 51 - - - - 100 - - - - - - - 53
KFU 26 36 - 50 91 - - - - - - - - - - - 50.75 FEFU 32 33 80 - - - - - - - - - - - - - 48.3
NSTU 64 6 - 73 64 - - 77 - - - 75 - - - 78 52.7
All the sites without exception completely pass the criterion of cross-browser compatibility
and layout stability. The sites of all nine universities are adapted for mobile version. But there
are significant differences in loading speed of the sites. SPbU, UrFU and BMSTU have
relatively low speed – more than 3 seconds. The highest loading speed belongs to Kazan Federal
University (1.89). The speed of the other sites ranges from 1.93 to 2.24 seconds. The speed of
loading sites is within acceptable range.
Universities are currently active to promote themselves and form their positive image
through social networks. The following social networks are popular with Russian universities:
Facebook, Instagram, YouTube, VK and Twitter (Fig. 2).
Figure 2 Russian universities on social networks
Source: Korchagova (2019)
Facebook Instagram VK YouTube Twitter
RU 9 8 9 8 5EN 3 2 0 1 3
0
2
4
6
8
10
Russian universities on social networks
RU EN
Pyankova, S. G., Mitrofanova, I. V., Ergunova, O. T., Buyanova, M. E.
111
The number of Facebook subscribers ranges from 562 to 51273, where Moscow State
University (51273), UrFU’s account in English (9096) and Far-Eastern Federal University
(7314) are among the top three. From December 19, 2019 to January 19, 2020, the universities
published posts ranging from 6 to 92. 92 published posts belong to UrFU’s account in Russian.
MSU and NSTU published the equal number of posts (65). BMSTU has the least number of
posts – only six.
Thus, we can conclude that Russian universities are active in all three stages of working with
students using online communication tools as an official website and social networks, as well
as offline through a series of events involving student organizations. However, the full potential
of effective online channels was not affected, since significant shortcomings were found in the
use of the site during its analysis, and the inefficiency or even lack of a strategy for maintaining
accounts on social networks manifested as a low level of user engagement. Another important
area requiring great efforts and attention at these sites is communication with graduates. Since
not all universities provide information for this target audience on their websites and social
networks.
RECOMMENDATIONS
We suggest applying the following online forms as ways to establish more effective
communication with people interested in educational services of russian universities on the
international market for educational services:
1) A form to book Skype consultation with a representative of admissions committee,
indicating the date and time;
2) A form for registration to use the opportunity to be a student at the russian universities for
a day, indicating.
The second method requires the participation of current active students to jointly attend
lectures and practical classes, present student organizations, and tour the campus (Huempfner
& Kopf, 2017). In these forms, users must specify an email address, which contributes to the
creation of a customer base for the successful use of email marketing.
The content of the sections for “Graduates” differs in the Russian and English versions of
the site. The Russian-language version of the «Graduates» section more fully informs about the
activities of the Alumni Association and its units, about projects and events with the
participation of graduates and for them, awards. We recommend describing the most successful
employment examples of both local and foreign graduates in the format of video presentations
Pyankova, S. G., Mitrofanova, I. V., Ergunova, O. T., Buyanova, M. E.
112
on their behalf. Such section does not function in the English version, but it is recommended to
create it because the indicated types of data can positively affect the decision of applicants and
increase the prestige of the university.
As we know (Kaushal & Ali, 2019), various interactive elements on a site are the most
attractive and contribute to a more memorable and easily perceived content compared to static
alternatives. For example, it is recommended that russian universities, various interactive
elements on a site are the most attractive and contribute to a more memorable and easily
perceived content compared to static alternatives. For example, it is recommended that UrFU,
in sections for applicants or graduates, provide statistical data on the employment of graduates
of UrFU at all levels and educational programs in detail using updated static infographics using
multimedia interactivity elements. Installed filters by educational level and educational
programs and navigation buttons will allow users to receive the information requested by them.
The embodiment of this project also requires maintaining communication with graduates and
conducting questionnaires for graduates on an ongoing basis. Tests are one of the simplest
forms of interactive content that Russian universities can use as an aid to applicants and enrolled
students in determining their interests and propensities for anticipated employment.
Users of social networks interested in a university would also be interested in the experience
of educational and extracurricular activities of current students, as they are the most reliable
source of information for applicants and the ability to speak the same language increases the
confidence of the audience (Chapleo & O’Sullivan, 2017). For this mission, active students of
Russian universities who want to gain practical skills in social media marketing or attract
subscribers to their account can act as virtual guides, giving an idea of what everyday student
life looks like, where the audience of the account can see the class process, interacting both
with teachers and students, demonstrate events or even the process of preparing for the event.
For the purpose of this type of content, live videos do a great job in stories, live broadcasts.
Real-time exchange and interaction on social platforms are at the peak of popularity, so active
work and interaction with their subscribers can be a great way to implement the above described
plan.
Game content on social networks launches mechanisms and tools that build two-way
interaction between the author and subscribers. Tests are one of the simplest forms of interactive
content that Russian universities can use as an aid to applicants and enrolled students in
determining their interests and propensities for anticipated employment. According to the
results of the passed test, students will receive practical recommendations and will be able to
study several proposed student organizations operating at Russian universities. Thus, we will
Pyankova, S. G., Mitrofanova, I. V., Ergunova, O. T., Buyanova, M. E.
113
be able to engage in the activities of Russian universities in an entertaining way and create a
positive emotional connection with the brand.
Also, students and employees of Russian universities can participate in global challenges
adapting for their purpose, distributed on the expanses of social networks. Today, the trend
challenge is flip the switch, which the university can adapt to its own style and even attract the
rector of the university, showing the path of the applicant to the graduate receiving a diploma
from the Rector. Participating in such events, Russian universities clearly show how they
support the initiatives and ideas of students and try to be on the same wavelength with the
audience. Given the popularity of videos on TikTok, perhaps Russian universities should start
acting on one of the trending platforms for interacting with a young audience. Another
advantage of the site is the principle of “repeat after all”, which makes it easy to catch trends
and speak the same language with the target audience.
CONCLUSION
The research methodology includes the following set of empirical methods: analysis of
websites of Russian on such criterions as informativeness, usability, website design,
functionality and location in search results; content analysis of accounts of Russian on social
networks listed on the official website of the universities with a relevant link; QS World
University Rankings 2020.
The analysis of the features of integration communications in the field of the
internationalization of higher education in the Russian Federation allowed us to conclude that
the large number of universities and the diversity of their educational programs taught in both
Russian and English, providing several ways of getting education on a budgetary basis. RF has
a budget education system for people who are not citizens of Russia. According to interviews
with employees of departments of universities in Russia, universities use similar tools for
working with applicants (Open Doors Days, participation in educational exhibitions,
international conferences, organization of field information sessions), students (assistance in
paperwork and settling in a dormitory with representatives of buddy, organization of the
Orientation Week, campus tour, etc.) and graduates (assistance in finding employment, creating
an association of graduates, invitation to participate in university events). However, they note
the high efficiency of online communication.
The official websites of universities and their accounts on social networks were selected as
online communication, to which users can go from the site through a link-transition. As a result
Pyankova, S. G., Mitrofanova, I. V., Ergunova, O. T., Buyanova, M. E.
114
of the analysis, we can conclude that universities in Russia may not understand the full potential
of these online resources, since they do not use them in full. During the analysis, significant
shortcomings of sites were revealed, namely, insufficient information content of the site for the
selected group of the target audience, the absence or limited functioning of interactive tools,
the presence of irrelevant sections and links. Universities will have to work on Search Engine
Optimisation of their websites, as their low position in search results, and in most cases a
complete absence, is noted. The most popular social networks with Russian are Facebook,
Instagram, Vkontakte, YouTube and Twitter. In this sector, one can also highlight a number of
shortcomings affecting the effective communication activities of the university.
Among the analysed Russian universities there are universities whose positive experience in
maintaining accounts can be adopted. Since they create content using modern trends, for
example, sharing of user-generated content, the publication of interactive and entertaining
posts, the placement of useful information. The main problem of the activities of universities
on social networks is the low level of user engagement, expressed in the number of likes,
comments, and shares which also affects the position of the university’s site in search results.
Therefore, universities will have to develop an effective communication concept for
maintaining their accounts that meets the needs and interests of users.
As a result of the study, we can conclude that in connection with the entry of universities
into the global market for educational services, the use of advertising and PR technologies in
accordance with the needs, wishes and expectations of the target audience and the overall
development strategy of the university are necessary and quite effective tools for the
implementation of competitive activities of universities and the formation of university brand
and its positive image.
Acknowledgement
The publication was prepared as part of the implementation of the State Assignment of the Southern Scientific Centre of the Russian Academy of Sciences, No. of state registration of the project AAAA-A19-119011190184-2.
REFERENCES
Alcaide-Pulido, P., Alves, H., & Gutiérrez-Villar, B. (2017). Development of a model to analyze HEI image: A case based on a private and a public university. Journal of Marketing for Higher Education, 27(2), 162-187.
Altschwager, T., Dolan, R., & Conduit, J. (2018). Social brand engagement: How orientation events engage students with the university. Australasian Marketing Journal, 26(2), 83-91.
Pyankova, S. G., Mitrofanova, I. V., Ergunova, O. T., Buyanova, M. E.
115
Arsenault, A., & Cowan, G. (2008). Moving from Monologue to Dialogue to Collaboration: The Three Layers of Public Diplomacy. The ANNALS of the American Academy of Political and Social Science, 616(1), 10-30.
Arseniev, D. G., Belyaevskaya, E. А., Denisova, V. A., & Vrublevskaya, M. V. (2016). Efficacy analysis of instruments and tools of attracting foreign students to university educational programs. University Management: Practice and Analysis, 6, 44-53.
Ashirbagina, N. L., & Frick, O. V. (2016). The image of the university through the eyes of the subjects of the educational process. Actual problems of the humanities and natural sciences, 4, 17-20.
Belousenko, D. V. (2018). Use of social networks in the promotion of educational services. Young scientist, 45, 55-58.
Belyavsky, I. K. (2014). Marketing research: information, analysis, forecast: Textbook. Allowance. Moscow: Prospect. 150.
Bocharov, M. P., & Chumikov, A. N. (2014). Public Relations: Theory and Practice. Moscow: Delo. 312.
Butkouskaya, V., Llonch-Andreu, J., & Alarcón-Del-Amo, M. (2019). Strategic antecedents and organisational consequences of IMC in different economy types. Journal of Marketing Communications, 27(2), 115-136.
Carvalho, A., & Fernandes, T. (2018). Understanding customer brand engagement with virtual social communities: A comprehensive model of drivers, outcomes and moderators. Journal of Marketing Theory and Practice, 26(1-2), 23-37. https://doi.org/10.1080/10696679.2017.1389241
Chapleo, C. (2015). Brands in higher education. International Studies of Management & Organization, 45(2), 150-163. https://doi.org/10.1080/00208825.2015.1006014
Chapleo, C., & O’Sullivan, H. (2017). Contemporary thought in higher education marketing. Journal of Marketing for Higher Education, 27(2), 159-161. https://doi.org/10.1080/08841241.2017.1406255
Clement, J. (2020). Facebook: distribution of global audiences 2020, by age and gender. Retrieved from: https://www.statista.com/statistics/376128/facebook-global-user-age-distribution/.
Cordelier, В., Vasquez, C. & Viviane, S. (2021). Branding the university: building up meaning through ideological oppositions. Journal of Marketing for Higher Education, 31:1, 136-154. https://doi.org/10.1080/08841241.2020.1761507
Education and Science activity of Rossotrudnichestvo (2020). Retrieved from: http://rs.gov.ru/en/activities/10 2020
Efthymios, C. & Zinck Stagno, M. C. (2011). Potential of the social media as instruments of higher education marketing: a segmentation study. Journal of Marketing for Higher Education, 21:1, 7-24. https://doi.org/10.1080/08841241.2011.573593
Elken, M. (2019). Marketing in higher education. In: Encyclopedia of international higher education systems and institutions. Springer Netherlands, 1-5. https://doi.org/10.1007/978-94-017-9553-1_569-1
Kashif, F., Mokhtar, S. S. M.& Salleh, S. Bt. Md. (2021). Role of brand experience and brand affect in creating brand engagement: a case of higher education institutions (HEIs). Journal of Marketing for Higher Education, 31(1), 107-135. https://doi.org 10.1080/08841241.2020.1759753
Fomina, E. M., & Pimonova, S. A. (2018). Growing attractiveness of Russian universities for international students. University Management: Practice and Analysis, 22(4), 97-109. https://doi.org/10.15826/umpa.2018.04.043
Freberg, K. (2020). Social Media for Strategic Communication: Creative Strategies and Research-Based Applications. Journal of Public Relations Education, 6 (2), 200-204.
Pyankova, S. G., Mitrofanova, I. V., Ergunova, O. T., Buyanova, M. E.
116
Huempfner, L., & Kopf, D. A. (2017). Using stakeholder marketing and social responsibility for new product development in higher education: A business spanish model. Journal of Marketing for Higher Education, 27(2), 251-273. https://doi.org/10.1080/08841241.2017.1384782
García, H. A., & Villarreal, M. de L. (2014). The “Redirecting” of International Students: American Higher Education Policy Hindrances and Implications. Journal of International Students, 4(2), 126-136.
Ivanova, I. N., & Mironova, R. E. (2012). Reintegration relations in the field of education in the post-Soviet space. Povolzhsky trade and economic journal, 3(25), 98-110.
Goi, M., Kalidas, V., & Yunus, N. (2018). Mediating roles of emotion and experience in the stimulus-organism-response framework in higher education institutions. Journal of Marketing for Higher Education, 28(1), 90-112. https://doi.org/10.1080/08841241.2018.1425231
Guilbault, M. (2018). Students as customers in higher education: The (controversial) debate needs to end. Journal of Retailing and Consumer Services, 40, 295-298. https://doi.org/10.1016/j.jretconser.2017.03.006
Jess, L. Gregory, (2019). Applying SERVQUAL: Using service quality perceptions to improve student satisfaction and program image. Journal of Applied Research in Higher Education, 11 (4), 110-115.
Kaushal, V., & Ali, N. (2020). University Reputation, Brand Attachment and Brand Personality as Antecedents of Student Loyalty: A Study in Higher Education Context. Corporate Reputation Review, Palgrave Macmillan, 23(4), 254-266. https://doi.org/10.1057/s41299-019-00084-y
Kerr, G., & Kelly, L. (2017). IMC education and digital disruption. European Journal of Marketing, 51(3), 406-420. https://doi.org/10.1108/EJM-08-2015-0603
Korchagova, L. A. (2019). Promotion analysis of the universities on social networks. RSUH/RGGU Bulletin. “Economics. Management. Law” Series; 1, 31-43. https://doi.org/10.28995/2073-6304-2019-1-31-43
Levina, S. A. (2015). Integrated Marketing Communications Application in the Education Market. Management consulting, 6, 173-181.
Mahoney, J. (2013). Strategic Communication: Principles and Practice. Melbourne: Oxford University Press. 260.
Melikyan, A. V. (2016). Typology of international educational activities of Russian universities. Higher education in Russia, 12(207), 140-150.
Neretina, E. A., & Makarets, A. B. (2009). University website as an important tool of marketing communications. Bulletin of the South Ural State University. Series: Economics and Management, 41 (12), 85-94.
Ong, C. H., Lee, H. W., & Ramayah, T. (2018). Impact of brand experience on loyalty. Journal of Hospitality Marketing & Management, 27(7), 755-774. https://doi.org/10.1080/19368623.2018.1445055
Qiao, L., Song, M., & Wang, N. T. (2019). Virtual Brand Community Experience, Identification, and Electronic Word-of-mouth. Journal of Computer Information Systems, 61(4), 1-14. https://doi.org/10.1080/08874417.2019.1661805
Potdar, V., Joshi, S., Harish, R., Baskerville, R., & Wongthongtham, P. (2018). A process model for identifying online customer engagement patterns on Facebook brand pages. Information Technology & People, 31(2), 595-614. https://doi.org/10.1108/ITP-02-2017-0035
Pyankova, S. G., Mitrofanova, I. V., Ergunova, O. T., & Zhemerikina, E. B., (2020). Promotion of a Higher EducationInstitution in the Educational Services’ Market Under the
Pyankova, S. G., Mitrofanova, I. V., Ergunova, O. T., Buyanova, M. E.
117
Conditions of Spatial Integration of Universities. Regional Economy. South of Russia, 8 (3), 34-51. https://doi.org/10.15688/re.volsu.2020.3.4
Prentice, C., Wang, X., & Loureiro, S. M. (2019). The influence of brand experience and service quality on customer engagement. Journal of Retailing and Consumer Services, 50, 50-59. https://doi.org/10.1016/j.jretconser.2019.04.020
QS World University Rankings (2021). Retrieved from: https://www.topuniversities.com/university-rankings/world-university-rankings/2021
Rodríguez, G. C., Román, C. P., & Zúñiga-Vicente, J.Á. (2019). The relationship between identification and loyalty in a public university: Are there differences between (the perceptions) professors and graduates? European Research on Management and Business Economics, 25(3), 122-128. https://doi.org/10.1016/j.iedeen.2019.04.005
Salgado, E. G., & Vela, M. R. (2019). Brand Fan pages experience and strength as antecedents to engagement and intensity of use to achieve HEIS’ brand loyalty. Journal of Marketing for Higher Education, 29(1), 102-120. https://doi.org/10.1080/08841241.2019.1605437
Shahsavar, T., & Sudzina, F. (2017). Student satisfaction and loyalty in Denmark: Application of EPSI methodology. PLOS ONE, 12(12). https://doi.org/10.1371/journal.pone.0189576
Salamatov, A. A., Korneev, D. N., Demtsura, S. S., Plohotnyuk, E. B. Kostryukova, L. A., Simonyan, R. Y., …Apukhtin, A. S. (2012). Marketing activities of a vocational education institution. A. A. Salamatov (Eds.). Chelyabinsk: Chelyabinsk State Pedagogical University. 104.
Schulz, S. A. (2006). Mastering the admissions game: understanding the enrollment priorities and recruitment strategies of master’s institutions. Electronic dissertation. Arizona: The University of Arizona. Retrieved from: https://repository.arizona.edu/handle/ 10150/194679.
Shurair, A. S., & Pokharel, S. (2019). Stakeholder’s perception of service quality: A case in Qatar. Quality Assurance in Education, 27(4), 493-510. https://doi.org/10.1108/qae-05-2017-0023
Sim, M., Conduit, J., & Plewa, C. (2018). Engagement within a service system: A fuzzy set analysis in a higher education setting. Journal of Service Management, 29(3), 422-442. https://doi.org/10.1108/JOSM-08-2016-0232
Simon, C., Brexendorf, T. O., & Fassnacht, M. (2013). Creating online brand experience on Facebook. Marketing Review St. Gallen, 30(6), 50-59. https://doi.org/10.1365/s11621-013-0299-6
Simon, F., & Tossan, V. (2018). Does brand-consumer social sharing matter? A relational framework of customer engagement to brand-hosted social media. Journal of Business Research, 85, 175-184. https://doi.org/10.1016/j.jbusres.2017.12.050
Strydom, J., Jooste, C., & Cant, M. (2000). Marketing management (4th ed.). Cape Town: Juta. 350.
Yoshida, M., Gordon, B. S., Nakazawa, M., Shibuya, S., & Fujiwara, N. (2018). Bridging the gap between social media and behavioral brand loyalty. Electronic Commerce Research and Applications, 28, 208-218. https://doi.org/10.1016/j.elerap.2018.02.005
Yuzhakova, T. A., & Karakchieva, I. V. (2015). International student mobility is a tool to increase the country's competitiveness in the international market for educational services. Science, Technology and Education, 5(11), 107-111.
DETUROPE – THE CENTRAL EUROPEAN JOURNAL OF REGIONAL DEVELOPMENT AND TOURISM Vol. 13 Issue 3 2021 ISSN 1821-2506
118
Original scientific paper
STRATEGIES OF TOURISM SERVICE PROVIDERS TO COPE WITH
THE COVID-19 PANDEMIC
Helena KUBÍČKOVÁa, Andrea HOLEŠINSKÁa
a Masaryk University, Faculty of Economics and Administration, Brno, Czech Republic, [email protected]; [email protected]
Cite this article: Kubíčková, H., Holešinská, A. (2021). Strategies of Tourism Service Providers to Cope with the COVID-19 Pandemic. Deturope. 13(3), 118-129.
Abstract
The situation with the COVID-19 pandemic has a negative impact on the development of tourism. It imposes restrictions on both tourism supply and tourism demand. Government lockdowns travel businesses and, at the same time, restricts the freedom of movement. Thus, the supply and demand sides have to cope with the exogenous shocks. The first evidence of experience and reactions of travel businesses was presented in early March 2020. Data from bookings describes how visitors start to adapt their travel behavior to the exit strategies. Even rural tourism is affected by the worldwide spread crisis. To highlight the impacts on rural tourism, this research focuses on middle and small-sized entrepreneurs (e.g., farmers, winemakers, local private rural museums, local accommodation providers; local providers of hippo-therapy) and on local tourist organizations (e. g. DMO, tourist information centers) involved in rural tourism. The aim of this study is to show how they overcame the situation with the COVID-19 pandemic. In other words, the study describes the changes in visitor behavior from the perspective of rural tourism providers. The research is based on a case study of South Moravia and applies both qualitative (a questionnaire survey) and quantitative (interviews) methods. The research data shows that rural tourism providers manage to cope with the government restrictions and tailor their services to new customers'' requirements as well. Besides the loss of incomes, tourism service providers face a decrease in the number of visitors, and thus they suffer a slump in sales. The majority of all rural tourism providers responded that their segment of visitors had changed. More specifically, the absence of foreign visitors was replaced by domestic ones. Keywords: COVID-19; behavior of visitors; reactions of service providers; exit strategy; rural tourism
INTRODUCTION
Undoubtedly, the COVID-19 pandemic is the biggest issue nowadays. The effects of the
COVID-19 pandemic on international tourism (e.g., Gössling, Scott & Hall, 2021) and its
transformation impacts (e.g., Hall, Scott, & Gössling, 2021) have been extensively published.
Even estimating models (Škare, Sariano, & Porada-Rochoń, 2021) have been introduced. In
general, the impacts on tourism businesses have been widely discussed (e.g., Richards, 2020),
as well as the behaviour of the tourism demand-side (e.g., Keller, 2020).
The aim of this paper is to identify exit strategies of tourism service providers (from both
the private and public sectors) that helped them to overcome the situation with the COVID-19
pandemic. The paper highlights two aspects that influence the behavior of tourism service
Kubíčková, H., Holešinská, A.
119
providers during the COVID-19 pandemic. The first one considers the government restrictions
and the second one the visitors' changed decisions.
Furthermore, the paper describes the application of crisis management in tourism practice.
Tourism service providers (specifically, small-sized entrepreneurs) without any previous
experience had to cope with the situation and had to invent their own strategy how to survive.
THEORETICAL BACKGROUND
Knowledge of the behavior (expectations) of visitors is important for the decision-making of
tourism service providers. Based on this knowledge, they can effectively make their offer
(tourism product). The behavior of visitors and their motives have been addressed by a number
of authors. In the 1960s-1970s, it was a trend to travel with the motive of "recovering from
work" and the possibilities and availability of travel had an impact on the decision-making that
appeared differently for certain groups of people, see Cohen (1972) and his typology of the
visitor or Plog (1973) and his classification of alo-centric and psychocentric. In the 1990s, travel
became a 'philosophy of life' and this was reflected in the changes of visitor behavior, see post-
tourist (Urry, 1990). Information and communication technologies are bringing a major change
in the trend of visitor behavior. The instant availability of information and at the same time the
easy accessibility to the destination result in the fact that the visitor makes decisions very
quickly (Tajeddini, Ratten, Merkle, 2019) and spends his/her holiday in the same way. The
vacation is cheaper, shorter and faster (Poon, 2003). However, a dramatic change was brought
about by the COVID-19 pandemic, which slowed down this trend (Fotiadis, Polyzos, Huan,
2021). Visitors were forced to reevaluate their expectations (Hao, Bai, Sun, 2021).
Nevertheless, the desire to travel has remained! In addition, visitor attitudes and requirements
have changed (www.revfine.com, 2020). Digital technologies dominate the tourism industry.
People want to travel safely! (Kock, Nørfelt, Josiassen, Assaf Tsionas, 2020) But they prefer
local experiences - avoiding mass tourism as a potential opportunity to get infected with
COVID-19. Moreover, they choose nearby destinations rather than international ones (Arbulú,
Razumova, Rey-Maquieira, Sastre, 2021). The first research question in this context is: How
did visitors adapt their behavior to the situation with the COVID-19 pandemic?
However, changes in visitor behavior are not the only aspect to which tourism service
providers must adapt. The corona pandemic as an exogenous shock precedes a crisis situation
(Keller, 2020), to which governments must urgently respond. The search for decisions and
unclear communication from the government creates instability and chaos (Holešinská &
Kubíčková, H., Holešinská, A.
120
Záboj, 2021). The crisis becomes chronic under these conditions (Antušák, 2009). Tourism
service providers are thus forced to develop a strategy that will meet the demands of visitors
and at the same time comply with government restrictions. The further research questions are:
How did tourism service providers cope with government restrictions? How did they react to
the visitor's changed behavior?
DATA AND METHODS
For the purpose of this research, the case study was chosen as the best example demonstrating
the behaviour of tourism service providers with the beginning of the COVID-19 pandemic
(spring 2020). The basis is a questionnaire survey. This was supplemented by personal
interviews. The case study is, therefore, both quantitative and primarily qualitative in nature.
The questionnaire included both closed and open-ended questions or combined questions.
The structure of the questionnaire corresponded to the focus of the research. The questionnaire
was distributed by email, in the form of a link to the online application, and at the same time in
the form of .doc or .pdf format.
As far as the interviews are concerned, they were conducted, both in person and by telephone
due to the COVID-19 pandemic. Representatives who provide typical services of rural tourism
from both public and private sector were selected.
Data sample
The research included 823 entities. These represented typical service providers of rural tourism.
The major criterium was the local character of their service. A total of 121 respondents
answered the questionnaire survey, which ran from May to July 2021 (Tab. 1). Of these, tourism
service providers from the private sector are dominant. The return rate of the questionnaires
was 14%. The lower return rate can be attributed to a reluctance to respond due to the long
duration of the COVID-19 pandemic and partly due to the number of open-ended questions.
Nevertheless, valuable information was still obtained and supported by the interviews
conducted. Two business entities and one public sector entity participated in the interviews.
Table 1 Data sample
Total addressed Respondents (n = 121) Interviews (n = 3) 823 Private Public Private Public
95 26 2 1 Source: own survey
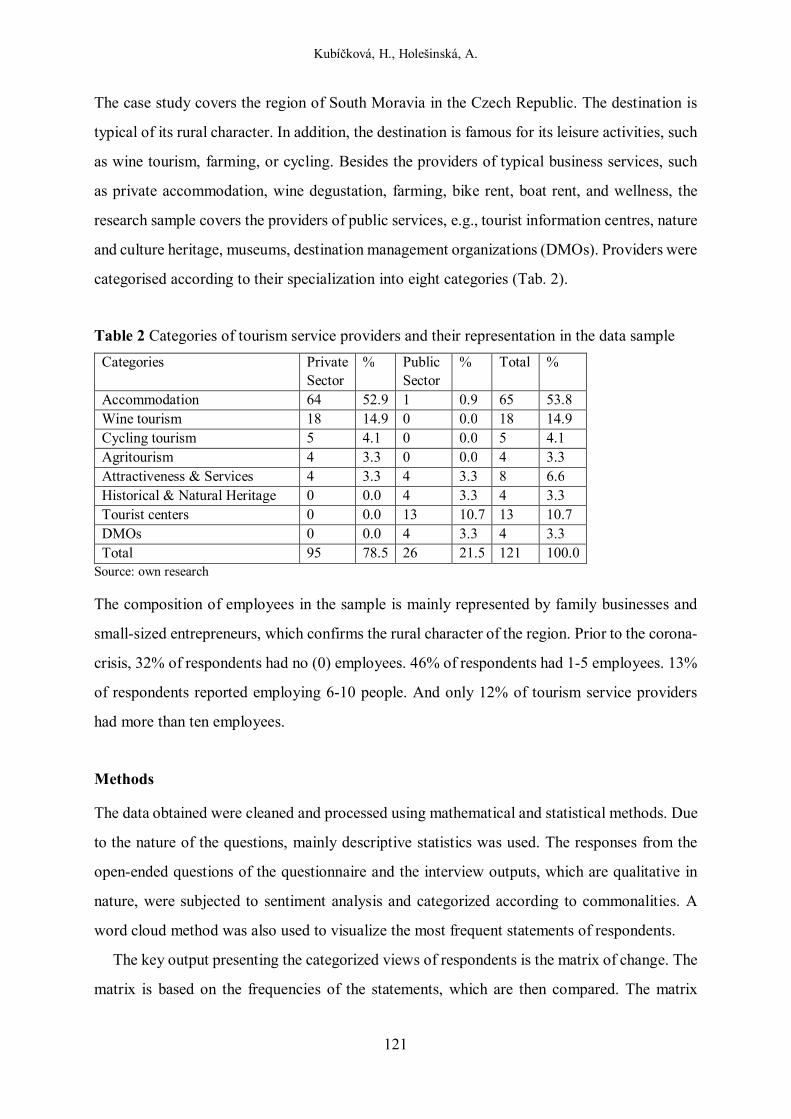
Kubíčková, H., Holešinská, A.
121
The case study covers the region of South Moravia in the Czech Republic. The destination is
typical of its rural character. In addition, the destination is famous for its leisure activities, such
as wine tourism, farming, or cycling. Besides the providers of typical business services, such
as private accommodation, wine degustation, farming, bike rent, boat rent, and wellness, the
research sample covers the providers of public services, e.g., tourist information centres, nature
and culture heritage, museums, destination management organizations (DMOs). Providers were
categorised according to their specialization into eight categories (Tab. 2).
Table 2 Categories of tourism service providers and their representation in the data sample
Categories Private Sector
% Public Sector
% Total %
Accommodation 64 52.9 1 0.9 65 53.8 Wine tourism 18 14.9 0 0.0 18 14.9 Cycling tourism 5 4.1 0 0.0 5 4.1 Agritourism 4 3.3 0 0.0 4 3.3 Attractiveness & Services 4 3.3 4 3.3 8 6.6 Historical & Natural Heritage 0 0.0 4 3.3 4 3.3 Tourist centers 0 0.0 13 10.7 13 10.7 DMOs 0 0.0 4 3.3 4 3.3 Total 95 78.5 26 21.5 121 100.0
Source: own research
The composition of employees in the sample is mainly represented by family businesses and
small-sized entrepreneurs, which confirms the rural character of the region. Prior to the corona-
crisis, 32% of respondents had no (0) employees. 46% of respondents had 1-5 employees. 13%
of respondents reported employing 6-10 people. And only 12% of tourism service providers
had more than ten employees.
Methods
The data obtained were cleaned and processed using mathematical and statistical methods. Due
to the nature of the questions, mainly descriptive statistics was used. The responses from the
open-ended questions of the questionnaire and the interview outputs, which are qualitative in
nature, were subjected to sentiment analysis and categorized according to commonalities. A
word cloud method was also used to visualize the most frequent statements of respondents.
The key output presenting the categorized views of respondents is the matrix of change. The
matrix is based on the frequencies of the statements, which are then compared. The matrix
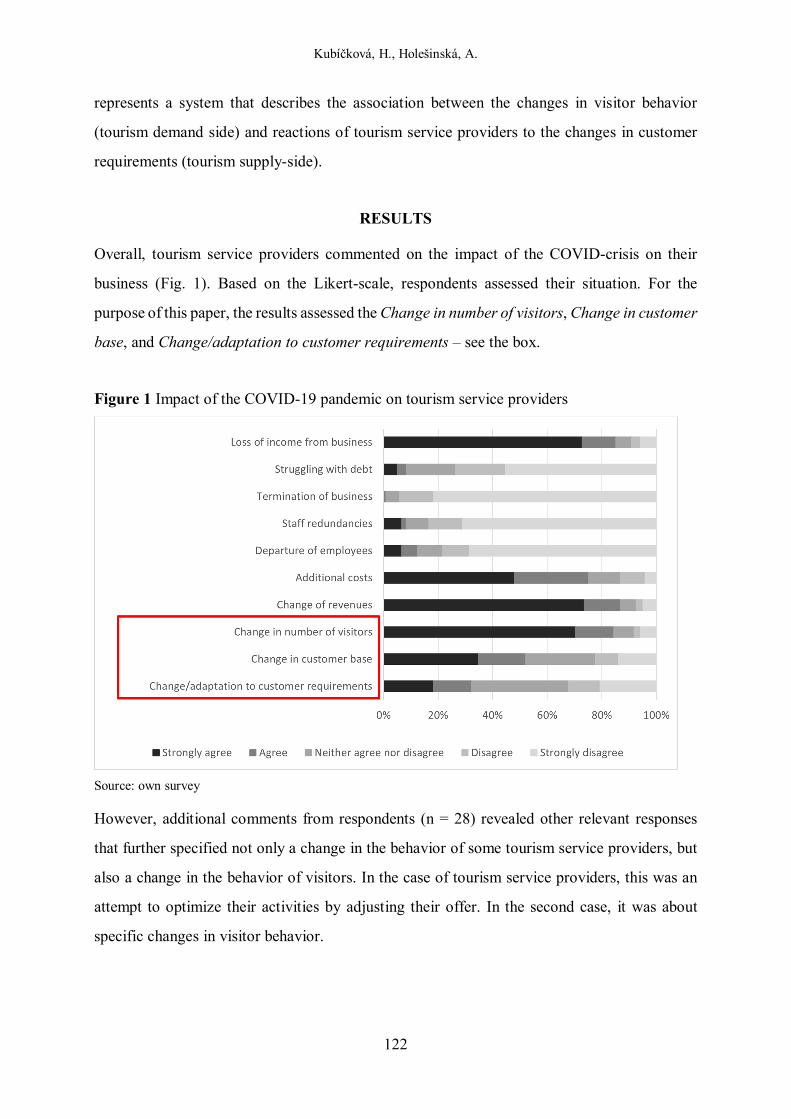
Kubíčková, H., Holešinská, A.
122
represents a system that describes the association between the changes in visitor behavior
(tourism demand side) and reactions of tourism service providers to the changes in customer
requirements (tourism supply-side).
RESULTS
Overall, tourism service providers commented on the impact of the COVID-crisis on their
business (Fig. 1). Based on the Likert-scale, respondents assessed their situation. For the
purpose of this paper, the results assessed the Change in number of visitors, Change in customer
base, and Change/adaptation to customer requirements – see the box.
Figure 1 Impact of the COVID-19 pandemic on tourism service providers
Source: own survey
However, additional comments from respondents (n = 28) revealed other relevant responses
that further specified not only a change in the behavior of some tourism service providers, but
also a change in the behavior of visitors. In the case of tourism service providers, this was an
attempt to optimize their activities by adjusting their offer. In the second case, it was about
specific changes in visitor behavior.
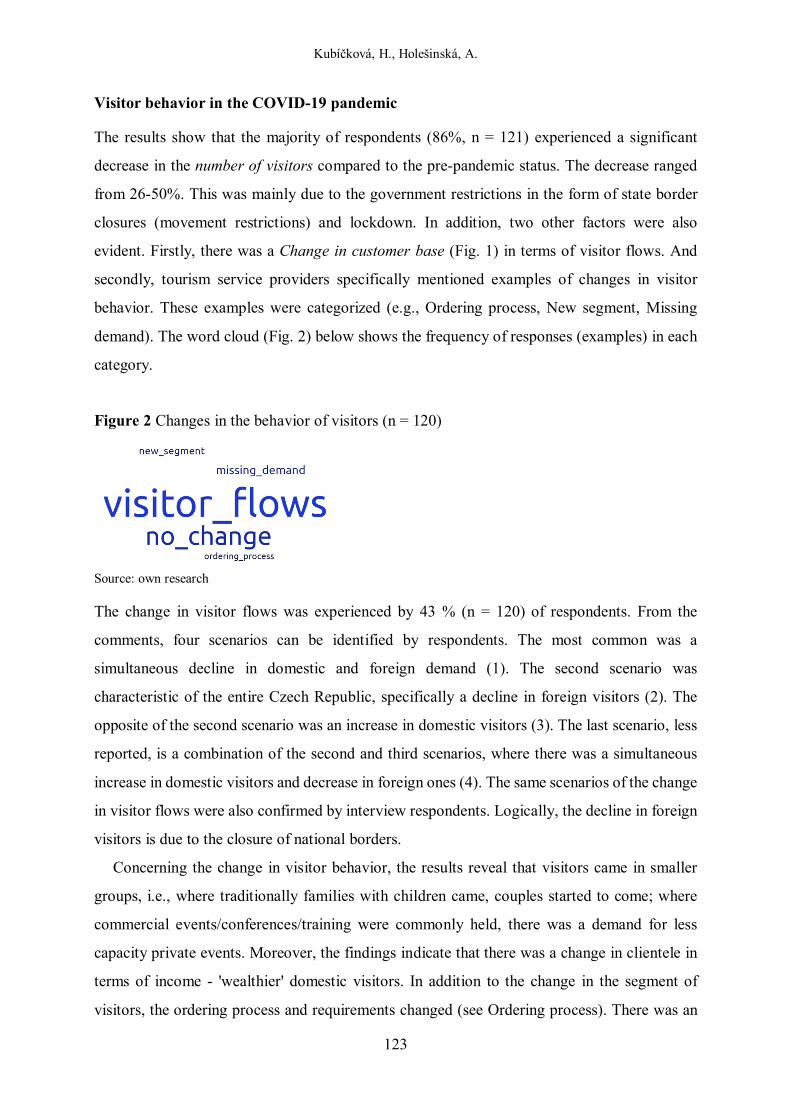
Kubíčková, H., Holešinská, A.
123
Visitor behavior in the COVID-19 pandemic
The results show that the majority of respondents (86%, n = 121) experienced a significant
decrease in the number of visitors compared to the pre-pandemic status. The decrease ranged
from 26-50%. This was mainly due to the government restrictions in the form of state border
closures (movement restrictions) and lockdown. In addition, two other factors were also
evident. Firstly, there was a Change in customer base (Fig. 1) in terms of visitor flows. And
secondly, tourism service providers specifically mentioned examples of changes in visitor
behavior. These examples were categorized (e.g., Ordering process, New segment, Missing
demand). The word cloud (Fig. 2) below shows the frequency of responses (examples) in each
category.
Figure 2 Changes in the behavior of visitors (n = 120)
Source: own research
The change in visitor flows was experienced by 43 % (n = 120) of respondents. From the
comments, four scenarios can be identified by respondents. The most common was a
simultaneous decline in domestic and foreign demand (1). The second scenario was
characteristic of the entire Czech Republic, specifically a decline in foreign visitors (2). The
opposite of the second scenario was an increase in domestic visitors (3). The last scenario, less
reported, is a combination of the second and third scenarios, where there was a simultaneous
increase in domestic visitors and decrease in foreign ones (4). The same scenarios of the change
in visitor flows were also confirmed by interview respondents. Logically, the decline in foreign
visitors is due to the closure of national borders.
Concerning the change in visitor behavior, the results reveal that visitors came in smaller
groups, i.e., where traditionally families with children came, couples started to come; where
commercial events/conferences/training were commonly held, there was a demand for less
capacity private events. Moreover, the findings indicate that there was a change in clientele in
terms of income - 'wealthier' domestic visitors. In addition to the change in the segment of
visitors, the ordering process and requirements changed (see Ordering process). There was an
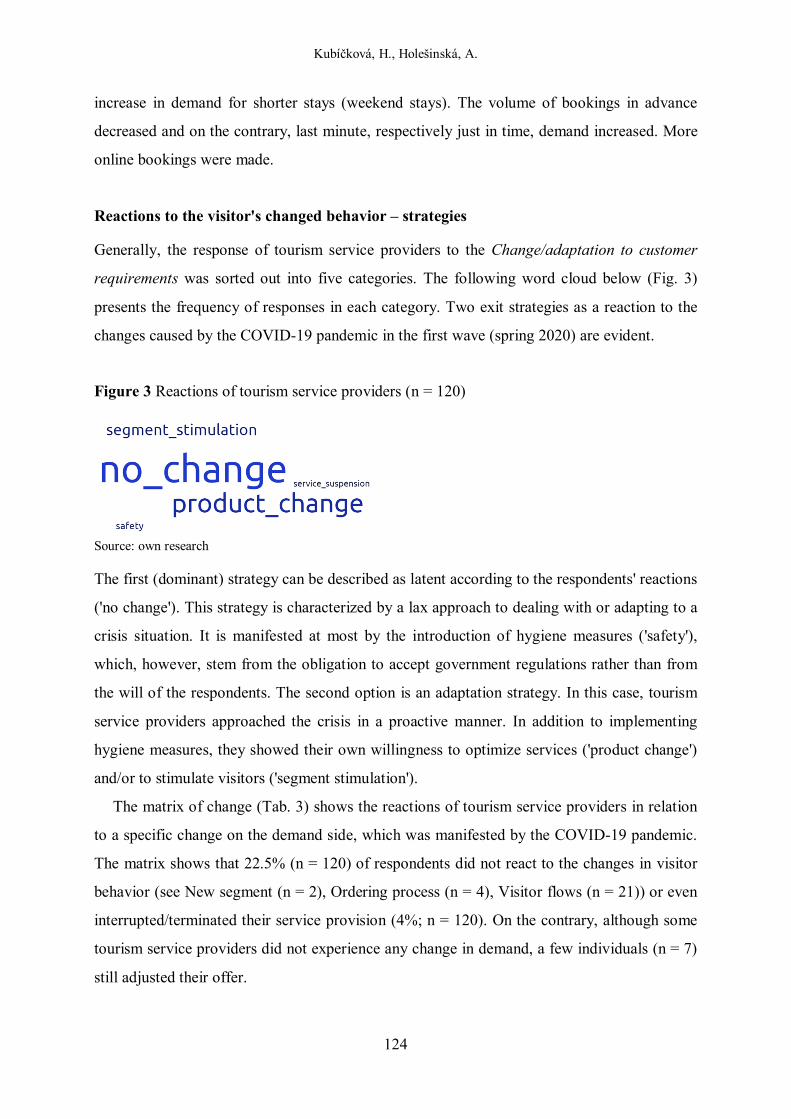
Kubíčková, H., Holešinská, A.
124
increase in demand for shorter stays (weekend stays). The volume of bookings in advance
decreased and on the contrary, last minute, respectively just in time, demand increased. More
online bookings were made.
Reactions to the visitor's changed behavior – strategies
Generally, the response of tourism service providers to the Change/adaptation to customer
requirements was sorted out into five categories. The following word cloud below (Fig. 3)
presents the frequency of responses in each category. Two exit strategies as a reaction to the
changes caused by the COVID-19 pandemic in the first wave (spring 2020) are evident.
Figure 3 Reactions of tourism service providers (n = 120)
Source: own research
The first (dominant) strategy can be described as latent according to the respondents' reactions
('no change'). This strategy is characterized by a lax approach to dealing with or adapting to a
crisis situation. It is manifested at most by the introduction of hygiene measures ('safety'),
which, however, stem from the obligation to accept government regulations rather than from
the will of the respondents. The second option is an adaptation strategy. In this case, tourism
service providers approached the crisis in a proactive manner. In addition to implementing
hygiene measures, they showed their own willingness to optimize services ('product change')
and/or to stimulate visitors ('segment stimulation').
The matrix of change (Tab. 3) shows the reactions of tourism service providers in relation
to a specific change on the demand side, which was manifested by the COVID-19 pandemic.
The matrix shows that 22.5% (n = 120) of respondents did not react to the changes in visitor
behavior (see New segment (n = 2), Ordering process (n = 4), Visitor flows (n = 21)) or even
interrupted/terminated their service provision (4%; n = 120). On the contrary, although some
tourism service providers did not experience any change in demand, a few individuals (n = 7)
still adjusted their offer.
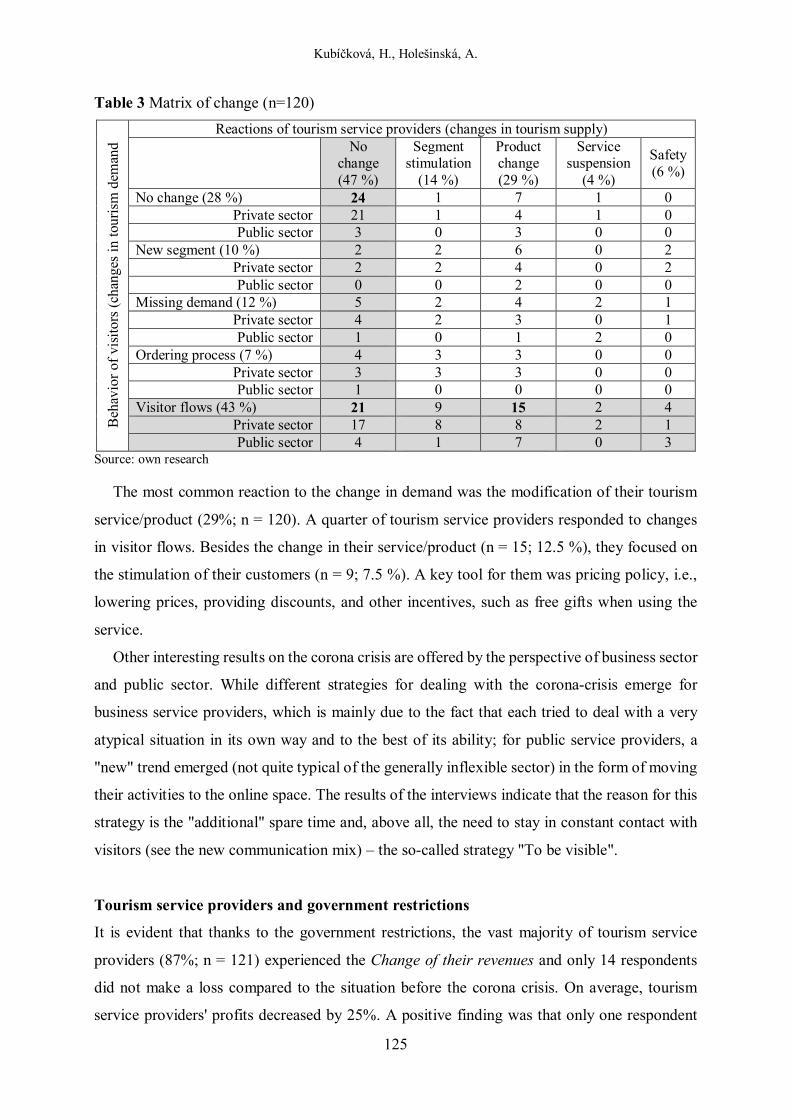
Kubíčková, H., Holešinská, A.
125
Table 3 Matrix of change (n=120) B
ehav
ior
of v
isit
ors
(cha
nges
in to
uris
m d
eman
d Reactions of tourism service providers (changes in tourism supply)
No change (47 %)
Segment stimulation
(14 %)
Product change (29 %)
Service suspension
(4 %)
Safety (6 %)
No change (28 %) 24 1 7 1 0 Private sector 21 1 4 1 0 Public sector 3 0 3 0 0
New segment (10 %) 2 2 6 0 2 Private sector 2 2 4 0 2 Public sector 0 0 2 0 0
Missing demand (12 %) 5 2 4 2 1 Private sector 4 2 3 0 1 Public sector 1 0 1 2 0
Ordering process (7 %) 4 3 3 0 0 Private sector 3 3 3 0 0 Public sector 1 0 0 0 0
Visitor flows (43 %) 21 9 15 2 4 Private sector 17 8 8 2 1 Public sector 4 1 7 0 3
Source: own research
The most common reaction to the change in demand was the modification of their tourism
service/product (29%; n = 120). A quarter of tourism service providers responded to changes
in visitor flows. Besides the change in their service/product (n = 15; 12.5 %), they focused on
the stimulation of their customers (n = 9; 7.5 %). A key tool for them was pricing policy, i.e.,
lowering prices, providing discounts, and other incentives, such as free gifts when using the
service.
Other interesting results on the corona crisis are offered by the perspective of business sector
and public sector. While different strategies for dealing with the corona-crisis emerge for
business service providers, which is mainly due to the fact that each tried to deal with a very
atypical situation in its own way and to the best of its ability; for public service providers, a
"new" trend emerged (not quite typical of the generally inflexible sector) in the form of moving
their activities to the online space. The results of the interviews indicate that the reason for this
strategy is the "additional" spare time and, above all, the need to stay in constant contact with
visitors (see the new communication mix) – the so-called strategy "To be visible".
Tourism service providers and government restrictions
It is evident that thanks to the government restrictions, the vast majority of tourism service
providers (87%; n = 121) experienced the Change of their revenues and only 14 respondents
did not make a loss compared to the situation before the corona crisis. On average, tourism
service providers' profits decreased by 25%. A positive finding was that only one respondent
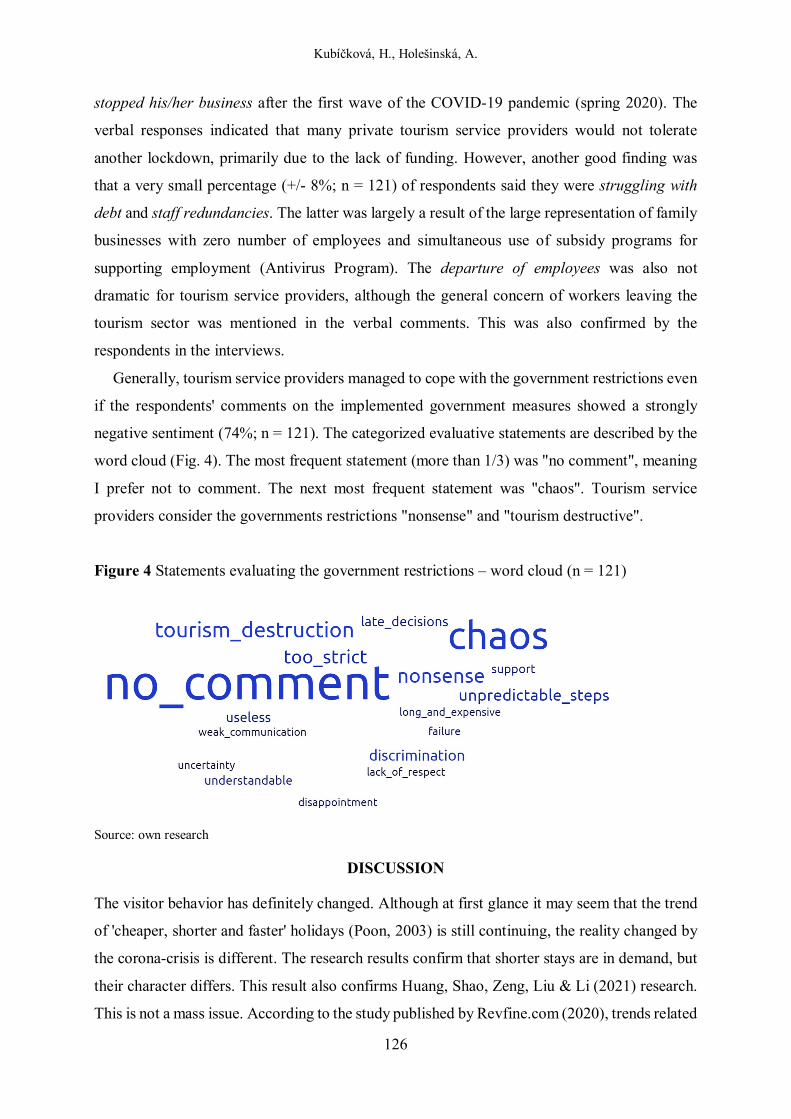
Kubíčková, H., Holešinská, A.
126
stopped his/her business after the first wave of the COVID-19 pandemic (spring 2020). The
verbal responses indicated that many private tourism service providers would not tolerate
another lockdown, primarily due to the lack of funding. However, another good finding was
that a very small percentage (+/- 8%; n = 121) of respondents said they were struggling with
debt and staff redundancies. The latter was largely a result of the large representation of family
businesses with zero number of employees and simultaneous use of subsidy programs for
supporting employment (Antivirus Program). The departure of employees was also not
dramatic for tourism service providers, although the general concern of workers leaving the
tourism sector was mentioned in the verbal comments. This was also confirmed by the
respondents in the interviews.
Generally, tourism service providers managed to cope with the government restrictions even
if the respondents' comments on the implemented government measures showed a strongly
negative sentiment (74%; n = 121). The categorized evaluative statements are described by the
word cloud (Fig. 4). The most frequent statement (more than 1/3) was "no comment", meaning
I prefer not to comment. The next most frequent statement was "chaos". Tourism service
providers consider the governments restrictions "nonsense" and "tourism destructive".
Figure 4 Statements evaluating the government restrictions – word cloud (n = 121)
Source: own research
DISCUSSION
The visitor behavior has definitely changed. Although at first glance it may seem that the trend
of 'cheaper, shorter and faster' holidays (Poon, 2003) is still continuing, the reality changed by
the corona-crisis is different. The research results confirm that shorter stays are in demand, but
their character differs. This result also confirms Huang, Shao, Zeng, Liu & Li (2021) research.
This is not a mass issue. According to the study published by Revfine.com (2020), trends related
Kubíčková, H., Holešinská, A.
127
to the COVID-19 pandemic include, for example, safety and hygiene standards, emphasis on
leisure (fewer business trips in comparison with leisure travelling), shift from international to
local, and technology in tourism (contactless payments or booking via the Internet). All these
mentioned trends independently confirm the results of this research. In the case study tourism
service providers emphasized the change in the segment (the decrease of commercial events in
favor of leisure clientele), as well as they proved the shift from international to local
destinations. In addition, they realized the importance of information and communication
technologies in tourism. Further mentioned trends in Revfine.com study cannot be verified
because they are common for large (international) enterprises.
The reactions of respondents (tourism service providers) confirm that the COVID-19
pandemic represents an exogenous shock (Keller, 2020). In such a situation, support from the
government is essential (Hall, Scott, & Gössling, 2021), as proved by a study from Macao
(McCarney, 2020). However, on the part of tourism service providers, this requires the adoption
of the necessary strategy to help to overcome the crisis. Stressful situations bring with them
pressure for greater creativity and new solutions, as confirmed by the respondents' comments.
In the context of the impact of the corona crisis on the development of rural tourism, all is not
as black as it seems. Richard (2020) highlights the pitfalls of large-capacity accommodation
establishments that are based on socializing. In times of the pandemic, this poses a problem
because the key government restriction to avoid the spread of coronavirus disease is done by
the limitation of social contacts. In this context service providers in rural tourism have a certain
"advantage".
CONCLUSION
This study provides the evidence of how tourism service providers in rural tourism managed to
cope with the crisis situation that was caused by the COVID-19 pandemic. The crisis came
unexpectedly and to adapt to it requires them considerable effort. The findings indicate that in
rural tourism there are especially small-sized entrepreneurs and family businesses that are very
sensitive to market changes. It is obvious that tourism service providers had to face the most
complicated times in their lives. The findings of the case study in the South Moravia region
revealed that at the beginning of the COVID-19 pandemic (spring 2020) tourism service
providers had reacted in compliance with the government restrictions and at the same time they
did very impulsively their best to survive the tough situation (without any previous experience).
Kubíčková, H., Holešinská, A.
128
In their effort to cope with the crisis of the COVID-19 pandemic, they generally invented
two types of exit strategies. The first one is the latent strategy with no or a little action, i.e. do
nothing "("no change""); limit the provided service "("service suspension""); or fulfil the
government restrictions "("safety""). On the contrary, the second strategy is proactive with a
willingness to adapt to the situation (therefore adaptation strategy). Tourism service providers
made an effort to optimize their service or modify it according to the customers'' requirements
"("product change""). Moreover, as a part of their strategy, they intensively stimulated their
customers "("segment stimulation"") and generally, they had to adapt their activities to the new
patterns of visitor behavior (e.g., ordering process, communication mix in marketing).
Especially the public service providers (i.e., DMOs and tourist centers) showed very a flexible
reaction to the 'customers' needs and moved their activities online.
Despite the very negative assessment of government regulations, most tourism service
providers fought for their existence and looked for ways to use this time for new ideas.
Therefore, in the short term they changed/rethought their priorities and set their (adaptation)
strategy on ""swift innovations"".
Acknowledgement
The paper was prepared within the Specific Research Project No. MUNI/A/1399/2020 of Masaryk University, Brno, Czech Republic.
REFERENCES
Arbulú, I., Razumova, M., Rey-Maquieira, J., & Sastre, F. (2021). Can domestic tourism relieve the COVID-19 tourist industry crisis? The case of Spain. Journal of Destination Marketing & Management, 1(20), 100568.
Antušák, E. (2009). Krizový management. Hrozby – krize – příležitosti. Praha: Wolters Kluwer. Cohen, E. (1972). Towards a Sociology of International Tourism. Political Economics, 39(1),
164-182. Fotiadis, A. Polyzos, S., & Huan, T.C. (2021). The good, the bad and the ugly on COVID-19
tourism recovery. Annals of Tourism Research, 87, 103117. Gössling, S., Scott, D., & Hall, C. M., (2021). Pandemics, tourism and global change. A rapid
assessment of COVID-19. Journal of sustainable tourism, 29(1), 1-20. Hall, C. M., Scott, D., & Gössling, S., (2020). Pandemics, transformations and tourism: be
careful what you wish for. Tourism Geographies, 22(3), 577-598. Hao, Y., Bai, H., & Sun, S. (2021). How does COVID-19 affect tourism in terms of people' 's
willingness to travel? Empirical evidence from China. Tourism Review, 76(4), 892-909. Holešinská, A., & Záboj, M. (2021). COVID-19, government’s decisions and impacts on
tourism businesses. In V. Klímová & V. Žítek (Eds.), XXIV. mezinárodní kolokvium o regionálních vědách (230-236). Brno: Masarykova univerzita.
Huang, S., Shao, Y., Zeng, Y., Liu, X., & Li, Z. (2021). Impacts of COVID-19 on Chinese nationals' tourism preferences. Tourism Management Perspectives, 40 (in progress).
Kubíčková, H., Holešinská, A.
129
Keller, P., (2020). Corona pandemic as exogenous shock for international tourism: a context analysis. In F. Burini (Ed.), Tourism facing a pandemic: from crisis to recovery (pp. 15-24). Bergamo: Universita degli Studi di Bergamo.
Kock, F., Nørfelt, A., Josiassen, A., Assaf, A. G., & Tsionas, M. G., (2020). Understanding the COVID-19 tourist psyche: The Evolutionary Tourism Paradigm. Annals of Tourism Research, 85(Nov.), 103053.
Plog, S. C. (1974). Why destination areas rise and fall in popularity. Cornell Hotel and Restaurant Quarterly, February, 55-58.
Poon, A. (2003). Competitive strategies for a new tourism. In C. Cooper (Ed.), Classic Reviews in Tourism (pp. 131-142). Clevedon: Channel View.
Revfine.com (2020). Discover The Latest Trends in The Tourism Industry. [online report]. Retrieved from https://www.revfine.com/tourism-trends/.
Richards, G., (2020). The impact of crisis on travel: Covid-19 and other shocks. In F. Burini (Ed.), Tourism facing a pandemic: from crisis to recovery (pp. 25-31). Bergamo: Universita degli Studi di Bergamo.
Tajeddini, K., Ratten, V., & Merkle, T. (2019). Tourism, Hospitality and Digital Transformation: Strategic Management Aspects. New York: Routledge.
Škare, M., Soriano, D. R., & Porada-Rochoń, M., (2021). Impact of COVID-19 on the travel and tourism industry. Technological Forcasting & Social Change, 163(February), 120469.
Urry, J. (1990). The Tourist Gaze: Leisure and Travel in Contemporary Society. London: SAGE.
WYSE Travel Confederation (2020). COVID-19 travel business impact series. March 2020. [online report]. Retrieved from https://www.wysetc.org/2020/03/covid-19-travel-business-impact-series-part-1/.
DETUROPE – THE CENTRAL EUROPEAN JOURNAL OF REGIONAL DEVELOPMENT AND TOURISM Vol. 13 Issue 3 2021 ISSN 1821-2506
130
AUSTRALIAN PUBLIC UNIVERSITIES VICE-CHANCELLOR
SALARIES AND WORKFORCE CASUALISATION: ETHICAL
TENSION?
Roberto BERGAMI
University of South Bohemia, Faculty of Economics, Department of Trade, Tourism and Language, Studentská 13, 370 05 České Budějovice, Czech Republic, email: [email protected]
Cite this article: Bergami, R. (2021). Australian Public Universities Vice-Chancellor Salaries and Workforce Casualisation: Ethical Tension? Deturope. 13(3), 130-141.
Abstract
Australian public universities’ Vice-Chancellors (VC) are among the highest paid in the world, with an individual average yearly income in excess of one million Australian Dollars, or about twice the annual income of the Prime Minister. Although universities are significantly government funded, they individually set their VC remuneration. Recent estimates put VC salaries at least 10 time that of an average lecturer’ income. The rationale given for such high salaries is that VC perform roles that are synonymous with those of free enterprise CEOS and, therefore, they should be remunerated accordingly. However, universities are neither free enterprises, nor do they operate in a ‘free-market’, as student fees are controlled by the government and universities cannot simply act as an entrepreneur and manipulate prices. As government funding continues to shrink, universities have reduced the permanent academic workforce, replacing this with casual academics, employed on precarious contracts that provide no job security, and raise questions over the long-term quality of education. This paper highlights some of the ethical dilemmas of this environment and offers suggestions for changing the status quo. Keywords: Australian universities, academic workforce casualization, vice-chancellor salaries, quality of education.
INTRODUCTION
This paper focuses on the issue of continually increasing Australian universities’ Vice-
Chancellors’ (VC) salaries in an environment of staff reduction to contain costs. Some
background is firstly provided about Australia and its neo-liberal approach to health and
education, before outlining the methodology and providing a brief select literature review. A
comparison of university and private enterprise structures is offered, prior to the discussion on
the fairness of increasing VC salaries and shrinking the university workforce, before offering
ideas for a more equitable VC pay structure and reaching the conclusion.
Australia’s population as at 20 September 2020 was 25,693,059 people (Australian Bureau
of Statistics, 2021), with 39 public and four private universities in the nation. In the English-
speaking world, Australia’s education system is highly regarded, and in the context of the
university sector on a global basis, it is commonly accepted that it ranks as the third global
Bergami, R.
131
‘powerhouse’ for international student destinations. Whilst the USA and the UK hold the first
two places, Australia is well ahead of other competitor nations, such as New Zealand and
Canada.
Australia’s relative success in the international university student environment has largely
been attributed to its profile, that encompasses a ‘clean and green’ image, with many natural
wonders and unique flora and fauna, a country that prides itself on freedom of the people and,
therefore, highly democratic and also politically stable. Perhaps the greatest attribute insofar as
international students are concerned is the relatively high safety of the Australian society.
Unlike other nations, such as the USA and some European nations, terrorism is not as
widespread in Australia and mass shootings are a rarity indeed. The safety of the nation, coupled
with its achievements in research and innovation, especially in the health sciences, as well as
its reputation for quality education, assist in painting a ‘positive picture’ that tends to attract
foreign students to study onshore. The focus on foreign students is an important factor for
Australian universities, as discussed later in this paper.
Australia’s university landscape, in recent decades, has been heavily influenced by the neo-
liberal ideology that believes in the mantra of the free market, one that is economically self-
sustaining. Yet, there is a plethora of evidence of free market failures, and I argue the neo-
liberal ideology ignores some of the realities of the world we live in and is not particularly
tolerant of societal and social needs. I am particularly critical of the neo-liberal ideology in two
areas of society: health and education, both of which I regard as fundamental pillars of any
modern civilisation. Although the focus of this paper is on universities, I briefly draw on the
government approach to the health sector as an example of the nature of the neo-liberal
approach.
In the eyes of the neo-liberal I see a common treatment of both health and education – they
are both regarded as ‘expense’ items and almost given the same treatment. Consequently, the
neo-liberal government wants to find solutions to ‘fix’ the problem by, essentially, privatising
it, thereby ‘removing’ the expenditure from the liability side of their ledger. However, this does
not work very well, if at all. As an example, in Australia, attempts have been made to privatise
the health system, at least in part. This has resulted in the federal government providing tax-
payer funded subsidies to private health providers, to help them survive, as they struggle to
attract fee paying members. A significant proportion of the population still prefers to rely on
the free publicly funded health system, as shown in Fig. 1.
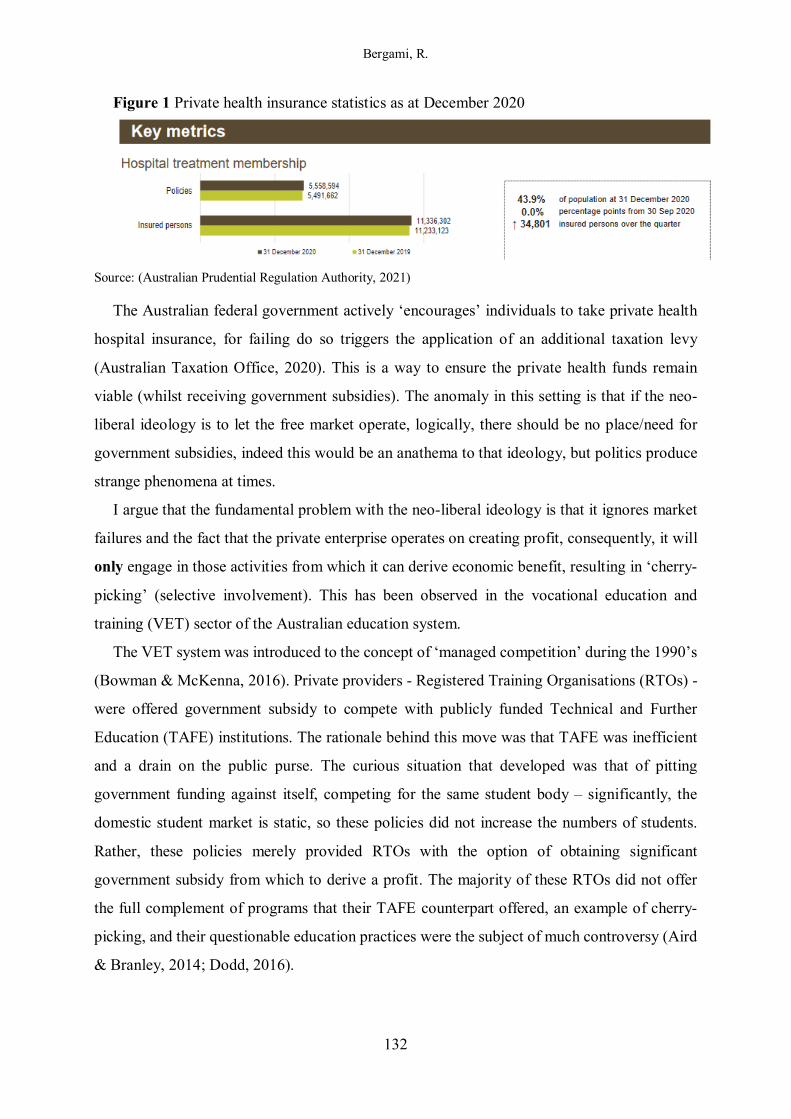
Bergami, R.
132
Figure 1 Private health insurance statistics as at December 2020
Source: (Australian Prudential Regulation Authority, 2021)
The Australian federal government actively ‘encourages’ individuals to take private health
hospital insurance, for failing do so triggers the application of an additional taxation levy
(Australian Taxation Office, 2020). This is a way to ensure the private health funds remain
viable (whilst receiving government subsidies). The anomaly in this setting is that if the neo-
liberal ideology is to let the free market operate, logically, there should be no place/need for
government subsidies, indeed this would be an anathema to that ideology, but politics produce
strange phenomena at times.
I argue that the fundamental problem with the neo-liberal ideology is that it ignores market
failures and the fact that the private enterprise operates on creating profit, consequently, it will
only engage in those activities from which it can derive economic benefit, resulting in ‘cherry-
picking’ (selective involvement). This has been observed in the vocational education and
training (VET) sector of the Australian education system.
The VET system was introduced to the concept of ‘managed competition’ during the 1990’s
(Bowman & McKenna, 2016). Private providers - Registered Training Organisations (RTOs) -
were offered government subsidy to compete with publicly funded Technical and Further
Education (TAFE) institutions. The rationale behind this move was that TAFE was inefficient
and a drain on the public purse. The curious situation that developed was that of pitting
government funding against itself, competing for the same student body – significantly, the
domestic student market is static, so these policies did not increase the numbers of students.
Rather, these policies merely provided RTOs with the option of obtaining significant
government subsidy from which to derive a profit. The majority of these RTOs did not offer
the full complement of programs that their TAFE counterpart offered, an example of cherry-
picking, and their questionable education practices were the subject of much controversy (Aird
& Branley, 2014; Dodd, 2016).
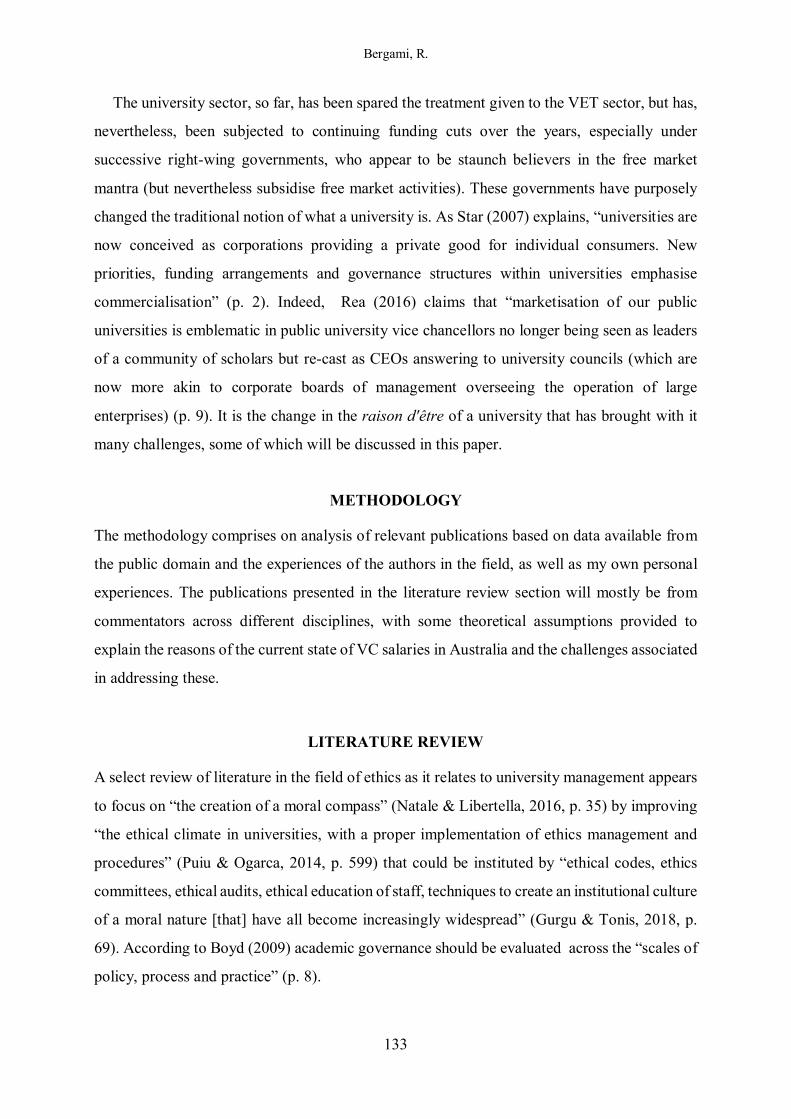
Bergami, R.
133
The university sector, so far, has been spared the treatment given to the VET sector, but has,
nevertheless, been subjected to continuing funding cuts over the years, especially under
successive right-wing governments, who appear to be staunch believers in the free market
mantra (but nevertheless subsidise free market activities). These governments have purposely
changed the traditional notion of what a university is. As Star (2007) explains, “universities are
now conceived as corporations providing a private good for individual consumers. New
priorities, funding arrangements and governance structures within universities emphasise
commercialisation” (p. 2). Indeed, Rea (2016) claims that “marketisation of our public
universities is emblematic in public university vice chancellors no longer being seen as leaders
of a community of scholars but re-cast as CEOs answering to university councils (which are
now more akin to corporate boards of management overseeing the operation of large
enterprises) (p. 9). It is the change in the raison d'être of a university that has brought with it
many challenges, some of which will be discussed in this paper.
METHODOLOGY
The methodology comprises on analysis of relevant publications based on data available from
the public domain and the experiences of the authors in the field, as well as my own personal
experiences. The publications presented in the literature review section will mostly be from
commentators across different disciplines, with some theoretical assumptions provided to
explain the reasons of the current state of VC salaries in Australia and the challenges associated
in addressing these.
LITERATURE REVIEW
A select review of literature in the field of ethics as it relates to university management appears
to focus on “the creation of a moral compass” (Natale & Libertella, 2016, p. 35) by improving
“the ethical climate in universities, with a proper implementation of ethics management and
procedures” (Puiu & Ogarca, 2014, p. 599) that could be instituted by “ethical codes, ethics
committees, ethical audits, ethical education of staff, techniques to create an institutional culture
of a moral nature [that] have all become increasingly widespread” (Gurgu & Tonis, 2018, p.
69). According to Boyd (2009) academic governance should be evaluated across the “scales of
policy, process and practice” (p. 8).
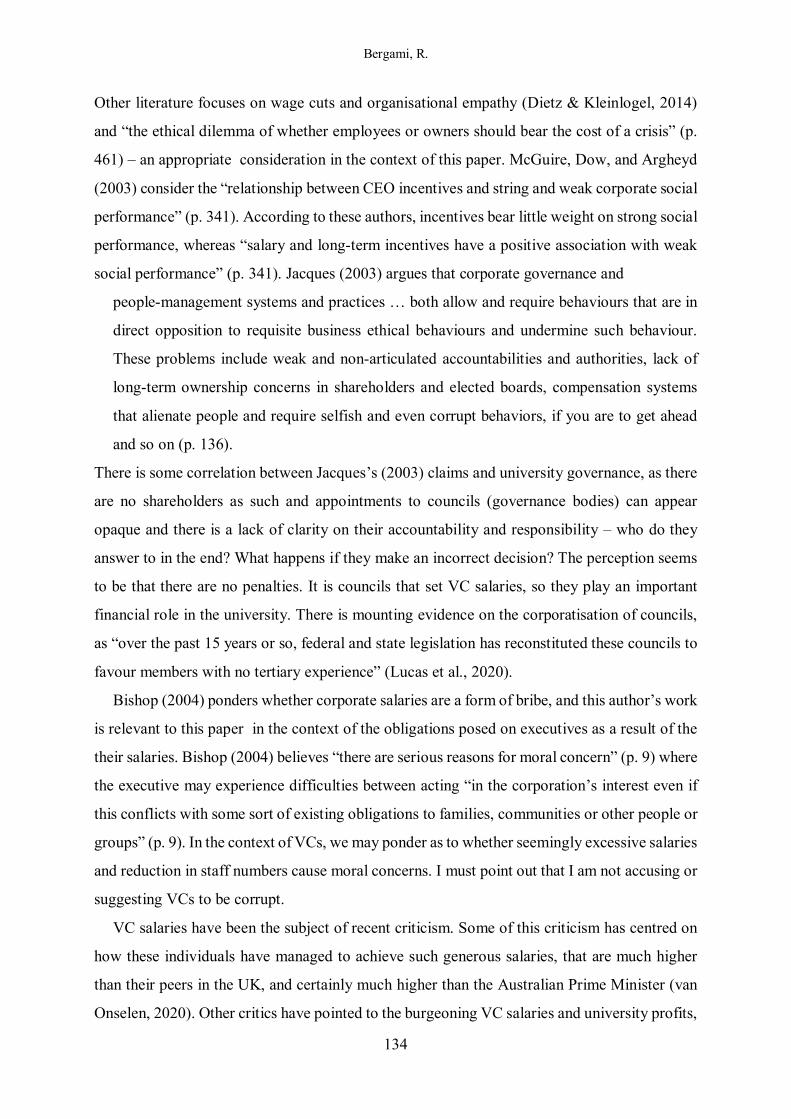
Bergami, R.
134
Other literature focuses on wage cuts and organisational empathy (Dietz & Kleinlogel, 2014)
and “the ethical dilemma of whether employees or owners should bear the cost of a crisis” (p.
461) – an appropriate consideration in the context of this paper. McGuire, Dow, and Argheyd
(2003) consider the “relationship between CEO incentives and string and weak corporate social
performance” (p. 341). According to these authors, incentives bear little weight on strong social
performance, whereas “salary and long-term incentives have a positive association with weak
social performance” (p. 341). Jacques (2003) argues that corporate governance and
people-management systems and practices … both allow and require behaviours that are in
direct opposition to requisite business ethical behaviours and undermine such behaviour.
These problems include weak and non-articulated accountabilities and authorities, lack of
long-term ownership concerns in shareholders and elected boards, compensation systems
that alienate people and require selfish and even corrupt behaviors, if you are to get ahead
and so on (p. 136).
There is some correlation between Jacques’s (2003) claims and university governance, as there
are no shareholders as such and appointments to councils (governance bodies) can appear
opaque and there is a lack of clarity on their accountability and responsibility – who do they
answer to in the end? What happens if they make an incorrect decision? The perception seems
to be that there are no penalties. It is councils that set VC salaries, so they play an important
financial role in the university. There is mounting evidence on the corporatisation of councils,
as “over the past 15 years or so, federal and state legislation has reconstituted these councils to
favour members with no tertiary experience” (Lucas et al., 2020).
Bishop (2004) ponders whether corporate salaries are a form of bribe, and this author’s work
is relevant to this paper in the context of the obligations posed on executives as a result of the
their salaries. Bishop (2004) believes “there are serious reasons for moral concern” (p. 9) where
the executive may experience difficulties between acting “in the corporation’s interest even if
this conflicts with some sort of existing obligations to families, communities or other people or
groups” (p. 9). In the context of VCs, we may ponder as to whether seemingly excessive salaries
and reduction in staff numbers cause moral concerns. I must point out that I am not accusing or
suggesting VCs to be corrupt.
VC salaries have been the subject of recent criticism. Some of this criticism has centred on
how these individuals have managed to achieve such generous salaries, that are much higher
than their peers in the UK, and certainly much higher than the Australian Prime Minister (van
Onselen, 2020). Other critics have pointed to the burgeoning VC salaries and university profits,
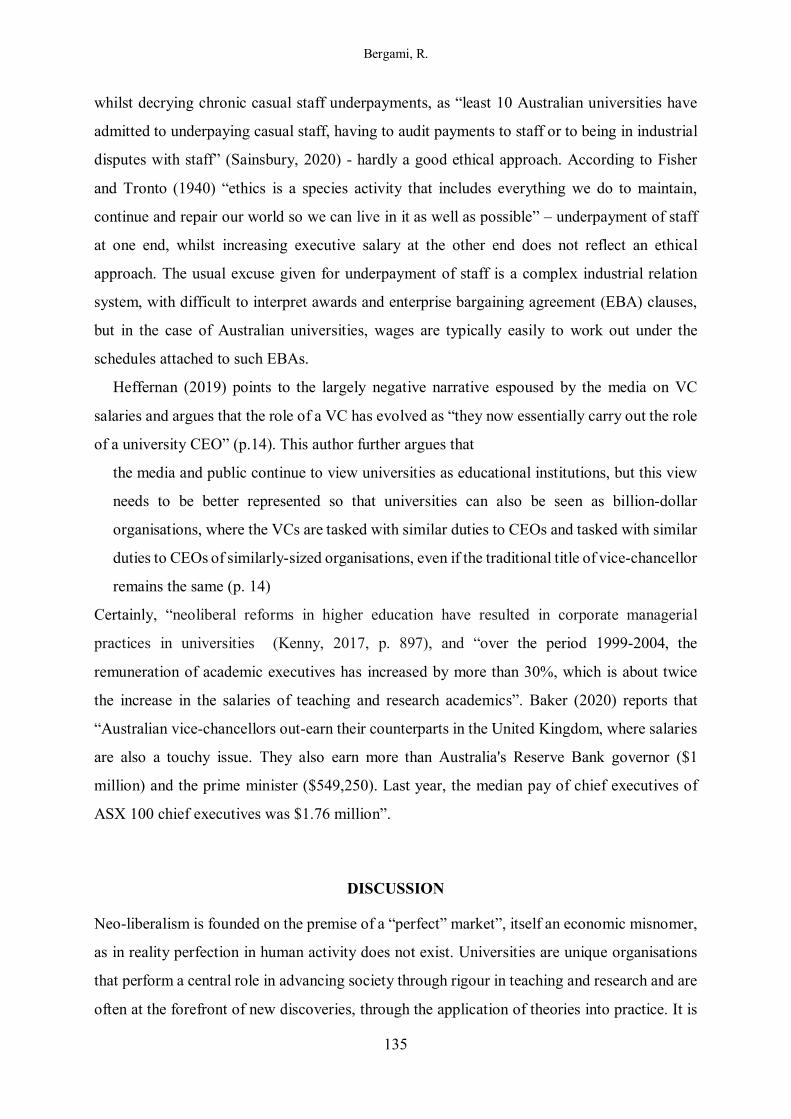
Bergami, R.
135
whilst decrying chronic casual staff underpayments, as “least 10 Australian universities have
admitted to underpaying casual staff, having to audit payments to staff or to being in industrial
disputes with staff” (Sainsbury, 2020) - hardly a good ethical approach. According to Fisher
and Tronto (1940) “ethics is a species activity that includes everything we do to maintain,
continue and repair our world so we can live in it as well as possible” – underpayment of staff
at one end, whilst increasing executive salary at the other end does not reflect an ethical
approach. The usual excuse given for underpayment of staff is a complex industrial relation
system, with difficult to interpret awards and enterprise bargaining agreement (EBA) clauses,
but in the case of Australian universities, wages are typically easily to work out under the
schedules attached to such EBAs.
Heffernan (2019) points to the largely negative narrative espoused by the media on VC
salaries and argues that the role of a VC has evolved as “they now essentially carry out the role
of a university CEO” (p.14). This author further argues that
the media and public continue to view universities as educational institutions, but this view
needs to be better represented so that universities can also be seen as billion-dollar
organisations, where the VCs are tasked with similar duties to CEOs and tasked with similar
duties to CEOs of similarly-sized organisations, even if the traditional title of vice-chancellor
remains the same (p. 14)
Certainly, “neoliberal reforms in higher education have resulted in corporate managerial
practices in universities (Kenny, 2017, p. 897), and “over the period 1999-2004, the
remuneration of academic executives has increased by more than 30%, which is about twice
the increase in the salaries of teaching and research academics”. Baker (2020) reports that
“Australian vice-chancellors out-earn their counterparts in the United Kingdom, where salaries
are also a touchy issue. They also earn more than Australia's Reserve Bank governor ($1
million) and the prime minister ($549,250). Last year, the median pay of chief executives of
ASX 100 chief executives was $1.76 million”.
DISCUSSION
Neo-liberalism is founded on the premise of a “perfect” market”, itself an economic misnomer,
as in reality perfection in human activity does not exist. Universities are unique organisations
that perform a central role in advancing society through rigour in teaching and research and are
often at the forefront of new discoveries, through the application of theories into practice. It is
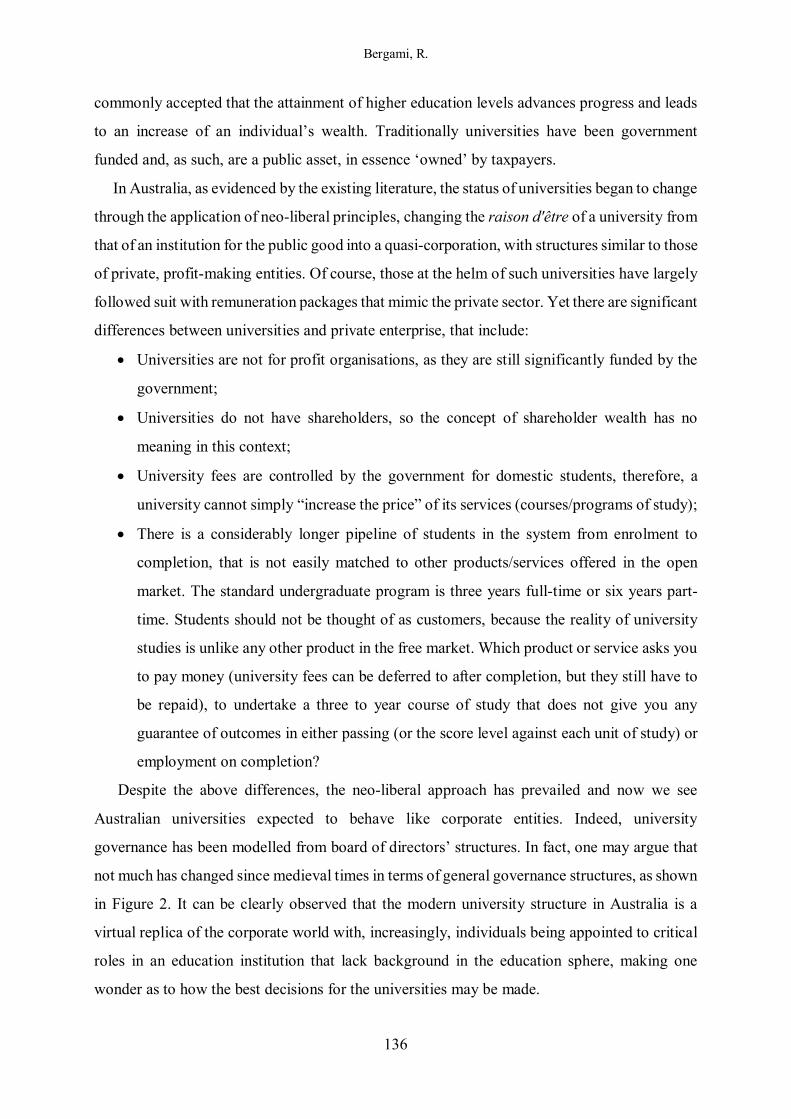
Bergami, R.
136
commonly accepted that the attainment of higher education levels advances progress and leads
to an increase of an individual’s wealth. Traditionally universities have been government
funded and, as such, are a public asset, in essence ‘owned’ by taxpayers.
In Australia, as evidenced by the existing literature, the status of universities began to change
through the application of neo-liberal principles, changing the raison d'être of a university from
that of an institution for the public good into a quasi-corporation, with structures similar to those
of private, profit-making entities. Of course, those at the helm of such universities have largely
followed suit with remuneration packages that mimic the private sector. Yet there are significant
differences between universities and private enterprise, that include:
• Universities are not for profit organisations, as they are still significantly funded by the
government;
• Universities do not have shareholders, so the concept of shareholder wealth has no
meaning in this context;
• University fees are controlled by the government for domestic students, therefore, a
university cannot simply “increase the price” of its services (courses/programs of study);
• There is a considerably longer pipeline of students in the system from enrolment to
completion, that is not easily matched to other products/services offered in the open
market. The standard undergraduate program is three years full-time or six years part-
time. Students should not be thought of as customers, because the reality of university
studies is unlike any other product in the free market. Which product or service asks you
to pay money (university fees can be deferred to after completion, but they still have to
be repaid), to undertake a three to year course of study that does not give you any
guarantee of outcomes in either passing (or the score level against each unit of study) or
employment on completion?
Despite the above differences, the neo-liberal approach has prevailed and now we see
Australian universities expected to behave like corporate entities. Indeed, university
governance has been modelled from board of directors’ structures. In fact, one may argue that
not much has changed since medieval times in terms of general governance structures, as shown
in Figure 2. It can be clearly observed that the modern university structure in Australia is a
virtual replica of the corporate world with, increasingly, individuals being appointed to critical
roles in an education institution that lack background in the education sphere, making one
wonder as to how the best decisions for the universities may be made.
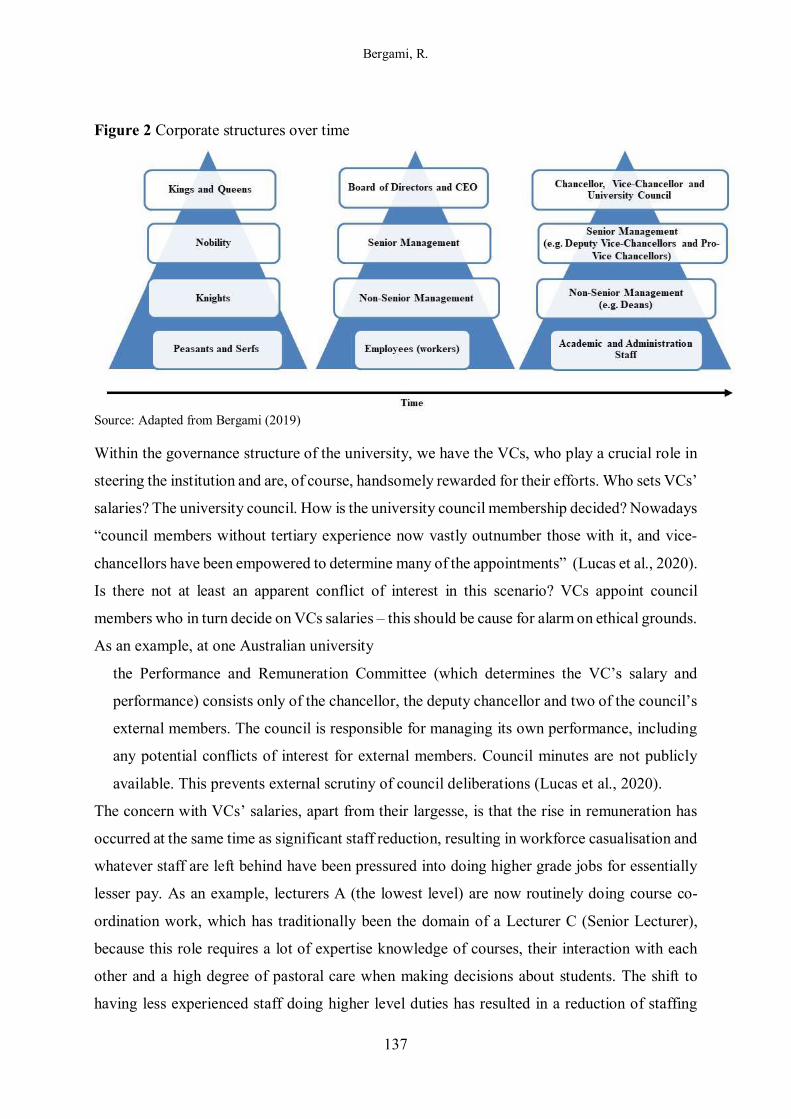
Bergami, R.
137
Figure 2 Corporate structures over time
Source: Adapted from Bergami (2019)
Within the governance structure of the university, we have the VCs, who play a crucial role in
steering the institution and are, of course, handsomely rewarded for their efforts. Who sets VCs’
salaries? The university council. How is the university council membership decided? Nowadays
“council members without tertiary experience now vastly outnumber those with it, and vice-
chancellors have been empowered to determine many of the appointments” (Lucas et al., 2020).
Is there not at least an apparent conflict of interest in this scenario? VCs appoint council
members who in turn decide on VCs salaries – this should be cause for alarm on ethical grounds.
As an example, at one Australian university
the Performance and Remuneration Committee (which determines the VC’s salary and
performance) consists only of the chancellor, the deputy chancellor and two of the council’s
external members. The council is responsible for managing its own performance, including
any potential conflicts of interest for external members. Council minutes are not publicly
available. This prevents external scrutiny of council deliberations (Lucas et al., 2020).
The concern with VCs’ salaries, apart from their largesse, is that the rise in remuneration has
occurred at the same time as significant staff reduction, resulting in workforce casualisation and
whatever staff are left behind have been pressured into doing higher grade jobs for essentially
lesser pay. As an example, lecturers A (the lowest level) are now routinely doing course co-
ordination work, which has traditionally been the domain of a Lecturer C (Senior Lecturer),
because this role requires a lot of expertise knowledge of courses, their interaction with each
other and a high degree of pastoral care when making decisions about students. The shift to
having less experienced staff doing higher level duties has resulted in a reduction of staffing
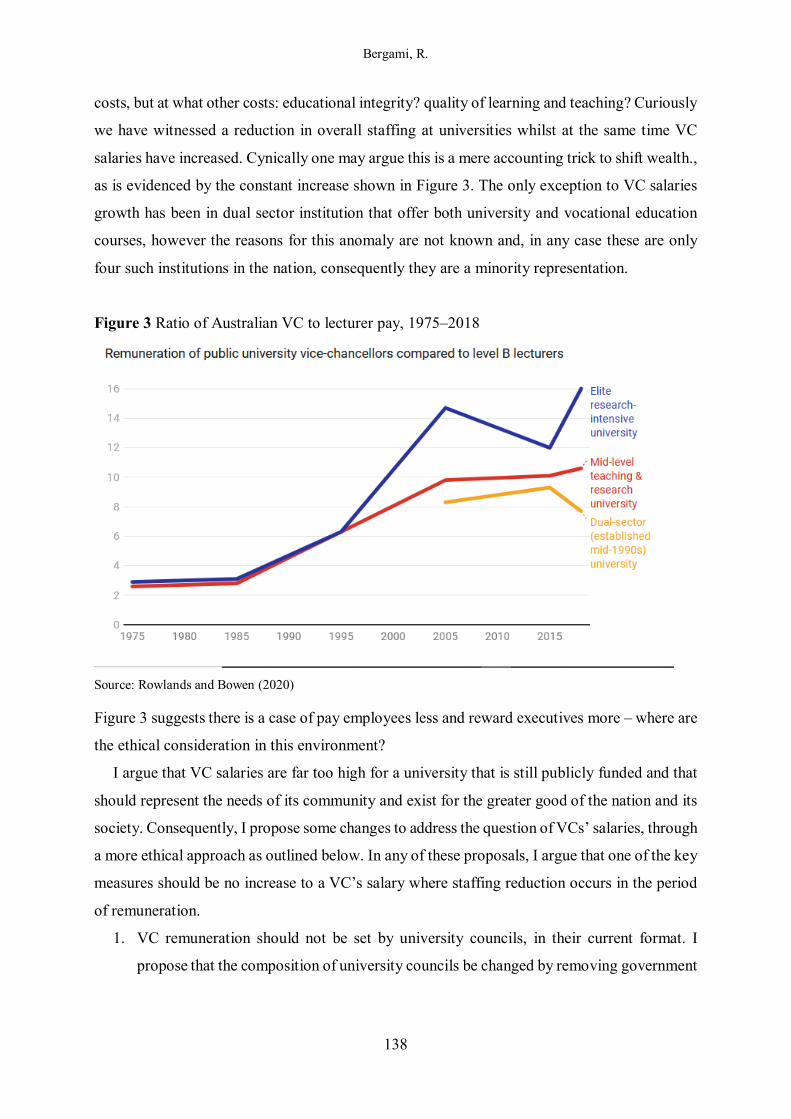
Bergami, R.
138
costs, but at what other costs: educational integrity? quality of learning and teaching? Curiously
we have witnessed a reduction in overall staffing at universities whilst at the same time VC
salaries have increased. Cynically one may argue this is a mere accounting trick to shift wealth.,
as is evidenced by the constant increase shown in Figure 3. The only exception to VC salaries
growth has been in dual sector institution that offer both university and vocational education
courses, however the reasons for this anomaly are not known and, in any case these are only
four such institutions in the nation, consequently they are a minority representation.
Figure 3 Ratio of Australian VC to lecturer pay, 1975–2018
Source: Rowlands and Bowen (2020)
Figure 3 suggests there is a case of pay employees less and reward executives more – where are
the ethical consideration in this environment?
I argue that VC salaries are far too high for a university that is still publicly funded and that
should represent the needs of its community and exist for the greater good of the nation and its
society. Consequently, I propose some changes to address the question of VCs’ salaries, through
a more ethical approach as outlined below. In any of these proposals, I argue that one of the key
measures should be no increase to a VC’s salary where staffing reduction occurs in the period
of remuneration.
1. VC remuneration should not be set by university councils, in their current format. I
propose that the composition of university councils be changed by removing government
Bergami, R.
139
appointees in order to achieve a balanced representation from staff, students, alumni and
the community the university primarily serves; or
2. If councils are not easily changed, then VC remuneration should, at the very least, be
removed from council authority and vested in a separate independent unit within the
university with the same membership criteria identified above; or
3. Setting up a national remuneration body for VC salaries that sets common benchmarks
and targets across the nation leading to a level playing field. This body should have no
government appointments and operate independently. Remuneration should be directly
related to key performance indicators that are fair, transparent and easily measurable.
CONCLUSION
There has been some disquiet in the media and academic literature about the largesse of
Australian universities VCs’ salaries. Most of the comments have been quite negative and
question the validity of such high remuneration, especially since these have occurred in an
environment of staff reduction and concurrent increase in VCs’ salaries.
This paper has sought to highlight some of the ‘disjoints’ of the current Australian university
sector, proposing a number of solutions that should foster a greater ethical environment in
relation to VCs’ remuneration. Change to the current status quo is, and should be, pursued as,
after all, university expenditure should be a matter of concern to the nation, as these institutions
are still predominantly government funded and accountability and transparency should be the
order of the day. The proposals in this paper aim to counteract the neo-liberal approach that has
made the modern Australian university of today.
REFERENCES
Aird, C., & Branley, A. (2014, 6 October). Unregistered training colleges target disadvantaged, sign them up to expensive government loans. ABC News. Retrieved from https://www.abc.net.au/news/2014-10-06/unregistered-training-colleges-target-low-income-earners/5793246
Australian Bureau of Statistics. (2021, 18 March). National, state and territory population. Retrieved from https://www.abs.gov.au/statistics/people/population/national-state-and-territory-population/sep-2020
Australian Prudential Regulation Authority. (2021). Quarterly private health insurance statistics - December 2020. Retrieved from Sydney, NSW, Australia: https://www.apra.gov.au/ sites/default/files/2021-02/Quarterly%20private%20health%20insurance%20statistics% 20December%202020.pdf
Bergami, R.
140
Australian Taxation Office. (2020, 27 October 2020). Medicare levy surcharge. Retrieved from https://www.ato.gov.au/individuals/medicare-and-private-health-insurance/medicare-levy-surcharge/
Baker, J. (2020, 20 November). Are heads of Australian universities worth a million dollars? Retrieved from https://www.smh.com.au/national/are-heads-of-australian-universities-worth-a-million-dollars-20201120-p56gga.html
Bergami, R. (2019). Twenty-First Century Feudalism in Australian Universities. In B. D. & M. C. (Eds.), Resisting Neoliberalism in Higher Education (Vol. 1, pp. 37-58). Cham, Switezrland: Palgrave Macmillan.
Bishop, J. D. (2004). Crossing the boundaries of obligation: Are corporate salaries a form of bribery? Journal of Business Ethics, 55, 1-11.
Bowman, K., & McKenna, S. (2016). The development of Australia’s national training system: a dynamic tension between consistency and flexibility. Adelaide, SA, Australia: NCVER.
Boyd, B. (2009). Evaluating academic governance processes and structures: Ethical dilemmas and academic governance development. Paper presented at the 7th Annual Australasian Higher Education Evaluation Forum, "Evaluation in a changing higher education landscape: Bradley and beyond", Byron Bay, NSW, Australia. https://www.scu.edu.au/aheef/index.php/7/
Dietz, J., & Kleinlogel, E. (2014). Wage cuts and managers' empathy: How a positive emotion can contribute t positive organizational ethics in difficult times. Journal of Business Ethics(119), 461-472.
Dodd, T. (2016, 21 May). Private college's VET FEE-HELP loan scandal hit: $160 million and counting. The Australian Financial Review. Retrieved from https://www.afr.com/policy/ health-and-education/private-colleges-vet-feehelp-loan-scandal-hit-160-million-and-counting-20160519-gozbmp
Fisher, B., & Tronto, J. (1940). Circles of care work and identity in women's lives. In E. K. Abel & M. K. Nelson (Eds.), Towards a feminist theory of caring. New York, NJ, USA: University Press.
Gurgu, E., & Tonis, R. (2018). Ethical universities of integrity and ethics management in the Romanian university environment. Journal of Economic Development, Environment and people, 7(4), 69-79.
Heffernan, T. A. (2019). Reporting on vice-chancellor salaries in Australia's and the United Kingdom's media in the wake of strikes, cuts and 'falling performance'. International Journal of Leadership in Education, 1-17. doi:10.1080/13603124.2019.1631387
Jacques, E. (2003). Ethics for management. Management Communications Quarterly, 17(1), 136-142.
Kenny, J. (2017). Academic work and performativity. Higher Education, 74, 897–913. Lucas, A., Whelan, A., Probyn-Rapsey, F., Tackacs, G., Svirsky, M., & Verucci, N. (2020, 4
September). Governing universities: tertiary experience no longer required. Retrieved from https://theconversation.com/governing-universities-tertiary-experience-no-longer-required-145439
McGuire, J., Dow, S., & Argheyd, K. (2003). CEO incentives and corporate social performance. Journal of Business Ethics, 45, 341-359.
Natale, S. M., & Libertella, A., F. (2016). Higher education and wealth equity: Calibrating the mora compass empathy, ethics and the trained will. Journal of Academic Ethics, 14, 35-47.
Puiu, S., & Ogarca, R. F. (2014). Ethics management in higher education system of Romania. Paper presented at the 2nd Global conference on business, economic, management and tourism, Prague, Czech Republic.
Bergami, R.
141
Rea, J. (2016). Critiquing neoliberalism in Australian universities. Australian Universities Review, 58(2), 9-14.
Rowlands, J., & Bowen, R. (2020, 2 December). How Australian vice-chancellors’ pay came to average $1 million and why it’s a problem. Retrieved from https://theconversation.com/how-australian-vice-chancellors-pay-came-to-average-1-million-and-why-its-a-problem-150829
Sainsbury, M. (2020). Australia’s universities: bosses reel in $1m-plus salaries, $1bn profit on back of staff underpayment. Retrieved from https://www.michaelwest.com.au/australian-university-profits/
Star, C. (2007, 26-29 September). Whither engagement? Challenges for community engagement within academia. Paper presented at the 2007 International Women's Conference: Education, Employment and Everything... the Triple Layers of a Woman's Life, Toowoomba, Queensland, Australia.
van Onselen, L. (2020, 21 April). How greedy university VCs fattened themselves on international students Retrieved from https://www.macrobusiness.com.au/2020/04/ greedy-university-vcs-must-cut-their-fat-salaries/
DETUROPE – THE CENTRAL EUROPEAN JOURNAL OF REGIONAL DEVELOPMENT AND TOURISM Vol. 13 Issue 3 2021 ISSN 1821-2506
142
Original scientific paper
A PANEL DATA MODEL OF INTERNATIONAL TOURISM DEMAND
FOR GREECE
Athanasia MAVROMMATIa, Konstantina PENDARAKIa, Achilleas
KONTOGEORGOSb, Fotios CHATZITHEODORIDISc*
a University of Patras, Department of Business Administration of Food and Agricultural Enterprises, [email protected] and [email protected] b International Hellenic University, Department of Agriculture, [email protected] c* University of Western Macedonia, Department of Regional and Cross-Border Development, [email protected]
Cite this article: Mavrommarti, A., Pendaraki, K., Kontogeorgos, A., Chatzitheodoridis, F. (2021). A Panel Data Model of International Tourism Demand for Greece. Deturope. 13(3), 142-157.
Abstract Tourism is an important industry which affects the profits of national economy. A strong tourism sector directly contributes to the national income of the country, combats unemployment and improves the balance of payments. Tourism demand is usually measured by the number of tourist visits from an origin country to a destination country, in terms of tourist nights spent in the destination country or in terms of tourist expenditures by visitors from an origin country to the destination country. The purpose of this study is to investigate the determinants of international tourism demand for Greece and to quantify their influences. Four econometric models have been developed with different combinations of countries, to estimate tourist inflow data from twenty-eight European and non-European countries, for the period 1996-2015. Various potential determinants are investigated, including gross domestic product, currency, the average per capita tourism expenditure and the marketing expenses to promote tourism industry. The empirical results indicate that the explanatory variables affect the tourism demand of Greece and play an important role in strategies that affect total cost, demand, and structure of the Greek tourism market. Keywords: International tourism demand, Greece, panel data analysis, modelling
INTRODUCTION
Tourism is an important industry which affects the profits of national economies. According to
the annal analysis of the World Travel & Tourism Council (WTTC, 2019), the tourism activity
in Greece generates about 20.8% of the gross domestic product, represents 21.7% of the total
employment and contributes decisively to attenuate the current account deficit of the balance
of payments. These numbers show that tourism industry is rapidly growing in contrast to other
sectors of the Greek economy and become one of the major factors of socio-economic progress
through the generation of jobs, the strengthening of export income and the enforcement of
infrastructure development (Kolokontes et al., 2018).
Mavrommarti, A., Pendaraki, K., Kontogeorgos, A., Chatzitheodoridis, F.
143
Greece is one of the world’s major tourist destinations. The difficult economic situation in
Greece and the instability due to the pandemic appear to have affected the country’s tourism
industry (Chatzitheodoridis & Kontogeorgos, 2020). The arrivals have been affected by the
impact of the coronavirus (Covid-19) pandemic and Greece’s tourism revenue dropped by 77%
during the 2020. According to the Bank of Greece, travel receipts from January to October of
2020 were down to only some 4 billion euros compared to 13.5 billion euros in the
corresponding period of 2019. Furthermore, during the first ten months of 2020, visitor flows
through airports declined by 72.8 % and arrivals through road border-crossing points were down
by 83.4 %.
A better knowledge of the factors that explain the tourists’ preferences to choose Greece as
a destination place will help the policy makers to design more adequate strategies to develop
further this sector. Therefore, it is essential to analyse determinants of the Greek tourism
demand, in order for the tourism industry to apply efficient management and to correspond to
infrastructure development needs. Tourism demand forecasting would help managers and
investors make operational, efficient and strategic decisions. The substantial contribution of
tourism in the Greek economy justifies the interest in explaining the determinants of tourism
demand and, therefore, the factors which influence the decision of tourists to choose the country
as a destination place.
The present study analyses empirically the determinants of tourism demand in Greece
through four econometric models for a statistically significant sample of twenty-eight European
and non-European countries for the years 1996-2015. The depended variable in all models is
the number of visitors (VIS), while the explanatory variables are: The Gross Domestic Product
per capita (GDP) by country, the marketing expenses to promote Greek tourism industry in each
foreign country (ADV), the average per capita tourism expenditure in Greece by country (EXP),
the population in foreign countries (POP) and the foreign exchange rate (FER) expressed in US
dollars. To our knowledge, there is no other research work that has used the advertising
expenses of Greece in tourism origin countries as an explanatory variable.
More specifically, the first model investigates the determinants of tourism demand in Greece
for eleven European countries with different currencies for the period 1996-2015 and includes
all the explanatory variables. The second model investigates the determinants of tourism
demand in Greece for eleven European countries with the same currency for the period 1996-
2015 and excludes the exchange rate (FER) from the explanatory variables. The third model
analyses the determinants of tourism demand in Greece for sixteen European and non-European
countries with different currencies for the period 1996-2015, includes all the explanatory
Mavrommarti, A., Pendaraki, K., Kontogeorgos, A., Chatzitheodoridis, F.
144
variables, but excludes USA because the currency is expressed in US dollars. The fourth and
last model analyses the determinants of tourism demand in Greece for twenty-eight European
and non-European countries for the period 1996-2015 and excludes the exchange rate (FER)
from the explanatory variables.
Section 2 presents the literature review, while the rest of the paper is organized as follows:
section three presents the model specification and the data set. The methodological framework
is presented in section four. Empirical results are discussed in section five and conclusions are
summarised in the last section.
THEORETICAL BACKGROUND
The growth of both the world-wide tourism industry and academic interest in tourism over the
last years has generated great interest in tourism demand modelling in both the business and the
academic area. Tourism demand modelling research relies heavily on secondary data in terms
of model construction and estimation. International tourism demand models use tourist arrivals
and expenditures as the most frequent dependent variables (Lim, 1997; Song & Li, 2008).
Numerous studies have shown that forecasting tourism demand remains important in order to
predict the future of tourism (Brand, 1973; Chan, 1979; Vanhove, 1980; Sheldon & Var, 1985;
Crouch, 1994; Witt & Witt, 1995; Lim, 1997a, 1997b and 1999; Li et al., 2005; Song & Li,
2008; Karlaftis, 2010; Goh & Law, 2011; Moro, et al., 2017; Khaidi et al., 2019;
Ghalehkhondabi et al., 2019). These review studies categorize demand models and methods
into three main approaches: time-series, econometric and artificial intelligence models.
Time-series models have been broadly applied because they provide simplicity in data
collection, cost effectiveness in the application and interpretation of forecasting demand and
allow comparisons for benchmarking purposes (Andrew et al., 1990; Goh & Law, 2002; Cho,
2003; Chan et al., 2005; Coshall, 2006; Adhikari & Agrawal, 2012; Baldigara & Mamula, 2015;
Tang, et al., 2015). Econometric models, on the other hand, enrich the study of forecasting
tourism demand by linking the causal relationship between tourism demand and its influencing
factors (Clements & Hendry, 1998; Lathiras & Siriopoulos, 1998; Kulendran & Wilson, 2000;
Song & Witt, 2003; Lim & McAleer, 2001; Turner & Witt, 2001, Dritsakis, 2004; Song &
Wong, 2003; Algieri, 2006; Han et al., 2006). More specifically, panel data approach provides
researchers with massive data sets, increases the degree of freedom, reduces the collinearity
among explanatory variables, and improves efficiency of econometric estimation (Serra et al.,
2014). Most recent studies that use panel data have examined both economic and non-economic
Mavrommarti, A., Pendaraki, K., Kontogeorgos, A., Chatzitheodoridis, F.
145
factors that affect international tourism demand. Moreover, artificial intelligence is recently
introduced by the emergence of programming systems in analyzing and predicting tourism
demand (Kon & Turner, 2005; Li et al., 2006; Palmer et al., 2006; Claveria & Torra 2014;
Cankurt & Subasi, 2016; Karakitsiou & Mavrommati, 2017). Nevertheless, econometric
models overtake both time-series and artificial models in predicting tourism demand, given
their advantage in linking the dependent variable with its explanatory ones (Khaidi et al., 2019).
International tourism demand models use most frequently tourist arrivals/departures and
expenditures/receipts as the dependent variables (Kulendran & Wong, 2005; Coshall, 2005;
Rosselló, 2001; Tang, et al., 2015; Cankurt & Subasi, 2016; Rafidah, et al., 2017), while there
also a few studies which measure the number of overnight stays such as these of Claveria &
Torra (2014) and Constantino et al. (2016). The most common explanatory variables used, are
the real gross domestic product for approaching the tourist incomes, the consumer price index,
the tourism cost of the destination country relative to the country of origin, the exchange rate,
the living cost, as well as the price of the competing destination (Song et al., 2003,
Constantinino et al., 2016; Song et al., 2011; Cankurt et al., 2015; Gunter, 2015; Zhu, et al.,
2018; Assaf et al., 2019). Country of origin (Claveria & Torra, 2014) and allowance for visitors
(Liang, 2014) are also chosen as explanatory variables in certain studies. Also, some researchers
use tourism related keywords from search engines (Liang, 2014; Yang et al., 2015; Önder 2017;
Kirilenko & Stepchenkova, 2018). Other determinant variables are also considered, like
distance or transportation costs (Lim & McAleer, 2001; Muhammad & Andrews, 2008;
Hanafiah & Harun, 2010), population (Hanafiah & Harun, 2010), tourism infrastructure as
accommodation capacity (Seetanah, 2006), consumer tastes or fashion (Song & Witt, 2000).
Model Specifications and Variable Definition
The demand of tourism in Greece by tourists from European and non-European countries is
analyzed by four different panel data sets. The panel data sets consist of tourist arrivals of
twenty-eight countries, namely the UK, Switzerland, Czech Republic, Sweden, Bulgaria,
Denmark, Hungary, Norway, Poland, Romania, Russia, USA, Turkey, Australia, Canada,
Japan, Israel, Austria, Cyprus, Italy, France, Spain, Slovakia, Germany, Netherlands, Portugal,
Finland, and Ireland. Based on a sample period of 20 years, from 1996 to 2015, the data for the
study are obtained from the World Bank Reports, the World Travel and Tourism Council, the
European Central Bank Statistical Data, Media Services S.A., the Greek Research Institute of
Tourism and the Bank of Greece.
Mavrommarti, A., Pendaraki, K., Kontogeorgos, A., Chatzitheodoridis, F.
146
The dependent variable is the number of visitors in Greece from the origin country (VIS), since
it is the most widely used variable in studies on tourism demand (Tang, et al., 2015; Cankurt &
Subasi, 2016; Rafidah, et al., 2017). Five explanatory variables have been used to measure the
influence on tourism demand (VIS) in the current model. The Gross Domestic Product per
capita (GDP) in each country, as a measure variable for analysing income, has a positive impact
on tourism arrivals (Surugiu, Leitão, & Surugiu, 2011; Deng & Athanasopoulos, 2011). The
exchange rate (FER) between the destination country and origin countries is expressed in US
dollars and measures the effective prices of goods and services in the destination country, in
relative to origin countries. It is an indicator of purchasing power of tourists in Greece and has
a positive impact on tourism arrivals (Kulendran & Wilson 2000; Chinnakum & Boonyasana
2017). The average per capita tourism expenditure in each country (EXP), being a
representative of the component cost of travel to the destination, negatively influences the
tourist arrivals (Au & Law, 2002; Brida & Risso, 2009). The population in each country (POP)
positively affects tourism demand (Oigenblick & Kirschenbaum, 2002). The current study is
further enhanced by the inclusion of an important variable in the model, which is related to the
tourism advertising expense in each country (ADV) as a representative of tourism marketing.
Tourism advertising expense has been suggested by Chinnakum and Boonyasana (2017) as an
explanatory variable, which has not been broadly studied yet in the tourism demand forecasting
models.
The following theoretical model is used in order to estimate international tourism demand
towards Greece and is applied to four different data sets from twenty-eight European and non-
European countries:
itiit uFERbEXPbPOPbADVbGDPbcVIS ++++++= 54321 ,
where i refers to cross sections and t refers to time periods. VIS is the number of tourist arrivals from country of origin to Greece GDP is the Gross Domestic Product per capita of country of origin ADV is the marketing expenses to promote Greek tourism industry in the country
of origin POP is the population in the country of origin EXP is the average per capita tourism expenditure of tourists in the host country FER is the bilateral exchange rate between Greece and the country of origin
In this study, due to data unavailability, EXP and FER were used as a proxy for the cost of
living for tourists in Greece and ADV was used as a proxy for marketing expenses to promote
Mavrommarti, A., Pendaraki, K., Kontogeorgos, A., Chatzitheodoridis, F.
147
Greek tourism industry. Similarly, GDP was used as a proxy for the income level of foreign
tourists. All monetary values are measured in US dollars.
Four panel data sets are analyzed, categorizing the countries by their geographical position
and by their currency. The first data set studies the determinants of tourism demand in Greece
for eleven European countries with different currencies, for the period 1996-2015. This model
includes all the explanatory variables for the following countries: the UK, Switzerland, the
Czech Republic, Sweden, Bulgaria, Denmark, Hungary, Norway, Poland, Romania and Russia.
The second data set studies the determinants of tourism demand in Greece for eleven European
countries with the same currency, for the period 1996-2015. This model excludes from the
explanatory variables the exchange rate (FER) and is applied for the following countries:
Austria, Cyprus, Italy, France, Spain, Slovakia, Germany, the Netherlands, Portugal, Finland
and Ireland. The third data set studies the determinants of tourism demand in Greece for sixteen
European and non-European countries with different currencies, for the period 1996-2015. This
model includes all the explanatory variables but excludes USA because the currency is
expressed in US dollars and is applied for: the UK, Switzerland, the Czech Republic, Sweden,
Bulgaria, Denmark, Hungary, Norway, Poland, Romania, Russia, Turkey, Australia, Canada,
Japan and Israel. The fourth and last model studies the determinants of tourism demand in
Greece for twenty eight European and non-European countries for the period 1996-2015,
excludes the exchange rate (FER) from the explanatory variables and is applied for the
following countries: the UK, Switzerland, the Czech Republic, Sweden, Bulgaria, Denmark,
Hungary, Norway, Poland, Romania, Russia, USA, Turkey, Australia, Canada, Japan, Israel,
Austria, Cyprus, Italy, France, Spain, Slovakia, Germany, the Netherlands, Portugal, Finland
and Ireland.
DATA AND METHODS
As far as tourism demand is concerned, econometric analysis has its empirical usefulness in
interpreting the change of tourism demand and evaluating the effectiveness of the existing
tourism policies. Panel data models consider the cross sectional and time series properties of
the data, for example, tourism revenue observed by origin and over time. In the present study,
the term “panel data” refers to the pooling of observations in a cross-section of the eleven
selected countries over a period of twenty years (1996-2015) and the data used were obtained
from the following sources: World Bank Reports; World Travel and Tourism Council;
Mavrommarti, A., Pendaraki, K., Kontogeorgos, A., Chatzitheodoridis, F.
148
European Central Bank, Statistical Data; Media Services S.A.; Research Institute of Tourism;
Bank of Greece.
The combination of cross section and time series data should be conducted in an appropriate
statistical way, otherwise the coefficients will not be efficient. A variety of estimation
techniques for panel data models have been developed in the literature that enable relaxation of
many of the restrictive assumptions of the single cross-sectional stochastic model and give rise
to alternative measures of efficiency. These include the fixed effects model and the least squares
dummy variable (LSDV) estimation, the random effects model and the generalised least squares
(GLS) estimation and finally, maximum likelihood estimation (MLE).
The fixed effect model explores the relationship between predictor and outcome variables
within an entity (country, company, etc.). Each entity has its own individual characteristics that
may or may not influence the predictor variables. The model requires relatively weak
assumptions and allows αi (i.e., the unknown intercept for each entity) to differ across the cross-
section units, and the estimates for the constants are different for each cross section. It provides
a convenient means of allowing for differences in coefficients, which may occur for different
samples or for different sample distributions (Carter at al., 1988). That is,
itiit
Z
zzit uXY ++= ∑
=
αβ1
with i = 1…Z and t = 1…T, where Yit represents the value of the dependent variable for entity i at time t, Xit is the value
of any Z explanatory variable for entity i at time t, and uit is the error term with the standard
assumption, βz is the coefficient for the explanatory variables and αi is the unknown intercept
for each entity. The fixed effects model is a classical regression model and controls all time-
invariant differences between the entities, so the estimated coefficients of the fixed-effects
models cannot be biased because of omitted time-invariant characteristics.
The rationale behind the random effects model is that, unlike the fixed effects model, the
variation across entities is assumed to be random and uncorrelated with the predictor or
independent variables included in the model. More specifically, the random effects model
assumes that the term αit is the sum of a common constant α and a time-invariant cross section
specific random variable ui that is uncorrelated with the disturbance term εit. This means that,
itititit
Z
zzit uXY εαβ +++= ∑
= 1
where E[u(i)] = 0, Var[u(i)] = σ2(u), Cov[ε(i,t),u(i)] = 0.
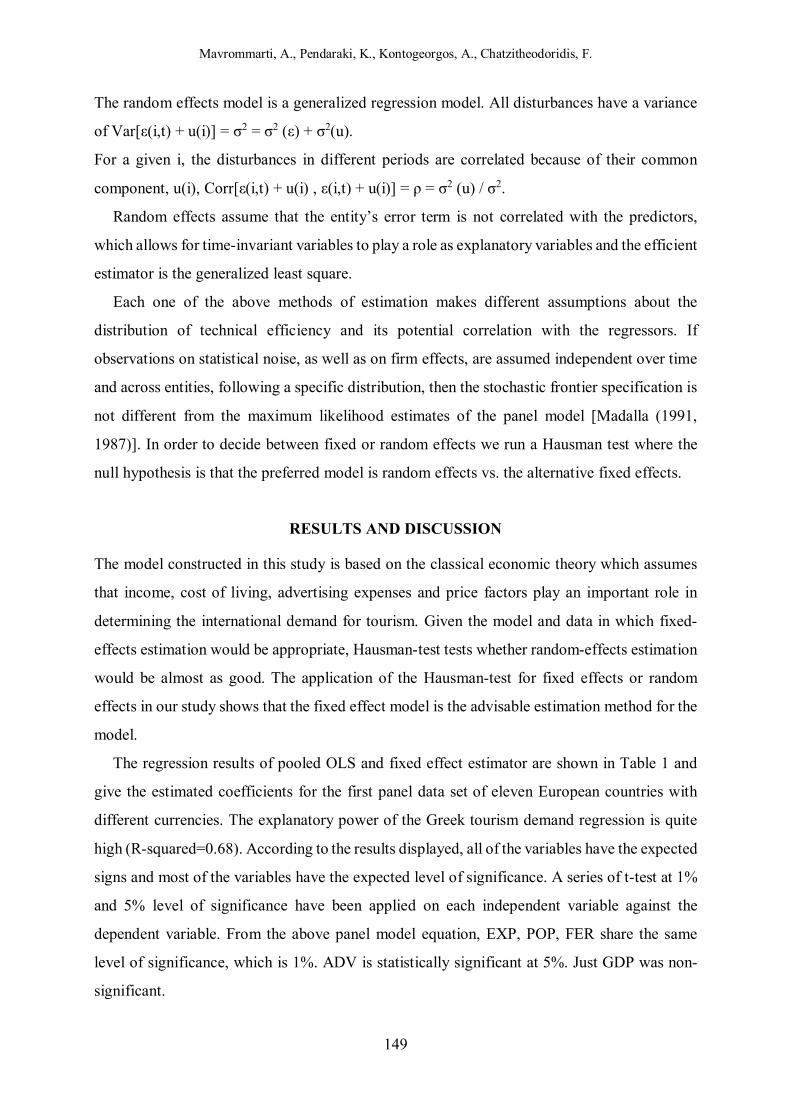
Mavrommarti, A., Pendaraki, K., Kontogeorgos, A., Chatzitheodoridis, F.
149
The random effects model is a generalized regression model. All disturbances have a variance
of Var[ε(i,t) + u(i)] = σ2 = σ2 (ε) + σ2(u).
For a given i, the disturbances in different periods are correlated because of their common
component, u(i), Corr[ε(i,t) + u(i) , ε(i,t) + u(i)] = ρ = σ2 (u) / σ2.
Random effects assume that the entity’s error term is not correlated with the predictors,
which allows for time-invariant variables to play a role as explanatory variables and the efficient
estimator is the generalized least square.
Each one of the above methods of estimation makes different assumptions about the
distribution of technical efficiency and its potential correlation with the regressors. If
observations on statistical noise, as well as on firm effects, are assumed independent over time
and across entities, following a specific distribution, then the stochastic frontier specification is
not different from the maximum likelihood estimates of the panel model [Madalla (1991,
1987)]. In order to decide between fixed or random effects we run a Hausman test where the
null hypothesis is that the preferred model is random effects vs. the alternative fixed effects.
RESULTS AND DISCUSSION
The model constructed in this study is based on the classical economic theory which assumes
that income, cost of living, advertising expenses and price factors play an important role in
determining the international demand for tourism. Given the model and data in which fixed-
effects estimation would be appropriate, Hausman-test tests whether random-effects estimation
would be almost as good. The application of the Hausman-test for fixed effects or random
effects in our study shows that the fixed effect model is the advisable estimation method for the
model.
The regression results of pooled OLS and fixed effect estimator are shown in Table 1 and
give the estimated coefficients for the first panel data set of eleven European countries with
different currencies. The explanatory power of the Greek tourism demand regression is quite
high (R-squared=0.68). According to the results displayed, all of the variables have the expected
signs and most of the variables have the expected level of significance. A series of t-test at 1%
and 5% level of significance have been applied on each independent variable against the
dependent variable. From the above panel model equation, EXP, POP, FER share the same
level of significance, which is 1%. ADV is statistically significant at 5%. Just GDP was non-
significant.
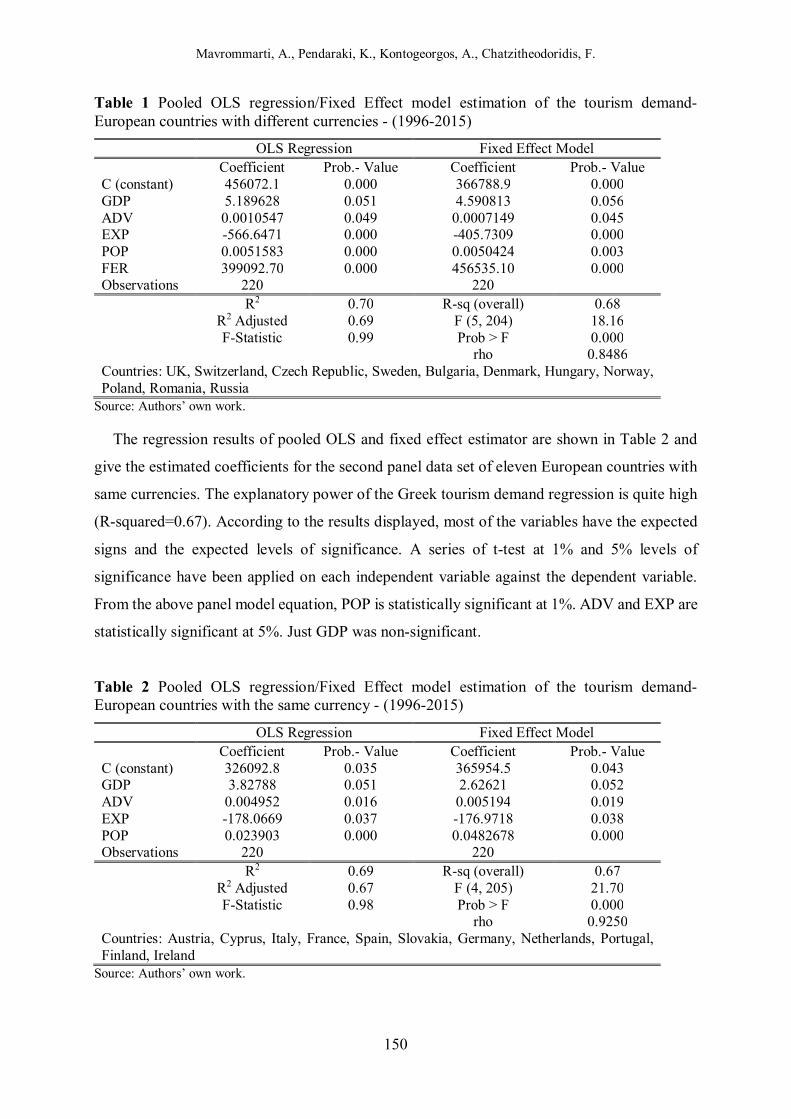
Mavrommarti, A., Pendaraki, K., Kontogeorgos, A., Chatzitheodoridis, F.
150
Table 1 Pooled OLS regression/Fixed Effect model estimation of the tourism demand-European countries with different currencies - (1996-2015)
OLS Regression Fixed Effect Model Coefficient Prob.- Value Coefficient Prob.- Value
C (constant) 456072.1 0.000 366788.9 0.000 GDP 5.189628 0.051 4.590813 0.056 ADV 0.0010547 0.049 0.0007149 0.045 EXP -566.6471 0.000 -405.7309 0.000 POP 0.0051583 0.000 0.0050424 0.003 FER 399092.70 0.000 456535.10 0.000 Observations 220 220
R2 0.70 R-sq (overall) 0.68 R2 Adjusted 0.69 F (5, 204) 18.16 F-Statistic 0.99 Prob > F 0.000 rho 0.8486
Countries: UK, Switzerland, Czech Republic, Sweden, Bulgaria, Denmark, Hungary, Norway, Poland, Romania, Russia
Source: Authors’ own work.
The regression results of pooled OLS and fixed effect estimator are shown in Table 2 and
give the estimated coefficients for the second panel data set of eleven European countries with
same currencies. The explanatory power of the Greek tourism demand regression is quite high
(R-squared=0.67). According to the results displayed, most of the variables have the expected
signs and the expected levels of significance. A series of t-test at 1% and 5% levels of
significance have been applied on each independent variable against the dependent variable.
From the above panel model equation, POP is statistically significant at 1%. ADV and EXP are
statistically significant at 5%. Just GDP was non-significant.
Table 2 Pooled OLS regression/Fixed Effect model estimation of the tourism demand-European countries with the same currency - (1996-2015)
OLS Regression Fixed Effect Model Coefficient Prob.- Value Coefficient Prob.- Value
C (constant) 326092.8 0.035 365954.5 0.043 GDP 3.82788 0.051 2.62621 0.052 ADV 0.004952 0.016 0.005194 0.019 EXP -178.0669 0.037 -176.9718 0.038 POP 0.023903 0.000 0.0482678 0.000 Observations 220 220
R2 0.69 R-sq (overall) 0.67 R2 Adjusted 0.67 F (4, 205) 21.70 F-Statistic 0.98 Prob > F 0.000 rho 0.9250
Countries: Austria, Cyprus, Italy, France, Spain, Slovakia, Germany, Netherlands, Portugal, Finland, Ireland
Source: Authors’ own work.
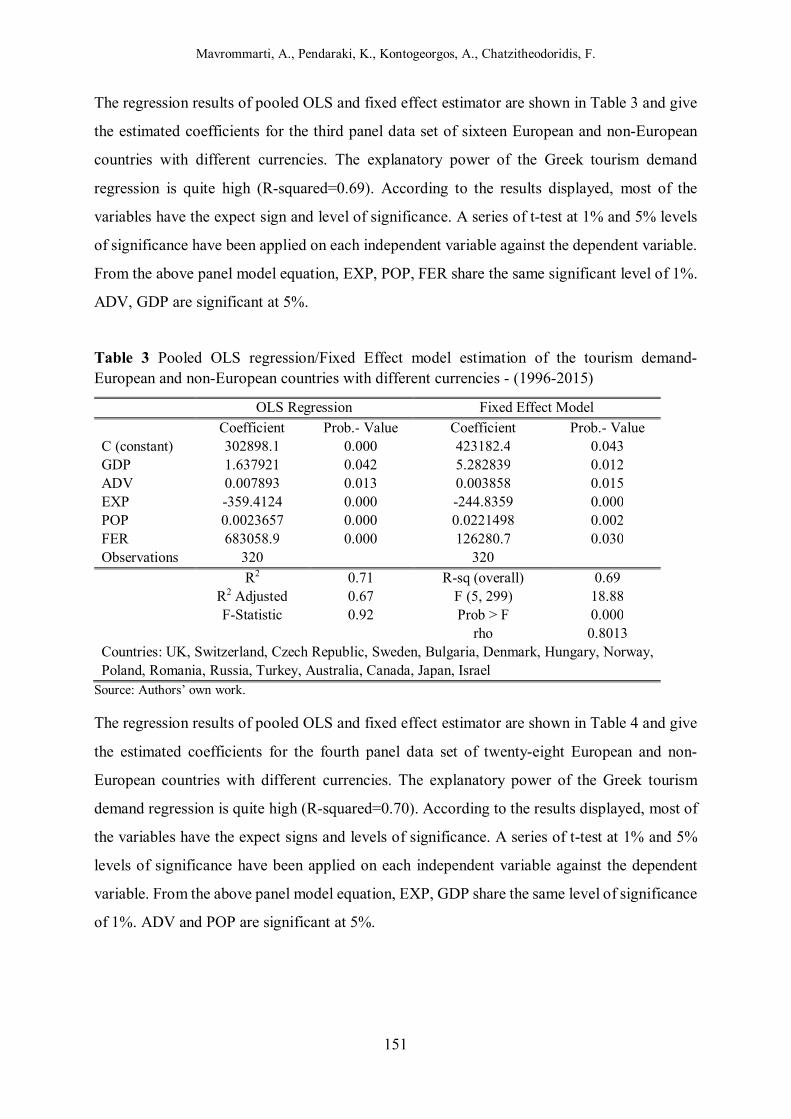
Mavrommarti, A., Pendaraki, K., Kontogeorgos, A., Chatzitheodoridis, F.
151
The regression results of pooled OLS and fixed effect estimator are shown in Table 3 and give
the estimated coefficients for the third panel data set of sixteen European and non-European
countries with different currencies. The explanatory power of the Greek tourism demand
regression is quite high (R-squared=0.69). According to the results displayed, most of the
variables have the expect sign and level of significance. A series of t-test at 1% and 5% levels
of significance have been applied on each independent variable against the dependent variable.
From the above panel model equation, EXP, POP, FER share the same significant level of 1%.
ADV, GDP are significant at 5%.
Table 3 Pooled OLS regression/Fixed Effect model estimation of the tourism demand-European and non-European countries with different currencies - (1996-2015)
OLS Regression Fixed Effect Model
Coefficient Prob.- Value Coefficient Prob.- Value C (constant) 302898.1 0.000 423182.4 0.043 GDP 1.637921 0.042 5.282839 0.012 ADV 0.007893 0.013 0.003858 0.015 EXP -359.4124 0.000 -244.8359 0.000 POP 0.0023657 0.000 0.0221498 0.002 FER 683058.9 0.000 126280.7 0.030 Observations 320 320
R2 0.71 R-sq (overall) 0.69 R2 Adjusted 0.67 F (5, 299) 18.88 F-Statistic 0.92 Prob > F 0.000 rho 0.8013
Countries: UK, Switzerland, Czech Republic, Sweden, Bulgaria, Denmark, Hungary, Norway, Poland, Romania, Russia, Turkey, Australia, Canada, Japan, Israel
Source: Authors’ own work.
The regression results of pooled OLS and fixed effect estimator are shown in Table 4 and give
the estimated coefficients for the fourth panel data set of twenty-eight European and non-
European countries with different currencies. The explanatory power of the Greek tourism
demand regression is quite high (R-squared=0.70). According to the results displayed, most of
the variables have the expect signs and levels of significance. A series of t-test at 1% and 5%
levels of significance have been applied on each independent variable against the dependent
variable. From the above panel model equation, EXP, GDP share the same level of significance
of 1%. ADV and POP are significant at 5%.
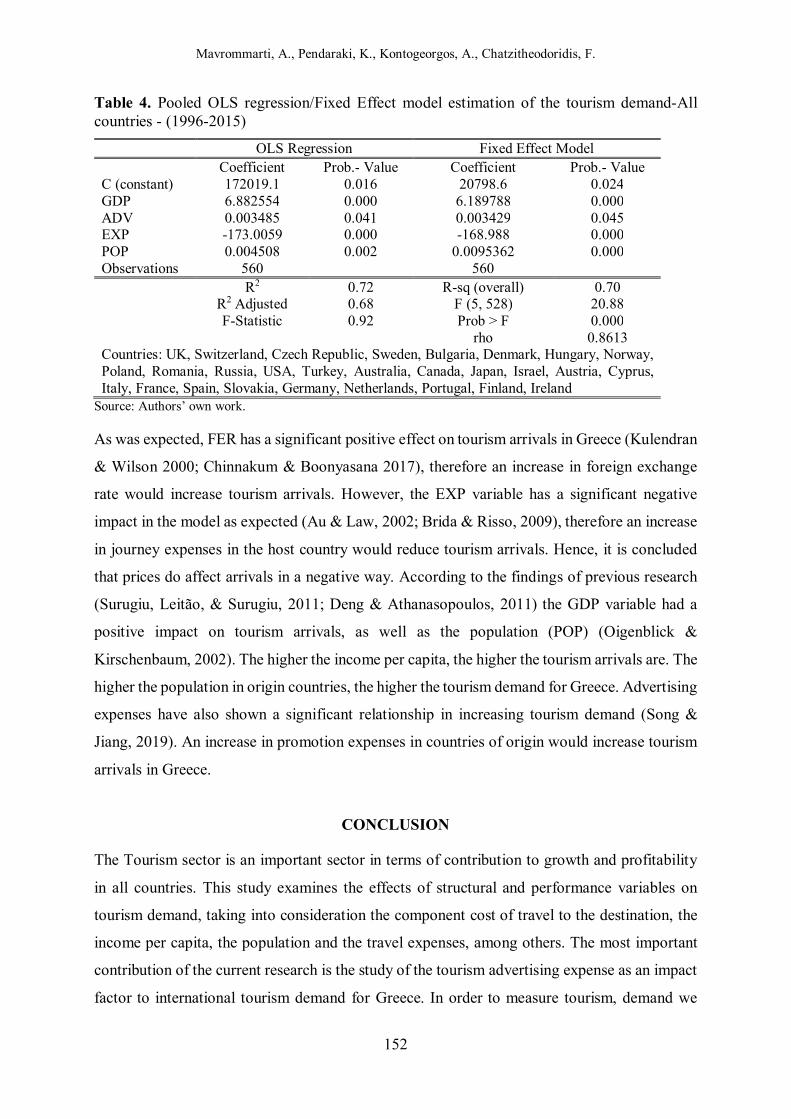
Mavrommarti, A., Pendaraki, K., Kontogeorgos, A., Chatzitheodoridis, F.
152
Table 4. Pooled OLS regression/Fixed Effect model estimation of the tourism demand-All countries - (1996-2015)
OLS Regression Fixed Effect Model Coefficient Prob.- Value Coefficient Prob.- Value
C (constant) 172019.1 0.016 20798.6 0.024 GDP 6.882554 0.000 6.189788 0.000 ADV 0.003485 0.041 0.003429 0.045 EXP -173.0059 0.000 -168.988 0.000 POP 0.004508 0.002 0.0095362 0.000 Observations 560 560
R2 0.72 R-sq (overall) 0.70 R2 Adjusted 0.68 F (5, 528) 20.88 F-Statistic 0.92 Prob > F 0.000 rho 0.8613
Countries: UK, Switzerland, Czech Republic, Sweden, Bulgaria, Denmark, Hungary, Norway, Poland, Romania, Russia, USA, Turkey, Australia, Canada, Japan, Israel, Austria, Cyprus, Italy, France, Spain, Slovakia, Germany, Netherlands, Portugal, Finland, Ireland
Source: Authors’ own work.
As was expected, FER has a significant positive effect on tourism arrivals in Greece (Kulendran
& Wilson 2000; Chinnakum & Boonyasana 2017), therefore an increase in foreign exchange
rate would increase tourism arrivals. However, the EXP variable has a significant negative
impact in the model as expected (Au & Law, 2002; Brida & Risso, 2009), therefore an increase
in journey expenses in the host country would reduce tourism arrivals. Hence, it is concluded
that prices do affect arrivals in a negative way. According to the findings of previous research
(Surugiu, Leitão, & Surugiu, 2011; Deng & Athanasopoulos, 2011) the GDP variable had a
positive impact on tourism arrivals, as well as the population (POP) (Oigenblick &
Kirschenbaum, 2002). The higher the income per capita, the higher the tourism arrivals are. The
higher the population in origin countries, the higher the tourism demand for Greece. Advertising
expenses have also shown a significant relationship in increasing tourism demand (Song &
Jiang, 2019). An increase in promotion expenses in countries of origin would increase tourism
arrivals in Greece.
CONCLUSION
The Tourism sector is an important sector in terms of contribution to growth and profitability
in all countries. This study examines the effects of structural and performance variables on
tourism demand, taking into consideration the component cost of travel to the destination, the
income per capita, the population and the travel expenses, among others. The most important
contribution of the current research is the study of the tourism advertising expense as an impact
factor to international tourism demand for Greece. In order to measure tourism, demand we
Mavrommarti, A., Pendaraki, K., Kontogeorgos, A., Chatzitheodoridis, F.
153
used four constructed panel databases for European and non-European countries for the period
1996–2015.
Important economic factors such as gross domestic product, price, advertising expenses for
promotion, exchange rate and the population number have been studied as independent
variables in the model. The empirical results indicate that international tourist arrivals to Greece
are positively determined by GDP per capita (GDP), advertising expenses (ADV), exchange
rate (FER) and population (POP), while relative price (EXP) has a negative impact on
international tourist arrivals to Greece. Panel data using fixed-effects model results, suggested
that 70% of the variation in twenty-eight European and non-European countries tourist inflows,
could be explained by real income per capita, advertising expenses, population and prices. All
the independent variables were significant in the panel data analysis model.
Based on our findings, income in the country of origin plays an important role in determining
international tourist arrivals to Greece. International tourists consider tourism in Greece as a
necessary goods and a valuable service. Our work also proves that tourism is very much
dependent on the economic conditions of the countries of origin. Moreover, high values of
income in the countries of origin mean that demand for travelling and vacation increases
significantly. Therefore, Greece will benefit from the long run growth of income in other
countries.
The advertising expenses in tourism industry is an information source that dynamically
affects tourists' price decisions and spending (Song and Jiang, 2019). However, the impact of
advertising expenditure on generating tourists’ arrivals is difficult to be estimated and,
therefore, countries seek to eliminate these costs. In addition to this, the different utility function
faced by different consumers displays different behaviours in choosing and purchasing tourist
products. Effective advertising might be, therefore, the answer to this tricky equation.
In order to sustain tourist arrivals in Greece it is necessary to increase promotion and
advertising expenses and reduce travel prices and the cost of living. It seems that although
tourists are sensitive to prices and travel expenses, they are attracted by advertising and
promotion when deciding to travel and choose a destination. The recent evolution of technology
and social media in the last decades could be exploited by countries to generate arrivals with
low-cost promotion campaigns. Marketing campaigns in the form of social media content
affects the behaviour of tourists, as well as their decision making towards a destination. In this
vein, the importance of advertising the tourist product can be supported by promoting tourism
in less costly ways, such as social media campaigns.
Mavrommarti, A., Pendaraki, K., Kontogeorgos, A., Chatzitheodoridis, F.
154
REFERENCES
Andrew, W.P., Crange, D.A., & Lee, C.K. (1990). Forecasting hotel occupancy rates with time series models: A empirical analysis. Hospitality Research Journal, 14 (2), 173–181.
Adhikari, R., & Agrawal, R.K. (2012). Forecasting strong seasonal time series with artificial neural networks. Journal of Scientific & Industrial Research, 71, 657-666.
Algieri, B. (2006). An econometric estimation of the demand for tourism: the case of Russia. Tourism Economics, 12, 5–20.
Assaf, A. G., Li, G., Song, H., & Tsionas, M.G. (2019). Modelling and forecasting regional tourism demand using the Bayesian Global Vector Autoregressive (BGVAR) Model. Journal of Travel Research, 58(3), 383–397.
Au, N., & Law, R. (2002). Categorical classification of tourism dining. Annals of Tourism Research, 29, 819-833.
Baldigara, T., & Mamula M. (2015). Modelling international tourism demand using seasonal ARIMA models. Tourism and Hospitality Management, 21(1), 19-31.
Brand, D. (1973), Travel demand forecasting: some foundations and a review. Highway Research Board Special Report, No. 143, Williamsburg, VA.
Brida, J., & Risso, W. (2009). A dynamic panel data study of the German demand for tourism in South Tryrol. Tourism and Hospitality Research, 9(4), 305-314.
Cankurt, S., & Subasi, A. (2015). Developing tourism demand forecasting models using machine learning techniques with trend, seasonal and cyclic components. Balk Journal of Electrical and Computer Engineering, 3(1), 42-49.
Cankurt, S., & Subasi, A. (2016). Tourism demand modelling and forecasting using data mining techniques in multivariate time series: a case study in Turkey. Turkish Journal of Electrical Engineering and Computer Sciences, 24(5), 3388-404.
Carter, H.R., Griffiths, W.E., Liitkepohl, H., & Tsounh, C.L. (1988). Introduction to the theory and practice of econometrics (2nd edition), John Wiley, New York.
Chan, Y. (1979). Review and compilation of demand forecasting experiences: an aggregation of estimation procedures, Department of Transportation, No. DOT-P-30-80-25, Washington, DC.
Chan, F., Lim, C., & McAleer, M. (2005). Modelling multivariate international tourism demand and volatility. Tourism Management, 26, 459-471.
Chatzitheodoridis, F., & Kontogeorgos, A. (2020). Exploring of a Small-Scale Tourism Product under Economic Instability: The Case of a Greek Rural Border Area. Economies, 8 (3): 52. https://doi.org/10.3390/economies8030052
Chinnakum, W., & Boonyasana, P. (2017). Modelling Thailand tourism demand: a dual generalized maximum entropy estimator for panel data regression models. Thai Journal of Mathematics. Special Issue on Entropy in Econometrics, 67-78.
Cho, V. (2003). A comparison of three different approaches to tourist arrival forecasting. Tourism Management, 24, 323–330.
Claveria, O., & Torra, S. (2014). Forecasting tourism demand to Catalonia: Neural networks vs. time series models. Economic Modelling, Elsevier, 36(C), 220-228.
Clements, M.P., & Hendry, D.F. (1998). Forecasting economic time series, Cambridge, Cambridge University Press.
Constantino H A, Fernandes, P.O., & Teixeira, J.P. (2016). Tourism demand modelling and forecasting with artificial neural network models: the Mozambique case study. Review of Applied Management Studies, 14(2), 113–24.
Coshall, J. T. (2005). A selection strategy for modelling UK tourism flows by air to European destinations. Tourism Economics, 11, 141-158.
Mavrommarti, A., Pendaraki, K., Kontogeorgos, A., Chatzitheodoridis, F.
155
Coshall J. (2006). Time series analyses of UK outbound travel by Air. Journal of Travel Research, 44, 335-347.
Crouch, G. I. (1994). The study of international tourism demand: a review of practice. Journal of Travel Research, 33, 41-54.
Deng, M., & Athanasopoulos, G. (2011). Modelling Australian domestic and international inbound travel: A spatial-temporal approach. Tourism Management, Vol. 32(5),1075–1084.
Dritsakis, N. (2004). Cointegration analysis of German and British tourism demand for Greece. Tourism Management, 25, 111–119.
Ghalehkhondabi I., Ardjmand, E, Young W. A., & Weckman, G.R. (2019). A review of demand forecasting models and methodological developments within tourism and passenger transportation industry. Journal of Tourism Futures, 5(1), 75-93.
Goh, C., & Law, R. (2002), Modelling and forecasting tourism demand for arrivals with stochastic no stationarity seasonality and intervention. Tourism Management, Vol. 23, pp. 499–510.
Goh, C., & Law, R. (2011). The methodological progress of tourism demand forecasting: A review of related literature. Journal of Travel and Tourism Marketing, 28(3), 296-317.
Gunter, U., & Onder, I. (2015). Forecasting international city tourism demand for Paris: Accuracy of uni- and multivariate models employing monthly data. Tourism Management, 46, 123-135.
Han, Z., Dubarry, R., & Sinclair, M.T. (2006). Modelling US tourism demand for European destinations. Tourism Management, 27, 1–10.
Hanafiah, M. H. M., & Harun, M. F. M. (2010). Tourism demand in Malaysia: A cross-sectional pool time-series analysis. International Journal of Trade. Economics and Finance, 1(1), pp. 80–83.
Karakitsiou, A. & Mavrommati, A. (2017). Machine learning methods in tourism demand forecasting: Some evidence from Greece. MIBES Transactions, 11(1), pp. 92-105.
Karlaftis, M.G. (2010). Critical review and analysis of air-travel demand: forecasting models, computational models, software engineering, and advanced technologies in air transportation: Next Generation Applications, IGI Global, 71-87.
Khaidi, S. M., Abu1, N., & Sarah, N.M. (2019). Tourism demand forecasting – A review on the variables and models. Journal of Physics: Conference Series, 1366.
Kirilenko, A.P., & Stepchenkova, S. (2018). Tourism research from its inception to present day: Subject area, geography, and gender distributions, PLoS ONE 13(11): e0206820. https://doi.org/ 10.1371/journal.pone.0206820
Kolokontes, D.A., Kontogeorgos, A, Loizou, E, & Chatzitheodoridis, F. (2018). Key-Sectors Attractiveness of the Greek Economy: An Input-Output Approach. Applied Econometrics and International Development, 18 (1), 35-54.
Kon, S.C., & Turner, W.L. (2005). Neural network forecasting of tourism demand. Tourism Economics, 11, 301–328.
Kulendran, N., & Shan, J. (2002). Forecasting China’s monthly inbound travel demand. Journal of Travel and Tourism Marketing, 13, 5-19.
Kulendran, N. & Wilson, K. (2000). Modelling business travel. Tourism Economics, 6, 47-59. Lathiras, P., & Siriopoulos, C. (1998). The demand for tourism to Greece: A Cointegration
approach. Tourism Economics, 4(2), 171-185. Li, G., Wong, K.F., Song, H. & Witt, S.F. (2006). Tourism demand forecasting: A time varying
parameter error correction model. Journal of Travel Research, 45, 175-185. Lim, C., & McAleer, M. (2001). Cointegration analysis of quarterly tourism demand by Hong
Kong and Singapore for Australia. Applied Economics, 33, 1599-1619.
Mavrommarti, A., Pendaraki, K., Kontogeorgos, A., Chatzitheodoridis, F.
156
Liang, Y.H. (2014). Forecasting models for Taiwanese tourism demand after allowance for Mainland China tourists visiting Taiwan. Computers & Industrial Engineering, 74, 111–119.
Liang, Z., Lim, C., Wenjun, X., & Yuan, W. (2018). Modelling tourist flow association for tourism demand forecasting. Current Issues in Tourism, 21(8), 902-916.
Lim, C. (1997a). Review of international tourism demand models. Annals of Tourism Research, 24, 835-849.
Lim, C. (1997b). An econometric classification and review of international tourism demand models. Tourism Economics, 3, 69-81.
Lim, C. (1999). A Meta-analysis review of international tourism demand. Journal of Travel Research, 37, 273-84.
Lim, C., & McAleer, M. (2001). Cointegration analysis of quarterly tourism demand by Hong Kong and Singapore for Australia. Applied Economics, 33, 1599-1619.
Maddala, G.S. (1987). Recent developments in the econometrics of panel data analysis. Transportation Research, 21, 303-326.
Maddala, G.S. (1991). To Pool or Not to Pool: That is the Question. Journal of Quantitative Economics, 7, 255-263.
Moro, S., Rita, P., & Cortez, P. (2017). A text mining approach to analysing Annals literature. Annals of Tourism Research, 208–210.
Muhammad, A., & Andrews, D. (2008). Determining Tourist Arrivals in Uganda: The Impact of Distance, Trade and Origin-Specific Factors. African Journal of Accounting, Economics, Finance and Banking Research, 2(2), 51-62.
Oilgenblick, L., & Kirschenbaum, A. (2002). Tourism and immigration comparing alternative approaches. Annals of Tourism Research, 29(4), 1086-1100.
Önder, I. (2017). Forecasting tourism demand with Google trends: Accuracy comparison of countries versus cities. International Journal of Tourism Res, 19, 648–660. https://doi.org/10.1002/jtr.2137
Palmer, A., Montaño, J.J., & Sesé, A. (2006). Designing an artificial neural network for forecasting tourism time-series. Tourism Management, 27, 781–790.
Rafidah, A., Shabri, A., Nurulhuda, A., & Suhaila, Y. (2017). A wavelet support vector machine combination model for Singapore tourist arrival to Malaysia. IOP Conference Series: Materials Science and Engineering, 226(1), 012077.
Rosselló, J. (2001). Forecasting turning points in international visitor arrivals in the Balearic Islands. Tourism Economics, 7, 365-380.
Seetanah, B. (2006). Analysing transport capital as a determinant of tourist Arrival in a co-integration and error correction framework. International Review of Business Research Papers, 2, (2), 15-29.
Serra, J., Correia, A., & Rodrigues, P.M.M. (2014). A comparative analysis of tourism destination demand in Portugal. Journal of Destination Marketing & Management, 2, 221-227.
Sheldon, P.J., & Var, T. (1985). Tourism forecasting: A review of empirical research. Journal of Forecasting, 4(2), 183-195.
Song, H., & Jiang, Y. (2019). Dynamic pricing decisions by potential tourists under uncertainty: The effects of tourism advertising. Tourism Economics, 25(2), 213-234.
Song, H., Li, G., Witt, SF., & Athanasopoulos, G. (2011). Forecasting tourist arrivals using time-varying parameter structural time series models. International Journal of Forecasting, 27(3), 855-869.
Song, H., & Li, G. (2008). Tourism demand modelling and forecasting. Tourism Research, 29(2), 203-220.
Mavrommarti, A., Pendaraki, K., Kontogeorgos, A., Chatzitheodoridis, F.
157
Song, H., & Wong, K.F. (2003). Tourism demand modelling: a time-varying parameter approach. Journal of Travel Res. 42, 57–64.
Song, H., S. F. Witt, & Li, G. (2003). Modelling and forecasting the demand for Thai tourism. Tourism Economics, 9, 363-87.
Song, H., & Witt, S.F. (2000). Tourism demand modelling and forecasting: modern econometric approaches. Pergamon, Cambridge.
Surugiu, C., Leitão, N. C., & Surugiu, M.R. (2011). A panel data modelling of international tourism demand: Evidence for Romania. Ekonomska istraživanja /Economic Research, 24(1), 134–145.
Tang, J., Sriboonchitta, S., & Yuan, X. (2015). Forecasting inbound tourism demand to China using time series models and belief functions. Econometrics of Risk, Springer, Cham, 329-41.
Turner, L.W., & Witt, S.F. (2001). Forecasting tourism using univariate and multivariate structural time series models. Tourism Economics, 7, 135–147.
Vanhove, N. (1980). Forecasting in tourism. Tourist Review, 35(3), 2-7. Yang, X., Pan, P., Evans, J.A., & Lv, B. (2015). Forecasting Chinese tourist volume with search
engine data. Tourism Management, 46, 386-397. Witt, S. F., & Witt, C. A. (1995). Forecasting tourism demand: A review of empirical research.
International Journal of Forecasting, 11, 447-475.
Related Documents