Volcano collapse and tsunami generation in the Bismarck Volcanic Arc, Papua New Guinea Eli Silver, Simon Day, Steve Ward, Gary Hoffmann, Pilar Llanes, Neal Driscoll, Bruce Appelgate, Steve Saunders PII: S0377-0273(09)00260-1 DOI: doi: 10.1016/j.jvolgeores.2009.06.013 Reference: VOLGEO 4348 To appear in: Journal of Volcanology and Geothermal Research Received date: 12 November 2008 Revised date: 5 June 2009 Accepted date: 30 June 2009 Please cite this article as: Silver, Eli, Day, Simon, Ward, Steve, Hoffmann, Gary, Llanes, Pilar, Driscoll, Neal, Appelgate, Bruce, Saunders, Steve, Volcano collapse and tsunami generation in the Bismarck Volcanic Arc, Papua New Guinea, Journal of Volcanology and Geothermal Research (2009), doi: 10.1016/j.jvolgeores.2009.06.013 This is a PDF file of an unedited manuscript that has been accepted for publication. As a service to our customers we are providing this early version of the manuscript. The manuscript will undergo copyediting, typesetting, and review of the resulting proof before it is published in its final form. Please note that during the production process errors may be discovered which could affect the content, and all legal disclaimers that apply to the journal pertain.

Welcome message from author
This document is posted to help you gain knowledge. Please leave a comment to let me know what you think about it! Share it to your friends and learn new things together.
Transcript

�������� ����� ��
Volcano collapse and tsunami generation in the Bismarck Volcanic Arc, PapuaNew Guinea
Eli Silver, Simon Day, Steve Ward, Gary Hoffmann, Pilar Llanes, NealDriscoll, Bruce Appelgate, Steve Saunders
PII: S0377-0273(09)00260-1DOI: doi: 10.1016/j.jvolgeores.2009.06.013Reference: VOLGEO 4348
To appear in: Journal of Volcanology and Geothermal Research
Received date: 12 November 2008Revised date: 5 June 2009Accepted date: 30 June 2009
Please cite this article as: Silver, Eli, Day, Simon, Ward, Steve, Hoffmann, Gary, Llanes,Pilar, Driscoll, Neal, Appelgate, Bruce, Saunders, Steve, Volcano collapse and tsunamigeneration in the Bismarck Volcanic Arc, Papua New Guinea, Journal of Volcanology andGeothermal Research (2009), doi: 10.1016/j.jvolgeores.2009.06.013
This is a PDF file of an unedited manuscript that has been accepted for publication.As a service to our customers we are providing this early version of the manuscript.The manuscript will undergo copyediting, typesetting, and review of the resulting proofbefore it is published in its final form. Please note that during the production processerrors may be discovered which could affect the content, and all legal disclaimers thatapply to the journal pertain.

ACC
EPTE
D M
ANU
SCR
IPT
ACCEPTED MANUSCRIPT
1 7/8/2009
Volcano collapse and tsunami generation in the Bismarck Volcanic Arc, Papua New Guinea
Eli Silver1*, Simon Day1,2, Steve Ward1, Gary Hoffmann1, Pilar Llanes3, Neal Driscoll4, Bruce Appelgate4, Steve Saunders5
1Earth and Planetary Sciences Dept., University of California, Santa Cruz, CA 95064 *Corresponding Author: [email protected] 2Dept of Earth Sciences, University College London, London, UK 3Universidad Complutense de Madrid, Facultad de Geologia, Ciudad Universitaria,
Madrid, Spain 4Scripps Institution of Oceanography, La Jolla, CA 92093 5Rabaul Volcanic Observatory, Papua New Guinea Abstract
During a cruise on the R/V Kilo Moana in 2004, we mapped 12 debris
avalanches from volcanoes in the Bismarck volcanic arc, estimated their sizes and
computed the size of potential tsunami run-up in major local population centers from
these features. We used the towed side-scan instrument Hawaii-MR1, the hull-mounted
EM120 system for swath bathymetry and backscatter intensity, a shallow penetration
chirp system, several bottom camera tows and selected cores. We calibrate our
computations with the known tsunami run-up of the Ritter collapse. Even the small
collapses may have had significant run-up on near-by coastlines. Had any of the collapses
we have identified occurred in modern times each would affect a presently populated
region of the coastline to a moderate or significant degree.
1. Introduction
Sector collapses are common occurrences for many volcanoes, such as the
Aleutian volcanoes (Coombs et al., 2007), the Lesser Antilles (Boudon et al., 2007),
Japan (Satake and Kato, 2001), Tonga-Kermadec (Wright et al., 2006), and the Cascades
(Crandell et al., 1984; Glicken, 1996). Enormous debris avalanche deposits have been
mapped around all of the Hawaiian Islands (Moore et al., 1989) and the Cape Verde -
Canary Islands (Watts and Masson, 1995; Masson et al., 2002; Masson et al., 2008),
which represent major oceanic island events. Collapse events into the ocean often result
in massive tsunami generation (Ward and Day, 2003). The 1888 AD collapse of nearly
the entire western flank of Ritter Island in the Bismarck volcanic arc was described by

ACC
EPTE
D M
ANU
SCR
IPT
ACCEPTED MANUSCRIPT
2 7/8/2009
Johnson (1987), Ward and Day (2003), and Silver et al. (2005). Here we report on the
results of a major multibeam and side-scan sonar study of a large part of the offshore
volcanic islands in the Bismarck volcanic arc, and we present observations for debris
avalanches from 11 volcanoes in the Bismarck chain: Garove, Tolokiwa, Sakar, Ritter,
Dakataua, Crown, Karkar, Manam, Kadovar, Bam, and a small seamount near Lolobau
Island off East New Britain. We explore implications for the possible tsunami effects
they may have had on the sites of present population centers.
2. Regional Setting
The Bismarck volcanic arc overlies the northward subducting Solomon Sea, a
small ocean basin that is rapidly disappearing (Davies et al., 1987; Silver et al., 1991).
The rate of subduction is highest in the eastern part of the arc and slowest in the west
(Taylor, 1979; Tregoning et al., 2000; Wallace et al., 2004). In addition, the Solomon sea
oceanic crust disappears from view at the surface to the west of New Britain island, as it
is overrun by the collision of the South Bismarck Sea plate with the Australian plate
(Abers and McCaffrey, 1988; Silver et al., 1991; Abbott et al., 1994). Nonetheless,
subduction of the Solomon Sea continues westward, as seen by both seismicity data
(Cooper and Taylor, 1987; Abers and Roecker, 1991) and the presence of 10Be in the
lavas from volcanoes both east and west of West New Britain (Gill et al., 1993). Both the
western and eastern ends of the Bismarck volcanic arc pass close to or are cut by
transform faults of the Bismarck Sea Seismic Lineation (BSSL). Our data do not include
the westernmost end, but they show the relationships between this fault system and the
Schouten Islands (Llanes et al., 2009).
Our easternmost data includes the region offshore of Ulawun and Lolobau
volcanoes. Ulawun is quite active and has been a target of study for the United Nations
(1987) International Decade of Natural Hazard Reduction program volcanoes (see also
http://www.sveurop.org/gb/articles/articles/decade.htm). The volcanic line runs largely
along the north coastal region of New Britain, with several remarkable exceptions (Fig.
1). One is the prominent N-trending Wilaumez Peninsula that extends about 50 km north
of the average line of the island’s north coast. The second exception is the Witu group of
islands that lies about 100 km off the north coast of New Britain. Most of the islands in

ACC
EPTE
D M
ANU
SCR
IPT
ACCEPTED MANUSCRIPT
3 7/8/2009
this group (Garove, Mundua, and Narage) lie on a roughly east-west oriented platform,
and the island of Unea is about 10 km to the south. West of New Britain, the islands of
Umboi, Sakar, Tolokiwa, Ritter, Long, Crown, Bagabag, Karkar and Manam all form a
northwest trend with minor scatter about the trend.
Formed as part of the process of opening the Manus basin (Taylor, 1979), the
Bismarck Sea Seismic Lineation (BSSL) extends westward across the Bismarck Sea to its
intersection with the coast. West of this intersection, subduction is southerly directed
beneath the margin, whereas to the east subduction is still northerly directed, toward the
Bismarck Sea. The pole of rotation that describes the collision of the Finisterre-Adelbert
Ranges with the rest of New Guinea lies near this intersection (Wallace et al., 2004). This
fault system passes through the Schouten Islands and may have had an influence in their
development.
3. Methods
During November-December, 2004, we carried out a geophysical study of the
Bismarck volcanic arc aboard the R/V Kilo Moana. We collected swath bathymetry and
backscatter data with the Simrad EM-120 hull-mounted sonar and the Hawaii MR1 towed
side-scan system. The minimum water depth allowable for the Hawaii MR1 towed side-
scan instrument was 500 m, which limited our work in shallow water. We obtained
shallow subsurface data with a Knudsen hull-mounted 4 kHz sub-bottom profiler
(University of Hawaii) and an X-Star towed 1-5.5 kHz chirp sub-bottom profiler (Scripps
Institution of Oceanography). Several camera tows were also carried out using a digital
deep-tow camera (Woods Hole Oceanographic Institution).
In addition to the marine geophysical study, onshore fieldwork was carried out
by S. Day in September-November 2004 and July-August 2005. This work was
principally directed at collection of data on tsunami deposits and oral traditions of
tsunamis (to be reported elsewhere), but a number of volcanic islands and coastal
volcanoes were visited: Talasea and other volcanoes of the Willaumez peninsula in 2004,
and all of the Witu Islands; Arop (Long); Crown; Bagabag; Karkar; Manam; Boisa; Bam;
Blupblup; Wei; Koil and Vokeo in 2005. Finally, a brief onshore visit was made to Ritter
Island in December 2006 during the course of near-shore survey work.

ACC
EPTE
D M
ANU
SCR
IPT
ACCEPTED MANUSCRIPT
4 7/8/2009
4. Results
The swath bathymetry and side-scan results from the 2004 cruise reveal a number
of debris avalanche deposits that may have generated significant tsunamis. We describe
each of these and discuss their volcanic and tectonic settings. Our interpretation of the
potential size of tsunamis that could be generated from the collapse events is based on the
size of the debris avalanche, as seen mainly on the side-scan images, although swath
bathymetry, with lower spatial resolution, is used as well. On many of the figures in this
paper that show debris avalanche deposits, we have outlined an area that is somewhat
wider than the large blocks clearly visible on the image to indicate the extent of the debris
field (as we interpret it). For very young collapse features the edges of the debris fields
are very clear in the side-scan imagery (Ritter, for example), but older collapse deposits
suffer partial or complete burial and a lack of clear definition of the edges of the original
deposit.
Most of the debris fields that we map are those of the debris avalanche stage of
the collapse landslide and not of any debris flows that may extend farther from the
source. Debris flows are quite evident off Ritter (discussed below) but are not evident in
our data on the other, older collapse features. Debris avalanche deposits tend to show
scattered blocks of various sizes, generally extended down-slope from the volcano.
Conical structures sometime present are considered volcanic cones and not part of the
debris avalanche, though the latter deposits may occur in the same region as the cones.
Often we see dark streaks down the flanks of volcanoes. These may be related to any of a
number of factors (magmato-phreatic eruptions, rapid slope wasting, landsliding of reefs,
or sector collapses). We only interpret the presence of debris avalanches when we have
visual evidence of a region of scattered blocks, as indicated above. These interpretations
allow us to estimate the areas of the debris avalanches. It is very difficult to determine
whether a debris avalanche deposit represents just one or multiple collapse events. Even
where separate lobes exist, such structure could be formed by a single event (see:
http://www.es.ucsc.edu/~ward/Etna-blob.mov for an excellent example of multiple lobes
from a single collapse event). We discuss the much less constrained issue of thickness for
these units in Section 5.

ACC
EPTE
D M
ANU
SCR
IPT
ACCEPTED MANUSCRIPT
5 7/8/2009
4.1 Ulawun, Lolobau, and Seamount Southwest of Lolobau
Off eastern New Britain we found a submarine volcano (Fig. 2) about 20 km
southwest of Lolobau Island, showing a small debris field off its northeast side. The
debris extends out approximately 4 km from the seamount, and the largest block making
up the debris field is 300 m across. Other major volcanoes in East New Britain such as
Lolobau and Ulawun were surrounded by shallow areas or reefs, preventing us from
surveying around these volcanoes. Ulawun (Fig. 3) shows a major scarp on its south side
that likely indicates an earlier collapse, prior to rebuilding its present cone. To the north
of Lolobau and Ulawun is a low region of irregular bathymetry and backscatter that could
indicate a debris avalanche deposit. Unfortunately our data are not sufficient to know
whether this zone is related to either of those volcanoes.
4.2 Garove
The most prominent debris avalanche deposit in the Witu group of islands is seen
at Garove (Figures 4 and 5), where the south side of the 4.6 km wide caldera has been
breached. The timing of Garove’s collapse is not reported. Side-scan data show a debris
field covering an area approximately 100 km2 fanning out from the breach in the caldera,
including a block several km wide located 10 km from the island. This block has low-
backscatter drape; it looks to be an older feature than the high - backscatter zone
extending from the caldera breach. Here, and in most other cases, it is difficult to
distinguish whether the debris avalanche deposits represent one or more collapse
episodes. A region of very high backscatter amplitudes also extends for about 11 km
south of the island, representing more recent sedimentary or phreatomagmatic events
from the island.
4.3 Dakataua
Southeast of Garove is Dakataua volcano (Figures 1, 4), lying at the northern tip
of the Willaumez Peninsula. Dakataua caldera collapsed 1270-1350 years ago (Newhall
and Dzurisin, 1988; Neall et al., 2008). Based on the size and depth of the caldera,
Lowder and Carmichael (1970) estimated the volume of caldera collapse to be 75 km3.

ACC
EPTE
D M
ANU
SCR
IPT
ACCEPTED MANUSCRIPT
6 7/8/2009
Irregular, high amplitude backscattered reflectivity is seen around the northern tip of the
peninsula (Fig. 6), and the bathymetry shows that some of these irregular features
represent significant blocks, 1-2 km in diameter (Fig. 6). Some of the large blocks may
indicate sector collapse prior to caldera formation (Machida et al., 1996). The area of
these blocks to the northeast Dakataua is approximately 30 km2.
4.4 Sakar
Located NW of westernmost New Britain and north of Umboi, the island of Sakar
(Fig. 7) is associated with significant debris avalanche deposits. Sakar has a younger
volcano with a crater lake (Johnson et al. 1972). North of Sakar is a field of large blocks
that can be seen in both the bathymetry and the side-scan imagery (Fig. 7). The blocks are
found out to more than 10 km from the island and cover an area approximately 30 km2,
indicating a debris avalanche. The collapse scar has been completely filled in by later
growth of the volcano and the formation of coral reefs. Several irregular valleys on the
north side of the island (Fig. 7) could represent sector collapse scars that might have
contributed to this debris field. Similar irregularities occur on the east, south and
southwest sides of the island, suggesting that a number of small collapses have occurred
in recent times. On the southeast side of Sakar is a smaller debris field. It is difficult to
discern whether this field is related to Sakar or to Ritter Island, and for this paper we have
not treated this debris field as a separate feature.
4.5 Ritter
South and west of Sakar is the very large and well-exposed debris field from the
1888 collapse of Ritter, described by Johnson (1987) and Silver et al. (2005). Ritter
collapsed toward the west and its debris avalanche was then diverted to the northwest by
the large bathymetric edifice of Umboi. Ward and Day (2003) have shown that the
landslide reached speeds of 40 m/s or greater, based on the distribution of the flow
materials and modeling of the well-documented tsunami that was generated by the
collapse. Contemporary reports by German colonists living in the region indicate that
forests were stripped from the lower slopes of Umboi, Sakar, and West New Britain to
heights of approximately 15 m, suggesting run-ups in excess of this number (Ward and

ACC
EPTE
D M
ANU
SCR
IPT
ACCEPTED MANUSCRIPT
7 7/8/2009
Day, 2003). Our backscatter and multi-beam data show that the blocks from the debris
avalanche extend to about 35 km from Ritter Island but are largely confined between the
edifices of Umboi and Sakar, although blocks are able to spread to the northeast to the
north of Sakar (Fig. 7). Within about 15 km of Ritter Island, the blocks are significantly
larger and more densely packed together. Following the terminology of Glicken (1996)
for the 1980 Mount St. Helens collapse, these are termed block-rich facies. Beyond 15
km, the blocks are smaller and less densely packed, leading to their description as a
matrix-rich facies (Silver et al., 2005). Again, this facies appears broadly comparable to
the matrix-rich facies described by Glicken in the 1980 Mount St. Helens collapse
deposits.
Northwest of the debris avalanche deposits, from 35 to 70 km from Ritter Island,
is a broad zone of relatively dark (high) backscatter that corresponds to debris flow
deposits (Fig. 7). Bottom photography indicates that this region does not contain deposits
of volcanic clasts, but is instead composed of deposits dominated by dark rounded clasts
which a dredge sample showed to be 10-30 cm diameter rounded intraclasts of ripped-up
deep marine mud and silt. Areas of anomalous, grooved and mesa-like bathymetry
upslope to either side of the debris avalanche deposits (Fig. 7) may represent the source
of the eroded sediment intraclasts. Two seabed photograph traverses across and to the
east of the distal end of the debris avalanche deposit revealed exposures of scoured and
eroded bedded sediments in the walls of the grooves and mesas where the uppermost
sediments have been ripped up, probably by the passage of the debris avalanche (Silver et
al., 2005). Farther to the northwest along the debris flow, we dredged materials from the
surface that are largely mud lumps – possibly the deposits of the eroded sediment (Silver
et al., 2005).
To determine the area of the debris avalanche we did not use the debris flow
deposits. One reason for this omission is the fact that a significant (yet unknown) fraction
of these deposits has been reworked from the sea floor along the path of the flow. Thus,
the total volume of material from the volcano deposited within this distal unit is likely to
be minor. A second reason is that Ritter is the only collapse feature for which we were
able to map the debris flow deposits with the side-scan imagery. All other deposits show
the debris avalanche blocks, but not debris flow deposits, which may well be present in

ACC
EPTE
D M
ANU
SCR
IPT
ACCEPTED MANUSCRIPT
8 7/8/2009
the subsurface but are not evident in the sonar backscatter data. Our data do not allow us
to determine the thickness of the debris avalanche deposits. We have estimated the
thickness based on the known run-up of the tsunami on nearby islands and on the
constraint provided by the ~4.6 km3 volume of the collapse scar on Ritter itself (Johnson,
1987).
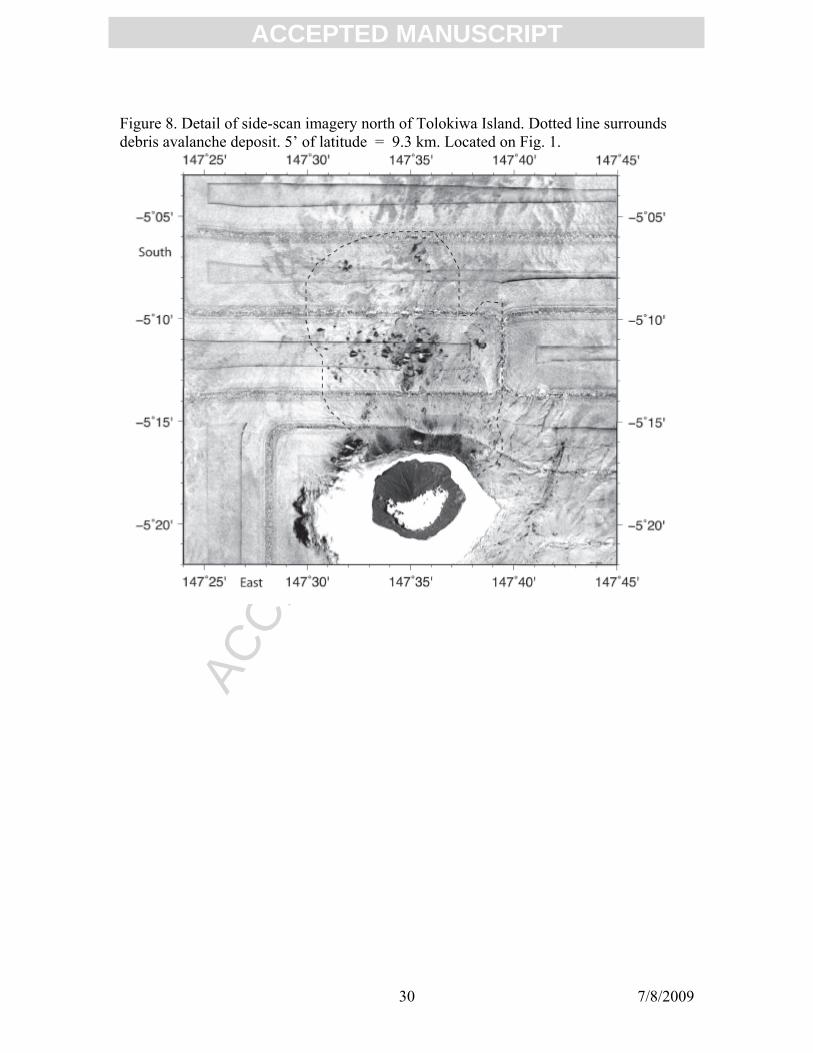
4.6 Tolokiwa
Tolokiwa is a conical stratovolcano. Most of the island is tree-covered and there
are no observations of eruptions or thermal areas (Johnson et al., 1972). A zone of high
amplitude backscatter lies north of Tolokiwa, as seen in the side-scan imagery (Fig. 8).
This backscatter is associated with a number of exceptionally large blocks (more than 60
can be resolved in the imagery) that lie on a fan-shaped high approximately 145 km2 in
area, radiating away from the north coast of the island (Fig. 8). This deposit represents
the most prominent debris avalanche that we have mapped in the Bismarck arc. The
debris field reaches over 20 km north of the island and the largest blocks attain
dimensions of up to 1 km across. Although morphologic irregularities occur on the north
flank of the island (Fig. 8), no large collapse scar sufficient to explain the debris field is
exposed, suggesting that the volcano has reconstructed itself following the event(s)
leading to the observed debris field.
4.7 Crown Island
Crown Island lies just northwest of Long Island (also known as Arop Island),
which experienced a major eruption about 300 y ago (Blong, 1982). Crown is deeply
dissected. It is covered by rain-forest and fringed by continuous coral reefs. Crown has no
reported eruptive history or sign of thermal activity (Johnson et al., 1972). Both north
and south of Crown Island are irregular, blocky regions consistent with debris fields from
collapse events. The debris field north of the island (Fig. 9) is much larger than that to the
south, approximately 100 km2 to the north compared with about 20 km2 to the south.
Blocks 1 km across can be found as far as 7 km north of Crown Island. Similar to
Tolokiwa, Crown Island is nearly circular in shape, and shows little evidence of sector

ACC
EPTE
D M
ANU
SCR
IPT
ACCEPTED MANUSCRIPT
9 7/8/2009
collapse of the size expected to explain the debris fields. Thus, volcanic reconstruction
has likely followed the main collapse events. No ages are available for these events.
4.8 Karkar
Karkar volcano (Fig. 10) has a relatively small caldera, about 5.5 km across.
Major eruptive events occurred approximately 9100 and 1400 years ago, but activity has
been occurring fairly regularly, including some significant events in the mid-1970’s
(McKee et al., 1976). The latest volcanic and solfataric activity has occurred on Bagiai
volcano, a 300 m high cone located in the summit crater of Karkar. Sidescan imagery
around Karkar (Fig. 10) shows very high amplitude reflectivity to the southwest,
indicating young lava flows. Adjacent to these flows are small regions of blocky
backscatter, suggesting debris avalanche deposits. Although these are small, it is possible
that they coalesce beneath the lava flows and have been buried by the younger activity.
High amplitude reflectivity also occurs on the north side of the island. Individual blocks
are scattered, and the reflectivity pattern appears result from both lava flows and small
debris avalanches. Karkar shows a slide scar on its south side (Fig. 10) that could be
associated with some of the debris imaged south of the island. Unfortunately our data
around Karkar came largely from transit lines and is incomplete. Although the debris
avalanche deposit mapped is small, it is still large enough to have produced potentially
significant tsunami run-up in the Madang area (section 5).
4.9 Manam Island
Manam Island has been active at least since the early 1600’s, based on reports of
marine explorers, and it was actively spewing ash during our cruise in late 2004. During
the last century the longest period of quiescence of the volcano was 9 years (Palfreyman
and Cooke, 1976). Because of the activity of the volcano during our cruise, our only data
were collected on two transit lines taken north and south of the island. Observations on
Manam by Simon Day in 2005 included young subaerial lava flows that continue beyond
the coast to below sea level. The southern transit shows a region of irregular, blocky
topography and high backscatter directly south of the island, suggesting at least one
sector collapse event during the volcano’s history.

ACC
EPTE
D M
ANU
SCR
IPT
ACCEPTED MANUSCRIPT
10 7/8/2009
The swath bathymetry shows a number of very large blocks south of Manam,
covering an area of 20-30 km2. The full extent is not mappable in the single swath. Side
scan imagery also shows this blocky region, but some of the large blocks don’t show up
well in the side scan, and the blocks do not show high amplitude reflectivity. This low
reflectivity could indicate that a collapse was ancient, but it isn’t clear what effect the
proximity to the Sepik and Ramu River mouths (Figs. 1 and 12) has on the rate of
sedimentation, and blocks may be rapidly covered with sediment in this region. The
debris field appears to be focused just southwest of Manam. Some block-like features to
the SW appear conical and may be small volcanic features. Several small conical features
also appear within the debris field and may be post – collapse volcanic vents, similar to
those observed north of Ritter Island (Silver et al., 2005).
Manam has large grooves incised down its flanks on the southwest, northwest,
northeast, and southeast sides of the island, suggesting recent collapses of the headwalls
of these valleys. Active lahar and debris flow fields are developed on the coast at the
mouth of each valley. Because of its very active volcanism, sector collapse scars are
likely to heal rapidly, and the existing scars have been produced by repeated small
rockfall – type landslides. The combination of rapid healing of collapse scars and high
but poorly constrained sedimentation rates around the island due to proximity of the
Ramu and Sepik rivers makes Manam a difficult volcano to study for collapse history.
4.10 Bam
Bam Island (Figures 12, 13 and 14) is the highest and south-easternmost of the
Schouten Islands (Fig. 12) and lies 55 km north-northeast of the mouth of the Sepik
River. The island has an oval shape and dimensions of 2.4 by 1.6 km. It is a stratovolcano
685 m high with a large summit crater, 180 m deep and 300 m wide with precipitous
walls exposing outward – dipping lava and scoria sequences (Cooke and Johnson, 1978;
1981), implying enlargement of the crater by floor subsidence and wall collapse. Bam has
been studied by Taylor (1955) and Johnson et al. (1972), and was visited by Day in 2005,
following reports of renewed fumarolic activity in 2004. This crater forms the center of a
recent edifice that has filled in both a northeast facing lateral collapse scar and a
southwest facing one (Fig. 14). The summit of the island to the northwest of the crater

ACC
EPTE
D M
ANU
SCR
IPT
ACCEPTED MANUSCRIPT
11 7/8/2009
and the northwest flank are the oldest and most deeply eroded parts of the island. An
unconformity in the sequence exposed in the southwest wall of the summit crater may
correspond to part of the headwall of the latter (or to a more recent thin – skinned
landslide scar similar to the 2002 landslide on Stromboli), but there is no equivalent
unconformity on the northeast side, indicating that the north-eastern collapse scar is more
deeply buried and therefore older. A single scoria cone occurs on the north-eastern flank
of the island, on the same trend as the submarine structures on the flank of the volcano,
but all other volcanic activity seems to have been centered on the summit of the island.
Bam has no fringing reefs, perhaps due to the frequent tephra falls from the
island. A distinct notch about 10 m below sea level and a few hundred meters wide was
observed on the boat echo-sounder off the north and northwest of the island during the
visit in 2005, but not to the northeast offshore from the lateral collapse scar. Its absence
there may have been produced by erosion of the intact flanks of the island both before
and after the collapse, as the collapse scar was filling with the more recent edifice. This
process would bury any erosional notch developed within the collapse scar.
Bam has had a long record of historical eruptions recorded since 1872. Most
reports have been restricted to small-to-moderate explosive activity from the summit
crater, but the inhabitants have an oral tradition of a major eruption leading to many
deaths and the temporary evacuation of the island about seven generations before 2005,
so most probably in the mid-1800s. Thick sequences of fresh airfall lapilli and lapilli
alluvium occur on the north coast, while the summit is formed by only partly vegetated
welded spatter and clast-rich lavas. Steam plumes and fumarolic activity occur along
fracture systems both within the summit crater and around its rim. Beginning in 2004, a
new set of arcuate, en echelon fractures has opened between the summit crater and the
western sidewall of the northeast – facing collapse scar (Fig. 14). Fumarolic activity
along these fractures was reported in 2004 and was continuing at the time of onshore
fieldwork in 2005 when boiling sounds at depth within the fractures were heard,
indicating that they are deep – seated features rather than superficial slope creep features.
No standing or boiling water is present on the floor of the summit crater, indicating that
the fractures are ~200 meters deep or greater.

ACC
EPTE
D M
ANU
SCR
IPT
ACCEPTED MANUSCRIPT
12 7/8/2009
Our bathymetry and side-scan imagery indicate a zone of blocks and high
backscatter 30 km2 in area to the south and southwest of Bam (Fig. 13). The large blocks
are imaged to distances up to 10 km from the coastline. The main patch of large blocks
lies to the southwest of the island, and smaller groups of blocks appear to be associated
with drainages leading off to the west. Another zone of material flow from the island is
seen to the northeast of Bam, mostly as large drainage channels and levees. A pair of
small volcanic cones occurs to the north of the island, and several smaller cones are off to
the northeast (Fig. 13).
4.11 Kadovar
Kadovar (Fig. 12 and 13) is located south of Blupblup and 25 km north from the
Sepik river mouth. The island is only 1.5 km long and wide, but has an elevation of 365
m. It is a Holocene stratovolcano dominated by andesitic scoria and lavas, but with a
large lava dome forming the summit and occupying a possible south – facing collapse
structure. Wallace et al. (1981) reported 3 phases of development of Kadovar. First the
build-up of a steep, low-silica andesite cone; second, development of a summit crater that
later breached to the south; and third, development of a high-silica andesite cumulo-dome
within the breached crater. Fumarolic activity was reported in the early 1900’s and
recommenced in 1976, when all residents of the island were temporarily evacuated, but
they returned soon after. The fumerolic and seismic activity in 1976-78 killed all the
vegetation in the main thermal zone (Wallace et al., 1981). The island has no fringing
reefs and is not highly dissected, though the outer slopes consist of resistant, thick lava
flows (Johnson et al., 1972).
Offshore data shows zones of moderate backscatter and small blocks south of
Kadovar (Fig. 13) covering an area of 20 km2, and low backscatter with occasional
blocks to the north. The region to the south records a debris avalanche, very likely the
deposit from the breached crater that formed during the island’s second stage of
development. The timing of the collapse is not reported. High amplitude streaks radiate
out from the island in the subsurface, and these are younger than the debris avalanche
deposits.
4.12 Blupblup

ACC
EPTE
D M
ANU
SCR
IPT
ACCEPTED MANUSCRIPT
13 7/8/2009
Blupblup (Fig. 12 and 13) is the emergent summit of a stratovolcano with an
irregular shape, dimensions of 2 km by 3.5 km for the part above sea level, and a summit
elevation of 402 m. The island is deeply eroded and has well developed fringing reefs and
a lagoon on the northwestern side, in addition to a circular drowned crater on the
southwest side between the main island and a small islet. These features suggest that the
island has undergone significant subsidence since the end of the main period of growth of
the volcano. However, discrete scoria cones and craters are present including one with a
crater lake at the eastern end of the island. These cones and craters suggest that an earlier
main period of volcanic activity was followed by intermittent, monogenetic eruptions
(Johnson et al., 1972); no historic eruptions have been recorded although the scoria cones
may be Holocene in age. A thermal area is reported on the western shore (Johnson et al.,
1972), and another is present on the north coast. Blupblup has a zone of large blocks but
relatively low backscatter to the NE of the island (Fig. 13), covering an area of
approximately 15 km2. No collapse scar is evident onshore, although the shape of the
island suggests removal of the south side of the caldera, which could indicate a past
collapse event (Fig. 13). The Bismarck Sea Seismic Lineation can be seen trending east-
west just to the north of Bam and Blupblup (Fig. 12), and activity on this feature might
act as a trigger for sector collapse. We see no evidence for a debris field to the south of
the island.
5. Discussion: Estimating Sizes of Debris Avalanches and Tsunami Potential
Knowledge of the volume of debris avalanches is critical for constraining the size
of tsunamis generated by the avalanche. For all collapse features discussed here except
for Ritter Island we do not have direct information on volumes, but we can estimate areas
using the side-scan and multi-beam images. We attempt to constrain volume by using a
range of likely average thicknesses. The numbers given here are very rough
approximations, but are likely to underestimate the size of the collapse in terms of
thickness. We measure the area of a debris avalanche deposit by mapping regions of
disturbed sea-floor and exotic blocks. Sources of error include the difficulty in
distinguishing single from multiple debris avalaches, and possible inclusion of debris
flows that have bulked up considerably with clasts ripped from the existing sea-floor

ACC
EPTE
D M
ANU
SCR
IPT
ACCEPTED MANUSCRIPT
14 7/8/2009
(Silver et al., 2005; Day et al., in prep.). We are able to map the debris flows from Ritter,
and we have tried to correct for the “bulk-up” effect. The older collapse events do not
clearly show these deposits in the side-scan imagery, and thus are not likely to include
this aspect as an error. Uncertainties in measuring the volumes of debris avalanches can
also be significant. We estimate volume by using the area and considering the average
thickness of the deposit. Thicknesses reported for debris avalanches in the literature from
island arc volcanoes vary from a few meters to half a kilometer (Boudon et al., 2007;
Satake and Kato, 2001; Crandell et al., 1984; Chiocci and Alteriis, 2006). Very few
studies have produced seismic images that grid the deposit clearly, so most estimates are
subject to significant error. Some estimates of volume use that of the observable slide
scar, but in many cases the original shape of the volcano was not well-known.
The volume of the Ritter collapse, 4.6 km3, was computed from the published
sketch of the volcano before collapse, and scaling that by matching features presently
existing on the island (Ward and Day, 2003; Silver et al., 2005). Dividing this volume by
the area of the present field of debris avalanche blocks (100 km2) gives an average
thickness of 46 m. The areas for Kadovar, Bam, and Crown (south) are about 20% or less
of the area of Ritter, and we used several different average thicknesses to determine a
range of possibilities.
These results can be compared with sector collapses measured elsewhere in the
world. Examples are from Japan, the Lesser Antilles, the Aleutians, and the
Mediterranean (Table 1). We see no relationship in Table 1 between thickness and area or
volume of these collapses, and thus cannot infer thickness from another measurement.
Since thickness is a key parameter in estimating tsunami height and run-up, we use a
conservative estimate and a range of thicknesses from 10-60 m or so in each case,
including the higher end for larger collapse areas. The range of numbers for each collapse
is reasonable for tsunamis generated by fast moving landslides. In the case of Ritter
Island we know the landslide motion was indeed rapid and the effects were observed by
people at or near the time of the event. However, we can’t say that each of these collapses
was similarly rapid, and thus the ranges given are on the high end. A slow collapse event
would be a very inefficient tsunami source and so generate minimal wave energy.

ACC
EPTE
D M
ANU
SCR
IPT
ACCEPTED MANUSCRIPT
15 7/8/2009
We can estimate the potential amplitude and run-up of tsunami expected from the
collapses in Table 3, using the following formulas (from Ward and Day, 2003; Ward and
Asphaug, 2003). The amplitude A(R) at a distance R from the source is: T(1+2R/D)-φ,
where
φ = 0.5+0.57e(-0.0175D/Ho)
T = Thickness of the unit
R= Distance of measurement point from the source
D = (4*Area/pi)1/2
The run-up from the tsunami is A(R)0.8Ho0.2, where Ho represents water depth of the
slide event.
The values run-up are corrected for geometrical and dispersive spreading, and
therefore apply at any distance. The inputs are thickness of deposit, T, water depth, Ho,
area of deposit, and distance, R. The other terms are computed from these inputs. The
calculations for run-up are not very sensitive to water depth, but they are directly
proportional to deposit thickness, T. Varying the thickness of these deposits between 10
m and 40 m more than doubles the computed run-up.
At least 12 discernable debris avalanches were emplaced within Bismarck
volcanic arc. While a number of these are relatively small features, such as the unnamed
seamount near Lolobau or the small collapses south of Crown, Bam and Kadovar islands,
it is clear that they have the potential for significant run-up and hazard for local coastal
towns, such as Wewak, Bogia, Hoskins and Madang. Six of the events discussed here are
likely to have produced run-ups of over 2 m in the Madang area, and several may have
produced run-ups that exceeded 7-8 meters (Table 2). We estimate the run-up of the
Ritter collapse on Sakar and West New Britain as 42 and 22 m, respectively, and direct
observations made on these islands a few years after the collapse reported that trees were
stripped from the islands to an elevation of 15 meters. It is known that trees can withstand
some meters of run-up, so these numbers are within a reasonable range.
These numbers are on the conservative side (assuming fast-moving flows).
Increasing the average thickness of the debris avalanche deposit to 50 meters for
Tolokiwa and Crown North produces tsunami run-up in excess of 10 meters each at
Madang, and thicknesses of 150 m would result in run-ups exceeding 25 meters. These

ACC
EPTE
D M
ANU
SCR
IPT
ACCEPTED MANUSCRIPT
16 7/8/2009
same average thicknesses off Garove would produce run-ups at Hoskins of 9 meters and
21 meters, respectively. Also, we used a water-depth of 500 meters for each of these
collapses. Greater depths decrease the size of the ensuing tsunami whereas shallower
depths will increase the size.
Volcano collapse is only part of the tsunami hazard that impacts Papua New
Guinea. The 1998 tsunami that killed over 1600 people in the Aitape-Sissano region of
NW PNG (Davies et al., 2003; H. Davies, written commun., 2008) was reportedly
generated by a large submarine landslide (Tappin et al., 2001; Synolakis et al., 2002;
Sweet and Silver, 2003). Papua New Guinea is also vulnerable to tsunami generated on
large subduction zones in the Western and Northern Pacific basin, as well as to large
events along the Solomon Sea subduction system. Both the distant subduction events and
local submarine slides confer vulnerability on coastal regions that are otherwise quite
distant from the effects of volcano collapse. However, the 1888 AD Ritter Island collapse
killed a reported several hundred people on adjacent coastlines, and produced significant
damage at distances up to 600 km (Cooke, 1981). Increased coastal populations mean
that tsunamis generated by future lateral collapses in the Bismarck Arc are liable to
produce much greater numbers of casualties, so volcanoes that are showing indications of
flank instability such as Bam and possibly Manam need careful monitoring.
6. Conclusions
We have identified 12 debris avalanche deposits from 11 volcanoes in the
Bismarck volcanic arc, using multi-beam and side-scan imagery. The areas of these
deposits range from 15 to 150 km2, and each of these may have been the potential source
of significant tsunami events. We have estimated the potential run-up at Madang for 6
tsunamis, and several each at Wewak, Hoskins and Bogia from local events. Even some
of the smaller events may have had a significant impact locally. The time span over
which these events occurred is not known. Additional tsunami from submarine landslides
and distant subduction thrust events significantly increase the total tsunami hazard in
PNG.
7. Acknowledgements

ACC
EPTE
D M
ANU
SCR
IPT
ACCEPTED MANUSCRIPT
17 7/8/2009
We thank the captain, crew and scientific party of the R/V Kilo Moana for their
support in obtaining the data presented here. We also thank the excellent technical staff
of HMRG for their efforts in acquiring and processing the swath bathymetry and MR1
side-scan data at sea. We are very grateful to Hugh Davies and Jim Robins for their
continued support of our studies in PNG, and to Davies, Russell Blong, Michelle Coombs
and Wally Johnson for their reviews and comments on this paper. This work was funded
by NSF grant OCE-0327004 to Silver and Ward.
9. References Cited
Abbott, L. D., E. A. Silver, and J. Galewsky. 1994. Structural evolution of a modern arc-
continent collision in Papua New Guinea, Tectonics, 13(5), 1007–1034.
Abers, G., and R. McCaffrey, 1988. Active deformation in the New Guinea fold-and-
thrust belt: Seismological evidence for strike-slip faulting and basement-involved
thrusting, Journal of Geophysical Research. 93, 13,332-13,354.
Abers, G.A., and S. Roecker. 1991. Deep structure of an arc-continent collision:
Earthquake relocation and inversion for upper mantle P and S wave velocities beneath
Papua New Guinea, J. Geophys. Res. 96,6379-6401.
Blong, R.L., 1982. The Time of Darkness. Australian National University Press,
Canberra. 257 p.
Boudon, G., Le Friant, A., Komorowski, J-C., Deplus, C., and Semet, M.P., 2007.
Volcano flank instability in the Lesser Antilles arc: diversity of scale, processes, and
temporal recurrence. J. Geophys. Res. B08205: doi:10.1029/2006JB004674.
Chiocci, F.L., and de Alteriis, G., 2006. The Ischia debris avalanche: first clear
submarine evidence in the Mediterranean of a volcanic island prehistorical collapse.
Terra Nova. 18: 202-209.
Cooke, R.J.S., Johnson, R.W., 1978. Volcanoes and volcanology in Papua New Guinea.
Geol Surv Papua New Guinea Rpt. 2: 1-46.
Cooke, R.J.S., Johnson, R.W., 1981. Bam volcano: morphology, geology, and reported
eruptive history. Geol Surv Papua New Guinea Mem. 10: 13-22.
Coombs, M.L., White, S.M., and Scholl, D.W., 2007. Massive edifice failure at Aleutian
arc volcanoes. Earth and Planetary Science Letters. 256: 403-418.

ACC
EPTE
D M
ANU
SCR
IPT
ACCEPTED MANUSCRIPT
18 7/8/2009
Cooper, P. and B. Taylor. 1987. Seismotectonics of New Guinea: A model for arc
reversal following arc-continent collision, Tectonics. 6: 53-67.
Crandell, D.R., Miller, C.D., Glicken, H.X., Christiansen, R.L., and Newhall, C.G., 1984.
Catastrophic debris avalanche from ancient Mount Shasta volcano, California. Geology.
12: 143-146.
Davies, H.L., Davies, J.M., Perembo, R.C.B, and Lus, W.Y., 2003. The Aitape 1998
Tsunami: Reconstructing the Event from Interviews and Field Mapping. Pure appl.
geophys. 160: 1895–1922.
Davies, H.L., J.B. Keene, K. Hashimoto, M. Joshima, J.E. Stuart, and D.L. Tiffin. 1987.
Bathymetry and canyons of the west Solomon Sea. Geo-Marine Letters, 6:181-191.
Gill, J.B., Morris, J.D., and Johnson, R.W., 1993. Timescale for producing the
geochemical signature of island arc magmas: U-Th-Po and Be-B systematics in recent
Papua New Guinea lavas. Geochim. Cosmochim. Acta. 57: 4269-4283.
Glicken, H., 1996. Rockslide-debris avalanche of May 18, 1980 Mount St. Helens
volcano, Washington. US Geological Survey Open-file Report 96-677, 90 pp.
Johnson, R.W., 1987. Large-scale volcanic cone collapse: the 1888 slope failure of Ritter
volcano, and other examples from Papua New Guinea. Bull Volcanol. 49: 669-679.
Johnson, R.W., Taylor, G.A.M., Davies, R.A., 1972. Geology and petrology of
Quaternary volcanic islands off the north coast of New Guinea. Aust Bur Min Resour
Geol Geophys Rec. 21: 1-127.
Llanes, P., E. Silver, S. Day, and G. Hoffman, 2009. Interactions between a transform
fault and arc volcanism in the Bismarck Sea, Papua New Guinea. Geochem. Geophys.
Geosyst. doi:10.1029/2009GC002430, in press.
Lowder, G.G., Carmichael, I.S.E., 1970. The volcanoes and caldera of Talasea, New
Britain: geology and petrology. Geol Soc Amer Bull. 81: 17-38.
Machida, H., Blong, R.J., Specht, J., Moriwaki, H., Torrence, R., Hayakawa, Y., Talai,
B., Lolok, D., and Pain, C.F., 1996. Holocene explosive eruptions of Witori and
Dakatau caldera volcanoes in west New Britain, Papua New Guinea. Quat Internatl.
34-36: 65-78.

ACC
EPTE
D M
ANU
SCR
IPT
ACCEPTED MANUSCRIPT
19 7/8/2009
Masson, D.G., Watts, A.B., Gee, M.J.R., Urgeles, R., Mitchell, N.C., Le Bas, T.P., and
Canals, M., 2002. Slope failures on the flanks of the western Canary Islands. Earth-
Science Reviews. 57: 1–35.
Masson, D.G., Le Bas, T.P., Grevemeyer, I. & Weinrebe, W., 2008. Flank collapse and
large scale landsliding in the Cape Verde Islands, off West Africa. Geochem. Geophys.
Geosystems, 9; Q07015, doi:10.1029/2008GC001983
McKee, C.O., Cooke, R.J.S., and Wallace, D.A., 1976. 1974-75 eruptions of Karkar
volcano, Papua New Guinea. In: Johnson, R.W., ed., Volcanism in Australasia.
Elsevier, Amsterdam, 173-190.
Moore, J.G., Clague, D.A., Holcomb, R.T., Lipman, P.W., Normark, W.R, and Torresan,
M.E., 1989. Prodigious submarine landslides on the Hawaiian Ridge. J. Geophys. Res.,
94: 17,465-17,484.
Neall, V.E., Wallace, R.C., and Torrence, R., 2008. The volcanic environment for 40,000
years of human occupation on the Willaumez Isthmus, West New Britain, Papua New
Guinea. J. Volc. and Geothermal Res. doi:10.1016/j.jvolgeores.2008.01.037
Newhall, C.G., Dzurisin, D., 1988. Historical unrest at large calderas of the world. U S
Geol Surv Bull 1855: 1108 p, 2 vol.
Palfreyman, W.D., and Cooke, R.J.S., 1976. Eruptive history of Manam volcano, Papua
New Guinea. In: Johnson, R.W., Editor. Volcanism in Australasia. Elsevier,
Amsterdam. 117-131.
Satake, K., and Kato, Y., 2001. The 1741 Oshima-Oshima eruption: Extent and volume
of submarine debris avalanche. Geophys. Res. Lett. 28: 427-430.
Silver, E.A., Abbott, L.D., Kirchoff-Stein, K.S., Reed, D.L., Bernstein-Taylor, B., and
Hilyard, D. 1991. Collision propagation in Papua New Guinea and the Solomon Sea.
Tectonics, 10. 863–874.
Silver, E.A., and 16 others, 2005. Island arc debris avalanches and tsunami generation.
EOS Transactions, American Geophysical Union 86: 485-489.
Smith, W.H.F., and Sandwell, D.T., 1997. Global Sea Floor Topography from Satellite
Altimetry and Ship Depth Soundings. Science 277: 1956-1962.

ACC
EPTE
D M
ANU
SCR
IPT
ACCEPTED MANUSCRIPT
20 7/8/2009
Sweet, S., and Silver, E.A., 2003. Tectonics and slumping in the source region of the
1998 Papua New Guinea tsunami from seismic reflection images. Pure Appl. Geophys.,
160: 1945-1968.
Synolakis, C., Bardet, J.-P., Borrero, J., Davies, H., Okal, E., Silver, E., Sweet, S., and
Tappin, D., 2002. The Slump Origin of the 1998 Papua New Guinea Tsunami. Proc.
Roy. Soc. London A458: 763–789.
Tappin, D.R., Watts, P., McMurty, G.M., Lafoy, Y., and Matsumoto, T., 2001. The
Sissano, Papua New Guinea Tsunami of July 1998 – Offshore Evidence of the Source
Mechanism. Marine Geology 175: 1–23.
Taylor, B., 1979. Bismarck Sea: evolution of a back-arc basin. Geology, 7: 171-174.
Taylor, G.A., 1955. Report on Bam Island volcano and an inspection of Kadovar and
Blup Blup. Aust Bur Min Res. Geol Geophys Rec, 73: 1-9
Tregoning, P., McQueen, H., Lambeck, K., Jackson, R., Little, R., Saunders, S., and
Rosa, R., 2000. Present-day crustal motion in Papua New Guinea. Earth Planets Space,
52: 727–730.
United Nations. The International Decade for Natural Disaster Reduction. New York:
United Nations, December 1987. (United Nations General Assembly Resolution
42/160.A/RES/ 42/169.11).
Wallace, D.A., Cooke, R.J.S., Dent, V.F., Norris, D.J., Johnson, R.W., 1981. Kadovar
volcano and investigations of an outbreak of thermal activity in 1976. Geol Surv Papua
New Guinea Mem. 10: 1-12.
Wallace, L., Stevens, C., Silver, E., McCaffrey, R., Loratung, W., Hasiata, S., Stanaway,
R., Curley, R., Rosa, R, and Taugaliode, J., 2004. GPS and seismological constraints on
active tectonics and arc-continent collision in Papua New Guinea: Implications for
mechanics of microplate rotations in a plate boundary zone. J. Geophys. Res., 109:
B05404.
Ward, S.N., and Day, S., 2003. Ritter Island Volcano—lateral collapse and the tsunami of
1888. Geophys. J. Int. 154: 891–902.
Ward, S.N., and Asphaug, E., 2003. Asteroid impact tsunami of 2880 March 16.
Geophys. J. Int., 153: F6–F10.

ACC
EPTE
D M
ANU
SCR
IPT
ACCEPTED MANUSCRIPT
21 7/8/2009
Watts, A.B., and Masson, D.G., 1995. A giant landslide on the north flank of Tenerife,
Canary Islands, J. Geophys. Res. 100: 24487-24498.
Wright, I.C., Worthington, T.J, and Gamble, J.A., 2006, New multibeam mapping and
geochemistry of the 308–358 S sector, and overview, of southern Kermadec arc
volcanism. J. Volcanol, and Geothermal Res. 149: 263-296.

ACC
EPTE
D M
ANU
SCR
IPT
ACCEPTED MANUSCRIPT
22 7/8/2009
Table 1. Sizes of selected sector collapses globally. 1) Satake and Kato, 2003. 2) Coombs et al., 2007. 3) Boudon et al., 2007. 4) Chiocci and Alteris, 2006. Name Area Volume Thickness Oshima-Oshima (Japan)1: 70 km2 2.5 km3 36 m Garaloi (Aleutians)2: 95 km2 1 km3 10 m Kanaga (Aleutians) 2: 230 km2 --- 100 m Kiska (Aleutians) 2: 200 km2 --- 300 m Pelee 1 (L. Antilles)3: 1100 km2 25 km3 22 m Pelee 2 (L. Antilles) 3: 700 km2 13 km3 19 m Pelee 3 (L. Antilles) 3: 60 km2 2 km3 33 m Kick ’em Jenny (L. Antilles)3: 67 km2 10 km3 150 m Ischia (Mediterranean)4: 250-300 km2 --- 6 m
Table 2. Estimated run-up for 12 debris avalanches, computed at Madang, Wewak, Bogia, and Hoskins. Also shown are estimated run-up and amplitude for the Ritter collapse at Sakar and West New Britain (WNB).
Volcano T Ho A R Run-up Town Thickness Depth Area Distance (meters)
Ritter 46 m 500 m 100 km2 25 km 22 WNB Ritter 46 m 500 m 100 km2 7 km 42 Sakar Ritter 46 m 500 m 100 km2 266 km 5 Madang Tolokiwa 20-60 m 500 m 145 km2 200 km 6.4+/-1.7 Madang Garove 20-60 m 500 m 100 km2 422 km 3+/-1.3 Madang Crown-N 20-60 m 500 m 100 km2 133 km 7+/-1.8 Madang Crown-S 10-40 m 500 m 20 km2 133 km 2+/1 Madang Sakar 10-50 m 500 m 40 km2 250 km 2+/-1 Madang Karkar 10-30 m 300 m 50 km2 50 km 5+/-2 Madang Kadovar 10-40 m 500 m 20 km2 110 km 2.5+/-1.2 Wewak Bam 10-40 m 500 m 30 km2 110 km 1.6+/-0.8 Wewak Dakataua 10-30 m 300 m 30 km2 70 km 3.5+/-1.5 Hoskins Garove 10-25 m 500 m 100 km2 166 km 6+/-2.2 Hoskins Seamount 5-10 m 300 m 15 km2 100 km 1+/-0.1 Hoskins Manam 10-30 m 300 m 30 km2 15 km 9.5+/-4 Bogia

ACC
EPTE
D M
ANU
SCR
IPT
ACCEPTED MANUSCRIPT
23 7/8/2009
10. Figure Captions, Figures and Tables
Figure 1. Location of volcanoes (circles) on topography (bathymetry) of the Papua New Guinea region, showing locations of figures used in the text, as well as significant tectonic features of the region. East to west Lo: Lolobau Island; WP: Willaumez Peninsula; B-T-PA Mts: Bewani-Torricelli-Prince Alexander Mountains. Bathymetry from Smith and Sandwell (1997). The towns of Hoskins, Madang, Bogia and Wewak are used to consider potential tsunami risk in Table 2.

ACC
EPTE
D M
ANU
SCR
IPT
ACCEPTED MANUSCRIPT
24 7/8/2009
Figure 2. Detailed side-scan imagery of debris field (dotted line) north of an unnamed seamount offshore East New Britain. Located on Fig. 1.

ACC
EPTE
D M
ANU
SCR
IPT
ACCEPTED MANUSCRIPT
25 7/8/2009
Figure 3. Detailed side-scan imagery north of Lolabau and Ulawun volcanoes, and topography of those volcanoes. Dotted line surrounds a debris field. Topography from SRTM data. 5’ of latitude = 9.3 km.

ACC
EPTE
D M
ANU
SCR
IPT
ACCEPTED MANUSCRIPT
26 7/8/2009
Figure 4. Shaded surface bathymetry of the Witu islands and the Willaumez Peninsula. Located on Fig. 1.

ACC
EPTE
D M
ANU
SCR
IPT
ACCEPTED MANUSCRIPT
27 7/8/2009
Figure 5. Detail of side scan imagery and bathymetry of Garove island and vicinity. Dotted line outlines debris avalanche deposits. 5’ of latitude = 9.3 km . Located on Fig. 1.

ACC
EPTE
D M
ANU
SCR
IPT
ACCEPTED MANUSCRIPT
28 7/8/2009
Figure 6. Detail of side-scan imagery surrounding Dakataua volcano. Dotted line surrounds debris avalanche deposit. 5’ of latitude = 9.3 km. Located on Fig. 1.

ACC
EPTE
D M
ANU
SCR
IPT
ACCEPTED MANUSCRIPT
29 7/8/2009
Figure 7. Detailed side-scan imagery around Umboi, Ritter and Sakar Islands. Dotted lines surround debris avalanches. 5’ of latitude = 9.3 km. Located on Fig. 1.
ACC
EPTE
D M
ANU
SCR
IPT
ACCEPTED MANUSCRIPT
30 7/8/2009
Figure 8. Detail of side-scan imagery north of Tolokiwa Island. Dotted line surrounds debris avalanche deposit. 5’ of latitude = 9.3 km. Located on Fig. 1.

ACC
EPTE
D M
ANU
SCR
IPT
ACCEPTED MANUSCRIPT
31 7/8/2009
Figure 9. Detail of side-scan and bathymetry data for region around Crown Island. Dotted lines north and south of Crown outline debris avalanche deposits. 5’ of latitude = 9.3 km. Located on Fig. 1.

ACC
EPTE
D M
ANU
SCR
IPT
ACCEPTED MANUSCRIPT
32 7/8/2009
Figure 10. Detailed side-scan imagery around Karkar and Bagabag islands. Dotted lines surround inferred debris avalanche deposit. 5’ of latitude = 9.3 km. Located on Fig. 1.

ACC
EPTE
D M
ANU
SCR
IPT
ACCEPTED MANUSCRIPT
33 7/8/2009
Figure 11. Side-scan (top) and shaded relief (bottom) imagery around Manam Island. Dotted line surrounds debris avalanche. 5’ of latitude = 9.3 km. Located on Fig. 1.

ACC
EPTE
D M
ANU
SCR
IPT
ACCEPTED MANUSCRIPT
34 7/8/2009
Figure 12. Shaded relief bathymetry of the Schouten Islands and Manam Island, showing the Bismarck Sea Seismic Lineation (BSSL) and part of the Sepik River and its offshore drainage. 15’ of latitude = 27.8 km. Located on Fig. 1.

ACC
EPTE
D M
ANU
SCR
IPT
ACCEPTED MANUSCRIPT
35 7/8/2009
Figure 13. Detailed side-scan imagery surrounding Bam, Kadovar and Blupblup islands. Dotted lines surround debris avalanche deposits. 5’ of latitude = 9.3 km. Located on Fig. 1.

ACC
EPTE
D M
ANU
SCR
IPT
ACCEPTED MANUSCRIPT
36 7/8/2009
Figure 14. Map views of Bam island, including fracture systems near summit, based on observations by Simon Day, August, 2005.
Related Documents


