Monitoring volcanic hazard using eddy covariance at Solfatara volcano, Naples, Italy C. Werner a; , G. Chiodini b , D. Voigt c , S. Caliro b , R. Avino b , M. Russo b , T. Brombach b , J. Wyngaard d , S. Brantley c a Institute of Geological and Nuclear Sciences, Private Bag 2000, Taupo, New Zealand b Osservatorio Vesuviano, via Diocleziano 328, 80124 Naples, Italy c Department of Geosciences, The Pennsylvania State University, University Park, PA 16802, USA d Meteorology Department, The Pennsylvania State University, University Park, PA 16802, USA Received 20 August 2002; received in revised form 19 February 2003; accepted 28 February 2003 Abstract An eddy covariance (EC) station was deployed at Solfatara crater, Italy, June 8^25, 2001 to assess if EC could reliably monitor CO 2 fluxes continuously at this site. Deployment at six different locations within the crater allowed areas of focused gas venting to be variably included in the measured flux. Turbulent (EC) fluxes calculated in 30-min averages varied between 950 and 4460 g CO 2 m 32 d 31 ; the highest measurements were made downwind of degassing pools. Comparing turbulent fluxes with chamber measurements of surface fluxes using footprint models in diffuse degassing regions yielded an average difference of 0% ( ɔ 4%), indicating that EC measurements are representative of surface fluxes at this volcanic site. Similar comparisons made downwind of degassing pools yielded emission rates from 12 to 27 t CO 2 d 31 for these features. Reliable EC measurements (i.e. measurements with sufficient and stationary turbulence) were obtained primarily during daytime hours (08:00 and 20:00 local time) when the wind speed exceeded 2 m s 31 . Daily average EC fluxes varied by ɔ 50% and variations were likely correlated to changes in atmospheric pressure. Variations in CO 2 emissions due to volcanic processes at depth would have to be on the same order of magnitude as the measured diurnal variability in order to be useful in predicting volcanic hazard. First-order models of magma emplacement suggest that emissions could exceed this rate for reasonable assumptions of magma movement. EC therefore provides a useful method of monitoring volcanic hazard at Solfatara. Further, EC can monitor significantly larger areas than can be monitored by previous methods. ȣ 2003 Elsevier Science B.V. All rights reserved. Keywords: eddy covariance; volcanic; carbon dioxide; hydrothermal; degassing; £ux; emissions 1. Introduction Carbon dioxide emissions are often monitored in volcanic and hydrothermal areas in order to assess hazard [1^3]. Increases in CO 2 degassing have been documented following dike emplace- ments and prior to volcanic eruptions [4,5], and 0012-821X / 03 / $ ^ see front matter ȣ 2003 Elsevier Science B.V. All rights reserved. doi :10.1016/S0012-821X(03)00127-4 * Corresponding author. Tel.: +64-07-376-0139; Fax: +64-07-374-8119. E-mail address: [email protected] (C. Werner). Earth and Planetary Science Letters 210 (2003) 561^577 www.elsevier.com/locate/epsl

Welcome message from author
This document is posted to help you gain knowledge. Please leave a comment to let me know what you think about it! Share it to your friends and learn new things together.
Transcript
Monitoring volcanic hazard using eddy covariance atSolfatara volcano, Naples, Italy
C. Werner a;�, G. Chiodini b, D. Voigt c, S. Caliro b, R. Avino b, M. Russo b,T. Brombach b, J. Wyngaard d, S. Brantley c
a Institute of Geological and Nuclear Sciences, Private Bag 2000, Taupo, New Zealandb Osservatorio Vesuviano, via Diocleziano 328, 80124 Naples, Italy
c Department of Geosciences, The Pennsylvania State University, University Park, PA 16802, USAd Meteorology Department, The Pennsylvania State University, University Park, PA 16802, USA
Received 20 August 2002; received in revised form 19 February 2003; accepted 28 February 2003
Abstract
An eddy covariance (EC) station was deployed at Solfatara crater, Italy, June 8^25, 2001 to assess if EC couldreliably monitor CO2 fluxes continuously at this site. Deployment at six different locations within the crater allowedareas of focused gas venting to be variably included in the measured flux. Turbulent (EC) fluxes calculated in 30-minaverages varied between 950 and 4460 g CO2 m32 d31 ; the highest measurements were made downwind of degassingpools. Comparing turbulent fluxes with chamber measurements of surface fluxes using footprint models in diffusedegassing regions yielded an average difference of 0% (: 4%), indicating that EC measurements are representative ofsurface fluxes at this volcanic site. Similar comparisons made downwind of degassing pools yielded emission ratesfrom 12 to 27 t CO2 d31 for these features. Reliable EC measurements (i.e. measurements with sufficient andstationary turbulence) were obtained primarily during daytime hours (08:00 and 20:00 local time) when the windspeed exceeded 2 m s31. Daily average EC fluxes varied by : 50% and variations were likely correlated to changes inatmospheric pressure. Variations in CO2 emissions due to volcanic processes at depth would have to be on the sameorder of magnitude as the measured diurnal variability in order to be useful in predicting volcanic hazard. First-ordermodels of magma emplacement suggest that emissions could exceed this rate for reasonable assumptions of magmamovement. EC therefore provides a useful method of monitoring volcanic hazard at Solfatara. Further, EC canmonitor significantly larger areas than can be monitored by previous methods.> 2003 Elsevier Science B.V. All rights reserved.
Keywords: eddy covariance; volcanic; carbon dioxide; hydrothermal; degassing; £ux; emissions
1. Introduction
Carbon dioxide emissions are often monitoredin volcanic and hydrothermal areas in order toassess hazard [1^3]. Increases in CO2 degassinghave been documented following dike emplace-ments and prior to volcanic eruptions [4,5], and
0012-821X / 03 / $ ^ see front matter > 2003 Elsevier Science B.V. All rights reserved.doi:10.1016/S0012-821X(03)00127-4
* Corresponding author. Tel. : +64-07-376-0139;Fax: +64-07-374-8119.
E-mail address: [email protected] (C. Werner).
EPSL 6605 5-5-03
Earth and Planetary Science Letters 210 (2003) 561^577
www.elsevier.com/locate/epsl
estimates of CO2 emissions have recently beenused as a proxy for magma emplacement rates[6]. An accurate estimation of CO2 degassing involcanic and hydrothermal regions can be di⁄-cult, however, due to the spatial and temporalvariability of emissions. Faults and fractures oftenact as conduits, leading to spatial variability ofemissions [7,8], and temporal variability of emis-sions has been linked to changes in meteorologicalconditions [9,10]. Continuous measurement of£ux at a single location (6 1 m2) can elucidatethe temporal variations, but might not providesu⁄cient information for predicting hazard in vol-canic regions where gas escapes over large areas(km2). Hence, new methods for continuous mea-surement of volcanic emissions over large regionsare needed.Recent studies have suggested that eddy cova-
riance (EC) provides a reliable and complementa-ry technique for measuring di¡use emissions involcanic regions [11,12]. Although new to the geo-logic community, EC has been extensively utilizedin studies of biospheric^atmospheric exchange ofCO2 and other trace gases (e.g. FLUXNET) [13].The advantages of using EC over the ground-based techniques are that the measurement is (1)made above the surface, which does not disturbnatural emissions, (2) continuous, and (3) repre-sentative of a spatial average of £uxes over theupwind source area [14,15]. However, the volcanicenvironment is potentially too extreme for ECmeasurements because volcanic regions oftenhave signi¢cant topographic relief, CO2 emissionsdisplay extreme spatial heterogeneity, and groundheat £uxes are typically elevated in volcanic envi-ronments.In this study we investigate if EC provides a
viable technique for continuous monitoring ofCO2 £uxes at Solfatara volcano located withinthe Campi Flegrei caldera (Naples, Italy). Wechose Solfatara because the area seemed suitableto EC measurements (i.e. £at terrain, V200^300m homogeneous upwind fetch, 6 15% slope), andbecause emissions and chemistry of volcanic gaseshave been extensively monitored at Solfatara forover 30 years [16,17]. We compare EC measure-ments with chamber measurements made upwindof the EC tower during the same sampling period
to demonstrate that EC provides reliable esti-mates of volcanic £uxes of CO2. The di¡erencesbetween EC and surface measurements are usedto estimate emissions from degassing pools for the¢rst time using this technique. The daily variabil-ity of EC measurements is used to assess the levelof volcanic emissions necessary to exceed back-ground variability at Solfatara, and ¢nally, wediscuss recommendations for the implementationof EC for continuous monitoring at this and othervolcanic sites.
2. Geologic setting and current monitoring
Solfatara was last volcanically active between3.8 and 4.1 ka, but phreatic eruptions occurredas recently as the 12th century. The most recentvolcanic activity in Campi Flegrei was the 1538eruption at Monte Nuovo (an eruptive volume of0.04 km3 over 10 days) [18], which was precededby several meters of uplift over a few decades [19].Several periods of seismic unrest and uplift (‘bra-dyseism’) occurred since 1970, each resulting inuplift up to 1.5 m. With the exception of the ¢rstcrisis, when no geochemical data were available,each episode was accompanied by changes of thechemical composition of the fumaroles [8,16,20],and suggest that unrest is likely the result of in-creased heat input at the base of the hydrothermalaquifers [8,19]. Increases in heat are thought toultimately originate from either the magma cham-ber, or the mantle, inferred at V5 and 25 km,respectively [21].Solfatara crater has steep walls (dips 70‡) on
the north, east, and south sides [8]. To the westthe crater wall is missing. The crater £oor is £at(6 1.5 m of relief over V500 m), hosts a largearea of intense di¡use degassing (0.5 km2), andcontains a few degassing pools (the Fangaia,Fig. 1). Several high-temperature fumaroles(140^160‡C) also exist near the SE crater wall[18]. CO2 and energy £uxes are periodically mea-sured using the chamber method over a samplingarray that covers 0.5 km2 of the crater £oor(Fig. 1), and CO2 £ux is measured hourly by apermanent instrument. According to Chiodini etal. [8], Solfatara releases a total of V1500 t CO2
EPSL 6605 5-5-03
C. Werner et al. / Earth and Planetary Science Letters 210 (2003) 561^577562
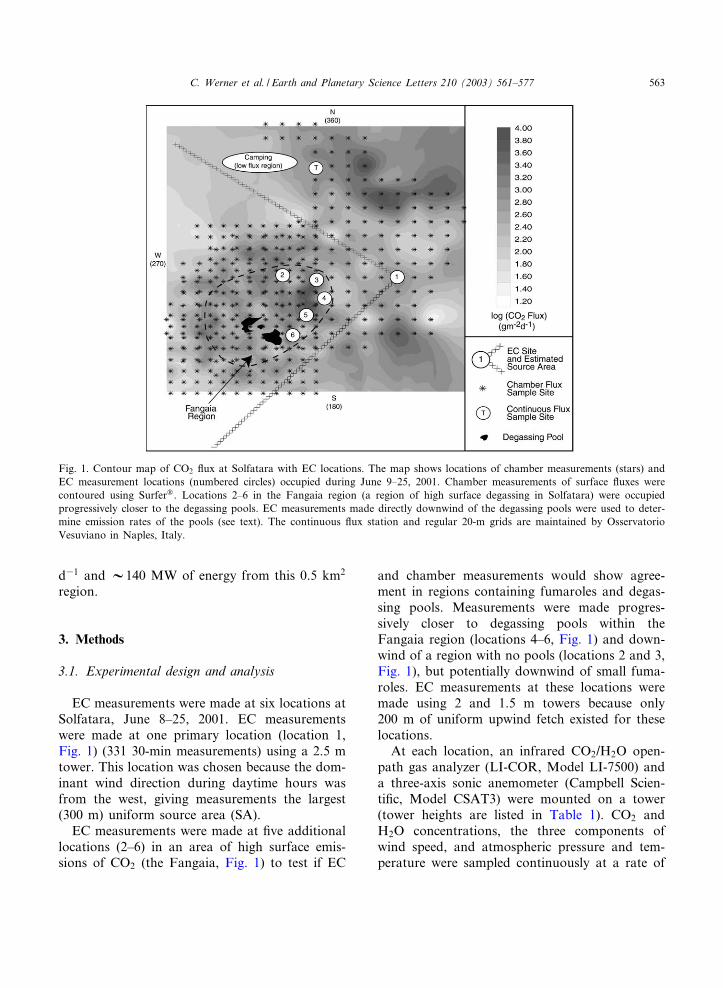
d31 and V140 MW of energy from this 0.5 km2
region.
3. Methods
3.1. Experimental design and analysis
EC measurements were made at six locations atSolfatara, June 8^25, 2001. EC measurementswere made at one primary location (location 1,Fig. 1) (331 30-min measurements) using a 2.5 mtower. This location was chosen because the dom-inant wind direction during daytime hours wasfrom the west, giving measurements the largest(300 m) uniform source area (SA).EC measurements were made at ¢ve additional
locations (2^6) in an area of high surface emis-sions of CO2 (the Fangaia, Fig. 1) to test if EC
and chamber measurements would show agree-ment in regions containing fumaroles and degas-sing pools. Measurements were made progres-sively closer to degassing pools within theFangaia region (locations 4^6, Fig. 1) and down-wind of a region with no pools (locations 2 and 3,Fig. 1), but potentially downwind of small fuma-roles. EC measurements at these locations weremade using 2 and 1.5 m towers because only200 m of uniform upwind fetch existed for theselocations.At each location, an infrared CO2/H2O open-
path gas analyzer (LI-COR, Model LI-7500) anda three-axis sonic anemometer (Campbell Scien-ti¢c, Model CSAT3) were mounted on a tower(tower heights are listed in Table 1). CO2 andH2O concentrations, the three components ofwind speed, and atmospheric pressure and tem-perature were sampled continuously at a rate of
Fig. 1. Contour map of CO2 £ux at Solfatara with EC locations. The map shows locations of chamber measurements (stars) andEC measurement locations (numbered circles) occupied during June 9^25, 2001. Chamber measurements of surface £uxes werecontoured using Surfer0. Locations 2^6 in the Fangaia region (a region of high surface degassing in Solfatara) were occupiedprogressively closer to the degassing pools. EC measurements made directly downwind of the degassing pools were used to deter-mine emission rates of the pools (see text). The continuous £ux station and regular 20-m grids are maintained by OsservatorioVesuviano in Naples, Italy.
EPSL 6605 5-5-03
C. Werner et al. / Earth and Planetary Science Letters 210 (2003) 561^577 563
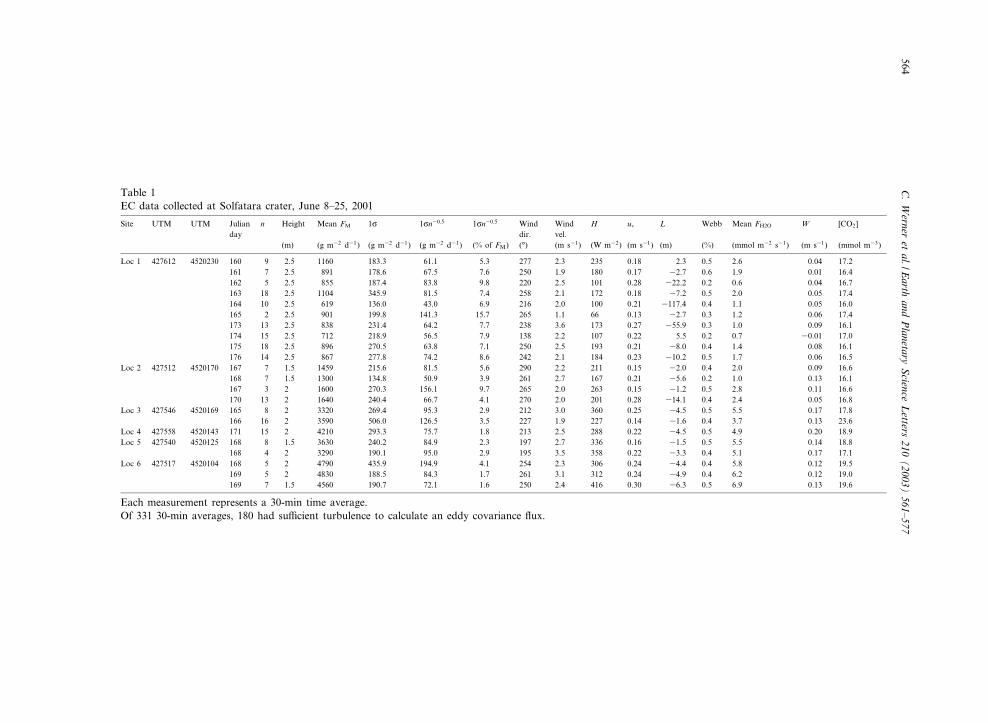
Table 1EC data collected at Solfatara crater, June 8^25, 2001
Site UTM UTM Julianday
n Height Mean FM 1c 1cn30:5 1cn30:5 Winddir.
Windvel.
H u� L Webb Mean FH2O W [CO2]
(m) (g m32 d31) (g m32 d31) (g m32 d31) (% of FM) (‡) (m s31) (W m32) (m s31) (m) (%) (mmol m32 s31) (m s31) (mmol m33)
Loc 1 427612 4520230 160 9 2.5 1160 183.3 61.1 5.3 277 2.3 235 0.18 2.3 0.5 2.6 0.04 17.2161 7 2.5 891 178.6 67.5 7.6 250 1.9 180 0.17 32.7 0.6 1.9 0.01 16.4162 5 2.5 855 187.4 83.8 9.8 220 2.5 101 0.28 322.2 0.2 0.6 0.04 16.7163 18 2.5 1104 345.9 81.5 7.4 258 2.1 172 0.18 37.2 0.5 2.0 0.05 17.4164 10 2.5 619 136.0 43.0 6.9 216 2.0 100 0.21 3117.4 0.4 1.1 0.05 16.0165 2 2.5 901 199.8 141.3 15.7 265 1.1 66 0.13 32.7 0.3 1.2 0.06 17.4173 13 2.5 838 231.4 64.2 7.7 238 3.6 173 0.27 355.9 0.3 1.0 0.09 16.1174 15 2.5 712 218.9 56.5 7.9 138 2.2 107 0.22 5.5 0.2 0.7 30.01 17.0175 18 2.5 896 270.5 63.8 7.1 250 2.5 193 0.21 38.0 0.4 1.4 0.08 16.1176 14 2.5 867 277.8 74.2 8.6 242 2.1 184 0.23 310.2 0.5 1.7 0.06 16.5
Loc 2 427512 4520170 167 7 1.5 1459 215.6 81.5 5.6 290 2.2 211 0.15 32.0 0.4 2.0 0.09 16.6168 7 1.5 1300 134.8 50.9 3.9 261 2.7 167 0.21 35.6 0.2 1.0 0.13 16.1167 3 2 1600 270.3 156.1 9.7 265 2.0 263 0.15 31.2 0.5 2.8 0.11 16.6170 13 2 1640 240.4 66.7 4.1 270 2.0 201 0.28 314.1 0.4 2.4 0.05 16.8
Loc 3 427546 4520169 165 8 2 3320 269.4 95.3 2.9 212 3.0 360 0.25 34.5 0.5 5.5 0.17 17.8166 16 2 3590 506.0 126.5 3.5 227 1.9 227 0.14 31.6 0.4 3.7 0.13 23.6
Loc 4 427558 4520143 171 15 2 4210 293.3 75.7 1.8 213 2.5 288 0.22 34.5 0.5 4.9 0.20 18.9Loc 5 427540 4520125 168 8 1.5 3630 240.2 84.9 2.3 197 2.7 336 0.16 31.5 0.5 5.5 0.14 18.8
168 4 2 3290 190.1 95.0 2.9 195 3.5 358 0.22 33.3 0.4 5.1 0.17 17.1Loc 6 427517 4520104 168 5 2 4790 435.9 194.9 4.1 254 2.3 306 0.24 34.4 0.4 5.8 0.12 19.5
169 5 2 4830 188.5 84.3 1.7 261 3.1 312 0.24 34.9 0.4 6.2 0.12 19.0169 7 1.5 4560 190.7 72.1 1.6 250 2.4 416 0.30 36.3 0.5 6.9 0.13 19.6
Each measurement represents a 30-min time average.Of 331 30-min averages, 180 had su⁄cient turbulence to calculate an eddy covariance £ux.
EPSL
66055-5-03
C.W
erneret
al./Earth
andPlanetary
Science
Letters
210(2003)
561^577564
20 measurements per second. Turbulent £uxes(FM) of CO2, H2O, and temperature were eachcalculated as the temporal covariance of the scalar(c) with vertical wind velocities (w) for 30-minintervals :
FM ¼ w0c0 ð1Þ
where the prime (P) indicates instantaneous devia-tions about the mean variable [14].Misalignment of the anemometer was corrected
following the axis rotation procedure of [14]. TheWebb correction was applied for both heat and
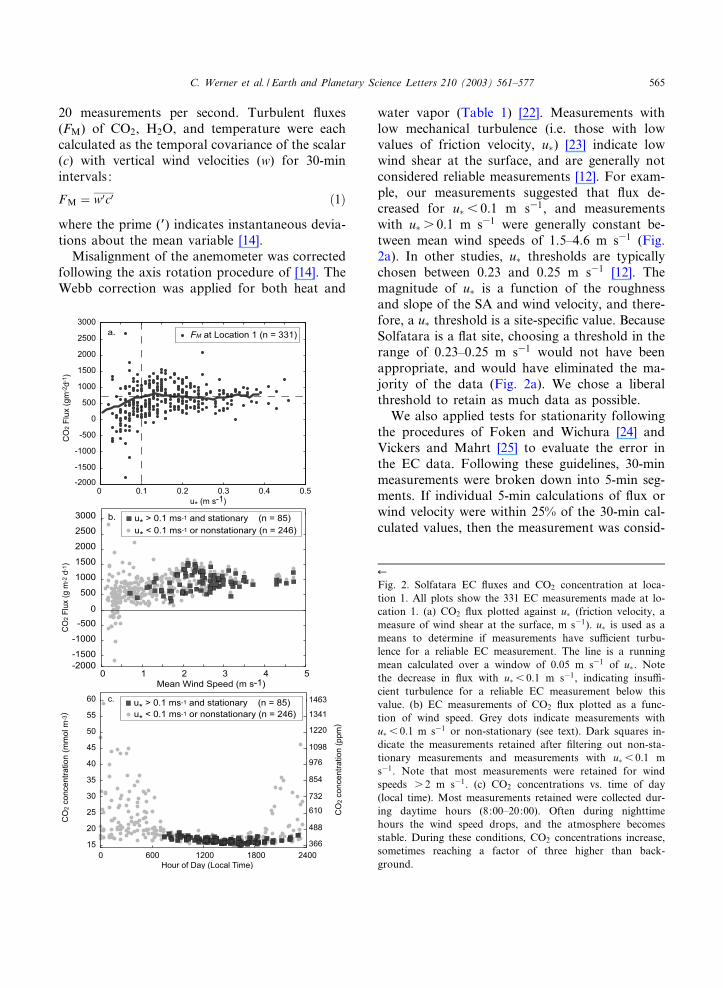
water vapor (Table 1) [22]. Measurements withlow mechanical turbulence (i.e. those with lowvalues of friction velocity, u�) [23] indicate lowwind shear at the surface, and are generally notconsidered reliable measurements [12]. For exam-ple, our measurements suggested that £ux de-creased for u� 6 0.1 m s31, and measurementswith u� s 0.1 m s31 were generally constant be-tween mean wind speeds of 1.5^4.6 m s31 (Fig.2a). In other studies, u� thresholds are typicallychosen between 0.23 and 0.25 m s31 [12]. Themagnitude of u� is a function of the roughnessand slope of the SA and wind velocity, and there-fore, a u� threshold is a site-speci¢c value. BecauseSolfatara is a £at site, choosing a threshold in therange of 0.23^0.25 m s31 would not have beenappropriate, and would have eliminated the ma-jority of the data (Fig. 2a). We chose a liberalthreshold to retain as much data as possible.We also applied tests for stationarity following
the procedures of Foken and Wichura [24] andVickers and Mahrt [25] to evaluate the error inthe EC data. Following these guidelines, 30-minmeasurements were broken down into 5-min seg-ments. If individual 5-min calculations of £ux orwind velocity were within 25% of the 30-min cal-culated values, then the measurement was consid-
6
Fig. 2. Solfatara EC £uxes and CO2 concentration at loca-tion 1. All plots show the 331 EC measurements made at lo-cation 1. (a) CO2 £ux plotted against u� (friction velocity, ameasure of wind shear at the surface, m s31). u� is used as ameans to determine if measurements have su⁄cient turbu-lence for a reliable EC measurement. The line is a runningmean calculated over a window of 0.05 m s31 of u�. Notethe decrease in £ux with u� 6 0.1 m s31, indicating insu⁄-cient turbulence for a reliable EC measurement below thisvalue. (b) EC measurements of CO2 £ux plotted as a func-tion of wind speed. Grey dots indicate measurements withu� 6 0.1 m s31 or non-stationary (see text). Dark squares in-dicate the measurements retained after ¢ltering out non-sta-tionary measurements and measurements with u� 6 0.1 ms31. Note that most measurements were retained for windspeeds s 2 m s31. (c) CO2 concentrations vs. time of day(local time). Most measurements retained were collected dur-ing daytime hours (8:00^20:00). Often during nighttimehours the wind speed drops, and the atmosphere becomesstable. During these conditions, CO2 concentrations increase,sometimes reaching a factor of three higher than back-ground.
EPSL 6605 5-5-03
C. Werner et al. / Earth and Planetary Science Letters 210 (2003) 561^577 565
ered stationary. Measurements that failed statio-narity tests, or low-turbulence measurements(u� 6 0.1 m s31) were not included in average dai-ly values (Table 1), but are included in the ¢guresin this paper to demonstrate how including thesedata in analyses could a¡ect results.
3.2. Surface £ux measurements
Accumulation chamber measurements of dif-fuse CO2 degassing (E) were performed over adetailed 15-m and a regularly-sampled 20-m gridduring the same period as the EC measurements[26] (Table 2 and Fig. 1). In addition to the grids,temporal variability of CO2 £ux, atmosphericpressure, air temperature, soil temperature, soilmoisture, and wind velocity were measured hourlyat the continuous £ux station (Fig. 1).
3.3. Comparing EC and chamber measurementsusing footprint models
EC measurements are representative of theweighted average of the upwind surface £ux[27,28], where locations closer to the EC towerare more likely to be represented by the EC mea-surement than locations further from the tower.For this reason, EC measurements cannot be di-rectly compared to the average of surface mea-surements upwind of the tower in regions of het-erogeneous £ux; rather, the contribution of eachelement of the upwind surface to the EC measure-ment must be determined. This contribution iscalled the ‘footprint’ (f), which can be modeledbased on the meteorological conditions duringthe EC measurement. The footprint function f isde¢ned over the SA. The upwind extent of the SAwas chosen to be 100zm for each measurement,where zm is the measurement height [14], andthe lateral extent was chosen as 4cy =4 cvx/U,where x is the upwind distance along the meanwind (U) trajectory, and cv is the root meansquare lateral wind velocity. Surface £uxes ofCO2 (E) and f were assigned to every mean-wind (x) and cross-wind (y) location within theSA in 5-m increments following the proceduresin Werner et al. [11]. If the surface £ux had notbeen measured within 25 m of the SA location
(typically at the edge of the thermal region), abackground value of 30 g m32 d31 was assigned[8]. The convolution of surface chamber measure-ments of CO2 £ux (E) with the footprint (f) ateach x and y location results in a predicted £ux(FP) :
FP ¼R R
Eðx0; y0Þf ðx3x0; y3y0; zmÞdx0dy0 ð2Þ
that theoretically should correspond to the mea-sured EC £ux (FM). Further, the integral of f overall x and y in the SA should equal 1 [28,29]. Weused the analytical footprint model of [28,29] tocalculate FP to be consistent with our previouswork [11].Comparisons between predicted CO2 £uxes (FP)
solved from Eq. 2 and the EC measurements ofCO2 £ux (FM�CO2, hereinafter referred to as FM)were made for 162 (49%) of the 331 measurementsat location 1 and for 60 measurements for loca-tions 2^6. During periods of weak and variablemean wind speeds, the lateral extent of the SAsometimes exceeded : 90‡ about the mean windtrajectory. Such a large SA does not result in anunreliable £ux, but such measurements are notsuitable for footprint calculations. Thus, compar-isons between FM and FP were not performed forthese measurements (25% of location-1 measure-ments). Comparisons were also not made if thewinds were from the east, where the upwind fetchwas not uniform with respect to topography forlocation 1 (26% of location-1 measurements), andwas not the area of interest for locations 2^6.Comparisons were made, however, for EC mea-surements that were below the u� =0.1 m s31
threshold, and also for measurements that wereconsidered non-stationary to determine if ECmeasurements during these conditions consis-tently over- or underestimated predicted £uxes.
4. Results
4.1. Meteorological conditions
Wind speeds varied between 0.09 and 4.71 ms31 and were bimodally distributed with dominantdirections centered at S70W (250‡) and N80E(80‡). Daytime winds were almost exclusively
EPSL 6605 5-5-03
C. Werner et al. / Earth and Planetary Science Letters 210 (2003) 561^577566
from the southwest, averaging S54W (234‡).Nighttime winds were from both dominant direc-tions, but easterly winds occurred primarily atnight. Only one short precipitation event occurredduring the measurement campaign, but this eventdid not signi¢cantly wet surface soils.
4.2. EC £uxes of CO2 (FM)
Turbulent £uxes of CO2 (FM) varied between31800 and 2800 g m32 d31 at location 1 (Fig.2a). Fluxes measured at mean wind speeds 6 1.5m s31 tended to decrease and become more vari-able, and negative £uxes were measured duringperiods of low wind speeds (6 0.5 m s31, Fig.2b). Typically unreliable £uxes were measuredduring nighttime hours when the mean CO2 con-centration increased up to a factor of three abovetypical daytime values (Fig. 2c). Eliminating non-stationary measurements and measurements withu� 6 0.1 m s31 resulted in average 30-min £uxesthat varied between 350 and 1500 g m32 d31 atlocation 1, and uniform mean CO2 concentrations(squares in Fig. 2c). Daily mean FM at location 1varied from 619 ( : 136) to 1160 ( : 183) g m32
d31 after screening for non-stationary and low-u�measurements (Table 1).Daily mean FM in the Fangaia region (locations
2^6, Fig. 1) were elevated with respect to FM atlocation 1. Fluxes increased progressively fromlocation 2 to location 6 as the thermal pools in
the Fangaia region were included in the SA of theEC measurement (Table 1). The highest EC mea-surements (4560^4830 g m32d31) were measuredat location 6, or directly downwind of a degassingpool (location 6, Fig. 1). Measurements of sensi-ble heat were slightly higher at the locations di-rectly downwind of thermal features, as werewater vapor £uxes, unrotated mean vertical veloc-ities, and mean CO2 concentrations (Table 1). Thecontribution to £ux due to the Webb correctionremained a constant percentage of the measuredEC £ux (Table 1).
4.3. Surface £uxes of CO2 (E)
Chamber measurements of surface CO2 £uxes(E) varied between 18 and 22 760 g m32 d31 (Ta-ble 2 and Fig. 1) depending on location withinSolfatara. The average £ux of the 20-m grid(n=203) was 1730: 222 g m32 d31, and the aver-age of the 15-m grid (n=176) in the southwestregion of Solfatara was 1120: 188 g m32 d31
(Fig. 1). The error expressed here is the standarderror of the mean de¢ned as 1c=
ffiffiffin
p. Fluxes varied
over several orders of magnitude over spatialscales of meters (Fig. 1).The daily mean CO2 £ux measured hourly at
the permanent station varied between 420 and 470g m32 d31 during the measurement campaign.The standard error of the daily mean £ux wastypically less than 4% of the mean value (Table 3).
Table 2Range and mean of chamber £uxes measured over the 200-pt. grid, 1997^2001a
Date n Max. ECO2 Min. ECO2 Mean ECO2 1cn30:5 1cn30:5
(g m32 d31) (g m32 d31) (g m32 d31) (g m32 d31) (% of E)
Apr-97 193 60 530 24 3190 614 19May-97 195 90 650 14 3230 709 22Jun-97 189 122 800 1 4490 1004 22Jul-97 200 106 500 22 4260 737 17Jan-98 199 40 850 2 2860 420 15Apr-98 201 128 600 1 3510 827 24Aug-98 204 45 120 8 2960 400 14Oct-98 201 48 360 17 3690 561 15May-99 200 82 430 7 2480 524 21Jun-99 200 75 050 1 1720 400 23Jan-00 201 62 490 4 3320 536 16Aug-00 198 42 410 10 2170 345 16Jun-01 202 22 760 18 1730 222 13a Data collected by G. Chiodini.
EPSL 6605 5-5-03
C. Werner et al. / Earth and Planetary Science Letters 210 (2003) 561^577 567
4.4. Comparison of EC £uxes (FM) with predicted£uxes from chamber measurements (FP)
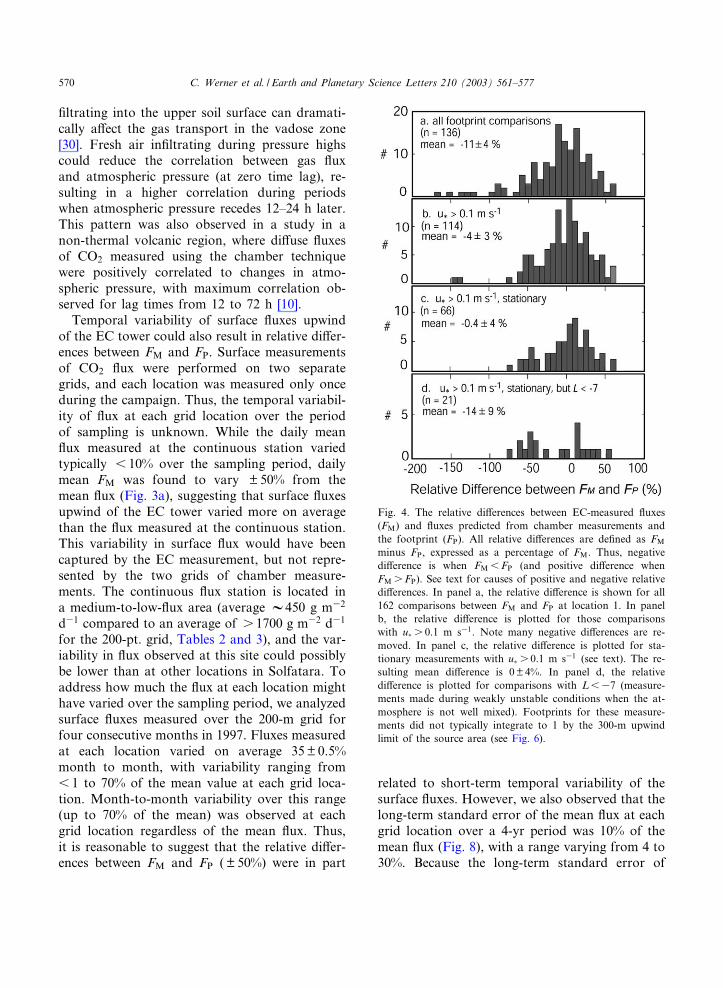
The relative di¡erences between EC-measured
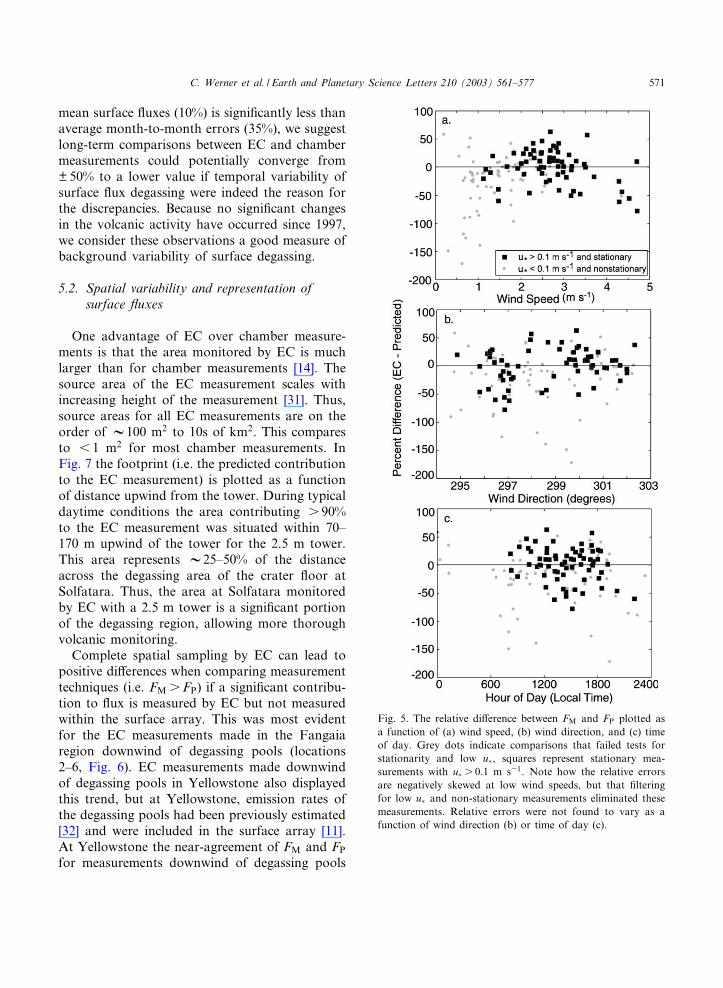
£uxes (FM) and predicted £uxes based on cham-ber measurements (FP) at location 1 were centeredabout zero (Fig. 4a), but negatively skewed. Therelative di¡erence was de¢ned as the EC-mea-sured £ux (FM) minus the predicted £ux (FP).The relative di¡erences were normalized by FMand expressed as a percentage. Thus, negative rel-ative di¡erences represent FM6FP, or EC £uxesthat were less than predicted £uxes calculatedfrom chamber measurements. Many of the casesin which FM was more than 50% lower than FPwere eliminated by ¢ltering out non-stationaryEC measurements and measurements withu� 6 0.1 m s31 (Fig. 4b,c). These measurementsgenerally correlated with wind speeds 6 2 m s31
(Fig. 5a), indicating that there was not enoughturbulence for a reliable EC measurement. Theresulting mean di¡erence after ¢ltering was0: 4% (mean: standard error of mean) (Fig.4c). The relative di¡erences between FM and FPwere not found to vary with wind direction orwith time of day (Figs. 5b,c) either before or after¢ltering.EC measurements at locations 2^6 were made
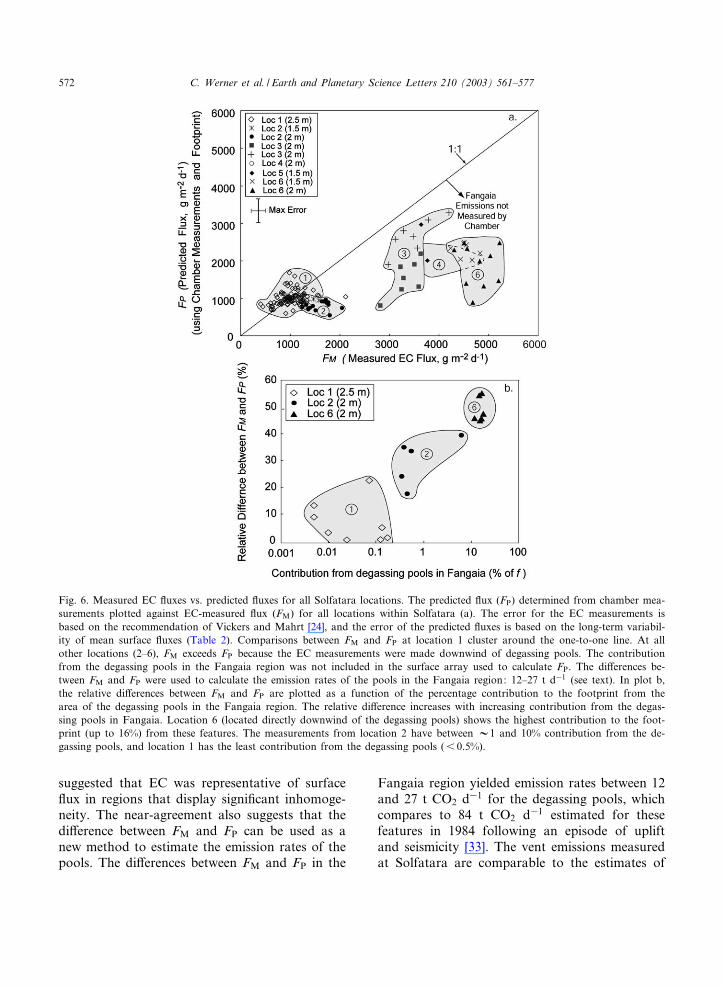
primarily during daytime hours, and the relativedi¡erences between FM and FP from locations 2^6were not found to vary as a function of windspeed or time of day. The relative di¡erences be-tween FM and FP were 18^82%, depending onlocation (Fig. 6a). Higher di¡erences corre-sponded to FM that contained a large percentageof the degassing pools within the source area. Forexample, FM from location 6 was found to haves 12% of the footprint derived from the Fangaiadegassing pools and displayed the largest di¡er-ences with FP. Smaller di¡erences were calculatedat locations far from degassing pools, and duringmeasurement periods when winds blew on averagefrom directions away from the degassing pools(e.g. location 2, Fig. 6b). For example, typicallyless than 0.5% of the footprint for FM at location2 derived from regions containing the degassingpools; however, one measurement at location 2resulted in nearly 10% (Fig. 6b). For comparison,FM from location 1 typically had 6 1% contribu-tion from the degassing pools, and on averageshowed the lowest relative di¡erence between FMand FP (Fig. 6b).
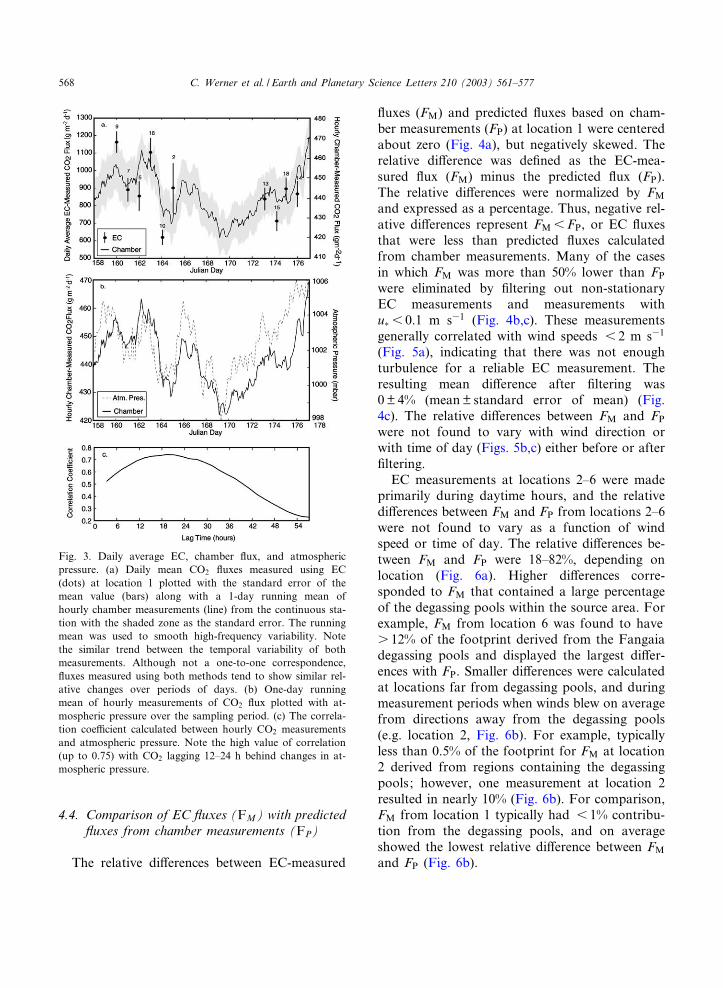
Fig. 3. Daily average EC, chamber £ux, and atmosphericpressure. (a) Daily mean CO2 £uxes measured using EC(dots) at location 1 plotted with the standard error of themean value (bars) along with a 1-day running mean ofhourly chamber measurements (line) from the continuous sta-tion with the shaded zone as the standard error. The runningmean was used to smooth high-frequency variability. Notethe similar trend between the temporal variability of bothmeasurements. Although not a one-to-one correspondence,£uxes measured using both methods tend to show similar rel-ative changes over periods of days. (b) One-day runningmean of hourly measurements of CO2 £ux plotted with at-mospheric pressure over the sampling period. (c) The correla-tion coe⁄cient calculated between hourly CO2 measurementsand atmospheric pressure. Note the high value of correlation(up to 0.75) with CO2 lagging 12^24 h behind changes in at-mospheric pressure.
EPSL 6605 5-5-03
C. Werner et al. / Earth and Planetary Science Letters 210 (2003) 561^577568
5. Discussion
Both the general consistency between FM andFP (Fig. 4c) and between the temporal variabilityof daily mean FM (location 1) with chamber £uxmeasurements at the continuous station (Fig. 3a)indicate that EC provides a reliable means tomonitor CO2 emissions continuously over largeregions of Solfatara. The successful implementa-tion of EC at Solfatara is largely due to the factthat winds typically come from the west to south-west during daytime hours (i.e. not obstructed bythe crater walls), and because the crater £oor ofSolfatara is large (V500 m across) and displayslittle relief (6 1%). However, because EC mea-surements of £ux were typically only reliable dur-ing daytime hours when wind speeds were s 1.5m s31, EC complements, but cannot replace, themonitoring capability of continuous chambermeasurements. We turn now to discussion of thetemporal and spatial variability observed in£uxes, how each type of variability a¡ects thecomparisons between measurement techniques,and how EC could be employed to detect hazardsrelated to volcanic and hydrothermal activity.
5.1. Temporal variability of £uxes
In order to assess the capacity of EC to detectchanges in CO2 £ux with increases in volcanicactivity, we must ¢rst document background var-iability during periods of quiescent degassing.Variations in the daily mean FM at location 1were consistent with variations observed in the1-day running mean of hourly CO2 £uxes (Fig.3a). Further, hourly CO2 £uxes measured withthe chamber were positively correlated withchanges in atmospheric pressure (Fig. 3b) with amaximum correlation at lag periods between 12and 24 h (Fig. 3c). While it is not possible todirectly compare the variability in FM withchanges in atmospheric pressure due to missingmeasurements, the correlation of both signalswith the mean hourly chamber measurements sug-gests that variability in FM (Fig. 3a) also relates tochanges in atmospheric pressure (Fig. 3b). Whilefurther work will be necessary to fully explain therelation between atmospheric pressure and gas£ux in geothermal regions where soil permeabil-ities are heterogeneous over scales of m2 to km2,previous studies have indicated that fresh air in-
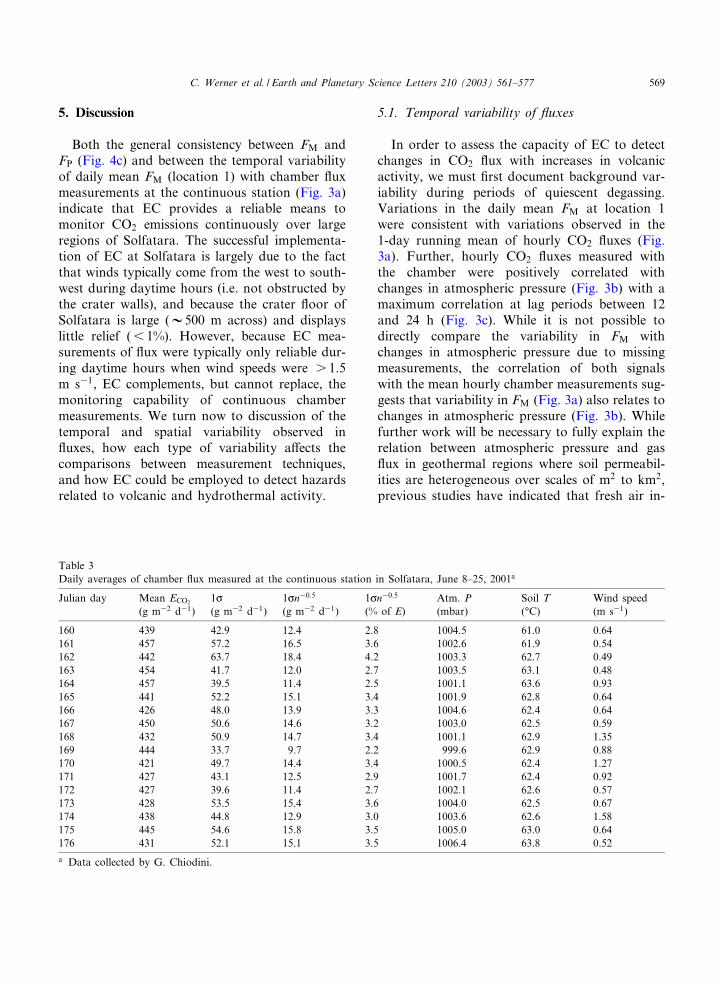
Table 3Daily averages of chamber £ux measured at the continuous station in Solfatara, June 8^25, 2001a
Julian day Mean ECO2 1c 1cn30:5 1cn30:5 Atm. P Soil T Wind speed(g m32 d31) (g m32 d31) (g m32 d31) (% of E) (mbar) (‡C) (m s31)
160 439 42.9 12.4 2.8 1004.5 61.0 0.64161 457 57.2 16.5 3.6 1002.6 61.9 0.54162 442 63.7 18.4 4.2 1003.3 62.7 0.49163 454 41.7 12.0 2.7 1003.5 63.1 0.48164 457 39.5 11.4 2.5 1001.1 63.6 0.93165 441 52.2 15.1 3.4 1001.9 62.8 0.64166 426 48.0 13.9 3.3 1004.6 62.4 0.64167 450 50.6 14.6 3.2 1003.0 62.5 0.59168 432 50.9 14.7 3.4 1001.1 62.9 1.35169 444 33.7 9.7 2.2 999.6 62.9 0.88170 421 49.7 14.4 3.4 1000.5 62.4 1.27171 427 43.1 12.5 2.9 1001.7 62.4 0.92172 427 39.6 11.4 2.7 1002.1 62.6 0.57173 428 53.5 15.4 3.6 1004.0 62.5 0.67174 438 44.8 12.9 3.0 1003.6 62.6 1.58175 445 54.6 15.8 3.5 1005.0 63.0 0.64176 431 52.1 15.1 3.5 1006.4 63.8 0.52a Data collected by G. Chiodini.
EPSL 6605 5-5-03
C. Werner et al. / Earth and Planetary Science Letters 210 (2003) 561^577 569
¢ltrating into the upper soil surface can dramati-cally a¡ect the gas transport in the vadose zone[30]. Fresh air in¢ltrating during pressure highscould reduce the correlation between gas £uxand atmospheric pressure (at zero time lag), re-sulting in a higher correlation during periodswhen atmospheric pressure recedes 12^24 h later.This pattern was also observed in a study in anon-thermal volcanic region, where di¡use £uxesof CO2 measured using the chamber techniquewere positively correlated to changes in atmo-spheric pressure, with maximum correlation ob-served for lag times from 12 to 72 h [10].Temporal variability of surface £uxes upwind
of the EC tower could also result in relative di¡er-ences between FM and FP. Surface measurementsof CO2 £ux were performed on two separategrids, and each location was measured only onceduring the campaign. Thus, the temporal variabil-ity of £ux at each grid location over the periodof sampling is unknown. While the daily mean£ux measured at the continuous station variedtypically 6 10% over the sampling period, dailymean FM was found to vary : 50% from themean £ux (Fig. 3a), suggesting that surface £uxesupwind of the EC tower varied more on averagethan the £ux measured at the continuous station.This variability in surface £ux would have beencaptured by the EC measurement, but not repre-sented by the two grids of chamber measure-ments. The continuous £ux station is located ina medium-to-low-£ux area (average V450 g m32
d31 compared to an average of s 1700 g m32 d31
for the 200-pt. grid, Tables 2 and 3), and the var-iability in £ux observed at this site could possiblybe lower than at other locations in Solfatara. Toaddress how much the £ux at each location mighthave varied over the sampling period, we analyzedsurface £uxes measured over the 200-m grid forfour consecutive months in 1997. Fluxes measuredat each location varied on average 35: 0.5%month to month, with variability ranging from6 1 to 70% of the mean value at each grid loca-tion. Month-to-month variability over this range(up to 70% of the mean) was observed at eachgrid location regardless of the mean £ux. Thus,it is reasonable to suggest that the relative di¡er-ences between FM and FP ( : 50%) were in part
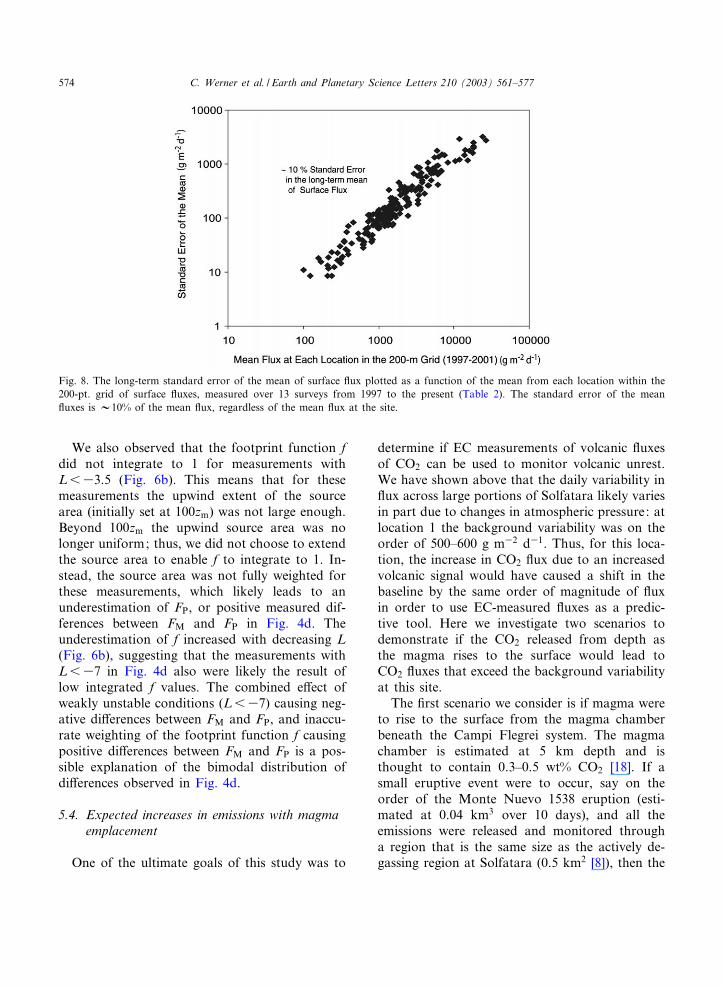
related to short-term temporal variability of thesurface £uxes. However, we also observed that thelong-term standard error of the mean £ux at eachgrid location over a 4-yr period was 10% of themean £ux (Fig. 8), with a range varying from 4 to30%. Because the long-term standard error of
Fig. 4. The relative di¡erences between EC-measured £uxes(FM) and £uxes predicted from chamber measurements andthe footprint (FP). All relative di¡erences are de¢ned as FMminus FP, expressed as a percentage of FM. Thus, negativedi¡erence is when FM6FP (and positive di¡erence whenFMsFP). See text for causes of positive and negative relativedi¡erences. In panel a, the relative di¡erence is shown for all162 comparisons between FM and FP at location 1. In panelb, the relative di¡erence is plotted for those comparisonswith u� s 0.1 m s31. Note many negative di¡erences are re-moved. In panel c, the relative di¡erence is plotted for sta-tionary measurements with u� s 0.1 m s31 (see text). The re-sulting mean di¡erence is 0 : 4%. In panel d, the relativedi¡erence is plotted for comparisons with L637 (measure-ments made during weakly unstable conditions when the at-mosphere is not well mixed). Footprints for these measure-ments did not typically integrate to 1 by the 300-m upwindlimit of the source area (see Fig. 6).
EPSL 6605 5-5-03
C. Werner et al. / Earth and Planetary Science Letters 210 (2003) 561^577570
mean surface £uxes (10%) is signi¢cantly less thanaverage month-to-month errors (35%), we suggestlong-term comparisons between EC and chambermeasurements could potentially converge from:50% to a lower value if temporal variability ofsurface £ux degassing were indeed the reason forthe discrepancies. Because no signi¢cant changesin the volcanic activity have occurred since 1997,we consider these observations a good measure ofbackground variability of surface degassing.
5.2. Spatial variability and representation ofsurface £uxes
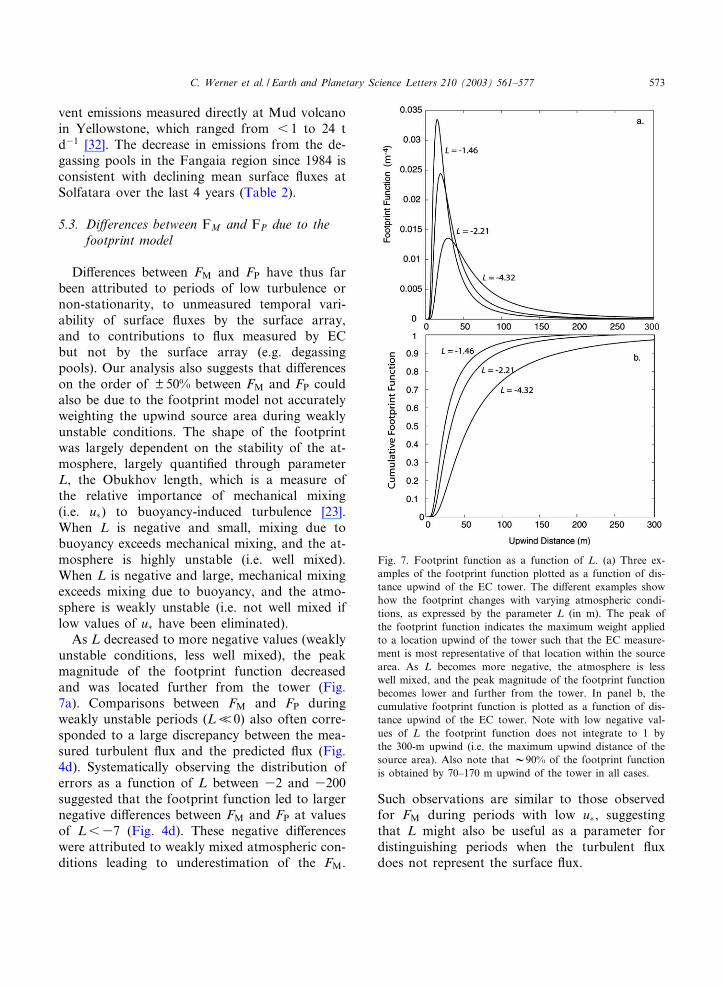
One advantage of EC over chamber measure-ments is that the area monitored by EC is muchlarger than for chamber measurements [14]. Thesource area of the EC measurement scales withincreasing height of the measurement [31]. Thus,source areas for all EC measurements are on theorder of V100 m2 to 10s of km2. This comparesto 6 1 m2 for most chamber measurements. InFig. 7 the footprint (i.e. the predicted contributionto the EC measurement) is plotted as a functionof distance upwind from the tower. During typicaldaytime conditions the area contributing s 90%to the EC measurement was situated within 70^170 m upwind of the tower for the 2.5 m tower.This area represents V25^50% of the distanceacross the degassing area of the crater £oor atSolfatara. Thus, the area at Solfatara monitoredby EC with a 2.5 m tower is a signi¢cant portionof the degassing region, allowing more thoroughvolcanic monitoring.Complete spatial sampling by EC can lead to
positive di¡erences when comparing measurementtechniques (i.e. FMsFP) if a signi¢cant contribu-tion to £ux is measured by EC but not measuredwithin the surface array. This was most evidentfor the EC measurements made in the Fangaiaregion downwind of degassing pools (locations2^6, Fig. 6). EC measurements made downwindof degassing pools in Yellowstone also displayedthis trend, but at Yellowstone, emission rates ofthe degassing pools had been previously estimated[32] and were included in the surface array [11].At Yellowstone the near-agreement of FM and FPfor measurements downwind of degassing pools
Fig. 5. The relative di¡erence between FM and FP plotted asa function of (a) wind speed, (b) wind direction, and (c) timeof day. Grey dots indicate comparisons that failed tests forstationarity and low u�, squares represent stationary mea-surements with u� s 0.1 m s31. Note how the relative errorsare negatively skewed at low wind speeds, but that ¢lteringfor low u� and non-stationary measurements eliminated thesemeasurements. Relative errors were not found to vary as afunction of wind direction (b) or time of day (c).
EPSL 6605 5-5-03
C. Werner et al. / Earth and Planetary Science Letters 210 (2003) 561^577 571
suggested that EC was representative of surface£ux in regions that display signi¢cant inhomoge-neity. The near-agreement also suggests that thedi¡erence between FM and FP can be used as anew method to estimate the emission rates of thepools. The di¡erences between FM and FP in the
Fangaia region yielded emission rates between 12and 27 t CO2 d31 for the degassing pools, whichcompares to 84 t CO2 d31 estimated for thesefeatures in 1984 following an episode of upliftand seismicity [33]. The vent emissions measuredat Solfatara are comparable to the estimates of
Fig. 6. Measured EC £uxes vs. predicted £uxes for all Solfatara locations. The predicted £ux (FP) determined from chamber mea-surements plotted against EC-measured £ux (FM) for all locations within Solfatara (a). The error for the EC measurements isbased on the recommendation of Vickers and Mahrt [24], and the error of the predicted £uxes is based on the long-term variabil-ity of mean surface £uxes (Table 2). Comparisons between FM and FP at location 1 cluster around the one-to-one line. At allother locations (2^6), FM exceeds FP because the EC measurements were made downwind of degassing pools. The contributionfrom the degassing pools in the Fangaia region was not included in the surface array used to calculate FP. The di¡erences be-tween FM and FP were used to calculate the emission rates of the pools in the Fangaia region: 12^27 t d31 (see text). In plot b,the relative di¡erences between FM and FP are plotted as a function of the percentage contribution to the footprint from thearea of the degassing pools in the Fangaia region. The relative di¡erence increases with increasing contribution from the degas-sing pools in Fangaia. Location 6 (located directly downwind of the degassing pools) shows the highest contribution to the foot-print (up to 16%) from these features. The measurements from location 2 have between V1 and 10% contribution from the de-gassing pools, and location 1 has the least contribution from the degassing pools (6 0.5%).
EPSL 6605 5-5-03
C. Werner et al. / Earth and Planetary Science Letters 210 (2003) 561^577572
vent emissions measured directly at Mud volcanoin Yellowstone, which ranged from 6 1 to 24 td31 [32]. The decrease in emissions from the de-gassing pools in the Fangaia region since 1984 isconsistent with declining mean surface £uxes atSolfatara over the last 4 years (Table 2).
5.3. Di¡erences between FM and FP due to thefootprint model
Di¡erences between FM and FP have thus farbeen attributed to periods of low turbulence ornon-stationarity, to unmeasured temporal vari-ability of surface £uxes by the surface array,and to contributions to £ux measured by ECbut not by the surface array (e.g. degassingpools). Our analysis also suggests that di¡erenceson the order of : 50% between FM and FP couldalso be due to the footprint model not accuratelyweighting the upwind source area during weaklyunstable conditions. The shape of the footprintwas largely dependent on the stability of the at-mosphere, largely quanti¢ed through parameterL, the Obukhov length, which is a measure ofthe relative importance of mechanical mixing(i.e. u�) to buoyancy-induced turbulence [23].When L is negative and small, mixing due tobuoyancy exceeds mechanical mixing, and the at-mosphere is highly unstable (i.e. well mixed).When L is negative and large, mechanical mixingexceeds mixing due to buoyancy, and the atmo-sphere is weakly unstable (i.e. not well mixed iflow values of u� have been eliminated).As L decreased to more negative values (weakly
unstable conditions, less well mixed), the peakmagnitude of the footprint function decreasedand was located further from the tower (Fig.7a). Comparisons between FM and FP duringweakly unstable periods (LI0) also often corre-sponded to a large discrepancy between the mea-sured turbulent £ux and the predicted £ux (Fig.4d). Systematically observing the distribution oferrors as a function of L between 32 and 3200suggested that the footprint function led to largernegative di¡erences between FM and FP at valuesof L637 (Fig. 4d). These negative di¡erenceswere attributed to weakly mixed atmospheric con-ditions leading to underestimation of the FM.
Such observations are similar to those observedfor FM during periods with low u�, suggestingthat L might also be useful as a parameter fordistinguishing periods when the turbulent £uxdoes not represent the surface £ux.
Fig. 7. Footprint function as a function of L. (a) Three ex-amples of the footprint function plotted as a function of dis-tance upwind of the EC tower. The di¡erent examples showhow the footprint changes with varying atmospheric condi-tions, as expressed by the parameter L (in m). The peak ofthe footprint function indicates the maximum weight appliedto a location upwind of the tower such that the EC measure-ment is most representative of that location within the sourcearea. As L becomes more negative, the atmosphere is lesswell mixed, and the peak magnitude of the footprint functionbecomes lower and further from the tower. In panel b, thecumulative footprint function is plotted as a function of dis-tance upwind of the EC tower. Note with low negative val-ues of L the footprint function does not integrate to 1 bythe 300-m upwind (i.e. the maximum upwind distance of thesource area). Also note that V90% of the footprint functionis obtained by 70^170 m upwind of the tower in all cases.
EPSL 6605 5-5-03
C. Werner et al. / Earth and Planetary Science Letters 210 (2003) 561^577 573
We also observed that the footprint function fdid not integrate to 1 for measurements withL633.5 (Fig. 6b). This means that for thesemeasurements the upwind extent of the sourcearea (initially set at 100zm) was not large enough.Beyond 100zm the upwind source area was nolonger uniform; thus, we did not choose to extendthe source area to enable f to integrate to 1. In-stead, the source area was not fully weighted forthese measurements, which likely leads to anunderestimation of FP, or positive measured dif-ferences between FM and FP in Fig. 4d. Theunderestimation of f increased with decreasing L(Fig. 6b), suggesting that the measurements withL637 in Fig. 4d also were likely the result oflow integrated f values. The combined e¡ect ofweakly unstable conditions (L637) causing neg-ative di¡erences between FM and FP, and inaccu-rate weighting of the footprint function f causingpositive di¡erences between FM and FP is a pos-sible explanation of the bimodal distribution ofdi¡erences observed in Fig. 4d.
5.4. Expected increases in emissions with magmaemplacement
One of the ultimate goals of this study was to
determine if EC measurements of volcanic £uxesof CO2 can be used to monitor volcanic unrest.We have shown above that the daily variability in£ux across large portions of Solfatara likely variesin part due to changes in atmospheric pressure: atlocation 1 the background variability was on theorder of 500^600 g m32 d31. Thus, for this loca-tion, the increase in CO2 £ux due to an increasedvolcanic signal would have caused a shift in thebaseline by the same order of magnitude of £uxin order to use EC-measured £uxes as a predic-tive tool. Here we investigate two scenarios todemonstrate if the CO2 released from depth asthe magma rises to the surface would lead toCO2 £uxes that exceed the background variabilityat this site.The ¢rst scenario we consider is if magma were
to rise to the surface from the magma chamberbeneath the Campi Flegrei system. The magmachamber is estimated at 5 km depth and isthought to contain 0.3^0.5 wt% CO2 [18]. If asmall eruptive event were to occur, say on theorder of the Monte Nuevo 1538 eruption (esti-mated at 0.04 km3 over 10 days), and all theemissions were released and monitored througha region that is the same size as the actively de-gassing region at Solfatara (0.5 km2 [8]), then the
Fig. 8. The long-term standard error of the mean of surface £ux plotted as a function of the mean from each location within the200-pt. grid of surface £uxes, measured over 13 surveys from 1997 to the present (Table 2). The standard error of the mean£uxes is V10% of the mean £ux, regardless of the mean £ux at the site.
EPSL 6605 5-5-03
C. Werner et al. / Earth and Planetary Science Letters 210 (2003) 561^577574
average increase in £ux over the entire regionwould be 83 000 g m32 d31. This predicted in-crease in average £ux is approximately 10 timesthat measured at Usu volcano in Japan, whereaverage di¡use £uxes on the £anks of Usu in-creased from 1800 g m32 d31 during a period ofquiescent degassing, to 7000 g m32 d31 immedi-ately prior to an eruptive event [4]. While admit-tedly perhaps an unrealistic scenario, this calcula-tion demonstrates that an eruptive event that iseven 100 times smaller than the Monte Nuevoeruption would result in CO2 £uxes that exceeddiurnal variability.The second scenario we consider is if mantle
basalt would migrate from the crust^mantleboundary (estimated at 25 km depth in this region[21]) to the magma chamber beneath Campi Fle-grei (V5 km) and release all CO2 to the solubilitylimit at that pressure over a 1-yr period. Assum-ing an initial mantle carbon content of 500 ppm[18], 10% partial melt, and emplacement of 0.04km3 of magma, the average daily increase in £uxover that year would be V3000 g m32 d31. Sig-ni¢cant changes in the measured £ux would alsobe observed if the magma took longer to degas:increases in £ux above the magnitude of the dailyvariability observed at location 1 (i.e. s 500 gm32 d31) could be measured even if the time todegas increased to 6 yr. Thus, the increases in£ux predicted for any of these events (increasesabove background by at least +10%) would ex-ceed daily changes in £ux measurements due to£uctuations in atmospheric pressure as observedin our work.
5.5. Conclusions and recommendations formonitoring
5.5.1. Applicable sites and conditionsDespite potential complications with advection
due to crater walls, Solfatara has proven an ex-cellent site to deploy a permanent EC station tomonitor CO2 £uxes. The contribution to the aver-age £ux from degassing pools or fumaroles wasnot measurable by chamber methods, but waseasily measured by EC. The success of using ECto measure degassing at Solfatara demonstratesthat EC could be a useful monitoring tool at oth-
er volcanic sites. Ideal sites should be relatively£at (6 15% slope [14]), not be in the lee of ahill, and have fairly constant wind direction withat least 150^200 m of degassing area upwind ofthe tower location. Any implementation of EC tomonitor for volcanic hazard should take care toeliminate measurements during low-turbulence ornon-stationary conditions. At Solfatara, low-tur-bulence and non-stationary measurements wereobserved primarily during nighttime hours (Fig.2b,c) and at wind speeds 6 2 m s31 (Fig. 5a),suggesting that nighttime and low-wind periodscould be avoided during data collection. Basedon these criteria, other applicable sites would in-clude many hydrothermal areas and large calderasystems.
5.5.2. Tower placement ^ footprint considerationsIn Section 5.2 we show that the area monitored
by EC is much larger than that of chamber mea-surements, and that EC can be used to measurethe temporal variability of £ux over large regions(thousands of m2 to V1 km2). At Usu volcanoin Japan, a series of three chamber £ux surveysshowed increases in £ux at all locations precedinga volcanic eruption, but di¡use £uxes tended toincrease most around areas displaying high degas-sing rates prior to the onset of volcanic activity[4]. If this study is typical of the changes in di¡usedegassing rates prior to eruptions, then this indi-cates that high-£ux regions would likely respondmore to increases in volcanic activity. This hy-pothesis is also supported by the observationthat degassing in volcanic areas is often elevatedalong well-de¢ned fault and fracture patterns[34,35] that serve as preferential conduits for de-gassing. Fracture-controlled degassing is also ob-served at Solfatara [8,33] ; thus, monitoring £uxesusing EC at Solfatara should attempt to containhigh-£ux regions within the EC source area be-cause these regions are most likely to show thegreatest response to volcanic unrest. For example,a 2.5 m tower should be located within 50^150 mdownwind of a high-£ux region given our foot-print calculations.
5.5.3. Contemporaneous measurementsEC can bridge the gap between continuously
EPSL 6605 5-5-03
C. Werner et al. / Earth and Planetary Science Letters 210 (2003) 561^577 575
monitored chamber measurements and spatialsurveys of surface £uxes. EC seems appropriatefor detecting large-scale changes in the volcanicsystems, and could be used to better plan thetiming for surface mapping of CO2 £ux. Due tomissing data during periods of low turbulence, ECis not as convenient for determining the processescausing trends in £ux as continuous chambermeasurements. However, continuous chambermeasurements by necessity only monitor changesat one point. The combined use of both tech-niques provides the most information regardingprocesses and the spatial representativeness of in-dividual chamber measurements. Furthermore,while we have not focused our discussion on thevariability in H2O £uxes, we suggest the combinedmeasurement of H2O and CO2 £uxes using ECcould provide more insight into volcanic and hy-drothermal processes, especially given the historyof changing gas/steam ratios preceding periods ofuplift and seismicity at Solfatara [16]. In conclu-sion, we ¢nd EC provides reliable estimates ofsurface £uxes at Solfatara, and EC can monitorsigni¢cantly larger areas than previous methods.Monitoring larger areas provides new insight intothe temporal variability and spatial distribution ofdegassing at Solfatara, and thus provides a newand useful technique for monitoring volcanic haz-ard.
Acknowledgements
This work was supported by the National Sci-ence Foundation (Grant EAR 01-14858), and theBiogeochemical Research Initiative for Education(BRIE) sponsored by NSF (IGERT) Grant DGE-9972759. C.W. was funded by the U.S. Depart-ment of Energy Global Change in EducationGraduate Research Fellowship program, thePenn State Geosciences Department KrynineFund, and the Geological Society of AmericanGraduate Research program. The authors are in-debted to Giorgio Anghirano, the owner of Sol-fatara crater, for allowing us to perform our ex-periment. This paper bene¢ted from the helpfulreviews of K.J. Davis, W.C. Evans, J.D. Rogie,P. Deines, and D.H. Eggler.[SK]
References
[1] G. Chiodini, R. Cioni, C. Leonis, L. Marini, B. Raco,Fluid geochemistry of Nisyros Island, Dodecanese,Greece, J. Volcanol. Geotherm. Res. 56 (1993) 95^112.
[2] J.C. Baubron, P. Allard, J.C. Sabroux, D. Tedesco, J.P.Toutain, Soil gas emanations as precursory indications ofvolcanic eruptions, J. Geol. Soc. London 148 (1991) 571^576.
[3] G. Chiodini, R. Cioni, M. Guidi, B. Raco, L. Marini, SoilCO2 £ux measurements in volcanic and geothermal areas,Appl. Geochem. 13 (1998) 543^552.
[4] P.A. Hernandez, K. Notsu, J.M. Salazar, T. Mori, G.Natale, H. Okada, G. Virgili, Y. Shimoike, M. Sato,N.M. Perez, Carbon dioxide degassing by advective £owfrom Usu volcano, Japan, Science 292 (2001) 83^86.
[5] K.A. McGee, T.M. Gerlach, R. Kessler, M.P. Doukas,Geochemical evidence for a magmatic CO2 degassingevent at Mammoth Mountain, California, September-De-cember 1997, J. Geophys. Res. 105 (2000) 8447^8456.
[6] T.M. Gerlach, K.A. McGee, T. Elias, A.J. Sutton, M.P.Doukas, Carbon dioxide emission rate of Kilauea Vol-cano: Implications for primary magma and summitreservoir, J. Geophys. Res. 107 (B9) (2002) 10.1029/2001JB000407.
[7] S. Giammanco, S. Gurrieri, M. Valenza, Soil CO2 degas-sing along tectonic structures of Mount Etna (Sicily); thePernicana Fault, Appl. Geochem. 12 (1997) 429^436.
[8] G. Chiodini, F. Frondini, C. Cardellini, D. Granieri, L.Marini, G. Ventura, CO2 degassing and energy release atSolfatara volcano, Campi Flegrei, Italy, J. Geophys. Res.106 (2001) 16213^16221.
[9] C.B. Connor, B.M. Clement, X.D. Song, S.B. Lane, K.Westthomas, Continuous monitoring of high-temperaturefumaroles on an active lava dome, Volcan Colima, Mex-ico ^ Evidence of mass-£ow variation in response to at-mospheric forcing, J. Geophys. Res. 98 (1993) 19713^19722.
[10] J.D. Rogie, D.M. Kerrick, M.L. Sorey, G. Chiodini, D.L.Galloway, Dynamic of carbon dioxide emission at Mam-moth Mountain, California, Earth Planet. Sci. Lett. 188(2001) 535^541.
[11] C. Werner, J.C. Wyngaard, S. Brantley, Eddy-correlationmeasurement of hydrothermal gases, Geophys. Res. Lett.27 (2000) 2925^2929.
[12] D.E. Anderson, C.D. Farrar, Eddy covariance measure-ment of CO2 £ux to the atmosphere from an area of highvolcanogenic emissions, Mammoth Mountain, California,Chem. Geol. 177 (2001) 31^42.
[13] D. Baldocchi, E. Falge, L.H. Gu, R. Olson, D. Hollinger,S. Running, P. Anthoni, C. Bernhofer, K. Davis, R.Evans, J. Fuentes, A. Goldstein, G. Katul, B. Law,X.H. Lee, Y. Malhi, T. Meyers, W. Munger, W. Oechel,K.T.P. U, K. Pilegaard, H.P. Schmid, R. Valentini, S.Verma, T. Vesala, K. Wilson, S. Wofsy, FLUXNET Anew tool to study the temporal and spatial variability ofecosystem-scale carbon dioxide, water vapor, and energy
EPSL 6605 5-5-03
C. Werner et al. / Earth and Planetary Science Letters 210 (2003) 561^577576
£ux densities, Bull. Am. Meteorol. Soc. 82 (2001) 2415^2434.
[14] D.D. Baldocchi, B.B. Hicks, T.P. Meyers, Measuring bio-sphere-atmosphere exchanges of biologically related gaseswith micrometeorological methods, Ecology 69 (1988)1331^1340.
[15] D.H. Lenschow, Micrometeorological techniques for mea-suring biosphere-atmosphere trace gas exchange, in:P.A.M.a.R.C. Harriss (Ed)., Biogenic Trace Gases: Mea-suring Emissions from Soil and Water, Blackwell Science,Cambridge, MA, 1995, pp. 126^163.
[16] R. Cioni, E. Corazza, L. Marini, The gas/steam ratio asindicator of heat transfer at the Solfatara fumaroles, Phle-graean Fields (Italy), Bull. Volcanol. 47 (1984) 295^302.
[17] M. Martini, P. Cellini Legittimo, G. Piccardi, L. Giannini,Composition of hydrothermal £uid during the bradyseis-mic crisis which commenced at Phlegraean ¢elds in 1982,Bull. Volcanol. 47 (1984) 267^273.
[18] P. Allard, A. Maiorani, D. Tedesco, G. Cortecci, B. Turi,Isotopic study of the origin of sulfur and carbon in Sol-fatara fumaroles, Campi Flegrei caldera, J. Volcanol.Geotherm. Res. 48 (1991) 139^159.
[19] D. Tedesco, P. Scarsi, Chemical (He, H-2, CH4, Ne, Ar,Na) and isotopic (He, Ne, Ar, C) variations at the Solfa-tara crater (southern Italy): mixing of di¡erent sources inrelation to seismic activity, Earth Planet. Sci. Lett. 171(1999) 465^480.
[20] D. Tedesco, Chemical and isotopic gas emissions at Cam-pi-Flegrei ^ Evidence for an aborted period of unrest,J. Geophys. Res. 99 (1994) 15623^15631.
[21] F. Ferrucci, G. Gaudiosi, N.A. Pino, G. Luongo, A.Hirn, L. Mirabile, Seismic detection of a mantle Mohoupheaval beneath the Campania volcanic area (Naples,Southern Italy), Geophys. Res. Lett. 16 (1989) 1317^1320.
[22] E.K. Webb, G.I. Pearman, R. Leuning, Correction to £uxmeasurements for density e¡ects due to heat and watervapor transfer, Q. J. R. Meteorol. Soc. 106 (1980) 85^100.
[23] R.B. Stull, An Introduction to Boundary Layer Meteorol-ogy, Kluwer Academic, Dordrecht, 1988.
[24] D. Vickers, L. Mahrt, Quality control and £ux samplingproblems for tower and aircraft data, J. Atmos. Ocean.Technol. 14 (1997) 512^526.
[25] T. Foken, B. Wichura, Tools for quality assessment ofsurface-based £ux measurements, Agric. Forest Meteorol.78 (1996) 83^105.
[26] G. Chiodini, F. Frondini, B. Raco, Di¡use emission ofCO2 from the Fossa Crater, Vulcano Island (Italy), Bull.Volcanol. 58 (1996) 41^50.
[27] P.H. Schuepp, M.Y. Leclerc, J.I. Macpherson, R.L. Des-jardins, Footprint prediction of scalar £uxes from analyt-ical solutions of the di¡usion equation, Bound.-Layer Me-teorol. 50 (1990) 355^373.
[28] T.W. Horst, J.C. Weil, Footprint estimation for scalar£ux measurements in the atmospheric surface layer,Bound.-Layer Meteorol. 59 (1992) 279^296.
[29] T.W. Horst, J.C. Weil, How far is far enough? The fetchrequirements for micrometeorological measurement ofsurface £uxes, J. Atmos. Ocean. Technol. 11 (1994)1018^1025.
[30] J. Massmann, D.F. Farrier, E¡ects of atmospheric pres-sures on gas transport in the vadose zone, Earth Planet.Sci. Lett. 28 (1992) 777^791.
[31] D. Finn, B. Lamb, M.Y. Leclerc, T.W. Horst, Experimen-tal evaluation of analytical and Lagrangian surface-layer£ux footprint models, Bound.-Layer Meteorol. 80 (1996)283^308.
[32] C. Werner, S.L. Brantley, K. Boomer, CO2 emissions re-lated to the Yellowstone volcanic system 2. Statisticalsampling, total degassing, and transport mechanisms,J. Geophys. Res. 105 (2000) 10831^10846.
[33] F. Italiano, P.M. Nuccio, M. Valenza, Geothermal energyrelease at the Solfatara of Pozzuoli (Phlegraean Filed):Phreatic and phreatomagmatic explosion risk implica-tions, Bull. Volcanol. 47 (1984) 275^285.
[34] S. Giammanco, S. Gurrieri, M. Valenza, Annomalous soilCO2 degassing in relation to faults and eruptive ¢ssureson Mount Etna (Sicily, Italy), Bull. Volcanol. 60 (1998)252^259.
[35] P. Hernandez, N. Perez, J. Salazar, M. Sato, K. Notsu, H.Wakita, Soil gas CO2, CH4, and H-2 distribution in andaround Las Canadas Caldera, Tenerife, Canary Islands,Spain, J. Volcanol. Geotherm. Res. 103 (2000) 425^438.
EPSL 6605 5-5-03
C. Werner et al. / Earth and Planetary Science Letters 210 (2003) 561^577 577
Related Documents