Introduction VNA Measurement Model Database Uncertainty Visualization Results VNA Tools II S-parameter uncertainty calculation Michael Wollensack METAS 25. May 2011 Michael Wollensack 1 METAS

Welcome message from author
This document is posted to help you gain knowledge. Please leave a comment to let me know what you think about it! Share it to your friends and learn new things together.
Transcript

Introduction VNA Measurement Model Database Uncertainty Visualization Results
VNA Tools IIS-parameter uncertainty calculation
Michael Wollensack
METAS
25. May 2011
Michael Wollensack 1 METAS

Introduction VNA Measurement Model Database Uncertainty Visualization Results
Outline
Introduction
VNA Measurement Model
Database
Uncertainty
Visualization
Results
Michael Wollensack 2 METAS

Introduction VNA Measurement Model Database Uncertainty Visualization Results
Introduction
ProblemComputation of the uncertainties of S-parameter measurements.
SolutionSet up a measurement model for the Vector Network Analyzer andpropagate all uncertainties through the VNA measurement model.
Michael Wollensack 3 METAS

Introduction VNA Measurement Model Database Uncertainty Visualization Results
Measurement Errors
Which non correctable influences affect the S-parametermeasurements?
I Noise floor and trace noise
I Linearity
I Drift of switch and calibration error terms
I Cable stability
I Connector repeatability
I Calibration standard definitions
Michael Wollensack 4 METAS

Introduction VNA Measurement Model Database Uncertainty Visualization Results
VNA Measurement Model
The following equation describes the in VNA Tools II used N-portVNA measurement model. All bold variables are S-parametermatrices and i is the measurement index.
M(i) = R(i) +[(
W + V(i))⊕[(
E + D(i))⊕[C(i) ⊕ S(i)
]]]
N+1
N+2
2N
1
2
N
W + V
N+1
N+2
2N
1
2
N
E + D
N+1
N+2
2N
1
2
N
C
1
2
N
SM− R
SS′M′′M′
W′ E′
Figure: VNA Measurement Model
Michael Wollensack 5 METAS

Introduction VNA Measurement Model Database Uncertainty Visualization Results
VNA Measurement Model - Raw Data
M denotes the raw data measured by the VNA.It changes from measurement to measurement.
R denotes the noise and linearity influences.It changes from measurement to measurement.
N+1
N+2
2N
1
2
N
W + V
N+1
N+2
2N
1
2
N
E + D
N+1
N+2
2N
1
2
N
C
1
2
N
SM− R
SS′M′′M′
W′ E′
Figure: VNA Measurement Model
Michael Wollensack 6 METAS

Introduction VNA Measurement Model Database Uncertainty Visualization Results
VNA Measurement Model - Switch Terms
W denotes the switch terms.It’s constant during an entire calibration.
V denotes the drift of the switch terms.It changes from measurement to measurement.
N+1
N+2
2N
1
2
N
W + V
N+1
N+2
2N
1
2
N
E + D
N+1
N+2
2N
1
2
N
C
1
2
N
SM− R
SS′M′′M′
W′ E′
Figure: VNA Measurement Model
Michael Wollensack 7 METAS

Introduction VNA Measurement Model Database Uncertainty Visualization Results
VNA Measurement Model - Calibration Error Terms
E denotes the calibration error terms.It’s constant during an entire calibration.
D denotes the drift of the calibartion error terms.It changes from measurement to measurement.
N+1
N+2
2N
1
2
N
W + V
N+1
N+2
2N
1
2
N
E + D
N+1
N+2
2N
1
2
N
C
1
2
N
SM− R
SS′M′′M′
W′ E′
Figure: VNA Measurement Model
Michael Wollensack 8 METAS
Introduction VNA Measurement Model Database Uncertainty Visualization Results
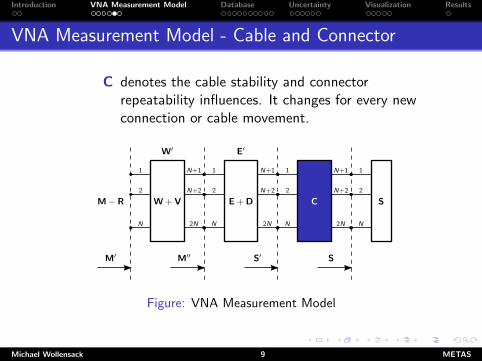
VNA Measurement Model - Cable and Connector
C denotes the cable stability and connectorrepeatability influences. It changes for every newconnection or cable movement.
N+1
N+2
2N
1
2
N
W + V
N+1
N+2
2N
1
2
N
E + D
N+1
N+2
2N
1
2
N
C
1
2
N
SM− R
SS′M′′M′
W′ E′
Figure: VNA Measurement Model
Michael Wollensack 9 METAS

Introduction VNA Measurement Model Database Uncertainty Visualization Results
VNA Measurement Model - Error Corrected Data
S denotes the error corrected data or the calibration kitstandard definitions. It changes if a new device isconnected.
N+1
N+2
2N
1
2
N
W + V
N+1
N+2
2N
1
2
N
E + D
N+1
N+2
2N
1
2
N
C
1
2
N
SM− R
SS′M′′M′
W′ E′
Figure: VNA Measurement Model
Michael Wollensack 10 METAS

Introduction VNA Measurement Model Database Uncertainty Visualization Results
Database
I All influences that affect the measurements are definded asuncertainties in a database.
I There are two types of uncertainties:
1. Additive quantities2. Multiplicative quantities
I There are four types of database items:
1. VNA Device (noise, linearity, drift)2. Cable (stability)3. Connector (repeatability)4. Calibration Standard
I All influences are frequency dependent.
I VNA Tools II has a graphical user interface to edit items inthe database.
Michael Wollensack 11 METAS

Introduction VNA Measurement Model Database Uncertainty Visualization Results
Database - Type of Uncertainties
Additive Quantity
The real and imaginary part isspecifed in dB.
Multiplicative Quantity
The magnitude is specifed in dBand the phase in deg.
(0, 0)
Real
Imag
Figure: Additive Quantity
(1, 0)
Mag
Ph
ase
Figure: Multiplicative Quantity
Michael Wollensack 12 METAS

Introduction VNA Measurement Model Database Uncertainty Visualization Results
Database - VNA Device
There are three groups ofuncertainty definitions for a VNAdevice:
1. Noise
2. Linearity
3. Drift
Figure: DB VNA Device Settings
Michael Wollensack 13 METAS

Introduction VNA Measurement Model Database Uncertainty Visualization Results
Database - VNA Device
Noise
I Noise Floor in dB (additive)
I Trace Noise in dB rms anddeg rms (multiplicative)
Figure: DB VNA Device Noise
Michael Wollensack 14 METAS
Introduction VNA Measurement Model Database Uncertainty Visualization Results
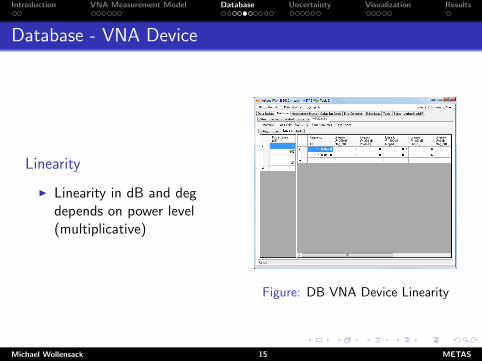
Database - VNA Device
Linearity
I Linearity in dB and degdepends on power level(multiplicative)
Figure: DB VNA Device Linearity
Michael Wollensack 15 METAS

Introduction VNA Measurement Model Database Uncertainty Visualization Results
Database - VNA Device
Drift
I Switch Term Drift in dB(additive)
I Directivity Drift in dB(additive)
I Tracking Drift in dB anddeg (multiplicative)
I Match Drift in dB (additive)
I Isolation Drift in dB(additive) Figure: DB VNA Device Drift
Michael Wollensack 16 METAS

Introduction VNA Measurement Model Database Uncertainty Visualization Results
Database - Cable
Cable Stability
I Stability in dB and deg(multiplicative)
Figure: DB Cable
Michael Wollensack 17 METAS
Introduction VNA Measurement Model Database Uncertainty Visualization Results
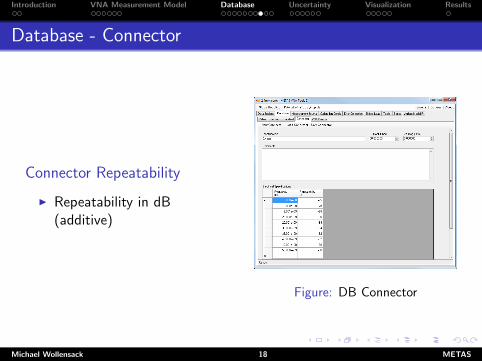
Database - Connector
Connector Repeatability
I Repeatability in dB(additive)
Figure: DB Connector
Michael Wollensack 18 METAS

Introduction VNA Measurement Model Database Uncertainty Visualization Results
Database - Calibration Standard
Agilent Model Standard
I Open and Short havespecified Phase Deviation indeg. Magnitude deviationassumed to be the same asthe phase deviation.(multiplicative)
I Load has specified ReturnLoss in dB. (additive)
Figure: DB Agilent Model Standard
Michael Wollensack 19 METAS

Introduction VNA Measurement Model Database Uncertainty Visualization Results
Database - Calibration Standard
Databased StandardUncertainties explicitly stated foreach data point.
Figure: DB Databased Standard
Michael Wollensack 20 METAS

Introduction VNA Measurement Model Database Uncertainty Visualization Results
Metas.UncLib
Metas.UncLib is a measurementuncertainty calculator.
The user specifies
I input quantities X withinput covariance matrix VX
I measurement model f
Metas.UncLib computes
I output quantities Y = f (X)
I Jacobi matrix JYX of f usingautomatic differentiation
I output covariance matrixVY = JYXVXJYX
′
X1 X2 X3
f1
corr
Input quantities
Output quantities
Measurement model
f2
Y1 Y2
corr
Figure: Metas.UncLib
Michael Wollensack 21 METAS

Introduction VNA Measurement Model Database Uncertainty Visualization Results
Uncertainty Generators
I Uncertainty Generators are used to generates Metas.UncLibinput uncertain quantities.
I The value of an uncertain quantity is zero for additivequantities or one for multiplicative quantities.
I The standard uncertainty of an uncertain quantity comes fromthe database.
I The uncertainty generator decides if the uncertain quantitygets a new (uncorrelated) or an existing (correlated) uncertaininput id.
I There are three groups of uncertainty generators:
1. Noise and linearity influences2. Drift of switch and error terms3. Cable stability and connector repeatability
Michael Wollensack 22 METAS

Introduction VNA Measurement Model Database Uncertainty Visualization Results
Uncertainty Generators - Noise and Linearity
Noise
I Uncorrelated for eachmeasurement.
I Depends on the VNA devicenoise floor and trace noisedefinition.
Linearity
I Correlated for eachmeasurement.
I Depends on the VNA devicelinearity definition.
1
2
N
R
Figure: Noise and linearity influences
Michael Wollensack 23 METAS

Introduction VNA Measurement Model Database Uncertainty Visualization Results
Uncertainty Generators - Drift of Switch and Error Terms
Drift
I Uncorrelated for eachmeasurement.
I Depends on the VNA devicedrift definition.
N+1
N+2
2N
1
2
N
W + V
N+1
N+2
2N
1
2
N
E + D
W′ E′
Figure: Drift of switch and errorterms
Michael Wollensack 24 METAS

Introduction VNA Measurement Model Database Uncertainty Visualization Results
Uncertainty Generators - Cable and Connector
Cable
I Uncorrelated for each newcable position.
I Depends on the cablestability definition.
Connector
I Uncorrelated for each newconnection.
I Depends on the connectorrepeatability definition.
21Cable
21Conn.
0 0
Cp
Cp
Rp,1 Rp,2
1
1
p p̄
Figure: Cable stability andconnector repeatability 2-port
Michael Wollensack 25 METAS

Introduction VNA Measurement Model Database Uncertainty Visualization Results
Uncertainty Propagation
The uncertainty generators are represented by R, V, D and C.
I Vna measurement model:
M(i) = R(i)+[(
W + V(i))⊕[(
E + D(i))⊕[C(i) ⊕ S(i)
]]]I Calibration and error correction are based on the above
equation.
I Linear uncertainty propagation is done with Metas.UncLib.
I The complexity is hidden from the user and from the VNATools II programmer.
I Metas.UncLib takes care about correlations.
Michael Wollensack 26 METAS

Introduction VNA Measurement Model Database Uncertainty Visualization Results
Uncertainty Propagation
The uncertainty generators are represented by R, V, D and C.
I Vna measurement model:
M(i) = R(i)+[(
W + V(i))⊕[(
E + D(i))⊕[C(i) ⊕ S(i)
]]]I Calibration and error correction are based on the above
equation.
I Linear uncertainty propagation is done with Metas.UncLib.
I The complexity is hidden from the user and from the VNATools II programmer.
I Metas.UncLib takes care about correlations.
Michael Wollensack 27 METAS

Introduction VNA Measurement Model Database Uncertainty Visualization Results
Visualization
VNA Tools II supports different view modes:
Graph shows a graphical visualization of multiple files.
Table shows a tabular visualization of a single file.
Point shows an uncertainty budget for one frequency pointand one parameter of a single file.
Info shows file information including MD5 checksum ofmultiple files.
There are three different uncertainty modes:
None hides the uncertainty.
Standard shows the standard uncertainty (67% coveragefactor, k = 1).
U95 shows the expanded uncertainty (95% coveragefactor, k = 2).
Michael Wollensack 28 METAS

Introduction VNA Measurement Model Database Uncertainty Visualization Results
Visualization
VNA Tools II supports different view modes:
Graph shows a graphical visualization of multiple files.
Table shows a tabular visualization of a single file.
Point shows an uncertainty budget for one frequency pointand one parameter of a single file.
Info shows file information including MD5 checksum ofmultiple files.
There are three different uncertainty modes:
None hides the uncertainty.
Standard shows the standard uncertainty (67% coveragefactor, k = 1).
U95 shows the expanded uncertainty (95% coveragefactor, k = 2).
Michael Wollensack 29 METAS
Introduction VNA Measurement Model Database Uncertainty Visualization Results
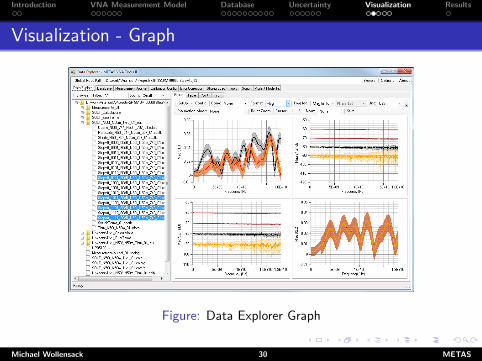
Visualization - Graph
Figure: Data Explorer Graph
Michael Wollensack 30 METAS

Introduction VNA Measurement Model Database Uncertainty Visualization Results
Visualization - Table
Figure: Data Explorer Table
Michael Wollensack 31 METAS

Introduction VNA Measurement Model Database Uncertainty Visualization Results
Visualization - Point
Figure: Data Explorer Point
Michael Wollensack 32 METAS

Introduction VNA Measurement Model Database Uncertainty Visualization Results
Visualization - Info
Figure: Data Explorer Info
Michael Wollensack 33 METAS

Introduction VNA Measurement Model Database Uncertainty Visualization Results
Results
I New VNA measurement model for a N-port Vector NetworkAnalyzer.
I Definition of all influences that affect the measurements.
I Linear propagation of all uncertainties through the VNAmeasurement model.
I Visualization of S-parameter data with uncertainties.
Michael Wollensack 34 METAS
Related Documents