Virtual spatial overlap modulation microscopy for resolution improvement Wei-Cheng Kuo, 1 Yuan-Ta Shih, 2 Hsun-Chia Hsu, 2 Yu-Hsiang Cheng, 3 Yi-Hua Liao, 2,4 and Chi-Kuang Sun 1,2,3,5,* 1 Department of Electrical Engineering, National Taiwan University, Taipei 10617, Taiwan 2 Molecular Imaging Center, National Taiwan University, Taipei 10617, Taiwan 3 Graduate Institute of Photonics and Optoelectronics, National Taiwan University, Taipei 10617, Taiwan 4 Department of Dermatology, National Taiwan University Hospital and College of Medicine, National Taiwan University, Taipei 10002, Taiwan 5 Graduate Institute of Biomedical Electronics and Bioinformatics & Center for Optoelectronic Medicine, National Taiwan University, Taipei 10617, Taiwan * [email protected] Abstract: High spatial and temporal resolutions are important advantages of optical imaging over other modalities. The recently developed spatial overlap modulation (SPOM) microscopy enables high resolution imaging by spatial modulation of double-beam overlap. However, SPOM suffers from bad temporal resolution and high system complexity. In this paper, we re-formulate the SPOM resolution theory and develop Virtual SPOM (vSPOM) microscopy. By one-way oversampling and convolution with differential filters, vSPOM not only realizes the same factor of spatial resolution improvement as SPOM, but overcome SPOM’s major drawbacks. We demonstrated vSPOM on in vivo clinical images and find that the Gabor filter, which represents two-beam vSPOM, is the most effective among all vSPOM filters. The development of vSPOM enables easy incorporation of SPOM into any imaging system, and extends the use of SPOM to real-time in vivo applications. ©2013 Optical Society of America OCIS codes: (170.0110) Imaging systems; (170.4090) Modulation techniques; (180.2520) Fluorescence microscopy; (180.4315) Nonlinear microscopy. References and links 1. W. Denk, J. H. Strickler, and W. W. Webb, “Two-photon laser scanning fluorescence microscopy,” Science 248(4951), 73–76 (1990). 2. P. J. Campagnola and L. M. Loew, “Second-harmonic imaging microscopy for visualizing biomolecular arrays in cells, tissues and organisms,” Nat. Biotechnol. 21(11), 1356–1360 (2003). 3. C. K. Sun, S. W. Chu, S. Y. Chen, T. H. Tsai, T. M. Liu, C. Y. Lin, and H. J. Tsai, “Higher harmonic generation microscopy for developmental biology,” J. Struct. Biol. 147(1), 19–30 (2004). 4. J. Squier and M. Muller, “High resolution nonlinear microscopy: A review of sources and methods for achieving optimal imaging,” Rev. Sci. Instrum. 72(7), 2855–2867 (2001). 5. K. Isobe, H. Kawano, T. Takeda, A. Suda, A. Kumagai, H. Mizuno, A. Miyawaki, and K. Midorikawa, “Background-free deep imaging by spatial overlap modulation nonlinear optical microscopy,” Biomed. Opt. Express 3(7), 1594–1608 (2012). 6. A. Arbouet, D. Christofilos, N. Del Fatti, F. Vallée, J. R. Huntzinger, L. Arnaud, P. Billaud, and M. Broyer, “Direct measurement of the single-metal-cluster optical absorption,” Phys. Rev. Lett. 93(12), 127401 (2004). 7. O. L. Muskens, P. Billaud, M. Broyer, N. Del Fatti, and F. Vallée, “Optical extinction spectrum of a single metal nanoparticle: Quantitative characterization of a particle and of its local environment,” Phys. Rev. B 78(20), 205410 (2008). 8. N. Fairbairn, R. A. Light, R. Carter, R. Fernandes, A. G. Kanaras, T. J. Elliott, M. G. Somekh, M. C. Pitter, and O. L. Muskens, “Spatial modulation microscopy for real-time imaging of plasmonic nanoparticles and cells,” Opt. Lett. 37(15), 3015–3017 (2012). 9. N. Chen, C. H. Wong, and C. J. Sheppard, “Focal modulation microscopy,” Opt. Express 16(23), 18764–18769 (2008). #198200 - $15.00 USD Received 24 Sep 2013; revised 11 Nov 2013; accepted 11 Nov 2013; published 27 Nov 2013 (C) 2013 OSA 2 December 2013 | Vol. 21, No. 24 | DOI:10.1364/OE.21.030007 | OPTICS EXPRESS 30007

Welcome message from author
This document is posted to help you gain knowledge. Please leave a comment to let me know what you think about it! Share it to your friends and learn new things together.
Transcript
Virtual spatial overlap modulation microscopy for resolution improvement
Wei-Cheng Kuo,1 Yuan-Ta Shih,2 Hsun-Chia Hsu,2 Yu-Hsiang Cheng,3 Yi-Hua Liao,2,4 and Chi-Kuang Sun1,2,3,5,*
1Department of Electrical Engineering, National Taiwan University, Taipei 10617, Taiwan 2Molecular Imaging Center, National Taiwan University, Taipei 10617, Taiwan
3Graduate Institute of Photonics and Optoelectronics, National Taiwan University, Taipei 10617, Taiwan 4Department of Dermatology, National Taiwan University Hospital and College of Medicine, National Taiwan
University, Taipei 10002, Taiwan 5Graduate Institute of Biomedical Electronics and Bioinformatics & Center for Optoelectronic Medicine, National
Taiwan University, Taipei 10617, Taiwan *[email protected]
Abstract: High spatial and temporal resolutions are important advantages of optical imaging over other modalities. The recently developed spatial overlap modulation (SPOM) microscopy enables high resolution imaging by spatial modulation of double-beam overlap. However, SPOM suffers from bad temporal resolution and high system complexity. In this paper, we re-formulate the SPOM resolution theory and develop Virtual SPOM (vSPOM) microscopy. By one-way oversampling and convolution with differential filters, vSPOM not only realizes the same factor of spatial resolution improvement as SPOM, but overcome SPOM’s major drawbacks. We demonstrated vSPOM on in vivo clinical images and find that the Gabor filter, which represents two-beam vSPOM, is the most effective among all vSPOM filters. The development of vSPOM enables easy incorporation of SPOM into any imaging system, and extends the use of SPOM to real-time in vivo applications.
©2013 Optical Society of America
OCIS codes: (170.0110) Imaging systems; (170.4090) Modulation techniques; (180.2520) Fluorescence microscopy; (180.4315) Nonlinear microscopy.
References and links
1. W. Denk, J. H. Strickler, and W. W. Webb, “Two-photon laser scanning fluorescence microscopy,” Science 248(4951), 73–76 (1990).
2. P. J. Campagnola and L. M. Loew, “Second-harmonic imaging microscopy for visualizing biomolecular arrays in cells, tissues and organisms,” Nat. Biotechnol. 21(11), 1356–1360 (2003).
3. C. K. Sun, S. W. Chu, S. Y. Chen, T. H. Tsai, T. M. Liu, C. Y. Lin, and H. J. Tsai, “Higher harmonic generation microscopy for developmental biology,” J. Struct. Biol. 147(1), 19–30 (2004).
4. J. Squier and M. Muller, “High resolution nonlinear microscopy: A review of sources and methods for achieving optimal imaging,” Rev. Sci. Instrum. 72(7), 2855–2867 (2001).
5. K. Isobe, H. Kawano, T. Takeda, A. Suda, A. Kumagai, H. Mizuno, A. Miyawaki, and K. Midorikawa, “Background-free deep imaging by spatial overlap modulation nonlinear optical microscopy,” Biomed. Opt. Express 3(7), 1594–1608 (2012).
6. A. Arbouet, D. Christofilos, N. Del Fatti, F. Vallée, J. R. Huntzinger, L. Arnaud, P. Billaud, and M. Broyer, “Direct measurement of the single-metal-cluster optical absorption,” Phys. Rev. Lett. 93(12), 127401 (2004).
7. O. L. Muskens, P. Billaud, M. Broyer, N. Del Fatti, and F. Vallée, “Optical extinction spectrum of a single metal nanoparticle: Quantitative characterization of a particle and of its local environment,” Phys. Rev. B 78(20), 205410 (2008).
8. N. Fairbairn, R. A. Light, R. Carter, R. Fernandes, A. G. Kanaras, T. J. Elliott, M. G. Somekh, M. C. Pitter, and O. L. Muskens, “Spatial modulation microscopy for real-time imaging of plasmonic nanoparticles and cells,” Opt. Lett. 37(15), 3015–3017 (2012).
9. N. Chen, C. H. Wong, and C. J. Sheppard, “Focal modulation microscopy,” Opt. Express 16(23), 18764–18769 (2008).
#198200 - $15.00 USD Received 24 Sep 2013; revised 11 Nov 2013; accepted 11 Nov 2013; published 27 Nov 2013(C) 2013 OSA 2 December 2013 | Vol. 21, No. 24 | DOI:10.1364/OE.21.030007 | OPTICS EXPRESS 30007
10. C. H. Wong, S. P. Chong, C. J. Sheppard, and N. Chen, “Simple spatial phase modulator for focal modulation microscopy,” Appl. Opt. 48(17), 3237–3242 (2009).
11. W. Lang, “Nomarski differential interference-contrast microscopy,” Oberkochen, Carl Zeiss, 11–18 (1982). 12. R. D. Allen, G. B. David, and G. Nomarski, “The zeiss-Nomarski differential interference equipment for
transmitted-light microscopy,” Z. Wiss. Mikrosk. 69(4), 193–221 (1969). 13. E. D. Salmon and P. Tran, “High-resolution video-enhanced differential interference contrast (VE-DIC) light
microscopy,” Methods Cell Biol. 56, 153–184 (1998). 14. M. Sticker, C. K. Hitzenberger, R. Leitgeb, and A. F. Fercher, “Quantitative differential phase measurement and
imaging in transparent and turbid media by optical coherence tomography,” Opt. Lett. 26(8), 518–520 (2001). 15. C. K. Hitzenberger and A. F. Fercher, “Differential phase contrast in optical coherence tomography,” Opt. Lett.
24(9), 622–624 (1999). 16. A. Leray and J. Mertz, “Rejection of two-photon fluorescence background in thick tissue by differential
aberration imaging,” Opt. Express 14(22), 10565–10573 (2006). 17. G. E. Sotak, Jr. and K. L. Boyer, “The Laplacian-of-Gaussian kernel: a formal analysis and design procedure
for fast, accurate convolution and full-frame output,” Comput. Vision Graphics Image Process. 48(2), 147–189 (1989).
18. R. A. Young, “The Gaussian derivative model for spatial vision: I. Retinal mechanisms,” Spat. Vis. 2(4), 273–293 (1987).
19. B. Chitprasert and K. R. Rao, “Discrete cosine transform filtering,” Signal Process. 19(3), 233–245 (1990). 20. J. P. Jones and L. A. Palmer, “An evaluation of the two-dimensional Gabor filter model of simple receptive
fields in cat striate cortex,” J. Neurophysiol. 58(6), 1233–1258 (1987). 21. J. W. Cooley and J. W. Tukey, “An algorithm for the machine calculation of complex Fourier series,” Math.
Comput. 19(90), 297–301 (1965). 22. S.-Y. Chen, S.-U. Chen, H.-Y. Wu, W.-J. Lee, Y.-H. Liao, and C.-K. Sun, “In vivo virtual biopsy of human skin
by using noninvasive higher harmonic generation microscopy,” IEEE J. Sel. Top. Quantum Electron. 16(3), 478–492 (2010).
23. T.-H. Tsai, C. Y. Lin, H. J. Tsai, S. Y. Chen, S. P. Tai, K. H. Lin, and C.-K. Sun, “Biomolecular imaging based on far-red fluorescent protein with a high two-photon excitation action cross section,” Opt. Lett. 31(7), 930–932 (2006).
24. C.-S. Hsieh, C.-Y. Ko, S.-Y. Chen, T.-M. Liu, J.-S. Wu, C. H. Hu, and C.-K. Sun, “In vivo long-term continuous observation of gene expression in zebrafish embryo nerve systems by using harmonic generation microscopy and morphant technology,” J. Biomed. Opt. 13(6), 064041 (2008).
25. M.-R. Tsai, S.-Y. Chen, D.-B. Shieh, P.-J. Lou, and C.-K. Sun, “In vivo optical virtual biopsy of human oral mucosa with harmonic generation microscopy,” Biomed. Opt. Express 2(8), 2317–2328 (2011).
26. S.-H. Chia, T.-M. Liu, A. A. Ivanov, A. B. Fedotov, A. M. Zheltikov, M.-R. Tsai, M.-C. Chan, C.-H. Yu, and C.-K. Sun, “A sub-100 fs self-starting Cr:forsterite laser generating 1.4 W output power,” Opt. Express 18(23), 24085–24091 (2010).
27. N. Otsu, “A threshold selection method from gray-level histograms,” IEEE Trans. Syst. Man Cybern. 9(1), 62–66 (1979).
28. D. V. Cicchetti and S. A. Sparrow, “Developing criteria for establishing interrater reliability of specific items: applications to assessment of adaptive behavior,” Am. J. Ment. Defic. 86(2), 127–137 (1981).
29. Y.-H. Liao, S.-Y. Chen, S.-Y. Chou, P.-H. Wang, M.-R. Tsai, and C.-K. Sun, “Determination of chronological aging parameters in epidermal keratinocytes by in vivo harmonic generation microscopy,” Biomed. Opt. Express 4(1), 77–88 (2013).
30. S.-Y. Chen, H.-Y. Wu, and C.-K. Sun, “In vivo harmonic generation biopsy of human skin,” J. Biomed. Opt. 14(6), 060505 (2009).
31. S.-P. Tai, T.-H. Tsai, W.-J. Lee, D.-B. Shieh, Y.-H. Liao, H.-Y. Huang, K. Zhang, H.-L. Liu, and C.-K. Sun, “Optical biopsy of fixed human skin with backward-collected optical harmonics signals,” Opt. Express 13(20), 8231–8242 (2005).
32. J. G. Daugman, “Uncertainty relation for resolution in space, spatial frequency, and orientation optimized by two-dimensional visual cortical filters,” J. Opt. Soc. Am. A 2(7), 1160–1169 (1985).
33. A. K. Jain and F. Farrokhnia, “Unsupervised texture segmentation using Gabor filters,” Pattern Recognit. 24(12), 1167–1186 (1991).
34. O. Nestares, R. Navarro, and J. Portilla, “Efficient spatial-domain implementation of a multiscale image representation based on gabor functions,” J. Electron. Imaging 7(1), 166–173 (1998).
35. R. W. Boyd, Nonlinear Optics (Academic, 2003), Chap. 2. 36. J. B. Sibarita, “Deconvolution microscopy,” Adv. Biochem. Eng. Biotechnol. 95, 201–243 (2005).
1. Introduction
The development of multi-photon microscopy, e.g. two-photon excitation fluorescence (TPEF) [1] microscopy, second-harmonic generation (SHG) [2] microscopy, and third-harmonic generation (THG) microscopy [3] has overcome conventional resolution limit thanks to decreased interaction volume determined by the order of nonlinear processes [4].
#198200 - $15.00 USD Received 24 Sep 2013; revised 11 Nov 2013; accepted 11 Nov 2013; published 27 Nov 2013(C) 2013 OSA 2 December 2013 | Vol. 21, No. 24 | DOI:10.1364/OE.21.030007 | OPTICS EXPRESS 30008
Taking the advantage of nonlinear optics, spatial overlap modulation microscopy (SPOM) further improved the resolution by modulating the overlap volume between two beams [5]. The improved resolution of SPOM is due to the same mechanism as that of spatial modulation microscopy (SMM) [6–8] and focal modulation microscopy (FMM) [9]. Unfortunately, SPOM suffers low temporal resolution and high laser 1/f noise due to low modulation frequency ~1kHz, which limits the use of SPOM on in vivo imaging [5]. According to previous SPOM theory, SPOM signal strength is proportional to the square of spatial modulation displacement [5]. However, even the optimal SPOM displacement causes the signal strength to be one eighth that of conventional microscopy [5]. It is impossible to improve this signal loss by increasing displacement, because increased displacement causes resolution to decay [6]. Last but not least, the complicated SPOM technique cannot easily work on single-beam microscopy systems. Beam splitting and re-combination are necessary [5]. To overcome the above drawbacks, we start by re-investigating the basic mechanism behind SPOM resolution improvement.
The modulation techniques, i.e. SPOM, SMM and FMM, all spatially modulate the beams around the sample and then demodulate the received signal with the harmonics of modulation frequency to form image. However, the lateral resolutions differ among them. As SPOM achieved 0.19 μm with 1000 nm pulses, SMM achieved roughly 0.3 μm with 532 nm light [5,6]. SPOM and SMM improved resolution above the diffraction limit by a factor of 1.7 and 1.3 respectively [5,6], but FMM only reported sub-micron diffraction-limit resolution [9,10]. Despite their differences, the resolution mechanism of these techniques is one and the same: differential imaging. In fact, spatial modulation is another form of differential imaging.
Differential imaging has demonstrated improved resolution and contrast in many studies. The classic differential interference contrast (DIC) microscopy shears the beams in two and re-combines them, thus producing an image proportional to the first derivative of optical path length along shear direction [11,12]. With DIC, a lateral resolution of 200 nm can be achieved with 500 nm light. Compared with phase contrast (PC) microscopy, DIC has better resolution because its aperture can be fully and evenly illuminated [13]. The success of DIC demonstrates the feasibility to enhance resolution by taking derivative of image, which inspires the application of similar ideas in optical coherence tomography (OCT). The differential phase contrast OCT (DPCOCT) has achieved a path-length resolution of 2-3 nm, far beyond the capability of conventional OCT [14,15]. On the other hand, the idea of differential imaging applies to TPEF microscopy by using the techniques of adaptive optics [16]. Enhanced contrast and resolution are achieved by subtracting the noise background from original image. To obtain the noise background, the authors deliberately degraded TPEF signal through aberration, and at the same time kept the background relatively unchanged [16]. These differential imaging works show that we can enhance resolution by either taking derivative, as in DIC or DPCOCT, or subtraction, as in adaptive optics.
However, techniques discussed thus far improve resolution by implementing differential imaging on hardware. An alternative approach is differential image processing, which generally refers to the use of derivatives, differential equations, differential geometry or the difference between a pixel and its neighbors. Regarded as a high-pass filter, this approach enhances the high-frequency edge and noise information. Multiple basic limits exist regarding its application on resolution improvement, including the limits on spatial frequency and the tradeoff between signal-to-noise ratio (SNR) and resolution. The highest spatial frequency attainable is limited by the distance between adjacent pixels, a parameter determined by hardware data acquisition procedure. On the other hand, small derivative mask gives us high spatial resolution but it tends to enhance noise and deteriorate SNR.
In this paper, we re-formulated the theory of SPOM resolution and developed vSPOM technique. While SPOM utilizes physical beam modulation to enhance resolution, vSPOM achieves the same effect by oversampling and post-processing. First, vSPOM oversamples
#198200 - $15.00 USD Received 24 Sep 2013; revised 11 Nov 2013; accepted 11 Nov 2013; published 27 Nov 2013(C) 2013 OSA 2 December 2013 | Vol. 21, No. 24 | DOI:10.1364/OE.21.030007 | OPTICS EXPRESS 30009
the object, and then it convolves the oversampled image with any filter from vSPOM differential filter bank, which includes: 1) Laplacian of Gaussian [17], 2) Radial derivative of Gaussian [18], 3) Radial cosine filter [19], and 4) Radial Gabor filter [20]. These filter families not only are strongly associated with differential imaging but are commonly used for purposes such as edge enhancement and texture segmentation in computer vision. Through combining oversampling on hardware and differential filtering on software, this study supports that vSPOM can achieve the same resolution improvement as SPOM and can overcome SPOM’s major drawbacks, e.g. temporal resolution, laser 1/f noise, signal loss, and system complexity. We also report our conduction of three experiments to verify the resolution improvement: first is to determine the diameter of nano-spheres by image segmentation; second is to find images where vSPOM can resolve originally unresolvable objects; third is to take in vivo human skin collagen imaging to visually demonstrate the resolution improvement. The theory and experiments altogether prove the efficacy of vSPOM.
2. Principles of virtual spatial overlap optical microscopy (vSPOM)
2.1 Basic operation of SPOM
The principles of vSPOM have one-to-one correspondence to that of conventional SPOM. Thus, in this section we will analyze the SPOM imaging process step by step, and present its virtual counterpart.
In conventional double-beam SPOM, a combination of double-beam pulses is used to trigger nonlinear optical processes. At each image pixel, we have one beam fixed at the center of the pixel, and the other beam scanned upon it at a modulation frequency f. Their overlap volume will be modulated by f, which causes the signal from each side of the pixel to be periodic with T = 1/f, because the scanning beam reaches it once in a period. The signal from the central point of pixel is modulated by 2f = 2/T because the scanning beam passes it twice in a period. In addition, the signal is mainly composed of even multiples of f’s harmonics, among which 2f component is by far the strongest [5]. As a result, SPOM demodulates only the 2f component in order to extract information from the central point beyond diffraction limit and in our vSPOM study, we also demodulate only the 2f component.
High spatial resolution is the major benefit of conventional SPOM. Previous theories attributed the resolution to the 2nd derivative of Gaussian beam profile [5,6]. The theory relies on Taylor approximation, which does not work accurately for SPOM’s large spatial displacement. Thus, we re-investigated the theory of SPOM in two parts: 1) fixed beam, and 2) spatial modulation to develop a remedy.
2.2 SPOM fixed beam effect and single/double-beam vSPOM
In conventional SPOM, the fixed beam is critical because it establishes the beam overlap volume for spatial modulation. We shall now study its effect. Assuming the scanning beam is at a position x relative to the center of the pixel, in Fig. 1(a) the interaction volume grows as the scanning beam approaches the center of fixed beam, and decays as it leaves. Its signal strength will be proportional to the two-beam overlap volume. Assuming Gaussian beams, the overlap interaction profile as a function of x would be a Gaussian function positioned at the center of the pixel because the convolution of Gaussian functions remains Gaussian. Thus, in conventional SPOM the effect of a fixed Gaussian beam is to introduce a Gaussian amplitude modulation surrounding the pixel center. On the other hand, the absence of fixed beam introduces a uniform interaction profile in this neighborhood. This discovery about the fixed beam effect leads us to develop corresponding single- and double-beam vSPOM.
#198200 - $15.00 USD Received 24 Sep 2013; revised 11 Nov 2013; accepted 11 Nov 2013; published 27 Nov 2013(C) 2013 OSA 2 December 2013 | Vol. 21, No. 24 | DOI:10.1364/OE.21.030007 | OPTICS EXPRESS 30010
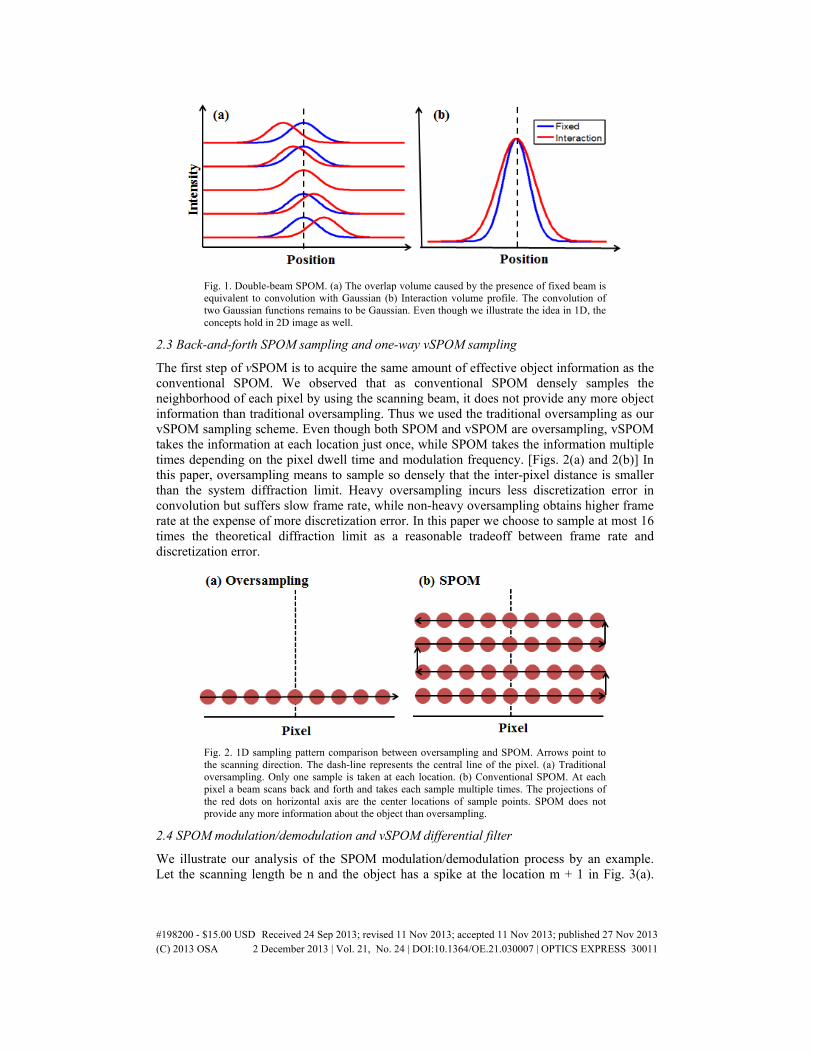
Fig. 1. Double-beam SPOM. (a) The overlap volume caused by the presence of fixed beam is equivalent to convolution with Gaussian (b) Interaction volume profile. The convolution of two Gaussian functions remains to be Gaussian. Even though we illustrate the idea in 1D, the concepts hold in 2D image as well.
2.3 Back-and-forth SPOM sampling and one-way vSPOM sampling
The first step of vSPOM is to acquire the same amount of effective object information as the conventional SPOM. We observed that as conventional SPOM densely samples the neighborhood of each pixel by using the scanning beam, it does not provide any more object information than traditional oversampling. Thus we used the traditional oversampling as our vSPOM sampling scheme. Even though both SPOM and vSPOM are oversampling, vSPOM takes the information at each location just once, while SPOM takes the information multiple times depending on the pixel dwell time and modulation frequency. [Figs. 2(a) and 2(b)] In this paper, oversampling means to sample so densely that the inter-pixel distance is smaller than the system diffraction limit. Heavy oversampling incurs less discretization error in convolution but suffers slow frame rate, while non-heavy oversampling obtains higher frame rate at the expense of more discretization error. In this paper we choose to sample at most 16 times the theoretical diffraction limit as a reasonable tradeoff between frame rate and discretization error.
Fig. 2. 1D sampling pattern comparison between oversampling and SPOM. Arrows point to the scanning direction. The dash-line represents the central line of the pixel. (a) Traditional oversampling. Only one sample is taken at each location. (b) Conventional SPOM. At each pixel a beam scans back and forth and takes each sample multiple times. The projections of the red dots on horizontal axis are the center locations of sample points. SPOM does not provide any more information about the object than oversampling.
2.4 SPOM modulation/demodulation and vSPOM differential filter
We illustrate our analysis of the SPOM modulation/demodulation process by an example. Let the scanning length be n and the object has a spike at the location m + 1 in Fig. 3(a).
#198200 - $15.00 USD Received 24 Sep 2013; revised 11 Nov 2013; accepted 11 Nov 2013; published 27 Nov 2013(C) 2013 OSA 2 December 2013 | Vol. 21, No. 24 | DOI:10.1364/OE.21.030007 | OPTICS EXPRESS 30011
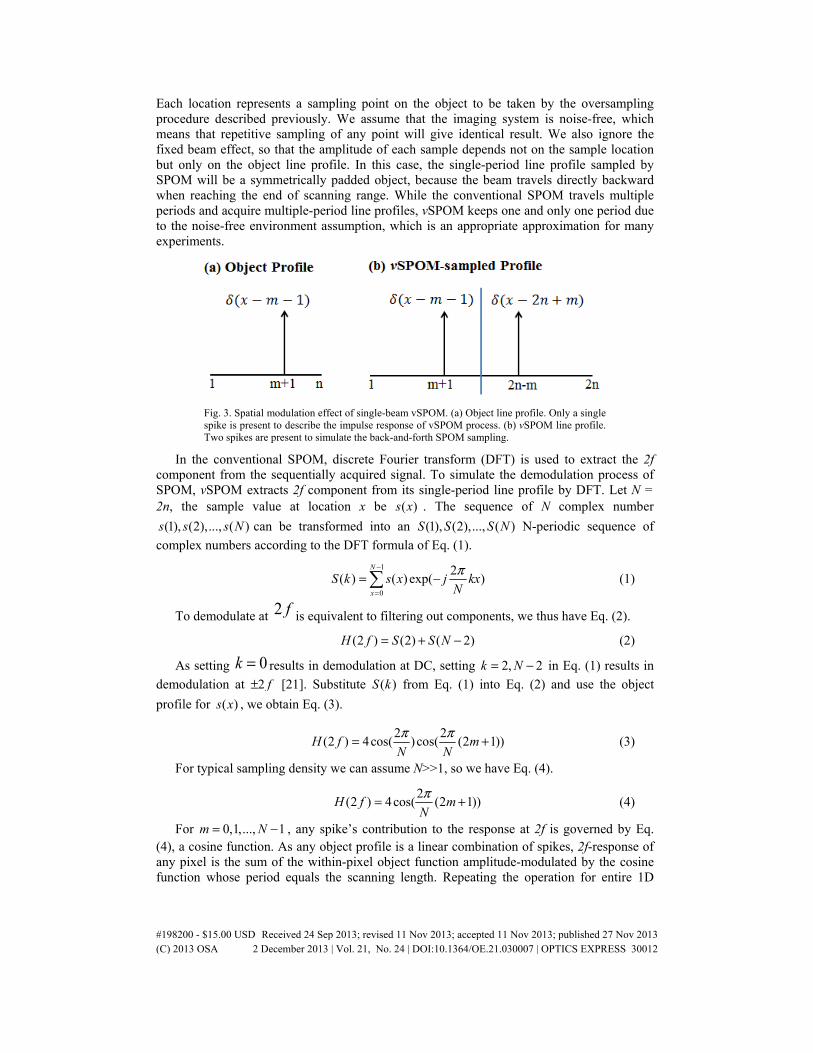
Each location represents a sampling point on the object to be taken by the oversampling procedure described previously. We assume that the imaging system is noise-free, which means that repetitive sampling of any point will give identical result. We also ignore the fixed beam effect, so that the amplitude of each sample depends not on the sample location but only on the object line profile. In this case, the single-period line profile sampled by SPOM will be a symmetrically padded object, because the beam travels directly backward when reaching the end of scanning range. While the conventional SPOM travels multiple periods and acquire multiple-period line profiles, vSPOM keeps one and only one period due to the noise-free environment assumption, which is an appropriate approximation for many experiments.
Fig. 3. Spatial modulation effect of single-beam vSPOM. (a) Object line profile. Only a single spike is present to describe the impulse response of vSPOM process. (b) vSPOM line profile. Two spikes are present to simulate the back-and-forth SPOM sampling.
In the conventional SPOM, discrete Fourier transform (DFT) is used to extract the 2f component from the sequentially acquired signal. To simulate the demodulation process of SPOM, vSPOM extracts 2f component from its single-period line profile by DFT. Let N = 2n, the sample value at location x be ( )s x . The sequence of N complex number
(1), (2),..., ( )s s s N can be transformed into an (1), (2),..., ( )S S S N N-periodic sequence of
complex numbers according to the DFT formula of Eq. (1).
1
0
2( ) ( ) exp( )
N
x
S k s x j kxN
π−
=
= − (1)
To demodulate at 2 f is equivalent to filtering out components, we thus have Eq. (2).
(2 ) (2) ( 2)H f S S N= + − (2)
As setting k = 0 results in demodulation at DC, setting 2, 2k N= − in Eq. (1) results in
demodulation at 2 f± [21]. Substitute ( )S k from Eq. (1) into Eq. (2) and use the object
profile for ( )s x , we obtain Eq. (3).
2 2
(2 ) 4cos( )cos( (2 1))H f mN N
π π= + (3)
For typical sampling density we can assume N>>1, so we have Eq. (4).
2
(2 ) 4cos( (2 1))H f mN
π= + (4)
For 0,1,..., 1m N= − , any spike’s contribution to the response at 2f is governed by Eq. (4), a cosine function. As any object profile is a linear combination of spikes, 2f-response of any pixel is the sum of the within-pixel object function amplitude-modulated by the cosine function whose period equals the scanning length. Repeating the operation for entire 1D
#198200 - $15.00 USD Received 24 Sep 2013; revised 11 Nov 2013; accepted 11 Nov 2013; published 27 Nov 2013(C) 2013 OSA 2 December 2013 | Vol. 21, No. 24 | DOI:10.1364/OE.21.030007 | OPTICS EXPRESS 30012
profile, we find that SPOM modulation/demodulation is equivalent to convolution with the cosine function. This discovery causes us to use cosine and Gabor filters in vSPOM filter bank, both of which are differential filters due to their negative sidelobes. Unlike the Taylor expansion derived by previous works [5,6], Eq. (4) is accurate for large displacement.
2.5 vSPOM procedure
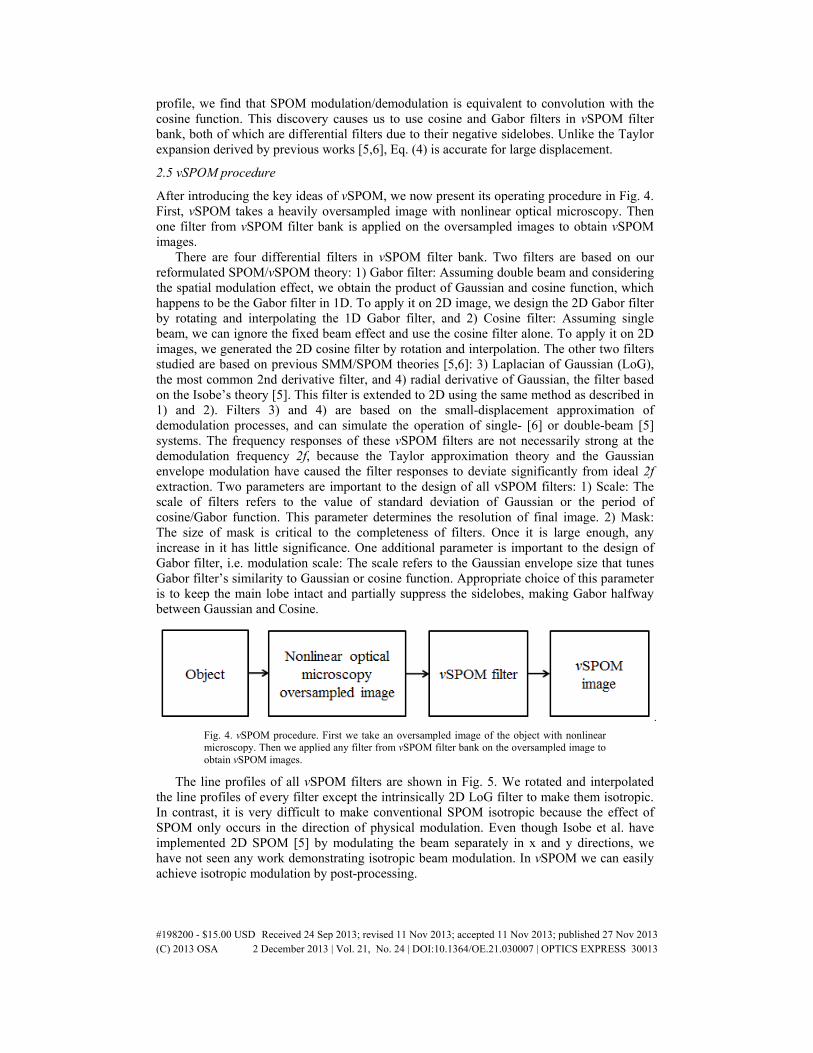
After introducing the key ideas of vSPOM, we now present its operating procedure in Fig. 4. First, vSPOM takes a heavily oversampled image with nonlinear optical microscopy. Then one filter from vSPOM filter bank is applied on the oversampled images to obtain vSPOM images.
There are four differential filters in vSPOM filter bank. Two filters are based on our reformulated SPOM/vSPOM theory: 1) Gabor filter: Assuming double beam and considering the spatial modulation effect, we obtain the product of Gaussian and cosine function, which happens to be the Gabor filter in 1D. To apply it on 2D image, we design the 2D Gabor filter by rotating and interpolating the 1D Gabor filter, and 2) Cosine filter: Assuming single beam, we can ignore the fixed beam effect and use the cosine filter alone. To apply it on 2D images, we generated the 2D cosine filter by rotation and interpolation. The other two filters studied are based on previous SMM/SPOM theories [5,6]: 3) Laplacian of Gaussian (LoG), the most common 2nd derivative filter, and 4) radial derivative of Gaussian, the filter based on the Isobe’s theory [5]. This filter is extended to 2D using the same method as described in 1) and 2). Filters 3) and 4) are based on the small-displacement approximation of demodulation processes, and can simulate the operation of single- [6] or double-beam [5] systems. The frequency responses of these vSPOM filters are not necessarily strong at the demodulation frequency 2f, because the Taylor approximation theory and the Gaussian envelope modulation have caused the filter responses to deviate significantly from ideal 2f extraction. Two parameters are important to the design of all vSPOM filters: 1) Scale: The scale of filters refers to the value of standard deviation of Gaussian or the period of cosine/Gabor function. This parameter determines the resolution of final image. 2) Mask: The size of mask is critical to the completeness of filters. Once it is large enough, any increase in it has little significance. One additional parameter is important to the design of Gabor filter, i.e. modulation scale: The scale refers to the Gaussian envelope size that tunes Gabor filter’s similarity to Gaussian or cosine function. Appropriate choice of this parameter is to keep the main lobe intact and partially suppress the sidelobes, making Gabor halfway between Gaussian and Cosine.
Fig. 4. vSPOM procedure. First we take an oversampled image of the object with nonlinear microscopy. Then we applied any filter from vSPOM filter bank on the oversampled image to obtain vSPOM images.
The line profiles of all vSPOM filters are shown in Fig. 5. We rotated and interpolated the line profiles of every filter except the intrinsically 2D LoG filter to make them isotropic. In contrast, it is very difficult to make conventional SPOM isotropic because the effect of SPOM only occurs in the direction of physical modulation. Even though Isobe et al. have implemented 2D SPOM [5] by modulating the beam separately in x and y directions, we have not seen any work demonstrating isotropic beam modulation. In vSPOM we can easily achieve isotropic modulation by post-processing.
#198200 - $15.00 USD Received 24 Sep 2013; revised 11 Nov 2013; accepted 11 Nov 2013; published 27 Nov 2013(C) 2013 OSA 2 December 2013 | Vol. 21, No. 24 | DOI:10.1364/OE.21.030007 | OPTICS EXPRESS 30013
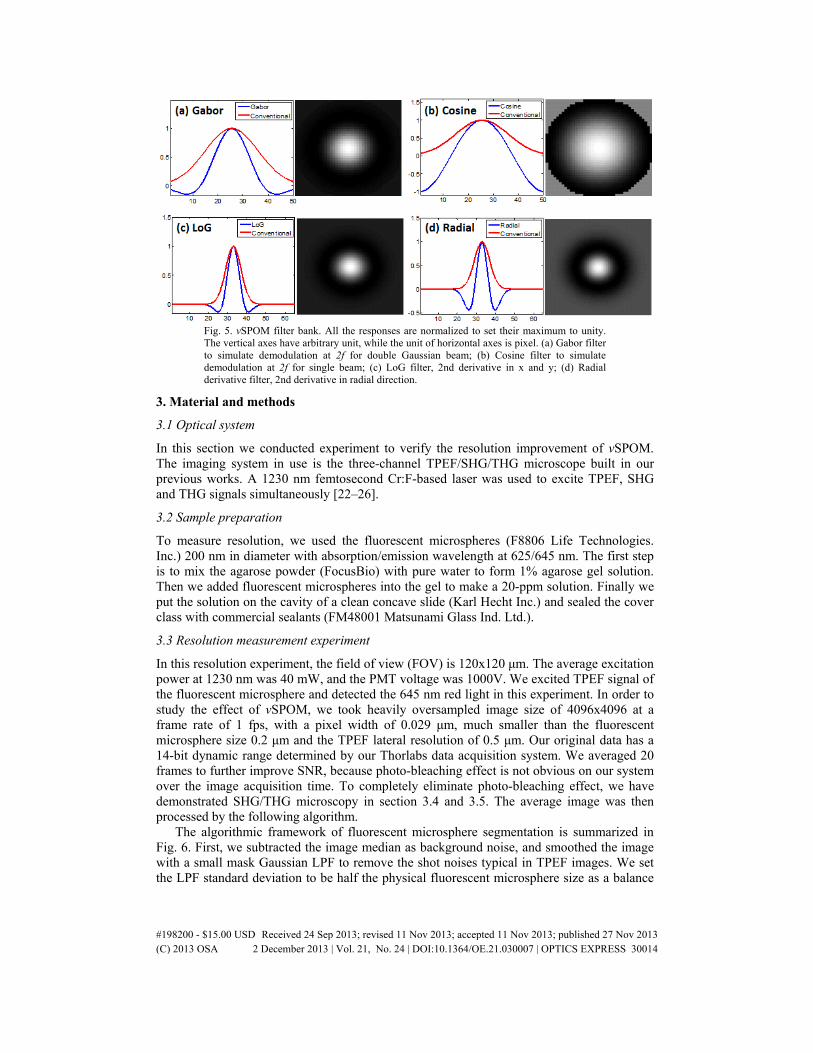
Fig. 5. vSPOM filter bank. All the responses are normalized to set their maximum to unity. The vertical axes have arbitrary unit, while the unit of horizontal axes is pixel. (a) Gabor filter to simulate demodulation at 2f for double Gaussian beam; (b) Cosine filter to simulate demodulation at 2f for single beam; (c) LoG filter, 2nd derivative in x and y; (d) Radial derivative filter, 2nd derivative in radial direction.
3. Material and methods
3.1 Optical system
In this section we conducted experiment to verify the resolution improvement of vSPOM. The imaging system in use is the three-channel TPEF/SHG/THG microscope built in our previous works. A 1230 nm femtosecond Cr:F-based laser was used to excite TPEF, SHG and THG signals simultaneously [22–26].
3.2 Sample preparation
To measure resolution, we used the fluorescent microspheres (F8806 Life Technologies. Inc.) 200 nm in diameter with absorption/emission wavelength at 625/645 nm. The first step is to mix the agarose powder (FocusBio) with pure water to form 1% agarose gel solution. Then we added fluorescent microspheres into the gel to make a 20-ppm solution. Finally we put the solution on the cavity of a clean concave slide (Karl Hecht Inc.) and sealed the cover class with commercial sealants (FM48001 Matsunami Glass Ind. Ltd.).
3.3 Resolution measurement experiment
In this resolution experiment, the field of view (FOV) is 120x120 μm. The average excitation power at 1230 nm was 40 mW, and the PMT voltage was 1000V. We excited TPEF signal of the fluorescent microsphere and detected the 645 nm red light in this experiment. In order to study the effect of vSPOM, we took heavily oversampled image size of 4096x4096 at a frame rate of 1 fps, with a pixel width of 0.029 μm, much smaller than the fluorescent microsphere size 0.2 μm and the TPEF lateral resolution of 0.5 μm. Our original data has a 14-bit dynamic range determined by our Thorlabs data acquisition system. We averaged 20 frames to further improve SNR, because photo-bleaching effect is not obvious on our system over the image acquisition time. To completely eliminate photo-bleaching effect, we have demonstrated SHG/THG microscopy in section 3.4 and 3.5. The average image was then processed by the following algorithm.
The algorithmic framework of fluorescent microsphere segmentation is summarized in Fig. 6. First, we subtracted the image median as background noise, and smoothed the image with a small mask Gaussian LPF to remove the shot noises typical in TPEF images. We set the LPF standard deviation to be half the physical fluorescent microsphere size as a balance
#198200 - $15.00 USD Received 24 Sep 2013; revised 11 Nov 2013; accepted 11 Nov 2013; published 27 Nov 2013(C) 2013 OSA 2 December 2013 | Vol. 21, No. 24 | DOI:10.1364/OE.21.030007 | OPTICS EXPRESS 30014
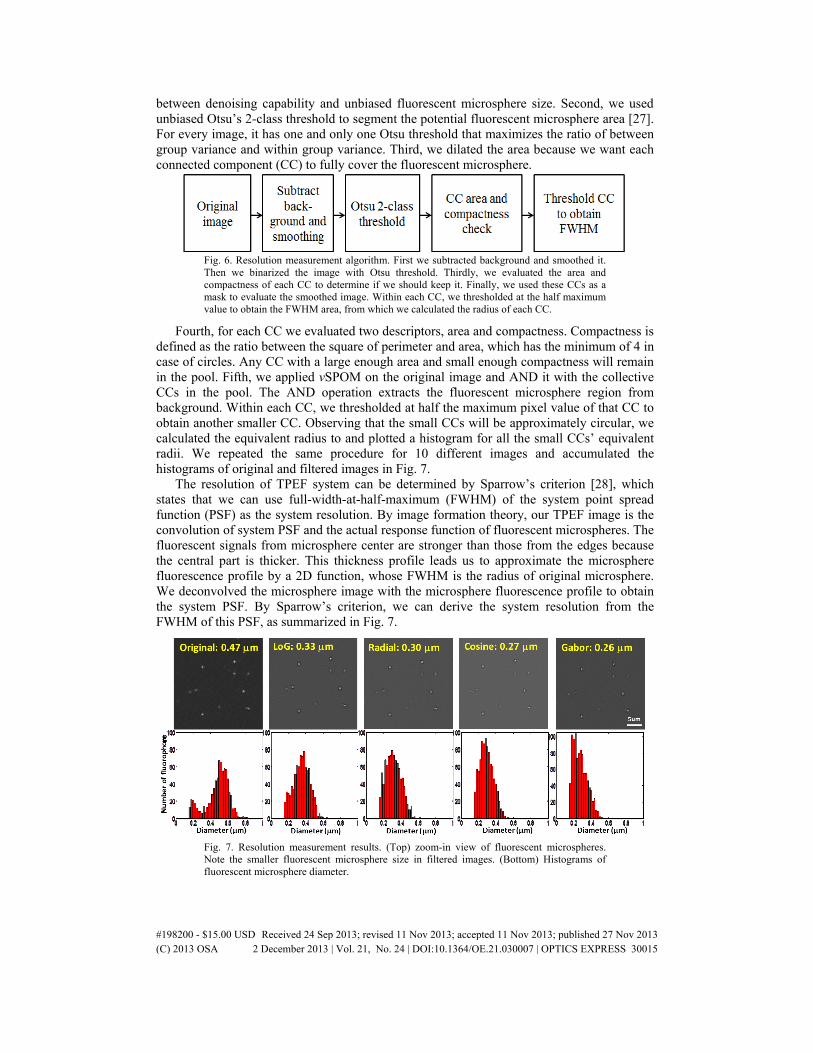
between denoising capability and unbiased fluorescent microsphere size. Second, we used unbiased Otsu’s 2-class threshold to segment the potential fluorescent microsphere area [27]. For every image, it has one and only one Otsu threshold that maximizes the ratio of between group variance and within group variance. Third, we dilated the area because we want each connected component (CC) to fully cover the fluorescent microsphere.
Fig. 6. Resolution measurement algorithm. First we subtracted background and smoothed it. Then we binarized the image with Otsu threshold. Thirdly, we evaluated the area and compactness of each CC to determine if we should keep it. Finally, we used these CCs as a mask to evaluate the smoothed image. Within each CC, we thresholded at the half maximum value to obtain the FWHM area, from which we calculated the radius of each CC.
Fourth, for each CC we evaluated two descriptors, area and compactness. Compactness is defined as the ratio between the square of perimeter and area, which has the minimum of 4 in case of circles. Any CC with a large enough area and small enough compactness will remain in the pool. Fifth, we applied vSPOM on the original image and AND it with the collective CCs in the pool. The AND operation extracts the fluorescent microsphere region from background. Within each CC, we thresholded at half the maximum pixel value of that CC to obtain another smaller CC. Observing that the small CCs will be approximately circular, we calculated the equivalent radius to and plotted a histogram for all the small CCs’ equivalent radii. We repeated the same procedure for 10 different images and accumulated the histograms of original and filtered images in Fig. 7.
The resolution of TPEF system can be determined by Sparrow’s criterion [28], which states that we can use full-width-at-half-maximum (FWHM) of the system point spread function (PSF) as the system resolution. By image formation theory, our TPEF image is the convolution of system PSF and the actual response function of fluorescent microspheres. The fluorescent signals from microsphere center are stronger than those from the edges because the central part is thicker. This thickness profile leads us to approximate the microsphere fluorescence profile by a 2D function, whose FWHM is the radius of original microsphere. We deconvolved the microsphere image with the microsphere fluorescence profile to obtain the system PSF. By Sparrow’s criterion, we can derive the system resolution from the FWHM of this PSF, as summarized in Fig. 7.
Fig. 7. Resolution measurement results. (Top) zoom-in view of fluorescent microspheres. Note the smaller fluorescent microsphere size in filtered images. (Bottom) Histograms of fluorescent microsphere diameter.
#198200 - $15.00 USD Received 24 Sep 2013; revised 11 Nov 2013; accepted 11 Nov 2013; published 27 Nov 2013(C) 2013 OSA 2 December 2013 | Vol. 21, No. 24 | DOI:10.1364/OE.21.030007 | OPTICS EXPRESS 30015
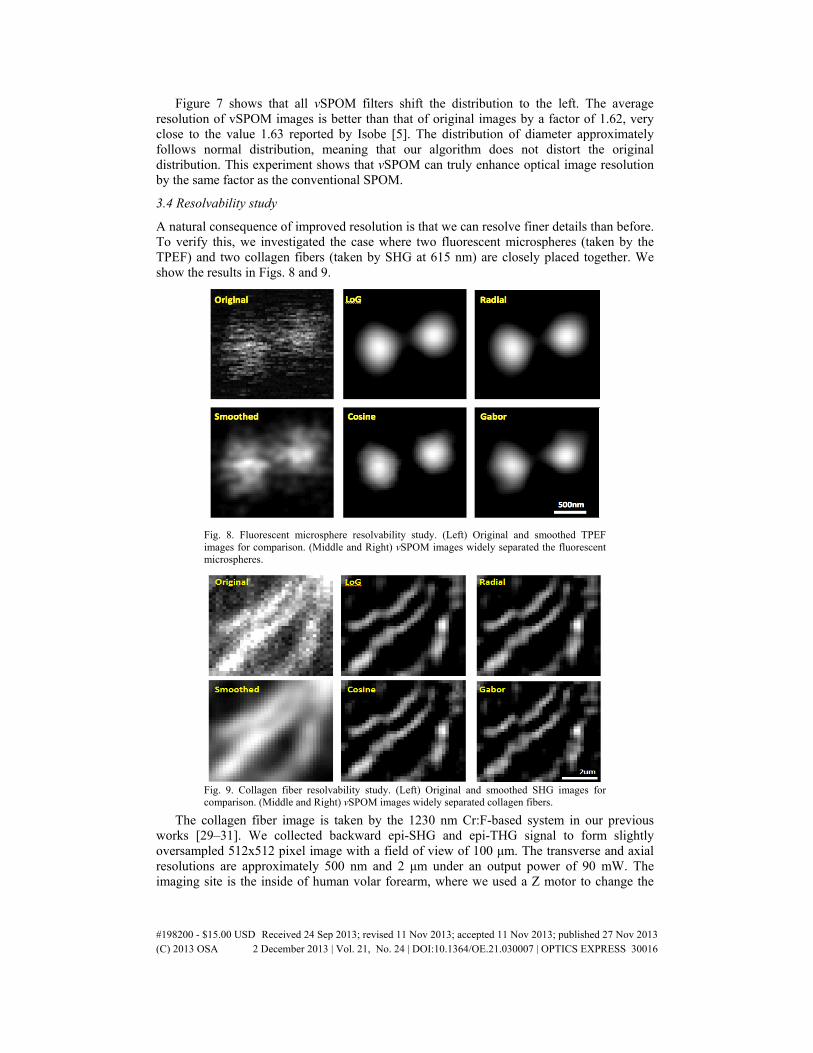
Figure 7 shows that all vSPOM filters shift the distribution to the left. The average resolution of vSPOM images is better than that of original images by a factor of 1.62, very close to the value 1.63 reported by Isobe [5]. The distribution of diameter approximately follows normal distribution, meaning that our algorithm does not distort the original distribution. This experiment shows that vSPOM can truly enhance optical image resolution by the same factor as the conventional SPOM.
3.4 Resolvability study
A natural consequence of improved resolution is that we can resolve finer details than before. To verify this, we investigated the case where two fluorescent microspheres (taken by the TPEF) and two collagen fibers (taken by SHG at 615 nm) are closely placed together. We show the results in Figs. 8 and 9.
Fig. 8. Fluorescent microsphere resolvability study. (Left) Original and smoothed TPEF images for comparison. (Middle and Right) vSPOM images widely separated the fluorescent microspheres.
Fig. 9. Collagen fiber resolvability study. (Left) Original and smoothed SHG images for comparison. (Middle and Right) vSPOM images widely separated collagen fibers.
The collagen fiber image is taken by the 1230 nm Cr:F-based system in our previous works [29–31]. We collected backward epi-SHG and epi-THG signal to form slightly oversampled 512x512 pixel image with a field of view of 100 μm. The transverse and axial resolutions are approximately 500 nm and 2 μm under an output power of 90 mW. The imaging site is the inside of human volar forearm, where we used a Z motor to change the
#198200 - $15.00 USD Received 24 Sep 2013; revised 11 Nov 2013; accepted 11 Nov 2013; published 27 Nov 2013(C) 2013 OSA 2 December 2013 | Vol. 21, No. 24 | DOI:10.1364/OE.21.030007 | OPTICS EXPRESS 30016
relative position between the arm and objective. We started to acquire images at 25 μm below skin surface, acquiring a frame every 5 μm until both THG and SHG signals disappeared, corresponding to a depth deeper than 300 μm. Image frame rate is 2 fps. The entire clinical protocol was approved by National Taiwan University Hospital Research Ethics Committee.
In these figures, we set the negative-value pixels to 0 following the convention of previous works, e.g. Isobe et al. [5]. Compared with the original and smoothed image, vSPOM images have widely separated fluorescent microspheres and collagen fibers. This proves the resolution improvement capability of VSPOM beyond the optical resolution limit.
3.5 In vivo human skin imaging
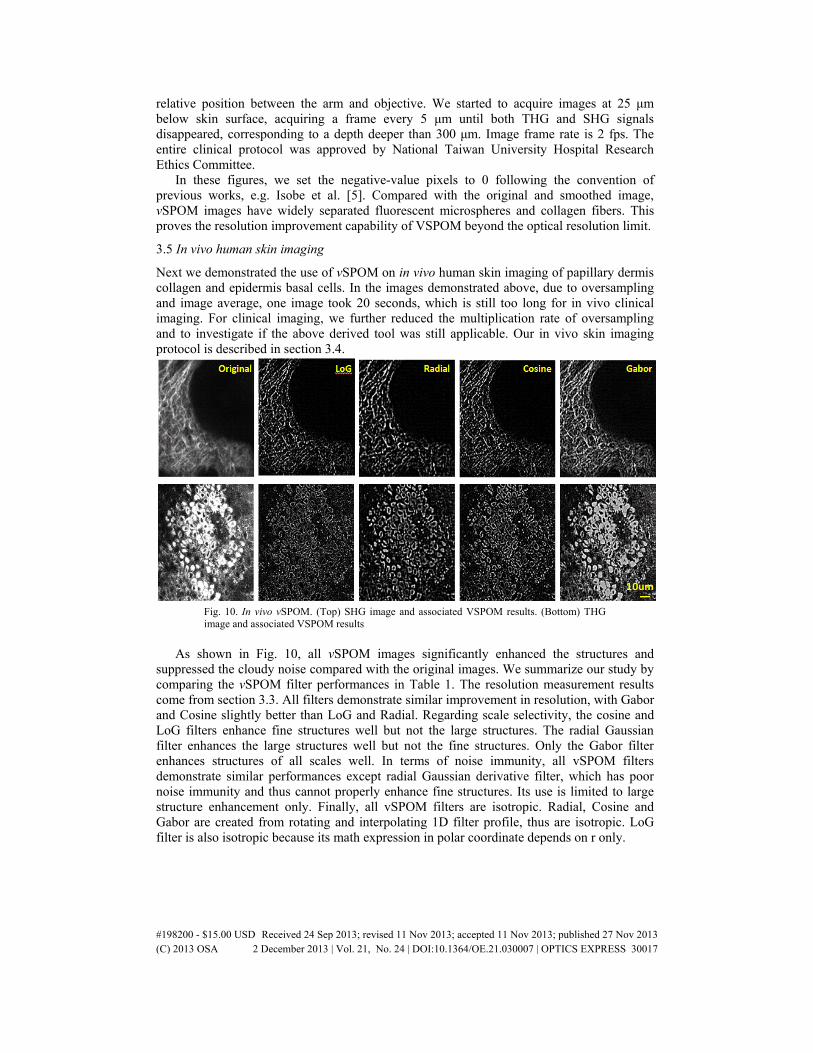
Next we demonstrated the use of vSPOM on in vivo human skin imaging of papillary dermis collagen and epidermis basal cells. In the images demonstrated above, due to oversampling and image average, one image took 20 seconds, which is still too long for in vivo clinical imaging. For clinical imaging, we further reduced the multiplication rate of oversampling and to investigate if the above derived tool was still applicable. Our in vivo skin imaging protocol is described in section 3.4.
Fig. 10. In vivo vSPOM. (Top) SHG image and associated VSPOM results. (Bottom) THG image and associated VSPOM results
As shown in Fig. 10, all vSPOM images significantly enhanced the structures and suppressed the cloudy noise compared with the original images. We summarize our study by comparing the vSPOM filter performances in Table 1. The resolution measurement results come from section 3.3. All filters demonstrate similar improvement in resolution, with Gabor and Cosine slightly better than LoG and Radial. Regarding scale selectivity, the cosine and LoG filters enhance fine structures well but not the large structures. The radial Gaussian filter enhances the large structures well but not the fine structures. Only the Gabor filter enhances structures of all scales well. In terms of noise immunity, all vSPOM filters demonstrate similar performances except radial Gaussian derivative filter, which has poor noise immunity and thus cannot properly enhance fine structures. Its use is limited to large structure enhancement only. Finally, all vSPOM filters are isotropic. Radial, Cosine and Gabor are created from rotating and interpolating 1D filter profile, thus are isotropic. LoG filter is also isotropic because its math expression in polar coordinate depends on r only.
#198200 - $15.00 USD Received 24 Sep 2013; revised 11 Nov 2013; accepted 11 Nov 2013; published 27 Nov 2013(C) 2013 OSA 2 December 2013 | Vol. 21, No. 24 | DOI:10.1364/OE.21.030007 | OPTICS EXPRESS 30017
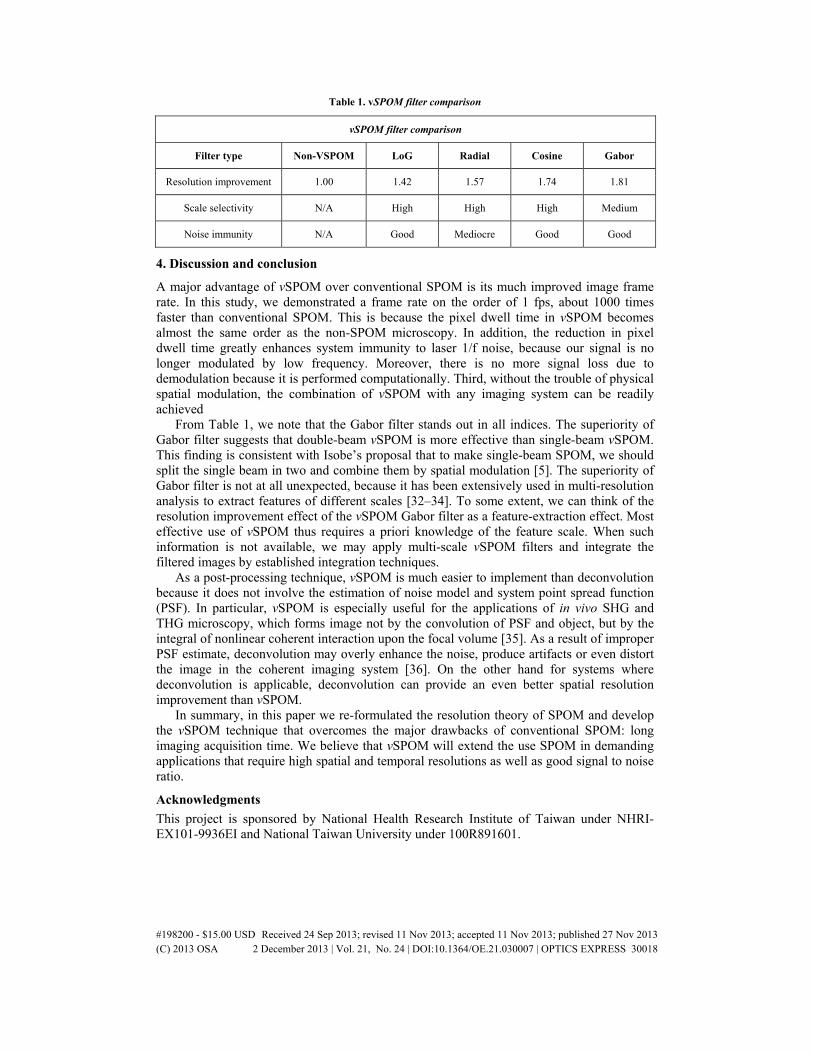
Table 1. vSPOM filter comparison
vSPOM filter comparison
Filter type Non-VSPOM LoG Radial Cosine Gabor
Resolution improvement 1.00 1.42 1.57 1.74 1.81
Scale selectivity N/A High High High Medium
Noise immunity N/A Good Mediocre Good Good
4. Discussion and conclusion
A major advantage of vSPOM over conventional SPOM is its much improved image frame rate. In this study, we demonstrated a frame rate on the order of 1 fps, about 1000 times faster than conventional SPOM. This is because the pixel dwell time in vSPOM becomes almost the same order as the non-SPOM microscopy. In addition, the reduction in pixel dwell time greatly enhances system immunity to laser 1/f noise, because our signal is no longer modulated by low frequency. Moreover, there is no more signal loss due to demodulation because it is performed computationally. Third, without the trouble of physical spatial modulation, the combination of vSPOM with any imaging system can be readily achieved
From Table 1, we note that the Gabor filter stands out in all indices. The superiority of Gabor filter suggests that double-beam vSPOM is more effective than single-beam vSPOM. This finding is consistent with Isobe’s proposal that to make single-beam SPOM, we should split the single beam in two and combine them by spatial modulation [5]. The superiority of Gabor filter is not at all unexpected, because it has been extensively used in multi-resolution analysis to extract features of different scales [32–34]. To some extent, we can think of the resolution improvement effect of the vSPOM Gabor filter as a feature-extraction effect. Most effective use of vSPOM thus requires a priori knowledge of the feature scale. When such information is not available, we may apply multi-scale vSPOM filters and integrate the filtered images by established integration techniques.
As a post-processing technique, vSPOM is much easier to implement than deconvolution because it does not involve the estimation of noise model and system point spread function (PSF). In particular, vSPOM is especially useful for the applications of in vivo SHG and THG microscopy, which forms image not by the convolution of PSF and object, but by the integral of nonlinear coherent interaction upon the focal volume [35]. As a result of improper PSF estimate, deconvolution may overly enhance the noise, produce artifacts or even distort the image in the coherent imaging system [36]. On the other hand for systems where deconvolution is applicable, deconvolution can provide an even better spatial resolution improvement than vSPOM.
In summary, in this paper we re-formulated the resolution theory of SPOM and develop the vSPOM technique that overcomes the major drawbacks of conventional SPOM: long imaging acquisition time. We believe that vSPOM will extend the use SPOM in demanding applications that require high spatial and temporal resolutions as well as good signal to noise ratio.
Acknowledgments
This project is sponsored by National Health Research Institute of Taiwan under NHRI-EX101-9936EI and National Taiwan University under 100R891601.
#198200 - $15.00 USD Received 24 Sep 2013; revised 11 Nov 2013; accepted 11 Nov 2013; published 27 Nov 2013(C) 2013 OSA 2 December 2013 | Vol. 21, No. 24 | DOI:10.1364/OE.21.030007 | OPTICS EXPRESS 30018
Related Documents