A comparison of muscle thin filament models obtained from electron microscopy reconstructions and low-angle X-ray fibre diagrams from non-overlap muscle Katrina J.V. Poole a , Michael Lorenz a , Gwyndaf Evans b , Gerd Rosenbaum c , Alnoor Pirani d , Roger Craig e , Larry S. Tobacman f , William Lehman d , Kenneth C. Holmes a, * a Arbeitsgruppe Biophysik, Max Planck Institut fu ¨ r medizinische Forschung, 69120 Heidelberg, Germany b Diamond Light Source Ltd., Rutherford Appleton Laboratory, Chilton OX11 0DE, UK c Biosciences Division, Argonne National Laboratory, Argonne, IL 60439, USA d Department of Physiology and Biophysics, Boston University School of Medicine, 715 Albany Street, Boston, MA 02118, USA e Department of Cell Biology, University of Massachusetts Medical School, 55 Lake Avenue North, Worcester, MA 01655, USA f Departments of Medicine and Physiology and Biophysics, University of Illinois at Chicago, 840 South Wood Street, Chicago, IL 60612, USA Received 30 January 2006; accepted 14 February 2006 Available online 7 May 2006 Abstract The regulation of striated muscle contraction involves changes in the interactions of troponin and tropomyosin with actin thin filaments. In resting muscle, myosin-binding sites on actin are thought to be blocked by the coiled–coil protein tropomyosin. During muscle activation, Ca 2+ binding to troponin alters the tropomyosin position on actin, resulting in cyclic actin–myosin interactions that accompany muscle con- traction. Evidence for this steric regulation by troponin–tropomyosin comes from X-ray data [Haselgrove, J.C., 1972. X-ray evidence for a conformational change in the actin-containing filaments of verterbrate striated muscle. Cold Spring Habor Symp. Quant. Biol. 37, 341–352; Huxley, H.E., 1972. Structural changes in actin and myosin-containing filaments during contraction. Cold Spring Habor Symp. Quant. Biol. 37, 361–376; Parry, D.A., Squire, J.M., 1973. Structural role of tropomyosin in muscle regulation: analysis of the X-ray diffraction patterns from relaxed and contracting muscles. J. Mol. Biol. 75, 33–55] and electron microscope (EM) data [Spudich, J.A., Huxley, H.E., Finch, J., 1972. Regulation of skeletal muscle contraction. II. Structural studies of the interaction of the tropomyosin–troponin complex with actin. J. Mol. Biol. 72, 619–632; O’Brien, E.J., Gillis, J.M., Couch, J., 1975. Symmetry and molecular arrangement in paracrystals of reconstituted muscle thin filaments. J. Mol. Biol. 99, 461–475; Lehman, W., Craig, R., Vibert, P., 1994. Ca(2+)-induced tropomyosin movement in Lim- ulus thin filaments revealed by three-dimensional reconstruction. Nature 368, 65–67] each with its own particular strengths and limitations. Here we bring together some of the latest information from EM analysis of single thin filaments from Pirani et al. [Pirani, A., Xu, C., Hatch, V., Craig, R., Tobacman, L.S., Lehman, W. (2005). Single particle analysis of relaxed and activated muscle thin filaments. J. Mol. Biol. 346, 761–772], with synchrotron X-ray data from non-overlapped muscle fibres to refine the models of the striated muscle thin filament. This was done by incorporating current atomic-resolution structures of actin, tropomyosin, troponin and myosin subfragment-1. Fitting these atomic coordinates to EM reconstructions, we present atomic models of the thin filament that are entirely consistent with a steric regulatory mech- anism. Furthermore, fitting the atomic models against diffraction data from skinned muscle fibres, stretched to non-overlap to preclude crossbridge binding, produced very similar results, including a large Ca 2+ -induced shift in tropomyosin azimuthal location but little change in the actin structure or apparent alteration in troponin position. Ó 2006 Elsevier Inc. All rights reserved. Keywords: Tropomyosin; Actin; Thin filament structure; Striated muscle activation; Calcium activation; Steric blocking; Myosin crossbridge; Crossbridge binding 1047-8477/$ - see front matter Ó 2006 Elsevier Inc. All rights reserved. doi:10.1016/j.jsb.2006.02.020 * Corresponding author. Fax: +617 638 4273. E-mail address: [email protected] (K.C. Holmes). www.elsevier.com/locate/yjsbi Journal of Structural Biology 155 (2006) 273–284 Journal of Structural Biology

Welcome message from author
This document is posted to help you gain knowledge. Please leave a comment to let me know what you think about it! Share it to your friends and learn new things together.
Transcript

Journal of
www.elsevier.com/locate/yjsbi
Journal of Structural Biology 155 (2006) 273–284
StructuralBiology
A comparison of muscle thin filament models obtainedfrom electron microscopy reconstructions and low-angle
X-ray fibre diagrams from non-overlap muscle
Katrina J.V. Poole a, Michael Lorenz a, Gwyndaf Evans b, Gerd Rosenbaum c,Alnoor Pirani d, Roger Craig e, Larry S. Tobacman f, William Lehman d,
Kenneth C. Holmes a,*
a Arbeitsgruppe Biophysik, Max Planck Institut fur medizinische Forschung, 69120 Heidelberg, Germanyb Diamond Light Source Ltd., Rutherford Appleton Laboratory, Chilton OX11 0DE, UK
c Biosciences Division, Argonne National Laboratory, Argonne, IL 60439, USAd Department of Physiology and Biophysics, Boston University School of Medicine, 715 Albany Street, Boston, MA 02118, USAe Department of Cell Biology, University of Massachusetts Medical School, 55 Lake Avenue North, Worcester, MA 01655, USA
f Departments of Medicine and Physiology and Biophysics, University of Illinois at Chicago, 840 South Wood Street, Chicago, IL 60612, USA
Received 30 January 2006; accepted 14 February 2006Available online 7 May 2006
Abstract
The regulation of striated muscle contraction involves changes in the interactions of troponin and tropomyosin with actin thin filaments.In resting muscle, myosin-binding sites on actin are thought to be blocked by the coiled–coil protein tropomyosin. During muscle activation,Ca2+ binding to troponin alters the tropomyosin position on actin, resulting in cyclic actin–myosin interactions that accompany muscle con-traction. Evidence for this steric regulation by troponin–tropomyosin comes from X-ray data [Haselgrove, J.C., 1972. X-ray evidence for aconformational change in the actin-containing filaments of verterbrate striated muscle. Cold Spring Habor Symp. Quant. Biol. 37, 341–352;Huxley, H.E., 1972. Structural changes in actin and myosin-containing filaments during contraction. Cold Spring Habor Symp. Quant. Biol.37, 361–376; Parry, D.A., Squire, J.M., 1973. Structural role of tropomyosin in muscle regulation: analysis of the X-ray diffraction patternsfrom relaxed and contracting muscles. J. Mol. Biol. 75, 33–55] and electron microscope (EM) data [Spudich, J.A., Huxley, H.E., Finch, J.,1972. Regulation of skeletal muscle contraction. II. Structural studies of the interaction of the tropomyosin–troponin complex with actin. J.Mol. Biol. 72, 619–632; O’Brien, E.J., Gillis, J.M., Couch, J., 1975. Symmetry and molecular arrangement in paracrystals of reconstitutedmuscle thin filaments. J. Mol. Biol. 99, 461–475; Lehman, W., Craig, R., Vibert, P., 1994. Ca(2+)-induced tropomyosin movement in Lim-ulus thin filaments revealed by three-dimensional reconstruction. Nature 368, 65–67] each with its own particular strengths and limitations.Here we bring together some of the latest information from EM analysis of single thin filaments from Pirani et al. [Pirani, A., Xu, C., Hatch,V., Craig, R., Tobacman, L.S., Lehman, W. (2005). Single particle analysis of relaxed and activated muscle thin filaments. J. Mol. Biol. 346,761–772], with synchrotron X-ray data from non-overlapped muscle fibres to refine the models of the striated muscle thin filament. This wasdone by incorporating current atomic-resolution structures of actin, tropomyosin, troponin and myosin subfragment-1. Fitting these atomiccoordinates to EM reconstructions, we present atomic models of the thin filament that are entirely consistent with a steric regulatory mech-anism. Furthermore, fitting the atomic models against diffraction data from skinned muscle fibres, stretched to non-overlap to precludecrossbridge binding, produced very similar results, including a large Ca2+-induced shift in tropomyosin azimuthal location but little changein the actin structure or apparent alteration in troponin position.� 2006 Elsevier Inc. All rights reserved.
Keywords: Tropomyosin; Actin; Thin filament structure; Striated muscle activation; Calcium activation; Steric blocking; Myosin crossbridge; Crossbridgebinding
1047-8477/$ - see front matter � 2006 Elsevier Inc. All rights reserved.
doi:10.1016/j.jsb.2006.02.020
* Corresponding author. Fax: +617 638 4273.E-mail address: [email protected] (K.C. Holmes).

274 K.J.V. Poole et al. / Journal of Structural Biology 155 (2006) 273–284
1. Introduction
1.1. Comparing EM results with X-ray fibre diagrams
The interpretation of X-ray fibre diagrams from musclethin filaments is model dependent, particularly with respectto the possible contributions of troponin. Therefore in thefollowing we have tried to combine the results of suchexperiments with the EM1 studies of the changes in the thinfilament induced by adding and removing Ca2+. Since mostof the EM studies of thin filaments in various states havebeen obtained by negative staining, the possible effects ofnegative stain itself and the classification of particle struc-ture types may need to be considered. The X-ray diffractionstudies provide observations close to physiological condi-tions that can be used to check and calibrate the EMresults. In the following study we compare the EM studiesreported in Pirani et al. (2005, 2006) with measurements ofthe changes in the low-angle X-ray fibre diagrams fromchemically skinned muscles stretched to non-overlap(Poole et al., 1995a,b).
1.2. Components of the thin filament
Thin filaments from vertebrate skeletal muscle havethree essential components: actin, tropomyosin and tropo-nin. The actin filament consists of a helical array of actinmonomers (42 kDa molecular weight) arranged on a sin-gle-start helix (Hanson and Lowy, 1963) with 28 moleculesin 13 left-handed turns repeating in 770 A (sometimes thevery similar symmetry 13 molecules in 6 turns repeatingin 357.5 A is seen, the actual number varies slightly withconditions (Oda et al., 2001)). The actin molecule existsin two forms: globular (g-) and fibrous (f-). The crystalstructure of g-actin has been determined by X-ray crystal-lography (Kabsch et al., 1990; McLaughlan et al., 1993;Otterbein et al., 2001; Schutt et al., 1993). The structureof the actin filament has been determined by taking theg-actin crystal structure and refining it to fit the X-ray fibrediffraction patterns (Holmes et al., 2003, 1990; Lorenzet al., 1993; Tirion et al., 1995). The various refinementsof f-actin yield similar but distinct results for the structureof f-actin, which reflect the fact that the fibre diagrams donot have enough resolving power to determine the struc-ture uniquely. The structure obtained depends on the con-straints used in the refinement. Because the rotation peractin monomer is 167� (close to 180�) the apparent mor-phology of the actin filament is two intertwined right-hand-ed helices each repeating every 770 A. These helices areknown as the long-pitch helices.
1 Abbreviations used: EM, electron microscopy; Ca2+ calcium ions; TM,tropomyosin; TN, troponin; J2, second order Bessel function; J4, fourthorder Bessel function; S1, myosin subfragement-1; EGTA, ethylene glycolbis (2 aminoethyl ether)—N,N,N 0N 0-tetraacetic acid; ATP, adenosinetriphosphate; KPr, potassium propionate; MgAc, magnesium acetate;MOPS, morpholinopropane sulphonate; NaN3, sodium azide; DTT,dithiothreitol; BDM, 2,3-butanedione monoxime.
Tropomyosin consists of two polypeptide chains, eachof ca. 35 kDa molecular weight, that wrap round eachother to form an a-helical coiled–coil (for review see Perry,2001). This coiled–coil is intrinsically bent into a coiled–coiled coil by patches of alanine residues in the d or a posi-tion of the coiled–coil (Brown et al., 2001; Whitby andPhillips, 2000). The coiled–coiled coil takes on the formof the actin long-pitch helix. The binding of tropomyosinand actin is primarily electrostatic in nature (Hill et al.,1992; Willadsen et al., 1992). Tropomyosin is highly nega-tively charged and appears to lie along the long-pitch helixin a region that is relatively positively charged on the actinsurface in the unregulated thin filament (Lorenz et al.,1995). The pseudo sevenfold repeat in the tropomyosinsequence (Parry, 1974, 1975a; McLachlan and Stewart,1976) and the coiled–coil cross-over of 137 A (Parry,1975b) ensure that each actin in the seven that lie undera tropomyosin has a similar environment. The tropomyo-sin molecules aggregate end-to-end to form two continuousstrands running along the long-pitch helix.
The striated muscle troponin complex of components I,T, & C has a molecular weight ca. 80 kDa (Greaser andGergely, 1971, 1973) and binds regularly to the tropomyo-sin every 385 A (i.e. every 7 actins along the long pitchhelix), probably at the overlap between neighbouringtropomyosin molecules (Tobacman, 1996; White et al.,1987). In support of this hypothesis, artificially shortenedtropomyosins produce more tightly spaced troponins (Leh-man et al., 2001). Troponin also binds to actin (Hitchcocket al., 1973; Potter and Gergely, 1974). The vertebrate skel-etal troponin structure, minus the ca. 20 kDa TnT-1domain, has been solved recently (Vinogradova et al.,2005). By combining crystal structures and EM images amolecular model of the arrangement of actin, troponinand tropomyosin has recently been produced (Piraniet al., 2006) and has been used in the present diffractionmodelling study.
1.3. X-ray fibre diagrams
Skeletal muscle yields a rich low-angle X-ray fibre dif-fraction pattern, which shows two sets of overlapping layerlines, arising from the actin thin filaments and from themyosin thick filaments. Since the repeat distances alongthe helices of the two filament types are different, thesetwo sets of layer lines can be identified. In the literaturethe actin layer-line pattern is generally indexed using ahelix of 13 subunits in 6 left-handed turns, with a longrepeat of 357.5 A, or using the very similar helix of 28 sub-units in 13 turns which has a long repeat of 770 A. We usethe latter in this study since it is very close to the symmetryobserved in the EM studies. Over thirty years ago it wasshown that the addition of calcium to glycerinated rabbitpsoas muscle or the electrical stimulation of intact frogmuscle had a large effect on the intensity of the J4 Besselfunction contribution on what is termed the 2nd layer-lineof a 13/6 helix or the 4th layer-line of a 28/13 helix. The

K.J.V. Poole et al. / Journal of Structural Biology 155 (2006) 273–284 275
strength of the J4 term is a measure of the fourfold symme-try of the thin-filament. It was proposed that the increase infourfoldedness originated in an azimuthal movement of thelong tropomyosin molecule around the actin filament inresponse to the presence of Ca2+ ions. The tropomyosinapparently moves from a position that shows strong two-fold symmetry (reflected in the strength of the J2 Besselfunction term) to a position with stronger fourfold symme-try (Haselgrove, 1972; Huxley, 1972; Parry and Squire,1973). This movement has been confirmed by 3D recon-structions of EM images of thin-filaments with and withoutCa2+ (Lehman et al., 1994, 1995; Milligan and Flicker,1987; Pirani et al., 2005; Vibert et al., 1997).
1.4. Unregulated thin filaments
The naked actin filament is unregulated. Myosin cross-bridges have full access to their binding sites on each actinmonomer. In the absence of troponin, striated muscletropomyosin binds weakly to the filament and much ofits stability on actin appears to be determined by its endto end interactions (Mak and Smillie, 1981). In this stateit does not block crossbridge binding but does confer coop-erativity upon the process (McKillop and Geeves, 1993).Analysis of X-ray fibre diffraction patterns of orientatedgels from such preparations indicated that the tropomyosinis not touching the actin surface at a radius close to 39 A(Lorenz et al., 1995). Its azimuthal position can also befound and energy refinements suggested that this may bedetermined by electrostatic interactions.
1.5. Regulation
Only in the presence of tropomyosin and the troponinmolecule is the filament fully regulated (Ebashi et al.,1969). Biochemical solution studies have shown that inthe absence of calcium the crossbridge binding sites areunavailable and the steric blocking model proposes thatthe tropomyosin lies over the bridge binding sites. Thealternative model would involve a troponin–tropomyosin-mediated allosteric change of the myosin binding sitesalong actin.
On calcium binding to troponin the biochemical proper-ties of the filament become similar to those of the troponin-free filament where crossbridges can bind but where thetropomyosin confers cooperativity on this binding (Greeneand Eisenberg, 1980; McKillop and Geeves, 1993). Asdescribed above, earlier X-ray measurements have shownthat the calcium induced structural change considerablystrengthens the fourfold symmetry of the thin filament indi-cated by a strengthening of the J4 term on the so called 2ndactin layer-line (indexed as 4th layer-line in the presentstudy); see review by Squire and Morris, 1998. The stericblocking model suggests that changes in the troponin causethe tropomyosin to be released from its blocking positionand move off the binding sites to a new position. However,solution studies show that only after the first bridges bind
are the rest of the sites on actin made fully available forunhindered binding of bridges, implying that the first fewbridges may hold the tropomyosin further back off thebinding site in a third position (Lehrer and Morris, 1982;review by Gordon et al., 2000). The solution kinetics stud-ies of McKillop and Geeves (1993), have named these threestates of the thin filament ‘‘blocked,’’ ‘‘closed,’’ and‘‘open.’’ We shall refer to these states again later in the dis-cussion of our structural findings.
1.6. Non-overlap muscle as a specimen of well orientated thin
filaments
Chemically skinned rabbit psoas muscle can be pulledout well beyond the point where the thick, myosin contain-ing filaments overlap with the thin actin filaments (Pooleet al., 1995b). On account of the connective filaments sucha titin that span the sarcomere, the orientation of the fila-ments in such samples is particularly good: they yield excel-lent low-angle X-ray fibre diagrams. Moreover, the actinand myosin are well separated so that we could show thatno interactions take place. Using such samples and anintense highly collimated synchrotron X-ray source andFuji X-ray imaging plates it is possible to register thelow-angle actin layer-lines rapidly and accurately. Further-more, it is possible to measure the effects of adding andremoving Ca2+ ions (by irrigating with salt solutions atpCa 8 or pCa 4) on the strength of the J2 and J4 terms ina reproducible way, by cycling between the states.
2. Fitting atomic models to the EM 3D reconstructions
To compare the X-ray diffraction results with the EMreconstructions, we have first fitted atomic coordinates tothe EM reconstructions. These can then be used to modelthe low-angle X-ray fibre diffraction. The EM data fromPirani et al. (2005) was taken as the basis of the followingstudy. The three reconstructions, EGTA, Ca2+ and theRigor complex were fitted to atomic models of actin, tropo-myosin and the actin-crossbridge complex. The helicalsymmetry of these reconstructions was close to 28/13repeating in 770 A. The actin model was taken fromHolmes et al. (2003). Tropomyosin was generated as acoiled–coiled coil to follow the long pitch helix coil usingthe algorithm described in Lorenz et al. (1995). The azi-muthal and axial positions of actin and the azimuthal posi-tion of tropomyosin that gave a best fit to the EM mapwere determined by a least squares procedure (Holmeset al., 2003). The resolution of the EM maps was takenas 22 A. On account of the limited resolution, the axialposition of the tropomyosin along the long-pitch helixwas indeterminate; a recent proposal in this regard (Brownet al., 2005) was not tested in the present work. The radiusof the tropomyosin was established by trial and error. Forthe fitting to the rigor map the actin–myosin complex fromHolmes et al. (2003) was fitted in place of actin. The resultsare shown in Figs. 1 and 2.
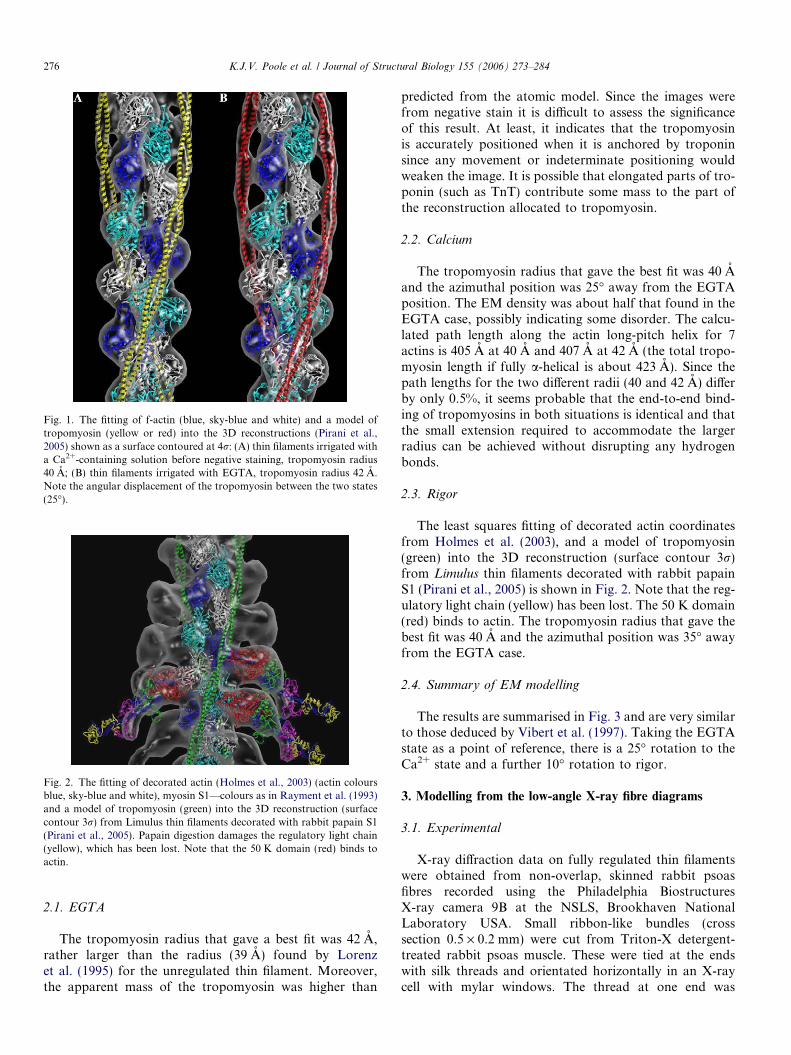
Fig. 1. The fitting of f-actin (blue, sky-blue and white) and a model oftropomyosin (yellow or red) into the 3D reconstructions (Pirani et al.,2005) shown as a surface contoured at 4r: (A) thin filaments irrigated witha Ca2+-containing solution before negative staining, tropomyosin radius40 A; (B) thin filaments irrigated with EGTA, tropomyosin radius 42 A.Note the angular displacement of the tropomyosin between the two states(25�).
Fig. 2. The fitting of decorated actin (Holmes et al., 2003) (actin coloursblue, sky-blue and white), myosin S1—colours as in Rayment et al. (1993)and a model of tropomyosin (green) into the 3D reconstruction (surfacecontour 3r) from Limulus thin filaments decorated with rabbit papain S1(Pirani et al., 2005). Papain digestion damages the regulatory light chain(yellow), which has been lost. Note that the 50 K domain (red) binds toactin.
276 K.J.V. Poole et al. / Journal of Structural Biology 155 (2006) 273–284
2.1. EGTA
The tropomyosin radius that gave a best fit was 42 A,rather larger than the radius (39 A) found by Lorenzet al. (1995) for the unregulated thin filament. Moreover,the apparent mass of the tropomyosin was higher than
predicted from the atomic model. Since the images werefrom negative stain it is difficult to assess the significanceof this result. At least, it indicates that the tropomyosinis accurately positioned when it is anchored by troponinsince any movement or indeterminate positioning wouldweaken the image. It is possible that elongated parts of tro-ponin (such as TnT) contribute some mass to the part ofthe reconstruction allocated to tropomyosin.
2.2. Calcium
The tropomyosin radius that gave the best fit was 40 Aand the azimuthal position was 25� away from the EGTAposition. The EM density was about half that found in theEGTA case, possibly indicating some disorder. The calcu-lated path length along the actin long-pitch helix for 7actins is 405 A at 40 A and 407 A at 42 A (the total tropo-myosin length if fully a-helical is about 423 A). Since thepath lengths for the two different radii (40 and 42 A) differby only 0.5%, it seems probable that the end-to-end bind-ing of tropomyosins in both situations is identical and thatthe small extension required to accommodate the largerradius can be achieved without disrupting any hydrogenbonds.
2.3. Rigor
The least squares fitting of decorated actin coordinatesfrom Holmes et al. (2003), and a model of tropomyosin(green) into the 3D reconstruction (surface contour 3r)from Limulus thin filaments decorated with rabbit papainS1 (Pirani et al., 2005) is shown in Fig. 2. Note that the reg-ulatory light chain (yellow) has been lost. The 50 K domain(red) binds to actin. The tropomyosin radius that gave thebest fit was 40 A and the azimuthal position was 35� awayfrom the EGTA case.
2.4. Summary of EM modelling
The results are summarised in Fig. 3 and are very similarto those deduced by Vibert et al. (1997). Taking the EGTAstate as a point of reference, there is a 25� rotation to theCa2+ state and a further 10� rotation to rigor.
3. Modelling from the low-angle X-ray fibre diagrams
3.1. Experimental
X-ray diffraction data on fully regulated thin filamentswere obtained from non-overlap, skinned rabbit psoasfibres recorded using the Philadelphia BiostructuresX-ray camera 9B at the NSLS, Brookhaven NationalLaboratory USA. Small ribbon-like bundles (crosssection 0.5 · 0.2 mm) were cut from Triton-X detergent-treated rabbit psoas muscle. These were tied at the endswith silk threads and orientated horizontally in an X-raycell with mylar windows. The thread at one end was

Fig. 4. Shown as half films are X-ray fibre diagrams (intensities are colourcoded) obtained from non-overlap skinned rabbit psoas muscle in thepresence and absence of Ca2+. Note that central scattering dominates thepattern. The J2 and J4 terms are marked. The considerable strengtheningof the J4 term produced by bathing the muscle in a Ca2+ containingsolution can be seen.
Fig. 3. The positions of tropomyosin in EGTA (red), Ca2+ (yellow) andrigor (green) as deduced from EM reconstructions. These agree with thevalues reported by Vibert et al. (1997).
K.J.V. Poole et al. / Journal of Structural Biology 155 (2006) 273–284 277
passed over a wheel and a small weight was applied tostretch the muscle slowly beyond non-overlap (ca.3.7 lm) in an ATP relaxing solution, containing BDMas an additional relaxant. On transferring fibres (4.4 lmsarcomere length) from an ATP relaxing solution to arigor solution no actin layer-line intensification couldbe seen. We could then be sure that any calcium or saltinduced changes observed in the X-ray fibre diagramcould not be attributed to the effects of crossbridge bind-ing. Experiments were performed at 2 �C, and patternswere taken using the Fuji imaging plate system (1 minexposure times at a camera length of 0.6–1 m and1.5 A X-ray wavelength). Bathing solutions contained70 mM K Propionate, 20 mM MOPS, 5 mM EGTA,1 mM free MgAcetate, 5 mM DTT. ATP solutions had7 mM MgATP, 8 mM MgAcetate and 5 mM BDM. Incalcium solutions 5 mM EGTA was replaced by 5 mMCaEGTA giving a pCa. of ca 4. 1 mM; free calciumwas also tested to check the calcium effects measuredwere saturated. A comparison of patterns before andafter ATP removal showed no changes in the actin partof the diffraction pattern. On adding Ca2+ the majorchanges occurred on the 1st and 2nd layer-lines (hereindexed as 2nd and 4th) as observed previously in geland activated muscle studies (Maeda et al., 1988; Poppand Maeda, 1993; Yagi and Matsubara, 1989). Patternsfrom the non-overlap rabbit preparations proved remark-ably stable in X-rays, more so than the equivalent over-lapped preparations, and it was possible to demonstratethat the effects measured were reversible, reproducibleand titratable (Poole et al., 1995b).
3.2. Low-angle scattering background
The X-ray fibre diagram from non-overlap skinned rab-bit psoas muscle in the absence of ATP is dominated bylow angle scattering from the unattached and disorderedmyosin crossbridges (Lowy et al., 1991; Lowy and Poulsen,1990). This scattering overlays the signal from the J2 termon the 2nd actin layer-line. Therefore, this signal has to beextracted by subtracting a steeply rising central scatteringpeak. The background (central scattering) values weredetermined between the actin layer-lines and interpolatedwith spline functions. However, since the value of the back-ground is many times stronger than the signal in the J2 areanear the equator of the pattern, the J2 peak is subject toerror. The problem is much less severe for the J4 term onthe 4th layer-line since the central scattering is much weak-er here. The raw data for the EGTA case and Ca2+ casesare shown in Fig. 4.
3.3. Fitting the EGTA case
The diffraction pattern calculated from the atomic coor-dinates generated by fitting the EM density obtained inEGTA was calculated using the methods given in Holmeset al. (1990) and was compared with the observed dataobtained by stripping off the background (central scatter).The disorientation parameter (Holmes and BarringtonLeigh, 1974) was found by trial and error to be 2.0� andthe layer-line half-width was 0.00025 A�1. The generatedcoordinates of the full molecule of tropomyosin were usedbut were weighted down to take account of the fact thatthere are 7 actins per tropomyosin. The 59 A layer-line(13th layer-line) was used to scale the two data sets. Theresults of a comparison of observed and modelled dataare shown in Fig. 5A. Noteworthy is the radial positionof the calculated J2 term: the observed J2 term lies at asmaller radius than the calculated J2 term. Some of this

Fig. 5. Experimental data from muscle fibres in EGTA with the central scatter subtracted is shown (colour coded) in two quadrants (upper-right, lower-left) compared with the fibre diffraction pattern in the other two quadrants calculated from the models described above: (A) model data: the EGTAposition of tropomyosin and actin; (B) model data; the EGTA position of tropomyosin with troponin and actin. Note that the troponin, which lies at alarge radius, contributes at low-reciprocal space radii and thereby pushed the calculated peak of the J2 term to a smaller radius, which improves theagreement with the observed data (the background stripping is difficult near the equator for the J2 layer-line and this may account for some of theremaining discrepancy). The J4 term is too weak to show up in this colour coding. The observed and calculated data were scaled on the 59 A layer-line. Theextra near-meridional intensities in the observed data arise largely from the thick filament and are not considered in the present discussion.
Fig. 6. A model of the thin filament in the blocked state proposed byPirani et al. (2006). Shown are actin molecules (blue and white),tropomyosin (red) in the blocked position, troponin C (magenta),troponin I (TnI) (light blue) and troponin T (TnT) (yellow) in the EGTAform. Not all of the structure was resolved in the crystallography(Vinogradova et al., 2005). Most of the TnC is visible, ca. 80% of the TnI,but only ca. 35% of the TnT, since the aggregate-inducing N-terminalhelix, TnT-1, was removed and a few C terminal residues remainedunresolved. Thus ca. 65% of the core troponin structure has been used inour modelling.
278 K.J.V. Poole et al. / Journal of Structural Biology 155 (2006) 273–284
effect might arise from inaccurate background fitting.However, we considered the possible contribution of tropo-nin. Pirani et al. (2006) have proposed an atomic model forthe actin troponin, tropomyosin complex. We took the tro-ponin from this model and positioned it in the correspond-ing place in our model (Fig. 6). The calculated diffractionpattern now looks more like the observed (Fig. 5B). Thiscomes about because the troponin complex, which isattached to domain 1 in actin, lies at a large radius andtherefore its effects are to enhance the intensity at smallradius in reciprocal space (i.e. it moves the J2 peak intowards the meridian). The troponin was included in allsubsequent calculations.
The calculated low value of the J4 term was in very goodagreement with the observed value. The J4 peak was esti-mated to be <5% of the integrated intensity of the 59 Alayer-line in EGTA. The observed diffraction pattern iswell accounted for by the atomic model derived from theEM observations and we used it as the point of referencefor all ensuing calculations.
3.4. Difference patterns
The presence of a steeply changing diffuse low-anglescattering background makes it difficult to determine theJ2 term near the equator of the pattern. However, in thisexperiment the diffuse scatter does not change on additionof calcium, so the subtraction of one pattern from the othercompletely removes the background and leaves only calci-um induced layer-line changes, which can then be accurate-ly measured. The sample can be cycled a number of timesbetween the two states and yields reproducible results,showing that the troponin control system remains fullyactive. The most obvious changes seen are on the 2nd,4th and 13th (59 A) layer-lines. The difference patternbetween the EGTA and the Ca2+ state are shown in Fig. 7.

K.J.V. Poole et al. / Journal of Structural Biology 155 (2006) 273–284 279
3.5. Modelling the difference patterns
An objective way of evaluating these data is to comparethe integrated values of the J2 and J4 terms from the differ-ence pattern with the calculated difference values on mov-ing the tropomyosin round azimuthally from the EGTAposition (for this calculation the radius was kept at42 A—a change to 40 A has a minimal effect). Troponin(see Fig. 6) was included in this calculation in the constantposition proposed by Pirani et al. (2006). In Fig. 8 the val-ues of the changes in the J2 and J4 terms as a function ofthe angular position of tropomyosin measured from theEGTA position are shown together with the measured val-ues (shown as straight lines). All values are expressed as afraction of the integrated intensity of the 59 A layer-line inEGTA. The lines cross at 15�: both the J2 and J4 data canbe accounted for by an azimuthal movement of 15�.
3.5.1. Moving troponin
We tried moving troponin round azimuthally whileleaving the tropomyosin in the EGTA position (see alsoSquire and Morris, 1998). This had very little effect(Fig. 8). We also tried moving the troponin with thetropomyosin (data not shown). This was very similarto the effect of moving tropomyosin alone. It appearsthat moving troponin on its own account cannot accountfor the observed differences. Note that the crystal struc-ture of troponin in EGTA used in the modelling (Vinog-radova et al., 2005) is incomplete and, in particular, anelongated (probably helical portion) of troponin T,TnT-1, is missing. If this were to lie at a radius similarto tropomyosin then interference effects would occur.However, using a 15 kDa extended piece of helix, ourmodelling shows that, depending on its behaviour on cal-cium binding, it could alter the best fits presented hereby maximally 5�, but no more.
3.5.2. Azimuthal disorderA Gaussian distribution of the azimuthal position of a
molecule with an angular standard deviation r (in radians)leads to a weakening of the Bessel function term of order n
by a factor
expð�r2n2=2Þ:We calculated the effects on the J2 and J4 terms (n = 2,n = 4) of subjecting the tropomyosin to a Gaussian disor-der with standard deviation r = 10� (±6 A). These areshown in Fig. 7. Introducing disorder leads to a bigger azi-muthal movement for a given change in the size of the J4
term. The effect on the J2 term is marginal.
3.6. Crossbridge binding
To determine the effects of crossbridge binding on theabove system we activated a relaxed overlapped muscle.The detergent skinned preparations were not well oriented
at the very short sarcomere lengths giving full overlap offilaments so the experiment was done at 50% actin filamentoverlap. The increase in the J4 term on Ca2+ addition wasclearly larger than at non-overlap, the difference valuereaching over 40% of the reference relaxed 59 A reflection.This is shown in Fig. 8B. These changes induced in the J4
term can be matched by moving tropomyosin through afurther 7–8�.
3.7. Summary of X-ray modelling
In the physiologically active array of thin filaments in arabbit skeletal muscle held at 2 �C, taking the EGTA stateas a point of reference, there is an average of 15� rotationto the Ca2+ state and a further 7–8� rotation when activecrossbridges bind. Introducing azimuthal disorder wouldmake the fit to the difference data worse.
4. Discussion
4.1. Comparison of models
There is general agreement between models deducedfrom electron microscopic reconstructions and the intensi-ties measured from low-angle X-ray fibre diagramsobtained for non-overlap muscle. In the EGTA case theagreement of tropomyosin positioning on the actin surfaceis very good and moreover, lends support to the position-ing of troponin recently reported by Pirani et al. (2006).Both methods agree that the major changes arise frommoving tropomyosin azimuthally round the thin filament.
There is an apparent discrepancy in the magnitude ofthe swing on calcium addition: the EM studies suggest anazimuthal movement of 25� from the EGTA position toCa2+ position; the X-ray fibre diagrams are well fitted witha shift of 15� (a previous study gave 20� (Al-Khayat et al.,1995)). Simply introducing a Gaussian azimuthal disorderwould not resolve the discrepancy since it only affects theJ4 term. We think that the most likely explanation is thatthe X-ray experiment measures the properties of the per-taining equilibrium of states, whereas the EM reconstruc-tions work on classified arrays of single filaments. Sincethe response of the calculated X-ray difference intensitiesto azimuthal swing (Fig. 8) is fairly linear, the methodwould not be able to distinguish between a 15� state anda 60:40 mixture of 25� and 0� states. Pirani et al. (2005)did find that an assay of filament structures in the presenceof Ca2+ contained a mixture of ca. 80% of the 25� state and20% showing the 0� blocking position. Considering thetemperature differences (2 �C for X-ray and 24 �C forEM) and possible species differences (X-ray studies usedrabbit fast skeletal muscle, the EM studies used reconstitut-ed filaments made from rabbit f-actin and bovine cardiactroponin–tropomyosin as well as thin filaments isolatedfrom Limulus), we think the results from the two methodsare remarkably consistent.
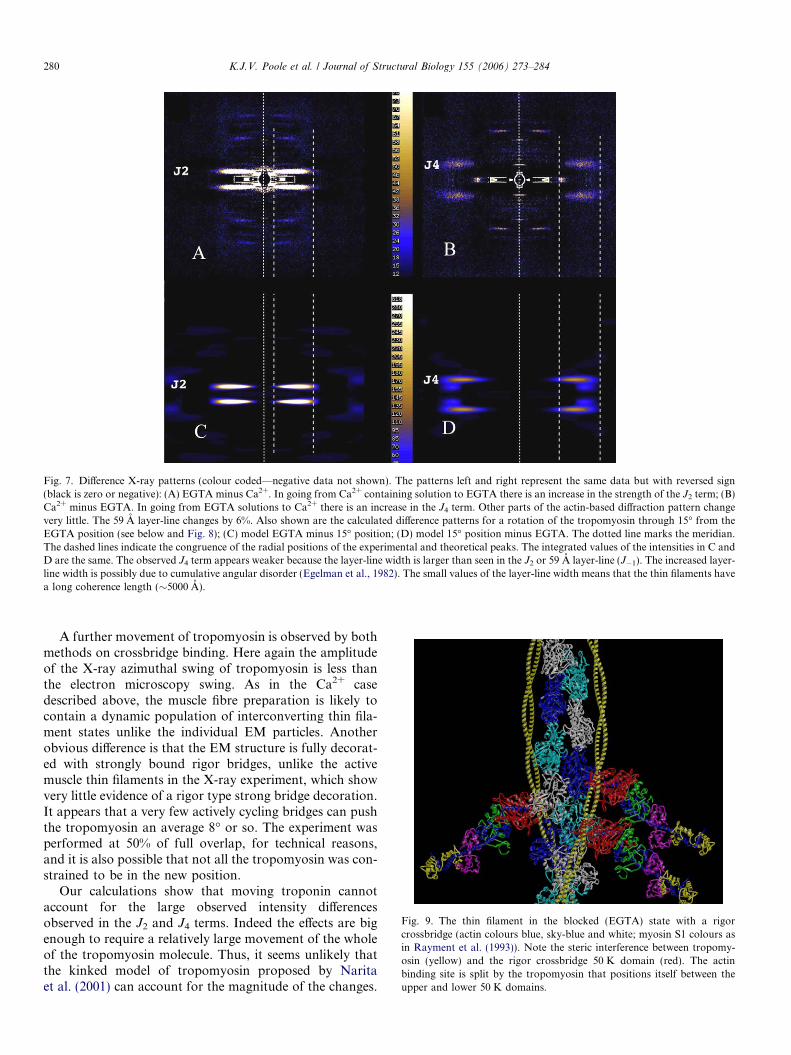
Fig. 7. Difference X-ray patterns (colour coded—negative data not shown). The patterns left and right represent the same data but with reversed sign(black is zero or negative): (A) EGTA minus Ca2+. In going from Ca2+ containing solution to EGTA there is an increase in the strength of the J2 term; (B)Ca2+ minus EGTA. In going from EGTA solutions to Ca2+ there is an increase in the J4 term. Other parts of the actin-based diffraction pattern changevery little. The 59 A layer-line changes by 6%. Also shown are the calculated difference patterns for a rotation of the tropomyosin through 15� from theEGTA position (see below and Fig. 8); (C) model EGTA minus 15� position; (D) model 15� position minus EGTA. The dotted line marks the meridian.The dashed lines indicate the congruence of the radial positions of the experimental and theoretical peaks. The integrated values of the intensities in C andD are the same. The observed J4 term appears weaker because the layer-line width is larger than seen in the J2 or 59 A layer-line (J�1). The increased layer-line width is possibly due to cumulative angular disorder (Egelman et al., 1982). The small values of the layer-line width means that the thin filaments havea long coherence length (�5000 A).
Fig. 9. The thin filament in the blocked (EGTA) state with a rigorcrossbridge (actin colours blue, sky-blue and white; myosin S1 colours asin Rayment et al. (1993)). Note the steric interference between tropomy-osin (yellow) and the rigor crossbridge 50 K domain (red). The actinbinding site is split by the tropomyosin that positions itself between theupper and lower 50 K domains.
280 K.J.V. Poole et al. / Journal of Structural Biology 155 (2006) 273–284
A further movement of tropomyosin is observed by bothmethods on crossbridge binding. Here again the amplitudeof the X-ray azimuthal swing of tropomyosin is less thanthe electron microscopy swing. As in the Ca2+ casedescribed above, the muscle fibre preparation is likely tocontain a dynamic population of interconverting thin fila-ment states unlike the individual EM particles. Anotherobvious difference is that the EM structure is fully decorat-ed with strongly bound rigor bridges, unlike the activemuscle thin filaments in the X-ray experiment, which showvery little evidence of a rigor type strong bridge decoration.It appears that a very few actively cycling bridges can pushthe tropomyosin an average 8� or so. The experiment wasperformed at 50% of full overlap, for technical reasons,and it is also possible that not all the tropomyosin was con-strained to be in the new position.
Our calculations show that moving troponin cannotaccount for the large observed intensity differencesobserved in the J2 and J4 terms. Indeed the effects are bigenough to require a relatively large movement of the wholeof the tropomyosin molecule. Thus, it seems unlikely thatthe kinked model of tropomyosin proposed by Naritaet al. (2001) can account for the magnitude of the changes.

0 5 10 15 20 25 30 35Modelled TM azimuth from EM EGTA position (deg)
-10
0
10
20
30
40
50
60
70
80
90
100
110
120
1st L
L in
tens
ity d
ecre
ase
as %
59Å
LL
data - J2 level reached in Ca at non-overlapmodel J2 dropmodel J2 - azimuthal disorder 10model - TN moving alone
0 5 10 15 20 25 30 35Modelled TM azimuth from EM EGTA position (deg)
0
10
20
30
40
50
60
70
80
90
100
110
120
2ndL
L in
tens
ity in
crea
se a
s %
59
ÅL
L
data -J4 level reached in Ca at non-overlapdata -J4 level reached in Ca in overlapmodel J4 increasemodel J4 - azimuthal disorder 10model J4 - TN moving alone
A
B
Fig. 8. The calculated changes in the integrated values of (A) the J2 term and (B) the J4 term as functions of moving tropomyosin (or troponin) through anazimuthal angle measured from the EGTA position. The observed values are shown as horizontal lines. The points of intersection of the observed datavalues with the calculated changes show the amount of azimuthal movement necessary to account for the experimental data. The intensities are expressedas percentages of the integrated 59 A layer-line intensity, which stays constant as tropomyosin is rotated. The effect of azimuthal disorder (10�) was alsocalculated. Also shown in (B) is the effect of activating a muscle at half overlap. This leads to a further increase in the observed changes in the J4 term thatcan be explained by a further azimuthal move of the tropomyosin on crossbridge binding.
K.J.V. Poole et al. / Journal of Structural Biology 155 (2006) 273–284 281
Apart from the J2 and J4 terms, we find very minimalexperimental changes on going from EGTA to Ca2+. Thechanges on the 59 A layer-line are 6%, which could beaccounted for by the kind of domain movements proposedby Al-Khayat et al. (1995), could also arise from move-ments of a single superficial helix or even changes in tropo-nin structure. There are no grounds for believing that actinundergoes substantial conformational changes when Ca2+
binds to troponin.
4.2. How this affects crossbridge binding
If we take the crossbridge blocking structure (EGTAstate) and build on the rigor crossbridge, we obtain thestructure shown in Fig. 9. It can be seen that there is exten-sive steric interference between the tropomyosin (yellow)and the 50 K domain of the crossbridge (red). There is adeep cleft in the 50 K domain dividing it into the upper50 K and lower 50 K subdomains (Rayment et al., 1993).

Fig. 11. As in Fig. 9, tropomyosin moved round azimuthally by 25�.Found for the EM Ca2+ state, and similar to the average position found inmuscle fibres with actively cycling bridges.
282 K.J.V. Poole et al. / Journal of Structural Biology 155 (2006) 273–284
This cleft shuts on strong (rigor) binding to actin (seereview Geeves and Holmes, 2005). Fig. 9 shows that thetropomyosin in the blocking situation lies in this cleft. Itwould act like a gag. It would split the binding site on actinso that the crossbridge cannot reach both halves at thesame time. This may explain how tropomyosin, held inplace by energetically weak interactions to troponin canfrustrate the strong binding of the myosin crossbridge toactin.
Figs. 10 and 11 show the situation when the tropomyo-sin has rotated 15� and 25�. While there is clearly still somesteric hindrance to bridge docking by the tropomyosin inboth of these positions, it now lies clearly to one side ofthe motor binding site, even if all filaments showed theminimum +15� average azimuthal rotation found in theX-ray experiment. From this situation it could respondby moving to the rigor, or bound head position (seeFig. 2). Since our data are consistent with earlier findingsthat the tropomyosin sits at a relatively large distance fromthe actin surface it follows that the energy involved in mov-ing over the surface will be low. It is thus easy to imaginethat in the presence of calcium, strong binding, stereospe-cifically attaching crossbridges would out-compete tropo-myosin for the partially covered binding sites. Thestrength of this bond may then be sufficient to maintain acertain length of the tropomyosin strand in the new posi-tion, making other actin sites fully available for furthermyosin binding and explaining the well-documented coop-erativity of binding (McKillop and Geeves, 1993; Gordonet al., 2000).
The estimates for the extent of this cooperativitydescribed in the literature vary depending on the type ofmeasurement (Geeves and Lehrer, 2002) but there are indi-cations that it may extend over many tropomyosin lengths(Brandt et al., 1987) and some of our own unpublished X-
Fig. 10. As in Fig.Fig. 9, tropomyosin moved round azimuthally by 15�.Average position in a muscle fibre in Ca2+. Note—this could be a singlestate or a dynamic mixture of 0� and 25� states.
ray data on the J2, J4 changes in activation experimentswould support this view. This would imply that the tropo-myosin is rather stiff. Indeed, the long coherence length asmeasured from the narrow width of the J2 layer-line inFig. 7 does appear to show that the molecule adopts a sta-ble coiled–coiled coil structure on actin. This is consistentwith the idea that alanine patches (Brown et al., 2001) givea specific coiled–coiled coil shape to the tropomyosin mol-ecule. This structure would not be compatible with a roll-ing motion over the actin surface. Therefore, we supportthe idea of a simple sliding motion between the observedpositions.
We tentatively assign the three structural states of thethin filament we find in EGTA, Ca2+ and in the presenceof crossbridges described in Fig. 3 and in the discussionabove, to the three kinetic states blocked, closed and open,described by McKillop and Geeves (1993). In regulatedthin filaments in the absence of Ca2+ the tropomyosinappears to be held in the strong twofold (weak fourfold)position by a presumed binding to troponin giving a‘‘blocked’’ state. The binding of Ca2+ ions to troponin freestropomyosin in some way and enables it to diffuse roundthe filament some 15–25�, which considerably strengthensthe fourfold symmetry and thereby strengthening the 4thactin layer-line J4 term. In this state we see from the modelof the actomyosin interface that the site is still partlyobscured by tropomyosin. This is entirely consistent withthe ‘‘closed state’’ of the actomyosin solution studies whichshow that the affinity of the first bridges approaching sucha calcium filament is still not as high as for a fully nakedarray of binding sites. However, our structural analysesindicate that the binding of crossbridges appears to pushthe tropomyosin even further round azimuthally (leadingto an even stronger J4 term) fully opening further cross-bridge binding sites. Again, this is consistent with the coop-

K.J.V. Poole et al. / Journal of Structural Biology 155 (2006) 273–284 283
erative crossbridge binding measured in the ‘‘closed’’ state,leading to the so called ‘‘open state’’ of solution kinetics.
The solution studies, however, suggest that tropomyosinoscillates dynamically between these three positions at allCa2+ levels, and that it is really the values of the respectiveequilibrium constants that are controlled by Ca2+. Thisinterpretation is supported by EM analyses of arrays ofsingle particles (Pirani et al., 2005) which find that at24 �C in saturating calcium concentrations at least 20%of their thin filament particles show tropomyosin to be inthe blocking state; 80% in the 25� state. Our interpretationof the X-ray data, taken at 2 �C, would be consistent with a40:60 population of two such structures.
To conclude, the possibility that actin–myosin interac-tion is regulated sterically by tropomyosin was first pro-posed by Hanson and Lowy (1964) and later supportedby low-angle X-ray diffraction studies of intact muscle car-ried out by Huxley (1972), Haselgrove (1972) and Parry andSquire (1973). At the same time, EM provided evidence onthe location of tropomyosin in isolated thin filaments(Spudich et al., 1972; O’Brien et al., 1975; O’Brien et al.,1983) that was also consistent with the steric mechanism.Technical improvements in methods for collecting fibre dif-fraction data and analysing 3D structure in EM images,coupled with the availability of crystal structures of actin,tropomyosin, troponin and myosin S1 have now allowedus to evaluate molecular details of the steric regulatorymechanism. The precision of the methods used here inlocating tropomyosin on actin was more than sufficient toconfirm that the molecule directly blocks important cross-bridge binding residues in the absence of calcium, and thatit reveals a large portion of the myosin binding surface oncalcium binding to troponin. The few degrees difference inthe EM and X-ray tropomyosin positions seems to arisefrom operational differences in the systems. One observesa single particle, trapped at one moment in time, the otheris an observation derived from a large, possibly dynamicallymixed population of filament states. We find that, in thepresence of Ca2+, tropomyosin partially obscures the myo-sin binding site. This position may be related to the locationrefined in X-ray studies of the troponin-free filament byLorenz et al. (1995). Its interaction with troponin and cross-bridges appear to determine its movements away from thisposition. Binding crossbridges push it some 10� furtherround; Ca2+ removal causes troponin interactions to pullit 15–25� back into a fully blocking position.
Acknowledgments
We gratefully acknowledge the support of the Brookha-ven Nation Laboratory through the allocation of beam time.This work was supported by NIH grants (HL36153 to W.L.,AR34711, RR08426 to R.C. and HL38834 to L.S.T.). Dia-grams of molecular models were prepared using Bobscriptv2.6 (Esnouf, 1997; Esnouf, 1999), Molscript (Kraulis,1991) and Raster 3D (Merritt and Bacon, 1997).
References
Al-Khayat, H.A., Yagi, N., Squire, J.M., 1995. Structural changes inactin–tropomyosin during muscle regulation: computer modelling oflow-angle X-ray diffraction data. J. Mol. Biol. 252, 611–632.
Brandt, P.W., Diamond, M.S., Rutchik, J., Schachat, F.H., 1987. Co-operative interactions between troponin–tropomyosin units extend thelength of the thin filament in skeletal muscle. J. Mol. Biol. 195, 885–896.
Brown, J.H., Kim, K.H., Jun, G., Greenfield, N.J., Dominguez, R.,Volkmann, N., Hitchcock-DeGregori, S.E., Cohen, C., 2001. Deci-phering the design of the tropomyosin molecule. Proc. Natl. Acad. Sci.USA 98, 8496–8501.
Brown, J.H., Zhou, Z., Reshetnikova, L., Robinson, H., Yammani, R.D.,Tobacman, L.S., Cohen, C., 2005. Structure of the mid-region oftropomyosin: bending and binding sites for actin. Proc. Natl. Acad.Sci. USA 102, 18878–18883.
Ebashi, S., Endo, M., Ohtsuki, I., 1969. Control of muscle contraction. Q.Rev. Biophys. 2, 351–384.
Egelman, E.H., Francis, N., DeRosier, D.J., 1982. F-actin is a helix with arandom variable twist. Nature 298, 131–135.
Esnouf, R.M., 1997. An extensively modified version of MolScript thatincludes greatly enhanced coloring capabilities. J. Mol. Graph. Model.15, 132–134.
Esnouf, R.M., 1999. Further additions to MolScript version 1.4, includingreading and contouring of electron-density maps. Acta Crystallogr.D55, 938–940.
Geeves, M.A., Holmes, K.C., 2005. The molecular mechanism of musclecontraction. Adv. Protein Chem. 71, 161–193.
Geeves, M.A., Lehrer, S.S., 2002. Modeling thin filament cooperativity.Biophys. J. 82, 1677–1681.
Gordon, A.M., Homsher, E., Regnier, M., 2000. Regulation of contrac-tion of striated muscle. Physiol. Rev. 80, 853–924.
Greaser, M.L., Gergely, J., 1971. Reconstitution of troponinactivity from three protein components. J. Biol. Chem. 246,4226–4233.
Greaser, M.L., Gergely, J., 1973. Purification and properties of thecomponents of troponin. J. Biol. Chem. 248, 2125–2133.
Greene, L.E., Eisenberg, E., 1980. Cooperative binding of myosinsubfragment-1 to the actin–troponin–tropomyosin complex. Proc.Natl. Acad. Sci. USA 77, 2616–2620.
Hanson, J., Lowy, J., 1963. The structure of f-actin and the actin filamentsisolated from muscle. J. Mol. Biol. 6, 46–60.
Hanson, J., Lowy, J., 1964. The structure of actin filaments and the originof the axial periodicity in the I-substance of vertebrate striated muscle.Proc. Royal Soc. Lond. B 160, 449–460.
Haselgrove, J.C., 1972. X-ray evidence for a conformational change in theactin-containing filaments of vertebrate striated muscle. Cold SpringHabor Symp. Quant. Biol. 37, 341–352.
Hill, L.E., Mehegan, J.P., Butters, C.A., Tobacman, L.S., 1992. Analysisof troponin–tropomyosin binding to actin. Troponin does not promoteinteractions between tropomyosin molecules. J. Biol. Chem. 267,16106–16113.
Hitchcock, S.E., Huxley, H.E., Szent-Gyorgyi, A.G., 1973. Calciumsensitive binding of troponin to actin–tropomyosin: a two-site modelfor troponin action. J. Mol. Biol. 80, 825–836.
Holmes, K.C., Angert, I., Kull, F.J., Jahn, W., Schroder, R.R., 2003.Electron cryo-microscopy shows how strong binding of myosin toactin releases nucleotide. Nature 425, 423–427.
Holmes, K.C., Barrington Leigh, J., 1974. The effect of disorientation onthe intensity distribution of non-crystalline fibres. 1. Theory. ActaCrystallogr. A30, 635–638.
Holmes, K.C., Popp, D., Gebhard, W., Kabsch, W., 1990. Atomic modelof the actin filament. Nature 347, 44–49.
Huxley, H.E., 1972. Structural changes in actin and myosin-containingfilaments during contraction. Cold Spring Habor Symp. Quant. Biol.37, 361–376.

284 K.J.V. Poole et al. / Journal of Structural Biology 155 (2006) 273–284
Kabsch, W., Mannherz, H.G., Suck, D., Pai, E.F., Holmes, K.C., 1990.Atomic structure of the actin:DNase I complex. Nature 347, 37–44.
Kraulis, P.J., 1991. MOLSCRIPT: a program to produce both detailedand schematic plots of proteins structures. J. Appl. Crystallogr. 24,946–950.
Lehman, W., Craig, R., Vibert, P., 1994. Ca(2+)-induced tropomyosinmovement in Limulus thin filaments revealed by three-dimensionalreconstruction. Nature 368, 65–67.
Lehman, W., Rosol, M., Tobacman, L.S., Craig, R., 2001. Troponinorganization on relaxed and activated thin filaments revealed byelectron microscopy and three-dimensional reconstruction. J. Mol.Biol. 307, 739–744.
Lehman, W., Vibert, P., Uman, P., Craig, R., 1995. Steric-blocking bytropomyosin visualized in relaxed vertebrate muscle thin filaments. J.Mol. Biol. 251, 191–196.
Lehrer, S.S., Morris, E.P., 1982. Dual effects of tropomyosin andtroponin–tropomyosin on actomyosin subfragment 1 ATPase. J. Biol.Chem. 257, 8073–8080.
Lorenz, M., Poole, K.J., Popp, D., Rosenbaum, G., Holmes, K.C., 1995.An atomic model of the unregulated thin filament obtained by X-rayfibre diffraction on oriented actin–tropomyosin gels. J. Mol. Biol. 246,108–119.
Lorenz, M., Popp, D., Holmes, K.C., 1993. Refinement of the f-actinmodel against X-ray fibre diffraction data by the use of a directedmutation algorithm. J. Mol. Biol. 234, 826–836.
Lowy, J., Popp, D., Stewart, A.A., 1991. X-ray studies of order–disordertransitions in the myosin heads of skinned rabbit psoas muscles.Biophys. J. 60, 812–824.
Lowy, J., Poulsen, F.R., 1990. Studies of the diffuse X-ray scattering fromcontracting frog skeletal muscles. Biophys. J. 57, 977–985.
Maeda, Y., Popp, D., McLaughlin, S.M., 1988. Cause of changes in thethin filament-associated reflexions on activation of frog muscle-myosinbinding or conformational change of actin. Adv. Exp. Med. Biol. 226,381–390.
Mak, A.S., Smillie, L.B., 1981. Non-polymerizable tropomyosin: prepa-ration, some properties and f-actin binding. Biochem. Biophys. Res.Commun. 16, 208–214.
McKillop, D.F., Geeves, M.A., 1993. Regulation of the interactionbetween actin and myosin subfragment 1: evidence for three states ofthe thin filament. Biophys. J. 65, 693–701.
McLachlan, A.D., Stewart, M., 1976. The 14-fold periodicity in a-tropomyosin and the interaction with actin. J. Mol. Biol. 103, 271–298.
McLaughlan, P.J., Gooch, J.T., Mannherz, H.G., Weeds, A.G., 1993.Atomic structure of gelsolin segment 1 in complex with actin and themechanism of filament severing. Nature 364, 685–692.
Merritt, E.A., Bacon, D.J., 1997. Raster3D Version 2: photorealisticmolecular graphics. Meth. Enzymol. 277, 505–524.
Milligan, R.A., Flicker, P.F., 1987. Structural relationships of actin,myosin, and tropomyosin revealed by cryo-electron microscopy. J. CellBiol. 105, 29–39.
Narita, A., Yasunaga, T., Ishikawa, T., Mayanagi, K., Wakabayashi, T.,2001. Ca(2+)-induced switching of troponin and tropomyosin on actinfilaments as revealed by electron cryo-microscopy. J. Mol. Biol. 308,241–261.
O’Brien, E.J., Gillis, J.M., Couch, J., 1975. Symmetry and moleculararrangement in paracrystals of reconstituted muscle thin filaments. J.Mol. Biol. 99, 461–475.
O’Brien, E.J., Couch, J., Johnson, G.R.P., Morris, E.P., 1983. Structure ofactin and the thin filament. In: dos Remedios, C.G., Barden, J.A.(Eds.), Actin, Structure and Function in Muscle and Non-MuscleCells. Academic Press, Sydney, pp. 3–15.
Oda, T., Makino, K., Yamashita, I., Namba, K., Maeda, Y., 2001. Thehelical parameters of f-actin precisely determined from X-ray fibrediffraction of well-oriented sols. Results Probl. Cell Differ. 32, 43–58.
Otterbein, L.R., Graceffa, P., Dominguez, R., 2001. The crystal structureof uncomplexed actin in the ADP state. Science 293, 708–711.
Parry, D.A., Squire, J.M., 1973. Structural role of tropomyosin in muscleregulation: analysis of the X-ray diffraction patterns from relaxed andcontracting muscles. J. Mol. Biol. 75, 33–55.
Parry, D.A.D., 1974. Structural studies on the tropomyosin–troponincomplex of vertebrate skeletal muscle. Biochem. Biophys. Res.Commun. 57, 216–224.
Parry, D.A.D., 1975a. Analysis of the primary sequence of alpha-tropomyosin from rabbit skeletal muscle. J. Mol. Biol. 98, 519–535.
Parry, D.A.D., 1975b. Double helix of tropomyosin. Nature 256, 346–347.Perry, S.V., 2001. Vertebrate tropomyosin: distribution, properties and
function. J. Muscle Res. Cell Motil. 22, 5–49.Pirani, A., Vinogradova, M.V., Curmi, P.M.G., King, W.A., Fletterick,
R.J., Craig, R., Tobacman, L.S., Xu, C., Hatch, V., Lehman, W., 2006.An atomic model of the thin filament in relaxed and Ca2+ activatedstated. J. Mol. Biol. 357, 707–717.
Pirani, A., Xu, C., Hatch, V., Craig, R., Tobacman, L.S., Lehman, W.,2005. Single particle analysis of relaxed and activated muscle thinfilaments. J. Mol. Biol. 346, 761–772.
Poole, K.J.V., Holmes, K.C., Evans, G., Rosenbaum, G., Rayment, I.,Lorenz, M., 1995a. Control of the actomyosin interaction. Biophys. J.68, 348s.
Poole, K.J.V., Holmes, K.C., Rosenbaum, G., Evans, G., Wray, J.S.,Lorenz, M., 1995b. The effects of calcium and salt on the structure ofthe regulated thin filament. J. Muscle Res. Cell Motil. 16, 149a.
Popp, D., Maeda, Y., 1993. Calcium ions and the structure of muscle actinfilament. An X-ray diffraction study. J. Mol. Biol. 229, 279–285.
Potter, J.D., Gergely, J., 1974. Troponin, tropomyosin, and actininteractions in the Ca2+ regulation of muscle contraction. Biochem-istry 13, 2697–2703.
Rayment, I., Rypniewski, W.R., Schmidt-Base, K., Smith, R., Tomchick,D.R., Benning, M.M., Winkelmann, D.A., Wesenberg, G., Holden,H.M., 1993. Three-dimensional structure of myosin subfragment-1: amolecular motor. Science 261, 50–58.
Schutt, C.E., Myslik, J.C., Rozycki, M.D., Goonesekere, N.C.W.,Lindberg, U., 1993. The structure of crystalline profilin-b-actin.Nature 365, 810–816.
Spudich, J.A., Huxley, H.E., Finch, J., 1972. Regulation of skeletal musclecontraction. II. Structural studies of the interaction of the tropomy-osin–troponin complex with actin. J. Mol. Biol. 72, 619–632.
Squire, J.M., Morris, E., 1998. A new look at thin filament regulation invertebrate skeletal muscle. FASEB J. 12, 761–771.
Tirion, M.M., ben-Avraham, D., Lorenz, M., Holmes, K.C., 1995.Normal modes as refinement parameters for the f-actin model.Biophys. J. 68, 5–12.
Tobacman, L.S., 1996. Thin filament-mediated regulation of cardiaccontraction. Annu. Rev. Physiol. 58, 447–481.
Vibert, P., Craig, R., Lehman, W., 1997. Steric-model for activation ofmuscle thin filaments. J. Mol. Biol. 266, 8–14.
Vinogradova, M.V., Stone, D.B., Malanina, G.G., Karatzaferi, C.,Cooke, R., Mendelson, R.A., Fletterick, R.J., 2005. Proc. Natl. Acad.Sci. USA 102, 5038–5043.
Willadsen, K.A., Butters, C.A., Hill, L.E., Tobacman, L.S., 1992. Effectsof the amino-terminal regions of tropomyosin and troponin T on thinfilament assembly. J. Biol. Chem. 267, 23746–23752.
White, S.P., Cohen, C., Phillips Jr., G.N., 1987. Structure of co-crystals oftropomyosin and troponin. Nature 325, 826–828.
Whitby, F.G., Phillips, G.N., 2000. Crystal structure of tropomyosin atseven Angstroms resolution. Proteins 38, 49–59.
Yagi, N., Matsubara, I., 1989. Structural changes in the thin filamentduring activation studied by X-ray diffraction of highly stretchedskeletal muscle. J. Mol. Biol. 208, 359–363.
Related Documents