UNIVERSITI PUTRA MALAYSIA PRODUCTION ANALYSIS OF MILKFISH CULTURE IN KENDAL REGENCY, CENTRAL JAVA, INDONESIA HAMROLI HARUN FEP 1992 1

Welcome message from author
This document is posted to help you gain knowledge. Please leave a comment to let me know what you think about it! Share it to your friends and learn new things together.
Transcript
UNIVERSITI PUTRA MALAYSIA
PRODUCTION ANALYSIS OF MILKFISH CULTURE IN KENDAL REGENCY, CENTRAL JAVA,
INDONESIA
HAMROLI HARUN
FEP 1992 1

PRODUCTION ANALYSIS OF MILKFISH CULTURE IN KENDAL REGENCY, CENTRAL JAVA,
INDONESIA
By
HAMROLIHARUN
Thesis Submitted in Partial Fulfilment of the Requirements for the Degree of Master of Science
in the Faculty of Economics and Management, Unlversitl Pertanlan Malaysia
July 1992

ACKNOWLEDGEMENTS
I wish to express my deepest appreciation and most sincere
gratitude to Dr. Sabak Mamat. my supervisor. who has contributed
his valuable time in supervising this thesis. His wise gUidance.
useful comments and constant encouragement throughout the pre
paration of this theSis are greatly appreCiated. I am also grateful to
Mr. K. Kuperan for his helpful suggestions during the preparation of
the thesis proposal.
I am greatly indebted to my parents for their sacrifice and
continuous support; to all my teachers and lecturers for their help;
to my wife Apri for her suffering and understanding in my absence.
I would also like to take this opportunity to affirm my heartfelt
gratitude to lORe for prOViding the finan cial support. and to
Diponegoro University for granting me the study leave.
My deep appreCiation is also due to Prof. Drs. Suhardi for
persuading and encouraging me to attend this masters degree
program.
Finally. I dedicate the usefulness of this thesis to my parents
and to all my teachers and lecturers.
11
TABLE OF CONTENTS
ACKNOWLEDGEMEN1'S ................................................... 11 LIST OF TABLES ........................................................ I. •••• vi
LIST OF FIGURES .................................... I. •••••••••• ••••••••• ••• Ix ABSTRACT ....................................................................... x
ABSTAAK ......................................................................... xii
CHAPTER
II
III
INTRODUC'fION ......... ................. ........... ....... 1
The Fishery Sector of Indonesia .................... 1
Central Java Fisheries .................................. 3
MUkflsh Culture Operation ... . . ... . . .. ............... 7
Statement of the Research Problem .............. 1 0
Objectives of the Study ................................. 1 1
Justification of the Study . . . . . . . . . . . . . . . . . . . . . . . . . . . . . 13
REVIEW OF LITERATURE . . . . . . . . . . . . . . . . . . . . . . . . . . .. 1 3
Previous Economics Studies on Mllkfish Culture ............... ..... . . . . ... . . . . . . . ... . . . ... 1 3
Revlew of Analytlcal Methods Used ............... 19
METHODOWGY . . . . . . . . . . . . . . . . . . . . . . . . . . . . . . . . . . . . . . . . . . 24
Theoretical Framework ........................ ......... 24
Theory of Production ............ ...... .......... .. ..... . 24 •
The Concept of Profit Function ................. .... 27
Empirical Model Specification .... . ... ... . . . ... . .. . . . 29
ill
IV
v
VI
Page
Definition of Variables ................... ............... 33
Sampling and Data Collection ...................... 36
Sampling Procedure and Sample Size . . . . . ...... 36
Data Collection ................................. ........... . 38
SOCIO·ECONOMIC PROFILE OF FARMERS 39
Age Distribution .................... ............ . .......... 39
Educational Status . . . . . . . . . . . . . . . . . . . . . . . . . . . . . . . . . . . . . . . 39
Experience in MUkftsh Culture . . . . . . . . . . . . . . . . . . . . . 4 1
Other Occupations . . . . . . . . . . . . . . . . . . . . . . . . . . . . . . . . . . . . . . . 42
Family Size and Economically Active Members ...................................................... 43
Farm and Land Ownership . . . . . . . . . . . . . . . . . . . . . . . . . . . 43
Farm Size and Number of Ponds ................... 45
Sources of Fund . . . . . . . . . . . . . . . . . . . . . . . . . . . . . . . . . . . . . . . . . . . 47
MUkftsh Pond Culture Practices . . . . . . . . . . . . . . . . . . . . 49
COSTS AND RETURNS ANALYSIS .............. .. 50
Costs of MUkfish Production . ...... ......... ......... 50
Yield and Returns by Farm Size .................... 54
EMPIRICAL RESUL� ................................. . 58
Estimation Results of the Production Functions .. . . . . . . . ..... ... . . . . . . . . . . .... . ... . . . . . .... ......... 58
Estimation Results of the Multiple Linear RegreSSion ......................................... 64
iv
Page
Estimation Results of the Profit Functions ..................................................... 66
VII SUMMARY, POLICY IMPLICATIONS AND CONCLUSIONS . . . . . . . . . . . . . . . . . . . . . . . . . . . . . . . . . . . . . . . . . . . . 70
Conclusions . . . . . . . . . . . . . . . . . . . . . . . . . . . . . . . . . . . . . . . . . . . . . . . . . 72
Policy Implication . . . . . . . . . . . . . . . . . . . . . . . . . . . . . . . . . . . . . . . . . 73
BIBLIOGRAPHY" .... .. . .. . . .... . .. . . ..... . . .. . . . .. . . . . . . . . . . . . . .... . . . . . . . . . . . . . 76
APPENDIX - Questionnaire for Milkftsh Farmers (Daftar Pertanyaan untuk Petani Tambak Bandeng) ....................................... 8 1
BIOGRAPHICAL SKETCH ..................•............................... 87
v

Table
I 2
3
4
5
6
7
8
9
10
11
12
13
14
15
LIST OF TABLES
Indonesian Fish Production, 1980 , 1984 . . . . . . . . . . . ..
Central Java Flsh Production 1978, 1982 . . . . . . . . . . .
Kendal Regency Fish Production 1982 . . . . . . . . . . . . . . ..
Number of Samples by Districts, 1985 . . . . . . . . . . . . . . ..
Number of Samples by Districts and FaJ"'m Size, 1 985 . It ••••••••••••••••••••••••••••••••••••••••••• II'
Age Dlstribution of Sample Farmers by Farm Size, 1985 ................................................ .
Educational Status of Sample Farmers by Farm Size, 1985 .. . . .. . . . . . . . . .. . . .. .. . . . . . . . . . . . . . . . . . . . . . . . . . . .
Experience of Sample Farmers by Farm Size, 1 985 . . . . . . . . . . . . . .. . . . . . ... .... . . .. . . . . . . . . . . . . . . . . . . . . . . . . . . .
Other Occupations of Sample Farmers by Farm Size, 1 985 ................................................ .
Family Size and Economlcally Active Members of Sample Farmers by Farm Size, 1985 ................................................................. .
Type of Enterprise of Sample Farms by Farm Size, 1 985 . 11." ." ." ••••••• 1,." ••••••• II ••••••• 11." ••••
Land Ownership of Sample Farmers by Farm Size, 1 985 . 1,." ." ." .,1." ." ." ••••••• I •••••••••••••••••
Number of Ponds, Total Pond Area and Pond Size Under MUkftsh Farming of Sample Farmers by Farm Size, 1985 . . . . . . . . . . . . . . . . ..
Sources of Fund for Mllkfish Farming of Sample Farmers by Farm Size, 1985 . . . . . . . . .. . . . . . . ..
Depreciation on Farm Facilities per Hectare of MUkftsh Culture for Large Farm, 1984/1 985 ... , ............ , ................. . . .. . . ...... .
vi
Page
2
5
7
37
37
40
4 1
42
43
44
44
45
46
48
52
Table Page
16 Depreciation on Farm Facilities per Hectare of Milkftsh Culture for Medium Farm, 1 984 / 1 985 ............... 1 ••••••••••••••••••••••• •••••••• 52
1 7 Depreciation on Farm Facilities per Hectare of Milkftsb Culture for Small Farm, 1984 / 1 985 ... 1. I ••••••••••••••••••••••••••••••••••••••••• 53
18 Fixed Costs per Hectare of Milkftsh Culture by Farm size (in rupiah), 1 984 / 1 985 .................................................. " ...... 53
1 9 Variable Costs per Hectare of MUkflsh Culture by Farm Size (in rupiah), 1 984 / 1 985 ......................................................... 54
20 Yield, Revenue, Costs and Returns per Hectare of Milkftsh Culture by Farm Size, 1 984 / 1 985 ................................................. 55
2 1 Average Revenue, Costs and Returns per Kilogram of MUkfish by Farm Size, 1 984 / 1985 ......................................................... 56
22 Estimated Production Functions of MUkftsh Culture in Kendal Regency of Central Java per Hectare Basis, 1 984 /1985 ......................................................... 59
23 The Profit Max1m1zing BehaViour Parameter of Milkftsb Culture for Large Farms in Kendal Regency, Central Java per Hectare Basis, 1 984 / 1 985 ............................ 62
24 The Profit Max1m1zing BehaViour Parameter of Milkfish Culture for Medium Farms in Kendal Regency, Central Java per Hectare Basis, 1 984 / 1 985 ............................ 63
25 The Profit Max1m1zing BehaViour Parameter of Milkftsh Culture for Small Farms in Kendal Regency, Central Java per Hectare Basis, 1984 / 1 985 ............................ 64
vii
Table
26
27
Estimated Multiple Linear Regression Between Residual of MUldlsh Production Function and Farmers' Individual Variability in Kendal Regency, Central Java, 1 984 / 1 985 ............................................... .
Estimated Profit Function of Milkfish Culture in Kendal Regency, Central Java per Hectare Basis, 1984 / 1985 . . . . . . . . . . . . . . . . . .. . . . . . . . . .
vU1
Page
65
67

Figure
1
2
LIST OF F'IGURES
Map of Indonesia by Province ShowJng the Location of Kendal Regency ......................... .
Sketch of Milldlsh Culture Pond ........................ .
Page
6
9
Abstract of thesis submitted to the Senate of Universiti Pertanian Malaysia in partial fulffiment of the requirements for the degree of Master of science
PRODUCTION ANALYSIS OF MILKFISH CULTURE IN KENDAL REGENCY. CENTRAL JAVA, INDONESIA
Supervisor
Faculty
by
HAMROLI HARUN July 1 992
Assoc. Prof. Sabak Mamat, Ph.D.
Economics and Management
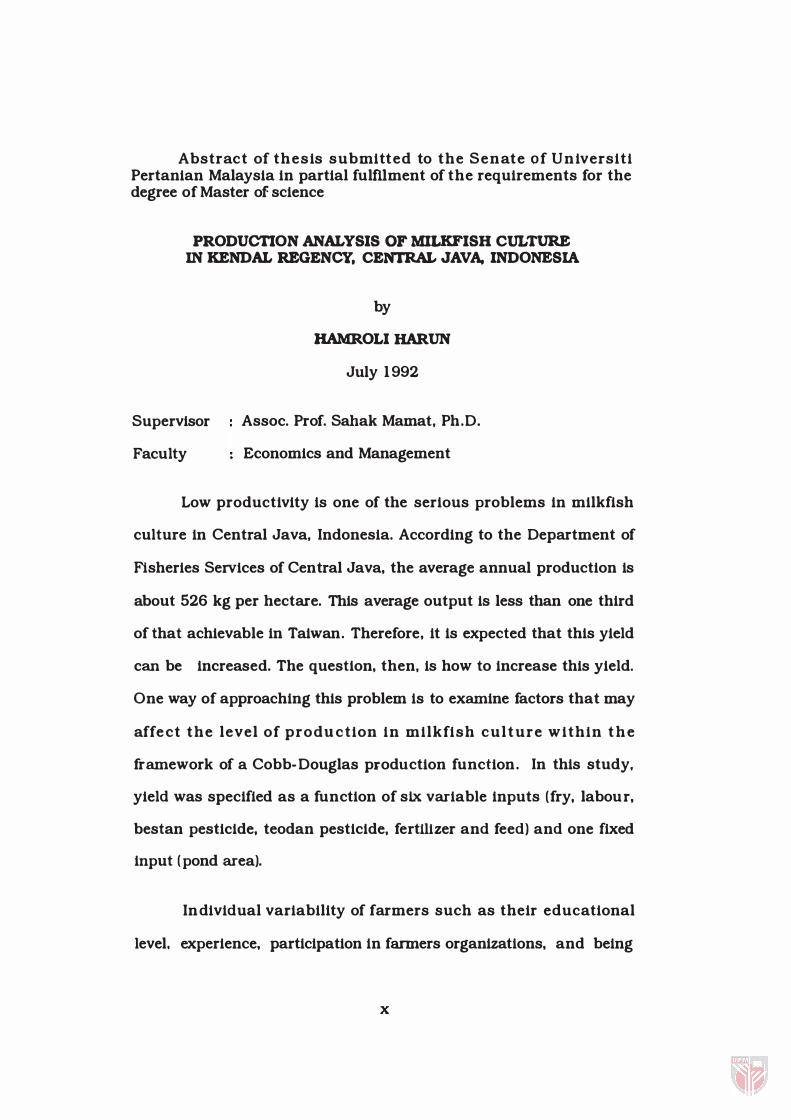
Low productivity is one of the serious problems in milkfish
culture in Central Java, Indonesia. According to the Department of
Fisheries Services of Central Java, the average annual production is
about 526 kg per hectare. This average output is less than one third
of that achievable in Taiwan. Therefore, it is expected that this yield
can be increased. The question, then, is how to increase this yield.
One way of approaching this problem is to examine factors that may
affe ct the level of prodUction in milkfish culture within t h e
framework of a Cobb-Douglas prodUction function. In this study,
yield was specified as a function of six variable inputs (fry, labour,
bestan pesticide, teodan pesticide, fert1l1zer and feed) and one fixed
input ( pond area).
Individual variability of farmers such as their educational
level, experience, participation in farmers organizations, and being
x
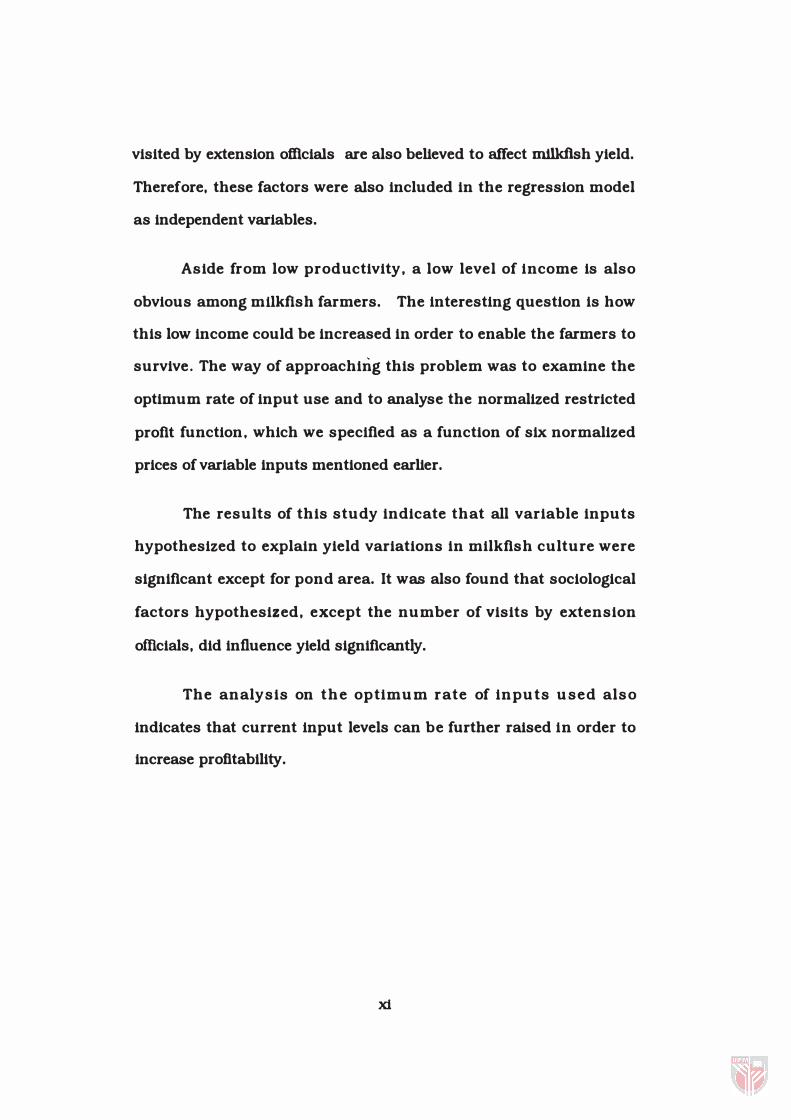
visited by extension officials are also beUeved to affect mllkfish yield.
Therefore, these factors were also included in the regression model
as independent variables.
ASide from low productivity, a low level of income is also
obvious among mUkflsh farmers. The interesting question is how
this low income could be increased in order to enable the farmers to
survive. The way of approaching this problem was to examine the
optimum rate of input use and to analyse the normalized restricted
profit function, which we specified as a function of six normalized
prices of variable inputs mentioned earUer.
The results of this study indicate that all variable inputs
hypothesized to explain yield variations in milkfish culture were
significant except for pond area. It was also found that sociological
factors hypothesized, except the number of Visits by extension
officials, did influence yield significantly.
The analysis on the optimum rate of inputs used also
indicates that current input levels can be further raised in order to
increase profitability.
xi

\
Abstrak thesis yang dikemukakan kepada Senat Universiti P ertanlan Malay sia sebagai memen u hl sebagal memenuhl sebahaglan daripada syarat dikurnlakan Ijazah Master Sains
ANALISIS PENGELUARAN IKAN PISANG-PISANG DI DAERAH KENDAL, JAWA TENGAH, INDONESIA
oleh
HamroD Barun
Julal 1 992
Penyella Prof. Madya Sahak Mamat. Ph.D.
FakulU Ekonoml dan Pengurusan
Daya pengeluaran yang rendah adalah meru pakan salah satu
masalah utama yang dlhadapl dl dalam perikanan plsang-plsang dl
Jawa Tengah, IndoneSIa. Mengtkut Jabatan Perkbidmatan Perikanan
Jawa Tengah purata keluaran tahunan di sana lalah 526 kg
sehektar. Purata pengeluaran tahunan int adalah merupakan satu
per tiga darl apa yang da�at dlcapal di Taiwan. Purata pengeluaran
yang rendah ini dipercayai boleh dipertingkatkan. Persoalannya
ialah bagrumanakah purata pengeluaran yang rendah inl boleh di-
pertlngkatkan.
Salah satu darlpada cara mendekatl masalah 1nl 1alah dengan
mengkajl faktor-faktor yang mempengaruhl tahap pengeluaran ikan
plsang-plsang menerusl fungsl pengeluaran Cobb-Douglass.
Menerusi kaedah tersebut b asil pengeluaran telah ditentukan
sebagal fungsl enam faktor input berubah (anak ikan. buruh, racun
xU
bestan. raeun teodan. baja. dan makanan ikan) dan satu input tetap
(kawasan kolam).
Perbezaan indiv1du di kalangan penternak-penternak seperti
tahap peneapaJan akadenUk, pengalaman. penglibatan penternak dl
dalam pertubuhan peladang, dan bllangan lawatan yang dilakukan
oleh pegawaJ-pegawaJ pengembangan terhadap seseorang penternak
juga dtpereayaJ mempengaruhl tingkat pengeluaran. Oleh itu faktor
faktor tersebut telah juga dlambll ktra sebagai pembolehubah di
dalam model regressi berkenaan.
Selain dari daya pengeluaran yang rendah, tingkat penda
patan yang rendah juga adalah nyata dl kalangan penternak
penternak. Persoalan yang menarlk ialah bagaimana tingkat pen
dapatan yang rendab tnt boleh diperttngkatkan untuk membolehkan
penternak-penternak berkenaan hidup lebth selesa. Car a untuk
mendekati masalab inl lalah dengan mengkajl kadar penggunaan
Input optimum dan menganalisis fungsl keuntungan yang telah
dltetapkan sebagai satu fungsl harga-harga enam input berubah
seperti yang telab dtnyatakan terlebih dabulu.
Keputusan kajian Inl menunjukkan bahawa kesemua input,
keeuali kawasan kolam, mempunyaJ kesan yang slgnlfikan terhadap
perubahan dalam tingkat pengeluaran. Kajlan inl juga mendapatt
bahawa kesemua faktor-faktor sostologikal yang tersebut di atas,
kecuaJi bllangan lawatan yang dllakukan oleh pegawaJ-pegawai
xiii

pengembangan. Juga dengan signiflkannya mempengaruhi tingkat
pengeluaran.
Analisis dari penggunaan input yang optimum juga menun
jukkan bahawa penggunaan input boleh dipertingkatkan lagi bagi
tUJuan meningkatkan lagi keuntungan di kalangan penternak
pentemak.
xiv

CHAPTER I
INTRODUCTION
The Fishery Sector of Indonesia
The economy of Indonesia is primarily agriculture. The
agriculture sector is important in terms of its contribution to gross
domestic product (GOP) and as a source of employment and foreign
exchange earnings to the Indonesian economy. In 1983 Indonesia's
agricultural sector contributed 35 percent to the country's GOP and
provided employment for about 60 percent of the total labour force in
the country. Due to its importance in the national economy,
agriculture, including the fishery sub-sector, has been chosen as the
central focus for the country's development effort since the
implementation of the First Five Year Development Plan in 1 969 .
Fishery products contributed about 6 percent to the real
agricultural G Dpl In 1 983 . They also contribute significantly to
employment and income for the people in rural areas. In 1 984, sea
fishing and brackish water fisheries provided employment to
1 .294 ,472 and 1 . 1 50,294 fishermen respectively.
Fishery products of Indonesia are from both inland and
marine and coastal fisheries. They are either captured or cultured.
The total fish production of Indonesia from both sub- sectors
increased from 1 ,849 ,662 tons in 1 980 to 2,260,989 tons in 1 984 .
1 Real agricultural GOP In 1983 was 17.696.2 bUUon rupiah.
1

2
Marine and coastal fish contributed the largest proportion to the
total fish production: 80 percent in 1 980 and more than 82 percent
in 1 984 (Table 1 ) .
Table 1
Indonesian Fish Production (Tons), 1 980, 1 984
------------------------------------------------------------------------------------------------
Sources 1 980 1 984
Brackishwater ponds 97,898 1 42,404
Freshwater ponds 66,379 76,528
Rice fields 35,495 58,880
Cages/ others 582 1 ,052
Inland open waters 254,498 269,321
Sea 1 ,394,8 1 0 1 ,71 2,804
Total 1 ,849,662 2,260,989 ============================================ ====
Source: Fisheries Statistics of Indonesia. Department of Agriculture. Jakarta. 1984
Fishery products also represent a principal source of animal
protein for Indonesians. In 1 983 . the average per capita consump
tion of fishery products was 1 5.2 kg (Susumu Awanohara. 1 984) .
Besides for domestic consumption. Indonesia also exports fishery
products. About 1 0 percent of total fish production was exported in
1 983. Due to the increase in population and income. the demand for
fishery products in the country is increasing.
To meet these increasing demands. the Government of
Indonesia has implemented several programmes to increase fish
production. Fishery authorities expect that total Indonesian fish
3
production would increase by 5.8 percent a year from 2.3 mUlion
tons in 1 984/85 to 2.8 million tons in 1 988/89. This production
increase is expected to come primarily from aquaculture, since
aquaculture production processes can be controlled and enhanced
through proper input use as opposed to capture fishery which
depends on natural stocks and enVironment. In addition, attempts
have also been made to fully utilize the available natural water
resources of the country for aquaculture purposes.
Indonesia is rich in natural water resources which can be
ut1l1zed for coastal aquaculture fishery . She has about 1 . 382, 000
km2 of continental shelf area and more than 6 1 ,000 km of coastline
which account for 14 percent of the world's coastline. Aquaculture
production accounted for 10 percent of total fishery production in
1 980 and 1 2 percent in 1 984 . It increased from 200, 354 tons in
1 980 to 278,864 tons in 1 984 (Department of Agriculture, 1 984) . In the long run, it is enVisaged that fish culture in Indonesia would
have at least the sam e potential as marine fisheries. Marine fisheries
potential within Indonesia territorial waters is estimated at 6 .5
million ton$ per year, of which 70 percent or 4.5 million ton per year
is the maximum sustainable yield (Birowo, 1 978) .
Central Java Fisheries
The Central Java Province lies between 1 080 -1 110 East of
Meridian and 60 - 80 South of equator. It is bordered by the Java Sea
in the South and West Java Province on the west. There are 3 5
4
regencies and municipalities in Central Java Province. The munici
pality of Semarang is the provincial capltal.
Fishery products contribute about 3 percent of the real
agricultural gross regional domestlc product of the province. The
fisheries sub-sector contributes significantly in terms of employment
and income for the people of Central Java. Sea fishing alone provides
employment for 64 , 950 people, while inland fisheries provides
54, 1 04 employment for the rural people in the province.
Total fish productlon from both sea and inland fisheries in the
Central Java province has been fluctuating. Total production
decreased from 1 50,822 tons in 1 979 to 1 35, 1 08 tons in 1 982. The
decline in total productlon was due to the decline in the catch of
marine fish from 1 2 1 .247 tons in 1 979 to 97,7 13 tons in 1 982 (Table
2) . However, inland fishery production increased from 29,574 tons
to 37 ,393 tons Within the same period. It is believed that the major
reason behind the decrease in the catch of marine fish is the limited
stock available Within the north coast of Central Java. The situation
Is aggravated by the increase in the number and the capacity of
fishing fleets in the area which might result in overfishing.
Central Java PrOvince is rich in natural water resources which
can be utilized for coastal and inland aquaculture. In 1 982, Central
Java produced about 20 percent of total fishery productlon in the
country. Aquaculture production in this area Is predominantly milk
fish. Mllkfish culture is an important means of subsistence for the
people In the north coast of Central Java. In 1 982 milkfish culture
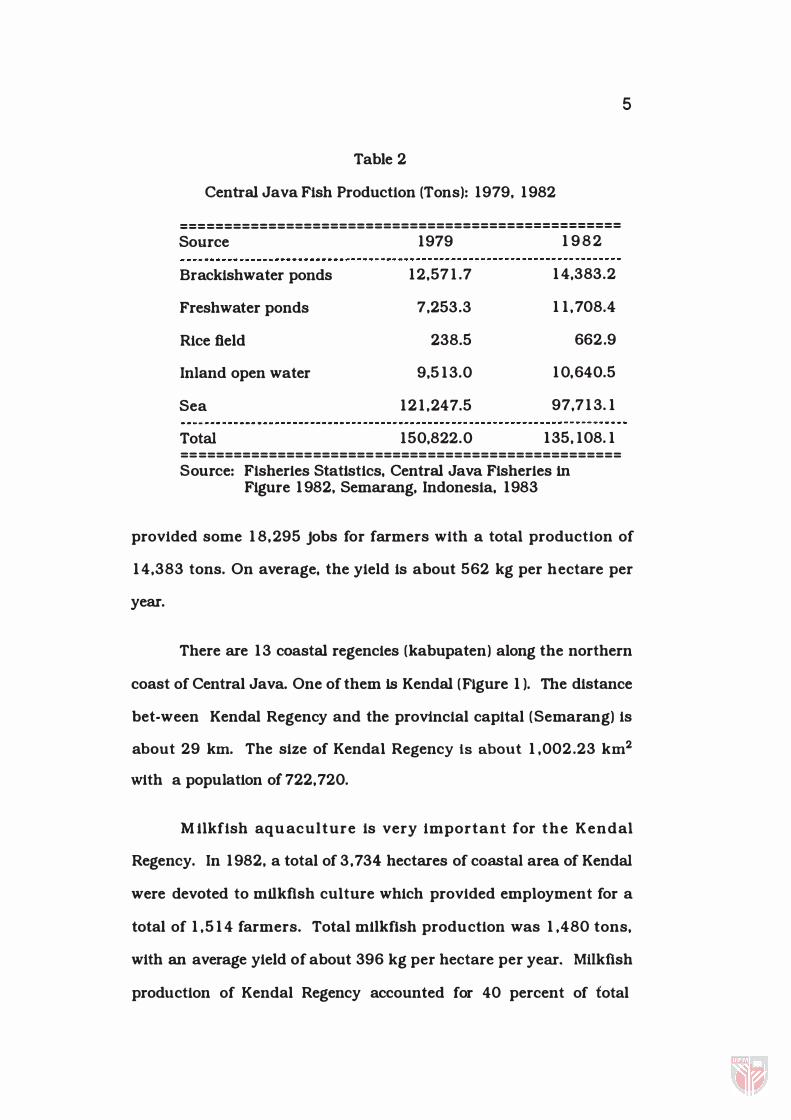
Table 2
Central Java Fish Production (Tons): 1 979. 1 982
=== ===============================================
Source 1 979 1 9 8 2
Brackishwater ponds 1 2.57 1 .7 1 4.383.2
Freshwater ponds 7.253.3 1 1 . 708.4
Rice field 238.5 662.9
Inland open water 9.5 1 3.0 1 0.640.5
Sea 1 2 1 .247.5 97.7 1 3. 1
Total 150.822.0 1 35. 1 08. 1 == ============= ======= ====== ======================
Source: Fisheries Statlstics. Central Java Fisheries in Figure 1 982. Semarang. Indonesia. 1 983
5
provided some 1 8. 295 jobs for farmers with a total production of
1 4.383 tons. On average. the yield is about 562 kg per hectare per
year.
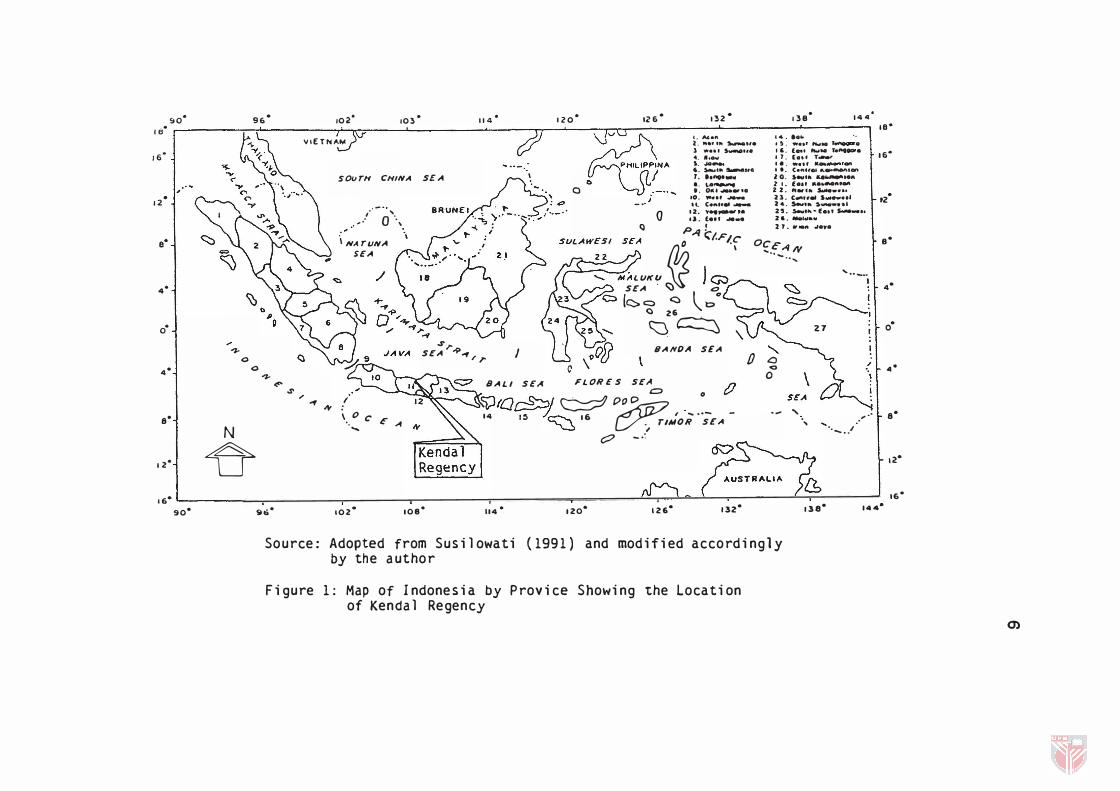
There are 1 3 coastal regencies (kabupaten) along the northern
coast of Central Java. One of them is Kendal (Figure 1 ). The distance
bet-ween Kendal Regency and the provincial capital (Semarang) is
about 29 km. The size of Kendal Regency is about 1 ,002.23 km2
With a population of 722.720.
Mllkfish aqu aculture Is very important for the Kendal
Regency. In 1 982. a total of 3.734 hectares of coastal area of Kendal
were devoted to mUkfish culture which provided employment for a
total of 1 .5 1 4 farmers. Total mllkflsh production was 1 .480 tons.
with an average yield of about 396 kg per hectare per year. MHkfish
prodUction of Kendal Regency accounted for 40 percent of total
�O'
III .
IS·
t.o� . 12
e'
4'
O'
4'
s'
IZ'
IS'
90·
�
N
9S·
o o
� �
..so "
10Z· 103·
v.ETNA'"
SOUTH CHINA SEA
" - " , ,.01 0'"
0\ NATIJNA SEA
/
114- 120· IZ6· 13Z" 138·
t. Me" '4, ....
144111
1 .... ,'" �". .$. ",." ".., .. �. 1 .... r 5V1ftO". I �. lOtI' ...,.. , ..... ecw. 4 . •• 0Il0l 17. (0.' r...,. �
o !rC§!�.�, i . .,HI..... I •. w •• , ___ ..... ,,, ... •. � ... �". It. e.,u, .. ..... �.� r . •• nee..... lO. S_ta �'eA .0 La,...".. 1 I. f ......... "._ t. O.U ...... .,... 2: Z. ,.., ... s..... ••••
o Q
.0 . ... ., ....... 2: 3. c_u .. , ....... _ ,.. CeAt'......... 2: 4. $ey," S.-... a'
12. y ..... .". 2�. Sew ..... , •• _ s.... .... .1. t... .... z& . ....... a�
PA! 21 . ., ..... ".w. C::/.FIC" o
. OCE . . - . . ..... . � ""A LlJK lJ
� \ .. AN
IIItro. •• _ ...
SEA 0 I\) C 0<;::l Ie::::. 0 <:) (t:> <I () 26
I.
Ie"
16·
'Z"
8·
4·
�� 27 i � o·
Sr ... SEA �/r I BANDA SEA "
C � 0 � "\....
�'" \.0 C' E A ......
BALI SEA FLORE S SEA .n 0 c:;J 0 V
fi)ICl�1 � P�D " A�.A:!,:'lJ .' 14 I� z.� 16 ' ,.,- - ._ "
o rlMOR SEA ', /
/ .
,,,,., ........ � .
'I"
s"
c:? -.�
4T 12·
g�. 10Z" 108' 114 · 120· 126" '3Z"
Source: Adopted from Susilowati (1991) and modified accordingly by the author
Figure 1: Map of Indonesia by Provice Showing the location of Kendal Regency
IS" '38" 144-
0)

7
fishery products in 1982. Table 3 shows fish production from the
total fishery sub-sector of Kendal Regency for 1982.
Table 3
Kendal Regency Fish Production (Ton): 1982
============================== ========
Source
Bracktshwater ponds
Freshwater
Inland open water
Sea
Total
1982
1.480
22 157
2,088
3 , 74 7 ============================ ==========
Source: Central Java Fisheries in Figure (1982), Fisheries Service of Central Java, Semarang, Indonesia
Mllkf1sh Culture Operation
Mllkfish \Culture in Indonesia has been practiced since the
Middle Ages. The first mUkftsh culture pond was built on the
initiative of a ''wall'' (trave1l1ng teachers of Islam) in East Java; it then
spread out to Central and West Java.
The history of mllkflsh culture in Central Java can be traced
back to the construction of mllkflsh culture ponds in Semarang in
1820, and one which was started in 1860 in Demak Regency. From
here, m1lkftsh culture spread along the north coast of Central Java.
Mllkfish culture operation is managed along agriculture lines,
but it is physiologically much more sensitive than a rice field or an

8
orchard. The risk in mUkflsh operations is high. since many things
can happen to flsh under a calm water surface. and it is not so easy
to detect what is going on. Operators must be alert all the time to
find out such indicators which may cause trouble.
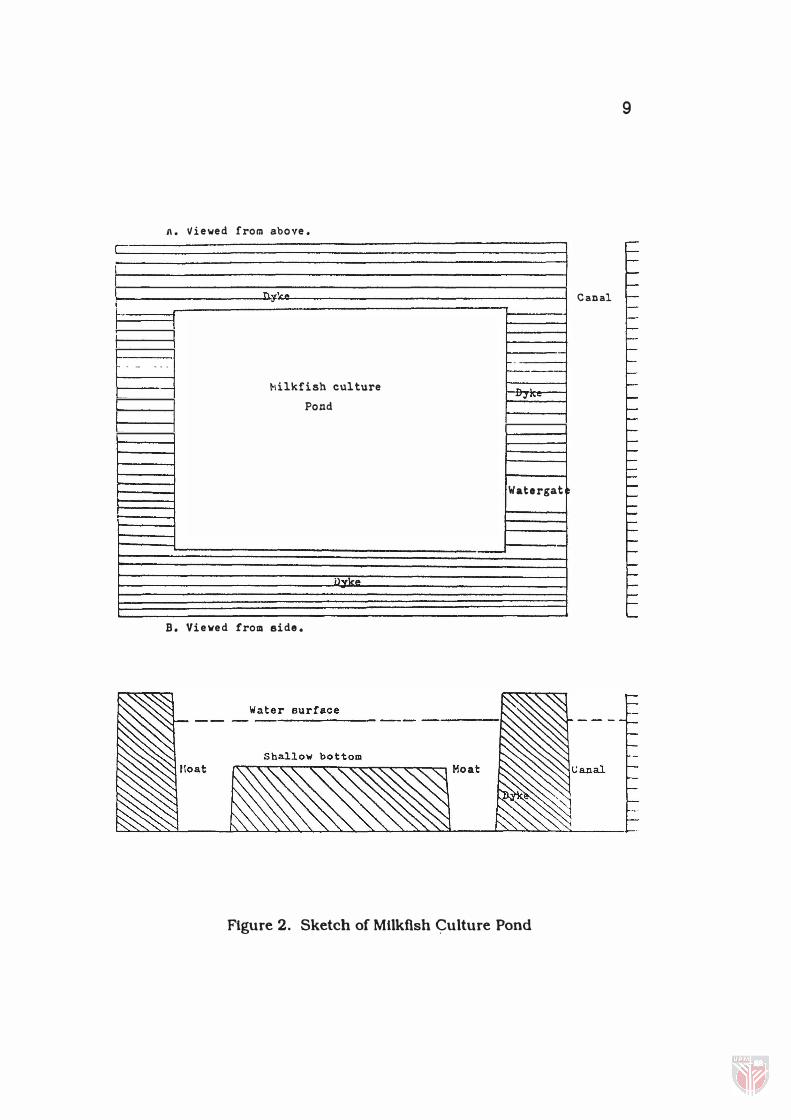
MUkftsh culture ponds are generally constructed by first
digging a broad. shallow ditch along the sides of a square plot of
land. Soil removed can be u sed to build the dykes. The dykes are
closed by placing a watergate which will face a nearby canal from
which water will flow in and out of the pond (Figure 2 ) .
There are various problems with a newly constructed pond.
The risk of the dyke breaking is great. Ponds are quickly ruled with
silt. These are some of the reasons why milkfish culture is only
undertaken about four years after pond construction. By then. the
dykes become strong and the risk of loss is reduced. Before a pond is
stocked with fry. it must be cleaned from trash fish. including the
predators.
The main rearing ponds have to be drained till the shallow
bottom is exposed to sunlight and air for several days. The surface
of the pond bottom will soon be covered by a bloom of algae which is
the main food for mUkfish. This is also the time to fertilize the pond
by broadcasting or submerging fertlllzer five centimenters below
the pond surface. The main objective of using fertilizer is to induce
the growth of algae. To reduce predators. some pesticides have to be
applied. When the algae bloom is suffiCient. water is allowed to fill
the pond and the fry are released into the pond. The fry are poured
r-
. . -
A. Viewed from above.
- - -
TI ' ......
Milkfish culture
Pond
ilylr'"
B. Viewed from side.
-1--'---
...... -.!. ""�
Watergat
--
Figure 2. Sketch of Milkflsh 9ulture Pond
9
Canal

1000351170
10
slowly into the nursery pond in order to reduce the temperature
difference. This is usually done in the morning or at sun set.
Generally. each pond can be harvested twice a year. The main
product of the pond Is mUkftsh. but there are other species of fish in
the pond. At every filling of a pond. different kinds of fry are swept
into the pond. No pond can be kept absolutely free from trash fish.
so their existence must be made useful.
Statement of the Research Problem
It is generally believed that productivity among the milk fish
farmers in Kendal Regency is low (Fisheries Service of Central Java.
1 982). Several studies (Diponegoro University. 1 972. 1974. 1975) on
milkftsh culture of Central Java have reported that:
( 1 ) Milkftsh culture pond operation is still traditional.
(2) The application of new inpu t s and t e c h n ology is
uncommon. and
(3) The level of production Is low.
According to the fisheries offices of Central Java Province
( 1 982). the average annual production of milkfish of Kendal Regency
is 396 kg/ha while the average productivity from Central Java is only
529 kg/hat In comparison. the average yield per unit of pond in
Central Java is about a third of that achieved in Taiwan (Toto Sugtto.
1 9 78 ). It Is. therefore • . belleved that the productivity of mllkfish
Related Documents