Prologis November 27, 2012 London, United Kingdom UBS Global Real Estate CEO Conference

Welcome message from author
This document is posted to help you gain knowledge. Please leave a comment to let me know what you think about it! Share it to your friends and learn new things together.
Transcript

Prologis
November 27, 2012
London, United Kingdom
UBS Global Real Estate CEO Conference

Forward-Looking Statements
2
The statements in this presentation that are not historical facts are forward-looking statements within the meaning of Section 27A of the Securities Act of 1933, as
amended, and Section 21E of the Securities Exchange Act of 1934, as amended. These forward-looking statements are based on current expectations, estimates
and projections about the industry and markets in which Prologis operates, management’s beliefs and assumptions made by management. Such statements
involve uncertainties that could significantly impact Prologis’ financial results. Words such as ―expects,‖ ―anticipates,‖ ―intends,‖ ―plans,‖ ―believes,‖ ―seeks,‖
―estimates,‖ variations of such words and similar expressions are intended to identify such forward-looking statements, which generally are not historical in nature.
All statements that address operating performance, events or developments that we expect or anticipate will occur in the future — including statements relating to
rent and occupancy growth, development activity and changes in sales or contribution volume of developed properties, disposit ion activity, general conditions in
the geographic areas where we operate, synergies to be realized from our recent merger transaction, our debt and financial position, our ability to form new
property funds and the availability of capital in existing or new property funds — are forward-looking statements. These statements are not guarantees of future
performance and involve certain risks, uncertainties and assumptions that are difficult to predict. Although we believe the expectations reflected in any forward-
looking statements are based on reasonable assumptions, we can give no assurance that our expectations will be attained and therefore, actual outcomes and
results may differ materially from what is expressed or forecasted in such forward-looking statements. Some of the factors that may affect outcomes and results
include, but are not limited to: (i) national, international, regional and local economic climates, (ii) changes in financial markets, interest rates and foreign currency
exchange rates, (iii) increased or unanticipated competition for our properties, (iv) risks associated with acquisitions, dispositions and development of properties,
(v) maintenance of real estate investment trust (―REIT‖) status and tax structuring, (vi) availability of financing and capital, the levels of debt that we maintain and
our credit ratings, (vii) risks related to our investments in our co-investment ventures and funds, including our ability to establish new co-investment ventures and
funds, (viii) risks of doing business internationally, including currency risks, (ix) environmental uncertainties, including risks of natural disasters, and (x) those
additional factors discussed in reports filed with the Securities and Exchange Commission by Prologis under the heading ―Risk Factors.‖ Prologis undertakes no
duty to update any forward-looking statements appearing in this presentation.

CO
NT
EN
TS
Contents
Prologis Overview 4
Business Lines 10
10Q Plan 19
2012 Guidance 25
Key Takeaways 26
Appendix 27
Total Return Performance
Long-term Global Trends and Demand Drivers
Property Photos
Reporting Definitions

Prologis Overview
4 Note: Data as of September 30, 2012
World Class
Platform
Differentiated
Strategy
Financial
Strength
Vibrant Private
Capital Franchise
Total AUM of ~$45 billion across ~565 msf (53 msm) in 21 countries on four continents
Broad, diverse, multi-national customer base that results in repeat business
Breadth and depth of team is unparalleled in the real estate industry
Committed to building one of the top three balance sheets in the REIT industry
Debt maturities well-laddered, geographically diverse and in manageable tranches
Continued access to debt capital markets through established lender relationships
Focused exclusively on high-quality global and regional industrial logistics markets
AUM of ~$18 billion in 16 co-investment ventures and funds
~$2 billion of deployment capacity across three continents
Global operating company with a distinct advantage over capital allocators and local developers
Invest in distribution and logistics facilities vital to global and regional supply chains
Local market knowledge, development expertise and commitment to sustainable design

Chronology
5
1983
AMB Property Corporation
(AMB) formed as an
investment management
business with focus on
investing in office, industrial
and community shopping
centers on behalf of major
institutional investors.
1994
Security Capital
Industrial Trust makes
its initial public offering
on the New York
Stock Exchange.
1998
Security Capital
Industrial Trust
officially changes its
name to ProLogis.
2004
AMB founded first
open-end commingled
fund by a REIT, AMB
Institutional Alliance
Fund III.
2011
The former ProLogis
and AMB complete a
merger of equals to
create the pre-eminent
global industrial real
estate company.
1997
AMB closes initial
public offering (IPO),
becoming one of the
largest publicly-traded
real estate companies
in the U.S.
1999
ProLogis forms its
first property fund,
ProLogis California
and the ProLogis
European Property
Fund.
1991
The company that is to
later become ProLogis
is incorporated as
Security Capital
IndustrialTrust.
AMB launches its first
commingled private
capital fund.
2003
ProLogis is added to
the S&P 500.
1987
AMB refines its
investment strategy
over the next two
years by exiting office
markets and focusing
on industrial and
shopping centers in
infill trade areas. 1991
5

Unmatched Global Platform
6
Note: Data as of September 30, 2012
1. Comprises operating, development and other portfolio
2. International Monetary Fund
Platform covers countries representing ~80% of global GDP(2)
Americas Europe Asia Total
Total Prologis’
Share Total
Prologis’
Share Total
Prologis’
Share Total
Prologis’
Share
Total Portfolio(1) -
Square Feet / Square Meters
(millions)
387 / 36 73% 144 / 13 67% 34 / 3 72% 565 / 53 71%
Development – TEI ($mm) $471 85% $179 89% $882 91% $1,532 89%
Land (acres) 6,897 97% 3,543 100% 129 95% 10,569 98%

Leading Customer Brand
7 Note: Data as of September 30, 2012
1. On-Tarmac counted as a separate market
Deep partnerships with highly diversified customer base
(% ABR)
2.2
1.3 1.3 1.1 0.9 0.8 0.8 0.8 0.7 0.7
0.0
0.5
1.0
1.5
2.0
2.5
3.0
DHL Kuehne & Nagel
CEVA Logistics
Geodis Amazon.com, Inc.
Home Depot, Inc.
Panasonic Co., Ltd.
United States Government
FedEx Corporation
PepsiCo
Number of
Countries 15 14 10 11 3 1 2 1 2 2
Number of
Markets(1) 41 28 22 18 6 7 7 10 12 11
Number of
Leases 126 65 42 39 13 8 20 52 42 18

Asset Allocation – Market Strategy
8 1. Represents Prologis’ share at September 30, 2012
GLOBAL MARKETS – 83% of NOI(1)
• Typically in markets that are served by a major seaport
and/or international airport
• Targeted development opportunities, increased
capital deployment
• Operating Portfolio – 407 msf / 38 msm
(287 msf / 27 msm) (1)
REGIONAL MARKETS – 12% of NOI(1)
• Local and regional distribution, not storage optimization
• Selectively disposing, acquiring and developing
• Operating Portfolio – 82 msf / 8 msm
(61 msf / 6 msm) (1)
OTHER MARKETS – 5% of NOI(1)
• Exit over time
• Operating Portfolio – 41 msf / 4 msm
(25 msf / 2 msm)(1)

Strategic Priorities
9 Data as of September 30, 2012
Execution of strategic plan on track
Priority Today Target Status
Build the best / most integrated real estate organization Completed
Merger synergy savings $115 M $90 M
Improve the utilization of our assets Ahead
Asset stabilization 93.1% 95%
Realign our portfolio with our investment strategy Ahead
Dispose of buildings to third-parties $1.6 B $2.9 B
Assets in global markets 83% 90%
Streamline our Private Capital business Ahead
Fund rationalization 7 4
New fund formation 0 3-4/7
Strengthen our financial position Slightly behind
Net debt to EBITDA 9.0x 6.0x
Look through leverage ratio 45% 30%

Prologis Business Lines(1)
10 1. Data as of September 30, 2012
2. Excludes promotes and development fees
OPERATIONS
Collect Rent
PRIVATE CAPITAL
Generate Fees
DEVELOPMENT
Create Value
• Stable income stream
• Global presence/local
market expertise
• Diversified global
customer base
• Recurring annuity stream
diversified by geography and
capital source
• Expands global operating
platform: less Prologis capital;
lower currency exposure
• New ventures will be seeded
with Prologis assets
• Various demand drivers exist
across all business cycles
• Established customer
relationships drive BTS
opportunities
• Existing land bank represents
an asset as markets recover
• $2.4B of annualized NOI
($1.6B Prologis’ share)
• 565 msf (404 msf Prologis’
share) / 21 countries / 4
continents
• 4,500 customers
$127M annualized private
capital revenue(2)
$18.4B of AUM ($4.2B
Prologis’ share)
$1.5B under development
($1.4B Prologis’ share)
Expected value creation $283M
($259M Prologis’ share)(2)
• Rent recoveries, to align with
replacement costs, and
occupancy gains
• Long-term growth from annual
contractual rent increases
• BTS activity in U.S. and Europe
• Speculative development in
Asia and emerging markets
• Increased revenues from
incremental AUM
• Significant promote opportunities
from recovery

Prologis’ Annualized Income(1)
11
$127M
$1.6B
$-400M
Incremental
with Stabilized
Fundamentals
+/- $100M
Additional Annual
Value Creation
Activities(4)
Real Estate
Operations NOI(2), (3)
Private Capital
Revenues
Development
Value Creation(3)
$ ~55M
Additional Revenues
from Incremental AUM
$259M
~95%
of Core
EBITDA
~5%
of Core
EBITDA
Lower
Higher
Mu
ltip
le
$265M of Total Value Creation
1. Represents a static portfolio, as of September 30, 2012, which excludes any effects from future acquisitions, dispositions, contributions and debt retirement
2. Net Operating Income (―NOI‖) represents rental income less rental expenses
3. Represents Prologis’ share
4. Includes development, land bank monetization and value creation activities

Operating Fundamentals
12 Data as of September 30, 2012
3%
4%
5%
6%
7%
8%
0
10,000
20,000
30,000
40,000
Q3 2011 Q4 2011 Q1 2012 Q2 2012 Q3 2012
New Leases Renewals % of Total Portfolio
33,450 37,561
Square Feet (000s)
30,852 34,999 38,980
Operating Portfolio – Period Ending Occupancy
Leasing Activity
2011 2012 2011 2012 2011 2012 2011 2012
91.1% 92.2% 92.1% 92.2%
93.3%
80%
85%
90%
95%
100%
Q3 Q4 Q1 Q2 Q3
90.0% 91.6% 92.1% 92.1% 92.0%
Q3 Q4 Q1 Q2 Q3
95.0% 96.0% 96.2% 96.8% 96.5%
Q3 Q4 Q1 Q2 Q3
91.0% 92.2% 92.3% 92.4%
93.1%
Q3 Q4 Q1 Q2 Q3
Americas Europe Asia Total
% of Total Portfolio

Global Rent Recovery
13
%
%
%
%
Americas
103% of
nominal peak
Europe &
Japan
96% of
nominal peak
Source: Prologis Research, CBRE
Forecast
China
125% of
nominal
peak
Americas Europe Japan China Wtd Average
%
%
%
%
%
5.2% CAGR
on Wtd Average
75
85
95
105
115
125
2001 2002 2003 2004 2005 2006 2007 2008 2009 2010 2011 2012 2013 2014 2015 2016
155
165
175

Global Private Capital – Co-Investment Strategy
14 Note: AUM is based on fair market value of private capital co-investment ventures and estimated investment capacity as of September 30, 2012.
* Represents potential future co-investments
• Open end funds to hold assets in mature markets (U.S., Europe, Japan)
• Development outside the U.S. / Europe to occur in funds (China, Mexico, Brazil)
• Development in U.S. occur on balance sheet to replace dispositions
Core
Core Plus
Value Add
Opportunistic
Mexico Fondo Logistico
Future Canada Venture*
Future Mexico Venture*
Prologis DFS I
Brazil Logistics Partners Fund I
Future Brazil Venture*
European Properties Fund II
Europe Logistics Venture 1
Targeted Europe Logistics Fund
Future Europe Venture*
Future UK Venture*
Japan OEF and/or JREIT*
China Logistics Venture 1
Japan Development Fund*
North American Industrial Fund
Targeted U.S. Logistics Fund
Mexico Industrial Fund
Asia $2.9B Americas $9.9B Europe $5.6B

Fee Increase on Asset Management Alone
15 1. Assumes no cap rate compression and property appreciation. It does assume that 50% of all expired capital is reinvested in a similar fund with a similar fee
structure. Future fund deployment is factored into this analysis
Forecasted Asset Management(1)
–––
Assets Under Management
2014 2015 2016
AM
Fe
es
- $ M
illion
s
AU
M -
$ B
illi
on
s
$60
$80
$100
$120
$140
$160
$15
$18
$21
$24
$27
$30
$33
1 2 3 4 5 6 2011 2012 2013
Asset Management Fees
2014 2015 2016

Global Development Overview
16 1. Original cost basis for land portfolio is $3.1 Billion
Strategic land bank provides substantial development opportunities
N. America 30%
Mexico 5%
Brazil 10%
Europe 20%
China 10%
Japan 25%
Projected Deployment Mix ~$2.5 B
2007 2012E Future Run Rate
Development Starts
$3.8 B
$2.5 B
$1.1 B
$1.5 B
2007 Q3 2012 Future Run Rate
Land Portfolio
$2.2 B $2.0 B $1.6 B
$0.6 B
(1)
AMB
PLD
AMB
PLD
Value Creation
$225 M
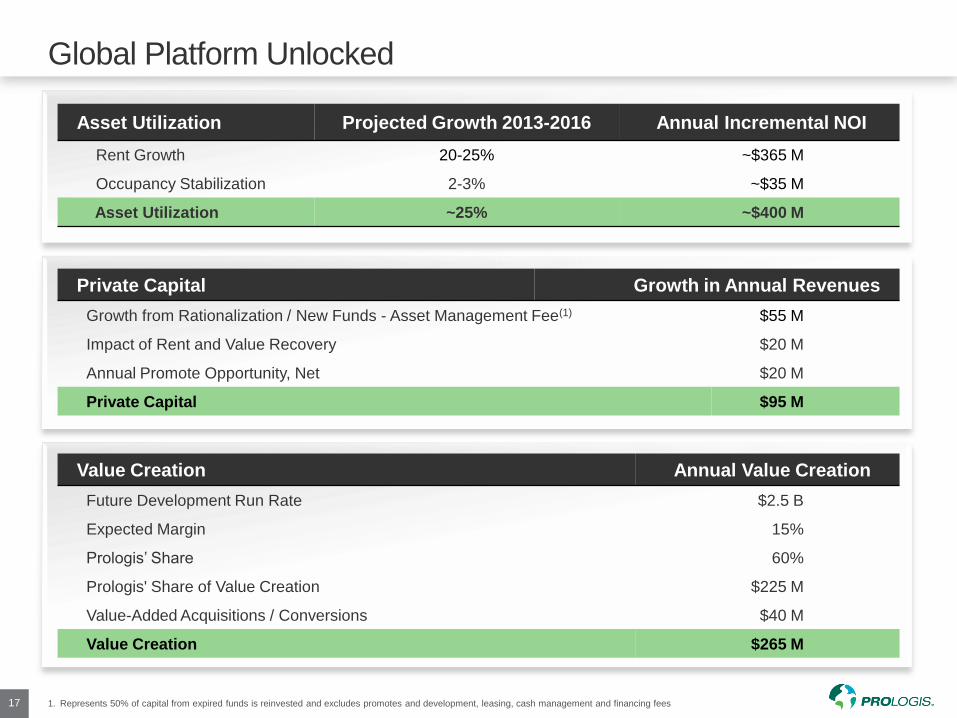
Global Platform Unlocked
17
Asset Utilization Projected Growth 2013-2016 Annual Incremental NOI
Rent Growth 20-25% ~$365 M
Occupancy Stabilization 2-3% ~$35 M
Asset Utilization ~25% ~$400 M
Private Capital Growth in Annual Revenues
Growth from Rationalization / New Funds - Asset Management Fee(1) $55 M
Impact of Rent and Value Recovery $20 M
Annual Promote Opportunity, Net $20 M
Private Capital $95 M
Value Creation Annual Value Creation
Future Development Run Rate $2.5 B
Expected Margin 15%
Prologis’ Share 60%
Prologis' Share of Value Creation $225 M
Value-Added Acquisitions / Conversions $40 M
Value Creation $265 M
1. Represents 50% of capital from expired funds is reinvested and excludes promotes and development, leasing, cash management and financing fees
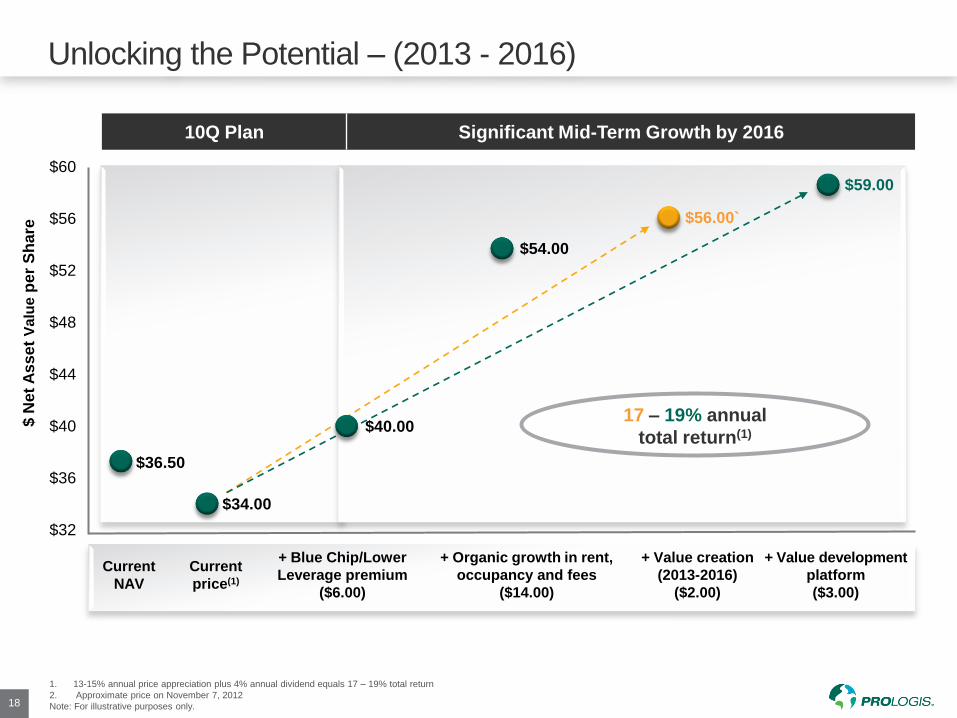
Unlocking the Potential – (2013 - 2016)
18
$60
$56
$52
$48
$44
$40
$36
$32
+ Organic growth in rent,
occupancy and fees
($14.00)
$54.00
+ Value creation
(2013-2016)
($2.00)
$56.00`
$ N
et
As
se
t V
alu
e p
er
Sh
are
$34.00
Current
price(1)
$36.50
Current
NAV
10Q Plan Significant Mid-Term Growth by 2016
+ Value development
platform
($3.00)
$59.00
17 – 19% annual
total return(1)
+ Blue Chip/Lower
Leverage premium
($6.00)
$40.00
1. 13-15% annual price appreciation plus 4% annual dividend equals 17 – 19% total return
2. Approximate price on November 7, 2012
Note: For illustrative purposes only.
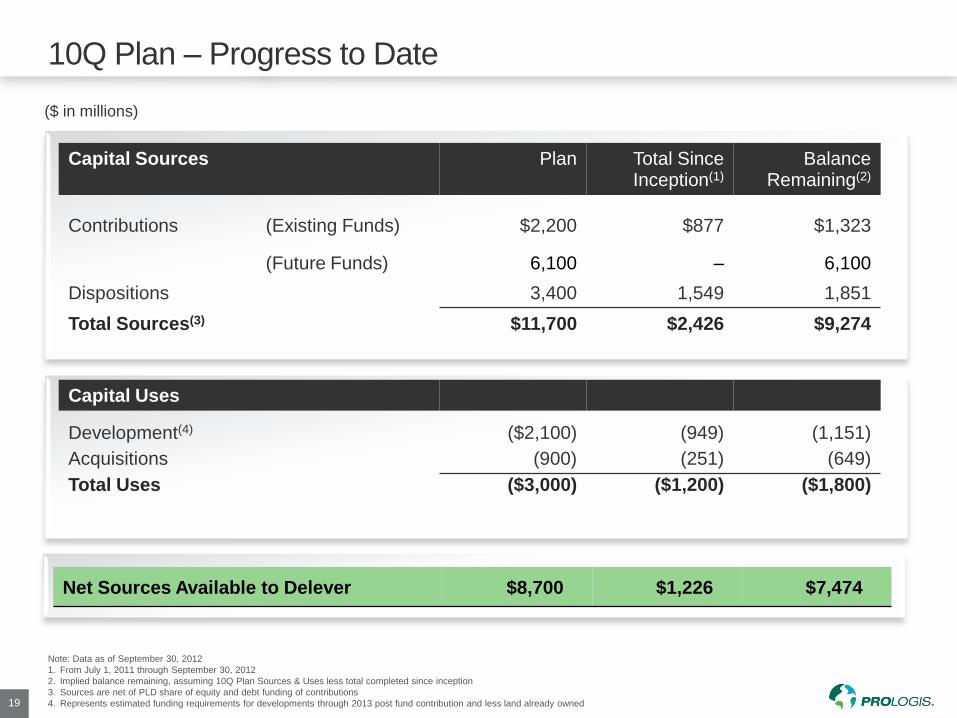
10Q Plan – Progress to Date
19
Note: Data as of September 30, 2012
1. From July 1, 2011 through September 30, 2012
2. Implied balance remaining, assuming 10Q Plan Sources & Uses less total completed since inception
3. Sources are net of PLD share of equity and debt funding of contributions
4. Represents estimated funding requirements for developments through 2013 post fund contribution and less land already owned
Net Sources Available to Delever $8,700 $1,226 $7,474
Capital Sources Plan Total Since Inception(1)
Balance Remaining(2)
Contributions (Existing Funds) $2,200 $877 $1,323
(Future Funds) 6,100 – 6,100
Dispositions 3,400 1,549 1,851
Total Sources(3) $11,700 $2,426 $9,274
Capital Uses
Development(4) ($2,100) (949) (1,151)
Acquisitions (900) (251) (649)
Total Uses ($3,000) ($1,200) ($1,800)
($ in millions)

10Q Plan – Illustrative Earnings Impact
20
1. Sources are net of PLD share of equity and debt funding of contributions
2. Based on Prologis’ weighted average stabilized cap rates for Americas, Europe and Asia at September 30, 2012
3. Development yield of 10% (8.5% adjusted to incorporate land already owned by Prologis) and acquisition stabilized cap rate of 6.5%
4. 80 bps on $9.2B (contributions and acquisitions held in funds)
Unique opportunity to
delever the balance sheet
with minimal dilution
Total Sources(1) $11,700
Cap Rate(2) ~6.1%
NOI ($720)
Capital Uses $3,000
Development and Acquisition ($3,000)
Incremental Yield/Cap Rate(3) ~9.0%
$270
Delever ($8,700)
Interest Rate ~4.3%
$369
Fees on incremental AUM(4) $74
Core FFO Impact ~$(7)
Net Dilution ~($0.02)/share
($ in millions, except per share)

10Q Plan – Impact on Look Through Leverage
21
10Q plan, including reinvestment, achieves target look-through leverage
(3.9%)
Portfolio
Realignment
Europe
Recapitalization
(8.5%) Japan
Recapitalization
(6.3%)
Post 10Q Plan
~30%
3.8 %
Reinvestment
Q3 2012
45%
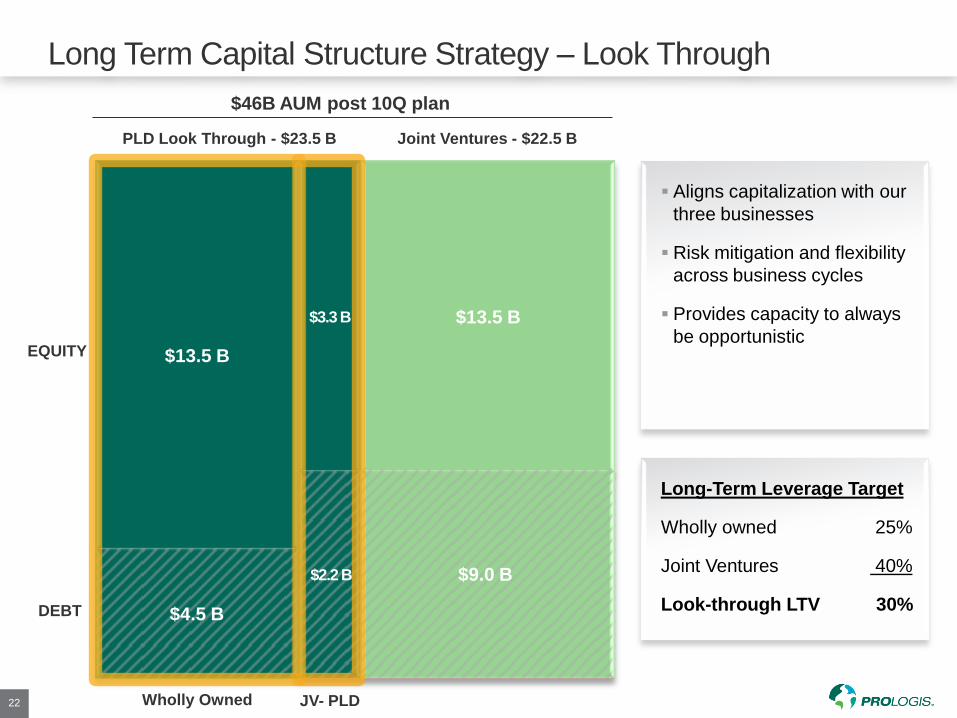
Long Term Capital Structure Strategy – Look Through
22
$13.5 B
$9.0 B
$13.5 B
$4.5 B
$3.3 B
$2.2 B
DEBT
JV- PLD Wholly Owned
EQUITY
Aligns capitalization with our
three businesses
Risk mitigation and flexibility
across business cycles
Provides capacity to always
be opportunistic
Long-Term Leverage Target
Wholly owned 25%
Joint Ventures 40%
Look-through LTV 30%
PLD Look Through - $23.5 B Joint Ventures - $22.5 B
$46B AUM post 10Q plan

Long Term Gross Asset Allocation and Net Equity Position
23 Note: Gross asset allocation and Prologis’ share of net equity contemplates completion of the 10Q plan
50%
28%
13%
9%
Gross Asset Allocation – $46B
80%
8%
6% 6%
Prologis’ Share of Net Equity – $16.8B
$ € ¥ Other

Building Blocks of NAV
24 1. Data reflects wholly owned and Prologis’ share of stabilized cash NOI, assets and debt as of September 30, 2012
2. Based on weighted average stabilized cap rates for Americas, Europe and Asia
$ 15,998 - $17,598M
460M
~$35.00 - $38.00
NOI $1,700(1) / 6.40% – 6.10%(2) $26,563 - $27,869M Properties with Net Operating Income
Stabilized Fair Value $1,009 - $1,086M Development Portfolio
Book Value $1,965M Land Bank
Multiple of Fees (10x -12x) $652- $788M Private Capital / Dev Mgmt
Net Working Capital, Other Real Estate
Related Assets & Minority Interests ($59M) Other Assets / (Liabilities)
Book Value + % Share of Fund Debt ($14,312 M) Debt
Net Asset Value
Diluted Shares
Components Net Asset Value Range
95%-105% of Book Value $762 - $843M Properties with Net Operating Loss
Net Asset Value Per Diluted Share
Book Value ($582M) Preferred Stock
Implied Cap Rate NAV
$30.00 7.02%
$32.00 6.78%
$34.00 6.53%
$36.00 6.31%
$38.00 6.10%
$40.00 5.90%
$42.00 5.89%

2012 Guidance(1)
25 1. Annual company guidance provided on October 23, 2012
2. Same Store NOI is on GAAP basis
($ In Millions except per share data) Low High
CORE FUNDS FROM OPERATIONS (per fully diluted unit and share) $1.72 $1.74
OCCUPANCY IN OPERATING PORTFOLIO 93.0% 93.5%
SAME STORE NOI(2) 1.0% 2.0%
CAPITAL DEPLOYMENT
Acquisitions
Total $450 $550
Prologis’ share (35-45%) $180 $220
Development Starts
Total $1,400 $1,500
Prologis’ share (75-85%) $1,120 $1,275
CONTRIBUTIONS / DISPOSITIONS
Total $3,500 $7,000
Prologis’ share (60-75%) $2,360 $4,725

26
Building the foundation for significant future growth
Organization
Portfolio
Balance Sheet
10Q
Pla
n
Significant embedded organic growth potential
Recovery in rents and occupancies
Stabilization of value creation activities
Growth in Private Capital business
Mid
Term
Secular drivers of demand
Rapid growth in global trade
Consumption growth in emerging markets
Reconfiguration of the supply chain
Lo
ng
Term
Unlocking the Potential

27

A Compelling Opportunity
28
Why
REITs?
Why
Industrial?
Why Industrial?
• Stable occupancy
• Lower volatility of returns
• Low levels of capital
expenditures in relation to
NOI
Why Now?
• Global recovery underway
• Inventories at unprecedented lows
• Operating fundamentals improving
Why REITs?
• Consistent income stream
• Consistent out
performance vs. major
indices (DJIA/SP500)
• Hedge against inflation
Why
Prologis?
Why
Now? Why Prologis?
• Unmatched global platform
• Best customer brand in the
real estate industry
• Market leading Private Capital
business
• World’s leading industrial
property developer
• The best and most diverse real
estate organization

2.6% 0.5% 1.0%
3.7%
Apartment Office Industrial Retail
Total Return Performance
29 Source: National Council of Real Estate Investment Fiduciaries (NCREIF), Bloomberg
Note: For equity total returns, Apartment = EQR and AVB; Office = BXP and SLG; Industrial = PLD; Retail = SPG and TCO
8.7% 7.7% 8.2% 10.2%
Apartment Office Industrial Retail
1069% 982%
213%
2207%
0%
January 2008 – September 2012
0%
Equity NCREIF
114.7%
28.2%
-17.0%
124.2%
January 2000 – September 2012

Global Demand Drivers
30 Source: Prologis Research, World Bank, International Monetary Fund
Demand Drivers Economy Supply Chain
U.S., Canada Mature Developed
Japan,
Europe Mature Underdeveloped
China, Brazil,
Mexico Emerging Underdeveloped
C T R
C T
C T R
Consumption Global Trade Reconfiguration T C R

Global Trade Relative to Global GDP
31 1. Reflects annual compounded growth from 1960 to 2010
2. World Bank and International Monetary Fund – 2011
Global trade has outpaced Global GDP by 3.5X over the past 50 years
0%
500%
1000%
1500%
2000%
2500%
1960 1965 1970 1975 1980 1985 1990 1995 2000 2005 2010
Global Trade
5.9%/yr(1)
Global GDP
3.5%/yr(1)

U.S. Industrial Market Outlook
32 Source: Prologis Research, CBRE-EA and Bureau of Economic Analysis (BEA)
• Record low supply from 2009 through 2013
• Vacancy forecast consistent with broad based rent growth in 2013
0.0%
2.0%
4.0%
6.0%
8.0%
10.0%
12.0%
-300
-200
-100
0
100
200
300
400
1990
1991
1992
1993
1994
1995
1996
1997
1998
1999
2000
2001
2002
2003
2004
2005
2006
2007
2008
2009
2010
2011
2012
2013
2014
Completion (left axis) Net Absorption (left axis) Vacancy Rate (right axis)
FO
RE
CA
ST
Va
ca
nc
y R
ate
M
illio
n S
qu
are
Fe
et
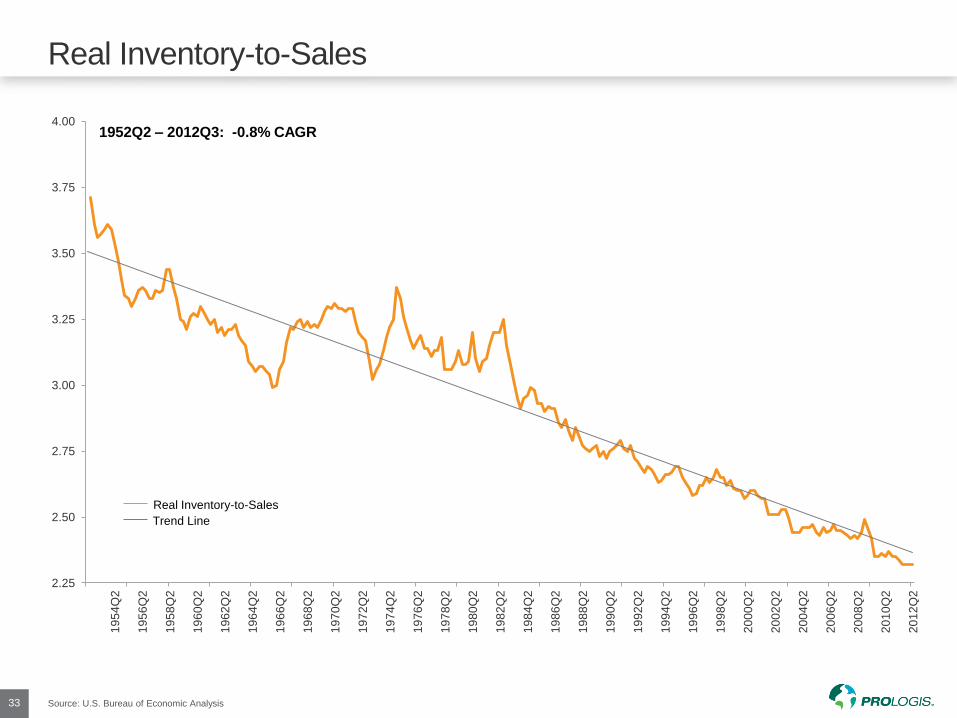
Real Inventory-to-Sales
33 Source: U.S. Bureau of Economic Analysis
2.25
2.50
2.75
3.00
3.25
3.50
3.75
4.00 1
95
4Q
2
19
56
Q2
19
58
Q2
19
60
Q2
19
62
Q2
19
64
Q2
19
66
Q2
19
68
Q2
19
70
Q2
19
72
Q2
19
74
Q2
19
76
Q2
19
78
Q2
19
80
Q2
19
82
Q2
19
84
Q2
19
86
Q2
19
88
Q2
19
90
Q2
19
92
Q2
19
94
Q2
19
96
Q2
19
98
Q2
20
00
Q2
20
02
Q2
20
04
Q2
20
06
Q2
20
08
Q2
20
10
Q2
20
12
Q2
1952Q2 – 2012Q3: -0.8% CAGR
Real Inventory-to-Sales
Trend Line
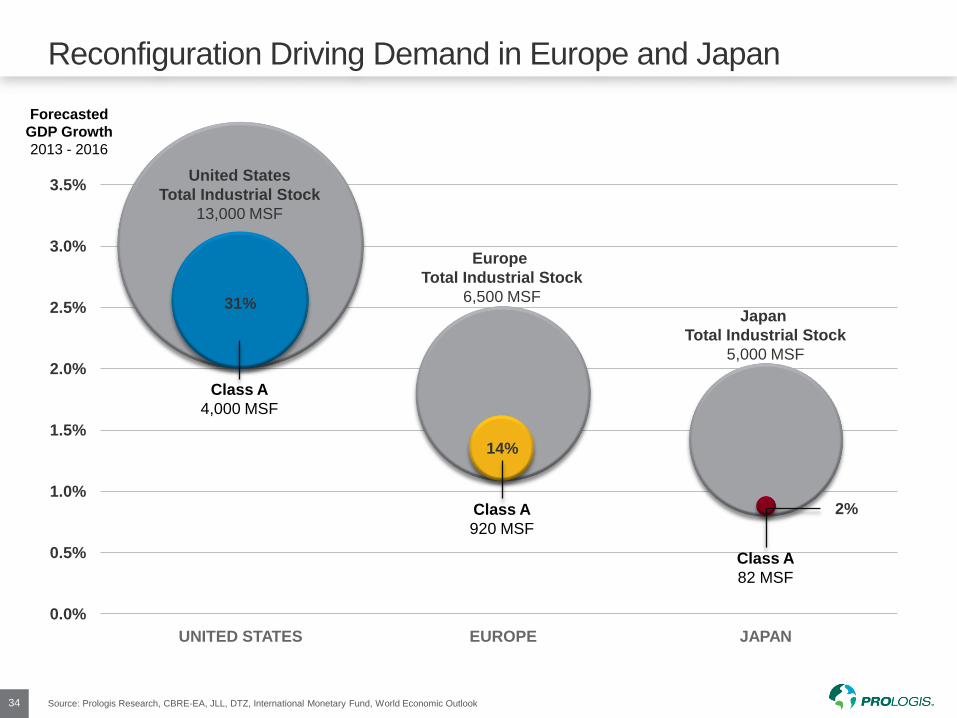
Reconfiguration Driving Demand in Europe and Japan
34 Source: Prologis Research, CBRE-EA, JLL, DTZ, International Monetary Fund, World Economic Outlook
0.0%
0.5%
1.0%
1.5%
2.0%
2.5%
3.0%
3.5%
Forecasted
GDP Growth
2013 - 2016
Class A
920 MSF
Europe
Total Industrial Stock
6,500 MSF
Class A
82 MSF
Japan
Total Industrial Stock
5,000 MSF
United States
Total Industrial Stock
13,000 MSF
Class A
4,000 MSF
UNITED STATES EUROPE JAPAN
31%
14%
2%
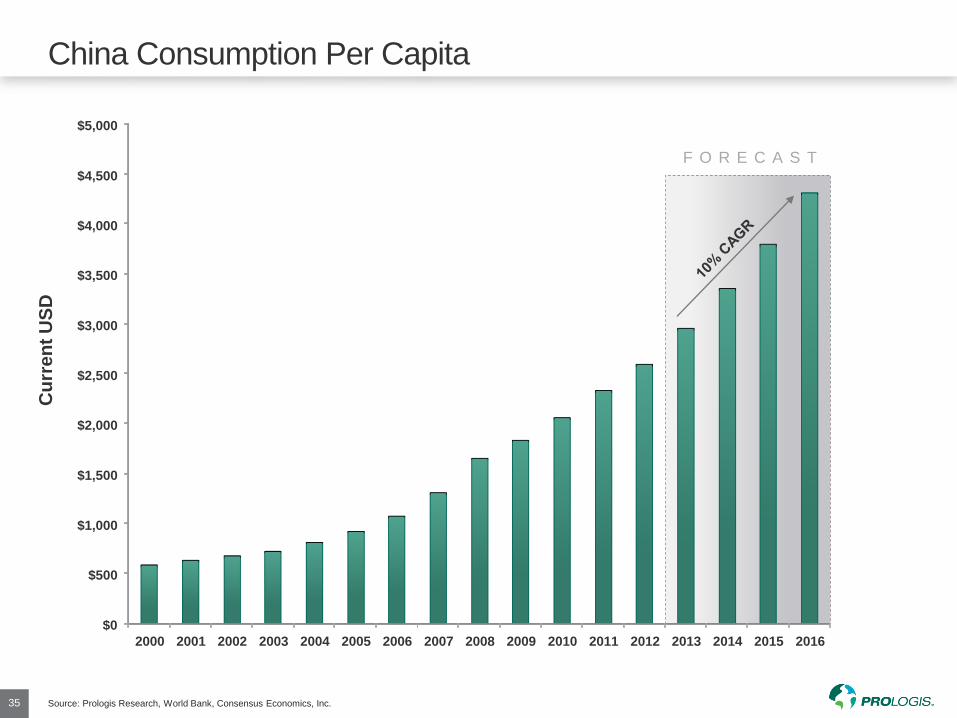
China Consumption Per Capita
35 Source: Prologis Research, World Bank, Consensus Economics, Inc.
FO
RE
CA
ST
F O R E C A S T
$0
$500
$1,000
$1,500
$2,000
$2,500
$3,000
$3,500
$4,000
$4,500
$5,000
2000 2001 2002 2003 2004 2005 2006 2007 2008 2009 2010 2011 2012 2013 2014 2015 2016
China Consumption Per Capita, Current USD
Cu
rre
nt
US
D

Prologis Northampton Pineham Distribution Center 1 — Midlands, UK

Prologis Fokker Logistics Park — Amsterdam, The Netherlands

Prologis CDG Cargo Center — Paris, France
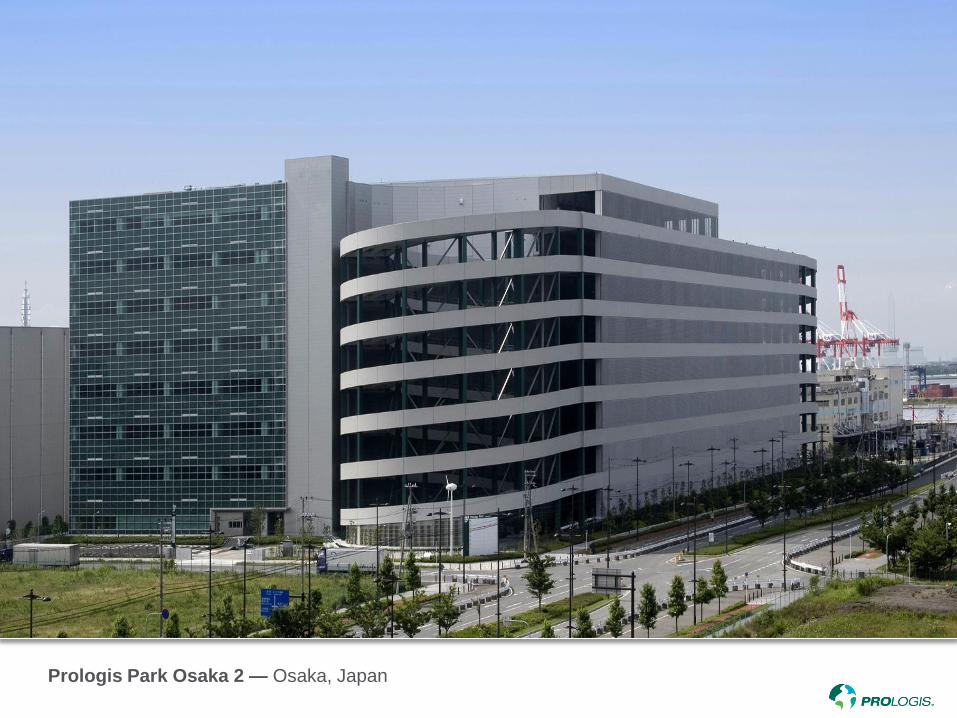
Prologis Park Osaka 2 — Osaka, Japan

Prologis Park Bolton DC1 — Toronto, Canada

Prologis Park Kaiser DC3 — Inland Empire, California

Prologis Slauson Distribution Center 6 — City of Commerce, CA
Prologis Park Rialto— Rialto, CA

Reporting Definitions
44
Please refer to our annual and quarterly financial statements filed with the Securities and Exchange Commission on Forms 10-K
and 10-Q and other public reports for further information about us and our business.
FFO; FFO, as defined by Prologis; Core FFO, (collectively referred to as ―FFO‖). FFO is a non-GAAP measure that is
commonly used in the real estate industry. The most directly comparable GAAP measure to FFO is net earnings. Although the
National Association of Real Estate Investment Trusts (―NAREIT‖) has published a definition of FFO, modifications to the NARE IT
calculation of FFO are common among REITs, as companies seek to provide financial measures that meaningfully reflect their
business.
FFO is not meant to represent a comprehensive system of financial reporting and does not present, nor do we intend it to present, a
complete picture of our financial condition and operating performance. We believe net earnings computed under GAAP remains the
primary measure of performance and that FFO is only meaningful when it is used in conjunction with net earnings computed under
GAAP. Further, we believe our consolidated financial statements, prepared in accordance with GAAP, provide the most meaningful
picture of our financial condition and our operating performance.
NAREIT’s FFO measure adjusts net earnings computed under GAAP to exclude historical cost depreciation and gains and losses
from the sales along with impairment charges of previously depreciated properties. We agree that these two NAREIT adjustments
are useful to investors for the following reasons:
historical cost accounting for real estate assets in accordance with GAAP assumes, through depreciation charges, that the value of
real estate assets diminishes predictably over time. NAREIT stated in its White Paper on FFO ―since real estate asset values have
historically risen or fallen with market conditions, many industry investors have considered presentations of operating results for
real estate companies that use historical cost accounting to be insufficient by themselves.‖ Consequently, NAREIT’s definition of
FFO reflects the fact that real estate, as an asset class, generally appreciates over time and depreciation charges required by
GAAP do not reflect the underlying economic realities.
REITs were created as a legal form of organization in order to encourage public ownership of real estate as an asset class through
investment in firms that were in the business of long-term ownership and management of real estate. The exclusion, in NAREIT’s
definition of FFO, of gains and losses from the sales of previously depreciated operating real estate assets allows investors and
analysts to readily identify the operating results of the long-term assets that form the core of a REIT’s activity and assists in
comparing those operating results between periods. We include the gains and losses from dispositions and impairment charges of
land and development properties, as well as our proportionate share of the gains and losses from dispositions recognized by our
unconsolidated investees, in NAREIT’s definition of FFO.
Our FFO Measures
At the same time that NAREIT created and defined its FFO measure for the REIT industry, it also recognized that ―management o f
each of its member companies has the responsibility and authority to publish financial information that it regards as useful to the
financial community.‖ We believe stockholders, potential investors and financial analysts who review our operating results are best
served by a defined FFO measure that includes other adjustments to net earnings computed under GAAP in addition to those
included in the NAREIT defined measure of FFO. Our FFO measures are used by management in analyzing our business and the
performance of our properties and we believe that it is important that stockholders, potential investors and financial analysts
understand the measures management uses.
We use these FFO measures, including by segment and region, to: (i) evaluate our performance and the performance of our
properties in comparison to expected results and results of previous periods, relative to resource allocation decisions; (ii) evaluate
the performance of our management; (iii) budget and forecast future results to assist in the allocation of resources; (iv) assess our
performance as compared to similar real estate companies and the industry in general; and (v) evaluate how a specific potential
investment will impact our future results. Because we make decisions with regard to our performance with a long-term outlook, we
believe it is appropriate to remove the effects of short-term items that we do not expect to affect the underlying long-term
performance of the properties. The long-term performance of our properties is principally driven by rental income. While not
infrequent or unusual, these additional items we exclude in calculating FFO, as defined by Prologis, are subject to significant
fluctuations from period to period that cause both positive and negative short-term effects on our results of operations, in
inconsistent and unpredictable directions that are not relevant to our long-term outlook.
We use our FFO measures as supplemental financial measures of operating performance. We do not use our FFO measures as,
nor should they be considered to be, alternatives to net earnings computed under GAAP, as indicators of our operating
performance, as alternatives to cash from operating activities computed under GAAP or as indicators of our ability to fund our cash
needs.
FFO, as defined by Prologis
To arrive at FFO, as defined by Prologis, we adjust the NAREIT defined FFO measure to exclude:
(i) deferred income tax benefits and deferred income tax expenses recognized by our subsidiaries;
(ii) current income tax expense related to acquired tax liabilities that were recorded as deferred tax liabilities in an acquisition, to the
extent the expense is offset with a deferred income tax benefit in GAAP earnings that is excluded from our defined FFO measure;
(iii) foreign currency exchange gains and losses resulting from debt transactions between us and our foreign consolidated
subsidiaries and our foreign unconsolidated investees;
(iv) foreign currency exchange gains and losses from the remeasurement (based on current foreign currency exchange rates) of
certain third party debt of our foreign consolidated subsidiaries and our foreign unconsolidated entities; and
(v) mark-to-market adjustments associated with derivative financial instruments.
We calculate FFO, as defined by Prologis for our unconsolidated investees on the same basis as we calculate our FFO, as defined
by Prologis.
We believe investors are best served if the information that is made available to them allows them to align their analysis and
evaluation of our operating results along the same lines that our management uses in planning and executing our business strategy.
Core FFO
In addition to FFO, as defined by Prologis, we also use Core FFO. To arrive at Core FFO, we adjust FFO, as defined by Prologis ,
to exclude the following recurring and non -recurring items that we recognized directly or our share recognized by our
unconsolidated entities to the extent they are included in FFO, as defined by Prologis:
(i) gains or losses from acquisition, contribution or sale of land or development properties;
(ii) income tax expense related to the sale of investments in real estate;
(iii) impairment charges recognized related to our investments in real estate (either directly
or through our investments in unconsolidated entities) generally as a result of our change
in intent to contribute or sell these properties;
(iv) impairment charges of goodwill and other assets;
(v) gains or losses from the early extinguishment of debt;
(vi) merger, acquisition and other integration expenses; and
(vii) expenses related to natural disasters
We believe it is appropriate to further adjust our FFO, as defined by Prologis for certain recurring items as they were driven by
transactional activity and factors relating to the financial and real estate markets, rather than factors specific to the on -going
operating performance of our properties or investments. The impairment charges we recognized were primarily based on valuations
of real estate, which had declined due to market conditions, that we no longer expected to hold for long-term investment. We
currently have and have had over the past several years a stated priority to strengthen our financial position. We expect to
accomplish this by reducing our debt, our investment in certain low yielding assets, such as land that we decide not to develop and
our exposure to foreign currency exchange fluctuations. As a result, we have sold to third parties or contributed to unconsolidated
entities real estate properties that, depending on market conditions, might result in a gain or loss. The impairment charges related to
goodwill and other assets that we have recognized were similarly caused by the decline in the real estate markets. Also in
connection with our stated priority to reduce debt and extend debt maturities, we have purchased portions of our debt securit ies. As
a result, we recognized net gains or losses on the early extinguishment of certain debt due to the financial market conditions at that
time. We have also adjusted for some non-recurring items. The merger, acquisition and other integration expenses include costs we
incurred in 2011 and that we expect to incur in 2 012 associated with the Merger and PEPR Acquisition and the integration of our
systems and processes. We have not adjusted for the acquisition costs that we have incurred as a result of routine acquisitions but
only the costs associated with significant business combinations that we would expect to be infrequent in nature. Similarly, the
expenses related to the natural disaster in Japan that we recognized in 2011 are a rare occurrence but we may incur similar
expenses again in the future. We analyze our operating performance primarily by the rental income of our real estate and the
revenue driven by our private capital business, net of operating, administrative and financing expenses. This income stream is not
directly impacted by fluctuations in the market value of our investments in real estate or debt securities. As a result, although these
items have had a material impact on our operations and are reflected in our financial statements, the removal of the effects of these
items allows us to better under stand the core operating performance of our properties over the long-term. We use Core FFO,
including by segment and region, to: (i) evaluate our performance and the performance of our properties in comparison to expected
results and results of previous periods, relative to resource allocation decisions; (ii) evaluate the performance of our management;
(iii) budget and forecast future results to assist in the allocation of resources; (iv) provide guidance to the financial markets to
understand our expected operating performance; (v) assess our operating performance as compared to similar real estate
companies and the industry in general; and (vi) evaluate how a specific potential investment will impact our future results. Because

Reporting Definitions
45
we make decisions with regard to our performance with a long -term outlook, we believe it is appropriate to remove the effects of
items that we do not expect to affect the underlying long -term performance of the properties we own. As noted above, we believe
the long -term performance of our properties is principally driven by rental income. We believe investors are best served if the
information that is made available to them allows them to align their analysis and evaluation of our operating results along the same
lines that our management uses in planning and executing our business strategy.
Limitations on Use of our FFO Measures
While we believe our defined FFO measures are important supplemental measures, neither NAREIT’s nor our measures of FFO
should be used alone because they exclude significant economic components of net earnings computed under GAAP and are,
therefore, limited as an analytical tool. Accordingly, they are two of many measures we use when analyzing our business. Some of
these limitations are:
The current income tax expenses that are excluded from our defined FFO measures represent the taxes that are payable.
Depreciation and amortization of real estate assets are economic costs that are excluded from FFO. FFO is limited, as it does not
reflect the cash requirements that may be necessary for future replacements of the real estate assets. Further, the amortizat ion of
capital expenditures and leasing costs necessary to maintain the operating performance of industrial properties are not reflected in
FFO.
Gains or losses from property acquisitions and dispositions or impairment charges related to expected dispositions represent
changes in the value of the properties. By excluding these gains and losses, FFO does not capture realized changes in the value of
acquired or disposed properties arising from changes in market conditions.
The deferred income tax benefits and expenses that are excluded from our defined FFO measures result from the creation of a
deferred income tax asset or liability that may have to be settled at some future point. Our defined FFO measures do not currently
reflect any income or expense that may result from such settlement.
The foreign currency exchange gains and losses that are excluded from our defined FFO measures are generally recognized based
on movements in foreign currency exchange rates through a specific point in time. The ultimate settlement of our foreign currency-
denominated net assets is indefinite as to timing and amount. Our FFO measures are limited in that they do not reflect the current
period changes in these net assets that result from periodic foreign currency exchange rate movements. The impairment charges of
goodwill and other assets that we exclude from Core FFO, have been or may be realized as a loss in the future upon the ultimate
disposition of the related investments or other assets through the form of lower cash proceeds. The gains and losses on
extinguishment of debt that we exclude from our Core FFO, may provide a benefit or cost to us as we may be settling our debt at
less or more than our future obligation. The Merger, acquisition and other integration expenses and the natural disaster expenses
that we exclude from Core FFO are costs that we have incurred.
We compensate for these limitations by using our FFO measures only in conjunction with net earnings computed under GAAP
when making our decisions. To assist investors in compensating for these limitations, we reconcile our defined FFO measures to
our net earnings computed under GAAP. This information should be read with our complete financial statements prepared under
GAAP.
Assets Under Managements (―AUM‖) represents the estimated value of the real estate we own or manage through our
consolidated entities and unconsolidated investees. We calculate AUM by adding the noncontrolling interests’ share of the
estimated fair value of the real estate investment to our share of total market capitalization.
Core EBITDA. We use Core EBITDA to measure both our operating performance and liquidity. We calculate Core EBITDA
beginning with consolidated net earnings/loss and removing the affect of interest, income taxes, depreciation and amortization,
impairment charges, gains or losses from the acquisition or disposition of investments in real estate, gains or losses on early
extinguishment of debt and derivative contracts (including cash charges), similar adjustments we make to our Core FFO (see
definition below), and other non-cash charges or gains (such as stock based compensation amortization and unrealized gains or
losses on foreign currency and derivative activity), including our share of these items from unconsolidated investees.
We consider Core EBITDA to provide investors relevant and useful information because it permits investors to view income from
operations on an unleveraged basis before the effects of income tax, non-cash depreciation and amortization expense and other
items (including stock-based compensation amortization and certain unrealized gains and losses), gains or losses from the
acquisition or disposition of investments in real estate, items that affect comparability, and other significant non-cash items. We also
included a pro forma adjustment in Core EBITDA to reflect a full period of NOI on the operating properties we acquired in a
significant transaction, such as the Merger, Acquisition and Other Integration Expenses and costs associated with the natural
disaster that occurred in first quarter 2011 in Japan. By excluding interest expense EBITDA allows investors to measure our
operating performance independent of our capital structure and indebtedness and, therefore, allows for a more meaningful
comparison of our operating performance to that of other companies, both in the real estate industry and in other industries. Gains
and losses on the early extinguishment of debt generally included the costs of repurchasing debt securities. Although difficult to
predict, these items may be recurring given the uncertainty of the current economic climate and its adverse effects on the real
estate and financial markets. While not infrequent or unusual in nature, these items result from market fluctuations that can have
inconsistent effects on our results of operations. The economics underlying these items reflect market and financing conditions in
the short-term but can obscure our performance and the value of our long-term investment decisions and strategies.
We believe that Core EBITDA helps investors to analyze our ability to meet interest payment obligations and to make quarterly
preferred share dividends. We believe that investors should consider Core EBITDA in conjunction with net income (the primary
measure of our performance) and the other required Generally Accepted Accounting Principles (―GAAP‖) measures of our
performance and liquidity, to improve their understanding of our operating results and liquidity, and to make more meaningful
comparisons of our performance against other companies. By using Core EBITDA an investor is assessing the earnings generated
by our operations, but not taking into account the eliminated expenses or gains incurred in connection with such operations. As a
result, Core EBITDA has limitations as an analytical tool and should be used in conjunction with our required GAAP presentations.
Core EBITDA does not reflect our historical cash expenditures or future cash requirements for working capital, capital expenditures
distribution requirements or contractual commitments. Core EBITDA, also does not reflect the cash required to make interest and
principal payments on our outstanding debt.
While EBITDA is a relevant and widely used measure of operating performance, it does not represent net income or cash flow from
operations as defined by GAAP and it should not be considered as an alternative to those indicators in evaluating operating
performance or liquidity. Further, our computation of Core EBITDA may not be comparable to EBITDA reported by other
companies. We compensate for the limitations of Core EBITDA by providing investors with financial statements prepared according
to GAAP, along with this detailed discussion of Core EBITDA and a reconciliation of Core EBITDA to consolidated net earnings
(loss), a GAAP measurement.
(in thousands) Three Months Ended
September 30,
2012 2011
Reconciliation of consolidated earnings (loss) to Core EBITDA
Net earnings (loss) available for common stockholders (46,526)$ 55,436$
Net gain on acquisitions and dispositions of investments in real estate (8,628) (19,806)
Depreciation and amortization from continuing operations 194,622 182,774
Interest expense from continuing operations 123,161 135,863
Impairment charges 37,187 -
Merger, acquisition and other integration expesnes 20,659 12,683
Loss (gain) on early extinguishment of debt - 298
Current and deferred income tax expense (benefit) (19,983) (2,838)
Pro forma adjustment (A) - -
Income attributable to disposal properties and assets held for sale (4,618) (11,903)
NOI attributable to assets held for sale 6,917 2,200
Net earnings attributabel to noncontrolling interest 3,323 23
Preferred stock dividends 10,305 10,409
Unrealized losses (gains) and stock compensation expense, net 14,279 (44,680)
Other adjustments made to arrive at Core FFO - (400)
Core EBITDA, prior to our share of unconsolidated entities 330,698 320,059
Our share of reconciling items from unconsolidated entities:
Net losses (gains) on disposition of real estate, net 357 (2,860)
Depreciation and amortization 35,309 31,393
Interest expense 22,328 38,043
Loss on early extinguishment of debt - -
Impairment of real estate properties and other assets 1,563 -
Current income tax expense 2,226 1,301
Unrealized losses (gains) and deferred income tax expense (benefit) 890 (1,615)
Realized losses on derivative activity - -
Core EBITDA 393,371$ 386,321$
(A) Adjustments for the effects of Prologis North American Industrial Fund II and Prologis California acquisitions to reflect NOI for the full period.

Reporting Definitions
46
Net Asset Value (―NAV‖). We consider NAV to be a useful supplemental measure of our operating performance because it
enables both management and investors to estimate the fair value of our business. The assessment of the fair value of a particular
segment of our business is subjective in that it involves estimates and can be calculated using various methods. Therefore, in this
presentation, we have presented the financial results and investments related to our business segments that we believe are
important in calculating our NAV but have not presented any specific methodology nor provided any guidance on the assumptions
or estimates that should be used in the calculation.
The components of NAV do not consider the potential changes in rental and fee income streams or the franchise value associated
with our global operating platform, private capital platform, or development platform.
Related Documents


