arXiv:0807.2295v1 [astro-ph] 15 Jul 2008 Project Lyman Stephan R. McCandliss *a , Jeffrey W. Kruk a , William P. Blair a , Mary Elizabeth Kaiser a , Paul D. Feldman a , Gerhardt R. Meurer a , William V. Dixon a , David J. Sahnow a , David A. Neufeld a , Roxana E. Lupu a , Brian Fleming a , Stephen A. Smee a , B. G. Andersson b , Samuel H. Moseley c , Alexander S. Kutyrev c , Mary J. Li c , George Sonneborn c , Oswald H. W.Siegmund d , John V. Vallerga d , Barry Y. Welsh d , Massimo Stiavelli e , Rogier A. Windhorst f and Alice E. Shapley g a Johns Hopkins University, 3400 North Charles Street, Baltimore, MD 21218, USA; b USRA/SOFIA, NASA/AMES, Bldg 211, Moffett Field, CA 94035-1000, USA; c NASA/GSFC, 8800 Greenbelt Rd, Greenbelt, MD 20771-2400, USA; d University of California, 7 Gauss Way, Berkeley, CA 94720, USA; e Space Telescope Science Institute, 3700 San Martin Dr, Baltimore, MD 21218, USA; f Arizona State University, Tyler Mall, Room PSF-470, Tempe, AZ 85287-1504, USA; g University of California, Los Angeles, CA 90095-1547, USA ABSTRACT We explore the design of a space mission called Project Lyman that has the goal of quantifying the ionization history of the universe from the present epoch to a redshift of z ∼ 3. Observations from WMAP and SDSS show that before a redshift of z ∼ > 6 the first collapsed objects, possibly dwarf galaxies, emitted Lyman continuum (LyC) radiation shortward of 912 ˚ A that reionized most of the universe. Theoretical estimates of the LyC escape fraction ( f esc ) required from these objects to complete reionization is f esc ∼ 10%. How LyC escapes from galactic environments, whether it induces positive or negative feedback on the local and global collapse of structures, and the role played by clumping, molecules, metallicity and dust are major unanswered theoretical questions, requiring observational constraint. Numerous intervening Lyman limit systems frustrate the detection of LyC from high z objects. They thin below z ∼ 3 where there are reportedly a few cases of apparently very high f esc . At low z there are only controversial detections and a handful of upper limits. A wide-field multi-object spectroscopic survey with moderate spectral and spatial resolution can quantify f esc within diverse spatially resolved galactic environments over redshifts with significant evolution in galaxy assemblage and quasar activity. It can also calibrate LyC escape against Lyα escape, providing an essential tool to JWST for probing the beginnings of reionization. We present calculations showing the evolution of the characteristic apparent magnitude of star-forming galaxy luminosity functions at 900 ˚ A, as a function of redshift and assumed escape fraction. These calculations allow us to determine the required aperture for detecting LyC and conduct trade studies to guide technology choices and balance science return against mission cost. Finally we review our efforts to build a pathfinding dual order multi-object spectro/telescope with a (0.5 ◦ ) 2 field-of-view, using a GSFC microshutter array, and crossed delay-line micro-channel plate detector. Keywords: Ultraviolet instruments, wide-field spectroscopy, ultraviolet:galaxies, ionizing radiation, reionization 1. INTRODUCTION Observations show that by a redshift of z ≈ 6 most of the universe passed through an era of reionization precipitated by an increase in the metagalactic ionizing background (MIB). 1 Star-forming galaxies and quasars are generally acknowledged as the most likely sources responsible for reionization, but how their relative contributions change over cosmic time is the subject of considerable debate. 2 Number counts of galaxies and quasars at z ∼ 6 show that low mass star-forming galaxies vastly outnumber the quasar population, 1,3,4 strongly suggesting but not proving, that star-forming galaxies dominate reionization. 5 The faint end slope of the quasar luminosity function near z ∼ 6 is poorly constrained, so it is not clear if quasars can produce ionizing radiation on par with that required from galaxies to sustain reionization epoch. 6 There are also indications that the initiation of reionization may require a ”hard” spectral energy distribution (SED) or an f e > 0.2 that increases with redshift. 7,8 * Send correspondence to [email protected], Telephone: 1 410 516 5272

Welcome message from author
This document is posted to help you gain knowledge. Please leave a comment to let me know what you think about it! Share it to your friends and learn new things together.
Transcript

arX
iv:0
807.
2295
v1 [
astr
o-ph
] 15
Jul
200
8
Project Lyman
Stephan R. McCandliss*a, Jeffrey W. Kruka, William P. Blaira, Mary Elizabeth Kaisera, Paul D.Feldmana, Gerhardt R. Meurera, William V. Dixona, David J. Sahnowa, David A. Neufelda, RoxanaE. Lupua, Brian Fleminga, Stephen A. Smeea, B. G. Anderssonb, Samuel H. Moseleyc, Alexander S.
Kutyrevc, Mary J. Lic, George Sonnebornc, Oswald H. W.Siegmundd, John V. Vallergad, Barry Y.Welshd, Massimo Stiavellie, Rogier A. Windhorstf and Alice E. Shapleyg
aJohns Hopkins University, 3400 North Charles Street, Baltimore, MD 21218, USA;bUSRA/SOFIA, NASA/AMES, Bldg 211, Moffett Field, CA 94035-1000, USA;
cNASA/GSFC, 8800 Greenbelt Rd, Greenbelt, MD 20771-2400, USA;dUniversity of California, 7 Gauss Way, Berkeley, CA 94720, USA;
eSpace Telescope Science Institute, 3700 San Martin Dr, Baltimore, MD 21218, USA;f Arizona State University, Tyler Mall, Room PSF-470, Tempe,AZ 85287-1504, USA;
g University of California, Los Angeles, CA 90095-1547, USA
ABSTRACT
We explore the design of a space mission called Project Lymanthat has the goal of quantifying the ionization history of theuniverse from the present epoch to a redshift ofz∼ 3. Observations from WMAP and SDSS show that before a redshift ofz∼> 6 the first collapsed objects, possibly dwarf galaxies, emitted Lyman continuum (LyC) radiation shortward of 912Athat reionized most of the universe. Theoretical estimatesof the LyC escape fraction (fesc) required from these objects tocomplete reionization isfesc∼ 10%. How LyC escapes from galactic environments, whether itinduces positive or negativefeedback on the local and global collapse of structures, andthe role played by clumping, molecules, metallicity and dust aremajor unanswered theoretical questions, requiring observational constraint. Numerous intervening Lyman limit systemsfrustrate the detection of LyC from high z objects. They thinbelow z∼ 3 where there are reportedly a few cases ofapparently very highfesc. At low z there are only controversial detections and a handful of upper limits. A wide-fieldmulti-object spectroscopic survey with moderate spectraland spatial resolution can quantifyfesc within diverse spatiallyresolved galactic environments over redshifts with significant evolution in galaxy assemblage and quasar activity. Itcan alsocalibrate LyC escape against Lyα escape, providing an essential tool to JWST for probing the beginnings of reionization.We present calculations showing the evolution of the characteristic apparent magnitude of star-forming galaxy luminosityfunctions at 900A, as a function of redshift and assumed escape fraction. These calculations allow us to determine therequired aperture for detecting LyC and conduct trade studies to guide technology choices and balance science returnagainst mission cost. Finally we review our efforts to builda pathfinding dual order multi-object spectro/telescope with a(0.5◦)2 field-of-view, using a GSFC microshutter array, and crosseddelay-line micro-channel plate detector.
Keywords: Ultraviolet instruments, wide-field spectroscopy, ultraviolet:galaxies, ionizing radiation, reionization
1. INTRODUCTION
Observations show that by a redshift ofz≈ 6 most of the universe passed through an era of reionization precipitated by anincrease in the metagalactic ionizing background (MIB).1 Star-forming galaxies and quasars are generally acknowledgedas the most likely sources responsible for reionization, but how their relative contributions change over cosmic time is thesubject of considerable debate.2
Number counts of galaxies and quasars atz∼ 6 show that low mass star-forming galaxies vastly outnumberthe quasarpopulation,1,3,4 strongly suggesting but not proving, that star-forming galaxies dominate reionization.5 The faint endslope of the quasar luminosity function nearz∼ 6 is poorly constrained, so it is not clear if quasars can produce ionizingradiation on par with that required from galaxies to sustainreionization epoch.6 There are also indications that the initiationof reionization may require a ”hard” spectral energy distribution (SED) or anfe > 0.2 that increases with redshift.7,8
* Send correspondence to [email protected], Telephone: 1410 516 5272

The relative contributions to the MIB for each population depends upon the faint end slope of the luminosity function,the escape efficiencyfesc of ionizing radiation emitted shortward of the Lyman edge at911.7A, the H II clumping factorC ≡< ρ2 > / < ρ >2 and the spectral hardness.2,9 The evolution of these quantities has a fundamental influence on thestate of the MIB, the intergalactic medium (IGM) and the formation of structure throughout cosmic time.10
Ionizing radiation can produce either positive or negativefeedback on the star formation process on global and localscales. The nature of the feedback depends in part on the clumping environment.11,12 Positive feedback occurs whenphoto-electrons catalyze the formation of H2, which allows the gas to efficiently cool and collapse. Negative feedbackoccurs when photoionization heating temporarily halts gascollapse by increasing the Jeans mass. How feedback relatesto the conditions that favor the escape of Lyman continuum (LyC) photons from star-forming environments and the roleplayed by clumping is not well understood. We know escape of LyC photons from wavelengths shorter than the HIionization edge at 911.7A is very difficult,10,13some have even said impossible.14 Mean HI column densities for normalgalaxies areNHI = 1021 cm−2, yet it takes only a column of 1.6× 1017 cm−2 to produce an optical depth of unity at theLyman edge.
For quasars this does not seem to be much of a problem. Below the Lyman edge quasars emit a “hard” SED, whichcan ionize both HI and HeII , while star-forming galaxies, which emit a “soft” SED, are capable of only ionizing HI. Thecharacteristic ultraviolet luminosity of quasars is 10 times that of the galaxies, so the IGM surrounding quasars tendsto bedevoid of neutral material. There are numerous examples of quasar SEDs that show no sign of a break in the continuumemission through the Lyman edge.15,16 Similar observations for galaxies are rare17–19 and often controversial.20–23 It isfair to say that there is considerable uncertainty regarding the physical conditions that favor LyC from star-forming regionsat any epoch.
It is somewhat simplistic to characterize reionization as aprocess caused by quasars withfe = 1 or star-forming galaxieswith fe < 1. The central engines of active galactic nuclei (AGN) come in a variety of masses, have intermittent duty cyclesand can be obscured by host galaxy environments, resulting in a softer SED.24 Some fraction of quasars do exhibit a breakat the Lyman edge,25 contrary to the conventional assumption of unity escape fraction.7 Furthermore, it is now acceptedthat black holes reside in the nuclei of most if not all quiescent galaxies,26,27so the effects of previous AGN activity withinan apparently dormant environment must also be considered.
Observations showing the transition of black HI absorption troughs to a forest of narrow absorption features at redshiftz∼< 6,1 compel us to infer that LyC photons somehow escape star-forming environments and hence must be detectableat some level. A failure to observationally confirm LyC escape at any level would necessitate a serious reevaluation ofconventional theories for the reionization era. Unfortunately, direct measurements of the LyC becomes difficult forz∼> 3due to the increasing optical depth of the IGM.18 The collection of Lyα forest systems (N(HI) ∼< 1017 cm−2), Lyman limitsystems (1017
∼< N(H I) ∼< 1019 cm−2) and damped Lyα systems (1019 cm−2∼< N(H I)) all increase toward highz. The
probably that a galaxy will be obscured by an intervening system as a function of redshift has recently been quantified byInoue & Iwata.28 They characterize the detection probability in terms of themagnitude difference between the continuumredward of the Lyman edge and the detection limit blueward ofthe edge. For a 2.5 magnitude difference (a factor of 10 influx) they find detection probabilities of 98, 92, 73, 19, 0% atz= 1, 2, 3, 4, 5. From this we conclude that stastical studiesto directly examine the physics of LyC leak are best conducted atz∼< 3. Detectable LyC leakers beyondz∼> 4 will be rare.
Here we discuss the requirements for detecting LyC leakage and explore the parameter space for a spacebased surveymission called Project Lyman, utilizing a wide-field spectral/imaging technique. The goal of this project is to quantifythe ionization history of the universe at redshiftsz∼< 3 by determining thefesc as a function of galactic morphology andclustering along with the local environmental factors of clumping, metallicity and gas-to-dust ratio. We will search for lowredshift analogs to the low mass star-forming galaxies thought to be responsible for initiating reionization, and determinewhether Lyα emission can serve as a proxy for the LyC escape from high redshift galaxies.
We first briefly review the star formation history of the universe, discuss the expectations for how the escape fractionevolves, and give a plausibility argument for the existenceof low redshift analogs to high redshift reionization sources. Areview of thefescdetections and lower limits will be presented. We also discuss how James Webb Space Telescope (JWST)reionization studies could benefit from the calibration of Lyα escape with LyC escape that this project proposes to make.We then use the redshift luminosity functions presented by Arnouts29 to estimate the areal densities of objects and therequired detection sensitivities as a function of redshift. The aperture requirement for a long duration spacebased missionis determined and compared to the capabilities of a prototype spectro/telescope we are fabricating for a series of soundingrocket missions to provide proof-of-concept for the optical design.
2. STAR FORMATION HISTORY OF THE UNIVERSE
As the universe evolves the dark matter halos, which make up the bulk of the matter in the universe, start to coalesce andattract baryons that turn into star filled luminous galaxies. Early on, the mass of these halos and the baryon number withinthem is small and the star production is low. As the merger process accelerates, the characteristic absolute luminosityinthe ultraviolet rest frame, a proxy for the star formation rate, rises fromM∗
uv ≈ -20 atz≈ 6-7 and reaches a peak ofM∗uv ≈
-21 after about 2 Gyrs near a redshift of≈ 3.5. In the ensuing 11.7 GyrsM∗uv has fallen to≈ -18.3 The intensity of the MIB
closely follows the stellar luminosity density.
Merger studies suggest that the peak luminosity nearz∼ 3 is associated with the assemblage of the most massivegalaxies, undergoing an enormous burst of star formation. This peak also roughly coincides with the peak in the quasarnumber density, and maybe associated with the HeII reionization era nearz∼ 3.24 These most massive galaxies quicklyform stars and perhaps exhaust their fuel reservoirs in the process. Today they are dominated by an older low masspopulation of stars and are members of the “red sequence” in the color bimodality distribution of galaxies.30 The rapidstar formation period of these most massive galaxies is somewhat analogous to the short nuclear burning timescales of themost massive stars.
It has been observed that in the low redshift universe following the star formation peak atz∼ 3, activity has sinceshifted from high mass systems to low mass systems in a process known as “downsizing.”31,32 In other words most ofthe present day star formation is occurring in the lower mass“blue sequence” galaxies. It is possible that we are now inan epoch where the lowest mass halos, which at az∼ 7 were not clumpy enough to support star formation, have gainedenough mass to initiate stellar collapse. The chemical enrichment in the low mass halos at lowz is an open question. Itdepends on the efficiency of chemical feedback from galaxiesinto the the IGM. It maybe that the low metallicity, lowmass star burst systems of today are analogs to the numerous low mass, low metallicity dwarf galaxies thought to havebeen responsible for sustaining and possibly initiating the reionization epoch. Detecting LyC escaping from the most metalpoor, low luminosity systems in the low redshift universe will tell us much about escape process in the early universe.These objects are expected to be rare, on the faint end slope of the luminosity function, and will require wide field surveytechniques to detect. On the other hand, they are expected tohave higher escape fractions on average, which will aid intheir detection.
3. ESCAPE FRACTION EVOLUTION – EXPECTATIONS AND OBSERVATIO NS
In the high redshift universe (z∼ 6) low mass star-forming galaxies are expected to vastly outnumber the quasar popula-tion,1,4 yielding a soft MIB and an early HI reionization era, as long as the average the LyC escape fraction is fesc∼> 10 –20%.4,7,33 There are no direct observations of LyC escape in this epoch.
Towards intermediate redshifts (z∼ 3) an increasing quasar population is expected to harden theMIB and usher in anera of HeII reionization. However, comparative observations of the HI and HeII Lyα forests over the redshift range 2.3< z< 2.9 show that in this era star-forming galaxies still supplya significant fraction of the MIB photons.24,34,35 Thisconclusion is supported by the Steidel et al.17 detection of LyC escape in a composite spectrum of 29 Lyman break galaxieswith a mean redshift ofz = 3.4, suggesting an escape fraction significantly higher than 5%. More significantly, Shapley etal.18 have found 2 Lyman break galaxies (LBG) at intermediate redshift (z∼ 3) with remarkably high escape fractions 40< fesc< 100%. There is also a new report of LyC detected from 10 Lyα emitters (LAEs) and 6 LBGs nearz= 3.1, using anarrow band filter technique.19 The averagefe > 15% estimated for this sample is somewhat tentative, pending follow-upspectroscopy on a few of the LAEs.
In the low redshift era, calculations indicate that the contribution of star-forming galaxies to the MIB will continue to becompetitive with that from quasars if on averagefesc∼> 5%.9 Thus if star-forming galaxies are indeed major contributors tothe MIB, then a non-trivial fraction of LyC photons should beescaping and directly detectable with spectroscopy, providedthe source is at a redshift high enough to escape the HI absorption “shadow” of the Milky Way;z∼> 0.02. The LyCabsorption shape should have an envelope∝ λ−3 shortward of the Lyman edge.36 Low redshift observations have beenless successful than those atz∼ 3 in detecting LyC. A recent low redshift search nearz∼ 1.3 using far-UV images of theHubble Deep Field–North and the Hubble Ultra Deep Field reports fe < 0.08, using a stack of 21 candidates.13
Leitherer et al.20 found upper limits onfesc< 1 – 15% from Hopkins Ultraviolet Telescope measurements of 4starburstgalaxies with redshifts 0.018≤ z≤ 0.03. Hurwitz et al.21 reexamined the same data and found upper limitsfesc< 3 – 57%.

Deharveng et al.37 used the Far Ultraviolet Spectroscopic Explorer (FUSE) to observe Mrk 54 atz = 0.0448 and foundfesc< 6%. Bergvall et al.22 also usedFUSE to observe the blue compact galaxy (BCG) Haro-11 atz = 0.021. Theirdetection of 4< fesc< 10% was questioned by Grimes et al.23 who found only an upper limitfesc∼< 2% in a reanalysis ofthe data.
We conclude that a meaningful lowzprogram needs to explore the regimefesc< 5%, with a sensitivity well below theFUSEbackground limit∼ 10−15ergs cm−2s−1 A−1 ≡ 1FEFU (femto-erg flux unit).
4. ENVIRONMENTAL INFLUENCES ON LYC AND Ly α ESCAPE RELATIONSHIPS
The escape fraction atz∼ 3 appears to have been higher than at lowz. Perhaps this is due to a paucity of well formedneutral disks around galaxies in the earlier epochs. We knowthe Hubble sequence began to form atz∼ 1 – 1.538 when theexpansion of the universe caused the rate of major mergers toslow, allowing for the first time massive HI disks to settle andremain stable on global scales. Galaxies atz≃ 2–3 are likely to have high escape fractions, because they have not had timeto form stable HI disks, due to the combined effects of a much higher major merger rate39 and starburst- or AGN-drivenoutflows.17 The combination of tidal disruption and ionization of the residual gas in young star clusters, perhaps aidedby a strong MIB, makes it easier for the LyC emission from starformation to exceed the recombination rate40 and create“density bounded” HII regions with high escape fractions. The low densities within the disrupted environments also aidlarge scale stellar and supernovae generated outflows to create superbubbles and chimneys through which LyC (and Lyα)can escape.41
This will be much less the case at lower redshifts (0≤ z≤ 1.5), where giant HI disks have begun to settle and outflowsare significantly smaller. Lowerfescmay result, due to the relatively high density of HI surrounding “radiation bounded”H II regions. Nevertheless, we expect a trend where metal poor dwarfs and irregulars have higherfesc than bulge and disktype galaxies because they tend to reside on the outskirts ofgalactic clusters and are surrounded by a more tenuous IGMwith a higher ionization fraction on average. These objectsmay be the lowzanalogs to the low mass LyC emitting objectsat highz. Furthermore, examples abound at lowz of mergers and objects with unstable disks, large scale outflows, andyoung star clusters embedded within clumpy multi-phased media. In short, all the same physical conditions conduciveto LyC escape at highz can be studied directly in lowz galaxies, up-close and in-depth, with perhaps a somewhat highermetallicity. Nevertheless, by characterizingfescat low redshift in a diverse sample of galaxies we gain insight to the physicsof LyC escape, with which we can constrain the contribution of high zgalaxies to the ionization history of the universe.
4.1 Is Lyα Escape a Proxy for LyC Escape?
Spectroscopy provides the most direct means to measure LyC and Lyα over a continuous range of redshifts and presents aunique opportunity to determine whether a proxy relationship exists between Lyα and LyC escape. This effort is extremelyimportant to the James Webb Space Telescope (JWST) key goal of identifying the sources responsible for initiating andcompleting the epoch of reionization. Moreover, Lyα emission is thought to be a beacon for the formation of structure inall epochs.42 It is the primary ionization diagnostic available toJWSTand may provide a detailed view of the beginning ofthe reionization era at redshiftsz> 6.43
At first glance, it appears that the probability for Lyα photons to escape is even lower than for LyC photons. The linecore optical depth reaches unity for a column ofN(HI) = 1.4× 1013 cm−2 with a doppler velocity of 10 km s−1. Case Brecombination theory posits that Lyα photons created in a recombination event are reabsorbed “on-the-spot,” and becometrapped in “radiation bounded” HII regions. In the absence of dust they scatter endlessly in successive absorptions andre-emissions until they random walk into the line wings and escape. In the process a characteristic double-peaked profileis created with a self-absorbed line core.44 Adding dust further blackens the core and reduces the peaks.In contrast, asingle absorption of a LyC photon results in its destruction, and the creation of a Lyα photon. Adding velocity fieldsfurther aids Lyα escape by doppler shifting the photons out of the optically thick line core and into the thin line wings,a process which is unavailable to LyC photons. Outflows skew double peaked profiles towards the red, inflows towardsthe blue.48,49 However, velocity gradients can aid LyC escape by creating low density regions with lower probability forcontinuum absorption.
Scattering of Lyα through a multi-phase (clumpy) medium has been found to enhance Lyα equivalent widths (EW).45
Examples of Lyα EW boosting may have been observed in highz star-forming systems, which often exhibit impressively

high EW≥ 150A.46 A more typical value is EW≈ 20A (rest frame) as found in the composite LBG spectrum atz≈ 3.4,17
which is similar to that found at lowz in star-forming galaxies.47
It is not clear whether these processes will lead to a correlation or an anti-correlation of LyC and Lyα escape. We notethe intensity of Lyα is proportional to the number of LyC photons that do NOT escape. A simple formula, following Maoet al.,36,50 for calculating the luminosity of escaping Lyα photons is,
LLyα =23
Q(1− fesc) fLyα (1)
where fLyα is the escape fraction of Lyα photons andQ is the total LyC emission rate. Ionizing radiation (Q) has to bepresent to create Lyα in the first place, but iffLyα is roughly constant and is mostly independent of the physical processesthat cause LyC leakage, then asfesc increasesLLyα decreases. On the other hand, if the Lyα and LyC escape processes areco-dependent (i.e.fesc≈ fLyα = f ) then atf ≈ 0.5 we find a peak luminosity forLLyα = 1
6Q.
Commensurate observations of Lyα and LyC to date are suggestive but not clearcut. In the Shapley et al.18 data on14 star-forming galaxies atz∼ 3 there are 5 objects without LyC and Lyα, 7 objects with Lyα and no LyC, 1 object withLyC ( fesc ∼ 50%) and strong Lyα, and 1 object with LyC (fesc ≥ 65%) and marginal Lyα. Lyα and LyC emission doappear together, but there is some variation. Further efforts to characterize this relationship will require a large statisticalsample. A quantitative assessment of the contribution of galaxies to the ionizing background will require a large numberof observations before LyC and Lyα luminosity functions can be established.51
4.2 Project Balmer
In support of this effort, Project Balmer, a groundbased observing program to acquire spectra of Hα and Hβ, will providea measure of the dust attenuation at visual wavelengths. It will also allow the determination of the absolute luminosityof the intrinsic LyC produced within, but not necessarily escaping the star-forming galaxies. After accounting for theeffects of dust attenuation and temperature, using standard emission line diagnositics,36 the Lyα escape fraction can befound by comparing the observed Lyα/Hα flux ratio to the intrinsic recombination flux ratio. Together Project Lyman andBalmer provide a complete accounting of the LyC and Lyα escape budgets for addressing the LyC escape and Lyα escapecorrelation. If such a correlation can be established with low redshift observations, then the relatively easy to observe Lyαcould be used to quantify the contribution of star-forming galaxies to the MIB at all redshifts.
5. LYC DETECTION REQUIREMENTS 0 ∼< Z ∼< 3
GALEXhas shown that there are hundreds of far-UV emitting galaxies in each square degree of the sky. We have suggestedthat a wide field spectroscopy survey can efficiently search for LyC leak.52 To plan a search we need to determine therequired instrumental sensitivity to detect Lyman continuum escaping star-forming galaxies representing a diversity ofmorphological types over the redshift interval 0∼< z∼< 3. The top level instrument design will flow down from the requireddetection sensitivity. Since these observations must be made in space it is important to have a realistic estimate of thescientific potential as a function of aperture to control mission cost. To carry out this assessment we need to know the arealdensity of Lyman continuum candidates on the sky, as a function of apparent magnitude (i.e. observer frame flux) andredshift.
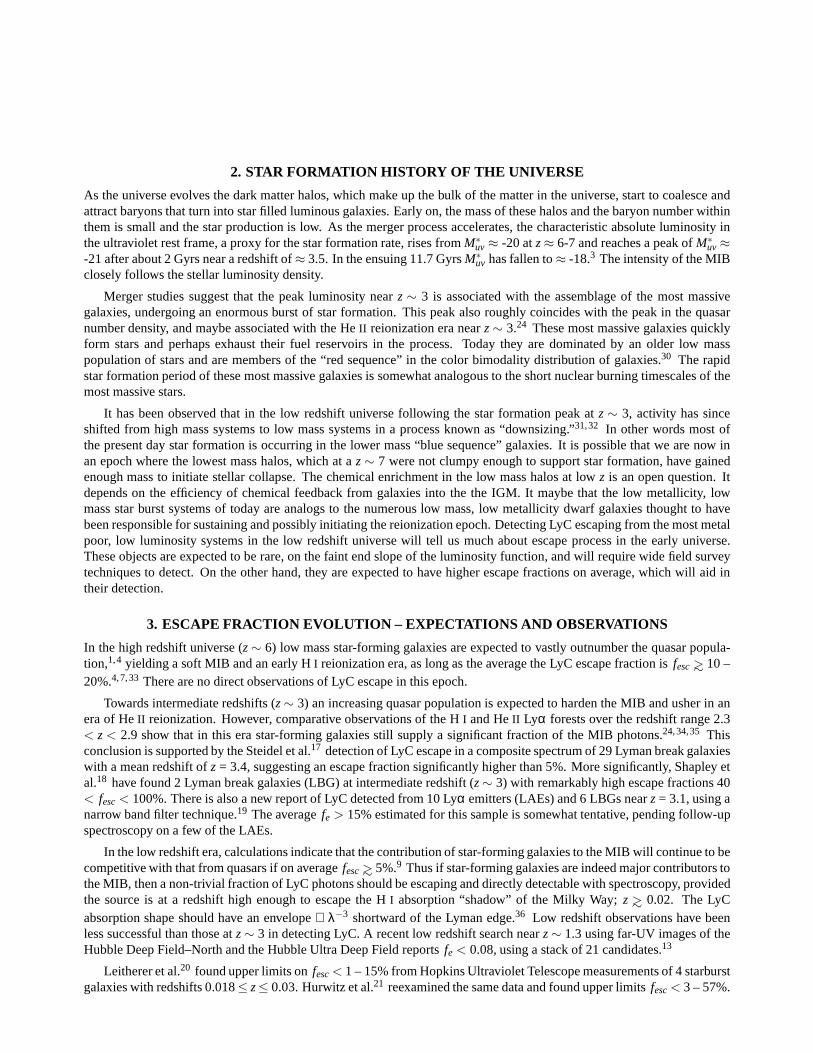
In Figure 1 on the left we plot an estimate based on luminosityfunctions provided by Arnouts et al. using the Schechterparameterization,29 for the redshift intervals indicated in the caption. The figure shows the logarithm of the number ofgalaxies per unit magnitude per square degree as a function of the restframe ultraviolet (∼ 1500A) AB magnitude asmeasured in the observer’s frame. We converted from the number per comoving volume to the number per square degreeby multiplying by the comoving volume per solid angle, calculated for the mid-point in each redshift interval. Each curvehas an∗ to indicate the location of the characteristic magnitudem∗
1500(1+z) where the Schechter function makes the transitionfrom the exponential cutoff in galaxy counts at the bright end of the luminosity function to the power law extension of thefaint end. The interval for the ordinate of each curve spans 5magnitudes (a factor of 100 in flux) centered onm∗
1500(1+z).
We used the formula53
m∗1500(1+z) = M∗
UV +2.5log(dl(z)∗105)2/(1.+z) (2)
16 18 20 22 24 26 28m
1500*(1+z)
10−2
100
102
104
106
dN/d
m (
deg−
2 mag
−1 )
dz= 0.0 − 0.2dz= 0.2 − 0.4dz= 0.4 − 0.6dz= 0.6 − 0.8dz= 0.8 − 1.2dz= 1.8 − 2.3dz= 2.4 − 3.4
1000 1500 2000 2500 3000 3500Wavelength (Å)
30
28
26
24
22
20
m* 90
0(1+
z) (A
B)
0.1 0.3 0.5 0.7 1.0 2.0 2.9
| | | | | | |
z=
fesc
= 0.16
fesc
= 0.08
fesc
= 0.04
fesc
= 0.02
0.1 FEFU
0.01 FEFU
0.001 FEFU
far−UV
near−UV
0.5 m
1 m
2 m
0.5 m
1 m
2 m
Figure 1. LEFT PANEL – Surface densities as a function of observer’s frame apparent magnitude for galaxy populations with redshiftsbetween 0 – 0.2, 0.2 – 0.4, 0.4 – 0.6, 0.6 – 0.8, 0.8 – 1.2, 1.8 – 2.3, 2.4 – 3.4, estimated following Arnouts.29 RIGHT PANEL –Apparent magnitude of the LyC emitted bym∗900(1+z) galaxies as a function of redshift and assumed escape fractions of fesc=0.02, 0.04,0.08, 0.16. Strawman far- and near-UV background limits as afunction of wavelength for spectro/telescopes with 0.5 m, 1m, and 2 mapertures are overplotted. For reference flux densities (fλ) in FEFU≡ 10−15 ( ergscm−2 s−1 A−1) are indicated with long-dashed lines.The redshifts are marked at the top of the figure. The far-UV assumes SiC mirrors and a CsI photocathode. The near-UV assumes MgF2over Al mirrors and GaN photocathode.
to transform from absolute magnitude in the 1500A restframe to the apparent magnitude in the observer’s frame, wheredl(z) is the luminosity distance in Mpc,z is the redshift, andM∗
UV is the absolute restframe UV magnitude. We haveignored the K-correction, because it is small in comparisonto the other terms in Eq. 2.
We convert the surface density estimates for the 1500A restframe magnitude to Lyman continuum magnitudes, usingthe scale factors given by Leitherer54 for starbursts. For a continuous starburst a typical ratio is f1500/ f900≈ 2, assuming asolar metallicity and a Salpeter initial mass function withan upper mass cutoff of 100 M⊙. This ratio is relatively insensitiveto age. The range is 1.5∼< f1500/ f900∼< 3 for ages 10 – 900 Gyr. A factor of 2 amounts toδm1500
900 = 2.5log f1500/ f900≈ 0.75.
In Table 1 we list the apparent magnitude of the LyC as a functionzand fesc,
m∗900(1+z) = m∗
1500(1+z) + δm1500900 + δmesc, (3)
whereδmesc= 2.5log fesc. We list the redshifted wavelength of 912A at the bottom of the table. Table 1 and Figure 1show that there are hundreds to thousands of galaxies at them∗
900(1+z) per magnitude per square degree at all redshift ranges.There will be no lack of LyC candidates provided we have enough sensitivity to reach them∗
900(1+z) galaxies.
Table 1.m∗900 as a function ofzand fesc.
fesc\z 0.1 0.3 0.5 0.7 1.0 2.0 2.91.00 20.9 22.9 23.0 23.5 23.9 25.2 25.10.32 22.2 24.2 24.3 24.7 25.2 26.4 26.30.16 22.9 24.9 25.0 25.5 25.9 27.2 27.10.08 23.7 25.7 25.8 26.2 26.7 27.9 27.80.04 24.4 26.4 26.5 27.0 27.4 28.7 28.60.02 25.2 27.2 27.3 27.7 28.2 29.4 29.30.01 25.9 27.9 28.0 28.5 28.9 30.2 30.1
912A×(1+z) 1003. 1186. 1368. 1550. 1824. 2736. 3557.
6. INSTRUMENT BACKGROUND LIMITS
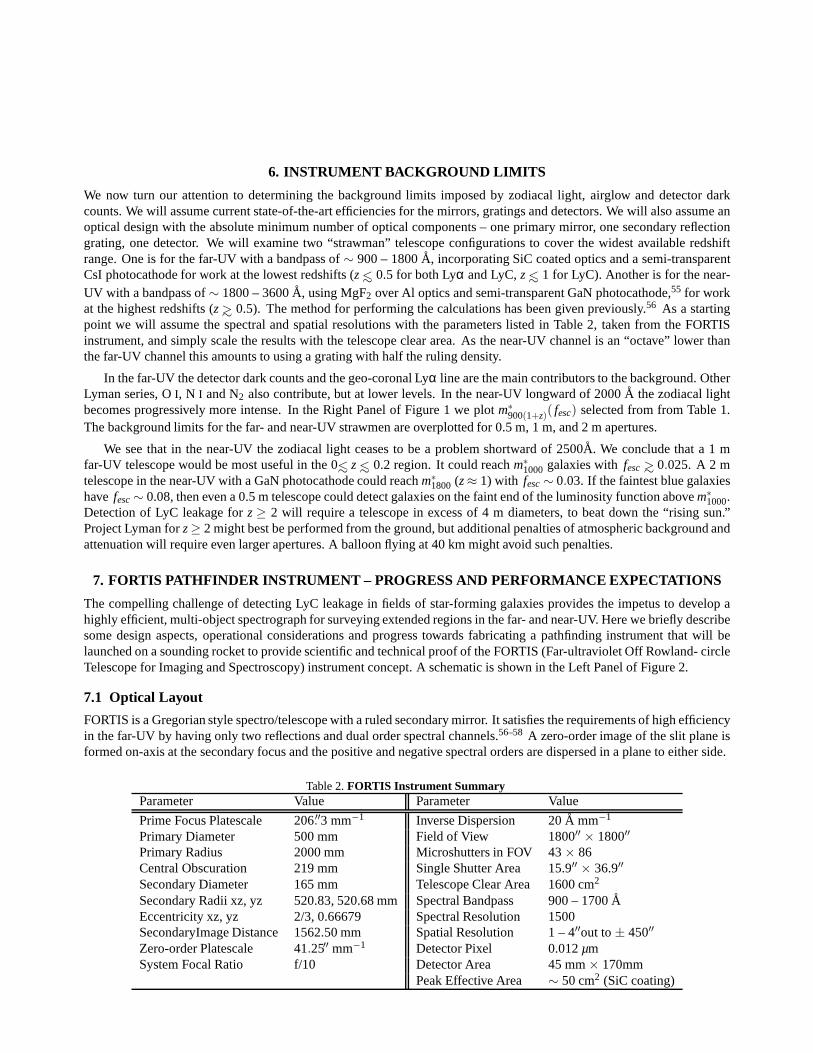
We now turn our attention to determining the background limits imposed by zodiacal light, airglow and detector darkcounts. We will assume current state-of-the-art efficiencies for the mirrors, gratings and detectors. We will also assume anoptical design with the absolute minimum number of optical components – one primary mirror, one secondary reflectiongrating, one detector. We will examine two “strawman” telescope configurations to cover the widest available redshiftrange. One is for the far-UV with a bandpass of∼ 900 – 1800A, incorporating SiC coated optics and a semi-transparentCsI photocathode for work at the lowest redshifts (z∼< 0.5 for both Lyα and LyC,z∼< 1 for LyC). Another is for the near-UV with a bandpass of∼ 1800 – 3600A, using MgF2 over Al optics and semi-transparent GaN photocathode,55 for workat the highest redshifts (z∼> 0.5). The method for performing the calculations has been given previously.56 As a startingpoint we will assume the spectral and spatial resolutions with the parameters listed in Table 2, taken from the FORTISinstrument, and simply scale the results with the telescopeclear area. As the near-UV channel is an “octave” lower thanthe far-UV channel this amounts to using a grating with half the ruling density.
In the far-UV the detector dark counts and the geo-coronal Lyα line are the main contributors to the background. OtherLyman series, OI, N I and N2 also contribute, but at lower levels. In the near-UV longward of 2000A the zodiacal lightbecomes progressively more intense. In the Right Panel of Figure 1 we plotm∗
900(1+z)( fesc) selected from from Table 1.The background limits for the far- and near-UV strawmen are overplotted for 0.5 m, 1 m, and 2 m apertures.
We see that in the near-UV the zodiacal light ceases to be a problem shortward of 2500A. We conclude that a 1 mfar-UV telescope would be most useful in the 0∼< z∼< 0.2 region. It could reachm∗
1000 galaxies withfesc∼> 0.025. A 2 mtelescope in the near-UV with a GaN photocathode could reachm∗
1800 (z≈ 1) with fesc∼ 0.03. If the faintest blue galaxieshavefesc∼ 0.08, then even a 0.5 m telescope could detect galaxies on thefaint end of the luminosity function abovem∗
1000.Detection of LyC leakage forz≥ 2 will require a telescope in excess of 4 m diameters, to beat down the “rising sun.”Project Lyman forz≥ 2 might best be performed from the ground, but additional penalties of atmospheric background andattenuation will require even larger apertures. A balloon flying at 40 km might avoid such penalties.
7. FORTIS PATHFINDER INSTRUMENT – PROGRESS AND PERFORMANCE EXPECTATIONS
The compelling challenge of detecting LyC leakage in fields of star-forming galaxies provides the impetus to develop ahighly efficient, multi-object spectrograph for surveyingextended regions in the far- and near-UV. Here we briefly describesome design aspects, operational considerations and progress towards fabricating a pathfinding instrument that will belaunched on a sounding rocket to provide scientific and technical proof of the FORTIS (Far-ultraviolet Off Rowland- circleTelescope for Imaging and Spectroscopy) instrument concept. A schematic is shown in the Left Panel of Figure 2.
7.1 Optical Layout
FORTIS is a Gregorian style spectro/telescope with a ruled secondary mirror. It satisfies the requirements of high efficiencyin the far-UV by having only two reflections and dual order spectral channels.56–58 A zero-order image of the slit plane isformed on-axis at the secondary focus and the positive and negative spectral orders are dispersed in a plane to either side.
Table 2.FORTIS Instrument SummaryParameter Value Parameter Value
Prime Focus Platescale 206.′′3 mm−1 Inverse Dispersion 20A mm−1
Primary Diameter 500 mm Field of View 1800′′ × 1800′′
Primary Radius 2000 mm Microshutters in FOV 43× 86Central Obscuration 219 mm Single Shutter Area 15.9′′ × 36.9′′
Secondary Diameter 165 mm Telescope Clear Area 1600 cm2
Secondary Radii xz, yz 520.83, 520.68 mmSpectral Bandpass 900 – 1700AEccentricity xz, yz 2/3, 0.66679 Spectral Resolution 1500SecondaryImage Distance 1562.50 mm Spatial Resolution 1 – 4′′out to± 450′′
Zero-order Platescale 41.25′′ mm−1 Detector Pixel 0.012µmSystem Focal Ratio f/10 Detector Area 45 mm× 170mm
Peak Effective Area ∼ 50 cm2 (SiC coating)

1000 1200 1400 1600Wavelength (Å)
−500
0
500
Ang
le o
ffaxi
s −
(")
→ → → → →
→ → → → →
→ → → → →
→ → → → →
→ → → → →
→ → → → →
→ → → → →
→ → → → →
→ → → → →
→ → → → →
→ → → → →
→ → → → →
→ → → → →
50 60 70 80Spectral axis − X (mm)
−20
−10
0
10
20
Spa
tial a
xis
− Y
(m
m)
1000 1200 1400 1600
Figure 2. LEFT PANEL – FORTIS sounding rocket optical layout. RIGHT PANEL – FORTIS raytrace. Point spread functions as afunction of wavelength and vertical off-axis angle calculated with a geometric raytrace. Inset points are wavelength pairs, separated by1 A, expanded by ten and sampled with (0.015 mm)2 bins. Off-axis image rotation will be corrected by distortion mapping.
Figure 3. Target simulation for M33. The zero-order image ofthe target is in the center. The rectangular regions are the slits with thebrightest integrated signal on the row. Only one slit is allowed per row to avoid spectral confusion. The light from each slit is diffractedinto the positive and negative orders to either side of the zero-order image. A rich spectral field is evident.
A combination of holographic ruling and triaxial figuring ofthe secondary mirror along with an optimum choice ofplatescale, greatly reduces spectral aberrations and fieldcurvature over a wide field-of-view (≈ 0.◦5). The image qualityin the spectral orders is a vast improvement over the prime-focus Rowland circle mount used byFUSE, which only hadpoint source spectroscopic capability. Examples of the point spread functions are shown in Figure 2 Right Panel. TheGregorian configuration allows placement of a microshutterarray at the prime focus. This creates a powerful mutliobjectspectrograph with a considerable multiplexing advantage.
7.2 Spectral Simulation
We show a spectral simulation of the M33 field in Figure 3. We used theGALEXflux calibrated FUV and NUV imagesof M33 to simulate the emission using the (1.′′5)2 square pixels provided by theGALEX images. This was done to keepthe image size of the calculation reasonable as the FORTIS design calls for 0.′′5 pixels. We assume that eachGALEXpixelhas afλ powerlaw with an slopeβo derived from the FUV and NUV images. Given the difference between the observedslope and an intrinsic slope (∆β ≡ –2.5 –βo) we model the atomic and molecular hydrogen absorption, assuming canonicalgas-to-dust ratios and molecular fractions. The simulatedspectra are produced using 0.73A bin−1. We used the estimatedFORTIS effective area curve,56 to convert fλ to total counts for an integration time of 400 s appropriate to a soundingrocket flight. A 3 KRayleigh geocoronal source (9× 10⁻¹⁴ ergs cm−2 s−1 arcsec−2), sets the background limit for eachslit. The effects of astigmatism have been neglected. The counting statistics have been simulated by adding or subtractingthe square root of the counts per bin multiplied by a random number drawn from a normalized Gaussian distribution.

Figure 4. Schematic cross section of a microshutter unit cell showing the key elements. Right – 64× 128 microshutter array with anarea of (12.8 mm)2 is shown at the center, mounted to a Si carrier and bonded to a fanout board in this lab version. The FORTIS fanoutwill minimize the vertical height to≈ 38 mm.
7.3 Microshutter Assembly
The microshutter arrays currently being developed at Goddard Space Flight Center (GSFC) for the Near Infrared Spec-trograph (NIRSpec) on the James Webb Space Telescope (JWST)consist of a two-dimensional array of closely packedclear aperture slits, each with an independently selectable shutter.59 Clear aperture slits are ideally suited for multi-objectspectroscopy in the far-UV where traditional techniques relying on optical fibers, lenslet arrays, mirrored slits or imageslicing cannot be used because of the poor efficiency of all optical materials in this bandpass. The following describes themicroshutters, their operation, the control electronics and the FORTIS zero-order imager interface.
7.3.1 Microshutter Description
Microshutter arrays with 64× 128 shutters were originally developed as production and lifetime test models for the larger175× 384 cyrogenic devices slated for NIRSpec. The arrays share the same shutter unit cell geometry and electrodestructures. We will use an uncooled 64× 128 array on FORTIS.
An array is composed of a thin shutter membrane and light shield mounted to a 100µm thick support grid. The supportgrid is an etched silicon wafer with a 100µm× 200µm pitch of rectangular holes. The matching shutter array is machinedinto a silicon nitride membrane 0.5µm thick. An individual shutter blade is suspended from the shutter frame by a torsionflexure. Reliability of the shutters has been evaluated and it has been shown that fatigue of the hinges is not a crediblefailure mechanism. Tests demonstrate that the number of failed open shutters equals≤ 1% after 106 cycles. Shutter bladesare surrounded by an aluminum light shield, which overlaps the edges. This provides high on-to-off contrast ratio∼ 7000:1The unit cell open area ratio is 0.69.60
The shutters are coated with a layer of high permeability magnetic material to allow for magnetic actuation of theshutters. Electrodes, deposited on one of the interior walls of the shutter support grid and the shutters themselves, allowfor electrostatic latching and release. Figure 4 shows the unit cell with exaggerated dimensions, indicating the differentstructural and electromechanical layers.
An aperture is opened by rotating the shutter by 90◦ on the torsion flexure. A magnetic actuation and electrostaticlatching method is used. Shutters are rotated out of the focal plane by the torque created as an external magnet is scannedover the shutter array. They are held open by an electrostatic potential applied between the open shutters and electrodesdeposited on the interior wall of the support grid. To enablethe electrostatic latch an aluminum coating is deposited onthe microshutters themselves to form address rows. Addresscolumns are formed by depositing backside electrodes on thewalls of the frame in a direction orthogonal to the rows, using angled deposition beam. During actuation and latching ofthe shutters, +24 V is applied to the shutters, and 24 V is applied to the wall electrode. Either the row voltage or the columnvoltage is sufficient to hold the shutter open. A shutter is released when both the row voltage and the column voltage areset to zero. This allows full random access, using a two dimension crosspoint address scheme.
7.3.2 Microshutter Components
A set of arrays and control electronics will be fabricated byGSFC. Selected arrays will be “bump bonded” to a Si arraycarrier. The Si array carrier will be mounted to a custom designed printed circuit (PC) fanout board with a small vertical

−900" 0" 900"
−90
0"
0"
9
00"
−900" 0" 900"
−90
0"
0"
9
00"
Figure 5. Left Panel – Far-UV zero-order cylindrical achromat. Middle Left – Zero-order raytrace PSFs at the focal planeextremeswithout correction. Middle Right – Zero-order corrected with the achromat. One pixel = 0.012µm = 0.′′5. Right Panel – A rendering ofthe detector assembly showing the position of the zero-order cylindrical achromat.
extent,≈ 38 mm, to minimize obscuration of the beam reflected off the secondary. The fanout board provides the parallelelectrical connections to the rows and columns of the individual shutters to allow application of the± 24 V levels foropening and closing the shutters from a high-voltage shift register (HV584) fabricated by SuperTex. The HV584 is a128 channel serial to parallel converter with push-pull outputs. The HV584 serial inputs come from level shifted logic,controlled by 5 volt CMOS inputs. The appropriate serial waveforms are generated by a microprocessor. Two HV584s arerequired, one for the rows and one for the columns.
7.3.3 Zero-Order Microshutter Interface – ZOMI
A zero-order microshutter interface, between the HV584 level shifter and the zero-order imaging channel, will allowaddressing of the individual microshutters during flight. It consists of a an onboard microprocessor to create a bit maparray of the zero-order target field, a field programable gatearray (FPGA) to pass the bit map to the 584, and a magnetsweeper for actuating the shutters. FPGAs will be programmed to take a bitmap array and output a serial waveform to the584 interface timed with the magnet sweep actuation. The FPGA will also have various functions preprogrammed into itsuch as, open all shutters or close all shutters. The magnet will be mounted on a linear translation stage thats travel backand forth, for opening and closing, by≈ 1.5 inch.
7.3.4 Zero-order Image Correction
Astigmatism can be corrected holographically, but in only one order at at time. Postive and negative order astigmatismcorrection, as required by a dual order design, can only be carried out with a grating figure that has slightly different sagittaland tangential radii.58 This surface creates a point source image with an astigmaticheight of≈ 280µm (11.′′5).
We have designed an achromat using CaF2 and MgF2 cylindrically shaped lenses to correct for astigmatism in theimaging focal plane. The use of CaF2 has the added benefit of eliminating geocoronal Lyα in from the imaging region.In Figure 5 the lens design is shown in the Left Panel, along with the raytrace results showning the imaging improvementprovided by the achromat (Middle Panels). For this raytraceinput point spread functions (PSFs) were radial Gaussian spotswith 1′′ FWHM and assumed a flat spectral response from 1300 – 1900A. Corrected PSFs are≈ 2′′over most of the 1800′′
× 1800′′ FOV.
7.4 Detector
The micro-channel plate (MCP) detector assembly is in the Right – Panel of Figure 5. The anode is a crossed delaylinewith three separate readouts. A 42× 42 mm2 readout for zero-order, and two 64× 42 mm2 readouts for the spectralregions. There are 4 mm gaps between the anodes. The MCPs alsoare separated by 4mm gaps but share a common outputvoltage plane. The output plane to anode voltage is maintained constant with zener diode. The input voltages are separatefor each MCP to allow the spectral channels to be turned off when acquiring the zero-order image. Otherwise geo-coronalLyα would swamp the spectral channels with counts, which, whilenot fatal, would be too high a count rate to be accurate.
The detector housing has a door, which will open in flight and during preflight testing, to allow the light to reachthe detectors. The detector assembly will also include, motors to actuate the door, a pump-out port, ion and getter pumpassembles (not shown in the drawing). The entire spectro/telescope is housed in vacuum tight skins and evacuated prior toflight.

7.5 Target Acquisition
The (1800′′) 2 FOV of the primary focal plane covers an area of≈ (9mm)2 and will illuminate 43 rows× 86 columns ofthe microshutters. The rows run in the direction of the dispersion, so for unconfused spectral acquistion only one shutterper row can be open.
The large number of slitlets presents a formidable target acquisition challenge, which is made more pressing given theshort time available for target selection during a soundingrocket flight, with a total observing time∼ of 400 s. Previousknowledge of the bright regions in the target field could be used to pre-program the array. However, this strategy couldeasily be foiled by an Acquistion and Control System (ACS) misalignment with the telescope bore center, which experiencehas shown can be as large as 5′ in pitch and yaw and> 1◦ in roll. A robust alternative is an automatic targeting system,which for the sounding rocket flight will be a simple brightest-object on a row targeting algorithm. On target, the ACSprovides excellent hold accuracy∼ 1′′ and a command uplink system is provided to fine tune pointing misalignments inrealtime after target acquistion at≈ T+85 s.
Our baseline target acquistion plan is to launch with the microshutters open. At arrival on target we will assess,fine tune and lock the pointing using the FORTIS zero-order image. After a set integration period (≈ 30 s) the onboardmicroprocessor will generate a 43× 86 brightest row member bitmask from the accumulated zero-order image and pass itto the 584 shift registers. The waveform will be synchronized with the magnet sweep, using a field programable gate array(FPGA) to close all but the selected shutters. Unconfused spectral observations will then commence for the duration of theflight, ending at≈ T+530 s.
8. CURRENT PROGRESS ON THE FORTIS BUILD
We have purchased and are testing the 0.5 m primary mirror. The tri-axial elliptical secondary is in fabrication. A sphericaltest secondary mirror has been delivered to the grating vendor and a proper elliptical secondary has been delivered to JHUas a comparison against which to test the tri-axial optic. The detector is in fabrication. The optical bench is in designphase along with the zero-order microshutter interface. Microshutter arrays have been fabricated but await selection. Weanticipate integration of the spectro/telescope will begin in the summer of 2009 and expect to begin integration of FORTISwith the NASA sounding rocket launch provider in summer of 2010. Our first target is currently scheduled to be M33.
ACKNOWLEDGMENTS
NASA grants to JHU NNG04WC03G and NNX08AM68G support this work.
REFERENCES[1] Fan, X. e. a., “A Survey of z>5.8 Quasars in the Sloan Digital Sky Survey. I. Discovery of Three New Quasars and the Spatial Density of Luminous Quasarsat z˜6,”
AJ122, 2833–2849 (Dec. 2001).[2] Madau, P., Haardt, F., and Rees, M. J., “Radiative Transfer in a Clumpy Universe. III. The Nature of Cosmological Ionizing Sources,”ApJ514, 648–659 (Apr. 1999).[3] Bouwens, R. J., Illingworth, G. D., Franx, M., and Ford, H., “z˜7-10 Galaxies in the HUDF and GOODS fields, and their UV Luminosity Functions,”ArXiv e-prints803
(Mar. 2008).[4] Yan, H. and Windhorst, R. A., “Candidates of z ˜= 5.5-7 Galaxies in the Hubble Space Telescope Ultra Deep Field,”ApJ612, L93–L96 (Sept. 2004).[5] Bouwens, R. J., Illingworth, G. D., Blakeslee, J. P., andFranx, M., “Galaxies at z ˜ 6: The UV Luminosity Function and Luminosity Density from 506 HUDF, HUDF
Parallel ACS Field, and GOODS i-Dropouts,”ApJ653, 53–85 (Dec. 2006).[6] Fan, X. e. a., “A Survey ofz>5.7 Quasars in the Sloan Digital Sky Survey. III. Discovery of Five Additional Quasars,”AJ128, 515–522 (Aug. 2004).[7] Bolton, J. S. and Haehnelt, M. G., “The observed ionization rate of the intergalactic medium and the ionizing emissivity at z≥ 5: evidence for a photon-starved and
extended epoch of reionization,”MNRAS382, 325–341 (Nov. 2007).[8] Meiksin, A., “Constraints on the ionization sources of the high-redshift intergalactic medium,”MNRAS356, 596–606 (Jan. 2005).[9] Shull, J. M., Roberts, D., Giroux, M. L., Penton, S. V., and Fardal, M. A., “The Metagalactic Ionizing Radiation Fieldat Low Redshift,”AJ 118, 1450–1460 (Oct.
1999).[10] Heckman, T. M., Sembach, K. R., Meurer, G. R., Leitherer, C., Calzetti, D., and Martin, C. L., “On the Escape of Ionizing Radiation from Starbursts,”ApJ558, 56–62
(Sept. 2001).[11] Ricotti, M., Gnedin, N. Y., and Shull, J. M., “The Fate ofthe First Galaxies. III. Properties of Primordial Dwarf Galaxies and their Impact on the Intergalactic Medium,”
ArXiv e-prints802(Feb. 2008).[12] Furlanetto, S., Haiman, Z., and Oh, S. P., “Fossil Ionized Bubbles Around Dead Quasars During Reionization,”ArXiv e-prints803(Mar. 2008).[13] Siana, B., Teplitz, H. I., Colbert, J., Ferguson, H. C.,Dickinson, M., Brown, T. M., Conselice, C. J., de Mello, D. F., Gardner, J. P., Giavalisco, M., and Menanteau, F.,
“New Constraints on the Lyman Continuum Escape Fraction at z˜1.3,” ApJ668, 62–73 (Oct. 2007).[14] Fernandez-Soto, A., Lanzetta, K. M., and Chen, H.-W., “Mission: impossible (escape from the Lyman limit),”MNRAS342, 1215–1221 (July 2003).[15] Zheng, W., Kriss, G. A., Telfer, R. C., Grimes, J. P., andDavidsen, A. F., “A Composite HST Spectrum of Quasars,”ApJ475, 469–+ (Feb. 1997).[16] Kriss, G. A., Davidsen, A. F., Zheng, W., and Lee, G., “The Ultraviolet Peak of the Energy Distribution in 3C 273: Evidence for an Accretion Disk and Hot Corona
around a Massive Black Hole,”ApJ527, 683–695 (Dec. 1999).[17] Steidel, C. C., Pettini, M., and Adelberger, K. L., “Lyman-Continuum Emission from Galaxies at Z ˜= 3.4,”ApJ546, 665–671 (Jan. 2001).

[18] Shapley, A. E., Steidel, C. C., Pettini, M., Adelberger, K. L., and Erb, D. K., “The Direct Detection of Lyman Continuum Emission from Star-forming Galaxies at z˜3,”ApJ651, 688–703 (Nov. 2006).
[19] Iwata, I., Inoue, A. K., Matsuda, Y., Furusawa, H., Hayashino, T., Kousai, K., Akiyama, M., Yamada, T., Burgarella,D., and Deharveng, J. ., “Detections of LymanContinuum from Star-forming Galaxies at z˜3 Through Subaru/Suprime-Cam Narrow-band Imaging,”ArXiv e-prints805(May 2008).
[20] Leitherer, C., Ferguson, H. C., Heckman, T. M., and Lowenthal, J. D., “The Lyman Continuum in Starburst Galaxies Observed with the Hopkins Ultraviolet Telescope,”ApJ454, L19+ (Nov. 1995).
[21] Hurwitz, M., Jelinsky, P., and Dixon, W. V. D., “Reexamining the Lyman Continuum in Starburst Galaxies Observed with the Hopkins Ultraviolet Telescope,”ApJ481,L31+ (May 1997).
[22] Bergvall, N., Zackrisson, E., Andersson, B.-G., Arnberg, D., Masegosa, J., and Ostlin, G., “First detection of Lyman continuum escape from a local starburst galaxy. I.Observations of the luminous blue compact galaxy Haro 11 with the Far Ultraviolet Spectroscopic Explorer (FUSE),”A&A 448, 513–524 (Mar. 2006).
[23] Grimes, J. P., Heckman, T., Strickland, D., Dixon, W. V., Sembach, K., Overzier, R., Hoopes, C., Aloisi, A., and Ptak, A., “Feedback in the Local Lyman-break GalaxyAnalog Haro 11 as Probed by Far-Ultraviolet and X-Ray Observations,”ApJ668, 891–905 (Oct. 2007).
[24] Shull, J. M., Tumlinson, J., Giroux, M. L., Kriss, G. A.,and Reimers, D., “The Fluctuating Intergalactic RadiationField at Redshifts z = 2.3-2.9 from He II and H IAbsorption toward HE 2347-4342,”ApJ600, 570–579 (Jan. 2004).
[25] Kriss, G., Krolik, J., Grimes, J., Tsvetanov, Z., Espey, B., Zheng, W., and Davidsen, A., “HUT Observations of the Lyman Limit in AGN: Implications for UnifiedModels,” in [IAU Colloq. 159: Emission Lines in Active Galaxies: New Methods and Techniques], Peterson, B. M., Cheng, F.-Z., and Wilson, A. S., eds.,113, 453–+(1997).
[26] Ferrarese, L. and Ford, H., “Supermassive Black Holes in Galactic Nuclei: Past, Present and Future Research,”Space Science Reviews116, 523–624 (Feb. 2005).[27] Soltan, A., “Masses of quasars,”MNRAS200, 115–122 (July 1982).[28] Inoue, A. K. and Iwata, I., “A Monte Carlo simulation of the intergalactic absorption and the detectability of the Lyman continuum from distant galaxies,”ArXiv
e-prints804(Apr. 2008).[29] Arnouts, S. e. a., “The GALEX VIMOS-VLT Deep Survey Measurement of the Evolution of the 1500A Luminosity Function,”ApJ619, L43–L46 (Jan. 2005).[30] Baldry, I. K., Glazebrook, K., Brinkmann, J., Ivezic,Z., Lupton, R. H., Nichol, R. C., and Szalay, A. S., “Quantifying the Bimodal Color-Magnitude Distribution of
Galaxies,”ApJ600, 681–694 (Jan. 2004).[31] Heinis, S. e. a., “Clustering Properties of Rest-FrameUV-Selected Galaxies. II. Migration of Star Formation Sites with Cosmic Time from GALEX and CFHTLS,”
ApJS173, 503–511 (Dec. 2007).[32] Cowie, L. L., Songaila, A., Hu, E. M., and Cohen, J. G., “New Insight on Galaxy Formation and Evolution From Keck Spectroscopy of the Hawaii Deep Fields,”
AJ112, 839–+ (Sept. 1996).[33] Windhorst, R. A., Cohen, S. H., Jansen, R. A., Conselice, C., and Yan, H., “How JWST can measure first light, reionization and galaxy assembly,”New Astronomy
Review50, 113–120 (Mar. 2006).[34] Kriss, G. A. e. a., “Resolving the Structure of Ionized Helium in the Intergalactic Medium with the Far Ultraviolet Spectroscopic Explorer,”Science293, 1112–1116
(Aug. 2001).[35] Zheng, W., Kriss, G. A., Deharveng, J.-M., Dixon, W. V.,Kruk, J. W., Shull, J. M., Giroux, M. L., Morton, D. C., Williger, G. M., Friedman, S. D., and Moos, H. W.,
“A Study of the Reionization History of Intergalactic Helium with FUSE and the Very Large Telescope,”ApJ605, 631–644 (Apr. 2004).[36] Osterbrock, D. E. and Ferland, G. J., [Astrophysics of gaseous nebulae and active galactic nuclei], Astrophysics of gaseous nebulae and active galactic nuclei,
2nd. ed. by D.E. Osterbrock and G.J. Ferland. Sausalito, CA:University Science Books, 2006 (2006).[37] Deharveng, J.-M., Buat, V., Le Brun, V., Milliard, B., Kunth, D., Shull, J. M., and Gry, C., “Constraints on the Lymancontinuum radiation from galaxies: First results
with FUSE on Mrk 54,”A&A 375, 805–813 (Sept. 2001).[38] Driver, S. P., Fernandez-Soto, A., Couch, W. J., Odewahn, S. C., Windhorst, R. A., Phillips, S., Lanzetta, K., and Yahil, A., “Morphological Number Counts and
Redshift Distributions to I< 26 from the Hubble Deep Field: Implications for the Evolution of Ellipticals, Spirals, and Irregulars,”ApJ496, L93+ (Apr. 1998).[39] Ryan, R. E., Cohen, S. H., Windhorst, R. A., and Silk, J.,“Galaxy Mergers at z> 1 in the HUDF: Evidence for a Peak in the Major Merger Rate of Massive Galaxies,”
ApJ676, 1–7 (Mar. 2008).[40] Dove, J. B. and Shull, J. M., “Photoionization of the diffuse interstellar medium and galactic halo by OB associations,” ApJ430, 222–235 (July 1994).[41] Fujita, A., Martin, C. L., Mac Low, M.-M., and Abel, T., “The Influence of Supershells and Galactic Outflows on the Escape of Ionizing Radiation from Dwarf Starburst
Galaxies,”ApJ599, 50–69 (Dec. 2003).[42] Furlanetto, S. R., Schaye, J., Springel, V., and Hernquist, L., “Lyα Emission from Structure Formation,”ApJ622, 7–27 (Mar. 2005).[43] Stiavelli, M., Fall, S. M., and Panagia, N., “The Possible Detection of Cosmological Reionization Sources,”ApJ610, L1–L4 (July 2004).[44] Neufeld, D. A., “The transfer of resonance-line radiation in static astrophysical media,”ApJ350, 216–241 (Feb. 1990).[45] Neufeld, D. A., “The escape of Lyman-alpha radiation from a multiphase interstellar medium,”ApJ370, L85–L88 (Apr. 1991).[46] Rhoads, J. E., Dey, A., Malhotra, S., Stern, D., Spinrad, H., Jannuzi, B. T., Dawson, S., Brown, M. J. I., and Landes, E., “Spectroscopic Confirmation of Three Redshift
z˜5.7 Lyα Emitters from the Large-Area Lyman Alpha Survey,”AJ125, 1006–1013 (Mar. 2003).[47] Giavalisco, M., Koratkar, A., and Calzetti, D., “Obscuration of LY alpha Photons in Star-forming Galaxies,”ApJ466, 831–+ (Aug. 1996).[48] Hansen, M. and Oh, S. P., “Lymanα radiative transfer in a multiphase medium,”MNRAS367, 979–1002 (Apr. 2006).[49] Dijkstra, M., Haiman, Z., and Spaans, M., “Lyα Radiation from Collapsing Protogalaxies. I. Characteristics of the Emergent Spectrum,”ApJ649, 14–36 (Sept. 2006).[50] Mao, J., Lapi, A., Granato, G. L., de Zotti, G., and Danese, L., “The Role of the Dust in Primeval Galaxies: A Simple Physical Model for Lyman Break Galaxies and
Lyα Emitters,”ApJ667, 655–666 (Oct. 2007).[51] Deharveng, J.-M., Faiesse, S., Milliard, B., and Le Brun, V., “The Lyman continuum radiation escaping from galaxies.,” A&A 325, 1259–1263 (Sept. 1997).[52] McCandliss, S. R., “A Lyman Continuum Explorer - LyContEx,” in [Astrophysics in the Far Ultraviolet: Five Years of Discovery with FUSE], Sonneborn, G., Moos,
H. W., and Andersson, B.-G., eds.,348, 569–+ (June 2006).[53] Yoshida, M. e. a., “Luminosity Functions of Lyman BreakGalaxies at z˜4 and z˜5 in the Subaru Deep Field,”ApJ653, 988–1003 (Dec. 2006).[54] Leitherer, C., Schaerer, D., Goldader, J. D., Delgado,R. M. G., Robert, C., Kune, D. F., de Mello, D. F., Devost, D., and Heckman, T. M., “Starburst99: Synthesis
Models for Galaxies with Active Star Formation,”ApJS123, 3–40 (July 1999).[55] Siegmund, O., Vallerga, J., McPhate, J., Malloy, J., Tremsin, A., Martin, A., Ulmer, M., and Wessels, B., “Development of GaN photocathodes for UV detectors,”
Nuclear Instruments and Methods in Physics Research A567, 89–92 (Nov. 2006).[56] McCandliss, S. R., France, K., Feldman, P. D., Glazebrook, K., Meurer, G., Bianchi, L., Moos, H. W., Kruk, J. W., Blair, W. P., and Baldry, I., “FORTIS: pathfinder to
the Lyman continuum,” in [UV and Gamma-Ray Space Telescope Systems. Edited by Hasinger, Gunther; Turner, Martin J. L. Proceedings of the SPIE, Volume 5488,pp. 709-718 (2004).], Hasinger, G. and Turner, M. J. L., eds., 709–718 (Oct. 2004).
[57] McCandliss, S. R., France, K., Feldman, P. D., and Pelton, R., “Long-slit imaging dual order spectrograph – LIDOS,”in [Proc. SPIE Vol. 4854, p. 385-396, FutureEUV/UV and Visible Space Astrophysics Missions and Instrumentation, J. C. Blades; Oswald H. Siegmund; Eds.], 4854, 385–396 (Feb. 2003).
[58] McCandliss, S. R., Burgh, E. B., and Feldman, P. D., “Ultraviolet groove efficiency of a holographic grating: implications for a dual-order spectrograph,”Appl. Opt.40,2626–2642 (June 2001).
[59] Kutyrev, A. S., Arendt, R., Moseley, S. H., Boucarut, R.A., Hadjimichael, T., Jhabvala, M., King, T., Li, M. J., Loughlin, J., Rapchun, D., Schwinger, D. S., andSilverberg, R. F., “Programmable Microshutter Arrays for the JWST NIRSpec: Optical Performance,”IEEE J. Select. Topics Quantum Electron.10, 652–718 (2004).
[60] Li, M. J. e. a., “Microshutter array development for theJames Webb space telescope,” in [Micro- and Nanotechnology: Materials, Processes, Packaging, and SystemsII. Edited by Chiao, Jung-Chih; Jamieson, David N.; Faraone, Lorenzo; Dzurak, Andrew S. Proceedings of the SPIE, Volume5650, pp. 9-16 (2005).], Chiao, J.-C.,Jamieson, D. N., Faraone, L., and Dzurak, A. S., eds., 9–16 (Feb. 2005).
Related Documents