NOVEL MINIATURIZED HYPERSPECTRAL SENSOR FOR UAV AND SPACE APPLICATIONS Heikki Saari, Ville-Veikko Aallos, Altti Akujärvi, Tapani Antila, Christer Holmlund, Uula Kantojärvi, Jussi Mäkynen, Jyrki Ollila Technical Research Centre of Finland – VTT, P.O. Box 1000, FI-02044 VTT, Finland ABSTRACT In many hyperspectral applications it is beneficial to produce 2D spatial images with a single exposure at a few selected wavelength bands instead of 1D spatial and all spectral band images like in push-broom instruments. VTT has developed a new concept based on the Piezo actuated Fabry-Perot Interferometer to enable recording of 2D spatial images at the selected wavelength bands simultaneously. The sensor size is compatible with light weight UAV platforms. In our spectrometer the multiple orders of the Fabry-Perot Interferometer are used at the same time matched to the sensitivities of a multispectral RGB-type image sensor channels. We have built prototypes of the new spectrograph fitting inside of a 40 mm x 40 mm x 20 mm envelope and with a mass less than 50 g. The operational wavelength range of built prototypes can be tuned in the range 400 – 1100 nm and the spectral resolution is in the range 5 – 10 nm @ FWHM. Presently the spatial resolution is 480 x 750 pixels but it can be increased simply by changing the image sensor. The hyperspectral imager records simultaneously a 2D image of the scenery at three narrow wavelength bands determined by the selected three orders of the Fabry-Perot Interferometer which depend on the air gap between the mirrors of the Fabry-Perot Cavity. The new sensor can be applied on UAV, aircraft, and other platforms requiring small volume, mass and power consumption. The new low cost hyperspectral imager can be used also in many industrial and medical applications. Keywords: hyperspectral sensors, multispectral image sensors, Fabry-Perot Interferometer, Piezo actuators, imaging spectrometer, UAV, airborne, medical imaging, precision agriculture, target detection 1. INTRODUCTION 1.1. Background A hyperspectral imager measures the spectral content of each pixel. The most common way to produce a hyperspectral image is to use a push-broom instrument. The push-broom imaging technologies is typically based on Prism-Grating- Prism components 1 or on gratings 2 . The push-broom imagers produce a line image of the target at all spectral bands simultaneously and require a mechanical scanner to form a hyperspectral image of a 2-dimensional, stationary object. The other common hyperspectral technology is based on a wavelength tunable filter 3 . There are several ways to construct an Electronically Tunable Filter (ETF). Liquid Crystal Tunable Filters (LCTF) have been used in several Hyperspectral Imager Systems (HIS) 4,5,6,7 . A Lyot-Ohman type LCTF which consists of a stack of polarizers and tunable retardation (bifringent) liquid crystal plates has been used in many hyperspectral imaging instruments in the wavelength range 400 nm to 2500 nm. The speed at which the wavelength can be changed in a conventional LCTF is limited by the relaxation time of the crystal and is in the range of 40…60 ms. In many applications considerably faster switching of pass band wavelength is required. The tunable filters based on Holographically formed Polymer-Dispersed Liquid Crystal (H-PDLC) materials are under development 7,8 . The H-PDLC devices consist of a polymer and micron sized LC droplets composite, resulting in improved electro-optical properties compared to traditional LC materials. With this technology it is possible to achieve faster switching times, wider wavelength operating ranges and better wavelength resolution, and higher transmission than with the traditional LC technology. A third glass of LCTF is based on deformed helix- Ferroelectric Liquid Crystals (FLCs). These materials enable building of Fabry-Perot tunable filters which can operated with a low voltage and at high speed 6,8 . Sensors, Systems, and Next-Generation Satellites XIII, edited by Roland Meynart, Steven P. Neeck, Haruhisa Shimoda, Proc. of SPIE Vol. 7474, 74741M · © 2009 SPIE · CCC code: 0277-786X/09/$18 · doi: 10.1117/12.830284 Proc. of SPIE Vol. 7474 74741M-1

Welcome message from author
This document is posted to help you gain knowledge. Please leave a comment to let me know what you think about it! Share it to your friends and learn new things together.
Transcript

NOVEL MINIATURIZED HYPERSPECTRAL SENSOR FOR UAV AND SPACE APPLICATIONS
Heikki Saari, Ville-Veikko Aallos, Altti Akujärvi, Tapani Antila, Christer Holmlund, Uula
Kantojärvi, Jussi Mäkynen, Jyrki Ollila
Technical Research Centre of Finland – VTT, P.O. Box 1000, FI-02044 VTT, Finland
ABSTRACT In many hyperspectral applications it is beneficial to produce 2D spatial images with a single exposure at a few selected wavelength bands instead of 1D spatial and all spectral band images like in push-broom instruments. VTT has developed a new concept based on the Piezo actuated Fabry-Perot Interferometer to enable recording of 2D spatial images at the selected wavelength bands simultaneously. The sensor size is compatible with light weight UAV platforms. In our spectrometer the multiple orders of the Fabry-Perot Interferometer are used at the same time matched to the sensitivities of a multispectral RGB-type image sensor channels. We have built prototypes of the new spectrograph fitting inside of a 40 mm x 40 mm x 20 mm envelope and with a mass less than 50 g. The operational wavelength range of built prototypes can be tuned in the range 400 – 1100 nm and the spectral resolution is in the range 5 – 10 nm @ FWHM. Presently the spatial resolution is 480 x 750 pixels but it can be increased simply by changing the image sensor. The hyperspectral imager records simultaneously a 2D image of the scenery at three narrow wavelength bands determined by the selected three orders of the Fabry-Perot Interferometer which depend on the air gap between the mirrors of the Fabry-Perot Cavity. The new sensor can be applied on UAV, aircraft, and other platforms requiring small volume, mass and power consumption. The new low cost hyperspectral imager can be used also in many industrial and medical applications.
Keywords: hyperspectral sensors, multispectral image sensors, Fabry-Perot Interferometer, Piezo actuators, imaging spectrometer, UAV, airborne, medical imaging, precision agriculture, target detection
1. INTRODUCTION
1.1. Background A hyperspectral imager measures the spectral content of each pixel. The most common way to produce a hyperspectral image is to use a push-broom instrument. The push-broom imaging technologies is typically based on Prism-Grating-Prism components1 or on gratings2. The push-broom imagers produce a line image of the target at all spectral bands simultaneously and require a mechanical scanner to form a hyperspectral image of a 2-dimensional, stationary object. The other common hyperspectral technology is based on a wavelength tunable filter3. There are several ways to construct an Electronically Tunable Filter (ETF). Liquid Crystal Tunable Filters (LCTF) have been used in several Hyperspectral Imager Systems (HIS)4,5,6,7. A Lyot-Ohman type LCTF which consists of a stack of polarizers and tunable retardation (bifringent) liquid crystal plates has been used in many hyperspectral imaging instruments in the wavelength range 400 nm to 2500 nm. The speed at which the wavelength can be changed in a conventional LCTF is limited by the relaxation time of the crystal and is in the range of 40…60 ms. In many applications considerably faster switching of pass band wavelength is required. The tunable filters based on Holographically formed Polymer-Dispersed Liquid Crystal (H-PDLC) materials are under development7,8. The H-PDLC devices consist of a polymer and micron sized LC droplets composite, resulting in improved electro-optical properties compared to traditional LC materials. With this technology it is possible to achieve faster switching times, wider wavelength operating ranges and better wavelength resolution, and higher transmission than with the traditional LC technology. A third glass of LCTF is based on deformed helix- Ferroelectric Liquid Crystals (FLCs). These materials enable building of Fabry-Perot tunable filters which can operated with a low voltage and at high speed6,8.
Sensors, Systems, and Next-Generation Satellites XIII, edited by Roland Meynart, Steven P. Neeck, Haruhisa Shimoda, Proc. of SPIE Vol. 7474, 74741M · © 2009
SPIE · CCC code: 0277-786X/09/$18 · doi: 10.1117/12.830284
Proc. of SPIE Vol. 7474 74741M-1

The Acousto-Optical Tunable Filter (AOTF)11 is based on a crystal in which a radio frequency (RF) induced acoustic wave separates a narrow wavelength band from a broadband light beam entering the crystal. The selected wavelength band depends on the RF frequency applied to the crystal. The AOTF filter deviates the light of the selected wavelength band by few degrees. The deviation is polarization dependent and only one component of the linearly polarized light can be used. A wavelength tuning only operates for polarized light in LCTF and AOTF devices. Therefore the light throughput for randomly polarized light is always reduced. If the light entering the LCTF or AOTF filter is linearly polarized the first polarizer of the filter must be set accordingly for maximum light throughput. Still another class of tunable filters is the Bragg Tunable Filter (BTF)11. A volume Bragg Grating or Volume Phase Hologram (VPH) contains material in which the index of diffraction varies periodically. The orientation of the modulation structure with respect to the incoming light determines whether the grating is reflective or transmissive. The Bragg diffraction caused by this index modulation affects a narrow region of the spectrum and the center wavelength of the pass band is
)sin(2 θλ Λ= (1) where λ is the wavelength, Λ is the index modulation period, and θ is the angle of incidence in the modulating medium. The light at wavelengths for which the Bragg condition is not valid passes the grating without beam angle change. An example of a tunable filter using a single Volume Bragg Grating (VGB) is described in a paper of S. Blais-Ouellette et.al.11. BTF based imaging spectrometer requires that the light beam entering the VGB is properly collimated as the spectral resolution depends on the quality of the collimation.
1.2. Fabry-Perot Interferometer based hyperspectral imagers The traditional Fabry-Perot Interferometer12 (FPI) has been used as a tunable filter since its invention. The basic concept for a FPI tunable filter is shown in Figure 1. The wavelengths that fulfil the constructive interference condition are described
λπλεθ ))(()cos(2 += mdgap (2)
where dgap is the distance between the mirrors (air gap), θ is the angle of incidence of the light with respect to the optical axis of the Fabry-Perot cavity, m is the order of interference, and is ε(λ) the phase change upon reflection from the mirror coating. An approximation of the wavelength-dependent filter transmission is
))cos(4
cos()(2)(1
)(),(2
2
λθπ
λλ
λλgap
mm
mgap d
RR
TdT−+
= (3)
Where dgap and θ are the air gap width and angle of incidence as in Eq. 2, Tm(λ) is the wavelength dependent transmission of the Fabry-Perot mirrors, Rm(λ) is the wavelength dependent reflectance of the Fabry-Perot mirrors. In Eq. 3 it has been assumed that the phase change upon reflection from the mirror coating can be neglected. The average spectral transmission of an optical beam containing a distribution of incident angles between 0 and θmax is
Proc. of SPIE Vol. 7474 74741M-2
IUCOW!Ud I
ILSLJ2W sq
400 500 600 700 800 900 10000
0.2
0.4
0.6
0.8
Wavelength/[nm]
Spec
tral t
rans
mis
sion
Fabry-Perot Mirrors
Air gap Order sorting filter
Object of the hyperspectral
imager
Image of the hyperspectral
imager
Front optics for collimation Focusing optics
for imaging
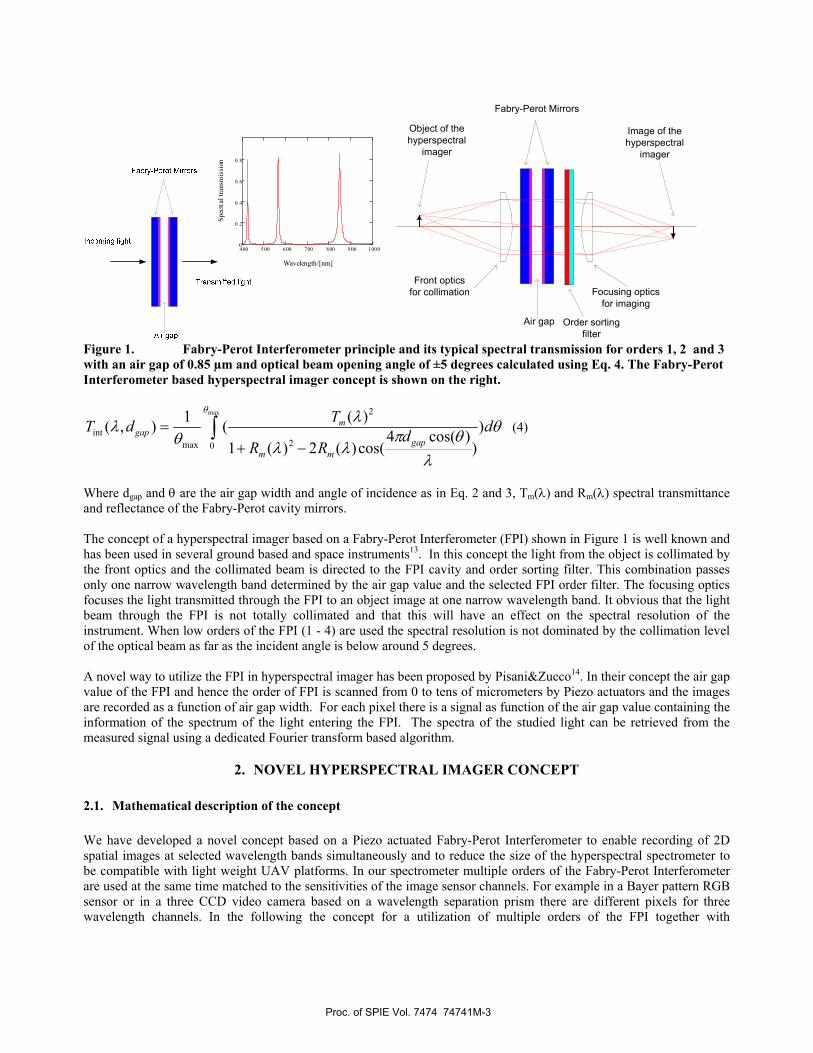
Figure 1. Fabry-Perot Interferometer principle and its typical spectral transmission for orders 1, 2 and 3 with an air gap of 0.85 µm and optical beam opening angle of ±5 degrees calculated using Eq. 4. The Fabry-Perot Interferometer based hyperspectral imager concept is shown on the right.
∫−+
=max
0 2
2
maxint )
))cos(4
cos()(2)(1
)((1),(θ
θ
λθπ
λλ
λθ
λ ddRR
TdTgap
mm
mgap (4)
Where dgap and θ are the air gap width and angle of incidence as in Eq. 2 and 3, Tm(λ) and Rm(λ) spectral transmittance and reflectance of the Fabry-Perot cavity mirrors. The concept of a hyperspectral imager based on a Fabry-Perot Interferometer (FPI) shown in Figure 1 is well known and has been used in several ground based and space instruments13. In this concept the light from the object is collimated by the front optics and the collimated beam is directed to the FPI cavity and order sorting filter. This combination passes only one narrow wavelength band determined by the air gap value and the selected FPI order filter. The focusing optics focuses the light transmitted through the FPI to an object image at one narrow wavelength band. It obvious that the light beam through the FPI is not totally collimated and that this will have an effect on the spectral resolution of the instrument. When low orders of the FPI (1 - 4) are used the spectral resolution is not dominated by the collimation level of the optical beam as far as the incident angle is below around 5 degrees. A novel way to utilize the FPI in hyperspectral imager has been proposed by Pisani&Zucco14. In their concept the air gap value of the FPI and hence the order of FPI is scanned from 0 to tens of micrometers by Piezo actuators and the images are recorded as a function of air gap width. For each pixel there is a signal as function of the air gap value containing the information of the spectrum of the light entering the FPI. The spectra of the studied light can be retrieved from the measured signal using a dedicated Fourier transform based algorithm.
2. NOVEL HYPERSPECTRAL IMAGER CONCEPT
2.1. Mathematical description of the concept We have developed a novel concept based on a Piezo actuated Fabry-Perot Interferometer to enable recording of 2D spatial images at selected wavelength bands simultaneously and to reduce the size of the hyperspectral spectrometer to be compatible with light weight UAV platforms. In our spectrometer multiple orders of the Fabry-Perot Interferometer are used at the same time matched to the sensitivities of the image sensor channels. For example in a Bayer pattern RGB sensor or in a three CCD video camera based on a wavelength separation prism there are different pixels for three wavelength channels. In the following the concept for a utilization of multiple orders of the FPI together with
Proc. of SPIE Vol. 7474 74741M-3

multispectral image sensor will be presented. An Eq. 4 was derived for the spectral transmission of the FPI as a function of the FPI air gap. Number of generated signal electrons of an RGB image sensor Blue (B), Green (G) and Red (R) pixels are
∫ Φ=max
min
)()(),()()(λ
λ
λλλλλη dTdTdS phsysgapFPIBgapB (5)
∫ Φ=max
min
)()(),()()(λ
λ
λλλλλη dTdTdS phsysgapFPIGgapG (6)
∫ Φ=max
min
)()(),()()(λ
λ
λλλλλη dTdTdS phsysgapFPIRgapR (7)
In Eqs. 5 - 7 the ηB(λ), ηG(λ) ja ηR(λ) are the quantum efficiences of the B-, G- ja R-pixels at the wavelength λ and the Φph(λ) is the spectral photon flux entering the system. The combined spectral transmission of the optical system without the FPI is included in the term Tsys(λ). Selecting a dgap in such a way that there are at most three trasmittted wavelengths at three different orders of the FPI in the range λmin ≤ λ ≤ λmax the signals of the B-, G- and R-pixels are originating mostly from the light at the three narrow wavelength bands of the transmitted three FPI orders. The center wavelengths of the three transmitted FPI pass bands at the FPI orders n, n+1, n+2 can be approximated by
ndgap
n
⋅=
2λ (8)
Where dgap is the FPI air gap width. For the retrieval of the spectral signal at the three selected wavelength bands a calibration is required for the responses of the B-, G- and R-pixels around the selected three FPI pass bands.
∫−⋅⋅
+⋅⋅
+⋅⋅−⋅⋅
=
))1(2
11(2
))1(2
11(2
)(),()(),(nnn
d
nnnd
sysgapFPIBgapBn
gap
gap
dTdTndS λλλλη (9)
∫−⋅⋅
+⋅⋅
+⋅⋅−⋅⋅
=
))1(2
11(2
))1(2
11(2
)(),()(),(nnn
d
nnnd
sysgapFPIGgapGn
gap
gap
dTdTndS λλλλη (10)
∫−⋅⋅
+⋅⋅
+⋅⋅−⋅⋅
=
))1(2
11(2
))1(2
11(2
)(),()(),(nnn
d
nnnd
sysgapFPIRgapRn
gap
gap
dTdTndS λλλλη (11)
Proc. of SPIE Vol. 7474 74741M-4

Where dgap is the FPI air gap width, n is the FPI order, the ηB(λ), ηG(λ) ja ηR(λ) are the quantum efficiences of the B-, G- ja R-pixels at the wavelength λ, TFPI(λ, dgap) is the spectral transmission of the FPI and Tsys(λ) is the combined spectral transmission of the optical system without the FPI. The calibration data of the hyperspectral imager consists of the FPI air gap values and of the responses SBn, SBn+1, SBn+2, SGn, SGn+1, SGn+2, SRn, SRn+1 ja SRn+2 of of the B-, G- and R-pixels at the air gap value. The goal in a hyperspectral measurement is to determine the spectral irradiance of the target at the selected wavelength range and at the specified spectral sampling interval and resolution. This can be accomplished by measuring the RGB image data at the air gap value range and intervals derived from the spectral range and sampling requirements. For a selected air gap value the signals of the B-, G- and R-pixels SBm, SGm and SRm are given by Eqs. 4 – 6. The measured signals at the three narrow wavelength bands corresponding the three transmitted orders of the FPI can be calculated using the responses SBn, SBn+1, SBn+2, SGn, SGn+1, SGn+2, SRn, SRn+1 and SRn+2 (Eqs. 9 - 11) derived in the calibration.
⎥⎥⎥
⎦
⎤
⎢⎢⎢
⎣
⎡⋅⎥⎥⎥
⎦
⎤
⎢⎢⎢
⎣
⎡=
⎥⎥⎥
⎦
⎤
⎢⎢⎢
⎣
⎡
+
+
++
++
++
n
n
n
RnRnRn
GnGnGn
BnBnBn
Rm
Gm
Bm
SSS
SSSSSSSSS
SSS
1
2
12
12
12
(12)
Where Sn+2, Sn+1 and Sn are the unkown spectral irradiances at the pass bands of the FPI orders n+2, n+1 and n. The irradiances Sn+2, Sn+1 and Sn can now be solved by
⎥⎥⎥
⎦
⎤
⎢⎢⎢
⎣
⎡⋅
⎥⎥⎥
⎦
⎤
⎢⎢⎢
⎣
⎡=
⎥⎥⎥
⎦
⎤
⎢⎢⎢
⎣
⎡−
++
++
++
+
+
Rm
Gm
Bm
RnRnRn
GnGnGn
BnBnBn
n
n
n
SSS
SSSSSSSSS
SSS 1
12
12
12
1
2
(13)
The concept described above is novel and a patent for it has been granted in Finland15,16. An example for a multispectral sensor having three different types of pixels has presented but the principle can be applied for any number of pixels differing in spectral response. Recently multispectral image sensors for other than standard color camera applications have been developed17,18 by Ocean Optics Inc. and Silios Technologies. This enables to use the present concept also in UV and IR spectral ranges.
2.2. Instrument requirements, modelling and simulations results The major goal of the compact hyperspectral imager development was to develop medium spectral resolution (3…10 nm @ FWHM) and at least VGA (640 x 480 pixels) spatial resolution instrument first for the visible and Very Near Infra Red (VNIR) spectral range (400 – 1100 nm). The goal instrument requirements are summarized in Table 1.
Table 1 Goal instrument requirements for the FPI and multispectral image sensor based hyperspectral imager Parameter Requirement Remarks Total operational spectral range 400 – 1100 nm Limited by the FPI mirror coatings and detector
availability Spectral range in the visible 400 – 700 nm Determined with low and high pass filters Spectral range in Vis&VNIR 500 – 900 nm Used in many forestry, agriculture and natural water
resources applications Spectral resolution < 10 nm @ FWHM Spectral sampling step size < 1 nm The wavelengths for the hyperspectral image should
be selectable at 1 nm steps Stability of the wavelength scale < 0.1 nm Over ambient temperature variations and time
Proc. of SPIE Vol. 7474 74741M-5
Time required to change the wavelength band
< 2 ms The time required to set the FPI air gap to a new value
F-number of the optics < 4.0 Angular field of view of the optics > 20° in vertical dir.
> 30° in horiz. dir.
Weight of the whole instrument < 350 g In the UAV applications the instrument system must contain the image data memory and battery
Average power consumption < 3 W The imager must operate at least 30 minutes onboard an UAV
Maximum envelope without objective
< 110 mm x 75 mm x 55 mm
The maximum envelope is determined by the available space in light weight UAVs
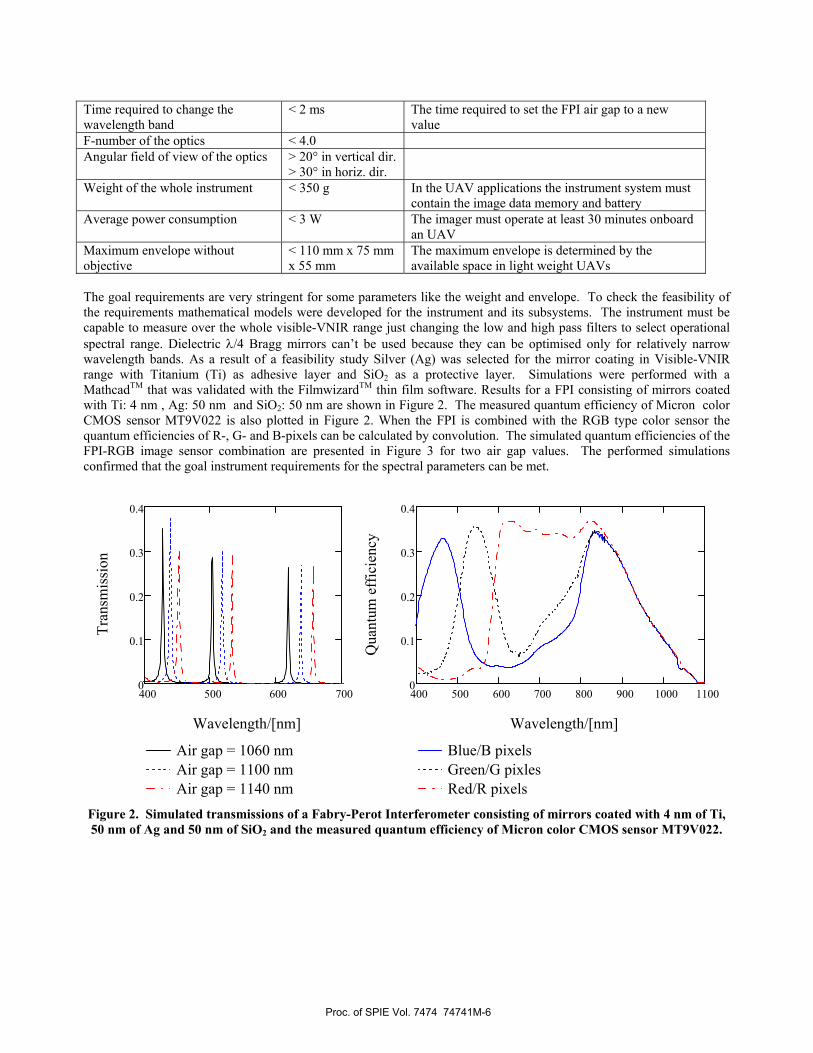
The goal requirements are very stringent for some parameters like the weight and envelope. To check the feasibility of the requirements mathematical models were developed for the instrument and its subsystems. The instrument must be capable to measure over the whole visible-VNIR range just changing the low and high pass filters to select operational spectral range. Dielectric λ/4 Bragg mirrors can’t be used because they can be optimised only for relatively narrow wavelength bands. As a result of a feasibility study Silver (Ag) was selected for the mirror coating in Visible-VNIR range with Titanium (Ti) as adhesive layer and SiO2 as a protective layer. Simulations were performed with a MathcadTM that was validated with the FilmwizardTM thin film software. Results for a FPI consisting of mirrors coated with Ti: 4 nm , Ag: 50 nm and SiO2: 50 nm are shown in Figure 2. The measured quantum efficiency of Micron color CMOS sensor MT9V022 is also plotted in Figure 2. When the FPI is combined with the RGB type color sensor the quantum efficiencies of R-, G- and B-pixels can be calculated by convolution. The simulated quantum efficiencies of the FPI-RGB image sensor combination are presented in Figure 3 for two air gap values. The performed simulations confirmed that the goal instrument requirements for the spectral parameters can be met.
400 500 600 7000
0.1
0.2
0.3
0.4
Air gap = 1060 nmAir gap = 1100 nmAir gap = 1140 nm
Wavelength/[nm]
Tran
smis
sion
400 500 600 700 800 900 1000 11000
0.1
0.2
0.3
0.4
Blue/B pixelsGreen/G pixlesRed/R pixels
Wavelength/[nm]
Qua
ntum
eff
icie
ncy
Figure 2. Simulated transmissions of a Fabry-Perot Interferometer consisting of mirrors coated with 4 nm of Ti, 50 nm of Ag and 50 nm of SiO2 and the measured quantum efficiency of Micron color CMOS sensor MT9V022.
Proc. of SPIE Vol. 7474 74741M-6
roM 9Up ap b922
Iw9d ud ob
9C119O
9cdfl 2!!OU
C9b9c!9UcE
CO ULO I
GCWL
woqnie !W9dG 2eu2
400 500 600 7000
0.05
0.1
B pixels at the Air gap = 680 nmG pixels at the Air gap = 680 nmR pixels at the Air gap = 680 nm
Wavelength/[nm]
Qua
ntum
eff
icie
ncy
400 500 600 7000
0.05
0.1
B pixels at the Air gap = 1100 nmG pixels at the Air gap = 1100 nmR pixels at the Air gap = 1100 nm
Wavelength/[nm]
Qua
ntum
eff
icie
ncy
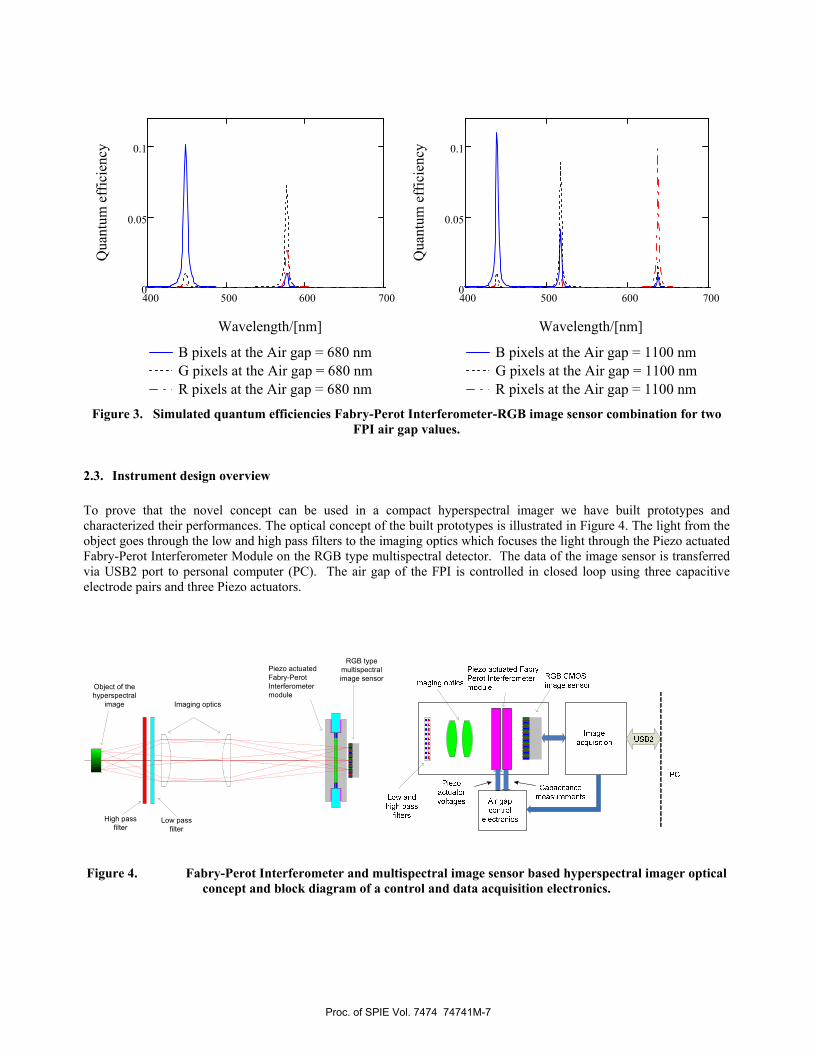
Figure 3. Simulated quantum efficiencies Fabry-Perot Interferometer-RGB image sensor combination for two
FPI air gap values.
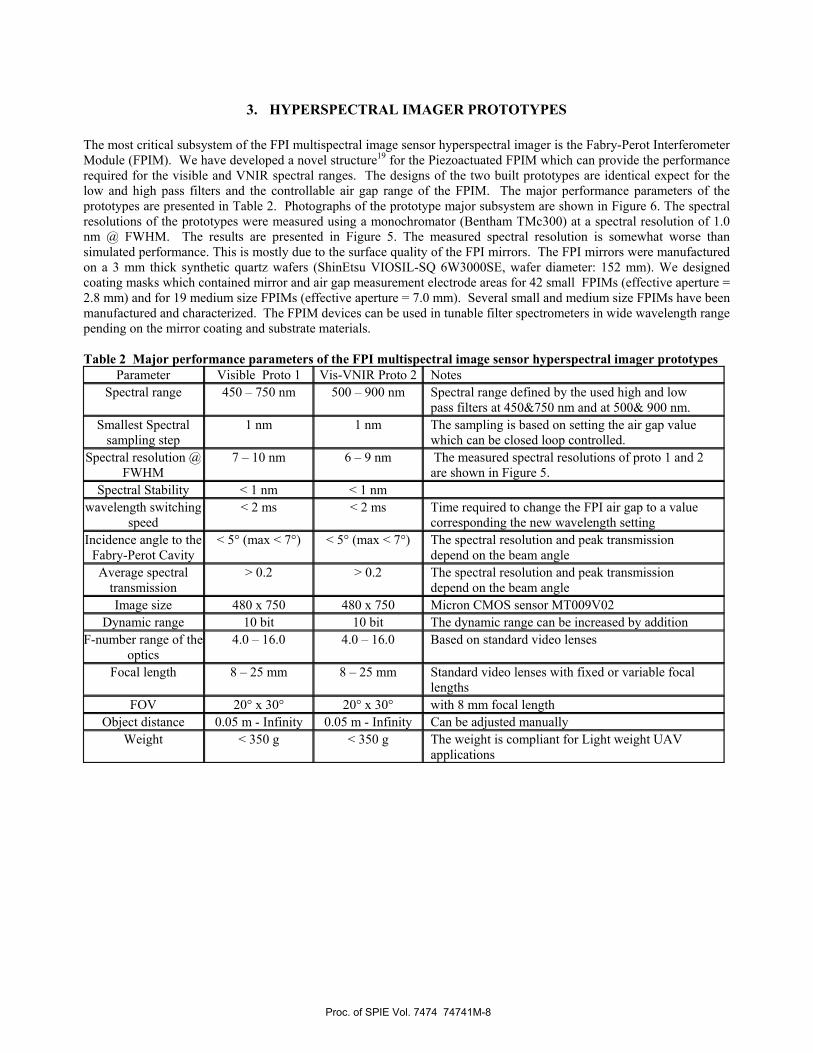
2.3. Instrument design overview To prove that the novel concept can be used in a compact hyperspectral imager we have built prototypes and characterized their performances. The optical concept of the built prototypes is illustrated in Figure 4. The light from the object goes through the low and high pass filters to the imaging optics which focuses the light through the Piezo actuated Fabry-Perot Interferometer Module on the RGB type multispectral detector. The data of the image sensor is transferred via USB2 port to personal computer (PC). The air gap of the FPI is controlled in closed loop using three capacitive electrode pairs and three Piezo actuators.
High pass filter
Object of the hyperspectral
image
RGB type multispectral image sensor
Imaging optics
Piezo actuatedFabry-PerotInterferometer module
Low pass filter
Figure 4. Fabry-Perot Interferometer and multispectral image sensor based hyperspectral imager optical
concept and block diagram of a control and data acquisition electronics.
Proc. of SPIE Vol. 7474 74741M-7
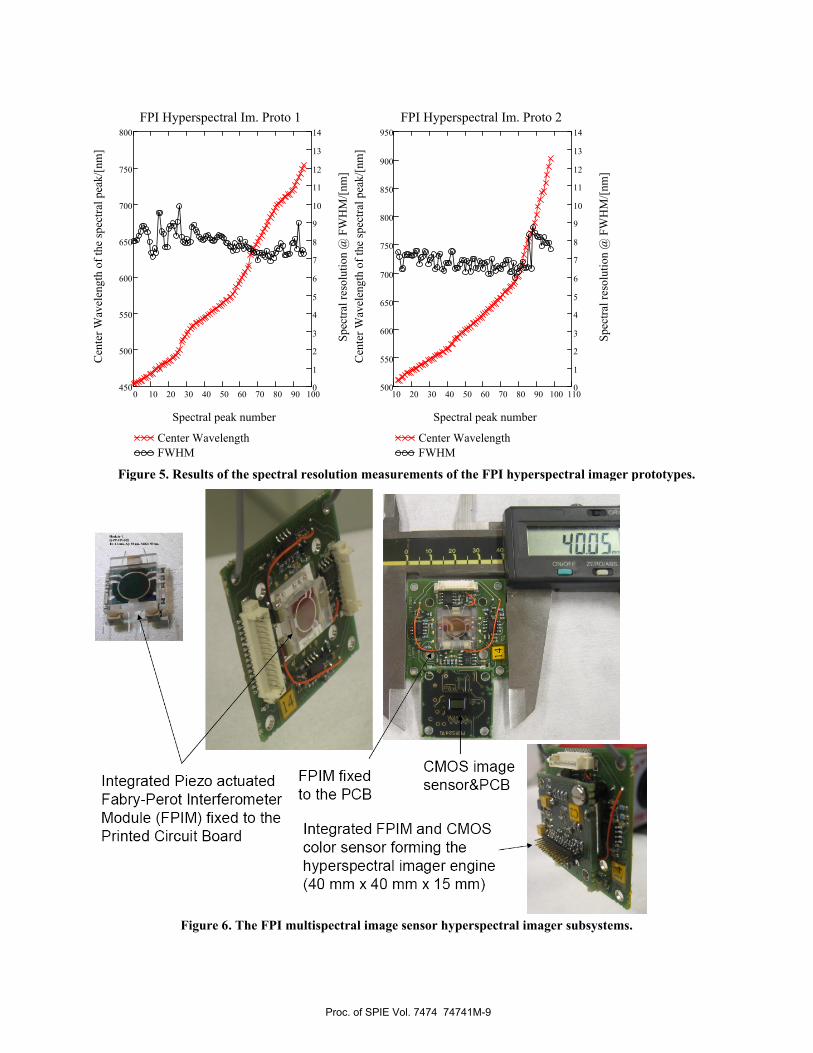
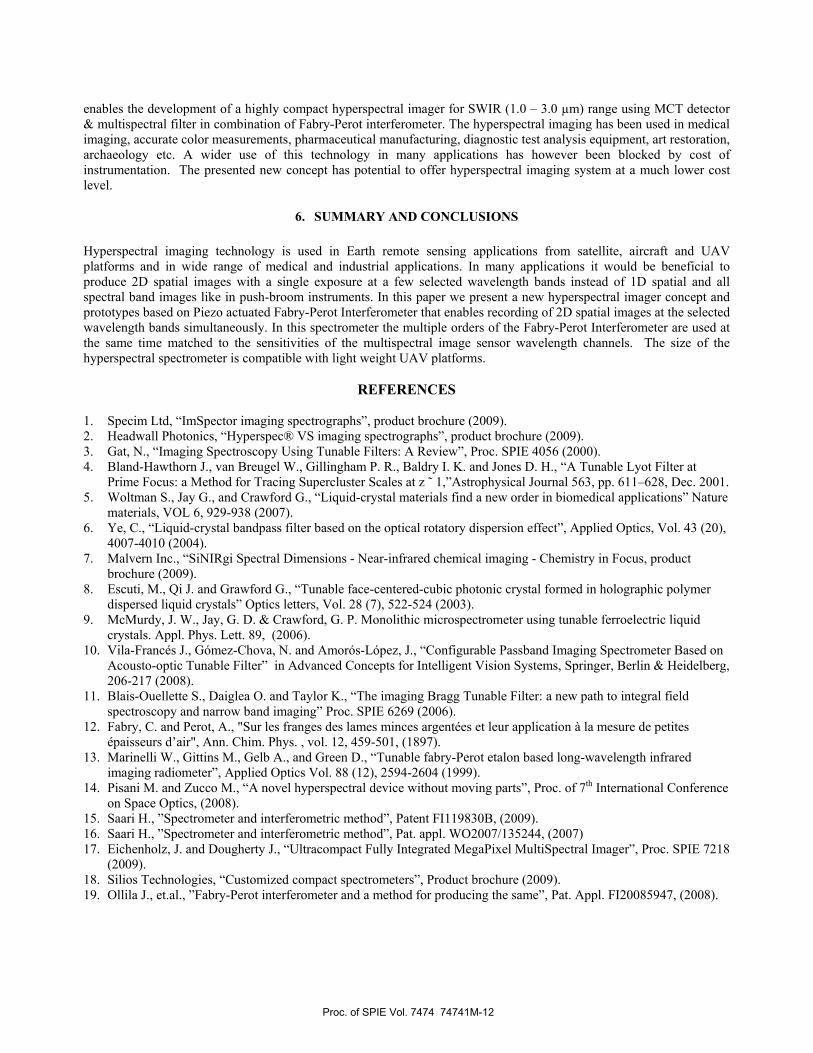
3. HYPERSPECTRAL IMAGER PROTOTYPES The most critical subsystem of the FPI multispectral image sensor hyperspectral imager is the Fabry-Perot Interferometer Module (FPIM). We have developed a novel structure19 for the Piezoactuated FPIM which can provide the performance required for the visible and VNIR spectral ranges. The designs of the two built prototypes are identical expect for the low and high pass filters and the controllable air gap range of the FPIM. The major performance parameters of the prototypes are presented in Table 2. Photographs of the prototype major subsystem are shown in Figure 6. The spectral resolutions of the prototypes were measured using a monochromator (Bentham TMc300) at a spectral resolution of 1.0 nm @ FWHM. The results are presented in Figure 5. The measured spectral resolution is somewhat worse than simulated performance. This is mostly due to the surface quality of the FPI mirrors. The FPI mirrors were manufactured on a 3 mm thick synthetic quartz wafers (ShinEtsu VIOSIL-SQ 6W3000SE, wafer diameter: 152 mm). We designed coating masks which contained mirror and air gap measurement electrode areas for 42 small FPIMs (effective aperture = 2.8 mm) and for 19 medium size FPIMs (effective aperture = 7.0 mm). Several small and medium size FPIMs have been manufactured and characterized. The FPIM devices can be used in tunable filter spectrometers in wide wavelength range pending on the mirror coating and substrate materials. Table 2 Major performance parameters of the FPI multispectral image sensor hyperspectral imager prototypes
Parameter Visible Proto 1 Vis-VNIR Proto 2 Notes Spectral range 450 – 750 nm 500 – 900 nm Spectral range defined by the used high and low
pass filters at 450&750 nm and at 500& 900 nm. Smallest Spectral
sampling step 1 nm 1 nm The sampling is based on setting the air gap value
which can be closed loop controlled. Spectral resolution @
FWHM 7 – 10 nm 6 – 9 nm The measured spectral resolutions of proto 1 and 2
are shown in Figure 5. Spectral Stability < 1 nm < 1 nm
wavelength switching speed
< 2 ms < 2 ms Time required to change the FPI air gap to a value corresponding the new wavelength setting
Incidence angle to the Fabry-Perot Cavity
< 5° (max < 7°) < 5° (max < 7°) The spectral resolution and peak transmission depend on the beam angle
Average spectral transmission
> 0.2 > 0.2 The spectral resolution and peak transmission depend on the beam angle
Image size 480 x 750 480 x 750 Micron CMOS sensor MT009V02 Dynamic range 10 bit 10 bit The dynamic range can be increased by addition
F-number range of the optics
4.0 – 16.0 4.0 – 16.0 Based on standard video lenses
Focal length 8 – 25 mm 8 – 25 mm Standard video lenses with fixed or variable focal lengths
FOV 20° x 30° 20° x 30° with 8 mm focal length Object distance 0.05 m - Infinity 0.05 m - Infinity Can be adjusted manually
Weight < 350 g < 350 g The weight is compliant for Light weight UAV applications
Proc. of SPIE Vol. 7474 74741M-8
0 10 20 30 40 50 60 70 80 90 100450
500
550
600
650
700
750
800
0
1
2
3
4
5
6
7
8
9
10
11
12
13
14
Center WavelengthFWHM
FPI Hyperspectral Im. Proto 1
Spectral peak number
Cen
ter W
avel
engt
h of
the
spec
tral p
eak/
[nm
]
Spec
tral r
esol
utio
n @
FW
HM
/[nm
]
10 20 30 40 50 60 70 80 90 100 110500
550
600
650
700
750
800
850
900
950
0
1
2
3
4
5
6
7
8
9
10
11
12
13
14
Center WavelengthFWHM
FPI Hyperspectral Im. Proto 2
Spectral peak number
Cen
ter W
avel
engt
h of
the
spec
tral p
eak/
[nm
]
Spec
tral r
esol
utio
n @
FW
HM
/[nm
]
Figure 5. Results of the spectral resolution measurements of the FPI hyperspectral imager prototypes.
Figure 6 . The FPI multispectral image sensor hyperspectral imager subsystems.
Proc. of SPIE Vol. 7474 74741M-9

BG9U2b1 116
A!21P
ybeLfi
16U2
EP' bGLOl
2GU2OL
IOM H !a
4. CALIBRATION AND TARGET MEASUREMENT RESULTS Our new type of hyperspectral imager requires a calibration as explained in Chapter 2. The calibration was performed for the both prototypes with a setup shown in Figure 7. The first step in the calibration was the measurement of the spectral photon flux focussed from the output slit of the monochromator to the system to be calibrated. This was performed using a calibrated absolute radiometer (UDT QED-200). The signals of the absolute radiometer and the reference detector were recorded for wavelength ranges 400 – 800 nm (Proto 1) and 450 – 950 (Proto 2) at 1 nm intervals and at a resolution of 1 @ FWHM. When we know the spectral photon flux for each wavelength it is possible to determine the calibration of the responses SBn, SBn+1, SBn+2, SGn, SGn+1, SGn+2, SRn, SRn+1 ja SRn+2 as they are defined in Eqs. 9, 10 and 11. These responses were determined for each selected air gap value. Therefore, for each selected air gap value the images of the RGB image sensor were recorded for the same spectral range and at the same spectral step and slit width as in the calibration of the spectral photon flux. As a result of this measurement it is possible determine for hyperspectral imager engine consisting of the low and high pass filters, of the FPIM and of the CMOS RGB image sensor the R-, G- and B-pixel spectral response curves, The simulated pixel response response curves are shown in Figure 3. Examples of the measured R-, G- and B-pixel spectral response curves are shown in Figure 8. The coefficients defined in Eqs. 9, 10 and 11 can be calculated from these sensitivity curves as an integral over the spectral peaks. We have studied the effect of the integration interval and we have found that 8 times the FWHM value of the spectral peak can be used in Eqs. 9, 10 and 11 to provide valid coefficients for the data retrieval.
Figure 7. Calibration setup of the FPI multispectral image sensor hyperspectral imager
500 600 700 800 900
1 10 3−×
2 10 3−×
3 10 3−×
4 10 3−×
5 10 3−×
Blue pixel response, air gap = 970 nmGreen pixel responseRed pixel response
Wavelength/[nm]
Spec
tral R
espo
nse/
[DU
/pho
tons
]
500 600 700 800 900
1 10 3−×
2 10 3−×
3 10 3−×
4 10 3−×
5 10 3−×
Blue pixel response, air gap = 1400 nmGreen pixel responseRed pixel response
Wavelength/[nm]
Spec
tral R
espo
nse/
[DU
/pho
tons
]
Figure 8. The measured spectral response curves of the R-, G-, and B-pixels of the FPI hyperspectral imager proto 2 for air gap values of 970 and 1400 nm.
Proc. of SPIE Vol. 7474 74741M-10

The Prototypes have been calibrated and used for target measurements. A typical result of spectral measurements is presented in Figure 9. The FPI hyperspectral imager Proto 2 result is well in line with the reference spectrometer result.
700 8000
0.2
0.4
0.6
0.8
Ref meas. @ 9 nm FWHMFPI Hypers. Imager result
Schott BG20 filter transmission
Wavelength/[nm]
Tran
smis
sion
700 8000
0.2
0.4
0.6
0.8
Ref meas. @ 9 nm FWHMFPI Hypers. Imager result
Schott BG36 filter transmission
Wavelength/[nm]Tr
ansm
issi
on
Figure 9 . Comparison of the transmission spectra of two colored glass filters measured with Ocean Optics HR-4000 commercial spectrometer convolved to a resolution of 9 nm @ FWHM and the spectra measured with the
new FPI Hyperspectral Imager Proto 2. The spectral data of Proto 2 was averaged over a 105 x 65 pixel subimage.
RGB raw image of the FPI Hyperspectral imager taken at Fabry-Perot Interferometer airgap value of 1130 nm.Spectra of a pine tree is plotted on the right.
Figure 10. Typical result of FPI Hyperspectral Imager Proto 1 data cube. The user interface software provides tools to examine the spectrum of each point in the hyperspectral image by placing the cursor on it.
5. APPLICATIONS In remote sensing the use of hyperspectral imaging on light weight UAV platforms has not been possible due to the payload mass limitations. The prototypes can converted to light weight UAV compatible devices with total mass of less than 350 g. We have a UAV compatible instrument available for test flights in the autumn 2009. Remote sensing applications that can benefit from the new UAV instrument include precision agriculture, forestry, natural water monitoring applications. In space a need of a compact hyperspectral imager has been also been identified. New technologies17,18 to manufacture RGB-type pixelized multispectral image sensors for wide spectral range including IR
Proc. of SPIE Vol. 7474 74741M-11
enables the development of a highly compact hyperspectral imager for SWIR (1.0 – 3.0 µm) range using MCT detector & multispectral filter in combination of Fabry-Perot interferometer. The hyperspectral imaging has been used in medical imaging, accurate color measurements, pharmaceutical manufacturing, diagnostic test analysis equipment, art restoration, archaeology etc. A wider use of this technology in many applications has however been blocked by cost of instrumentation. The presented new concept has potential to offer hyperspectral imaging system at a much lower cost level.
6. SUMMARY AND CONCLUSIONS Hyperspectral imaging technology is used in Earth remote sensing applications from satellite, aircraft and UAV platforms and in wide range of medical and industrial applications. In many applications it would be beneficial to produce 2D spatial images with a single exposure at a few selected wavelength bands instead of 1D spatial and all spectral band images like in push-broom instruments. In this paper we present a new hyperspectral imager concept and prototypes based on Piezo actuated Fabry-Perot Interferometer that enables recording of 2D spatial images at the selected wavelength bands simultaneously. In this spectrometer the multiple orders of the Fabry-Perot Interferometer are used at the same time matched to the sensitivities of the multispectral image sensor wavelength channels. The size of the hyperspectral spectrometer is compatible with light weight UAV platforms.
REFERENCES 1. Specim Ltd, “ImSpector imaging spectrographs”, product brochure (2009). 2. Headwall Photonics, “Hyperspec® VS imaging spectrographs”, product brochure (2009). 3. Gat, N., “Imaging Spectroscopy Using Tunable Filters: A Review”, Proc. SPIE 4056 (2000). 4. Bland-Hawthorn J., van Breugel W., Gillingham P. R., Baldry I. K. and Jones D. H., “A Tunable Lyot Filter at
Prime Focus: a Method for Tracing Supercluster Scales at z ˜ 1,”Astrophysical Journal 563, pp. 611–628, Dec. 2001. 5. Woltman S., Jay G., and Crawford G., “Liquid-crystal materials find a new order in biomedical applications” Nature
materials, VOL 6, 929-938 (2007). 6. Ye, C., “Liquid-crystal bandpass filter based on the optical rotatory dispersion effect”, Applied Optics, Vol. 43 (20),
4007-4010 (2004). 7. Malvern Inc., “SiNIRgi Spectral Dimensions - Near-infrared chemical imaging - Chemistry in Focus, product
brochure (2009). 8. Escuti, M., Qi J. and Grawford G., “Tunable face-centered-cubic photonic crystal formed in holographic polymer
dispersed liquid crystals” Optics letters, Vol. 28 (7), 522-524 (2003). 9. McMurdy, J. W., Jay, G. D. & Crawford, G. P. Monolithic microspectrometer using tunable ferroelectric liquid
crystals. Appl. Phys. Lett. 89, (2006). 10. Vila-Francés J., Gómez-Chova, N. and Amorós-López, J., “Configurable Passband Imaging Spectrometer Based on
Acousto-optic Tunable Filter” in Advanced Concepts for Intelligent Vision Systems, Springer, Berlin & Heidelberg, 206-217 (2008).
11. Blais-Ouellette S., Daiglea O. and Taylor K., “The imaging Bragg Tunable Filter: a new path to integral field spectroscopy and narrow band imaging” Proc. SPIE 6269 (2006).
12. Fabry, C. and Perot, A., "Sur les franges des lames minces argentées et leur application à la mesure de petites épaisseurs d’air", Ann. Chim. Phys. , vol. 12, 459-501, (1897).
13. Marinelli W., Gittins M., Gelb A., and Green D., “Tunable fabry-Perot etalon based long-wavelength infrared imaging radiometer”, Applied Optics Vol. 88 (12), 2594-2604 (1999).
14. Pisani M. and Zucco M., “A novel hyperspectral device without moving parts”, Proc. of 7th International Conference on Space Optics, (2008).
15. Saari H., ”Spectrometer and interferometric method”, Patent FI119830B, (2009). 16. Saari H., ”Spectrometer and interferometric method”, Pat. appl. WO2007/135244, (2007) 17. Eichenholz, J. and Dougherty J., “Ultracompact Fully Integrated MegaPixel MultiSpectral Imager”, Proc. SPIE 7218
(2009). 18. Silios Technologies, “Customized compact spectrometers”, Product brochure (2009). 19. Ollila J., et.al., ”Fabry-Perot interferometer and a method for producing the same”, Pat. Appl. FI20085947, (2008).
Proc. of SPIE Vol. 7474 74741M-12
Related Documents