Trends in organic pollutants and lipids in juvenile Snake River spring Chinook salmon with different outmigrating histories through the Lower Snake and Middle Columbia Rivers Mary R. Arkoosh a, ⁎, Stacy Strickland a , Ahna Van Gaest a , Gina M. Ylitalo b , Lyndal Johnson b , Gladys K. Yanagida b , Tracy K. Collier c , Joseph P. Dietrich a a Environmental Conservation Division, Northwest Fisheries Science Center, National Marine Fisheries Service, National Oceanic and Atmospheric Administration, 2032 South East OSU Drive, Newport, OR 97365, United States b Environmental Conservation Division, Northwest Fisheries Science Center, National Marine Fisheries Service, National Oceanic and Atmospheric Administration, 2725 Montlake Boulevard East, Seattle, WA 98112, United States c Oceans and Human Health, National Oceanic and Atmospheric Administration, 1315 East–west Highway, Silver Spring, MD 20910, United States abstract article info Article history: Received 11 May 2011 Received in revised form 11 August 2011 Accepted 16 August 2011 Available online 19 September 2011 Keywords: Federal Columbia River Power System Chinook Lipids Contaminants Persistent organic pollutants (PCBs and DDTs) PAHs A three-year field study was conducted from 2006 to 2008 to monitor the spatial and temporal trends of or- ganic pollutants in migrating juvenile Snake River spring Chinook salmon (Oncorhynchus tshawytscha) sam- pled from the Lower Snake and Middle Columbia River Basins. Specifically, hatchery-reared juvenile salmon were monitored as they navigated the Federal Columbia River Power System (FCRPS) by either transport barge (Barged) or remained in the river (In-River) from Lower Granite Dam to a terminal collection dam, ei- ther John Day Dam or Bonneville Dam. Levels of polychlorinated biphenyls (PCBs), polybrominated diphenyl ethers (PBDEs), and organochlorine (OC) pesticides were detected in the bodies of both In-River and Barged salmon during the 2006, 2007 and 2008 outmigrating season. At the terminal dam, In-River fish had greater concentrations of persistent organic pollutants POPs than Barged salmon. Of the POPs detected, dichlorodi- phenyltrichloroethanes (DDTs) were found at the greatest concentrations in the salmon bodies. These elevat- ed lipid-normalized concentrations in the In-River fish were due to lipid depletion in all years as well as increased exposure to POPs in some years as indicated by an increase in wet weight contaminant concentra- tions. Salmon were also exposed to polycyclic aromatic hydrocarbons (PAHs) as indicated by the phenan- threne (PHN) signal for biliary fluorescent aromatic compounds (FACs) at the hatcheries or prior to Lower Granite Dam. There were detectable levels of biliary FACs as fish migrated downstream or were barged to the terminal dam. Therefore, the potential exists for these organic pollutants and lipid levels to cause adverse effects and should be included as one of the variables to consider when examining the effects of the FCRPS on threatened and endangered juvenile salmon. Published by Elsevier B.V. 1. Introduction Twenty-eight species of Pacific salmon and steelhead in Washing- ton, Oregon, Idaho and California are listed as either threatened or en- dangered (NMFS, 2011). The Columbia River Basin provides critical habitat for 13 of these 28 evolutionarily significant units. A number of factors present in the Columbia River Basin have the potential to influ- ence the survival of outmigrating salmonid populations and include the loss and alteration of critical habitat, predation by birds, piscivorous fishes, and mammals as well as exposure to contaminants (Fresh et al., 2005). Exposure to sublethal concentrations of contaminants found in the Columbia River Basin such as persistent organic pollutants (POPs), polycyclic aromatic hydrocarbons (PAHs), and organophos- phate and carbamate insecticides can adversely affect the health of ju- venile salmon by decreasing their ability to respond to pathogens (Arkoosh et al., 2001; Arkoosh et al., 2010; Bravo et al., 2011), suppres- sing their immune system (Arkoosh et al., 1994; Misumi et al., 2005), interfering with acetylcholinesterase activity causing neurotoxicity (Laetz et al., 2009), and reducing growth (Meador et al., 2006). Besides factors such as the presence of contaminants, physical habitat loss and alteration, and predation, the Federal Columbia River Power System (FCRPS) is another variable affecting salmon health in the Columbia River Basin. The FCRPS has altered flow re- gimes and caused habitat change in the Columbia Basin. Juvenile salmon from the Snake River Basin outmigrate past as many as 8 dams. A number of mitigation actions have been undertaken in order to reduce both the direct (manifested within the hydropower Science of the Total Environment 409 (2011) 5086–5100 ⁎ Corresponding author at: Newport Research Station, 2032 South East OSU Drive, Newport, OR 97365-5275, United States. Tel.: +1 541 867 0327; fax: +1 541 867 0389. E-mail address: [email protected] (M.R. Arkoosh). 0048-9697/$ – see front matter. Published by Elsevier B.V. doi:10.1016/j.scitotenv.2011.08.031 Contents lists available at SciVerse ScienceDirect Science of the Total Environment journal homepage: www.elsevier.com/locate/scitotenv

Welcome message from author
This document is posted to help you gain knowledge. Please leave a comment to let me know what you think about it! Share it to your friends and learn new things together.
Transcript

Science of the Total Environment 409 (2011) 5086–5100
Contents lists available at SciVerse ScienceDirect
Science of the Total Environment
j ourna l homepage: www.e lsev ie r .com/ locate /sc i totenv
Trends in organic pollutants and lipids in juvenile Snake River spring Chinook salmonwith different outmigrating histories through the Lower Snake and MiddleColumbia Rivers
Mary R. Arkoosh a,⁎, Stacy Strickland a, Ahna Van Gaest a, Gina M. Ylitalo b, Lyndal Johnson b,Gladys K. Yanagida b, Tracy K. Collier c, Joseph P. Dietrich a
a Environmental Conservation Division, Northwest Fisheries Science Center, National Marine Fisheries Service, National Oceanic and Atmospheric Administration,2032 South East OSU Drive, Newport, OR 97365, United Statesb Environmental Conservation Division, Northwest Fisheries Science Center, National Marine Fisheries Service, National Oceanic and Atmospheric Administration,2725 Montlake Boulevard East, Seattle, WA 98112, United Statesc Oceans and Human Health, National Oceanic and Atmospheric Administration, 1315 East–west Highway, Silver Spring, MD 20910, United States
⁎ Corresponding author at: Newport Research StatioNewport, OR 97365-5275, United States. Tel.: +1 5410389.
E-mail address: [email protected] (M.R. Arko
0048-9697/$ – see front matter. Published by Elsevier Bdoi:10.1016/j.scitotenv.2011.08.031
a b s t r a c t
a r t i c l e i n f oArticle history:Received 11 May 2011Received in revised form 11 August 2011Accepted 16 August 2011Available online 19 September 2011
Keywords:Federal Columbia River Power SystemChinookLipidsContaminantsPersistent organic pollutants (PCBs and DDTs)PAHs
A three-year field study was conducted from 2006 to 2008 to monitor the spatial and temporal trends of or-ganic pollutants in migrating juvenile Snake River spring Chinook salmon (Oncorhynchus tshawytscha) sam-pled from the Lower Snake and Middle Columbia River Basins. Specifically, hatchery-reared juvenile salmonwere monitored as they navigated the Federal Columbia River Power System (FCRPS) by either transportbarge (Barged) or remained in the river (In-River) from Lower Granite Dam to a terminal collection dam, ei-ther John Day Dam or Bonneville Dam. Levels of polychlorinated biphenyls (PCBs), polybrominated diphenylethers (PBDEs), and organochlorine (OC) pesticides were detected in the bodies of both In-River and Bargedsalmon during the 2006, 2007 and 2008 outmigrating season. At the terminal dam, In-River fish had greaterconcentrations of persistent organic pollutants POPs than Barged salmon. Of the POPs detected, dichlorodi-phenyltrichloroethanes (DDTs) were found at the greatest concentrations in the salmon bodies. These elevat-ed lipid-normalized concentrations in the In-River fish were due to lipid depletion in all years as well asincreased exposure to POPs in some years as indicated by an increase in wet weight contaminant concentra-tions. Salmon were also exposed to polycyclic aromatic hydrocarbons (PAHs) as indicated by the phenan-threne (PHN) signal for biliary fluorescent aromatic compounds (FACs) at the hatcheries or prior to LowerGranite Dam. There were detectable levels of biliary FACs as fish migrated downstream or were barged tothe terminal dam. Therefore, the potential exists for these organic pollutants and lipid levels to cause adverseeffects and should be included as one of the variables to consider when examining the effects of the FCRPS onthreatened and endangered juvenile salmon.
n, 2032 South East OSU Drive,867 0327; fax: +1 541 867
osh).
.V.
Published by Elsevier B.V.
1. Introduction
Twenty-eight species of Pacific salmon and steelhead in Washing-ton, Oregon, Idaho and California are listed as either threatened or en-dangered (NMFS, 2011). The Columbia River Basin provides criticalhabitat for 13 of these 28 evolutionarily significant units. A number offactors present in the Columbia River Basin have the potential to influ-ence the survival of outmigrating salmonid populations and include theloss and alteration of critical habitat, predation by birds, piscivorousfishes, and mammals as well as exposure to contaminants (Fresh etal., 2005). Exposure to sublethal concentrations of contaminants
found in the Columbia River Basin such as persistent organic pollutants(POPs), polycyclic aromatic hydrocarbons (PAHs), and organophos-phate and carbamate insecticides can adversely affect the health of ju-venile salmon by decreasing their ability to respond to pathogens(Arkoosh et al., 2001; Arkoosh et al., 2010; Bravo et al., 2011), suppres-sing their immune system (Arkoosh et al., 1994; Misumi et al., 2005),interfering with acetylcholinesterase activity causing neurotoxicity(Laetz et al., 2009), and reducing growth (Meador et al., 2006).
Besides factors such as the presence of contaminants, physicalhabitat loss and alteration, and predation, the Federal ColumbiaRiver Power System (FCRPS) is another variable affecting salmonhealth in the Columbia River Basin. The FCRPS has altered flow re-gimes and caused habitat change in the Columbia Basin. Juvenilesalmon from the Snake River Basin outmigrate past as many as8 dams. A number of mitigation actions have been undertaken inorder to reduce both the direct (manifested within the hydropower
5087M.R. Arkoosh et al. / Science of the Total Environment 409 (2011) 5086–5100
system) and indirect (manifested beyond the system) effects of thedams on salmon survival. For example, juvenile fish bypass facilitieshave been constructed at all of the FCRPS dams except at The DallesDam (Matthews et al., 1977) to help the juvenile salmon avoid pas-sage through dam turbines. Juvenile salmon are also transportedthrough the dams via barges because the reservoirs behind thedams have increased their travel time through the river. Currently,travel time of fish remaining in the river to migrate through the hy-dropower system is estimated to be between 15 and 40 days. In con-trast, when only 4 mainstem dams were in place, the travel time tomigrate through the river was between 10 and 20 days. It takes ap-proximately 36 h to barge fish through the hydropower system tobelow Bonneville Dam (Ferguson et al., 2005).
While barging has some clear benefits for juvenile salmon, it alsohas some disadvantages. For example, yearling spring Chinook salm-on (Oncorhynchus tshawytscha) that are barged have greater patho-gen prevalences than salmon that remain in the river to navigatethe dams (Van Gaest et al., 2011). Contaminant exposure is anotherfactor that could be influenced by barging. The influence of bargingon contaminant exposure and resulting levels in juvenile salmon, rel-ative to salmon that remain in-river to navigate the FCRPS, is cur-rently unknown. Ultimately, factors such as contaminant exposureand the FCRPS that act on early-life stages of outmigrating salmoncan influence population viability (Kareiva et al., 2000; Loge et al.,2005).
Previous researchers have examined POP levels in juvenile fallChinook salmon at their natal hatcheries along the Columbia River,as well as in both wild and hatchery-reared Chinook from severalsites in the lower Columbia River and estuary (LCR&E). The LCR&Eis defined as the reach from Bonneville Dam downstream to themouth of the Pacific Ocean (EPA, 2009). The sites sampled for salmonin these studies spanned the length of the LCR&E, from Warrendale,located just downstream from the Bonneville Dam, to Point Adams lo-cated at the mouth of the river. The researchers found levels of poly-brominated diphenyl ethers (PBDEs), polychlorinated biphenyls(PCBs), and dichlorodiphenyltrichloroethanes (DDTs) in fish fromthe LCR&E (Johnson et al., 2007; LCREP, 2007; Sloan et al., 2010;Johnson et al., 2011) that may cause adverse effects. However, salmonsampled at their natal hatcheries generally had lower levels of con-taminants than those associated with adverse health effects in salmo-nids (Johnson et al., 2009). Their results suggest that for both wildand hatchery-reared juvenile salmon, contaminant accumulation oc-curs primarily as a result of in-river exposure. In comparison to theLower Columbia River, very little information is available on contam-inant concentrations, in juvenile salmon from other parts ofthe Columbia Basin (EPA, 2009), and basin wide surveys are neededto evaluate patterns of contaminant accumulation and toxicity risksin listed Columbia River salmon stocks.
The objective of the current study was to assess the spatial andtemporal distribution of selected contaminants and their concentra-tions in outmigrating Snake River spring Chinook salmon from theirhatchery of origin through the Lower Snake and Middle ColumbiaRivers. While these hatchery populations may not be entirely repre-sentative of wild fish, the results of previous studies in the LowerColumbia (Johnson et al., 2007; LCREP, 2007; Johnson et al., 2011)suggest that they may be reasonable surrogates. We also examinedhow barging may influence contaminant exposure in spring Chinooksalmon relative to salmon that remain in-river during outmigration,something that was possible because these hatchery populations areintensely monitored to track their response to dam passage. The con-centrations of contaminants measured in these fish were compared tolevels known to adversely affect the health of salmonids. The percentof whole body lipids and a specific lipid class, triglycerides, were alsodetermined since they play a major role in POP concentrations, aswell as fish growth, migration, and survival (Lassiter and Hallam,1990; Tocher, 2003; Biro et al., 2004; Finstad et al., 2004). Energy
metabolism from stored fat reserves is specifically required duringoutmigration, causing a decrease in lipid levels in juvenile salmon(Beckman et al., 2000). The metabolized lipids release contaminants,making them available for toxicity by changing internal toxicokinetics(Lassiter and Hallam, 1990). Therefore, total lipids and triglyceridesare also important factors to consider when examining contaminantlevels and their potential for adverse effects in outmigrating juvenileChinook salmon.
2. Materials and methods
2.1. Hatcheries
The fish used in this study originated from three Columbia andSnake River Basin hatcheries: Rapid River Hatchery, Dworshak Na-tional Fish Hatchery (NFH), and Clearwater Hatchery (Fig. 1). Salmonfrom Rapid River Hatchery, operated by the Idaho Department of Fishand Game, were raised in earthen rearing ponds with concrete side-walls. Juvenile Chinook salmon at Rapid River Hatchery began theirmigration from the rearing ponds at will (i.e. volitional release) onMarch 17, 2006, March 15, 2007, and March 17, 2008, during the re-spective study years. Salmon from Dworshak NFH, operated by theUS Fish and Wildlife Service, were raised in concrete raceways.Dworshak NFH personnel released tagged study fish on March 27and 29 in 2006, and March 28 and 29 in 2007. Salmon from Clearwa-ter Hatchery, operated by the Idaho Department of Fish and Game,originated from outdoor raceways and three satellite facilities(Crooked River, Red River, and Powell). During March 19 to 24,2008, approximately 416,000 Chinook smolts were transportedto the Powell rearing pond and volitionally released from March 19to 28.
2.2. Geographic region
The study area encompasses the migration routes of spring Chi-nook originating from Dworshak NFH, Rapid River Hatchery, andClearwater Hatchery to Bonneville Dam (Fig. 1). From Rapid RiverHatchery, located on the Salmon River at river kilometer (SaRkm)149.7, the migration route is approximately 976 km to the PacificOcean. From Dworshak NFH, located on the Clearwater River atriver kilometer (CwRkm) 66.0, the migration route is approximately813 km to the Pacific Ocean. Clearwater Hatchery is also located onthe Clearwater River at river kilometer (CwRkm) 66.0, but the springChinook migration route is approximately 1006 km to the PacificOcean from the hatchery's release site at the Powell rearing pond (lo-cated at CwRkm 259.1). Outmigrants from the three hatcheries en-counter eight hydroelectric projects (Fig. 1): four on the lowerSnake River (SR), including Lower Granite (SRkm 173.0), LittleGoose (SRkm 113.2), Lower Monumental (SRkm 67.0), and IceHarbor (SRkm 14.8); and four on the Columbia River, includingMcNary(CRkm 470.0), John Day (CRkm 347.0), The Dalles (CRkm 308.2),and Bonneville (CRkm 234.0).
2.3. PIT-tagging
Juvenile Snake River spring Chinook salmon were collected from asubset of hatchery-reared salmon injected with passive integratedtransponder tags (PIT-tags) for the Army Corps of Engineers (WallaWalla District) and the Fish Passage Center (Portland, OR) in 2006,2007 and 2008. The PIT-tagged population of juvenile spring Chinooksalmon over the three years included: approximately 126,000 fromRapid River (62,243) and Dworshak NFH (63,871) hatcheries in2006; approximately 140,000 from Rapid River (69,865) and Dwor-shak NFH (70,102) hatcheries in 2007; and approximately 135,000from Rapid River (65,898) and Clearwater (69,116) hatcheries in

Fig. 1. Location of sampling sites for juvenile spring Chinook salmon during 2006, 2007 and 2008. GIS layers for the basins provided by U.S. Geological Survey (NAUS, 2011).
5088 M.R. Arkoosh et al. / Science of the Total Environment 409 (2011) 5086–5100
2008. Tagging was performed by BioMARK (Boise, ID) and the FishPassage Center.
2.4. Fish collection
Fish collected from the river system were grouped into experi-mental cohorts based on their outmigration history. Fig. 1 detailsthe sites where cohorts were sampled during 2006, 2007, and 2008.These experimental cohorts are identified as either ‘Barged’ or ‘In-River.’ Efforts were made to collect fish for all cohorts over the courseof their passage, Mid-April through May each year (Table 1). In 2007and 2008, pre-release juvenile spring Chinook salmon were also col-lected at the hatcheries of origin (Rapid River Hatchery in 2007 and2008, Dworshak NFH in 2007, and Clearwater Hatchery in 2008) soinitial contaminant concentrations could be monitored. These fish
Table 1Release period, migration period and sampling dates of PIT-tagged Snake River spring Chin
Location 2006
Rapid River HatcheryRelease perioda Mar 17–Apr 24Sample dates NAb
Dworshak National Fish HatcheryRelease period Mar 27–29Sample dates NA
Clearwater HatcheryRelease period NASample dates NA
Lower Granite DamMigration periodc Mar 30–Jun 1Sample dates Apr 17, 29; May 9
McNary DamMigration period NASample dates NA
John Day DamMigration period NASample dates NA
Bonneville DamMigration period Apr 18–May 27Sample dates May 9, 20, 23
BargedSample dates Apr 24, 25; May 3
a The start of volitional release.b Not applicable; samples were not collected during this period.c Completed passage of ~99% of the detected population at that dam (not just the sampl
were anesthetized with a lethal dose of tricaine methane sulphonate(MS222; Sigma-Aldrich), the fork lengths and body weights wererecorded, and samples were collected for chemical contaminant andlipid analyses, as described below.
The Chinook salmon were first sampled from the river system atLower Granite Dam, the point of divergence for fish with In-Riverand Barged outmigration histories. The fish PIT-tagged as part ofthis study were automatically separated from the outmigrant popula-tions in the juvenile bypass system with a PIT-tag separation-by-codesystem located at the dam, operated by PTAGIS (PTAGIS, 2011). Thesefish were diverted into temporary holding pens, where catch wasscanned for the presence of PIT-tags and by-catch were removedand released. Experimental fish were anesthetized with a non-lethaldose of MS222; and the fork lengths and body weights were recorded.If the fish were to be barged, they were held for a minimum recovery
ook salmon at study locations.
2007 2008
Mar 15–Apr 27 Mar 17–Apr 25Mar 15 Mar 12
Mar 28–29 NAMar 17 NA
NA Mar 19–28NA Mar 11
Mar 26–May 21 Apr 2–Jun 1Apr 26; May 2, 14 Apr 25; May 1, 6, 16
Apr 17–May 28 Apr 27–June 29May 15, 23 May 17, 23, 29
NA Apr 27–Jun 20NA May 26, 29; Jun 2
Apr 19–Jun 2 NAMay 16, 22 NA
May 7, 17 May 2, 7, 18
ed population).

5089M.R. Arkoosh et al. / Science of the Total Environment 409 (2011) 5086–5100
period of 12 h in tanks supplied with flow-through river water at anapproximate density of 0.5 to 1 fish/L prior to transport to BonnevilleDam in 1 m×1 m×1.2 m net pens suspended in barge holds. Thirty ofthe remaining fish were sacrificed to obtain samples for chemicalcontaminant and lipid analyses. The others, which were to be moni-tored in-river, were released.
Cohorts with In-River outmigration histories were subsequentlycollected downriver from Lower Granite Dam at McNary (2007,2008) and either Bonneville (2006, 2007) or John Day (2008) terminaldams, and named accordingly. As at Lower Granite dam, the fish sam-pled at McNary, John Day, and Bonneville dams were separated fromthe outmigrant population with a PIT-tag separation-by-code system(PTAGIS, 2011), weighed and measured, and sampled for chemicalcontaminant and lipid analyses. Finally, fish with Barged outmigrationhistories were collected and sampled in the same manner from thebarge net pens upon reaching Bonneville Dam. Fish within this ‘Barged’cohort shared a barge hull with other outmigrating run-at-large popu-lations (e.g., wild and hatchery steelhead and spring Chinook).
2.5. Morphometric characteristics of outmigrants
Lengths and weights were measured from each fish, and conditionfactors (CFs) were determined for each cohort of fish. The conditionfactor, which is a measure of relative robustness of both individualsand a group of fish, was calculated using the following formula(Williams, 2000):CF=100,000 W/L3; where, W is the weight of thefish in grams and L is the fish fork length (mm).
2.6. Sample collection
Composite samples containing up to four fish per hatchery werecollected for chemical contaminant and lipid analyses at up to threedifferent points in time during the outmigration period from each ofthe cohorts (Table 1). Each composite sample was partitioned into:(1) bile (for measurement of PAHmetabolites); and (2) whole bodiesfor measurement of lipids and POPs; namely DDTs, PCBs, PBDEs, andOC pesticides. Samples were placed on ice and transported immedi-ately to the Newport Research Station where they were frozen andstored at −80 °C until analyses were performed.
2.7. Analyses of POPs in whole bodies
Whole body composite samples were extracted with methylenechloride using an accelerated solvent extractor, and analyzed by gaschromatography/mass spectrometry (GC/MS) to determine levels ofPCB congeners, PBDE congeners, DDT and metabolites, and OC pesti-cides (hexachlorocyclohexanes, hexachlorobenzene, chlordanes, al-drin, dieldrin, mirex, and endosulfan I) as described by (Sloan et al.,2005). Forty-three PCB congeners were measured (IUPAC numbers17, 18, 28, 31, 33, 44, 49, 52, 66, 70, 74, 82, 87, 95, 99, 101/90, 105,110, 118, 128, 138, 149, 151, 153/132, 156, 158, 170/190, 171, 177,180, 183, 187, 191, 194, 195, 199, 205, 206, 208, 209). SummedPCBs (∑PCBs) were determined by adding these individual conge-ners. The hexachlorocyclohexanes (HCHs) measured in the fish in-cluded α-HCH, β-HCH, and γ-HCH (lindane). Summed HCHs(∑HCHs) were determined by adding these three individual HCHs.DDTs measured included p,p′-DDT, p,p′-DDE, p,p′-DDD, o,p′-DDD, o,p′-DDE and o,p′-DDT. Summed DDTs (∑DDT) were determined byadding these six individual DDTs. Chlordanes (CHLDs) measured in-cluded heptachlor, heptachlor epoxide, γ-chlordane, α-chlordane,oxychlordane, cis-nonachlor, trans-nonachlor and nonachlor III.Summed chlordanes (∑CHLDs) were determined by adding theseeight individual chlordanes.
Quality assurance criteria for POP analyses by the GC/MS methodare outlined in detail by Sloan et al. (2006) addressing: instrumentcalibration; reference materials and blanks; replicates; internal
standards recoveries; and inter-laboratory comparisons. The limitsof quantification ranged from b0.031 to b0.36 ng/g wet weight forPCB congeners, b0.27 to b0.71 ng/g wet weight for individual PBDEsand b0.11 to b0.83 ng/g wet weight for OC pesticides. The recoveriesof the surrogate standards ranged from 83% to 120%.
2.8. PAH metabolite analysis of bile
Composite bile samples were analyzed by high-performance liq-uid chromatography with fluorescence detection of PAH metabolitesas described in Krahn et al. (1988). The concentrations of fluorescentPAHs in bile were determined by using PHN as an external standardand converting the fluorescence response of bile to PHN equivalents(μg PHN equivalents/mg protein). Bile metabolites fluorescing atPHN wavelengths were considered a good indicator of exposure tovarious PAHs (both petrogenic and pyrogenic) found in urban areas(Meador et al., 2008b).
2.9. Lipid determination
Composite samples of whole bodies were analyzed for percentlipid and triglycerides by thin layer chromatography with flame ioni-zation detection as described in Ylitalo et al. (2005). To adjust for thepotential influence of lipid concentration on the toxicity of chemicalcontaminants, we normalized whole body (wet weight) contaminantconcentrations to the lipid concentration (lipid-normalized). We re-lied primarily on lipid-normalized data to evaluate potential healtheffects of toxicants on juvenile salmon. Wet weight contaminantdata were analyzed to determine if an increase in contaminant expo-sure was due to actual exposure as the fish out-migrated or due toloss of lipids. Wet weight contaminant data is also presented to facil-itate comparison with other studies.
2.10. Statistical analyses
A one-way analysis of variance (ANOVA) using the Tukey–KramerHSD (honestly significant difference) multiple comparison test (Zar,1999) was performed on lipid-normalized and wet weight contami-nant concentrations. Below-limit-of-quantification values wereassigned a value of zero and all contaminant concentrations werelog-transformed as follows: x′=log (x+1). Arcsine transformationwas performed on the lipid percentage data. Both of these transfor-mations allowed for a normal distribution prior to performing theANOVA. A one-way ANOVA using the Tukey–Kramer HSD multiplecomparison test was also performed on the morphometric character-istics of outmigrants. The significance level (α) was set at 0.05 in allcomparisons of mean values. The statistical software JMP© (SAS Insti-tute, Inc., Cary, NC, USA) was used to perform all analyses.
3. Results
3.1. Morphometric characteristics of outmigrants
3.1.1. Length, weight and condition factorFork length and weight measurements were obtained for each
PIT-tagged fish at the time of collection (Table 2). A comparison ofsize differences between the two hatchery populations collected atdifferent locations in the river system for fish with In-River outmigra-tion histories is presented below for each sample year. We assumedno change in size during the short outmigration period (36–44 h)from Lower Granite Dam to Bonneville Dam for fish in the Bargedcohort.
3.1.2. 2006 river outmigration sitesThe mean weight and fork length of Dworshak NFH fish increased
slightly during their in-river outmigration from Lower Granite to

Table 2Weight (mean±SD), fork length (mean±SD), condition factor (mean±SD), whole body percent total lipid (mean±SD), whole body percent triglycerides (mean±SD), and per-cent of lipids that were triglycerides in juvenile Chinook salmon collected from the FCRPS during their migration in 2006, 2007 and 2008.
Collectionyear
Collectioncohort
Fork length(mm)
Conditionfactor
Whole body Whole body % lipids that are
Hatchery Weight (g) % total lipids % triglyceridesΔ TriglyceridesΔ
2006* Lower Granite Rapid River 34.1±6.0a 139.4±8.9ab 1.11±0.08a 3.8±1.0a^ 3.4±1.0 90Dworshak 24.7±5.6d 131.6±9.8d 1.07±0.08b 3.8±1.7a 3.5±1.7 91
Bonneville Rapid River 29.9±5.5a 142.7±8.7a 1.02±0.09d 1.7±0.9ab 1.3±0.9 76Dworshak 26.5±4.5c 137.0±8.3c 1.03±0.10d 0.9±0.3b 0.2±0.2 24
Barged Rapid River 30.4±6.0a 139.4±8.9ab 1.11±0.08a 4.2±1.2a 3.7±1.2 89Dworshak 24.7±5.6d 131.6±9.8d 1.07±0.08b 2.4±0.9ab 1.9±0.8 81
2007 Hatchery Rapid River 26.3±4.1bcd 123.5±6.9f 1.39±0.13b 4.7±0.3b 4.4±0.3 93Dworshak 30.6±5.3a 126.3±8.8f 1.52±0.16a 7.0±0.7a 7.0±0.9 94
Lower Granite Rapid River 24.3±5.0d 136.5±8.5d 0.94±0.07d 1.7±0.6cd 1.2±0.7 71Dworshak 22.6±4.7e 132.5±9.4e 0.96±0.08c 2.6±0.9c 2.1±1.1 80
McNary Rapid River 24.7±4.6cd 139.9±7.8bc 0.89±0.08e 1.2cd 0.6 49Dworshak 24.6±5.0cd 139.9±9.3c 09.0±0.09e 0.7±0.1d 0.1±0.1 19
Bonneville Rapid River 26.0±4.8b 143.9±9.2a 0.87±0.07f 0.5±0.1d 0.9±0.1 18Dworshak 25.5±5.2bc 141.6±8.3b 0.89±0.08e 0.9±0.1cd 0.2±0.3 27
Barged Rapid River 24.3±5.0d 136.5±8.5d 0.94±0.07d 1.3±0.1cd 0.9±0.1 70Dworshak 22.6±4.7g 132.5±9.4h 0.96±0.08c 1.5±0.2bc 0.9±0.1 61
2008 Hatchery Rapid River 26.1±6.5e 129.1±9.5e 1.19±0.08a 5.3±0.7ab 4.6±0.7 87Clearwater 24.1±5.6e 129.7±8.8e 1.09±0.01b 6.2±1.3a 5.2±1.1 84
Lower Granite Rapid River 32.9±7.5b 148.8±9.5b 0.98±0.08c 3.5±1.0abc 2.3±0.8 67Clearwater 24.4±5.4e 138.9±9.0d 0.90±0.08e 2.6±1.4bcd 1.2±1.5 59
McNary Rapid River 31.3±5.4bc 150.2±7.5b 0.92±0.05e 2.2±0.6bcd 1.3±0.5 62Clearwater 26.7±7.8de 143.8±9.8c 0.89±0.07e 1.4±0.3cd 0.2±0.1 18
John Day Rapid River 32.3±6.1b 150.1±8.8b 0.95±0.12d 1.8±0.4cd 1.0±0.4 52Clearwater 28.5±8.5cd 145.1±11.4bc 0.92±13e 0.3d 0.01 3
Barged Rapid River 32.9±7.5b 148.8±9.5b 0.98±0.08c 3.6±0.6abc 2.7±0.8 74Clearwater 24.4±5.4bc 138.9±9.0d 0.90±0.08e 2.2±0.8bcd 1.1±0.7 51
For each sample year, mean values with different superscript letters are statistically different. Lower case letters represent comparisons among river outmigration sites.*Salmon were not collected at either Dworshak or Rapid River Hatcheries.^2006 % lipid data modified from Dietrich et al. 2011.ΔNo statistical comparisons were made.
5090 M.R. Arkoosh et al. / Science of the Total Environment 409 (2011) 5086–5100
Bonneville Dam, whereas these parameters did not significantlychange during outmigration of the Rapid River Hatchery fish(Table 2). During the course of collection, Rapid River Hatchery fishwere larger (length andweight) at both Lower Granite and Bonnevilledams than the Dworshak NFH population (Table 2).
The mean condition factor (CF) decreased for fish from bothhatcheries over the course of outmigration from Lower Granite Damto Bonneville Dam (Table 2). Rapid River Hatchery fish had a greatermean CFwhen they arrived at Lower Granite Dam than the DworshakNFH fish. In contrast, by the time the In-River fish arrived atBonneville Dam, the mean CF for fish from both hatcheries wasequivalent.
3.1.3. 2007 river outmigration sitesInitially, mean fish weights from both Dworshak NFH and Rapid
River Hatchery decreased during their outmigration from the hatch-ery to Lower Granite Dam. Subsequently, the mean weight and forklength of both Rapid River and Dworshak NFH fish increased duringtheir in-river outmigration from Lower Granite Dam to BonnevilleDam (Table 2). Rapid River Hatchery fish had greater mean weightsand lengths at Lower Granite and Bonneville dams than DworshakNFH fish (Table 2).
The mean CF values of fish from both Dworshak NFH and RapidRiver Hatchery decreased over the course of outmigration fromtheir respective hatcheries (Table 2). Dworshak NFH fish had a slight-ly greater mean CF than the Rapid River Hatchery fish at the hatchery.However by the time fish outmigrated to Bonneville Dam, the meanCFs of the fish from the two hatcheries was almost equivalent.
3.1.4. 2008 river outmigration sitesFish from Rapid River Hatchery had increased mean weights and
fork lengths when they arrived at Lower Granite Dam. Although themean weight of fish from Clearwater Hatchery did not increase
when they arrived at Lower Granite Dam from the hatchery, theirmean fork length was significantly greater. In-River fish from bothhatcheries had greater mean weights and fork lengths when they ar-rived at John Day Dam than when they left their respective hatcheries(Table 2). During the course of collection, Rapid River Hatchery fishconsistently had greater mean weights and fork lengths than Clear-water Hatchery fish (Table 2).
Rapid River Hatchery fish had a slightly greater mean CF than theClearwater Hatchery fish at the hatchery. This trend was still apparentby the time the fish outmigrated to John Day Dam. At John Day Dam,the mean CF of the fish from Rapid River Hatchery was greater thanthe mean CF of fish from Clearwater Hatchery. However, fish fromboth hatcheries had significantly lower CFs at John Day Dam than attheir hatcheries of origin.
3.2. Percent lipids and triglycerides
Percent lipid values were determined in whole body compositesamples in outmigrant populations with different migration historiesand hatcheries of origin. The mean percent whole body lipid and pro-portion of triglycerides composing the total lipid in compositesamples of fish from Dworshak NFH, Rapid River Hatchery, and Clear-water Hatchery are summarized in Table 2 and presented below bysample year.
3.2.1. 2006 river outmigration sitesBoth Dworshak and Rapid River hatchery fish arrived at Lower
Granite Dam with approximately the same mean lipid content(3.8%) with triglycerides (a major energy store) accounting for 90%of total lipids (3.4%; Table 2). As In-River salmon from both hatcheriesoutmigrated through the Snake and Columbia rivers their lipids de-creased, however, there was only a minimal change in lipids in fishthat were barged. Barged fish from both hatcheries had greater

5091M.R. Arkoosh et al. / Science of the Total Environment 409 (2011) 5086–5100
mean percent lipids and triglyceride proportions than fish collected atBonneville Dam (Table 2). At Bonneville Dam, composites had 2–3%lower whole-body lipid content and 2–3% lower proportion of triglyc-erides than composites collected at Lower Granite Dam. In addition,there were differences in lipid values between fish from the differenthatcheries at Bonneville Dam. Fish at Bonneville Dam from RapidRiver Hatchery had lipid levels (ca. 1.7%) that were twice that offish from Dworshak NFH (ca. 0.9%), with 6.5 times greater triglycer-ides (Table 2).
3.2.2. 2007 river outmigration sitesAs salmon from both hatcheries migrated through the Snake and
Columbia rivers, their lipid values decreased significantly. Thewhole body lipid content of fish from Dworshak NFH and RapidRiver Hatchery decreased significantly in composite samples fromthe hatchery prior to release (7% and 4.7%, respectively) to compositesamples at Lower Granite Dam (2.6% and 1.7%, respectively; Table 2).The lipid content continued to decrease with outmigration distancefrom Lower Granite Dam to McNary Dam to Bonneville Dam andafter barging. Eventually, whole body lipid values in fish fromDworshakNFH and Rapid River Hatchery were 1.5% and 1.3% for Barged fish,respectively, and 0.9% and 0.5% at Bonneville Dam, respectively.
In general, there were minimal differences in total lipids and tri-glycerides in fish originating from Rapid River Hatchery as comparedto those from the Dworshak NFH. Prior to release, fish from DworshakNFH had significantly greater lipids than fish from Rapid River Hatch-ery. However, after Lower Granite Dam, the total lipid content wasnot significantly different when the fish were collected at eitherMcNary or Bonneville dams, or after barging (Table 2). At LowerGranite Dam, Rapid River Hatchery fish had slightly lower wholebody triglycerides (1.2%) than Dworshak NFH fish (2.1%). However,the whole body triglyceride level in Rapid River Hatchery fish wasgreater than Dworshak NFH fish when they arrived at McNary Dam(0.6% and 0.1%, respectively) as well as at Bonneville Dam (0.9% and0.2%, respectively).
3.2.3. 2008 river outmigration sitesThe lipid content of salmon decreased significantly as they outmi-
grated. The whole body lipid content of fish from Clearwater andRapid River hatcheries decreased significantly in composite samplesfrom the hatchery prior to release (6.2% and 5.3%, respectively) tocomposite samples at Lower Granite Dam (2.6% and 3.5%, respective-ly; Table 2). After Lower Granite Dam, there was a minimal change inlipids in fish that were barged (less than 0.4%). In contrast, the lipidtriglyceride proportions continued to decrease with outmigration dis-tance from Lower Granite Dam to McNary Dam to John Day Dam infish with In-River outmigration histories. Ultimately, whole bodylipid values in fish from Clearwater and Rapid River hatcheries were0.3% and 1.8% at John Day Dam, respectively and 2.2% and 3.6% inBarged fish, respectively.
Fish originating from Rapid River Hatchery had greater wholebody lipid content in composite samples than fish originating fromClearwater Hatchery at all locations sampled during outmigration.At Lower Granite Dam, Clearwater Hatchery fish had roughly halfthe triglycerides (1.2%) than Rapid River Hatchery fish (2.3%,Table 2) contained. Also, fish from Rapid River Hatchery had greatertriglycerides than fish from Clearwater Hatchery after barging and ar-rival at McNary and John Day dams. Rapid River Hatchery fish had 6.5times more triglycerides than Clearwater Hatchery fish at McNaryDam and roughly 100 times more triglycerides at John Day Dam.
3.3. Outmigrant exposure to chemical contaminants
Contaminants analyzed in gutted fish whole body and bile com-posites were categorized as: (1) OC pesticides (excluding DDTs);(2) PBDEs; (3) DDTs; (4) PCBs; and (5) biliary PHN equivalents
(indicating PAH exposure). Results are summarized below in refer-ence to the composite means for each cohort and further subdividedbased on the hatchery of origin. With the exception of DDTs, levelsof OC pesticides were generally found near or slightly above thelimit of quantitation (LOQ). Therefore, due to the small number ofsamples that had measureable OCs, statistical analyses were not per-formed on these samples collected during the three years.
3.3.1. 2006 river outmigration sites
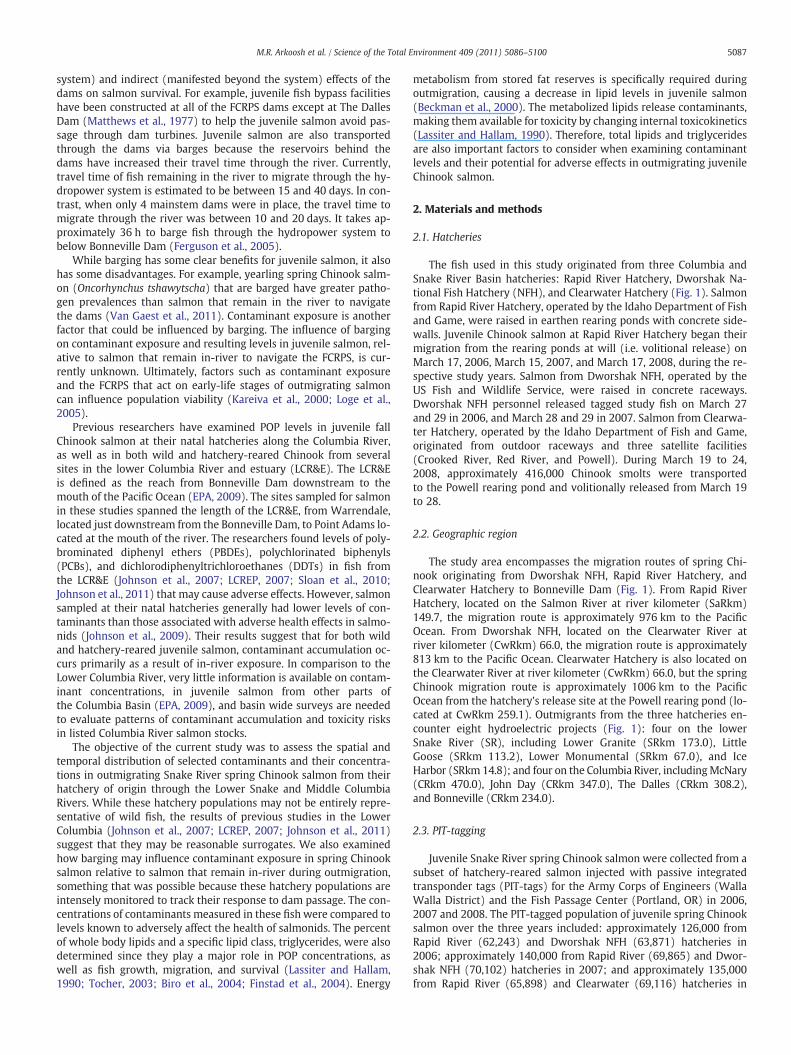
3.3.1.1. ∑PBDEs. The concentration of ∑PBDEs in salmon duringoutmigration ranged from 170 to 2100 ng/g lipid (6–43 ng/g wetweight) (Fig. 2a, b; Table 3). At Lower Granite Dam, Rapid RiverHatchery fish had a significantly greater mean ∑PBDE level(1100 ng/g lipid; 43 ng/g wet weight) than Dworshak NFH fish(290 ng/g lipid; 11 ng/g wet weight; Fig. 2a, b). Although not statisti-cally significant, the mean lipid-normalized ∑PBDE levels of fish atBonneville Dam were greater than at Lower Granite Dam or post-Barging, regardless of hatchery of origin. In contrast, the mean wetweight values at Bonneville Dam were less than at Lower GraniteDam and equivalent to Barged fish, regardless of hatchery of origin.
3.3.1.2. ∑DDTs. The concentration of ∑DDTs in salmon during out-migration ranged from 580 to 8400 ng/g lipid (33 to 49 ng/g wetweight). There were no significant differences in the mean levels of∑DDTs (lipid-normalized or wet weight) in fish from DworshakNFH and Rapid River Hatchery at either of the dams or after barging(Fig. 2c, d; Table 3). Fish collected at Bonneville Dam had greatermean levels of ∑DDTs (lipid-normalized and wet weight) than fishcollected at Lower Granite Dam and post-barging (Fig. 2c, d). Themean level of ∑DDTs in Dworshak NFH fish collected at BonnevilleDam (6300 ng/g lipid; 49 ng/g wet weight) was significantly greaterthan at Lower Granite Dam (980 ng/g lipid; 32 ng/g wet weight). Inaddition, the mean wet weight concentration of ∑DDTs in RapidRiver Hatchery fish collected at Bonneville Dam (47 ng/g wet weight)was significantly greater than at Lower Granite Dam (35 ng/g wetweight).
3.3.1.3.∑PCBs. The concentration of∑PCBs in salmon during outmi-gration ranged from 210 to 3100 ng/g lipid (10–17 ng/g wet weight;Fig. 2e, f; Table 3). In general, fish from Dworshak NFH had consis-tently greater ∑PCB levels (lipid-normalized and wet weight) thanfish from Rapid River Hatchery at each dam site and post-Barging(Fig. 2e, f). The mean wet weight concentration of ∑PCBs in fishfrom Dworshak NFH was significantly greater than fish from RapidRiver Hatchery collected at Lower Granite Dam (13.7 ng/g and10.1 ng/g wet weight, respectively), as well as at Bonneville Dam(16.7 ng/g and 12.3 ng/g wet weight, respectively). Fish collected atBonneville Dam had greater mean levels of∑PCBs (lipid-normalizedand wet weight) than fish collected at Lower Granite Dam and afterbarging (Fig. 2e, f). However, the only significant difference occurredin lipid-normalized values between Dworshak NFH fish collected atLower Granite and Bonneville dams.
3.3.1.4. OC pesticides (excluding DDTs). Although the levels of mirex,aldrin, and the hexachlorocyclohexanes (α-HCH, β-HCH, lindane)were below the LOQ, levels of ∑CHLDs, HCB, dieldrin, and endosul-fan I were quantifiable (Table 4). Slightly greater concentrations ofHCB were observed in Dworshak NFH fish than Rapid River Hatcheryfish for both wet weight and lipid-normalized values at Lower GraniteDam and in Barged fish. HCB concentrations were greater in Dwor-shak NFH fish (0.88 ng/g wet weight) after barging than at BonnevilleDam (0.54 ng/g wet weight) on a wet weight basis. Fish from RapidRiver Hatchery also had greater concentrations of HCB after barging(0.79 ng/g wet weight) than at Bonneville Dam (0.67 ng/g wetweight). The mean concentration of ∑CHLDs was greater in

0
700
1400
2100
2800
3500
Lower Granite Bonneville Barged Lower Granite Bonneville Barged
b b
ab
a
b
ab
(e)
0
500
1000
1500
2000
2500Rapid River HatcheryDworshak NFH
Σ P
BD
Es
ng
/g li
pid
Σ D
DT
s n
g/g
lip
idΣ
40C
Bs
ng
/g li
pid
a
b
a
ab
ab ab
(a)
0
10
20
30
40
50
60
70
Σ P
BD
Es
ng
/g w
et w
eig
ht
Σ D
DT
s n
g/g
wet
wei
gh
tΣ
40C
Bs
ng
/g w
et w
eig
ht
a
b
ab
b
ab
b
(b)
0
2000
4000
6000
8000
b b
ab
a
b
ab
(c)
0
5
10
15
20
25
c
abbc
a
bc
ab
(f)
0
10
20
30
40
50
60
bb
aa
abab
(d)
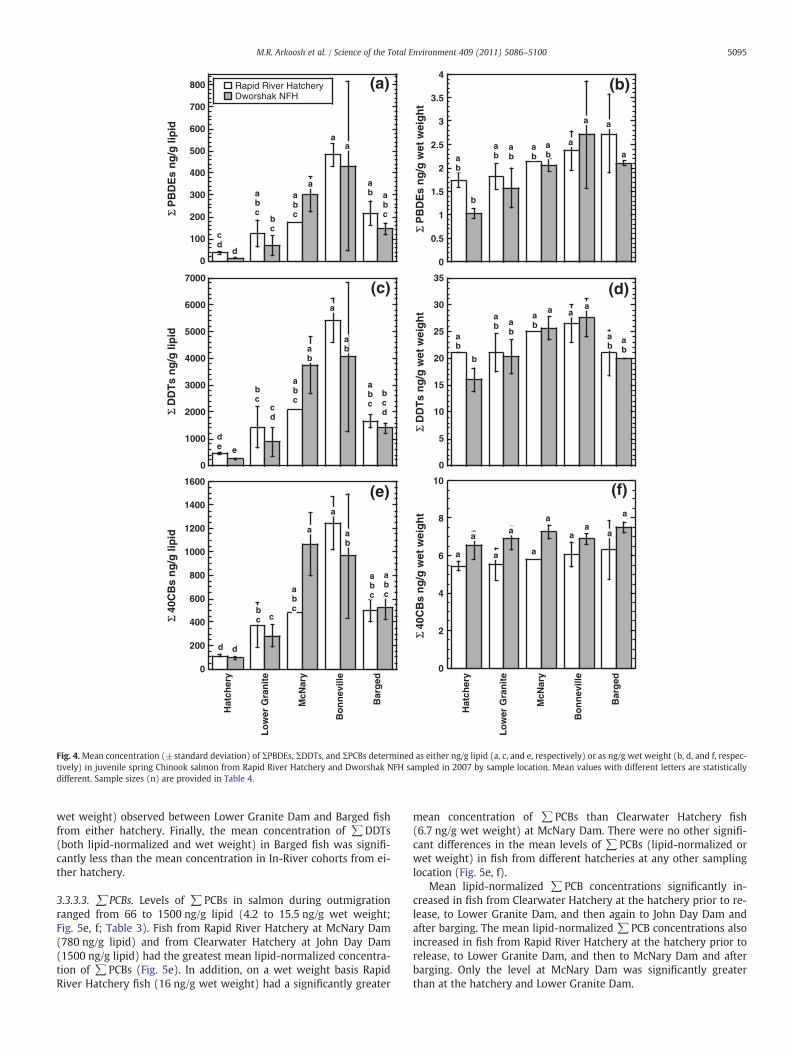
Fig. 2.Mean concentration (±standard deviation) of ΣPBDEs, ΣDDTs, and ΣPCBs determined as either ng/g lipid (a, c, and e, respectively) or as ng/g wet weight (b, d, and f, respec-tively) in juvenile spring Chinook salmon from Rapid River Hatchery and Dworshak NFH sampled in 2006 by sample location. Mean values with different letters are statisticallydifferent. Sample sizes (n) are provided in Table 4.
5092 M.R. Arkoosh et al. / Science of the Total Environment 409 (2011) 5086–5100
Dworshak NFH fish than Rapid River Hatchery fish for both wetweight and lipid-normalized values at Lower Granite and Bonnevilledams, as well as after barging (Table 4). Likewise, the mean concen-tration of dieldrin was greater in Dworshak NFH fish than RapidRiver Hatchery fish for lipid-normalized values at all sample locations.Finally, endosulfan I was detected only in Rapid River Hatchery fish atBonneville Dam (0.40 ng/g wet weight; 18 ng/g lipid).
3.3.1.5. Biliary PHN equivalents. The outmigrating salmon were ex-posed to PAHs (as indicated by biliary PAHs fluorescing at PHN wave-lengths) with PHN equivalents ranging from 0.48 to 4.80 μg PHNequivalents/mg protein (Fig. 3a, Table 3). Rapid River Hatchery fish(3.83 μg PHN equivalents/mg protein) had greater values than Dwor-shak NFH Barged salmon (1.29 μg PHN equivalents/mg protein;Fig. 3a). Also, the mean level of PHN equivalents in fish from RapidRiver Hatchery was significantly greater in Barged fish than thevalues measured in fish collected at Bonneville Dam. Although not
significant, PHN levels in fish from both hatcheries decreased fromLower Granite to Bonneville Dam (Fig. 3a).
3.3.2. 2007 river outmigration sites
3.3.2.1. ∑PBDEs. The concentration of ∑PBDEs in salmon duringoutmigration ranged from 11 to 700 ng/g lipid (1.0 to 3.5 ng/g wetweight) (Fig. 4a, b; Table 3). Although not significant, fish fromRapid River Hatchery had greater mean ∑PBDE concentrationsthan fish from Dworshak NFH at all sample locations, except on alipid-normalized basis at McNary Dam and on a wet weight basis atBonneville Dam (Fig. 4a,b).
Levels of ∑PBDE (both lipid-normalized and wet weight) steadilyincreased as the fish outmigrated downriver from their hatcheries of or-igin, with the greatest concentrations observed at Bonneville Dam. Fishfrom Dworshak NFH collected at Bonneville Dam had significantlygreater mean lipid-normalized ∑PBDE concentrations (430 ng/g

Table 3Range of mean concentrations of POPs (ng/g lipid) or PAHs (PHN FACs) determined for juvenile Chinook salmon collected from the FCRPS during their migration in 2006, 2007 and2008.
Collection year/ ∑PBDEs ∑DDTs ∑PCBs μg PHN equivalents/mg protein
Sampling location Rapid River Dworshak/Clearwater Rapid River Dworshak/Clearwater Rapid River Dworshak/Clearwater Rapid River Dworshak/Clearwater
2006Lower Granite 780–1500 170–410 750–1200 580–1500 210–390 279–501 1.60–3.00 0.67–3.10Bonneville 630–2100 440–1400 2000–6800 4300–8400 440–1800 1400–3100 0.48–1.10 0.55–1.10Barged 210–590 330–480 730–1300 1100–4000 220–330 472–1084 2.80–4.80 0.98–1.80
2007Hatchery 32–43 11–17 400–480 200–270 100–130 80–109 4.00–5.99 NRb
Lower Granite 66–190 32–120 870–2300 530–1500 230–600 212–388 3.60–4.70 4.90McNary 178 246–358 2083 3000–4500 483 875–1250 2.80 3.50–3.70Bonneville 450–520 160–700 4800–6000 2100–6000 1100–1400 600–1300 2.40–3.50 1.80–2.60Barged 180–260 130–170 1500–1800 1300–1500 430–570 456–592 2.90–2.90 2.20–3.20
2008Hatchery 7.0–10 bLOQ 130–150 81–85 130–170 66–68 0.80–1.60 2.10–2.10Lower Granite bLOQa-8 bLOQ-27 180–330 200–470 160–250 121–201 1.50–2.50 1.30–2.40McNary 57–66 80–113 496–879 867–1321 355–1484 427–547 2.30–3.00 1.40–2.50John Day 32–33 470 730–740 8700 370 1500 0.97–1.80 2.00Barged 10–24 bLOQ-16 220–270 380–650 230–270 172–339 2.00–3.20 1.50–2.20
a Below assay detection limit. bLOQ—less than the limit of quantitation.b NR—Not reported, as insufficient bile was available to determine protein content.
5093M.R. Arkoosh et al. / Science of the Total Environment 409 (2011) 5086–5100
lipid) than these fish from Lower Granite Dam (70 ng/g lipid) and thehatchery (15 ng/g lipid). Although the mean lipid-normalized ∑PBDEconcentrations in fish from Rapid River Hatchery steadily increasedfrom the hatchery (37 ng/g lipid) to Lower Granite Dam (120 ng/glipid) and to Bonneville Dam (480 ng/g lipid), the difference was onlysignificant for the values between the hatchery fish and those at Bonne-ville Dam. Although not significant, the mean ∑PBDE concentration atBonneville Dam was greater than in Barged fish.
3.3.2.2. ∑DDTs. The concentrations of ∑DDTs in salmon during out-migration ranged from 200 to 6000 ng/g lipid (13 to 30 ng/g wetweight; Fig. 4c, d; Table 3). There were no significant differences in
Table 4Mean (±SD) concentration (ng/g) of organochlorine pesticides measured in whole bodies2007 and 2008. The pesticides include summed chlordanes (∑CHLDs), hexachlorobenzene
Collectionyear
Collectioncohort
Hatchery ∑CHLDs H
n Wet wt. Lipid wt. W
2006c Lower Granite Rapid River 3 2.5±0.3 69±20 0Dworshak 3 2.6±0.4 74±24 0
Bonneville Rapid River 3 2.9±0.61 210±7.4 0Dworshak 3 3.2±0.59 400±99 0
Barged Rapid River 3 2.5±0.25 63±13 0Dworshak 3 3.0±0.38 150±97 0
2007 Hatchery Rapid River 4 2.0±0.17 42±6.2 0Dworshak 4 1.7±0.29 25±5.6 0
Lower Granite Rapid River 3 1.3±0.49 81±11 0Dworshak 3 1.7±0.46 70±28 0
McNary Rapid River 1 1.9 160 0Dworshak 2 1.4±0.07 200±29 0
Bonneville Rapid River 2 1.1±0.14 230±35 0Dworshak 2 1.2±0.38 160±47 0
Barged Rapid River 2 1.6±0.49 120±33 0Dworshak 2 1.3±0.00 91±13 0
2008 Hatchery Rapid River 2 0.96±0.20 19±6.1 0Clearwater 2 0.36±0.20 5.63±2.06 0
Lower Granite Rapid River 4 0.92±0.19 27±4.1 0Clearwater 4 0.60±0.07 28±15 0
McNary Rapid River 3 1.10±0.12 52±9.0 0Clearwater 3 0.66±0.21 50±19 0
John Day Rapid River 3 0.98±0.03 56±14 0Clearwater 1 bLOQ bLOQ 0
Barged Rapid River 3 0.86±0.10 24±1.4 0Clearwater 3 0.43±0.13 21±9.0 0
a Below assay detection limit. bLOQ—less than the limit of quantitation.b Not available (NA) for analyses.c Salmon were not collected from either the Dworshak National Fish Hatchery or Rapid R
the mean levels of ∑DDTs (lipid-normalized or wet weight) in fishfrom Dworshak NFH and Rapid River Hatchery at any of the samplinglocations (Fig. 4c, d).
Similar to ∑PBDEs, mean ∑DDT concentrations (both lipid-normalized and wet weight) increased as the fish outmigrated down-river from their hatcheries of origin, with the greatest concentrationsobserved at Bonneville Dam. The mean lipid-normalized concentra-tion of ∑DDTs in Dworshak NFH fish collected at Bonneville Dam(5400 ng/g lipid) was significantly greater than at Lower GraniteDam (890 ng/g lipid). The mean lipid-normalized concentrations of∑DDTs in Barged and Bonneville Dam cohorts were significantlygreater than those measured at the hatchery prior to release. In
of juvenile Chinook salmon collected from the FCRPS during their migration in 2006,(HCB), dieldrin and endosulfan I.
CB Dieldrin Endosulfan I
et wt. Lipid wt. Wet wt. Lipid wt. Wet wt. Lipid wt.
.70±0.1 19±3.4 0.7±0.3 19±7.9 bLOQa bLOQ
.86±0.08 25±8.4 0.82±0.12 25±12 bLOQ bLOQ
.67±0.20 45±18 0.66±0.28 42±9.6 0.40±0.36 18±15
.54±0.18 64±1.7 0.53±0.32 59±15 bLOQ bLOQ
.79±0.09 20±3.5 0.65±0.06 17±6.1 bLOQ bLOQ
.88±0.15 43±23 0.96±0.47 55±53 bLOQ bLOQ
.55±0.01 12±0.75 bLOQ bLOQ bLOQ bLOQ
.52±0.05 7.5±0.98 0.54±0.06 7.7±0.75 bLOQ bLOQ
.50±0.10 31±5.7 0.10±0.17 6.3±11 bLOQ bLOQ
.60±0.08 24±7.5 0.82±0.25 32±2.2 bLOQ bLOQ
.57 48 0.29 24 bLOQ bLOQ
.45±0.02 65±10 bLOQ bLOQ bLOQ bLOQ
.42±0.06 85±11 bLOQ bLOQ bLOQ bLOQ
.46±0.09 61±25 bLOQ bLOQ bLOQ bLOQ
.51±0.06 40±2.8 0.25±0.03 20±3.4 bLOQ bLOQ
.53±0.08 37±11 0.42±0.09 29±11 NAb bLOQ
.51±0.03 11±2.0 7.2±2.0 135±20 bLOQ bLOQ
.48±0.05 7.8±0.78 5.05±1.2 82±2.9 bLOQ bLOQ
.68±0.05 20±3.7 0.19±0.13 5.6 ±4.5 bLOQ bLOQ
.55±0.13 24±8.4 0.48±0.22 18±1.6 bLOQ bLOQ
.82±0.04 39±7.4 0.04±0.36 18±19 bLOQ bLOQ
.53±0.12 39±4.0 bLOQ bLOQ bLOQ bLOQ
.69±0.08 38±5.4 0.25±0.23 14±12 bLOQ bLOQ
.35 117 bLOQ bLOQ bLOQ bLOQ
.77±0.16 22±0.11 0.25±0.06 7.0±0.28 bLOQ bLOQ
.56±0.10 27±10 0.30±0.27 14±14 bLOQ bLOQ
iver Hatchery.

0
1
2
3
4
5
6
7
Lo
wer
Gra
nit
e
Bo
nn
evill
e
Bar
ged
Rapid River HatcheryDworshak NFH
Rapid River HatcheryDworshak NFH
PA
H M
etab
olit
es,
μg P
HN
eq
uiv
alen
ts/m
g p
rote
in
ab
b
b b
a
b
(a) 2006 (b) 2007 (c) 2008
0
1
2
3
4
5
6
7
Hat
cher
y
Lo
wer
Gra
nit
e
McN
ary
Bo
nn
evill
e
Bar
ged
Hat
cher
y
Lo
wer
Gra
nit
e
McN
ary
Bo
nn
evill
e
Bar
ged
a
NR
ab
ab
ab
ab
ab
aab
ab
0
1
2
3
4
5
6
7Rapid River HatcheryClearwater Hatchery
a
aa
a
a
aaa
a
a
Fig. 3. Exposure to high and lowmolecular weight PAHs as determined by μg PHN equivalents/mg protein in the bile of juvenile spring Chinook salmon sampled at various locationsas they migrated in 2006 (a), 2007 (b) and 2008 (c). Within years, mean values with different letters are statistically different. NR (not reported), as insufficient bile was available todetermine protein content for the sample. Sample sizes (n) are provided in Table 4.
5094 M.R. Arkoosh et al. / Science of the Total Environment 409 (2011) 5086–5100
addition, the mean wet weight concentrations of∑DDTs in fish fromDworshak NFH at McNary (26 ng/g wet weight) and Bonneville(28 ng/g wet weight) dams were significantly greater than the con-centration determined at Dworshak NFH (2.2 ng/g wet weight)prior to release.
3.3.2.3. ∑PCBs. The ∑PCB values in salmon during outmigrationranged from 80 to 1400 ng/g lipid (4.8 to 7.7 ng/g wet weight; Fig. 4e, f; Table 3). There were no significant differences in the mean levelsof ∑PCBs (lipid-normalized or wet weight) in fish from DworshakNFH and Rapid River Hatchery at any of the sampling locations(Fig. 4e, f). However, fish from Dworshak NFH did have greater con-centrations than fish from Rapid River Hatchery on a wet weightbasis at all sampling locations (Fig. 4f).
Dworshak NFH fish collected at McNary and Bonneville dams hadsignificantly greater mean lipid-normalized ∑PCB concentrationsthan at Lower Granite Dam, which was, in turn, significantly greaterthan at the Dworshak NFH prior to release. In addition, Rapid RiverHatchery fish collected at Bonneville Dam had greater mean lipid-normalized∑PCB concentrations than at McNary and Lower Granitedams, which were, in turn, significantly greater than at the RapidRiver Hatchery prior to release. The mean lipid-normalized ∑PCBconcentrations in Barged salmon were significantly greater than atthe hatcheries prior to release, but less than fish collected at Bonne-ville Dam. There were no significant differences in the mean concen-trations of ∑PCBs between sampling locations when examined on awet weight basis, regardless of the hatchery of origin.
3.3.2.4. OC pesticides (excluding DDTs). Composite samples analyzedfor endosulfan I, mirex and aldrin were below the LOQ. Quantifiableconcentrations of ∑CHLDs, HCB, and dieldrin are reported inTable 4. Also, low levels of ∑HCHs (α-HCH, β-HCH, lindane) weredetected (data not shown). In general, no trends were found on OCwet weight levels, whereas differences in lipid-normalized OC levelswere found. Greater mean lipid-normalized concentrations of HCBand∑CHLDs were observed in Rapid River Hatchery fish than Dwor-shak NFH fish at the hatcheries prior to release, Lower Granite andBonneville dams, and post-Barging. Fish collected at Bonneville Damalso had a greater mean lipid-normalized concentration of HCB thanfish at Lower Granite Dam and the hatcheries irrespective of hatcheryof origin. The mean lipid-normalized concentrations of dieldrin atLower Granite Dam and Barged fish were greater in Dworshak NFHfish than Rapid River Hatchery fish. Low levels of ∑HCHs weredetected in Rapid River Hatchery fish at Lower Granite Dam
(0.27 ng/g wet weight) and in Dworshak NFH fish at the hatchery(0.25 ng/g wet weight) prior to release.
3.3.2.5. Biliary PHN FACs equivalents. The PHN equivalents measured insalmon during outmigration ranged between 1.8 and 5.9 PHN equiv-alents μg/mg protein (Fig. 3b, Table 3). There were no significant dif-ferences in PHN equivalents measured in fish from Dworshak NFHand Rapid River Hatchery during outmigration. The PHN equivalentsin the bile collected at Dworshak NFH were below the LOQ. ThePHN equivalents in fish from both hatcheries decreased with outmi-gration distance (Fig. 3b).
3.3.3. 2008 river outmigration sites
3.3.3.1. ∑PBDEs. The concentration of ∑PBDEs in salmon duringoutmigration ranged from bLOQ to 470 ng/g lipid (bLOQ to 1.3 ng/gwet weight; Fig. 5a, b; Table 3). There were no significant differencesin the mean levels of ∑PBDEs (lipid-normalized or wet weight) infish from Clearwater and Rapid River hatcheries at any of the sam-pling locations.
Fish originating from Clearwater Hatchery had no detectablelevels of PBDEs prior to release, but ∑PBDE concentrations (bothlipid-normalized and wet weight) steadily increased at downriverdam sampling sites. The mean concentrations of∑PBDEs in Clearwa-ter Hatchery fish collected at McNary and John Day dams (1.3 and1.4 ng/g wet weight, respectively) were significantly greater than attheir hatchery and post-Barging (bLOQ and 0.17, respectively). Thetrend was similar with the Rapid River Hatchery fish.
3.3.3.2. ∑DDTs. The ∑DDTs in salmon during outmigration rangedfrom 81 to 8700 ng/g lipid (5.1 to 26 ng/g wet weight; Fig. 5c,d;Table 3). Clearwater Hatchery fish had a significantly greater meanlipid-normalized concentration of ∑DDTs (8700 ng/g lipid) thanRapid River Hatchery fish (850 ng/g lipid) at John Day Dam. Therewere no other significant differences in the mean levels of ∑DDTs(lipid-normalized or wet weight) in fish from different hatcheries atany other sampling location (Fig. 5c, d).
Mean ∑DDT concentrations (both lipid-normalized and wetweight) significantly increased in fish from Clearwater Hatchery atsampling locations downriver from their hatchery of origin. A similartrend was noted for the Rapid River Hatchery fish, but only the lipid-normalized and wet weight concentrations at McNary Dam were sig-nificantly greater than at Lower Granite Dam. There was minimal dif-ference in mean ∑DDT concentrations (both lipid-normalized and
0
200
400
600
800
1000
1200
1400
1600
Hat
cher
y
Lo
wer
Gra
nit
e
McN
ary
Bo
nn
evill
e
Bar
ged
Hat
cher
y
Lo
wer
Gra
nit
e
McN
ary
Bo
nn
evill
e
Bar
ged
d d
bc c
abc
a
a
abc
abc
ab
(e)
0
100
200
300
400
500
600
700
800 Rapid River HatcheryDworshak NFH
cd
d
abc
bc
abc
a
aa
ab a
bc
(a)
0
0.5
1
1.5
2
2.5
3
3.5
4
ab
b
ab
ab
ab
ab
a
a a
a
(b)
0
1000
2000
3000
4000
5000
6000
7000
de e
bc
cd
abc
ab
a
ab
abc
bcd
(c)
0
2
4
6
8
10
a a
a
a
a a
aa
a
a
(f)
0
5
10
15
20
25
30
35
ab
b
ab a
b
ab
a aa
ab
ab
(d)
Σ P
BD
Es
ng
/g li
pid
ΣD
DT
s n
g/g
lip
idΣ
40C
Bs
ng
/g li
pid
ΣP
BD
Es
ng
/g w
et w
eig
ht
ΣD
DT
s n
g/g
wet
wei
gh
tΣ
40C
Bs
ng
/g w
et w
eig
ht
Fig. 4.Mean concentration (±standard deviation) of ΣPBDEs, ΣDDTs, and ΣPCBs determined as either ng/g lipid (a, c, and e, respectively) or as ng/g wet weight (b, d, and f, respec-tively) in juvenile spring Chinook salmon from Rapid River Hatchery and Dworshak NFH sampled in 2007 by sample location. Mean values with different letters are statisticallydifferent. Sample sizes (n) are provided in Table 4.
5095M.R. Arkoosh et al. / Science of the Total Environment 409 (2011) 5086–5100
wet weight) observed between Lower Granite Dam and Barged fishfrom either hatchery. Finally, the mean concentration of ∑DDTs(both lipid-normalized and wet weight) in Barged fish was signifi-cantly less than the mean concentration in In-River cohorts from ei-ther hatchery.
3.3.3.3. ∑PCBs. Levels of ∑PCBs in salmon during outmigrationranged from 66 to 1500 ng/g lipid (4.2 to 15.5 ng/g wet weight;Fig. 5e, f; Table 3). Fish from Rapid River Hatchery at McNary Dam(780 ng/g lipid) and from Clearwater Hatchery at John Day Dam(1500 ng/g lipid) had the greatest mean lipid-normalized concentra-tion of ∑PCBs (Fig. 5e). In addition, on a wet weight basis RapidRiver Hatchery fish (16 ng/g wet weight) had a significantly greater
mean concentration of ∑PCBs than Clearwater Hatchery fish(6.7 ng/g wet weight) at McNary Dam. There were no other signifi-cant differences in the mean levels of ∑PCBs (lipid-normalized orwet weight) in fish from different hatcheries at any other samplinglocation (Fig. 5e, f).
Mean lipid-normalized ∑PCB concentrations significantly in-creased in fish from Clearwater Hatchery at the hatchery prior to re-lease, to Lower Granite Dam, and then again to John Day Dam andafter barging. The mean lipid-normalized ∑PCB concentrations alsoincreased in fish from Rapid River Hatchery at the hatchery prior torelease, to Lower Granite Dam, and then to McNary Dam and afterbarging. Only the level at McNary Dam was significantly greaterthan at the hatchery and Lower Granite Dam.

0
200
400
600
800
1000
1200
1400
1600
Hat
cher
y
Lo
wer
Gra
nit
e
McN
ary
Joh
n D
ay
Bar
ged
Hat
cher
y
Lo
wer
Gra
nit
e
McN
ary
Joh
n D
ay
Bar
ged
cd
cd
c
ab
abc
abc
a
bcb
c
d
(e)
0
100
200
300
400
500Rapid River HatcheryClearwater Hatchery
abcd
d
abc
cd
ab
a
a
abcd
bcd
abcd
(a)
0
1
1.5
2
2.5
3
abcd
bcd
bcd
aa
abc
ab a
bcd
cd
d
(b)
0
2000
4000
6000
8000
1 104
ef
bde
cd
bc
f
bc
a
de
bcd
(c)
0
5
10
15
20
25
30
abb
b
a
b
ab
bb
ab
b
(f)
0
5
10
15
20
25
30
de
d
cd
bc
b ab
a
bcd
d
e
(d)
Σ P
BD
Es
ng
/g li
pid
ΣD
DT
s n
g/g
lip
idΣ
40C
Bs
ng
/g li
pid
ΣP
BD
Es
ng
/g w
et w
eig
ht
ΣD
DT
s n
g/g
wet
wei
gh
tΣ
40C
Bs
ng
/g w
et w
eig
ht
Fig. 5.Mean concentration (±standard deviation) of ΣPBDEs, ΣDDTs, and ΣPCBs determined as either ng/g lipid (a, c, and e, respectively) or as ng/g wet weight (b, d, and f, respec-tively) in juvenile spring Chinook salmon from Rapid River and Clearwater hatcheries sampled in 2008 by sample location. Mean values with different letters are statistically dif-ferent. Sample sizes (n) are provided in Table 4.
5096 M.R. Arkoosh et al. / Science of the Total Environment 409 (2011) 5086–5100
3.3.3.4. OC pesticides (excluding DDTs). Composite samples analyzedfor endosulfan I, mirex and aldrin were below the LOQ. Quantifiableconcentrations of ∑CHLDs, HCB, and dieldrin are reported inTable 4. Slightly greater wet weight concentrations of HCB were ob-served in Rapid River Hatchery fish than Clearwater Hatchery fish attheir hatcheries, Lower Granite and McNary dams, and post-Barging.Fish at McNary and John Day dams also had greater mean concentra-tions of HCB than Barged fish on a lipid-normalized basis irrespectiveof hatchery of origin. The mean wet weight concentration of∑CHLDs was greater in Rapid River Hatchery fish than ClearwaterHatchery fish at all sample locations (Table 4). The mean lipid-nor-malized concentration of dieldrin at Lower Granite Dam and inpost-Barged fish was greater for Clearwater Hatchery fish than
Rapid River Hatchery fish. ∑HCHs were detected in In-River RapidRiver Hatchery fish at John Day Dam (0.37 ng/g wet weight) as wellas in Barged Clearwater Hatchery fish (0.19 ng/g wet weight).
3.3.3.5. Biliary PHN FACs equivalents. The low and high molecularweight PAHs sampled in salmon during outmigration ranged from0.8 to 3.2 PHN equivalents μg/mg protein (Fig. 3c, Table 3). Therewere no significant differences in PHN equivalents measured in fishfrom Rapid River and Clearwater hatcheries at any of the samplesites. While PHN equivalents appeared to remain stable across thesampling locations in fish from Clearwater Hatchery, PHN levels in-creased slightly in fish from Rapid River Hatchery duringoutmigration.
5097M.R. Arkoosh et al. / Science of the Total Environment 409 (2011) 5086–5100
4. Discussion
4.1. Morphometric characteristics, total lipids, and triglycerides
The condition factor expresses the robustness and degree of nour-ishment in fish (Williams, 2000) and is used to examine fish stress(Roussel et al., 2007). During the three sampling years, In-River fishcollected at either of the terminal sampling dams, Bonneville orJohn Day dams, had lower mean condition factors than the cohortscollected at the hatcheries, at Lower Granite Dam, or at BonnevilleDam after barging, despite increases in fish weights and lengths.
In 2006, 2007 and 2008 the lipid and triglyceride proportionswere determined in whole body composite samples of fish collectedat different locations during outmigration from Dworshak NFH,Rapid River and/or Clearwater hatcheries. During all three samplingyears, the mean total lipids of In-River fish sampled at the terminalsampling dams were considerably lower than initial mean lipid levelsmeasured in fish at Lower Granite Dam. However, the mean total lipidlevels in Barged fish were fairly consistent with the levels found inLower Granite fish, which was not surprising considering the shortbarging trip of 32 to 44 h. Moreover, most cohorts of In-River fish(those released from Dworshak NFH in 2006 and 2007, from Clearwa-ter Hatchery in 2008, and from Rapid River Hatchery in 2007) arrivedat the terminal dam with less than 1% total lipids. Biro et al. (2004)demonstrated total lipids just below 1% resulted in death of age-0 rainbow trout (O. mykiss). Therefore, In-River juvenile Chinooksalmon arriving at the terminal dams with low lipid levels (≤1%)may be close to a critical concentration of lipids necessary for surviv-al. Insufficient energy reserves or the mobilization and availabilityof previously sequestered contaminants may ultimately affect thesurvival of In-River salmon with such low lipid levels (Lassiter andHallam, 1990; Finstad et al., 2004). By the time the In-River fishwere sampled at the terminal dams, their neutral lipid proportions(triglyceride) were also much reduced, indicating that the lipid storesmost critical for energy production were depleted. This reduction ordepletion of triglycerides in In-River fish again raises the concernthat juvenile salmon may not arrive at the terminal dams withenough energy reserves for future survival.
While we found that both total lipid and triglyceride levels werereduced in all three hatchery stocks during the three sampling yearsas they migrated in-river through the Snake and Columbia rivers,the degree that the levels were reduced depended upon the hatcheryof origin as well as the time during migration they were sampled.Dworshak or Clearwater hatchery fish generally had lower percent-age of triglycerides than the Rapid River Hatchery fish sampled atlater time points. For example in 2006, at Bonneville Dam, the lastcomposite of Dworshak NFH fish that traveled in-river had dramati-cally lower triglyceride levels (9%) than the corresponding RapidRiver Hatchery salmon (60%).
In contrast to the In-River fish, hatchery fish that were Bargedtended to have greater proportion of triglycerides as well as percentlipid values relative to the In-River fish when they arrived at the ter-minal dams. This may be due to reduced travel time in barged fishcompared to fish that made the journey to the terminal dam in-river. These findings suggest that barging could contribute to in-creased survival of hatchery fish by helping them to maintain theirlipid reserves. However, it is unclear whether Barged fish maintaingreater lipid reserves relative to In-River fish as they migrate throughthe lower estuary and enter the ocean.
A number of factors may contribute to the observed reducedmeancondition factors and lipid levels in In-River fish. The energetic de-mands of in-river migration and the adaptation to capturing prey inthe wild both likely contribute to this reduction. Hormonal and phys-iological changes associated with smoltification can result in meta-bolic increases that reduce condition factor as well as lipid level(Beckman et al., 2000; Meador et al., 2006). Contaminant exposure
alone has also been demonstrated to reduce the condition factor offish (Khan, 2003; Li et al., 2010).
4.2. Outmigrant exposure to chemical contaminants
DDTs, PCBs and PBDEs were detected in Dworshak, Clearwater andRapid River hatchery fish during all three sampling years. Althoughother POPs such as OC pesticides, chlordanes, hexachlorobenzene,and dieldrins were also detected as the fish migrated, the levelswere low (just above the LOQ values).
In general, fish with an In-River outmigration history had greaterlipid-normalized concentrations of DDTs, PCBs, and PBDEs thanBarged fish at the conclusion of their outmigration past the dams.In-River fish also had greater lipid-normalized concentrations ofDDTs, PCBs, and PBDEs at the conclusion of their outmigration thanfish collected from Lower Granite Dam. In comparison, Barged fishhad no significant increases in DDTs, PBDEs, or PCBs relative to fishfrom Lower Granite Dam.
Wet weight concentrations of contaminants, especially DDTsshowed some increase during outmigration in In-River fish, suggest-ing that the fish accumulated contaminants during outmigration. Aspatial increase in wet weight concentrations, as well as a decreasein lipids, resulted in increased whole body levels of DDTs during2006–2008, PBDEs during 2007–2008, and PCBs during 2006 as theIn-River fish outmigrated downriver. Wet weight body concentra-tions of DDTs showed the greatest and most consistent increases.This is not surprising, as much of the land in the Columbia Basin hashistorically been used for agriculture. A recent EPA study indicatedthat DDTs are widespread, although at relatively low concentrations,in sediments from the Middle Columbia Basin along the migrationpath of salmon sampled in the present study (Watson et al., 2008),and DDTs have routinely been detected in resident fish for MiddleColumbia River sites (Hinck et al., 2006). Wet weight concentrationsof PCBs and PBDEs in salmon did not increase as consistently and thechanges were relatively small in magnitude, suggesting lower expo-sure to these contaminants in the Snake River and Middle ColumbiaBasins. This is consistent with EPA findings of relatively low concen-trations of these contaminants in Middle Columbia River sediments,although PBDEs, in particular, appear to be widespread (Watson etal., 2008). Moreover, there are reports of PCBs and PBDEs in some res-ident fish in the Snake and Middle Columbia Basins (Hinck et al.,2006; EPA, 2009). One potential source of PCBs is Bradford Island,near the Bonneville Dam, which is a former PCB disposal site (EPA,2009). Population centers like the Tri-Cities (Kennewick, Pasco, andRichland, WA) may be sources of PBDEs, which typically enter theriver through sewage outfalls and wastewater treatment plants(Hale et al., 2003).
Even without additional contaminant uptake during outmigration,a decrease in lipids among In-River fish resulted in significantly in-creased body burdens of DDTs, PCBs, and PBDEs. Changes in lipid con-tent alone resulted in an increase in lipid-normalized body burdens ofPBDEs in 2006, and PCBs in 2007 and 2008, without additional con-taminant uptake during outmigration. As lipids are depleted duringoutmigration, more of the contaminants are mobilized and may be-come available to other tissues (Lassiter and Hallam, 1990). Thusthe loss of energy stores in outmigrant salmon is not only a directthreat to their survival, but increases their risk of toxic injury aswell. Potentially, barging may reduce risks of toxics to some extentby reducing exposure to contaminants in the river environment, es-pecially DDTs, but primarily by reducing lipid loss and associated mo-bilization and increased toxicity of contaminants.
Differences in lipid-normalized concentrations of DDTs, PCBs, andPBDEs were also observed in In-River fish from the three differenthatcheries, although they showed no consistent trends. For example,for In-River fish, greater POP body burdens were generally found infish from Dworshak NFH relative to Rapid River Hatchery in 2006;
5098 M.R. Arkoosh et al. / Science of the Total Environment 409 (2011) 5086–5100
from Rapid River Hatchery relative to Dworshak NFH in 2007; andfrom Clearwater Hatchery relative to Rapid River Hatchery in 2008.These observed differences in fish with In-River outmigration histo-ries from different hatcheries appear, in part, to be due to changesin lipid concentration. Fish with the lowest levels of lipids aftertheir migration had the greatest relative concentrations of POPs. Ini-tial concentrations at hatcheries for the most part were fairly similar,and comparable to concentrations of POPs measured in pre-releasefall Chinook from other Columbia River Basin hatcheries (Johnson etal., 2009). The exception would be PBDE levels in Rapid River Hatch-ery fish collected in 2006, which were much higher than reportedelsewhere.
The salmon appeared to experience some exposure to PAHs at thehatchery or prior to Lower Granite Dam. Unlike POPs, PAHs do notbioaccumulate in fish as they are quickly metabolized by vertebrates(including fish) to more polar compounds that are concentrated inbile for elimination (Varanasi et al., 1989). Thus, exposure to PAHsis assessed by measuring concentrations of PAH metabolites in bile(Krahn et al., 1984). Levels of PAH metabolites were detected as fishmigrated downstream or underwent barging. It is difficult to deter-mine if fish were constantly exposed to PAHs as they outmigrated be-cause, although biliary FACs are considered an indicator of ‘recent’exposure to PAHs (Meador et al., 2008a), FAC values can remain ele-vated a number of days (Collier and Varanasi, 1991) or even weeks(Bravo et al., 2011) following exposure under controlled laboratoryconditions. In 2007, fish sampled at the Rapid River Hatchery, aswell as fish from both hatcheries sampled at Lower Granite Dam,had the greatest mean concentration of PAH metabolites in bile(FAC-PHN levels in the 4 to 5 μg/mg bile protein range) detected.Levels of PAH metabolites in bile subsequently declined as fish mi-grated downriver or were barged. More typical levels in hatcheryfish are in the 0.5 to 1 μg/mg bile protein range (Johnson et al.,2009), although unusually high PAH exposure (N5 μg/mg bile pro-tein) in hatchery fish have been observed (Johnson et al., 2009). It isdifficult to know the source of PAH exposure in hatchery fish. Possiblesources include contaminated feed, fuel spills, or a contaminatedwater column. Generally, Barged fish had equivalent PAH levels tothe In-River fish at the terminal dams. However, in 2006 Barged fishfrom Rapid River Hatchery had significantly greater PAH metabolitesthan the In-River fish at the terminal dam.
4.3. Contaminant exposure relative to established toxicity thresholds
Exposure to POPs and PAHs has been shown to be associated withsublethal effects such as altered growth, altered immune function andincreased disease susceptibility in juvenile salmon (Arkoosh et al.,1994; Arkoosh et al., 2001; Meador et al., 2006; Arkoosh et al.,2010; Bravo et al., 2011). However, not all of the potential adversehealth effects associated with the individual chemicals detected isknown, nor are possible synergistic or additive effects due to low-level exposures to multiple classes of contaminants.
DDTs were found in the greatest concentrations in the salmonbodies, despite a ban on their use in the United States since 1972(EPA, 2009). Although few studies link whole body concentrationsof ∑DDTs to potential adverse affects in juvenile salmon, one studydetermined that a concentration above 600 ng/g wet weight (Beckvaret al. 2005) or adjusted for lipid, 6000 ng/g lipid as recommended byJohnson et al. (2009) may cause adverse effects. To obtain the adverseeffects concentration for DDTs, Beckvar et al. (2005) examined the lit-erature for end-points that included survival, growth, reproduction,and behavior. We found that 16.7%, 8.0%, and 3.7% of the compositescollected in 2006, 2007 and 2008, respectively, exceeded this thresh-old. Salmon that exceeded the threshold all had In-River outmigrationhistories. The DDT levels of fish sampled in the present study weresimilar to those measured in spring Chinook collected in 2007 fromsites near the mouth of the Columbia (Johnson et al., 2011).
Other organochlorine pesticides were detected in outmigratingsalmon. Concentrations of ΣCHLDs, HCB and dieldrin were detected.However, information on adverse effects levels due to these organo-chlorines are limited (Johnson et al., 2007). Chlordane concentrationsbetween 300,000 and 4,000,000 ng/g lipid in fish have been found tocause mortality (Zito, 1978). The greatest concentration of ΣCHLDswe observed was 400 ng/g lipid in In-River fish collected in 2006,which is between 750 and 10,000 times below the lethal level. How-ever, a chlordane concentration criteria of no greater than 300 ng/glipid has been recommended for protecting fish (Zito, 1978; Eisler,1990) and the In-River fish collected from Dworshak NFH in 2006exceeded that value. Adverse health effects of HCBs in rainbowtrout (O. mykiss) can occur between 1000 and 10,000 ng/g wetweight (Dalich et al., 1982; Niimi and Lowe-Jinde, 1984). The levelsof HCBs we detected in the salmon during the three years weremuch lower (bLOQ-7.2 ng/g wet weight).
Toxicological studies on juvenile salmonids with effects rangingfrom enzyme induction to mortality have indicated an adverse healtheffects threshold for PCBs of 2400 ng/g lipid (Meador et al., 2002).During the 2006, 2007, and 2008 sampling years we found 5%, 0%,and 0% of the composites collected, respectively, exceeded thisthreshold. Like DDTs, the salmon that exceeded the threshold in2006 all had In-River outmigration histories. Of the spring Chinookcollected in 2007 from the mouth of the Columbia River, 12.5%exceeded the threshold (Johnson et al., 2011).
An adverse health effects threshold for PBDEs has yet to be deter-mined. However, Arkoosh et al. (2010) demonstrated that fish fed anenvironmentally relevant concentration of PBDE congeners (Sloan etal., 2010) and obtaining an environmentally realistic body burden ofPBDEs (1600±660 ng/g lipid) are more susceptible to the marinebacterial pathogen Listonella anguillarum. During the 2006, 2007,and 2008 sampling years we found 22%, 0%, and 0% of the compositescollected, respectively, were within the 940–2260 ng PBDEs/g lipidrange. Once again, all the salmon that exceeded the threshold in2006 had In-River outmigration histories. These results are similarto those for spring Chinook collected at the mouth of the Columbiain 2007 (Johnson et al., 2011); none of these fish had PBDE levelsabove 940 ng/g lipid.
Adverse effects such as impaired somatic growth and energeticsassociated with PAH exposure may occur in salmon when PHN FACvalues are greater than 2 μg PHN/mg bile protein (Meador et al.,2008a). During the 2006, 2007, and 2008 sampling years we found42%, 94%, and 50% of the composites collected, respectively, exceededthis threshold.
4.4. Comparison to other Columbia River salmon stocks
Because the fish sampled in the present study were of hatchery or-igin, there is some question about whether their contaminant con-centrations would be representative of wild spring Chinook stocksmigrating the Snake and Middle Columbia Rivers. However, concen-trations of PCBs, DDTs, and PBDEs measured in this study werevery similar to those reported by Johnson et al. (2011) in wildUpper Columbia and Snake River spring Chinook collected in 2007from sites near the mouth of the Columbia River, suggesting thatthe current study provides relevant information on the potentialrisks of contaminant exposure to listed spring Chinook stocks.
In comparison to juvenile fall Chinook salmon from the LowerColumbia River, concentrations of DDTs measured in hatchery springChinook from the present study were in a similar range. For example,Johnson et al. (2011) report average concentrations of ΣDDTs in SnakeRiver, Upper Columbia, and Lower Columbia subyearling fall Chinookcollected from the Lower Columbia River in the 2000–4000 ng/glipid range.
In general, exposure to PAHs was similar in the spring Chinooksampled in the present study relative to fall Chinook sampled in the

5099M.R. Arkoosh et al. / Science of the Total Environment 409 (2011) 5086–5100
Lower Columbia River by other researchers. Forty seven percent of fallChinook salmon collected from sites in the Lower Columbia River hadPHN FAC values greater than 2 μg PHN/mg bile protein (LCREP, 2007;Yanagida et al., in press) which is representative of what was foundwith the spring Chinook. Themajority of these fall Chinook were sam-pled from sites at or below the Columbia/Willamette confluence.However, fish collected at Warrendale, Oregon, a relatively undis-turbed site below Bonneville Dam, had PHN FAC levels below 2 μgPHN/mg bile protein in all composites analyzed (LCREP, 2007;Yanagida et al., in press). Of fall Chinook collected at Columbia Riverhatcheries, 20% had PHN FAC levels above 2 μg PHN/mg bile protein(Johnson et al., 2009). The proportion of hatchery spring Chinook inthe Lower Snake and Middle Columbia and fall Chinook from Colum-bia River hatcheries with elevated PHN FAC levels is surprisingly highconsidering the low population density and lack of urbanization inthe area, and the sources are not clear.
On the other hand, concentrations of PCBs and PBDEs were gener-ally lower in the spring Chinook sampled in this study than thosereported for juvenile fall Chinook from the Lower Columbia River.Johnson et al. (2011) found that 32% to 50% of juvenile Snake River,Upper Columbia, and Lower Columbia River fall Chinook sampledfrom the Lower Columbia River had body concentrations of PCBsabove the 2400 ng/g lipid threshold. As for PBDEs, 36% of fall Chinooksalmon collected from sites in the Lower Columbia River had PBDEsabove 940 ng/g lipid (LCREP, 2007; Johnson et al., 2011).
The relatively low concentrations of PCBs and PBDEs in the springChinook salmon sampled in this and other studies (Johnson et al.,2011) relative to juvenile fall Chinook collected from the LowerColumbia River (Johnson et al., 2007; LCREP, 2007; Johnson et al.,2011) suggests that extended residence in the Lower Columbia andLower Willamette rivers, more typical of fall Chinook, contributesto uptake of PCBs and PBDEs in fall Chinook stocks. Also, Johnson etal. (2011) and Sloan et al. (2010) found that juvenile fall Chinooksalmon from multiple stocks had relatively low body concentrationsof PCBs and PBDEs when collected below Bonneville Dam, but sig-nificantly higher levels when collected at or below the Columbia/Willamette confluence, highlighting the Portland/Vancouver areaand below as major sources of PCBs in salmon.
Overall, our results suggest that, of the contaminants measured inthe present study, DDTs and related OC pesticides and PAHs pose thegreatest threat to Snake River and Middle Columbia spring Chinook.
5. Conclusion
We determined that juvenile Chinook salmon outmigrating fromthe Lower Snake and Middle Columbia Basins through the hydropow-er system dams were exposed to POPs and PAHs during this three-year study. Salmon outmigrating in 2006 had concentrations ofPOPs known to cause adverse effects, whereas salmon examined dur-ing 2007 and 2008 had levels that did not exceed the threshold valuesassociated with harmful effects. Lower levels of these contaminants inthe later sampling years may reflect gradual declines in legacy con-taminants, DDTs and PCBs (Henry et al., 2009), and the enactingof legislation to regulate the use of PBDEs in a number of countries.Exposure levels to POPs were comparable to those in wild springChinook collected in 2007 from the mouth of the estuary (Johnson etal., 2011), suggesting they would be representative of fish of naturalas well as hatchery origin. However, the bioaccumulative POP levelswe observed were lower than those reported for fall Chinook(Johnson et al., 2007; LCREP, 2007; Johnson et al., 2011) that spend alonger period of time feeding and rearing in the Lower ColumbiaRiver and estuary, whose urban areas are important sources of con-taminants such as PCBs and PBDEs. On the other hand, a high propor-tion (42% to 94%) of the fish collected in all years was exposed to PAHlevels that could potentially cause adverse effects. Fish with In-Riveroutmigration histories had greater concentrations of POPs (ng/g
lipid) than Barged fish at the terminal dam. This was due to a consis-tent loss of lipids during in-river migration, and in some cases due toincreased POP exposure in the river environment for fish with In-River outmigration histories. It is also important to consider thatboth In-River and Barged fish had not yet completed their migrationto the ocean, and still must travel a significant distance and risk stillfurther loss of lipid and exposure to contaminants in the Lower Co-lumbia River and estuary. Because pollutants do not occur in isolation(Eggen et al., 2004), more studies are needed to further understandhow the interaction of multiple abiotic factors, such as the hydropow-er system and exposure to multiple contaminants, can affect thehealth of juvenile stages of threatened/endangered salmon as theyoutmigrate.
Acknowledgments
Funding for this study was provided, in part, by the AnadromousFish Evaluation Program of the US Army Corps of Engineers andfrom NOAA Fisheries programmatic support for salmon recovery sci-ence. We appreciate the support of John W. Ferguson, Director ofNorthwest Fisheries Science Center's Fish Ecology Division in helpingto obtain financial support for this work. We greatly appreciate thetechnical assistance of Jerry Pruiett, Samantha Bund, Paul Peterson,James Lathe, Bill Fleenor, Greg Hutchinson, Erik Loboschefsky, NancyRaskauskas, Amber Roegner, Dina Spangenberg, Mary Bhuthimethee,Collin Christianson, Ben Campbell, Claudia Bravo, Don Thompson, KaiEder, and Frank Loge in sample collection and care; as well as JennieBolton, Daryle Boyd, Richard Boyer, Catherine Sloan, and Karen Tilburyin sample and data analysis. We thank Paul Olson and Mark Myers forreviewing the manuscript.
References
Arkoosh MR, Clemons E, Myers M, Casillas E. Suppression of B-Cell mediated immunityin juvenile Chinook salmon (Oncorhynchus tshawytscha) after exposure to either apolycyclic aromatic hydrocarbon or to polychlorinated-biphenyls. Immunophar-macol Immunotoxicol 1994;16:293–314.
Arkoosh MR, Clemons E, Huffman P, Kagley AN. Increased susceptibility of juvenileChinook salmon to vibriosis after exposure to chlorinated and aromatic compoundsfound in contaminated urban estuaries. J Aquat Anim Health 2001;13:257–68.
Arkoosh MR, Boylen D, Dietrich JP, Anulacion BF, Ylitalo GM, Bravo CF, et al. Diseasesusceptibility of salmon exposed to polybrominated diphenyl ethers (PBDEs).Aquat Toxicol 2010;98:51–9.
Beckman BR, Larsen DA, Sharpe C, Lee-Pawlak B, Schreck CB, Dickhoff WW. Physiolog-ical status of naturally reared juvenile spring chinook salmon in the Yakima River:seasonal dynamics and changes associated with smolting. Trans Am Fish Soc2000;129:727–53.
Beckvar N, Dillon TM, Read LB. Approaches for linking whole-body fish tissue residuesof mercury or DDT to biological effects thresholds. Environ Toxicol Chem 2005;24:2094–105.
Biro PA, Morton AE, Post JR, Parkinson EA. Over-winter lipid depletion and mortality ofage-0 rainbow trout (Oncorhynchus mykiss). Can J Fish Aquat Sci 2004;61:1513–9.
Bravo CF, Curtis LR, Myers M, Meador JP, Johnson LL, Buzitis J, et al. Biomarker responseand disease susceptibility in juvenile rainbow trout Oncorhynchus mykiss fed a highmolecular weight PAH mixture. Environ Toxicol Chem 2011;30:1-11.
Collier TK, Varanasi U. Hepatic activities of xeobiotic metabolizing enzymes and biliarylevels of zenobiotics in English sole (Parophrys vetulus) exposed to environmentalcontaminants. Arch Environ Contam Toxicol 1991;20:462–73.
Dalich GM, Larson RE, Gingerich WH. Acute and chronic toxicity studies with mono-chlorobenzene in rainbow trout (Salmo gairdneri). Aquat Toxicol 1982;2:127–42.
Dietrich JP, Boylen DA, Thompson DE, Loboschefsky EJ, Bravo CF, Spangenberg DK,Ylitalo GM, Collier TK, Loge FJ. An evaluation of the influence of stock orginand out-migration history on the disease susceptibility and survival of juvenileChinook salmon. J Aquat Anim Health 2011;23:35–47.
Eggen RIL, Behra R, Burkhardt-Holm P, Escher BI. Challenges in ecotoxicology. EnvironSci Technol 2004;38:58A–64A.
Eisler R. Chlordane hazards to fish, wildlife, and invertebrates: a synoptic review. U.S.Fish and Wildlif Biological Report. 85(1.21); 1990. Laurel, MD, 49 p.
EPA. Columbia River Basin: state of the river report for toxics January 2009. EPA 910-R-08-004; 2009.
Ferguson JW, Smith SG, Zabel RW, Muir WD, Scheuerell MD, Sandford BP, Marsh DM,McNatt RA, Achord S. Effects of the Federal Columbia River System on salmonidpopulations. 2005; US Department of Commerce, Washington DC. NOAA Technical.NMFS-NWFSC-63 Memorandum.

5100 M.R. Arkoosh et al. / Science of the Total Environment 409 (2011) 5086–5100
Finstad AG, Ugedal O, Forseth T, Naesje T. Energy related juvenile winter mortality in anorthern popoulation of Atlantic salmon, Salmo salar L. Can J Fish Aquat Sci2004;61:2358–68.
Fresh KL, Casillas E, Johnson LL, Bottom DL. Role of the estuary in the recovery ofColumbia River Basin salmon and steelhead: an evaluation of the effects of selectedfactors on salmonid population viability. 2005; US Department of Commerce,Washington DC. NOAA Technical Memorandum, NMFS-NWFSC-69.
Hale RC, Alaee M, Manchester-Neesvig JB, Stapleton HM, Ikonomou MG. Polybromi-nated diphenl ethers flame retardants in the North America environment. EnvironInt 2003;29:771–9.
Henry CJ, Grove RA, Kaiser JL. PCDDs, PCDFs, PCBs, OC pesticides and mercury in fishand osprey eggs fromWillamette River, Oregon (1993, 2001 and 2006) with calcu-lated biomagnifications factors. Ecotoxicology 2009;18:151–73.
Hinck JE, Schmitt CJ, Blazer VS, Denslow ND, Bartish TM, Anderson PJ, et al. Environ-mental contaminants and biomarker responses in fish from the Columbia Riverand its tributaries: spatial and temporal trends. Sci Total Environ 2006;366:549–78.
Johnson LL, Ylitalo GM, Sloan CA, Anulacion BF, Kagley AN, Arkoosh MR, et al. Persistentorganic pollutants in outmigrant juvenile Chinook salmon from the LowerColumbia Estuary, USA. Sci Total Environ 2007;374:342–66.
Johnson LL, Willis ML, Olson OP, Pearce RW, Sloan CA, Ylitalo GM. Contaminant concen-trations in juvenile fall Chinook salmon from Columbia River hatcheries. N Am JAquacult 2009;72:73–92.
Johnson LL, Anulacion BF, Arkoosh MR, Bolton JL, Boyd D, Dietrich JP, Lomax DP,Macneale K, Olson OP, Sol SL, Spromberg JA, Teel D, Willis M, Yanagida GK, YlitaloGM. Chemical contaminants and threatened and endangered salmon in the LowerColumbia River and Estuary. 2011; US Department of Commerce, Washington DC.NOAA Technical. NMFS-NWFSC Memorandum.
Kareiva P, Marvier M, McClure M. Recovery and management options for spring/summer Chinook salmon in the Columbia River Basin. Science 2000;290:977–9.
Khan RA. Health of flatfish from localities in Placentia Bay, Newfoundland, contaminat-ed with petroleum and PCBs. Arch Environ Contam Toxicol 2003;44:485–92.
Krahn MM, Myers M, Burrows DG, Malins DC. Determination of metabolites of xenobi-otics in the bile of fish from polluted waterways. Xenobiotica 1984;14:633–46.
Krahn MM, Wigren CA, Pearce RW, Moore LK, Bogar RG, Macleod WD, et al. Standardanalytical procedures of the NOAA National Analytical Facility, 52. 1988.
Laetz CA, Baldwin DH, Collier TK, Herbert V, Stark JD, Scholz NL. The synergistic toxicityof pesticide mixtures: implications for risk assessment and the conservation of en-dangered Pacific salmon. Environ Health Perspect 2009;117:348–53.
Lassiter RR, Hallam TG. Survival of the fattest: implications for acute effects of lipophilicchemicals on aquatic populations. Environ Toxicol Chem 1990;9:585–95.
LCREP. (Lower Columbai River Estuary Partnership). Lower Columbia River EstuaryEcosystem Monitoring: water quality and salmon sampling reprot. Prepared bythe Lower Columbia River Esutary Partnership, Portland, Or; 2007. 76pp.
Li Z-H, Zlabek V, Velisek J, Grabic R, Machova J, Randak T. Physiological condition statusand muscle-based biomarkers in rainbow trout (Oncorhynchus mykiss), after long-term exposure to carbamazepine. J Appl Toxicol 2010;30:197–203.
Loge FJ, Arkoosh MR, Ginn TR, Johnson LL, Collier TK. Impact of environmental stressorson the dynamics of disease transmission. Environ Sci Technol 2005;39:7329–36.
Matthews GM, Swan GA, Smith JR. Improved bypass and collection system for protec-tion of juvenile salmon and steelhead trout at Lower Granite Dam. Mar Environ Res1977;39:10–4.
Meador JP, Collier TK, Stein JE. Use of tissue and sediment-based threshold concentra-tions of polychlorinated biphenyls (PCBs) to protect juvenile salmonids listedunder the US Endangered Species Act. Aquat Conserv: Mar Freshwat Ecosyst2002;12:493–516.
Meador JP, Sommers FC, Ylitalo GM, Sloan CA. Altered growth and related physiologicalresponses in juvenile Chinook salmon (Oncorhynchus tshawytscha) from dietaryexposure to polycyclic aromatic hydrocarbons (PAHs). Can J Fish Aquat Sci2006;63:2364–76.
Meador JP, Buzitis J, Bravo CF. Using fluorescent aromatic compounds in bile from juve-nile salmonids to predict exposure to polycyclic aromatic hydrocarbons. EnvironToxicol Chem 2008a;27:845–53.
Meador JP, McCarthy LS, Escher BI, Adams WJ. 10th anniversary critical review: the tis-sue-residue approach for toxicity assessment: concepts, issues, application, andrecommendations. J Environ Monit 2008b;10:1486–98.
Misumi I, Vella AT, Leong J, Nakanishi T, Schreck CB. p, p′-DDE depresses the immunecompetence of Chinook salmon (Oncorhynchus tshawytscha) leukocytes. Fish Shell-fish Immunol 2005;19:97-114.
NAUS. National Atlas of the United States. Metadata for hydrologic unit boundaries.www.nationalatlas.gov/mld/hucs00m.html. Accessed May 10, 2011.
Niimi AJ, Lowe-Jinde L. Differential blood cell ratios of rainbow trout (Salmo gairdneri)exposed to methylmercury and chlorbenzenes. Arch Environ Contam Toxicol1984;13:303–11.
NMFS. Snapshot of salmon & steelhead ESA status. http://www.nwr.noaa.gov/ESA-Salmon-Listings/index.cfm. Accessed May 9, 2011.
PTAGIS. (Columbia Basin PIT Tag Information System) Pacific States Marine FisheriesCommission. www.ptagis.org. Accessed May 9, 2011.
Roussel H, Joachim S, Lamothe S, Palluel O, Gauthier L, Bonzom JM. A long-term copperexposure on freshwater ecosystem using lotic mesocosms: individual and popula-tion responses of three-spined sticklebacks (Gasterosteus aculeatus). Aquat Toxicol2007;82:272–80.
Sloan CA, Brown DW, Pearce RW, Boyer RH, Bolton JL, Burrows DG, et al. Determiningaromatic hydrocarbons and chlorinated hydrocarbons in sediments and tissuesusing accelerated solvent extraction and gas chromatography/mass spectrometry.In: Ostrander GK, editor. Techniques in Aquatic Toxicology. Boca Raton, FL: CRCPress; 2005.
Sloan CA, Brown DW, Ylitalo GM, Buzitis J, Herman DP, Burrows DG, et al. Quality assur-ance plan for analyses of environmental samples for polycyclic aromatic com-pounds, persistent organic pollutants, fatty acids, stable isotope ratios, lipidclasses, and metabolites of polycyclic aromatic compounds. US Department ofCommerce, NOAA Technical Memorandum, NMFS-NWFSC-77; 2006.
Sloan CA, Anulacion BF, Bolton JL, Boyd D, Olson OP, Sol SL, et al. Polybrominateddiphenyl ethers in outmigrant juvenile Chinook salmon from the Lower ColumbiaRiver and estuary and Puget Sound, Washington. Arch Environ Contam Toxicol2010;58:403–14.
Tocher DR. Metabolism and functions of lipids and fatty acids in teleost fish. Rev FishSci 2003;11:107–84.
Van Gaest AL, Dietrich JP, Thompson DE, Boylen D, Strickland SA, Collier TK, et al.Survey of pathogens in hatchery Chinook salmon with different outmigrationhistories through the Snake and Columbia Rivers. J Aquat Anim Health2011;23:62–77.
Varanasi U, Stein JE, Nishimoto M. Biotransformation and disposition of PAH in fish. In:Varanasi U, editor. Metabolism of Polycyclic Aromatic Hydrocarbons in the AquaticEnvironment. Boca Raton, FL: CRC Press; 1989. p. 93-149.
Watson M, Cox M, Edmond L. Sediment quality in the Mid-Clumbia River betweeenVantage, Washington and McNary Dam. EPA 910/R-08-001. U. S. EnvironmentalProtection Agency, Office of Environmental Assessment, Region 10, 1200 Sixth Av-enue, Suite 900, Seattle, Washington; 2008.
Williams JE. The coefficient of condition of fish. In: Schneider J, editor. Manual of Fish-eries Survey Methods II: With Periodic UpdatesMichigan Department of NaturalResources, Fisheries Special Report 25, Ann Arbor; 2000.
Yanagida GK, Anulacion BF, Bolton JL, BoydD, LomaxDP, Olson OP, Sol SY,WillisM, YlitaloGM, Johnson LL. Polycyclic aromatic hydrocarbons and threatened and endangeredChinook salmon in the Lower Columbia River and Estuary. Arch Environ Contam Tox-icol in press.
Ylitalo GM, Yanagida GK, Hufnagle LC, Krahn MM. Determination of lipid classes andlipid content in tissues of aquatic organisms using thin layer chromatography/flame ionization detection (TLC/FID) microlipid method. In: Ostrander GK, edi-tor. Techniques in Aquatic Toxicology. Boca Raton, FL: CRC Press; 2005.p. 449–64.
Zar JH. Biostatistical Analysis. 4th Edition. Upper Saddle River, NJ: Prentice Hall; 1999.Zito V. Nonachlor and chlordane in aquatic fauna. Chemosphere 1978;1:3–7.
Related Documents