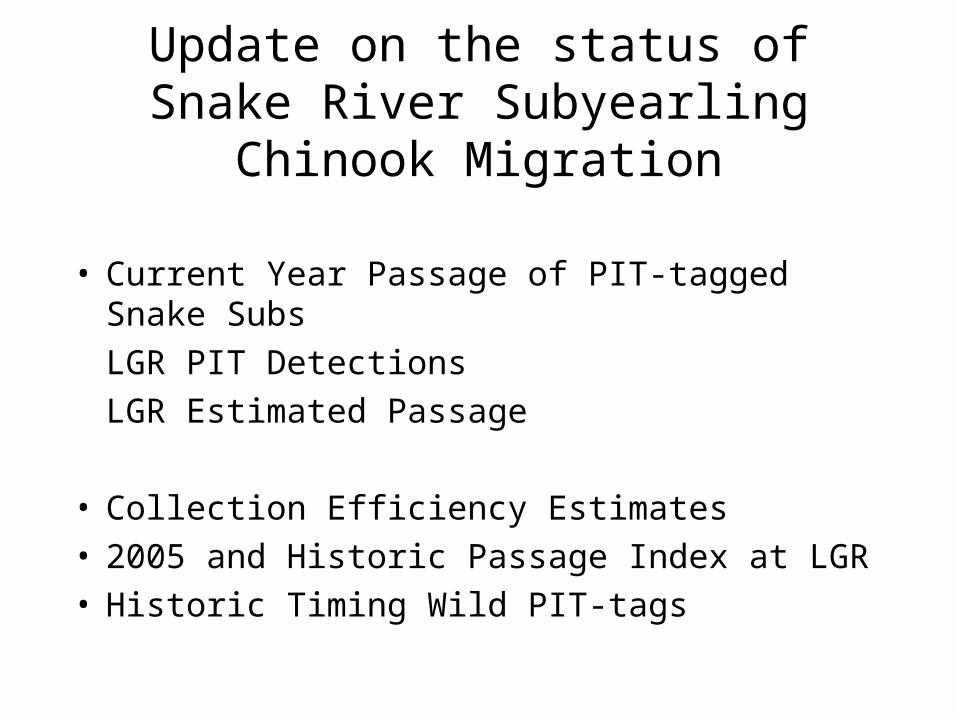
Update on the status of Snake River Subyearling Chinook Migration • Current Year Passage of PIT-tagged Snake Subs LGR PIT Detections LGR Estimated Passage • Collection Efficiency Estimates • 2005 and Historic Passage Index at LGR • Historic Timing Wild PIT-tags

Welcome message from author
This document is posted to help you gain knowledge. Please leave a comment to let me know what you think about it! Share it to your friends and learn new things together.
Transcript
Update on the status of Snake River Subyearling Chinook Migration
• Current Year Passage of PIT-tagged Snake Subs
LGR PIT Detections
LGR Estimated Passage
• Collection Efficiency Estimates• 2005 and Historic Passage Index at LGR• Historic Timing Wild PIT-tags

LGR PIT-tag Detection Summary
Updated Lower Granite Detections and Estimated Pop Passage
srrt Org River Marks LGR Detecs Pct15W USFWS Snake R 9302 1038 11.16%13W NPT Clearwater R 1875 15 0.80%13H NOAA Clearwater R 45790 128 0.28%13H NOAA Snake R 121833 19007 15.60%
---------------------------------------------------------------------------------------------------------------------------------------------------------------------------srrt Org River Marks LGR Pop Est Pct15W USFWS Snake R 9302 Pop Pass LGRWPC (n/.5)/(1-(S%+.2)) 5038 54.16%FPC1 (n/0.5) then (n/0.2) 2723 29.27%FPC2 (n/0.42) then (n/.09) 4351 46.77%
--------------------------------------------------------------------------------------------------------------------------------------------------------------------------srrt Org River Marks LGR Pop Est Pct13Ws NPT Clearwater R 1875 Pop Pass LGRWPC (n/.5)/(1-(S%+.2)) 112 5.97%FPC1 (n/0.5) then (n/0.2) 63 3.36%FPC2 (n/0.42) then (n/.09) 111 5.93%
---------------------------------------------------------------------------------------------------------------------------------------------------------------------------srrt Org River Marks LGR Pop Est Pct13H NOAA Clearwater R 45790WPC (n/.5)/(1-(S%+.2)) 1452 3.17%FPC1 (n/0.5) then (n/0.2) 640 1.40%FPC2 (n/0.42) then (n/.09) 1422 3.11%

Collection Efficiency Calculations at LGR
• Compare Methods of Estimating Collection Efficiency/Population Expansion methods
• Cormack-Jolly-Seber
• FPCv1 and v2 memo method
• WPC memo spill expansion method
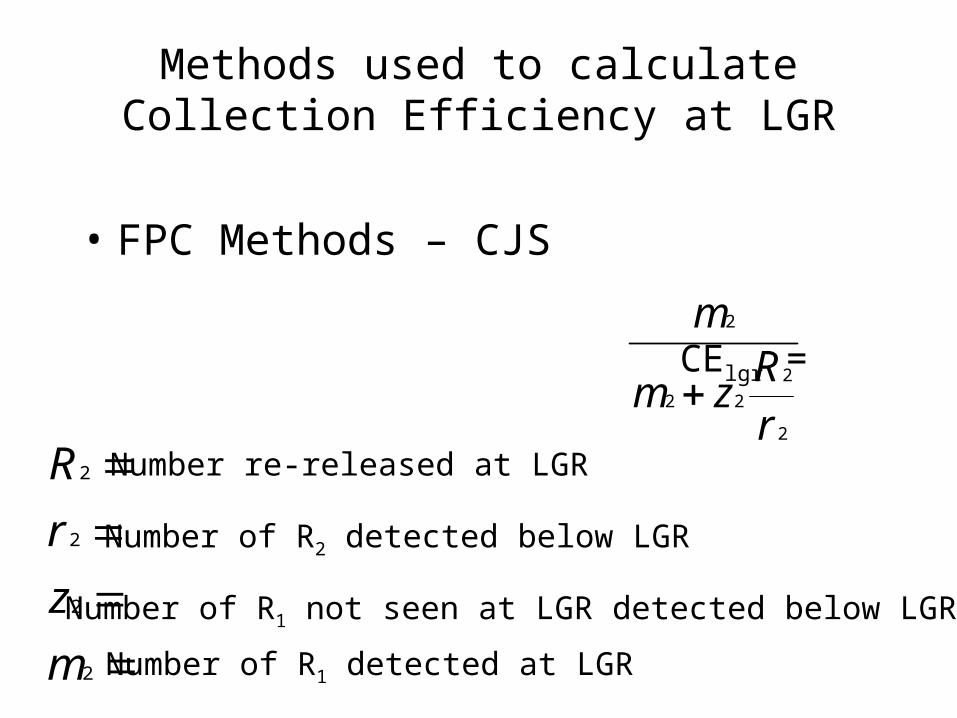
Methods used to calculate Collection Efficiency at LGR
• FPC Methods – CJS
CElgr =
2
2
22
2
rR
zm
m
2
2
2
2
m
z
r
R Number re-released at LGR
Number of R2 detected below LGR
Number of R1 not seen at LGR detected below LGR
Number of R1 detected at LGR

Methods used to calculate Collection Efficiency at LGR cont.
• FPC Methods – use LGS detects to estimate LGR CE (based on various methods)
X11 = PITs seen at LGR and LGS
X01 = PITs seen at LGS but not LGR
Flgr = proportion of fish removed at LGR (trans, research)
• Project X01 distribution based on X11 travel time distribution at LGS (gamma dist)
• Calculate seasonal weighted CE (weight daily LGS PIT detections)
)X*(F+X
X
01lgr11
11
dailyCE
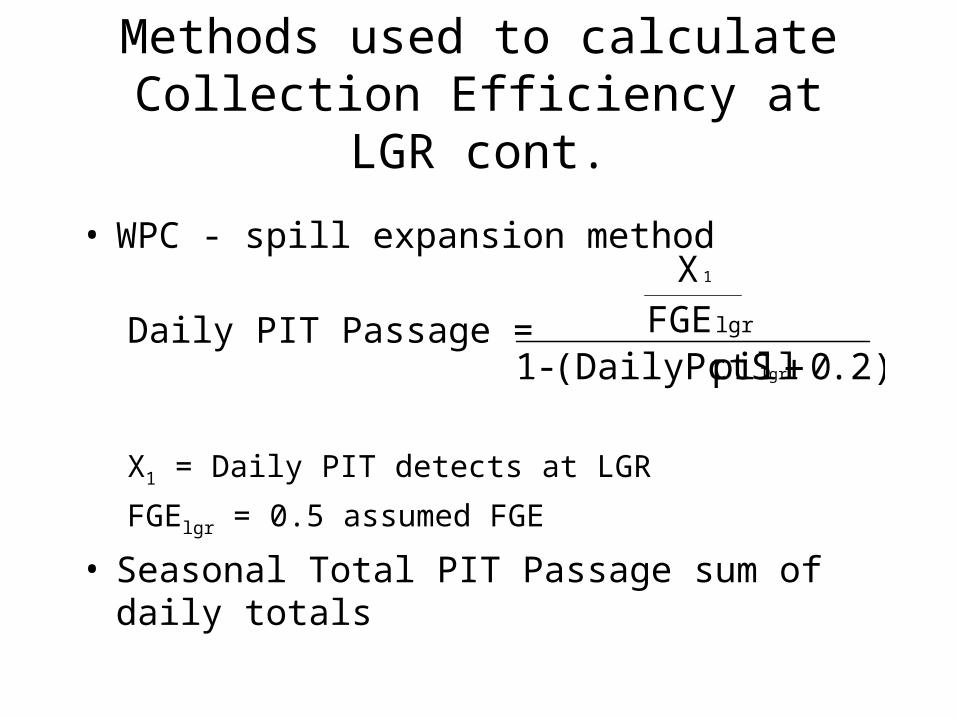
Methods used to calculate Collection Efficiency at LGR cont.
• WPC - spill expansion method
Daily PIT Passage =
X1 = Daily PIT detects at LGR
FGElgr = 0.5 assumed FGE
• Seasonal Total PIT Passage sum of daily totals
.2)0pill(DailyPctS-1
FGEX
lgr
1
lgr

Range of Total Snake River 15W PIT passage estimates from methods
Method
LGR CE Prior to June 20
LGR CE
After June 20
Estimated total PIT passage
R = 9302, LGR det = 1038
CJS 0.269 0.269 3,858 (41%)
FPC v1 0.50 0.20 4,351 (47%)
FPC v2 0.42 0.09 2,723 (29%)
WPC spill exp 0.33 0.08 4,829 (52%)

Daily estimates of PIT-tag passage at LGR Snake River Wild Subs (15W)
0
100
200
300
400
500
600
700
5/9/
05
5/16
/05
5/23
/05
5/30
/05
6/6/
05
6/13
/05
6/20
/05
6/27
/05
7/4/
05
7/11
/05
7/18
/05
7/25
/05
8/1/
05
8/8/
05
Date
Nu
mb
er o
f Ta
gs
WPC Method
FPC-Method 1
FPC-Method 2

Daily estimates of PIT-tag passage at LGR Clearwater River Wild Subs 13W
0
2
4
6
8
10
12
14
16
5/9/05 5/16/05 5/23/05 5/30/05 6/6/05 6/13/05 6/20/05 6/27/05 7/4/05 7/11/05 7/18/05 7/25/05 8/1/05 8/8/05
Date
Est
imat
ed N
um
ber
of
Tag
s
WPC Method
FPC-Method 1
FPC-Method 2
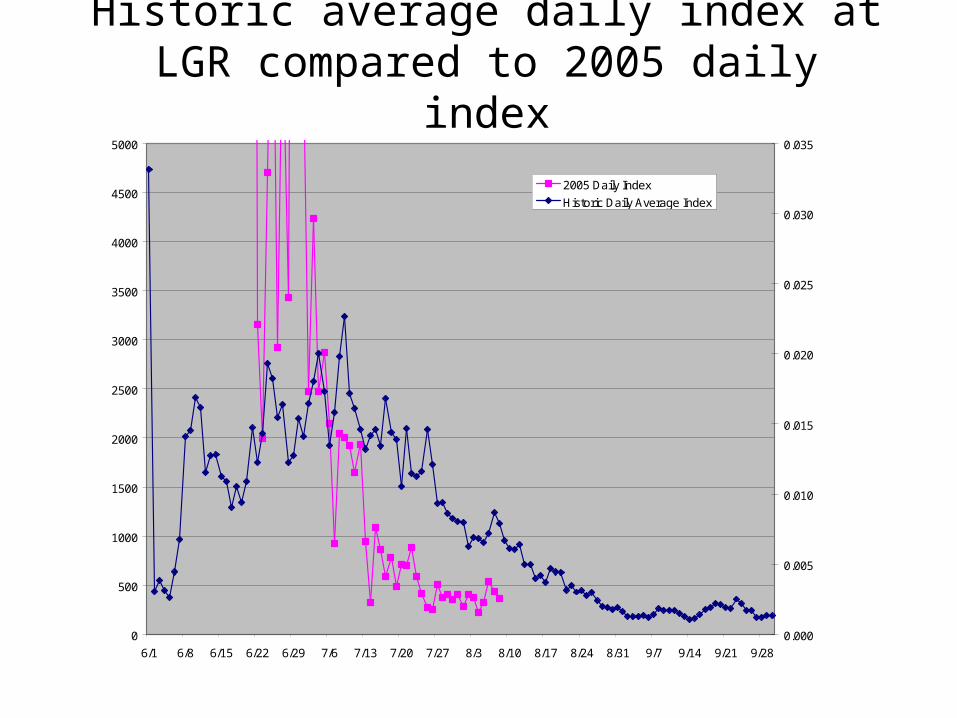
Historic average daily index at LGR compared to 2005 daily index
0
500
1000
1500
2000
2500
3000
3500
4000
4500
5000
6/1 6/8 6/15 6/22 6/29 7/6 7/13 7/20 7/27 8/3 8/10 8/17 8/24 8/31 9/7 9/14 9/21 9/28
0.000
0.005
0.010
0.015
0.020
0.025
0.030
0.035
2005 Daily Index
Historic Daily Average Index

Historic Cumulative Passage Timing LGR CH0
0.0000
0.1000
0.2000
0.3000
0.4000
0.5000
0.6000
0.7000
0.8000
0.9000
1.0000
DATE 6/7 6/14 6/21 6/28 7/5 7/12 7/19 7/26 8/2 8/9 8/16 8/23 8/30 9/6 9/13 9/20 9/27
1991
1992
1993
1994
1995
1996
1997
1998
1999
2000
2001
2002
2003
2004
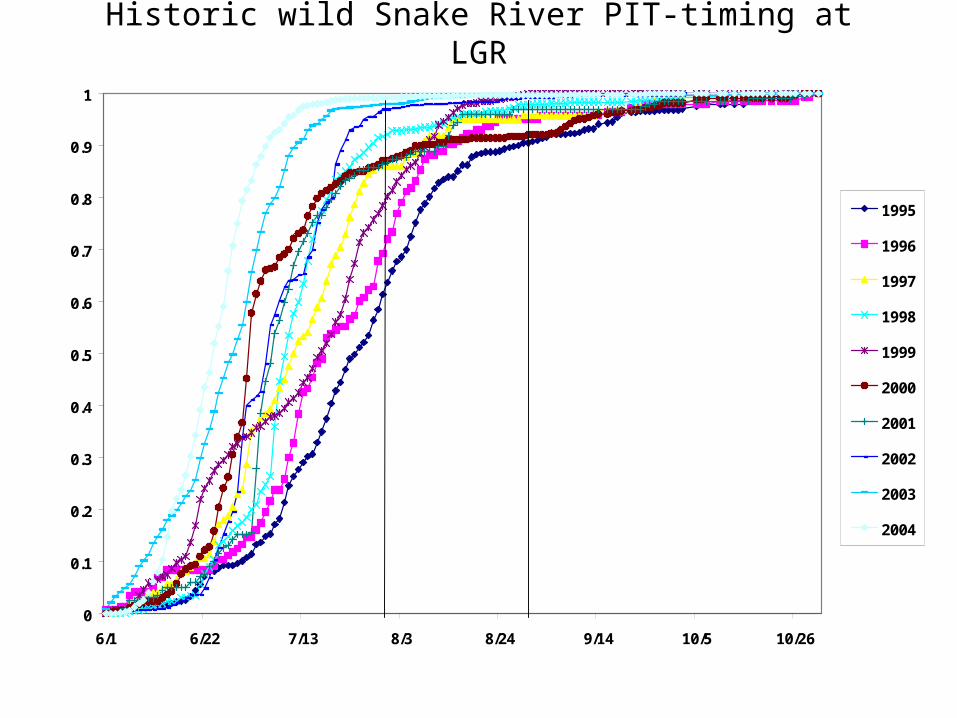
Historic wild Snake River PIT-timing at LGR
0
0.1
0.2
0.3
0.4
0.5
0.6
0.7
0.8
0.9
1
6/1 6/22 7/13 8/3 8/24 9/14 10/5 10/26
1995
1996
1997
1998
1999
2000
2001
2002
2003
2004

Historic wild Clearwater River PIT-timing at LGR
0.00
0.10
0.20
0.30
0.40
0.50
0.60
0.70
0.80
0.90
1.00
6/1 6/22 7/13 8/3 8/24 9/14 10/5 10/26
200465.68%
200360.00%
200233.33%
200164.44%
200040.00%
199964.71%
199874.47%
199543.33%

D?
Related Documents