1 Transportation: Global Climate Change

Transportation: Global Climate Change
Dec 30, 2015
Transportation: Global Climate Change. Outline. Global Climate Change Impacts Activities Strategies Conclusions. Global Climate Change. Background How is transportation impacted? Strategies. - PowerPoint PPT Presentation
Welcome message from author
This document is posted to help you gain knowledge. Please leave a comment to let me know what you think about it! Share it to your friends and learn new things together.
Transcript
1
Transportation: Global Climate Change
2
Outline
• Global Climate Change– Impacts – Activities– Strategies– Conclusions
Global Climate Change
• Background• How is transportation impacted?• Strategies
“Global GHG emission due to human activities have grown since pre-industrial times, with an increase of 70% between 1970 and 2004.” - IPCC
Global Climate Change
• Global Climate Change (GCC) IS happening
“The world’s leading climate scientists have reached consensus that human activity in the form of greenhouse gas (GHG) emission is warming the planet in ways that will have profound and unsettling impacts on natural resources, energy use, ecosystems, economic activity, and potentially quality of life.1”
1 “Special Report 290: Potential Impacts of Climate Change on U.S. Transportation”, TRB Committee on Potential Impacts of Climate Change and U.S. Transportation, March 2008
What is GCC?• Greenhouse gasses (GHG) =
– Carbon dioxide (CO2)
– Methane (CH4)
– Nitrous Oxide (N2O)
– Hydrofluorocarbons (HFCs)– Perflourocarbons (PFCs)
– Sulfur hexafluoride (SF6)
• GHG are represented as CO2 equivalents (1 ton of
Carbon Dioxide)
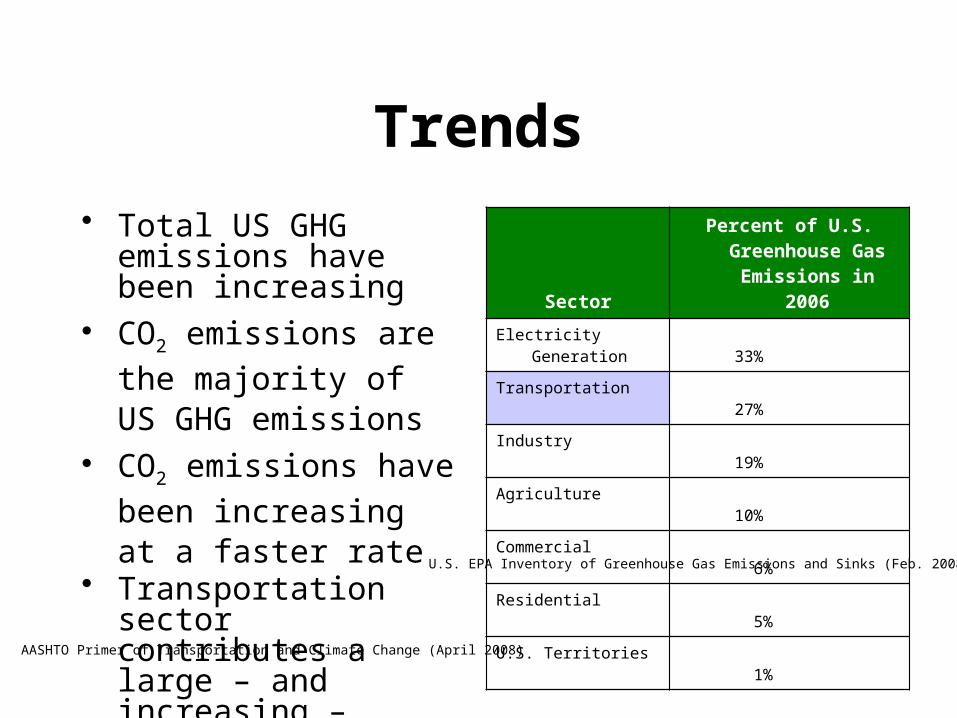
Trends
• Total US GHG emissions have been increasing
• CO2 emissions are the
majority of US GHG emissions
• CO2 emissions have been
increasing at a faster rate• Transportation sector
contributes a large – and increasing – share of GHG emissions
Sector
Percent of U.S. Greenhouse Gas
Emissions in 2006
Electricity Generation 33%
Transportation 27%
Industry 19%
Agriculture 10%
Commercial 6%
Residential 5%
U.S. Territories 1%
U.S. EPA Inventory of Greenhouse Gas Emissions and Sinks (Feb. 2008)
AASHTO Primer of Transportation and Climate Change (April 2008)
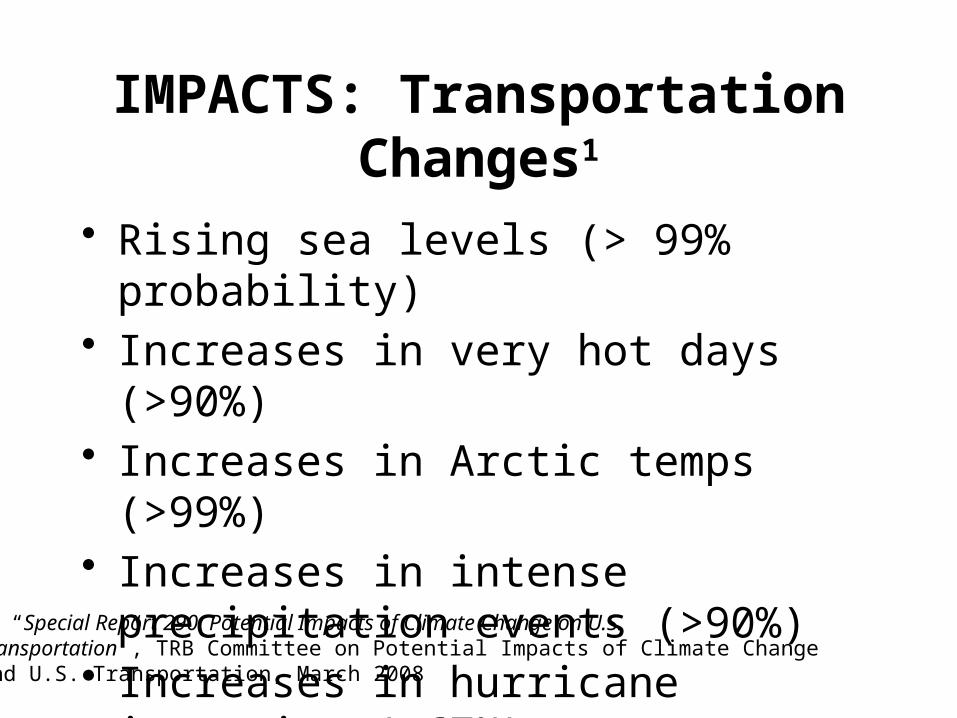
IMPACTS: Transportation Changes1
• Rising sea levels (> 99% probability)• Increases in very hot days (>90%)• Increases in Arctic temps (>99%)• Increases in intense precipitation events
(>90%)• Increases in hurricane intensity (>67%)
1 “Special Report 290: Potential Impacts of Climate Change on U.S. Transportation”, TRB Committee on Potential Impacts of Climate Change and U.S. Transportation, March 2008
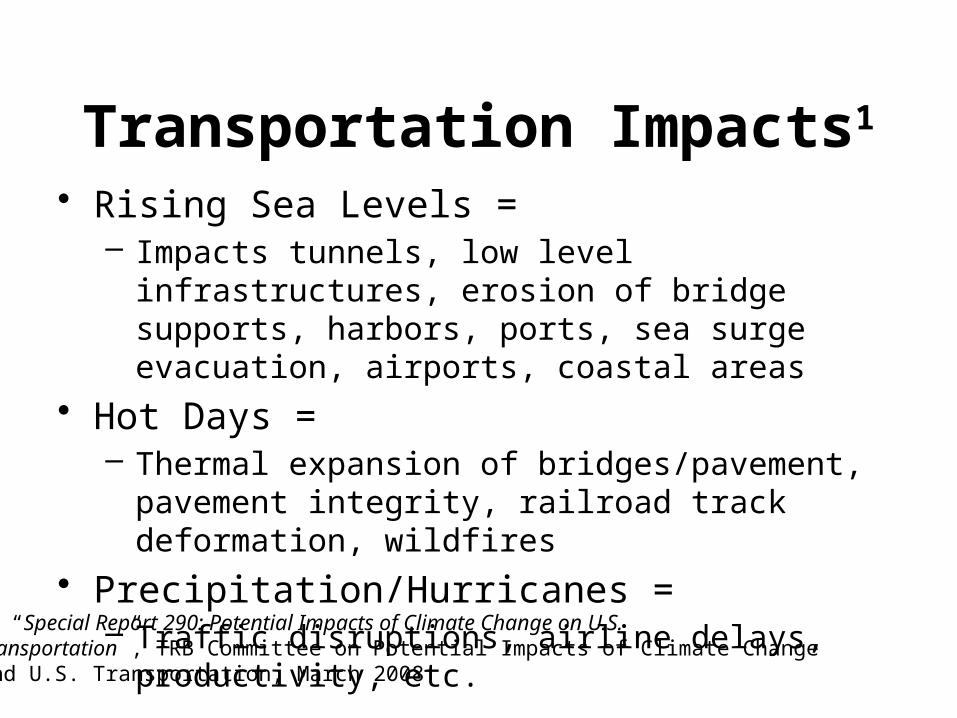
Transportation Impacts1
• Rising Sea Levels =– Impacts tunnels, low level infrastructures, erosion of bridge
supports, harbors, ports, sea surge evacuation, airports, coastal areas
• Hot Days =– Thermal expansion of bridges/pavement, pavement
integrity, railroad track deformation, wildfires
• Precipitation/Hurricanes =– Traffic disruptions, airline delays, productivity, etc.
1 “Special Report 290: Potential Impacts of Climate Change on U.S. Transportation”, TRB Committee on Potential Impacts of Climate Change and U.S. Transportation, March 2008
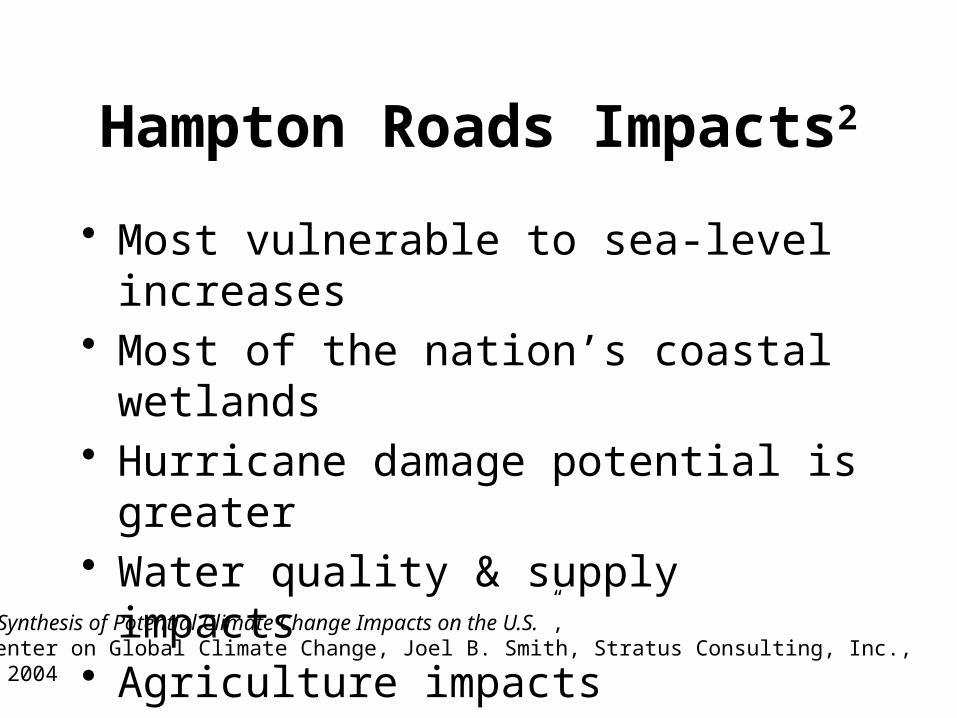
Hampton Roads Impacts2
• Most vulnerable to sea-level increases• Most of the nation’s coastal wetlands• Hurricane damage potential is greater• Water quality & supply impacts• Agriculture impacts• Transportation impacts
2 “A Synthesis of Potential Climate Change Impacts on the U.S.”, Pew Center on Global Climate Change, Joel B. Smith, Stratus Consulting, Inc., April 2004
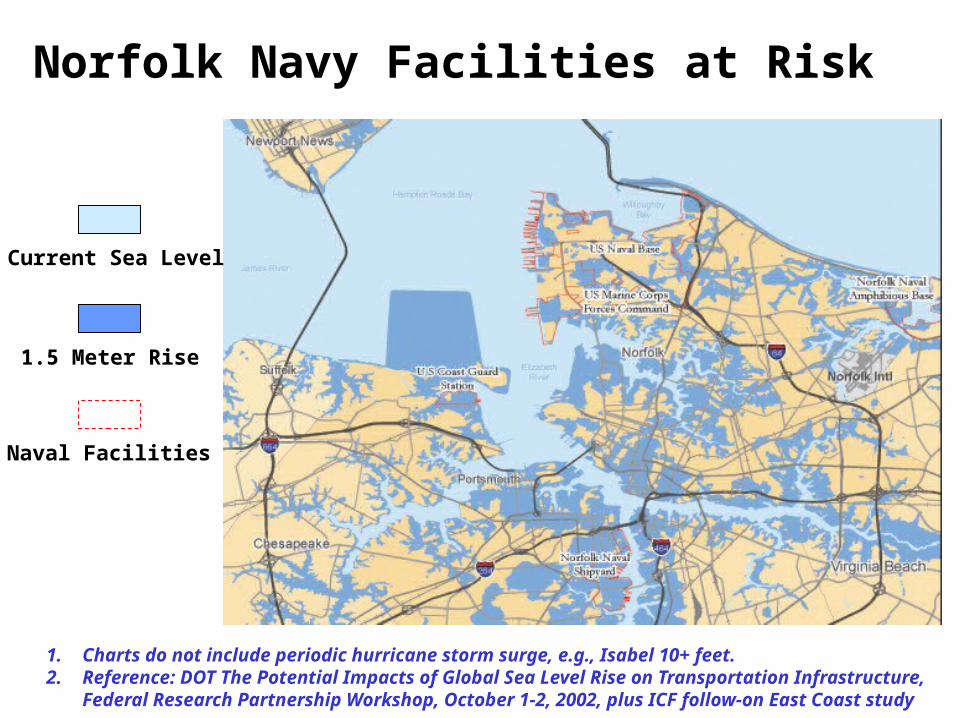
1. Charts do not include periodic hurricane storm surge, e.g., Isabel 10+ feet.2. Reference: DOT The Potential Impacts of Global Sea Level Rise on Transportation Infrastructure,
Federal Research Partnership Workshop, October 1-2, 2002, plus ICF follow-on East Coast study
Norfolk Navy Facilities at Risk
Current Sea Level
1.5 Meter Rise
Naval Facilities
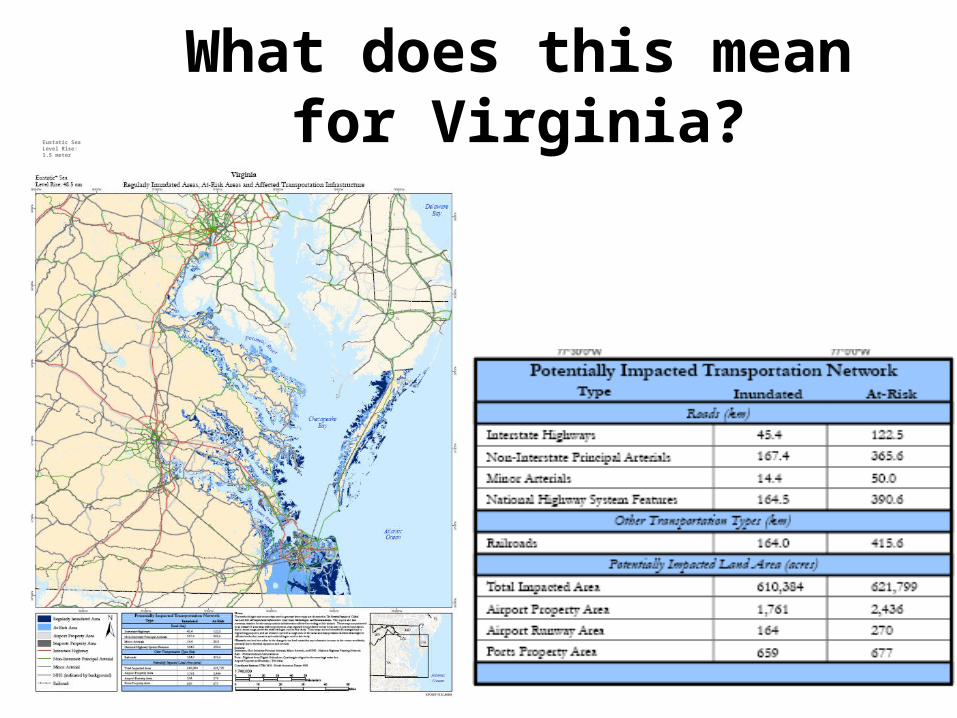
What does this mean for Virginia?Eustatic Sea
Level Rise: 1.5 meter
1.5 Meter SLR Scenario Roads Rail Airports Ports
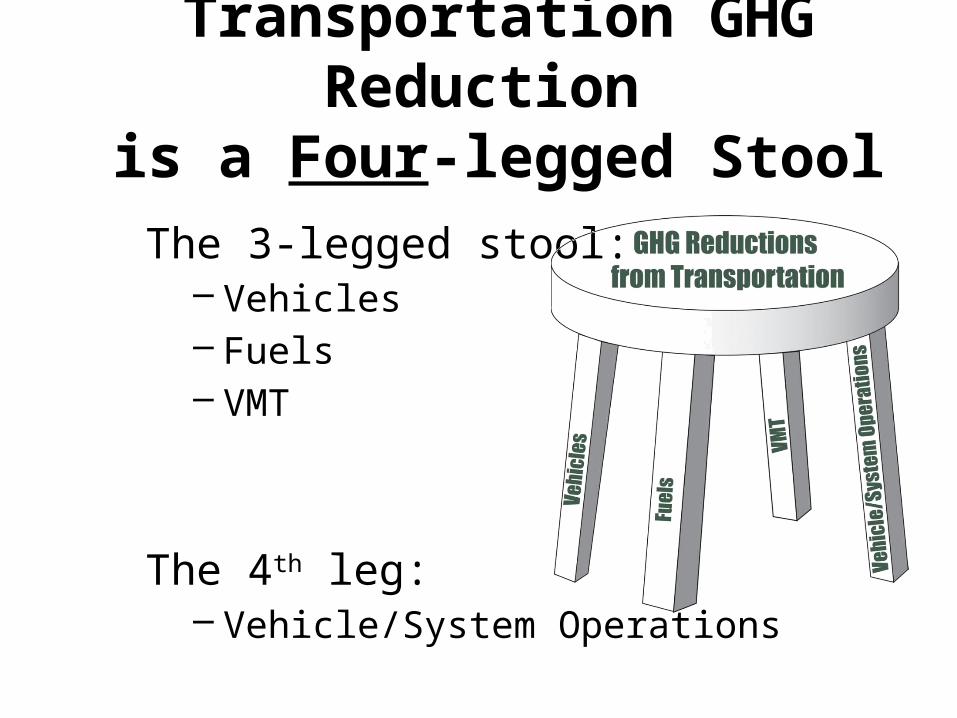
Transportation GHG Reduction is a Four-legged Stool
The 3-legged stool:– Vehicles– Fuels– VMT
The 4th leg:– Vehicle/System Operations
Vehicles & Fuels
• 50% cut in GHG/mile is feasible by 2030 from conventional technologies and biofuels
• Almost complete decarbonization of transport vehicles/fuels by 2050 is a “realistic ambition,” with advanced technology/fuels
• Electric and hydrogen fuel cell vehicles are promising paths to decarbonization – but many technology and economic issues must be overcome
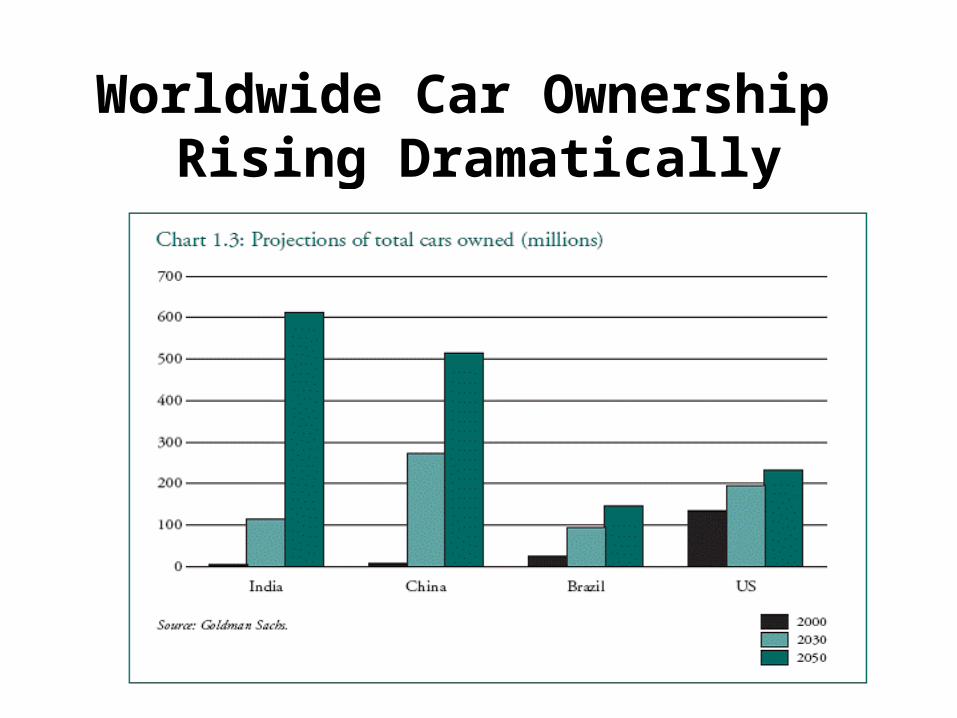
Worldwide Car Ownership Rising Dramatically
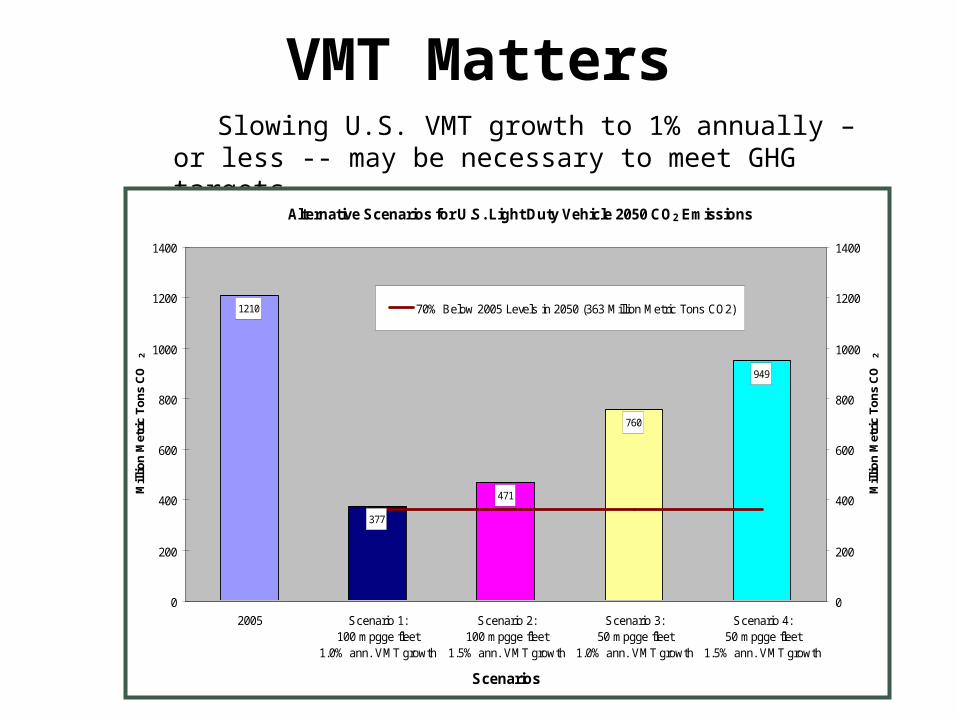
VMT Matters Slowing U.S. VMT growth to 1% annually – or less -- may be
necessary to meet GHG targets
Alternative Scenarios for U.S. Light Duty Vehicle 2050 CO2 Emissions
1210
377
471
760
949
0
200
400
600
800
1000
1200
1400
2005 Scenario 1:100 mpgge fleet
1.0% ann. VMT growth
Scenario 2:100 mpgge fleet
1.5% ann. VMT growth
Scenario 3:50 mpgge fleet
1.0% ann. VMT growth
Scenario 4:50 mpgge fleet
1.5% ann. VMT growth
Scenarios
Mil
lio
n M
etri
c T
on
s C
O2
0
200
400
600
800
1000
1200
1400
Mil
lio
n M
etri
c T
on
s C
O2
70% Below 2005 Levels in 2050 (363 Million Metric Tons CO2)
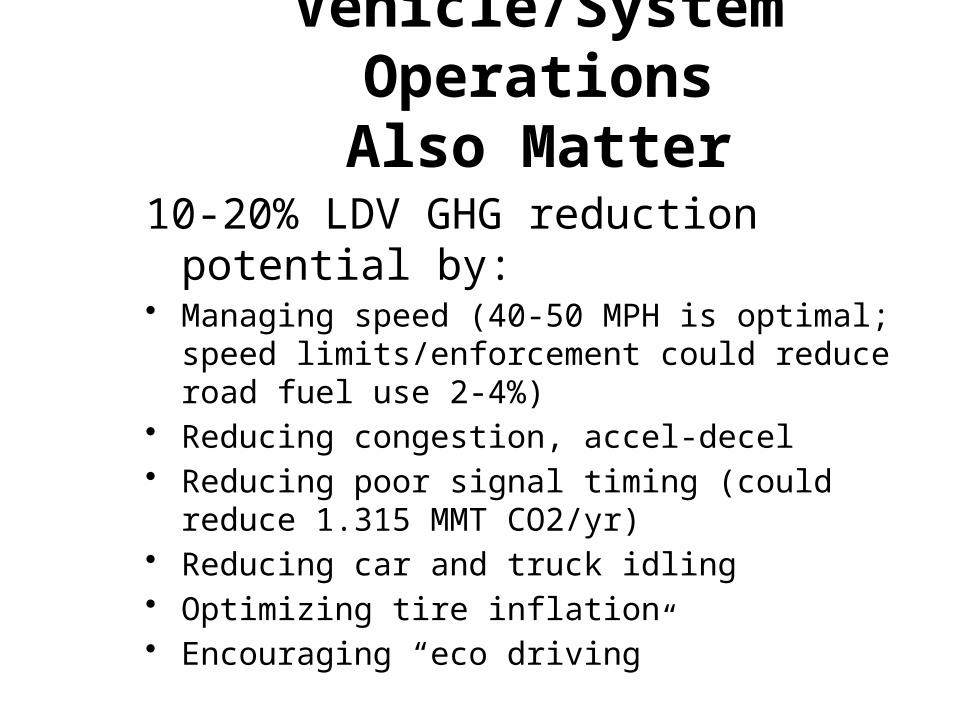
Vehicle/System OperationsAlso Matter
10-20% LDV GHG reduction potential by:• Managing speed (40-50 MPH is optimal; speed
limits/enforcement could reduce road fuel use 2-4%)• Reducing congestion, accel-decel• Reducing poor signal timing (could reduce 1.315 MMT
CO2/yr) • Reducing car and truck idling • Optimizing tire inflation• Encouraging “eco driving”
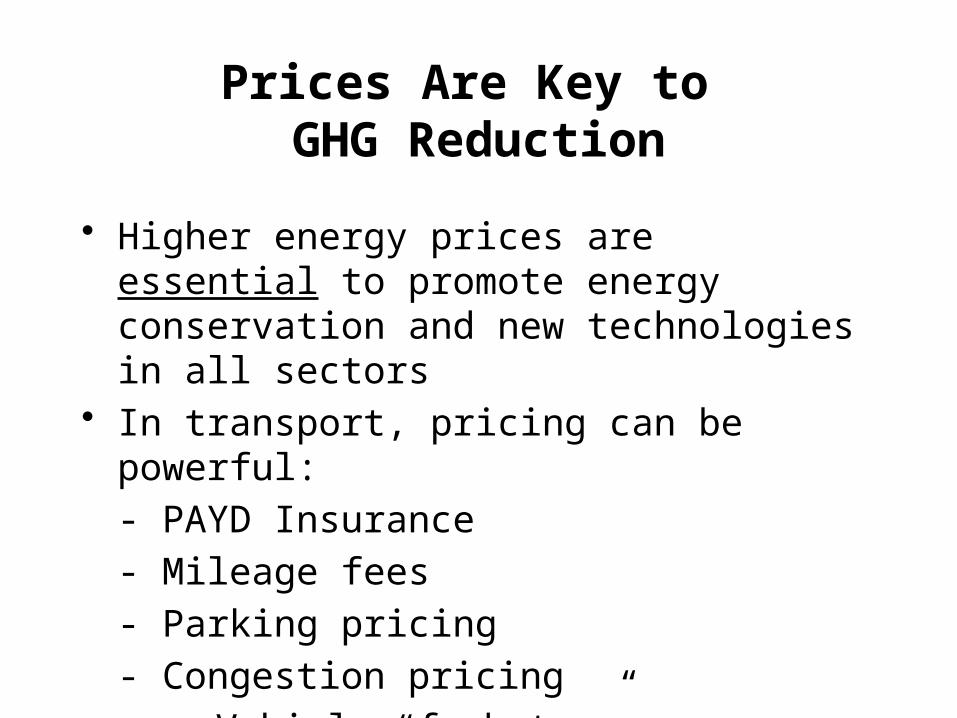
Prices Are Key to GHG Reduction
• Higher energy prices are essential to promote energy conservation and new technologies in all sectors
• In transport, pricing can be powerful:
- PAYD Insurance
- Mileage fees
- Parking pricing
- Congestion pricing
- Vehicle “feebates”
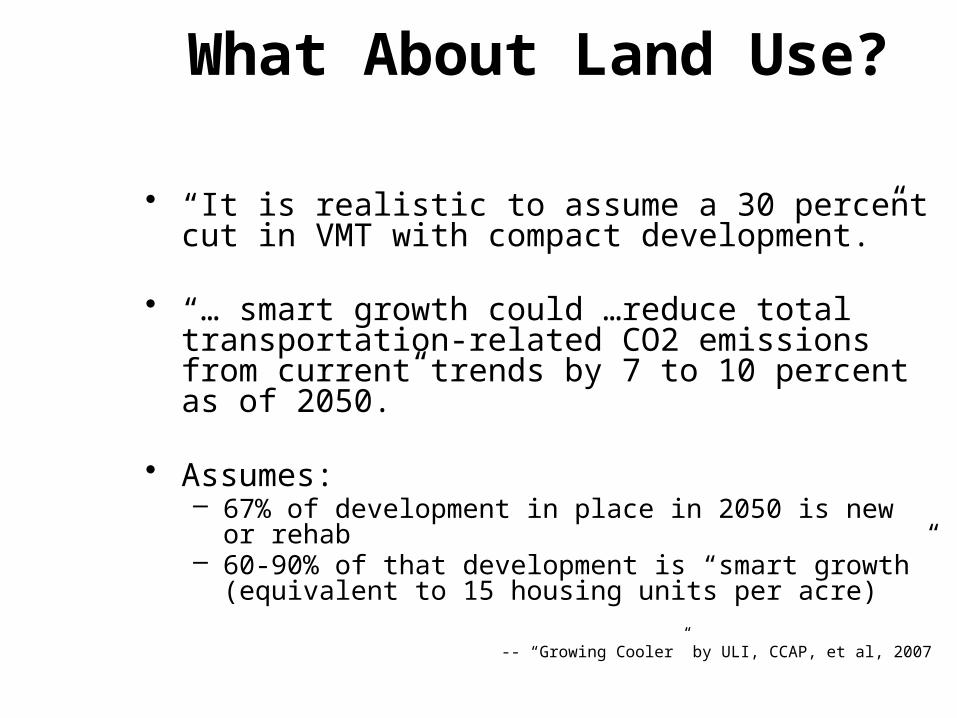
What About Land Use?
• “It is realistic to assume a 30 percent cut in VMT with compact development.”
• “… smart growth could …reduce total transportation-related CO2 emissions from current trends by 7 to 10 percent as of 2050.”
• Assumes: – 67% of development in place in 2050 is new or rehab– 60-90% of that development is “smart growth” (equivalent to 15
housing units per acre)
-- “Growing Cooler” by ULI, CCAP, et al, 2007
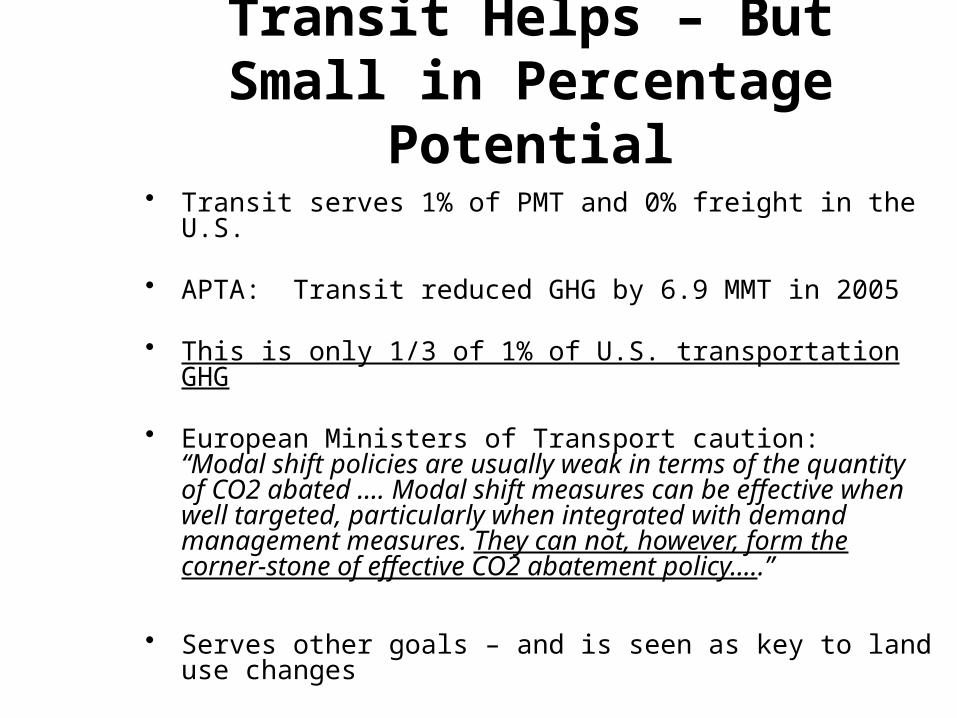
Transit Helps – But Small in Percentage Potential
• Transit serves 1% of PMT and 0% freight in the U.S.
• APTA: Transit reduced GHG by 6.9 MMT in 2005
• This is only 1/3 of 1% of U.S. transportation GHG
• European Ministers of Transport caution: “Modal shift policies are usually weak in terms of the quantity of CO2 abated …. Modal shift measures can be effective when well targeted, particularly when integrated with demand management measures. They can not, however, form the corner-stone of effective CO2 abatement policy…..”
• Serves other goals – and is seen as key to land use changes
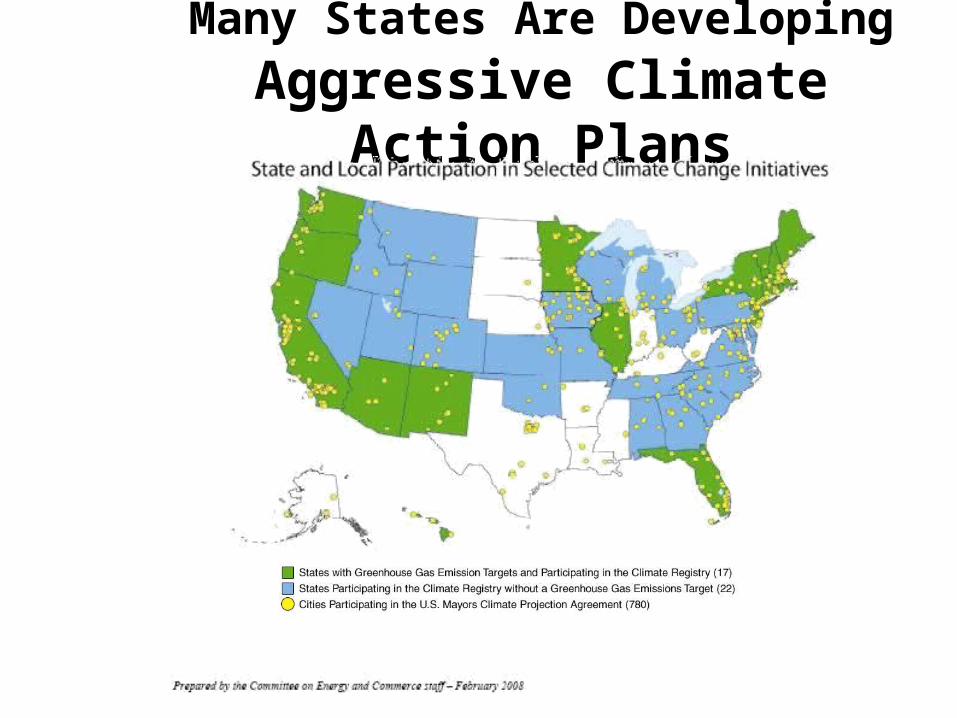
Many States Are Developing Aggressive Climate Action Plans
Virginia Activities
• CO2 emissions rose in VA by approximately
34% from 1990 to 2004 – nearly twice the national average rate
• Virginia Energy Plan – reducing GHG emissions by 30% by 20253
• Commission on Climate Change established December 2007.
3 Virginia Executive Order 59 (2007)
VA Commission on Climate Change
• Prepare Climate Change Action Plan – Inventory amount of & contributors to VA
GHG emissions– Evaluate impacts– ID what VA needs to do to prepare for likely
consequences– ID actions to achieve 30% goal– Scan Best Practices from other states
CONCLUSION: Many Strategies Needed to Reduce Transport
GHG
1. Develop/deploy carbon-neutral vehicle technology world-wide
2. Adopt pricing measures to reward conservation and tech innovation
3. Maximize energy efficiency of current vehicles
4. Push “eco driving” and system/speed management 5. Adopt more efficient land use
6. Support and reward carpools & vanpools
7. Increase biking, walking, transit use, trip chaining, telecommuting
Resources
• IPCC – Intergovernmental Panel on Climate Change (www.ipcc.ch) • TRB Special Report 290 (http://trb.org/news/blurb_detail.asp?id=8794
)• Pew Center on Global Climate Change (www.pewclimate.org)• Economic and Technology Advancement Advisory Committee
(ETAAC) report to California Air Resources Board (http://www.arb.ca.gov/cc/etaac/etaac.htm)
• Center for Clear Air Policy – USDOT Comprehensive Guidebook (http://www.ccap.org/safe/guidebook.php)
• Virginia Energy Plan (http://www.dmme.virginia.gov/DE/VAEnergyPlan/2007VEP-Full.pdf)
• USDOT Center for Climate Change and Environmental Forecasting (http://climate.dot.gov/)
• EPA (several sites; http://www.epa.gov/otaq/greenhousegases.htm)
Related Documents